Embed Size (px)
Citation preview

CHAPTER 8
DYNAMIC MECHANICAL ANALYSIS Abstract
Linear viscoelastic properties of Barium Sodium Niobate-Polystyrene
nanocomposites and Yttrium Barium Copper Oxide -Polystyrene
microcomposites were investigated with special reference to the effect of
filler loading, frequency and temperature. Dynamic mechanical analysis
showed significant increase in storage modulus in the glassy and rubbery
region .The (tanδ) peak temperature showed a right shift and, the peak
intensity was lowered for the composites. The composites showed a shift
in cross over frequency to the lower frequency region suggesting a
delayed relaxation of the molecular chains in the presence of fillers and
this shift was found to depend on the content of filler. The enhancement
in storage modulus was correlated with the morphological observations.
The compatibility of the composites was observed through the Cole-Cole
plots.
The results of this chapter have been communicated to publish in Journal
of Thermal Analysis and Calorimetry.
228 Chapter VIII
8.1 Introduction
DMTA [Dynamic Mechanical Thermal Analysis] measures the stiffness
and mechanical damping or internal friction/thermal dissipation of a
dynamically deformed material as a function of temperature. Specifically it
is used to study transitions in materials that occur on the molecular level.
The most conspicuous of the transition characteristics of amorphous and
semicrystalline polymers is the alpha or glass transition temperature (Tg).
Below this temperature an amorphous polymer is a glass. At Tg, micro-
Brownian motion of molecular segments begins where short range
diffusion can take place. At temperature less than Tg, thermal energy is
insufficient to cause rotational and translational motions of segments
[1-5]. The viscoelastic response of the polymeric materials can be
monitored with respect to time, temperature and frequencies. DMTA is an
extremely versatile thermal analysis method, and no other single test
method provides more information about the physical properties of a
sample in a single test. This supplies an oscillating force, causing a
sinusoidal stress to be applied to a sample which generates a sinusoidal
strain. By the measurement of the magnitude of the deformation at the
peak of the sine wave and the lag between the stress and strain waves,
properties such as modulus, glass transition temperature and damping can
be measured.
For solids that behave ideally and follow Hooke’s law, the stress is
proportional to the strain amplitude, and the stress and strain signals are in
phase. The stress signal generated by a viscoelastic material can be
separated into two components: an elastic stress in phase with the strain,
and a viscous stress90°out of phase with the strain. The elastic stress
Dynamic Mechanical Analysis 229
measures the degree to which the material behave as a solid and the
viscous stress, measures the degree to which the material behaves as an
ideal fluid [6].
The elastic and viscous stresses are related to material properties through
the ratio of stress to strain, the modulus. The ratio of the elastic stress to
strain is the elastic (or storage) modulus G’ which signifies the stiffness of
the polymer; the ratio of the viscous stress to strain is the viscous (or loss)
modulus G”, which implies the dissipated energy and the damping is
given by the ratio of loss modulus to storage modulus. Storage modulus
(G′), loss modulus (G″) and loss tangent (tan∂= G″/ G′) are presented as a
function of temperature and frequency for polystyrene and the
composites. The presence of nanofillers modifies all the above properties
of polystyrene.
The first objective of this research is to evaluate the value of (Tg) using
the three different techniques(1) the onset of the change in the slope of the
storage modulus (G’) curve,(2) the maximum loss modulus (G”) on loss
modulus-temperature curve and(3) the maximum loss tangent (tanδ ) in
the (tanδ)- temperature curve. Comparing the (Tg) values obtained from
the above calculations one can predict the applicability of the composites
for various electrical & electronic purposes.
Even though DMTA is used extensively in Tg calculation, uncertainties
still exist regarding the proper methods of accurate determination. The
procedures described in several standards and recommendations can result
in significantly different values of the same data, as discussed in detail by
Wolfurm et al. [7]. Tg represents a range of temperature over which the
glass transition takes place [8]. The five regions of viscoelastic behavior
230 Chapter VIII
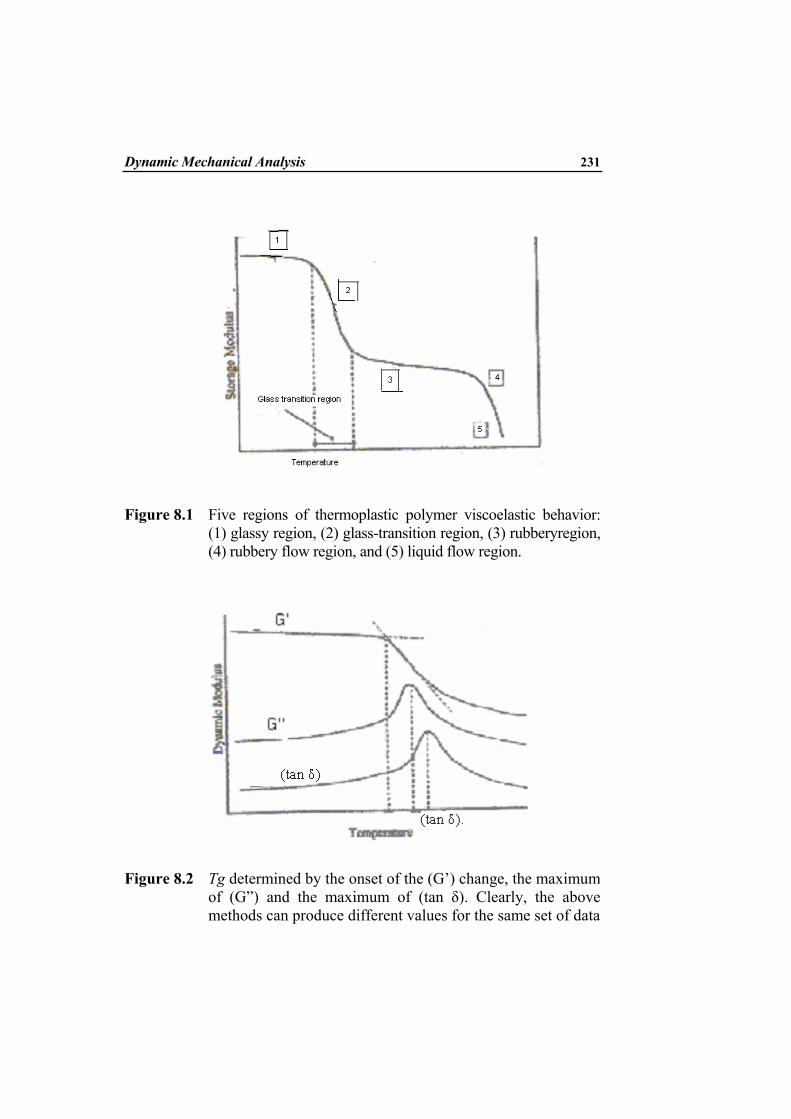
typical of a thermoplastic polymer [9, 10] are presented in Figure8.1. The
glass-transition range is characterized by a sharp decrease in the elastic
modulus of the polymer and is dependent on the state of the polymer and its
thermal history [11]. In an effort to simplify the determination of Tg, it is
commonly defined as the maximum of the damping ratio, (G”/G’), (tanδ ),
or the maximum of G”. Several researchers however, had found that a
more accurate determination could be derived from the onset of the
change in the slope of the G’ curve [12, 13]. Tg values computed with the
onset of change in the slope of the G’ curve were obtained by plotting the
derivative of G’ as a function of temperature. Tg was then determined to
be the average of two slopes from that curve. The first slope was selected
at a temperature before the modulus drop step; the second slope was
selected at a temperature indicating the middle point of the modulus drop.
The intersection of the two slopes is to be taken as the value of Tg. If Tg
is used for engineering design, that is, the determination of maximal end-
use temperatures, we believe that a conservative estimate of ( Tg )is
warranted . Therefore, in this work, one method of Tg calculation was
based on the temperature at which mechanical properties began to be
compromised, that is, the onset of the glass transition range, as
determined by the onset of the change in the slope of G’. It can be
measured from the peak point of the plot, derivative of storage modulus
versus temperature. Also the value of( Tg ) based on the maximum
damping ratio and by the tan(δ) peak is also reported. The last value
represents the end of the transition period. The three values give an
indication of the size of the transition period as in fig 8.2
Dynamic Mechanical Analysis 231
Figure 8.1 Five regions of thermoplastic polymer viscoelastic behavior:
(1) glassy region, (2) glass-transition region, (3) rubberyregion, (4) rubbery flow region, and (5) liquid flow region.
Figure 8.2 Tg determined by the onset of the (G’) change, the maximum
of (G”) and the maximum of (tan δ). Clearly, the above methods can produce different values for the same set of data
232 Chapter VIII
8.2 Results and discussion
DMA of the samples were carried out at frequencies 0.1Hz, 1Hz and 10Hz. A detailed discussion of the results of ‘Tg’ variations is neatly presented. The enhancement in storage modulus is seen in the case of glassy and rubbery regions of the composites. The compatibility is expressed in terms of Cole-Cole plot.
8.2.1 Storage modulus
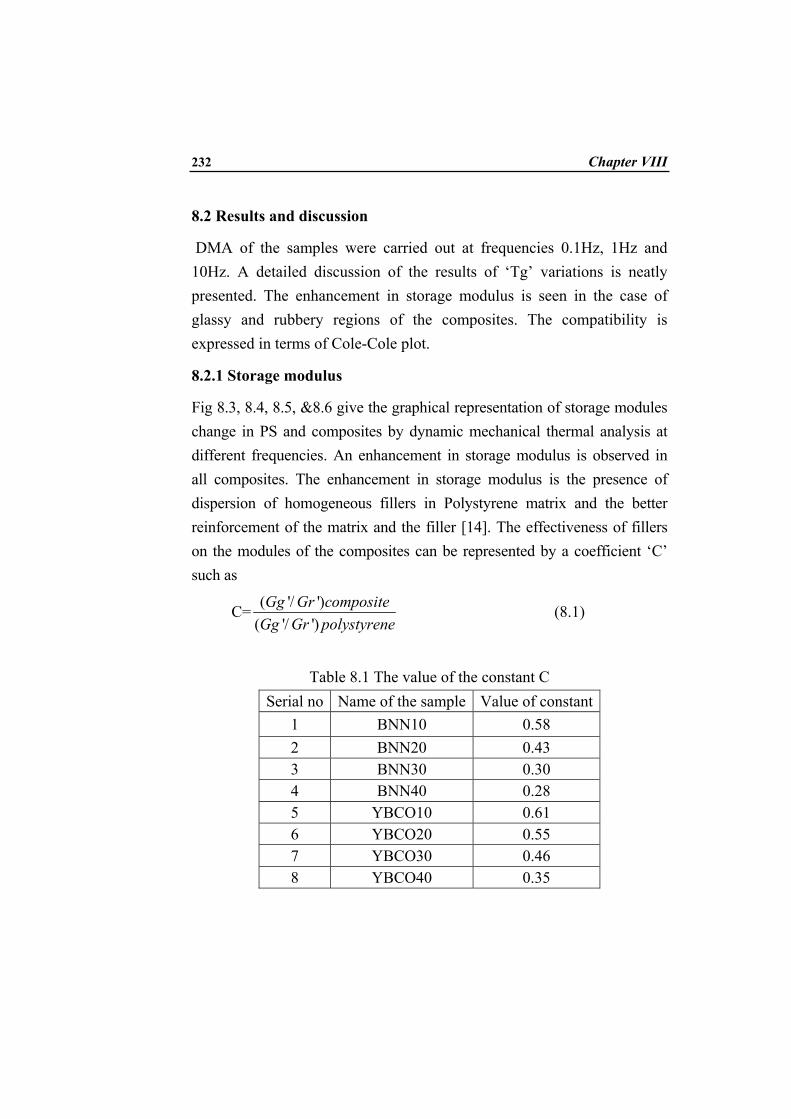
Fig 8.3, 8.4, 8.5, &8.6 give the graphical representation of storage modules change in PS and composites by dynamic mechanical thermal analysis at different frequencies. An enhancement in storage modulus is observed in all composites. The enhancement in storage modulus is the presence of dispersion of homogeneous fillers in Polystyrene matrix and the better reinforcement of the matrix and the filler [14]. The effectiveness of fillers on the modules of the composites can be represented by a coefficient ‘C’ such as
C= ( '/ ')( '/ ')
Gg Gr compositeGg Gr polystyrene
(8.1)
Table 8.1 The value of the constant C Serial no Name of the sample Value of constant
1 BNN10 0.58 2 BNN20 0.43 3 BNN30 0.30 4 BNN40 0.28 5 YBCO10 0.61 6 YBCO20 0.55 7 YBCO30 0.46 8 YBCO40 0.35

Dynamic Mechanical Analysis 233
Where 'Gg and 'Gr are the storage modulus values in the glassy and
rubbery regions respectively [15]. The lower the value of C, the higher is the effectiveness of the filler. The measured G’ values at 30 and 1200C for the polymer and the composites were employed as 'Gg and
'Gr respectively. The values obtained for different systems at frequency 10 Hz are given in table8.1. The effectiveness of the composites is gradually increasing with filler content and the highest is for 40% filler loading. It is important to mention that modulus in the glassy state is determined primarily by the strength of the intermolecular forces and the way the polymer chains are packed. The stiffness at high temperature is determined by the amorphous regions, which are very compliant above the relaxation transition. However, the difference between modules of the glassy state and rubbery state is smaller in composites than in PS.
20 40 60 80 100 120 1405.5
6.0
6.5
7.0
7.5
8.0
8.5
9.0
9.5
10.0
log(
G')
( Pa)
Temperature(0C)
PS BNN10 BNN20 BNN30 BNN40
Fig 8.3 Variation of storage modulus of BNN-PS composites with temperature at a frequency of 10Hz
234 Chapter VIII
20 40 60 80 100 120 1405.5
6.0
6.5
7.0
7.5
8.0
8.5
9.0
9.5
10.0
log(
G')
( Pa)
Temperature(0C)
PS YBCO10 YBCO20 YBCO30 YBCO40
Fig 8.4 Variation of storage modulus of YBCO-PS composites with
temperature at a frequency of 10Hz
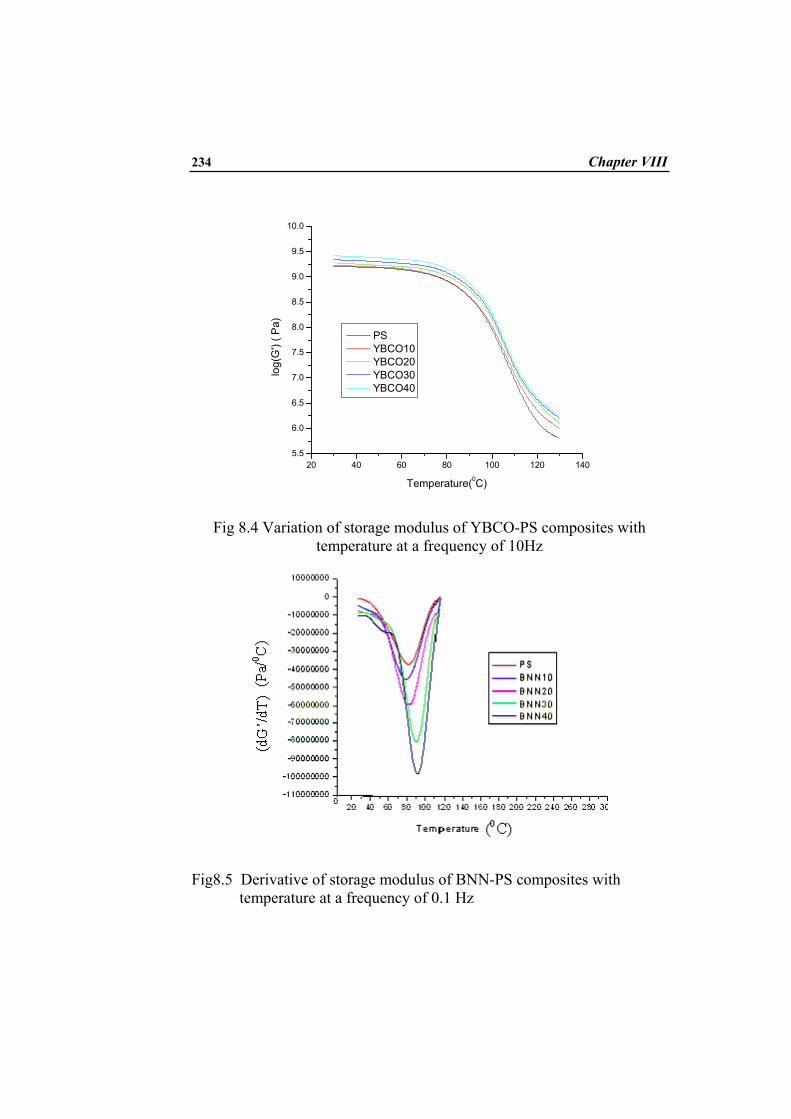
Fig8.5 Derivative of storage modulus of BNN-PS composites with
temperature at a frequency of 0.1 Hz
Dynamic Mechanical Analysis 235
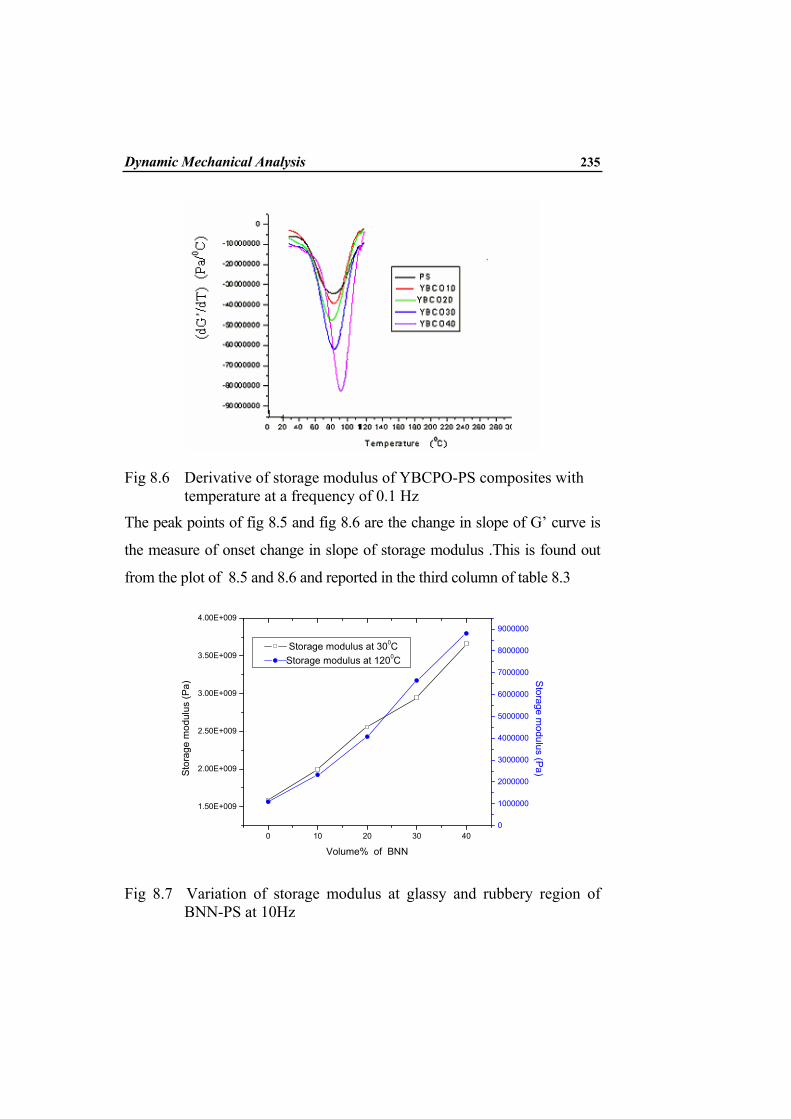
Fig 8.6 Derivative of storage modulus of YBCPO-PS composites with temperature at a frequency of 0.1 Hz
The peak points of fig 8.5 and fig 8.6 are the change in slope of G’ curve is
the measure of onset change in slope of storage modulus .This is found out
from the plot of 8.5 and 8.6 and reported in the third column of table 8.3
0 10 20 30 40
1.50E+009
2.00E+009
2.50E+009
3.00E+009
3.50E+009
4.00E+009
Storage modulus at 300CStorage modulus at 1200C
Volume% of BNN
Stor
age
mod
ulus
(Pa)
0
1000000
2000000
3000000
4000000
5000000
6000000
7000000
8000000
9000000
Storage m
odulus (Pa)
Fig 8.7 Variation of storage modulus at glassy and rubbery region of BNN-PS at 10Hz
236 Chapter VIII
0 10 20 30 40
1.60E+009
1.80E+009
2.00E+009
2.20E+009
2.40E+009
2.60E+009
2.80E+009
Storage modulus at 300C Storage modulus at 1200C
Stor
age
mod
ulus
(Pa)
Volume% of YBCO
Stor
age
mod
ulus
(Pa)
1000000
1500000
2000000
2500000
3000000
3500000
4000000
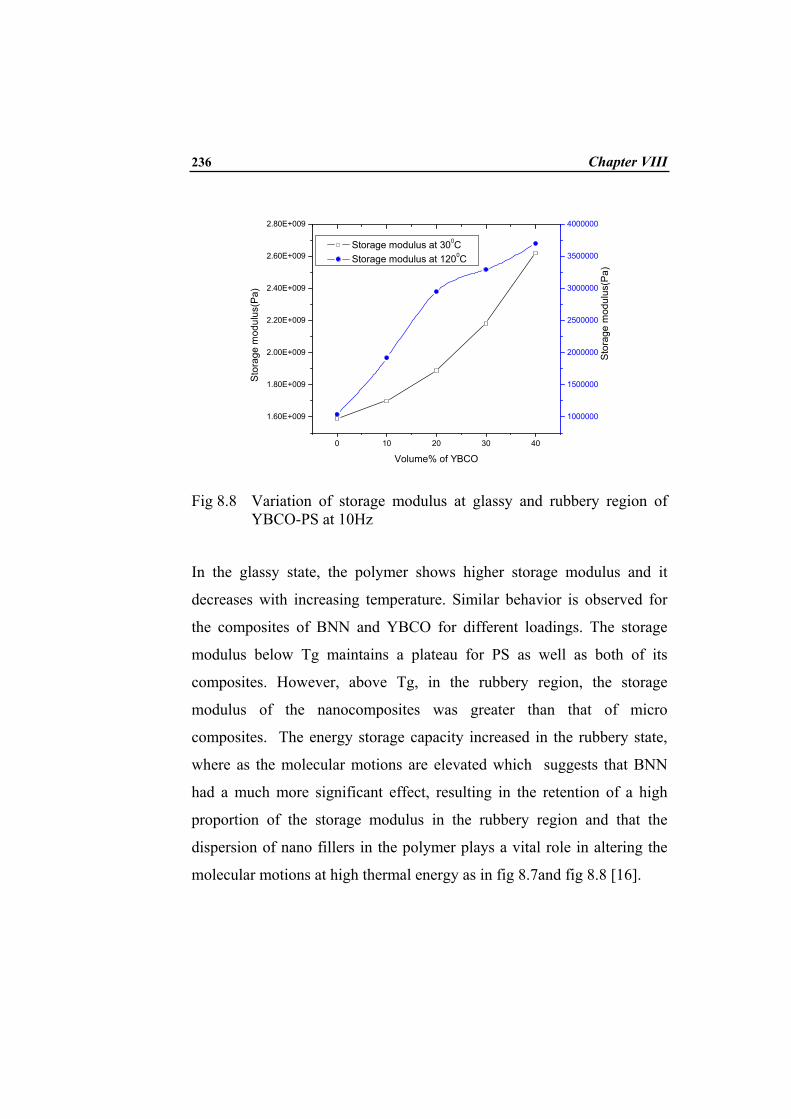
Fig 8.8 Variation of storage modulus at glassy and rubbery region of
YBCO-PS at 10Hz
In the glassy state, the polymer shows higher storage modulus and it
decreases with increasing temperature. Similar behavior is observed for
the composites of BNN and YBCO for different loadings. The storage
modulus below Tg maintains a plateau for PS as well as both of its
composites. However, above Tg, in the rubbery region, the storage
modulus of the nanocomposites was greater than that of micro
composites. The energy storage capacity increased in the rubbery state,
where as the molecular motions are elevated which suggests that BNN
had a much more significant effect, resulting in the retention of a high
proportion of the storage modulus in the rubbery region and that the
dispersion of nano fillers in the polymer plays a vital role in altering the
molecular motions at high thermal energy as in fig 8.7and fig 8.8 [16].

Dynamic Mechanical Analysis 237
8.2.2 Theoretical modeling
The simplest equation for the prediction of storage modulus of a material
by the inclusion of filler is rule of mixtures and the equation is [17]
1(1 )Gc Gm v= + (8.2)
where CG and mG are the storage modulus of composite and matrix
respectively. Einstein had developed a better approach and by
Einstein’s model [18], the equation is
1(1 1.25 )Gc Gm v= + (8.3)
Table 8.2 Theoretical predictions of storage modulus at room temperature.
Name of the sample
Rule of mixtures(GPa)
Einstein Equation(GPa)
Guth Equation(GPa) Experimental(GPa)
Polystyrene 1.59 1.59 1.59 1.59
BNN10 1.74 1.78 2.01 1.99
BNN20 1.91 1.98 2.88 2.55
BNN30 2.06 2.18 4.21 2.95
BNN40 2.23 2.38 5.97 3.66
YBCO10 1.74 1.78 2.02 1.71
YBCO20 1.91 1.98 2.88 1.82
YBCO30 2.06 2.12 4.20 2.19
YBCO40 2.22 2.35 5.97 2.51
238 Chapter VIII
v1 is the volume fraction of filler. This model has been used to investigate
adhesion between spherical filler and an incompressible matrix and is valid
only at low concentration of filler particles. Many researchers modified this
equation. According to Guth [19] the prediction is
21 1(1 1.25 14.1 )Gc Gm v v= + + (8.4)
The experimental and theoretical modulus values are given in table 8.2. It
can be seen that the experimental value lie between the two theoretical
predictions. This signifies the chemical non reactivity of filler and
polymer.
8.2.3 Glass transition Region The glass transition is detected as a sudden and considerable (several
decades) change in the elastic modulus and an attendant peak in the (tan δ)
curve. This underscores the importance of the glass transition as a
material property, for it shows clearly the substantial change in rigidity
that the material experiences in a short span of temperatures.
There is a large fall in modulus with increasing temperature in the unfilled
system The storage moduli drops from~ 109 to~106 Pa in the glass
transition region of PS .The drop in the modulus on passing through the
glass transition temperature is comparatively less for filled composites
than that of unfilled one as in fig 8.9and fig 8.10.
Dynamic Mechanical Analysis 239
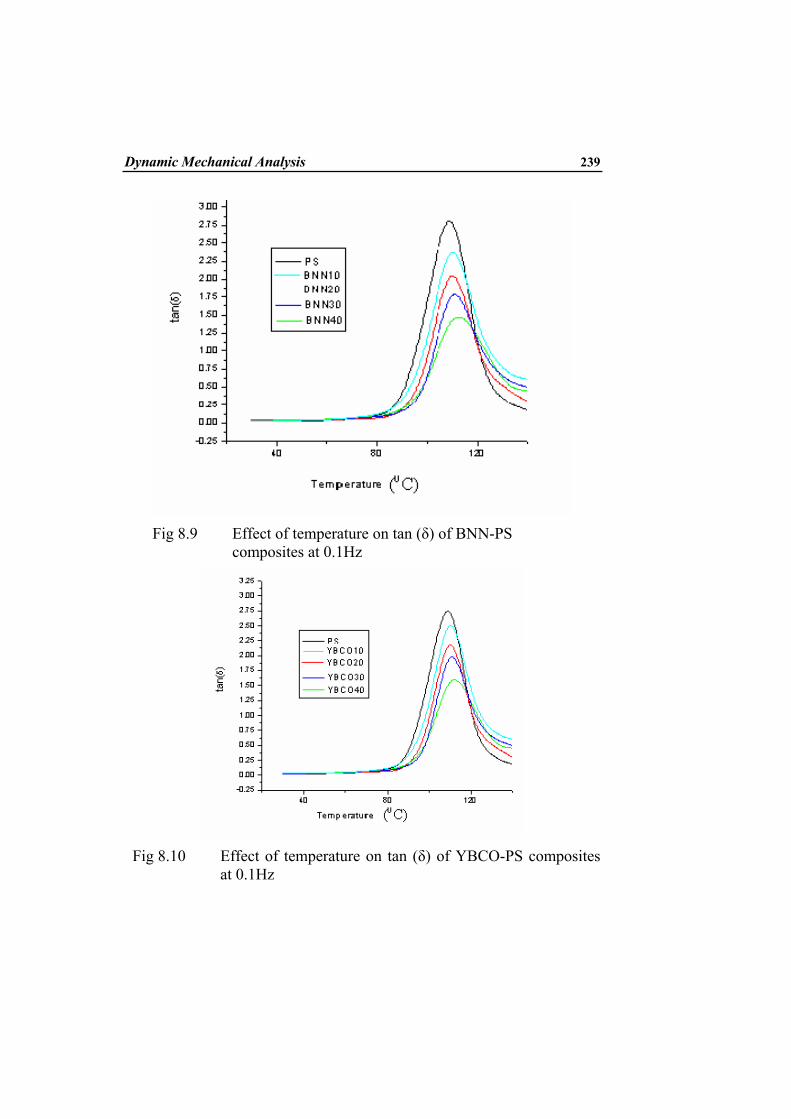
Fig 8.9 Effect of temperature on tan (δ) of BNN-PS
composites at 0.1Hz
Fig 8.10 Effect of temperature on tan (δ) of YBCO-PS composites
at 0.1Hz
240 Chapter VIII
8.2.4 Magnitude of tan (δ) peak
Magnitude of tan (δ) peak value is indicative of the nature of the polymer
system. The tan (δ) peak value, which signifies the dissipation of energy due
to internal friction and molecular motions decreased with increasing filler
content for the composites as shown in fig 8.9&8.10 and the results are
reported in the fourth column of table 8.4. Since the damping peak occurs in
the region of glass transition where the material changes from rigid to more
elastic state, is associated with the movement of small groups and chains of
molecule within the polymer structure, all of which are initially frozen in. In
a composite system damping is affected through the incorporation of fillers.
This is due mainly to shear stress concentrations at the filler surface in
association with additional viscoelastic energy dissipation in the matrix
material. The lowering of tan (δ) peak values for the composites can be
ascribed to the confinement of Polystyrene by fillers and this confined
fraction changes as the content of fillers changed; similar behaviour has been
reported for other micro and nano composites [20] Improvement in
interfacial reinforcement in the composites occurs as observed by the
lowering of tan(δ) values. Damping at the interfaces depends upon the
adhesion between filler and PS. High damping is seen in the case of YBCO
composites. This is associated with the poorer adhesion between YBCO and
PS. Based on the above studies it is concluded that YBCO- dissipate more
energy than that of BNN-PS. At high filler content when strain is applied to
the composite, the strain is controlled mainly by the filler in such a way that
the interface, which is assumed to be the more dissipative component of the
composite is strained to a lesser degree [21].The observed reduction in tan (δ)
values are attributed to the presences of interfacial reinforcement between PS

Dynamic Mechanical Analysis 241
matrix and filler and to the increased hindrance for energy dissipation and
relaxation of polymer chains in the presence of filler.
8.2.5 Shifting of tan (δ) peak
The glass transition temperature of the nanocomposites, based on the
temperature of the tan (δ) peak, was found to be shifted slightly towards
higher temperature as that of pristine polymer with respect to the content
of BNN and YBCO as shown in fig 8.9 and fig 8.10 and the respective
values are reported in the last column of table 8.3.
Table 8.3 Tg by different methods at a frequency 0.1Hz
Serial No
Name of the sample
By Slope of storage modulus
(0C)
By Loss Modulus ( 0C)
By (tanδ) peak (0C)
1 Polystyrene 84.18 96 108.875
2 BNN10 85.43 96.8 109.23
3 BNN20 86.8 97.2 110.4
4 BNN30 87.8 98 110.75
5 BNN40 88.8 98.5 112.57
6 YBCO10 84.6 96.5 110.01
7 YBCO20 85.12 97.1 110.23
8 YBCO30 86.03 97.7 111.06
9 YBCO40 87.4 98 111.6
In an unfilled system, the chain segments are free from restraints.
Addition of fillers show a positive shift to the Tg values stressing the
242 Chapter VIII
effectiveness of the filler as the reinforcing agent. This effect is more
prominent in BNN-PS composites than that of YBCO-PS composites. The
shifting of Tg to higher temperature can be associated with the decreased
mobility of the chains by the addition of fillers and the increased
interfacial reinforcements [22].
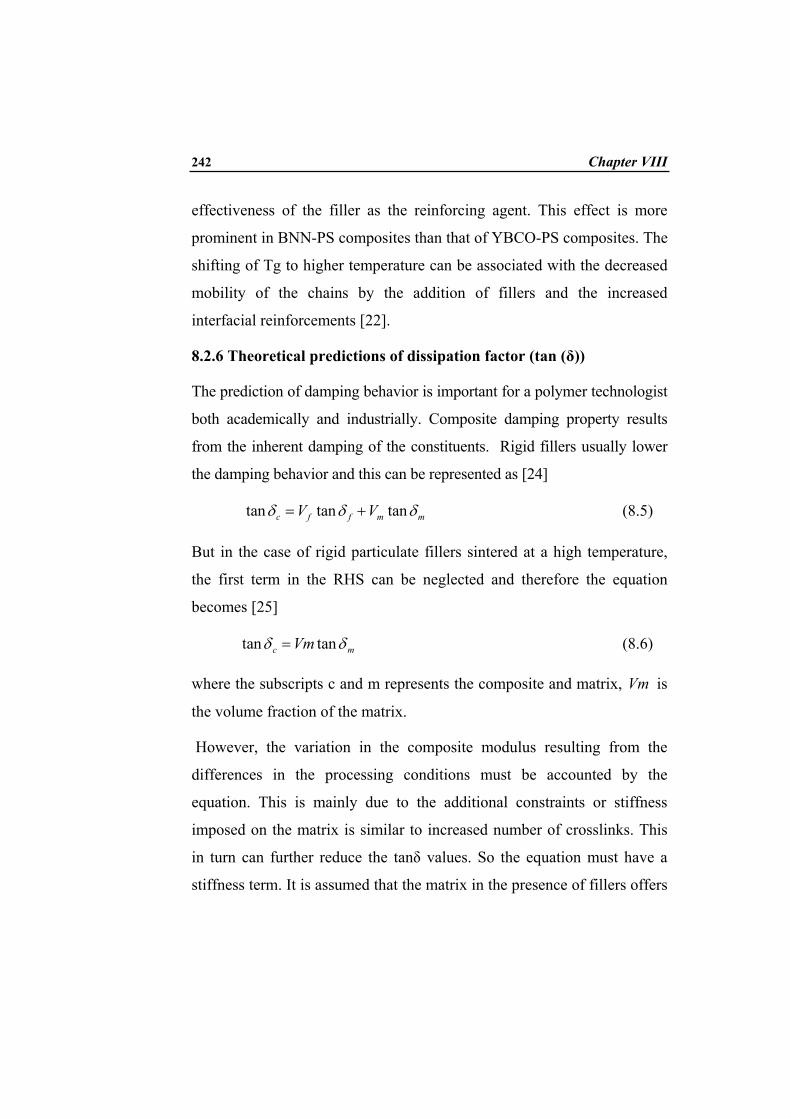
8.2.6 Theoretical predictions of dissipation factor (tan (δ))
The prediction of damping behavior is important for a polymer technologist
both academically and industrially. Composite damping property results
from the inherent damping of the constituents. Rigid fillers usually lower
the damping behavior and this can be represented as [24]
tan tan tanc f f m mV Vδ δ δ= + (8.5)
But in the case of rigid particulate fillers sintered at a high temperature,
the first term in the RHS can be neglected and therefore the equation
becomes [25]
tan tanc mVmδ δ= (8.6)
where the subscripts c and m represents the composite and matrix, Vm is
the volume fraction of the matrix.
However, the variation in the composite modulus resulting from the
differences in the processing conditions must be accounted by the
equation. This is mainly due to the additional constraints or stiffness
imposed on the matrix is similar to increased number of crosslinks. This
in turn can further reduce the tanδ values. So the equation must have a
stiffness term. It is assumed that the matrix in the presence of fillers offers
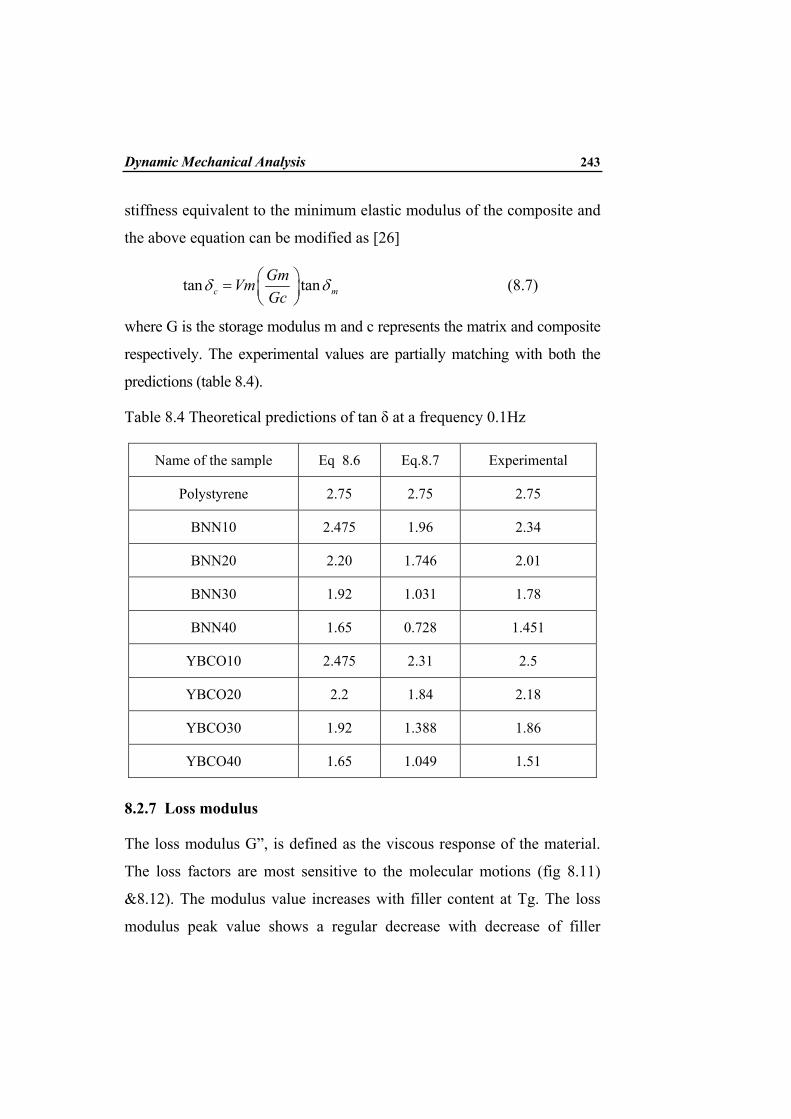
Dynamic Mechanical Analysis 243
stiffness equivalent to the minimum elastic modulus of the composite and
the above equation can be modified as [26]
tan tanc mGmVmGc
δ δ =
(8.7)
where G is the storage modulus m and c represents the matrix and composite
respectively. The experimental values are partially matching with both the
predictions (table 8.4).
Table 8.4 Theoretical predictions of tan δ at a frequency 0.1Hz
Name of the sample Eq 8.6 Eq.8.7 Experimental
Polystyrene 2.75 2.75 2.75
BNN10 2.475 1.96 2.34
BNN20 2.20 1.746 2.01
BNN30 1.92 1.031 1.78
BNN40 1.65 0.728 1.451
YBCO10 2.475 2.31 2.5
YBCO20 2.2 1.84 2.18
YBCO30 1.92 1.388 1.86
YBCO40 1.65 1.049 1.51
8.2.7 Loss modulus
The loss modulus G”, is defined as the viscous response of the material.
The loss factors are most sensitive to the molecular motions (fig 8.11)
&8.12). The modulus value increases with filler content at Tg. The loss
modulus peak value shows a regular decrease with decrease of filler

244 Chapter VIII
content at glass transition region. The loss modulus peak value is reported
in the fourth column of table 8.3.Another result is the broadening of the
loss modulus peak with filler content.
The damping is low below glass transition region because the chain segments
are frozen in. Below Tg, the deformations are thus mainly elastic and
molecular slip resulting in viscous flow is low. As temperature increases,
damping goes through a maximum near Tg, in the transition region and then
a minimum in the rubbery region. Above Tg, where rubbery region exists,
the damping is also low because molecular segments are very free to move
about and there is only very little resistance for flow. Thus, when the
segments are either frozen in or are free to move, damping is low. The peak
is seemed to be broadened with the increment in filler content at glass
transition region. The observed broadening may be explained as due to the
difference in the physical state of the matrix surrounding the filler to the rest
of the matrix. The higher the volume fraction of the filler, the more restraints
are present at the interfaces. The different physical state of the matrix
surrounding the filler hinders the molecular motions. The greater constraints
on the amorphous phase could give rise to the higher and broader glass
transition behavior [27, 28]

Dynamic Mechanical Analysis 245
Fig 8.11 Effect of temperature on loss modulus of (a) BNN-PS
composites at a frequency of 0.1Hz.
Fig 8.12 Effect of temperature on loss modulus of YBCO-PS
composites at a frequency of 0.1Hz.
246 Chapter VIII
8.2.8 Effect of frequency
The storage modulus, loss modulus and damping peaks have been found
to be affected by frequency. The variation of G’, G” and tan (δ) with
frequency of neat PS and one of the composites as a function of
temperature is shown in fig(8.13-8.18). Increase of frequency has been
found to increase the modulus values. Frequency has a direct impact on
the dynamic modulus especially at higher temperature. The modulus
values are found to drop at a temperature around 850C. The drop in
modulus value continues steadily till the temperature of 1150C is reached.
The molecular motion can be believed to be set in at 800C. If a material is
subjected to a constant stress, its elastic modulus will decrease over a
period of time. This is due to the fact that the material undergoes
molecular rearrangement in an attempt to minimize the localized stresses.
Modulus measurement performed over a short time (high frequency)
result thus in higher values whereas, measurements taken over longer time
(low frequency) result in lower values [29]
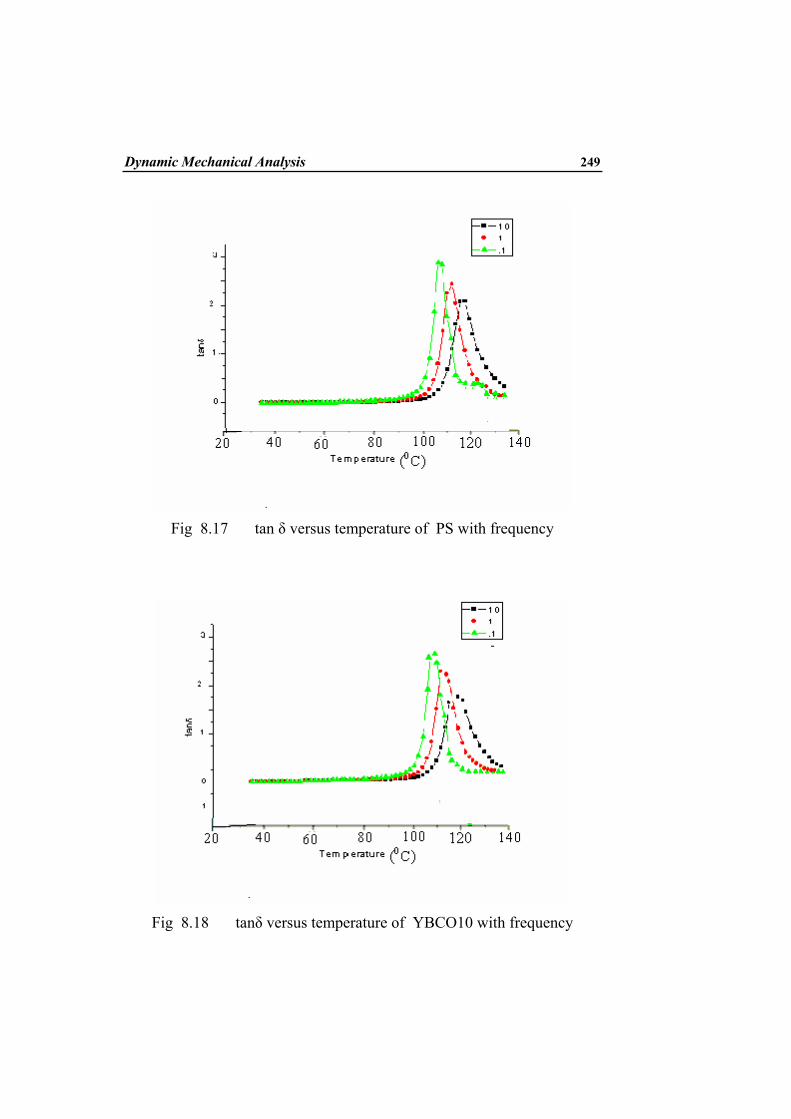
The tanδ peak is found to shift to higher temperature with increase of
frequency as in fig 8.17 &8.18. The damping peak is associated with
partial loosening of the polymer structure so that the groups and small
chain segments can move. Fig 8.15&fig 8.16 show the effect of frequency
on the loss modulus values of PS and composites. The peak of loss
modulus is seen to be shifted to higher temperature with increase of
frequency. The G” peak of the composite is broader revealing the
morphological rearrangement resulting in a highly rigid high modulus
region and also improved interaction between the filler and the polymer.
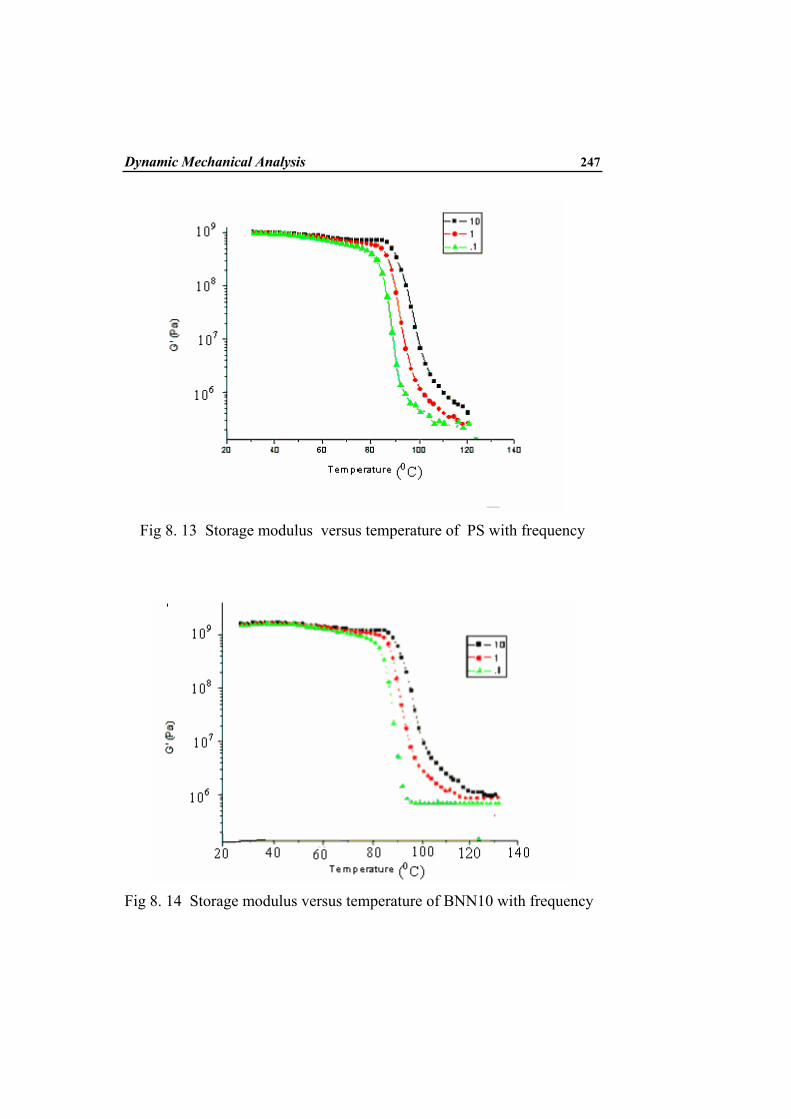
Dynamic Mechanical Analysis 247
Fig 8. 13 Storage modulus versus temperature of PS with frequency
Fig 8. 14 Storage modulus versus temperature of BNN10 with frequency

248 Chapter VIII
Fig 8.15 Loss modulus versus temperature of PS with frequency
Fig8.16 Loss modulus versus temperature of BNN30 with frequency
Dynamic Mechanical Analysis 249
Fig 8.17 tan δ versus temperature of PS with frequency
Fig 8.18 tanδ versus temperature of YBCO10 with frequency
250 Chapter VIII
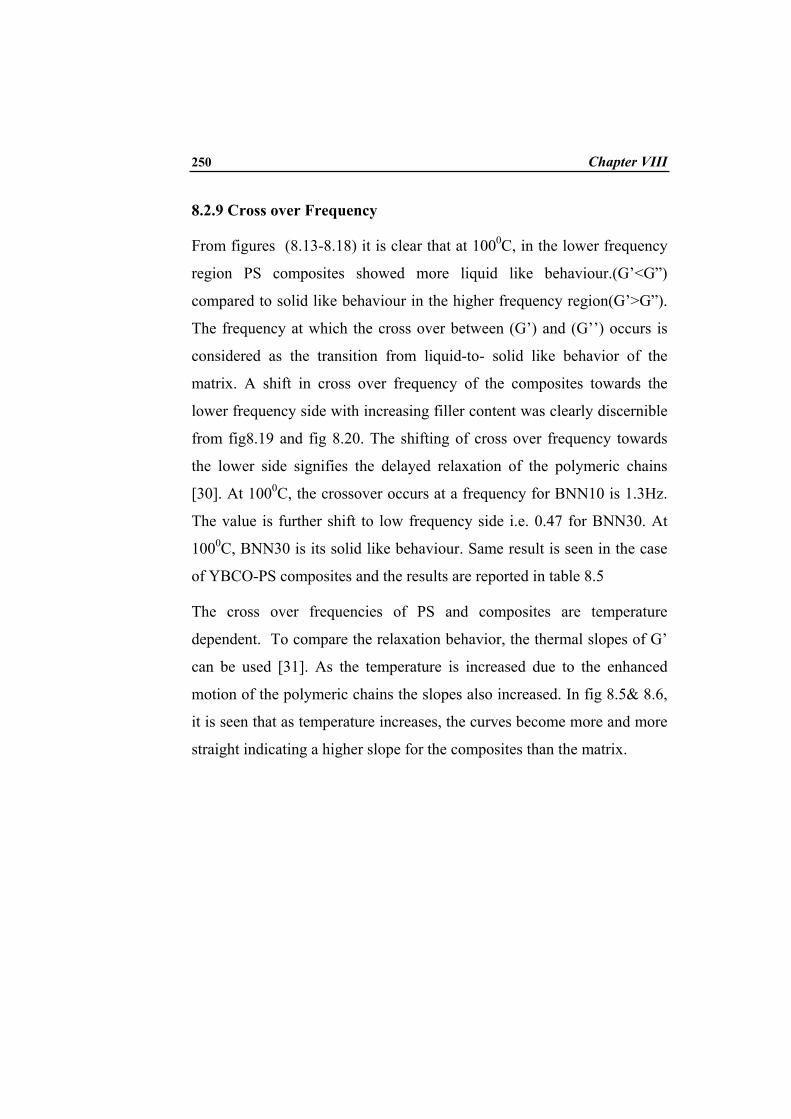
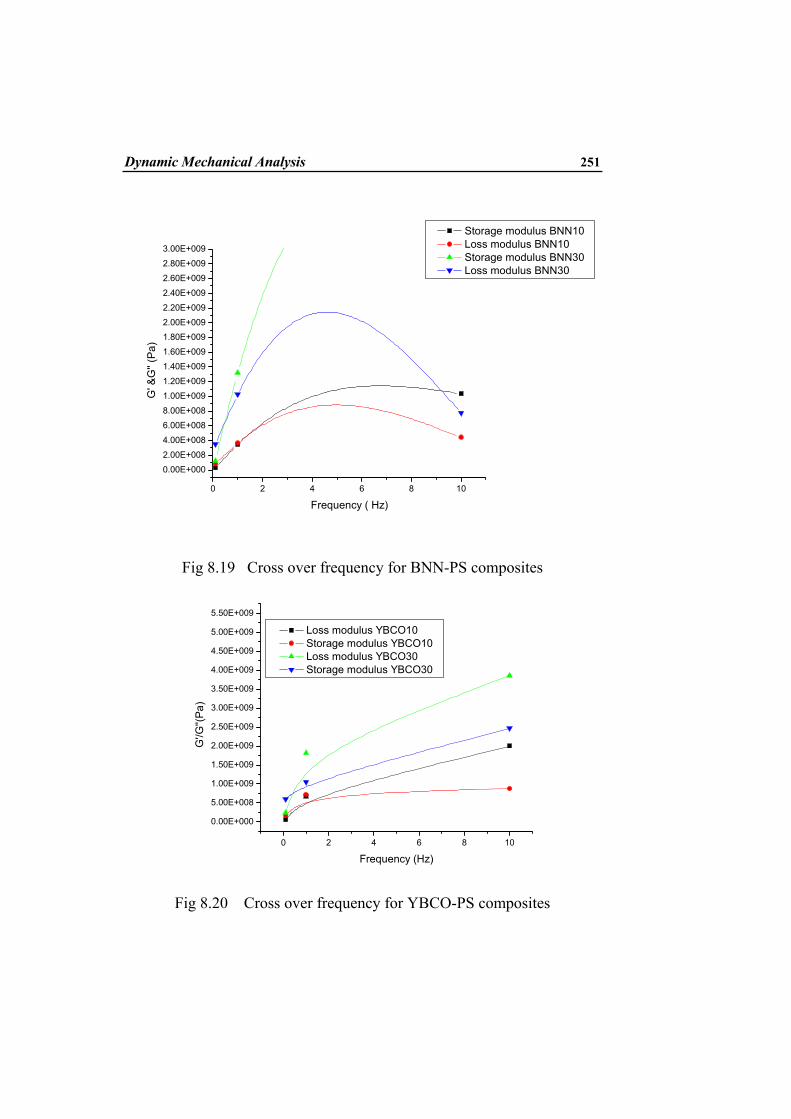
8.2.9 Cross over Frequency
From figures (8.13-8.18) it is clear that at 1000C, in the lower frequency
region PS composites showed more liquid like behaviour.(G’<G”)
compared to solid like behaviour in the higher frequency region(G’>G”).
The frequency at which the cross over between (G’) and (G’’) occurs is
considered as the transition from liquid-to- solid like behavior of the
matrix. A shift in cross over frequency of the composites towards the
lower frequency side with increasing filler content was clearly discernible
from fig8.19 and fig 8.20. The shifting of cross over frequency towards
the lower side signifies the delayed relaxation of the polymeric chains
[30]. At 1000C, the crossover occurs at a frequency for BNN10 is 1.3Hz.
The value is further shift to low frequency side i.e. 0.47 for BNN30. At
1000C, BNN30 is its solid like behaviour. Same result is seen in the case
of YBCO-PS composites and the results are reported in table 8.5
The cross over frequencies of PS and composites are temperature
dependent. To compare the relaxation behavior, the thermal slopes of G’
can be used [31]. As the temperature is increased due to the enhanced
motion of the polymeric chains the slopes also increased. In fig 8.5& 8.6,
it is seen that as temperature increases, the curves become more and more
straight indicating a higher slope for the composites than the matrix.
Dynamic Mechanical Analysis 251
0 2 4 6 8 10
0.00E+0002.00E+008
4.00E+008
6.00E+0088.00E+008
1.00E+0091.20E+009
1.40E+0091.60E+009
1.80E+0092.00E+0092.20E+009
2.40E+009
2.60E+0092.80E+009
3.00E+009
G' &
G'' (
Pa)
Frequency ( Hz)
Storage modulus BNN10 Loss modulus BNN10 Storage modulus BNN30 Loss modulus BNN30
Fig 8.19 Cross over frequency for BNN-PS composites
0 2 4 6 8 10
0.00E+000
5.00E+008
1.00E+009
1.50E+009
2.00E+009
2.50E+009
3.00E+009
3.50E+009
4.00E+009
4.50E+009
5.00E+009
5.50E+009
G'/G
''(Pa
)
Frequency (Hz)
Loss modulus YBCO10 Storage modulus YBCO10 Loss modulus YBCO30 Storage modulus YBCO30
Fig 8.20 Cross over frequency for YBCO-PS composites
252 Chapter VIII
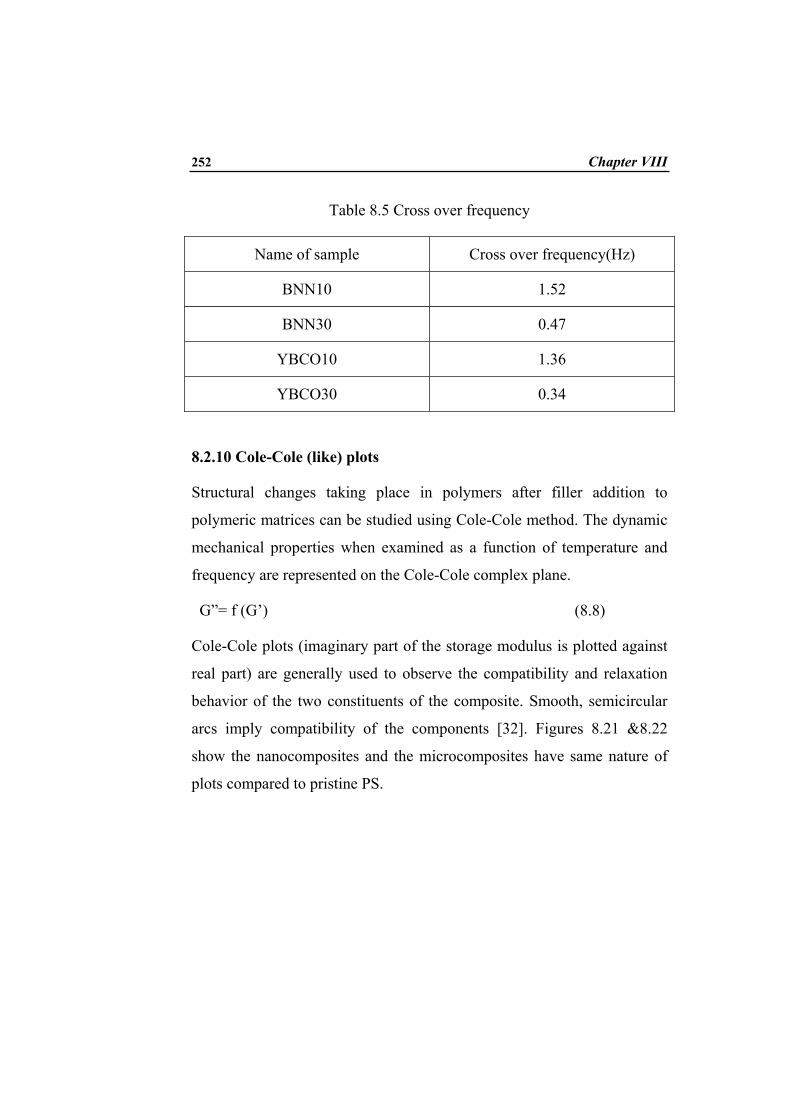
Table 8.5 Cross over frequency
Name of sample Cross over frequency(Hz)
BNN10 1.52
BNN30 0.47
YBCO10 1.36
YBCO30 0.34
8.2.10 Cole-Cole (like) plots
Structural changes taking place in polymers after filler addition to
polymeric matrices can be studied using Cole-Cole method. The dynamic
mechanical properties when examined as a function of temperature and
frequency are represented on the Cole-Cole complex plane.
G”= f (G’) (8.8)
Cole-Cole plots (imaginary part of the storage modulus is plotted against
real part) are generally used to observe the compatibility and relaxation
behavior of the two constituents of the composite. Smooth, semicircular
arcs imply compatibility of the components [32]. Figures 8.21 &8.22
show the nanocomposites and the microcomposites have same nature of
plots compared to pristine PS.

Dynamic Mechanical Analysis 253
0.00E+000 5.00E+008 1.00E+009 1.50E+009 2.00E+009 2.50E+0090.00E+000
2.00E+008
4.00E+008
6.00E+008
8.00E+008
1.00E+009
G''(
Pa)
G' (Pa)
PS BNN40 BNN20 BNN30 BNN10
Fig 8.21 Cole-Cole plot for BNN-PS composite
0.00E+000 5.00E+008 1.00E+009 1.50E+009 2.00E+009 2.50E+0090.00E+000
2.00E+008
4.00E+008
6.00E+008
8.00E+008
1.00E+009
G''(
Pa)
G'(Pa)
PS YBCO40 YBCO20 YBCO30 YBCO10
Fig 8.22 Cole-Cole plot for YBCO-PS composite
254 Chapter VIII
8.3 Conclusions
Dynamic mechanical properties of ceramic powder reinforced PS
composites are greatly dependent on the volume fraction of filler. This
analysis showed significant improvement in storage modulus of PS in the
glassy and rubbery region and is correlated with the morphological
behaviour. Different test methods and oscillation frequencies can result in
different Tg values as in Table8.3. Therefore, the values found in Table
8.3 should be viewed qualitatively because values from different studies
cannot be compared directly. This gives the beginning and end of the
transition period. The Tg values calculated in this chapter, therefore,
support the trends found by others. The presence of rigid filler into a
polymer matrix is generally responsible for the increase of glass transition
temperature. The glass transition temperature is shifted positively on the
addition of filler. Increase of frequency shifts the ‘Tg’ to higher
temperature. This results are justified by the homogeneity of dispersion of
the nanofiller into Polystyrene, as revealed by SEM analysis, and by the
enormous interfacial area of the nanoparticles, as a strong interconnection
between the two phases, reduces the mobility of Polystyrene chains.
The cross over frequency of the nanocomposites shifted towards the lower
frequency region with increasing BNN & YBCO content, signifying the
elastic behaviour and the delayed relaxation of the composites because of
the incorporation of BNN & YBCO. The (tanδ) peak temperature showed
a right shift and, the peak intensity was lowered for the composites.
Dynamic Mechanical Analysis 255
References
1 Saqan S A, Ayesh A S; Polymer Testing 23 (2004) 739.
2 Jin Y, Xudong C R F, Jiasen W; J. Appl. Poly. Sci 109 (2008) 3458.
3 Cowie J M G; Polymers: Chemistry & Physics of Modern Materials
Nelson Thornes CHELTENHAM,UK.
4 Lorenzo D M L, Errico M E, Avelle M; J. Mater. Sci. 37(2002) 2351.
5 Ferry J D; Viscoelastic Properties of Polymers, John Wiley, New York,
1980.
6 Kingery W D, Bowen H. K, Uhlmann D. R; Introduction to Ceramics
John Wiley &Sons New York. (2004).
7 Wolfrum J, Ehrenstein C W; J Comp. Mater. 34 (2000), 1788.
8 Work item W. K. 278; American Society of testing materials. West
Conshohocken P. A. 2003.
9 Sperling L H; Introduction to Physical Polymer Science, Wiley, New
York 2001.
10 Bryant E. The rapid prototype development Laboratory, University of
Dayton Research Institute; 1998.
http//www.udri.udayton.edu/rpdl/papers.htm(accessed March 2004).
11 Akay M; Comp. Scienc.Technol, 47(1993), 419.
12 Cassel B, Twombly B; ASTM Spec Tech Pub 108(1991),1136.
13 Kaszonyiova M, Rybnikar M; J Macromole. Sci Phys. 43 (2004) 1095.
14 Karbhari V M; Wang Q; Compos B 35(2004) 299.
15 Pothen L A, Zachariah O, Thomas S; Comp Scie. Tech. 63(2003) 283.
15 Marcovich N E, Reboredo M M; J Appl. Poly Sci, 70 (1998) 2121.
256 Chapter VIII
16 Bhatnagar M S; Polymers Processing and Application Vol. 2, S. Chand,
New Delhi, (2004).
17 Joel R Fried; Polymer Science and Technology, Prentice Hall of India,
New Delhi, (2000).
18 Einstein A; Investigation on theory of Brownian motion, New York,
Dover, (1956).
19 Guth E J; J. Appl Phys 16, (1951) 21.
20 Sung Y, Kum C, Lee H; Polymer 46, (2005), 5656.
21 Shaffer M, Windle A; Adv. Mater, 11 (1999) 937.
22 Chua P S; J Poly Comp 8(1987)308.
23 Gracius D H, Chen Z, Shen Y R, Somoraji G A ; Acc. Chem. Res. 32,
(1999) 930.
24 Tung C M, Dynes P J; J. Appl. PolySci 33 (1987) 505.
25 Drzal L. T, Rich M. J, Koening M. F, Llyod P. F; J Adhes 16, (1983) 133.
26 Nielsen L E; Mechanical properties of polymers and composites,
New York, Marcel Dekker (1974).
27 Joshi M, Maiti S N, Misra A; Polymer 35(1994) 205.
28 Landel R F; Mechanical Properties of Polymers and Composites, New
York, Marcel Dekker, (1994).
29 Murayamma T; Dynamic Mechanical Analysis of Polymer Material.
Elsevier, New York, (1978).
30 Hyun Y, Lim S, Choi H; Macromolecules 34, (2001), 8084.
31 Gu S, Ren J, Wang Q; J. Appl. Polym. Sci. 91(2004), 2427.
32 Hameed T, Hussein I; Macromol. Mater. Engg. 289 (2004) 198-203.