Embed Size (px)
Citation preview
Geophys. J . Int. (1996) 126,555-578
Dynamic models of subduction: geophysical and geological evidence in the Tyrrhenian Sea
Carlo Giunchi,1.2 Roberto Sabadini,' Enzo Boschi2 and Paolo Gasperini3 ' Dipartimento di Scienze della Terra, Sezione Geofisica, Universita di Milano, Via L. Cicognara, 7,20129 Milano, Italy
Istituto Nazionale di Geojisica, Via di Vigna Murata, 605, 00143 Roma, Italy Dipartimento di Fisica, Settore Geojisica, Unioersita di Bologna, Vide B. Pichat, 8, 40127 Bologna, Italy
Accepted 1996 April 1. Received 1996 March 28; in original form 1995 May 4
SUMMARY Predictions based on a 2-D finite-element model for subduction underneath the Calabrian Arc in southern Italy are compared with a variety of geophysical and geological data, such as the present-day stress pattern within the slab, uplift from the elevation of marine terraces in Calabria and subsidence in the Tyrrhenian Marsili Basin from ODP Leg 107. We model the behaviour of the slab driven by slab pull, in agreement with the present tectonic style in this part of the Mediterranean as suggested by several investigators. The model accounts for the crustal, lithospheric and mantle structures in a vertical cross-section perpendicular to the Calabrian subduction zone. The shape of the slab is constrained on the basis of new tomographic images in the southern Tyrrhenian Sea, which were obtained from the regional seismic stations of the Istituto Nazionale di Geofisica, while the rheological properties of the mantle are taken from global dynamic models. Density contrasts between the subducted slab and the surrounding mantle, based on petrological models, drive the flow in our viscoelastic model; stress values, displacements and vertical velocities at the surface are sampled at different times after loading until dynamic equilibrium is reached. Our estimates are appropriate for a time window of 100 kyr; the validity of our comparison with the geological record is based on the assumption that the tectonic configuration in the past was not substantially different from that of the present day. Two families of models, with unlocked and locked subduction faults, are considered. The unlocked models allow for roll-back of the trench of about 20 mm yr-', in agreement with some geological estimates; the same family of models predicts uplift of the Calabrian Arc of about 1 mm yr-l and subsidence in the Marsili Basin of 1-2 mm yr-', in agreement with geological surveys. The deviatoric stress obtained from the unlocked model is consistent with the continuous distribution of deep seismicity in the southern Tyrrhenian Sea, with minor concentration within the lithospheric wedge. Locked models fail to reproduce these geophysical and geological observations. Predictions derived from a detached slab model are not consistent with the continuous hypocentral distribution of deep seismicity in the southern Tyrrhenian Sea. Deformation at the surface and the stress patterns at depth for a detached slab differ substantially from those of a continuous plate: dynamic topography and horizontal motions are reduced, when compared with the continuous plate, with deviatoric stresses concentrated within the relict slab. Our results indicate that subduction is a major tectonic process in the southern Tyrrhenian Sea.
Key words: lithospheric deformation, stress distribution, subduction, Tyrrhenian Sea.
(1) subduction underneath the Calabrian Arc; (2) collision between the African and Eurasian blocks; (3) orogenic collapse of the Alpine mountain belt.
INTRODUCTION
The tectonic setting in the Tyrrhenian Basin and surrounding mountain belts is the result of three major geodynamic processes: Subduction of the Ionian oceanic lithosphere is indicated by
0 1996 RAS 555
556 C. Giunchi et al.
deep seismicity that, extending down to a maximum depth of about 500 km, characterizes the Calabrian Benioff zone (McKenzie 1972; Gasparini et al. 1982). Other evidence for subduction comes from seismic tomography (Spakman 1990; Selvaggi & Chiarabba 1995), petrological and geological data (Serri, Innocenti & Manetti 1993) and recent studies on the modern stress field (Rebai, Philip & Taboada 1992). The occurrence of intermediate seismicity in Italy beneath the Northern Apennines at depths of 90 km reinforces the hypoth- esis that a type of subduction mechanism also extends into the northern part of peninsular Italy, although different in style from the Calabrian Benioff zone (Selvaggi & Amato 1992).
Collision between the African and Eurasian blocks is indi- cated by global plate models (Argus et al. 1989; DeMets et al. 1990), by the release of seismic energy in the Mediterranean area (Pondrelli, Morelli & Boschi 1995), by the stress pattern inferred from seismicity, microtectonics and in situ stress measurements (Rebai et a!. 1992) and by VLBI-SLR data (Ryan et al. 1992; Ward 1994; Robbins et a/. 1992; Smith et al. 1994). The present north-north-westward motion of Africa is of the order of 10 mm yr-' (Robbins et ul. 1992; Ward 1994). This northward direction of motion of Africa has been main- tained over the last 10 Myr, with a reduction in the absolute velocity in the last few million years (Minster & Jordan 1978; Argus et al. 1989; Dewey et al. 1989). In the central Mediterranean, convergence caused the formation of the Apennine Maghrebian thrust belt.
In the late Oligocene-Early Miocene, extension started in the Tyrrhenian Basin at the top of the thickened Alpine wedge contemporaneously with compression at its front (Platt & Compagnoni 1990; Jolivet, Daniel & Fournier 1991; Wallis, Platt & Knott 1993). The effects of the gravitational collapse of this overthickened crust have probably been strengthened by a decrease of absolute convergence and trench retreat of the subduction hinge ( Molnar & Lyon-Caen 1988).
A fully realistic numerical simulation of the geodynamics of this area would require a 3-D analysis to account for the three dominant tectonic mechanisms, the finite lateral extent of subduction in the Tyrrhenian Sea underneath the Calabrian Arc, and the rheological complexities of the area and geometry of the structures.
In order to gain insight into the effects of the aforementioned complexities on the geodynamics of the area, Bassi & Sabadini (1994) and Giunchi et ul. (1994) made use of two 2-D studies: one, in the horizontal plane, simulated the effects of collision between the two continental blocks where subduction is para- metrized by means of a trench suction force applied at the plate boundary (Bassi & Sabadini 1994); the other, along vertical planes perpendicular to the trench, studied the effects of subduction on some geophysical and geological observations (Giunchi et a/. 1994). Discrepancies between our predictions and the data, together with a comparison of 2-D and 3-D models (in preparation), will lead to a full understanding of the tectonics of the area.
The driving mechanism in our study is slab pull, without active convergence between the overriding and subducting plates, in agreement with global plate-tectonic models that indicate a negligible east-west relative motion of the African and Eurasian plates (DeMets et ul. 1990).
In this study, the preliminary analysis by Giunchi et a1. (1994) on Tyrrhenian subduction is carried forward several steps, taking into account new complexities in the rheological
and petrological stratification of the mantle. With respect to the previous study, an extra viscoelastic layer has been inserted to account for the lower mantle, characterized by a viscosity increase with respect to the upper mantle in agreement with global geodynamical models (Spada et al. 1992).
Model predictions are now compared with seismological and geological observations; new tomographic results allow us to constrain the dip of the slab and, at the same time, to compare the pattern of deviatoric stress inferred from our modelling with the distribution of deep earthquakes in the southern Tyrrhenian Sea (Selvaggi & Chiarabba 1995). The change from an extensional style into a compressional one in our model slab is compared with seismological data on the active stress field, which shows that this transition occurs at relatively shallow depths, between 160 and 350 km (Giardini & Velona 1991; Frepoli, Selvaggi & Chiarabba 1996). The pattern of subcrustal earthquakes in the Northern Apennines is also considered in order to permit comment on the different style of subduction between the northern and southern Tyrrhenian Sea (Selvaggi & Amato 1992).
Vertical motions inferred from geological records fall into two categories: subsidence rates, estimated from sedimentation rates in the foredeeps and in the back-arc basin, and uplift rates, obtained from the elevation of marine terraces in the arc with respect to present sea-level surface. These geological data, together with the style of stress within the slab inferred from seismology, are the most appropriate to discriminate amongst the various tectonic hypotheses and corresponding numerical models.
Sedimentation rates in the foredeeps and subsidence rates in the Marsili Basin are of the order of 1 mm yr-I and 1-2 mm yr-', respectively (Royden, Patacca & Scandone 1987; Kastens et al. 1987), while the uplift rate, measured in the Calabrian Arc from marine terraces, is 1 kO.1 mm yr-' (Westaway 1993). The extension rate in the southern Tyrrhenian Basin is the most difficult to estimate because of the lack of GPS data in the area and the long time-scale over which available estimates for this datum are based; Malinverno & Ryan (1986), for example, provide an estimate that is appropriate for the whole evolution of the Tyrrhenian Basin of about 20 Myr, corresponding to a time interval that is much longer than the time window of validity of our scheme. Recent estimates by Serri et al. (1993) on the extension rate in the northern Tyrrhenian Basin, relative to its southern part, are also considered.
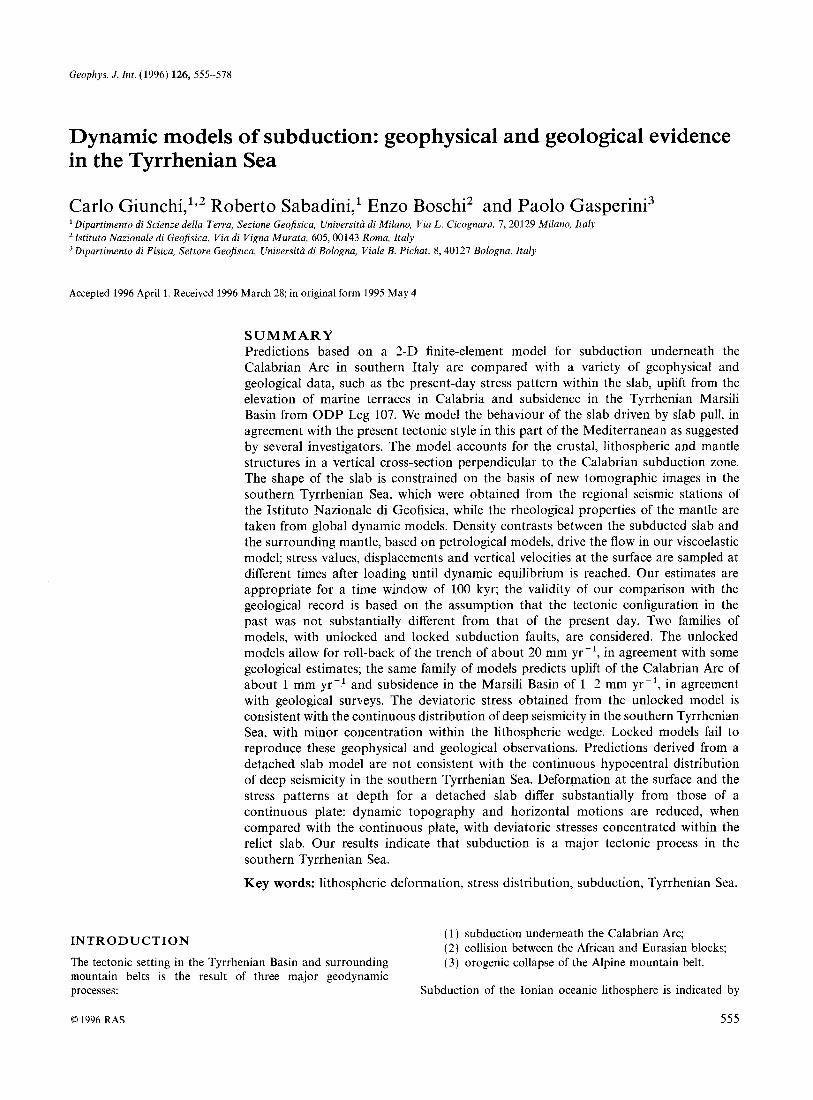
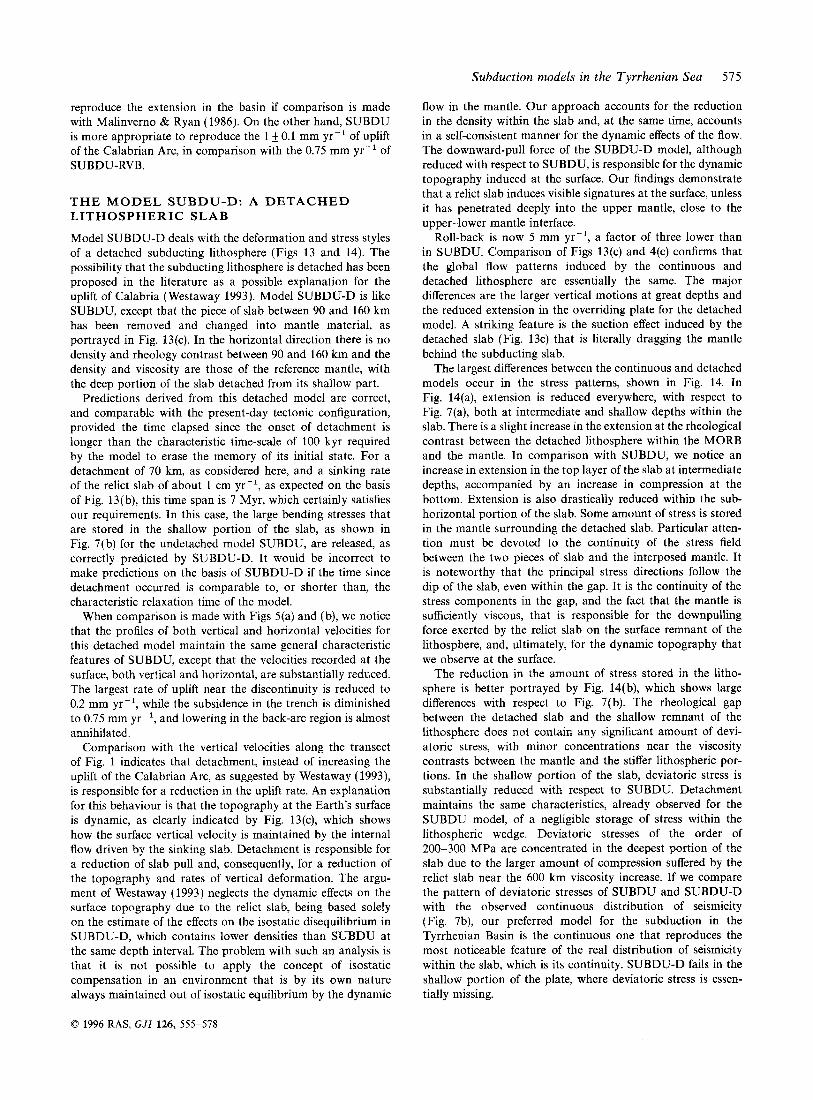
Fig. 1 is a simplified portrait of the neostructural domains of peninsular Italy after Ambrosetti et al. (1987), where the regions subject to uplift and subsidence are emphasized because they are relevant to our modelling. The inset indicates the names of the various domains used throughout this paper. The white dashed line shows the transect in which we are interested, perpendicular to the Calabrian Arc. We recognize that the Alpine chain sectors, symbols 1 and 2, are subject to uplift; the foreland is also being uplifted, as indicated by 2 and 3. Subsidence prevails in the foredeeps, as shown by 5-7. The Apennines chain is denoted by 8-10 and, for the part of interest to us, is being uplifted, as indicated by 8 and 10. The Tyrrhenian Sea is subsiding, as shown by 11. The subduction hinge line is indicated by white triangles.
Along the white dashed line from north-west, in the Tyrrhenian Sea, to south-east, in the Ionian Sea, the noticeable feature, is the sequence of subsidence in the Tyrrhenian Basin
0 1996 RAS, GJI 126, 555-578
Subduction models in the Tyrrhenian Sea 551
NEO-STRUCTURAL DOMAINS OF ITALY
lonian Sea
b
11111 3
:;.; 4
5
1 6
w7 ..... .... ..... ::::. 8
I!! 9
57 ’0
11
Figure 1. Uplift and subsidence is indicated for the different tectonic domains of peninsular Italy and surrounding regions [simplified from the Neotectonic Map of Italy, Ambrosetti et al. (1987)l. The dashed line, perpendicular to the Tyrrhenian subduction underneath the Calabrian Arc, corresponds to the section considered in our modelling. 1: Pre-Pliocene Alpine chain (uplift); 2: inner sector of the south Alpine-Dinaric margin (uplift); 3: Pliocene foreland and Pliocene-Quaternary foreland (subsidence); 4: Pliocene foreland and Pliocene-Quaternary foreland (uplift); 5: Pliocene-Quaternary foredeep deformed by normal faults (subsidence); 6: Pliocene-Quaternary foredeep deformed by reverse and thrust faults (intense subsidence); 7: Pliocene foredeep affected by crustal shortening (subsidence); 8: Apenninic chain (uplift); 9 Apenninic chain (subsidence); 10: pre-Pliocene chains and the Sardo-Corsica block (uplift); 11: pre-Pliocene chains and the Sardo-Corsica block (subsidence).
(1 l), uplift of Calabria (8) and subsidence in the Ionian Sea ( 5 and 7). Although not explicitly reported in Fig. 1, extension and migration of the subduction hinge line to the south-east along the transect has been accompanied by the formation of the Tyrrhenian Sea.
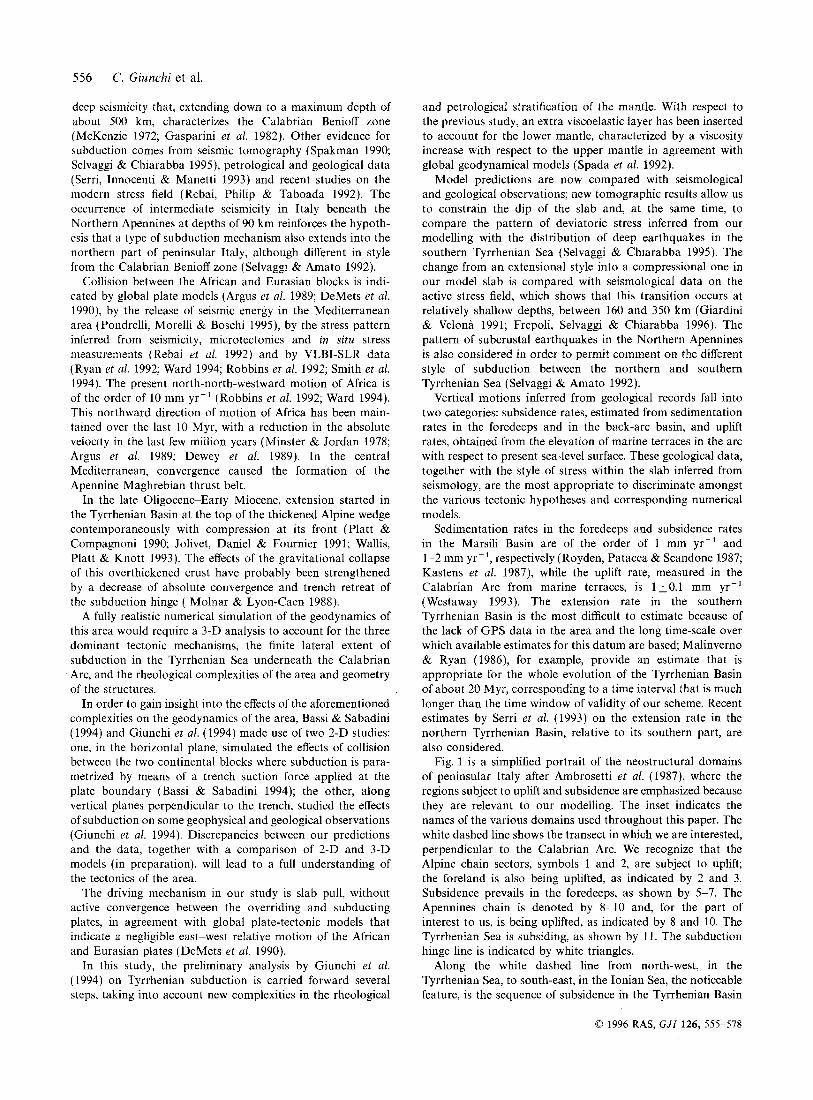
on the geometry and rheology of this model are given in Table 1. The different shadings correspond to the various portions of the model, differentiated into the crust, lithosphere and upper and lower mantle. We assume that the subducting Ionian lithosphere is oceanic, while the overriding plate is a thinned continental plate. The thickness of the upper oceanic
MODEL CHARACTERISTICS
Our preliminary study (Giunchi et al. 1994) was based on the plane-strain version of the finite-element code TECTON, with materials characterized by Maxwell viscoelastic rheology (Melosh & Raefsky 1981; Gasperini & Sabadini 1989). In order to change to a numerical scheme more versatile in the modification of the mesh for different tectonic models, we have used the ANSYS code (Ansys Inc. 1992) for our new analysis. The quality of the new numerical solutions has been verified by means of benchmark calculations that confirm the agreement of the solutions derived from the TECTON and ANSYS finite-element codes.
Fig. 2 depicts a vertical cross-section of the 2-D model considered in the present calculations; quantitative information
lithosphere is 40 km, differentiated into a crust of 10 km and a harzburgite layer of 30 km. The thickness of the lower oceanic lithosphere is 40 km.
In contrast to Whittaker, Bott & Waghorn (1992), where the upper lithosphere is perfectly elastic, we have modelled this layer by means of a viscoelastic Maxwell rheology with a viscosity of loz4 Pa s in order to avoid unrealistic bending stresses.
The lower oceanic lithosphere has a Maxwell viscosity of 5 x 10” Pa s, as in Whittaker et al. (1992). The upper and lower mantle have viscosities of 10” and 3 x 10” Pa s, respectively, in agreement with global geodynamic models (Spada et al. 1992). The elastic structure of the upper and lower mantle is based on the PREM reference model (Dziewonski & Anderson 1981). In the overriding plate the
0 1996 RAS, GJI 126, 555-578
558 C. Giunchi et al.
crust
upper mantle
lithosphere
lower mantle
Figure 2. 2-D model used in the finite-element calculations. The lower mantle is included, together with a realistic section of the overriding plate in the southern Tyrrhenian Sea along the profile of Fig. 1 (dashed). The different shades of grey correspond to the various portions of the lithosphere and mantle, as given at the bottom. The box inserted in the upper mantle denotes the region displayed in
14(a) and 14( b). Figs 4k), 7(a), 7" 8(c), 9(ch 10(a), 10(b), 11(c), W ) , W b ) , W ) ,
Table 1. Geometrical and rheological characteristics of the model portrayed in Fig. 4.
Geometry Model width Model depth Basin width Slab depth Slab thickness Crust thickness Harzburgite layer thickness Slab dip angle
2700 km 1800 km 500 km 500 km 80 km 10 km 30 km
70"
Rheology Upper lithosphere (oceanic crust + harzburgite) viscosity Pa s Lower lithosphere (pyrolite) viscosity 5 x 10" P a s Upper mantle viscosity loz1 P a s Lower mantle viscositv 3 x P a s
viscosities of the crust and lithosphere are loz4 and 5 x 10'' Pa s, respectively.
With respect to our previous efforts, based on a uniform density contrast of 50 kg m-3 within the slab and a single viscoelastic layer for the upper mantle (Giunchi et al. 1994), the models considered in this paper are characterized by the presence of the lower mantle and by density contrasts derived from Irifune & Ringwood (1987).
In order to have the same volume for the upper and lower mantle as in the real Earth, the boundary between the upper and lower mantle is fixed at 600 km and the bottom of the lower mantle at 1800 km; the horizontal extent of the grid is 2700 km. Crustal and lithospheric thinning in the basin are taken from Rehault et al. (1990) and Morelli (1994).
The horizontal displacement is imposed to vanish at the
right and left edges of the mesh from the upper surface down to a depth of 90 km, corresponding to the lithospheric layer, as sketched in Fig. 2. The bottom of the grid is fixed in the vertical direction and all other boundaries are free to allow the upper-mantle flow to escape in the horizontal direction from the side walls of the grid. For the family of unlocked models, the subduction fault is characterized by a zero friction coefficient in order to allow for roll-back of the subduction hinge (Whittaker et al. 1992).
In our approach, where we focus on a short time interval during the evolution of the system, the thinned lithosphere in the basin is included in the model at the start, instead of being generated in a complete time evolution as appropriate for a convective model. We are not interested in the deformation of the sedimentary cover, nor is our model appropriate for the description of the rheological behaviour of this layer, which should be treated as a plastic body; we focus instead on the deformation of the stiffer basement. The initial topography of Fig. 2 corresponds, in fact, to the basement in the area, and plays only a minor role in our conclusions.
The dip of the slab is 70" (Table l ) , in agreement with the most up-to-date seismic studies (Selvaggi & Chiarabba 1995). It should be noted that we do not include any variation in the dip at 250 km, in contrast to previous analyses of deep seismicity based on teleseismic data (Anderson & Jackson 1987).
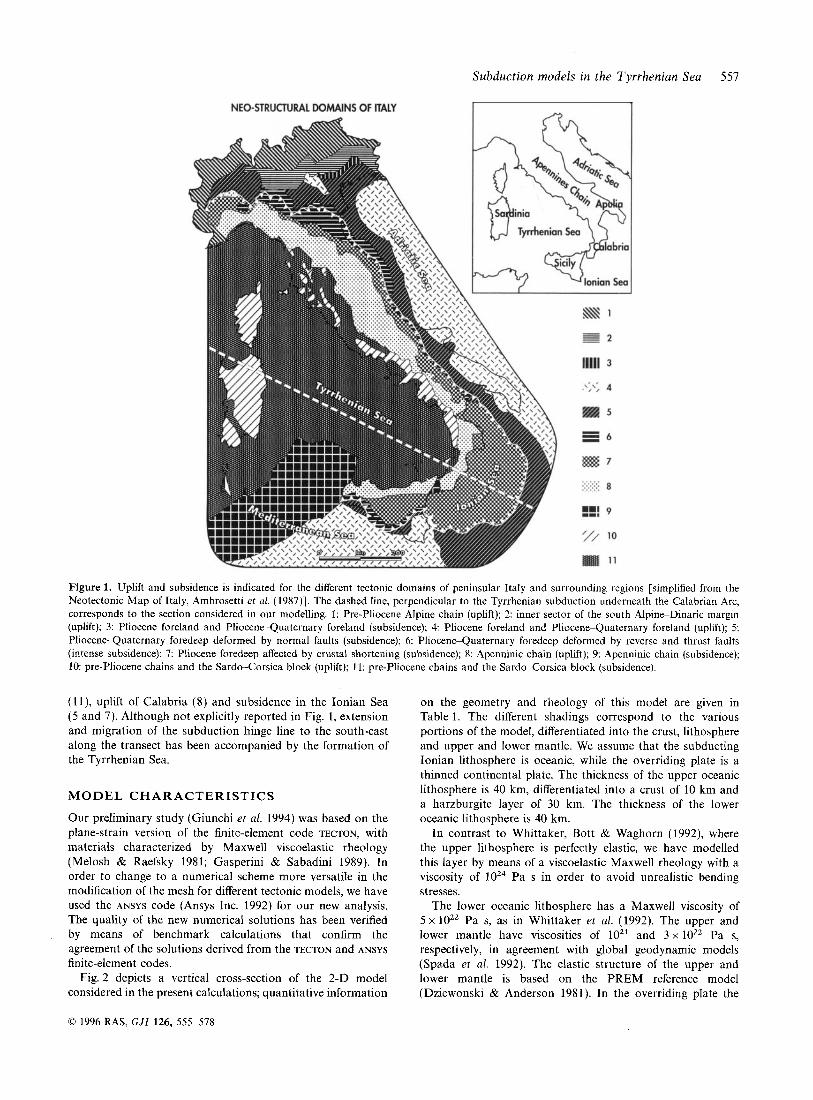
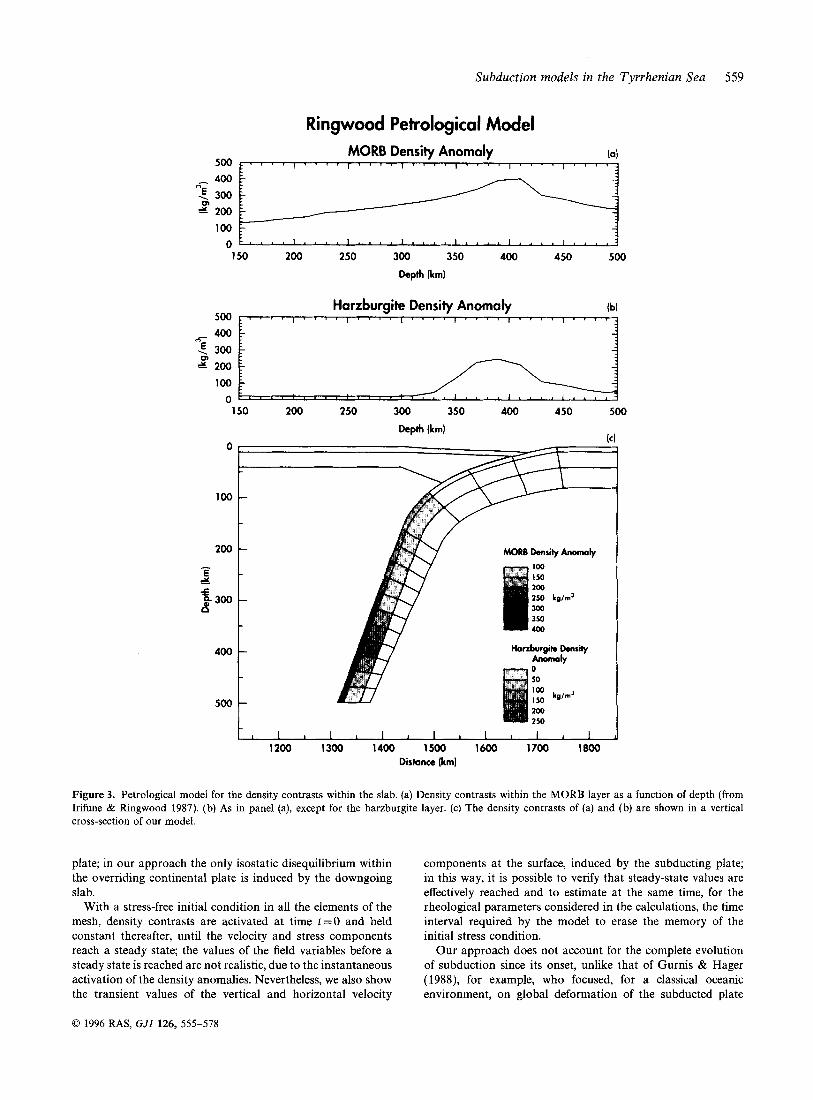
The density structure within the slab, portrayed in Fig. 3, is based on the petrological studies by Irifune & Ringwood (1987), where the phase transformations within the slab, mod- elled by a combination of 80 per cent harzburgite plus 20 per cent primitive MORB, are provided as a function of depth. The results of Irifune & Ringwood (1987) are appro- priate for a cold, non-equilibrated slab, corresponding to commonly accepted temperature contrasts of 800 "C at 400 km depth and 400 "C at 650 km. The density contrasts with respect to the surrounding mantle are responsible for the body force that drives the flow in our model; these are shown in Figs 3(a) and (b), with the oceanic crust of 10 km and the underlying harzburgite layer of 30 km. Fig. 3(c) depicts the distribution of density anomalies within the slab, in a 2-D vertical cross- section. In this model, the lower portion of the slab is not differentiated in density with respect to the mantle, in agree- ment with Irifune & Ringwood (1987). The largest density contrast is found at 400 km; the total force per unit length along the trench is 1.92 x 10¹³ N m-l. The density contrasts considered in our models vanish at 500 km depth, where deep seismicity terminates.
The buoyant restoring force, due to the density contrast at the surface, is taken into account in the model by means of a force boundary condition proportional to the vertical displace- ment (Williams & Richardson 1991).
In contrast to Whittaker et al. (1992), we do not consider there to be a negative density contrast in the overriding plate, which is equivalent to assuming that the plate is in isostatic equilibrium before slab pull becomes effective; in Whittaker et al. (1992), on the other hand, the effects of the negative density contrast in the overriding plate are counteracted by a vertical force imposed at the surface to avoid the uplift of the lighter continental crust. We avoided this procedure because of the ambiguity in establishing any realistic initial density contrast in the overriding plate, with respect to an equilibrium state, without inducing an artificially high level of stress in this
0 1996 RAS, GJI 126, 555-578
Subduction models in the Tyrrhenian Sea 559
Ringwood Petrological Model
150 200 250 300 350 400 450 500 h p h (km)
Harzburgite Density Anomaly (bl
0
100
200 - E r_ 2 300 400
500
150 200 250 300 350 400 450 500 h p h (kml
lc
4 Y MORB Density Anomaly
1 1 , 1 1 I I 1 I 1 1 I 1200 1300 1400 1500 1600 1700 1800
Distance (kml
Figure 3. Petrological model for the density contrasts within the slab. (a) Density contrasts within the MORB layer as a function of depth (from Irifune & Ringwood 1987). (b) As in panel (a), except for the harzburgite layer. (c) The density contrasts of (a) and (b) are shown in a vertical cross-section of our model.
plate; in our approach the only isostatic disequilibrium within the overriding continental plate is induced by the downgoing slab.
With a stress-free initial condition in all the elements of the mesh, density contrasts are activated at time t = O and held constant thereafter, until the velocity and stress components reach a steady state; the values of the field variables before a steady state is reached are not realistic, due to the instantaneous activation of the density anomalies. Nevertheless, we also show the transient values of the vertical and horizontal velocity
components at the surface, induced by the subducting plate; in this way, it is possible to verify that steady-state values are effectively reached and to estimate at the same time, for the rheological parameters considered in the calculations, the time interval required by the model to erase the memory of the initial stress condition.
Our approach does not account for the complete evolution of subduction since its onset, unlike that of Gurnis & Hager (1988), for example, who focused, for a classical oceanic environment, on global deformation of the subducted plate
0 1996 RAS, GJI 126, 555-578
560 C . Giunchi et al.
without considering tectonic features such as back-arc extension or roll-back; in our approach we assume that the stress due to the previous subduction history has been released by viscous processes and seismic activity.
MODELLING RESULTS
Before the numerical results are presented, we briefly introduce the models considered in our analysis in Table 2. In the left column the subduction models SUBD are differentiated into the family of unlocked models, U, and the only representative of the locked models, SUBDL, with unlocking of the subduc- tion fault limited to the uppermost 70 km (Furukawa 1993), as specified in the second column characterizing the style of slab/mantle coupling. The third column specifies other charac- teristics of the models, such as the lateral variations in the rheological properties of the lithosphere or detachment with the depth interval where mantle material is substituted for the detached lithosphere.
Starting with the unlocked models (Figs 4 to 8), we first discuss the deformation style in Figs 4-6, dealing with the vertical and horizontal velocities at the surface and displace- ment patterns in vertical cross-sections. Fig. 5 deals with the differences, in the vertical and horizontal velocities, between the present analysis and our previous one, based on a simplified structure of the mantle and density anomalies within the slab (Giunchi et al. 1994). The stress pattern for the unlocked model is shown in Fig. 7. Fig. 8 deals with an unlocked model where the viscosity is increased in the transition zone of the upper mantle. The effects of a locked subduction fault on the deformation and stress patterns are shown in Figs 9 and 10 to emphasize the differences between locked and unlocked models. In Figs 11 and 12 we analyse the effects of a modification in the rheology of the crust and lithosphere underneath the basin. Finally, in Figs 13 and 14, the effects of detachment on the deformation and stress patterns are shown. Each model is discussed regarding its implications for the geophysical and geological constraints and its differences with respect to the other models.
THE UNLOCKED MODEL SUBDU
Fig. 4 deals with SUBDU where the subduction fault is unlocked from the surface to a depth of 500 km; this first model belongs to the class of subduction models (SUBD) and to the sub-class of the unlocked models (U). We have verified that unlocking of the fault can be obtained equivalently by a slip condition on the nodes of the elements belonging to the
Table2. For the various models listed on the left, the style of slab/ mantle coupling is given in the middle column; viscosity variations with respect to the standard model of Table 1 are indicated in the right column.
Model Slab/Mantle Coupling Other features
SUBDU unlocked (0-500 km) SUB D U - T unlocked (0-400 km)
SUBDL locked (70-500 km) SUBDU-RVB unlocked (0-500 km) viscosity decrease in the
SUBDU-D unlocked detachment
viscosity increase in the transition zone
basin
(90- 160 km)
slab and upper mantle, maintaining the contact between the two parts of the fault, or by a viscosity decrease of two orders of magnitude in a thin layer overlying the top of the slab; our results are all based on the first approach. In this paper we do not discuss the physical processes, mainly thermal and plastic ones, or phase transformations at the top of the slab that control the amount of decoupling between the mantle and the slab.
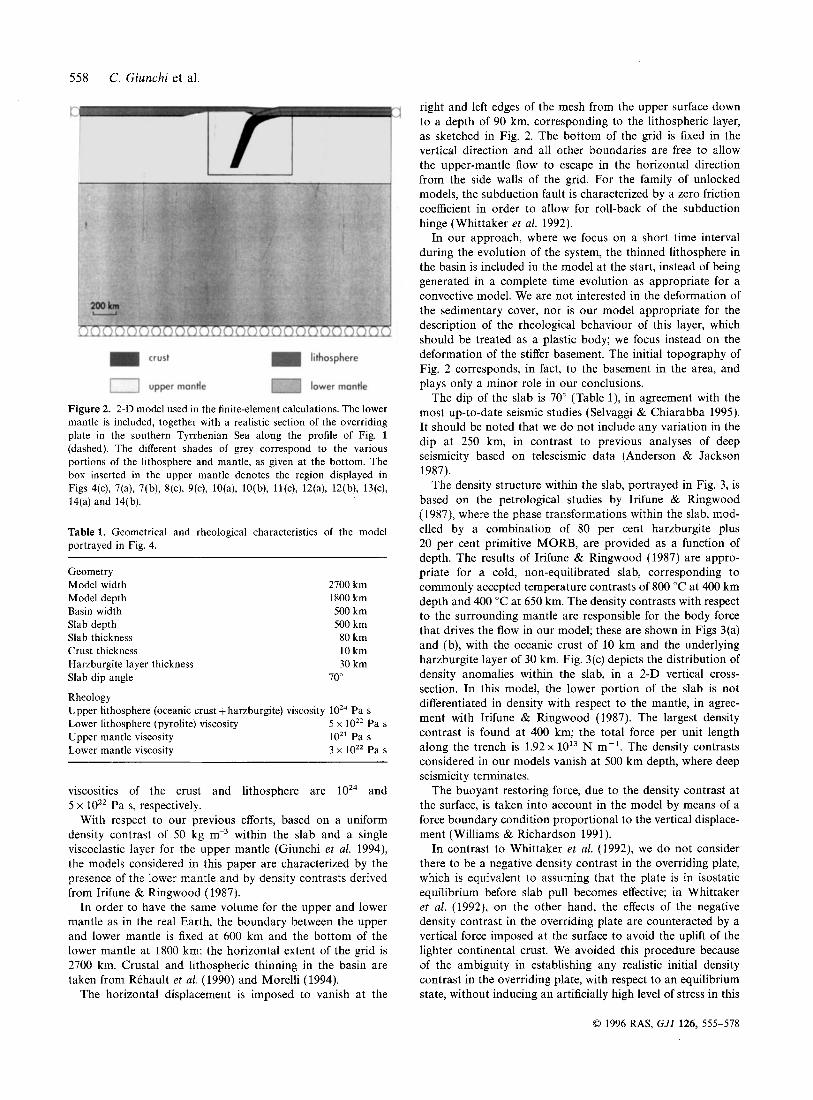
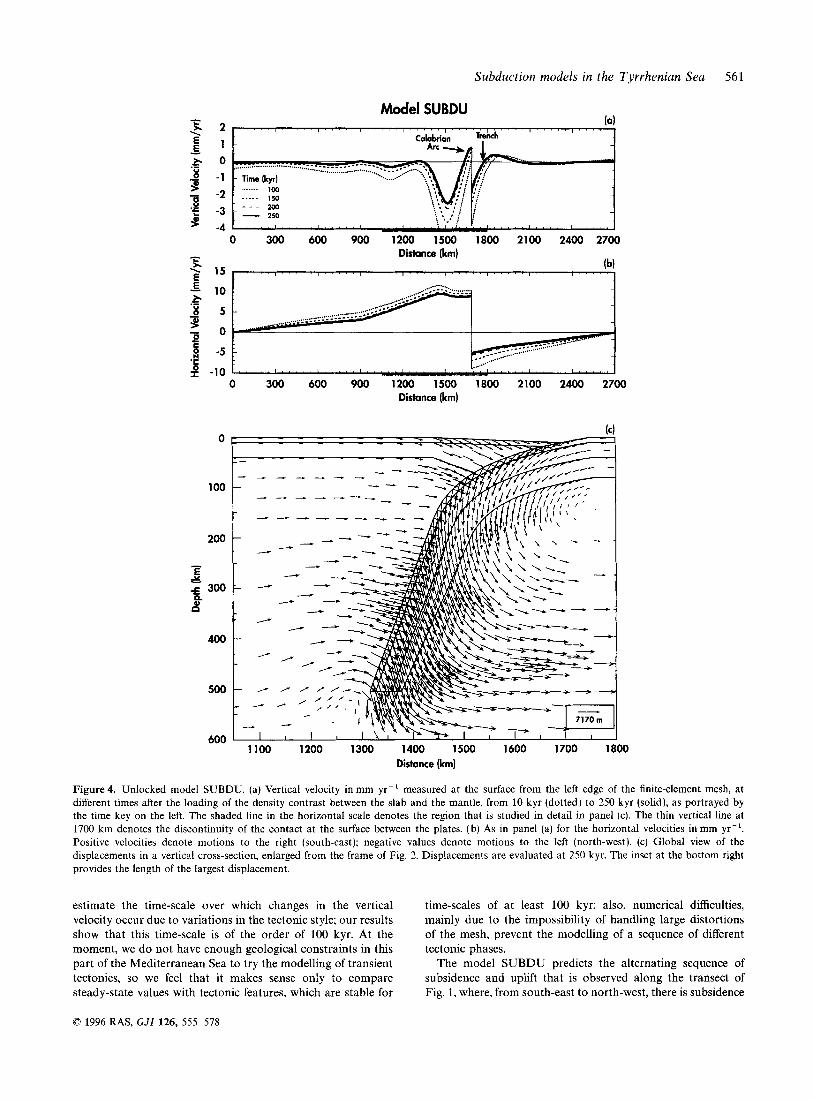
Vertical and horizontal velocities at the surface in mm yr-I are shown in Figs 4(a) and (b), respectively, at different times after the loading of the density contrasts at time t = O the velocities are sampled at 100, 150, 200 and 250 kyr (dotted, dashed, thin and thick curves). The thick solid curve corre- sponds to the steady state when velocities reach the asymptotic values. The shaded region on the horizontal scale, between 1050 and 1800 km from the left boundary, denotes the part of the model that is studied in greater detail in the bottom panel (c); the same holds for subsequent figures.
These velocities are appropriate for the present-day con- figuration of the slab and thus cannot be considered valid for different tectonic configurations with a different depth of the tip of the slab, a different inclination, and so on; our results provide a picture that is valid for a time-scale of 100 kyr during which we assume that substantial modifications to the tectonic style did not occur. Numerical integration over this time interval prevents large distortions of the mesh.
From right to left in Fig. 4(a), we recognize some features whose gross characteristics will be reproduced by the whole set of unlocked models: a broad bulge of the oceanic lithosphere at 1850 km, the profound depression of the trench between 1675 and 1775 km, the outer arc at the left border of the trench region between 1625 and 1675 km, and the broad subsidence in the basin between 1350 and 1625 km. The depression of the trench and subsidence of the basin are due to the cold, negatively buoyant slab sinking in the mantle, while the two peripheral bulges, at 1900 and 1300 km, are due to the flexural response of the lithosphere to downwelling; these regions of uplift are asymmetric, due to the intrinsic asymmetry of the structure, with the uplift on the right responsible for a bulge in the geological record, which is more developed in comparison with the smoother bulge on the left because of the larger bend of the subducting lithosphere.
An important feature of Fig. 4(a) is the sharp discontinuity at the left border of the trench, at 1675 km, due to the subduction fault that decouples the top of the subducting lithosphere from the overriding lithospheric plate and the mantle. This decoupling corresponds to the condition of an unlocked subduction fault, used by Whittaker et al. (1992), which allows the roll-back of the subduction hinge. This condition will be modified into a locked subduction fault in some of the following calculations.
The gross features of the vertical displacement are similar to those already obtained by Tharp (1985) for a subduction model with decoupling limited to a lithospheric megathrust and a different rheological structure of the lithosphere, based on an elastic-plastic body, and of the asthenosphere, characterized by a low viscosity value.
Although a precise modelling of the transient tectonics caused by changes in the convergence rates between the two plates or in the amount of coupling between the mantle and the top of the slab would require modification of the boundary conditions at the edges of the plates or contact at the subduc- tion fault, we can nevertheless make use of our findings to
0 1996 RAS, GJI 126, 555-578
Figure
Subduction models in the Tyrrhenian Sea
Model SUBDU k 2
.- -zz:,;;,I:,., L. 0 -8 -1 - Tirnatkyrj 9 ..........
~ -2 .g -3 I - - - 9
0 300 600 900 1200 1500 1800 2100 2400 2700 Distance (km)
\
- E 1 :
100 - ..... 150
100 - 250
-
-4 - , , , , , I , , 1
0 300 600 900 1200 1500 1800 2100 2400 2700 Distance (krn)
0
100
200
- E Y f, 300 B
400
500
600 1100 1200 1300 1400 1500 1600 1700 1800
Distance (km)
56 1
Jnlocked model SUBDU. (a) Vertical velocity in mm yr-' measured at the surface from the left edge of the iite-element me! 1, at different times after the loading of the density contrast between the slab and the mantle, from 10 kyr (dotted) to 250 kyr (solid), as portrayed by the time key on the left. The shaded line in the horizontal scale denotes the region that is studied in detail in panel (c). The thin vertical line at 1700 km denotes the discontinuity of the contact at the surface between the plates. (b) As in panel (a) for the horizontal velocities in mm yr-'. Positive velocities denote motions to the right (south-east); negative values denote motions to the left (north-west). (c) Global view of the displacements in a vertical cross-section, enlarged from the frame of Fig. 2. Displacements are evaluated at 250 kyr. The inset at the bottom right provides the length of the largest displacement.
estimate the time-scale over which changes in the vertical velocity occur due to variations in the tectonic style; our results show that this time-scale is of the order of 100 kyr. At the moment, we do not have enough geological constraints in this part of the Mediterranean Sea to try the modelling of transient tectonics, so we feel that it makes sense only to compare steady-state values with tectonic features, which are stable for
Q 1996 RAS, GJI 126, 555-578
time-scales of at least 100 kyr; also, numerical difficulties, mainly due to the impossibility of handling large distortions of the mesh, prevent the modelling of a sequence of different tectonic phases.
The model SUBDU predicts the alternating sequence of subsidence and uplift that is observed along the transect of Fig. 1, where, from south-east to north-west, there is subsidence
562 C. Giunchi et al.
(a) 1.5
9 -3.5 1 ' ' " " " " ' I " " ' I " ' " I ' " " I ' " " I " " ' " " " " " ' I 0 300 600 900 1200 1500 1800 2100 2400 2700
- E 10 r-,* 4J ........... ......... c - - ........ * - ...... c ........ .................... 5 .........
$ 0
8 ............. ............. s -5 ......... .........
.-
b -10 t . " ' ' ' , ' ' . , I . ' " " " " ~ " " ' ~ ' " ' ' " " " ' ' " " ' ' ~ ' " ~ ~
0 300 600 900 1200 1500 1800 2100 2400 2700 Distance (km)
I
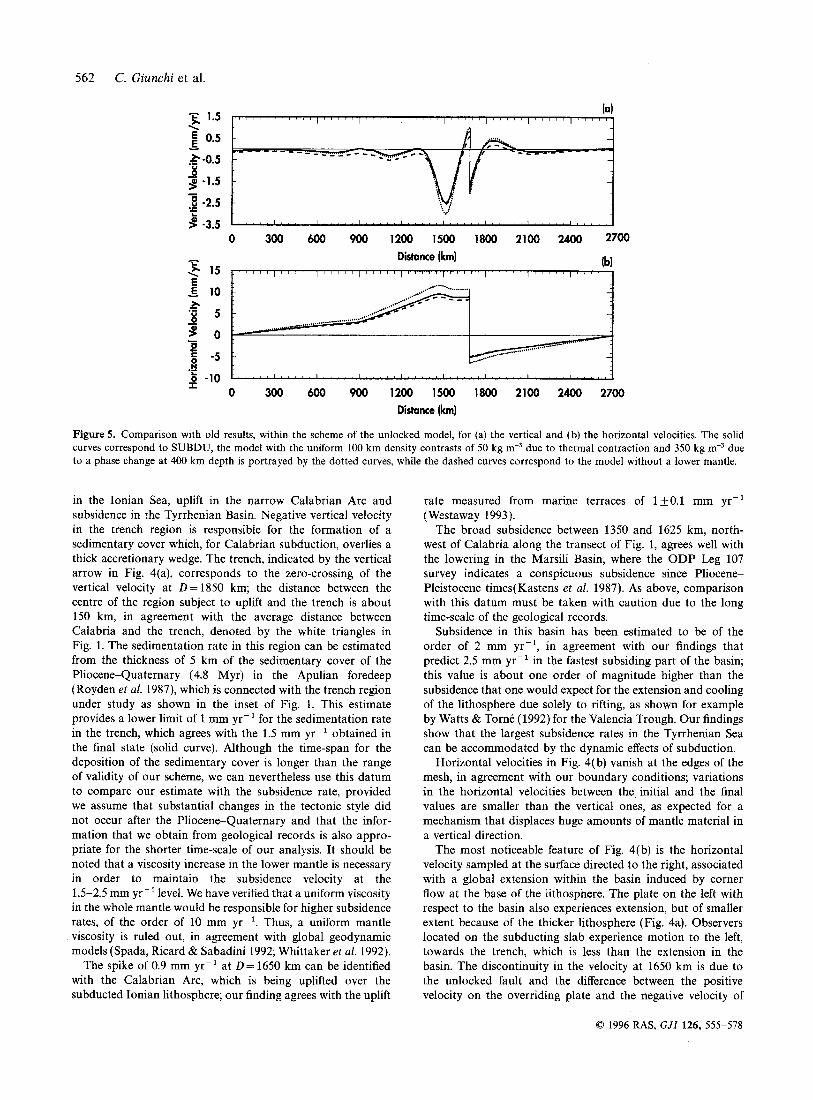
Figure 5. Comparison with old results, within the scheme of the unlocked model, for (a) the vertical and (b) the horizontal velocities. The solid curves correspond to SUBDU, the model with the uniform 100 km density contrasts of 50 kg m-3 due to thermal contraction and 350 kg m-3 due to a phase change at 400 km depth is portrayed by the dotted curves, while the dashed curves correspond to the model without a lower mantle.
in the Ionian Sea, uplift in the narrow Calabrian Arc and subsidence in the Tyrrhenian Basin. Negative vertical velocity in the trench region is responsible for the formation of a sedimentary cover which, for Calabrian subduction, overlies a thick accretionary wedge. The trench, indicated by the vertical arrow in Fig. 4(a), corresponds to the zero-crossing of the vertical velocity at D = 1850 km; the distance between the centre of the region subject to uplift and the trench is about 150 km, in agreement with the average distance between Calabria and the trench, denoted by the white triangles in Fig. 1. The sedimentation rate in this region can be estimated from the thickness of 5 km of the sedimentary cover of the Pliocene-Quaternary (4.8 Myr) in the Apulian foredeep (Royden et al. 1987), which is connected with the trench region under study as shown in the inset of Fig. 1. This estimate provides a lower limit of 1 mm yr-' for the sedimentation rate in the trench, which agrees with the 1.5 mm yr-' obtained in the final state (solid curve). Although the time-span for the deposition of the sedimentary cover is longer than the range of validity of our scheme, we can nevertheless use this datum to compare our estimate with the subsidence rate, provided we assume that substantial changes in the tectonic style did not occur after the Pliocene-Quaternary and that the infor- mation that we obtain from geological records is also appro- priate for the shorter time-scale of our analysis. It should be noted that a viscosity increase in the lower mantle is necessary in order to maintain the subsidence velocity at the 1.5-2.5 mm yr-' level. We have verified that a uniform viscosity in the whole mantle would be responsible for higher subsidence rates, of the order of 10 mm yr-'. Thus, a uniform mantle viscosity is ruled out, in agreement with global geodynamic models (Spada, Ricard & Sabadini 1992; Whittaker et al. 1992).
The spike of 0.9 mm yr- ' at D = 1650 km can be identified with the Calabrian Arc, which is being uplifted over the subducted Ionian lithosphere; our finding agrees with the uplift
rate measured from marine terraces of 1 kO.1 mm yr-' (Westaway 1993).
The broad subsidence between 1350 and 1625 km, north- west of Calabria along the transect of Fig. 1, agrees well with the lowering in the Marsili Basin, where the ODP Leg 107 survey indicates a conspicuous subsidence since Pliocene- Pleistocene times( Kastens et al. 1987). As above, comparison with this datum must be taken with caution due to the long time-scale of the geological records.
Subsidence in this basin has been estimated to be of the order of 2 mm yr-', in agreement with our findings that predict 2.5 mm yr-' in the fastest subsiding part of the basin; this value is about one order of magnitude higher than the subsidence that one would expect for the extension and cooling of the lithosphere due solely to rifting, as shown for example by Watts & Torne (1992) for the Valencia Trough. Our findings show that the largest subsidence rates in the Tyrrhenian Sea can be accommodated by the dynamic effects of subduction.
Horizontal velocities in Fig. 4( b) vanish at the edges of the mesh, in agreement with our boundary conditions; variations in the horizontal velocities between the initial and the final values are smaller than the vertical ones, as expected for a mechanism that displaces huge amounts of mantle material in a vertical direction.
The most noticeable feature of Fig. 4(b) is the horizontal velocity sampled at the surface directed to the right, associated with a global extension within the basin induced by corner flow at the base of the lithosphere. The plate on the left with respect to the basin also experiences extension, but of smaller extent because of the thicker lithosphere (Fig. 4a). Observers located on the subducting slab experience motion to the left, towards the trench, which is less than the extension in the basin. The discontinuity in the velocity at 1650 km is due to the unlocked fault and the difference between the positive velocity on the overriding plate and the negative velocity of
0 1996 RAS, G J I 126, 555-578
Subduction models in the Tyrrhenian Sea 563
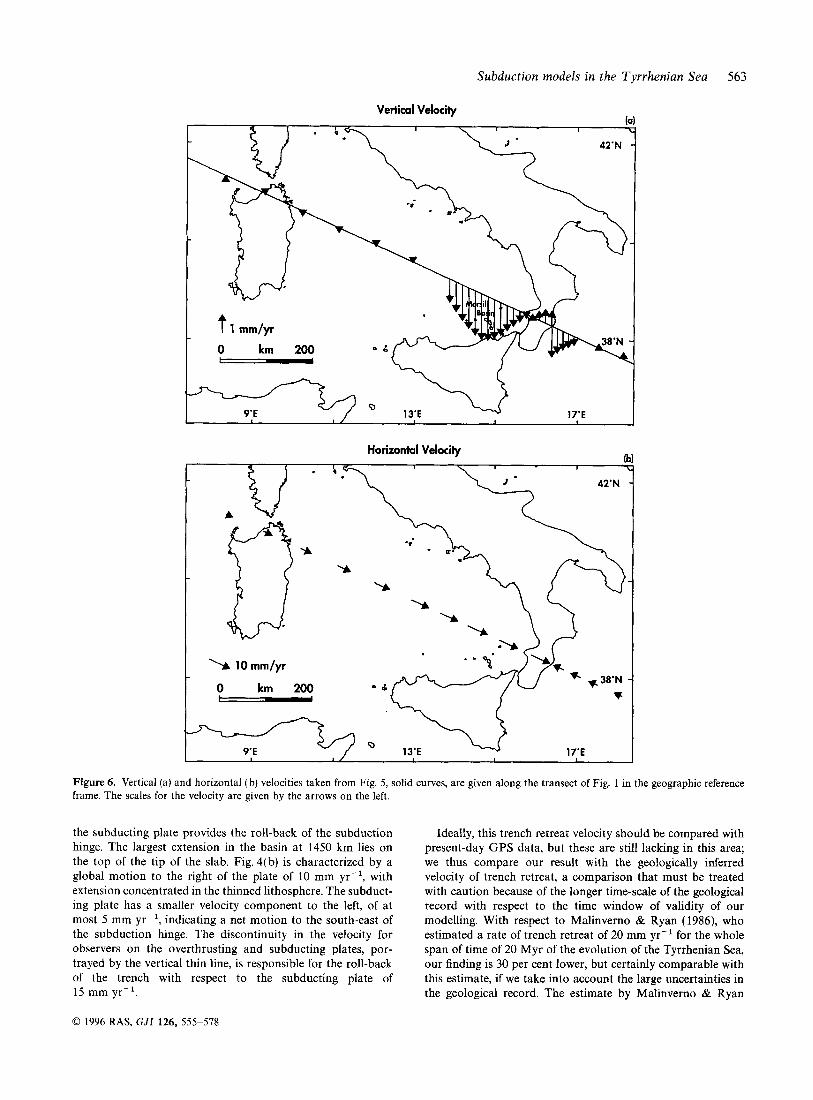
Figure 6. Vertical (a) and horizontal (b) velocities taken from Fig. 5, solid curves, are given along the transect of Fig. 1 in the geographic reference frame. The scales for the velocity are given by the arrows on the left.
the subducting plate provides the roll-back of the subduction hinge. The largest extension in the basin at 1450 km lies on the top of the tip of the slab. Fig. 4( b) is characterized by a global motion to the right of the plate of 10 mm yr-', with extension concentrated in the thinned lithosphere. The subduct- ing plate has a smaller velocity component to the left, of at most 5 mm yr-', indicating a net motion to the south-east of the subduction hinge. The discontinuity in the velocity for observers on the overthrusting and subducting plates, por- trayed by the vertical thin line, is responsible for the roll-back of the trench with respect to the subducting plate of 15 mm yr-'.
Ideally, this trench retreat velocity should be compared with present-day GPS data, but these are still lacking in this area; we thus compare our result with the geologically inferred velocity of trench retreat, a comparison that must be treated with caution because of the longer time-scale of the geological record with respect to the time window of validity of our modelling. With respect to Malinverno & Ryan (1986), who estimated a rate of trench retreat of 20 mm yr-' for the whole span of time of 20 Myr of the evolution of the Tyrrhenian Sea, our finding is 30 per cent lower, but certainly comparable with this estimate, if we take into account the large uncertainties in the geological record. The estimate by Malinverno & Ryan
Q 1996 RAS, GJI 126, 555-578
564 C . Giunchi et al.
Model SUBDU 0
100
200
- E &
f 300 B
400
500
0
100
200
- E
i 300
400
500
600 K)
Distance (km)
0 25 55 85 115 140 170 200 230 260 283 315 345 375 400 430 460 490 520 I Immmmmmmmii
MPa
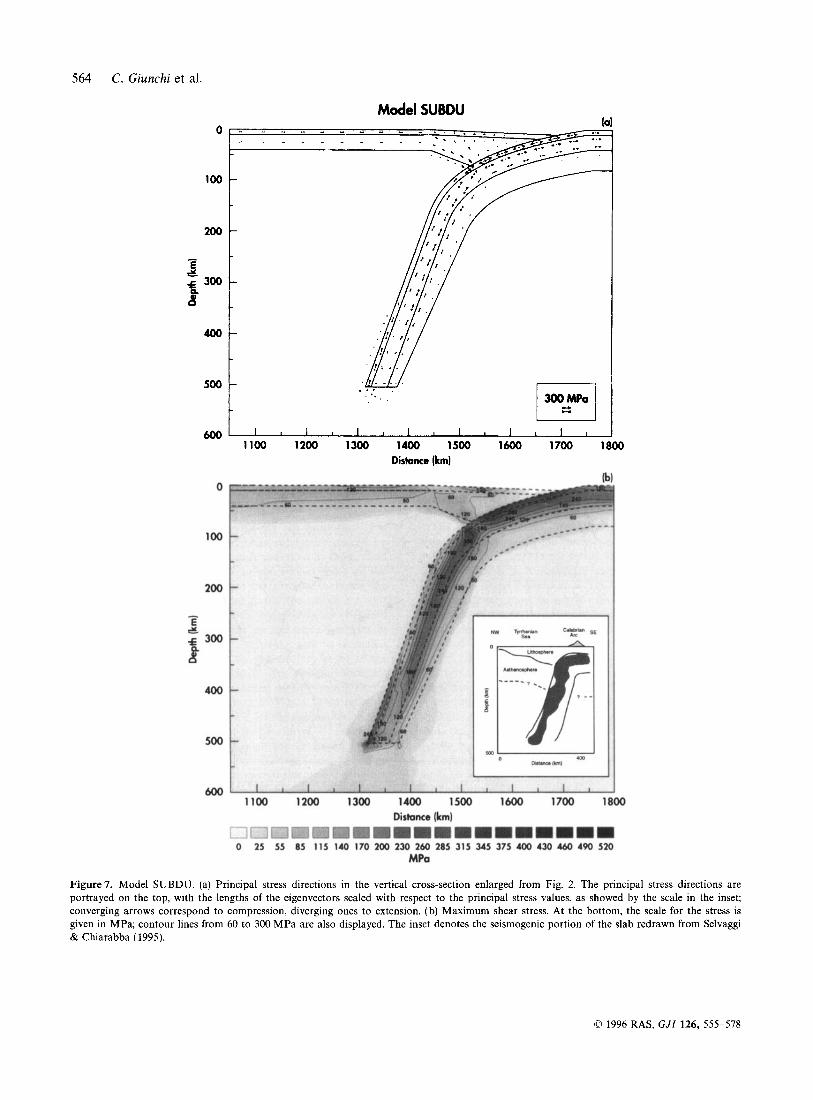
Figure7. Model SUBDU (a) Principal stress directions in the vertical cross-section enlarged from Fig 2. The pnncipal stress directions are portrayed on the top, with the lengths of the eigenvectors scaled with respect to the principal stress values, as showed by the scale in the inset, converging arrows correspond to compression, diverging ones to extension. (b) Maximum shear stress At the bottom, the scale for the stress is given in MPa, contour lines from 60 to 300 MPa are also displayed. The inset denotes the seismogenic portion of the slab redrawn from Selvaggi & Chiarabba (1995).
(0 1996 RAS, GJI 126, 555-578
Subduction models in the Tyrrhenian Sea 565
Model SUBDU-T
N .- 8 -10 I . ' ' . ~ " ~ ' " " ' ' " " " ' ' " " " " " " " ' ' ' " " ' ' ' ' " ~
0 300 600 900 1200 1500 1800 2100 2400 2700 Distance [km)
0
100
200
400
500
600 1100 1200 1300 1400 1500 1600 1700 1800
Distance (km)
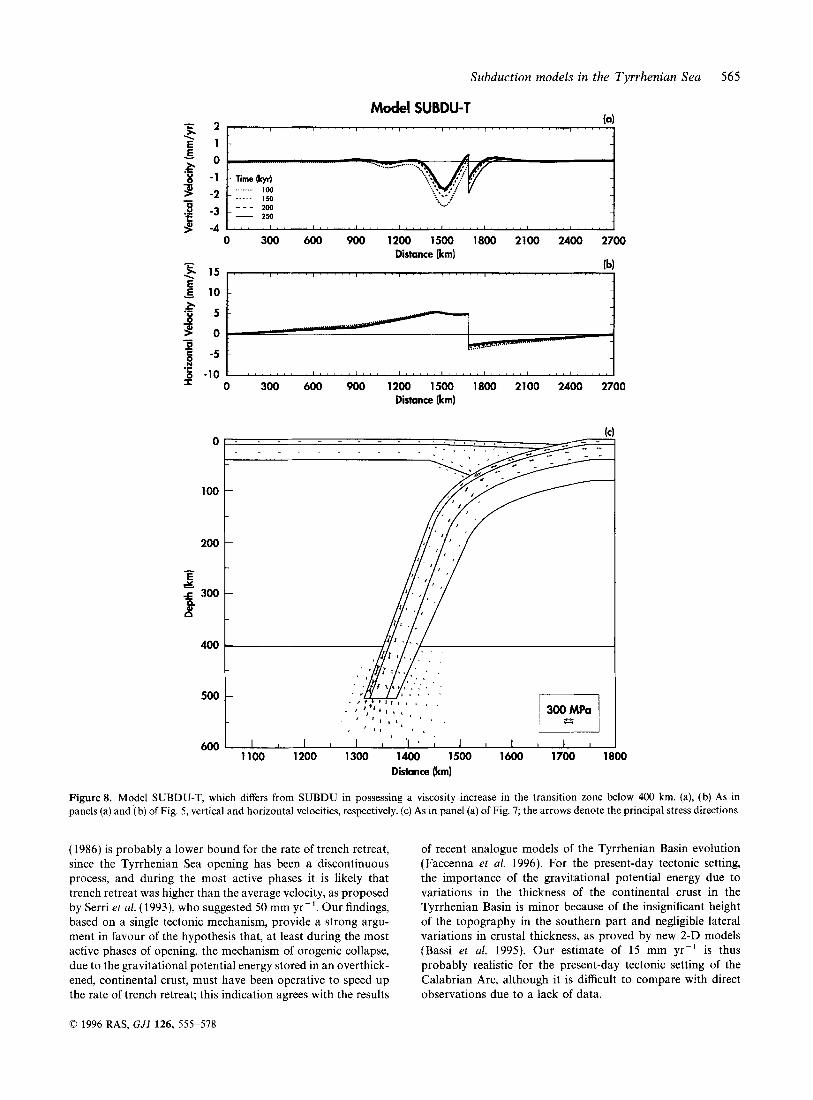
Figure 8. Model SUBDU-T, which differs from SUBDU in possessing a viscosity increase in the transition zone below 400 km. (a), (b) As in panels (a) and (b) of Fig. 5, vertical and horizontal velocities, respectively. (c) As in panel (a) of Fig. 7; the arrows denote the principal stress directions.
(1986) is probably a lower bound for the rate of trench retreat, since the Tyrrhenian Sea opening has been a discontinuous process, and during the most active phases it is likely that trench retreat was higher than the average velocity, as proposed by Serri et al. (1993), who suggested 50 mm yr-'. Our findings, based on a single tectonic mechanism, provide a strong argu- ment in favour of the hypothesis that, at least during the most active phases of opening, the mechanism of orogenic collapse, due to the gravitational potential energy stored in an overthick- ened, continental crust, must have been operative to speed up the rate of trench retreat; this indication agrees with the results
of recent analogue models of the Tyrrhenian Basin evolution (Faccenna et al. 1996). For the present-day tectonic setting, the importance of the gravitational potential energy due to variations in the thickness of the continental crust in the Tyrrhenian Basin is minor because of the insignificant height of the topography in the southern part and negligible lateral variations in crustal thickness, as proved by new 2-D models (Bassi et al. 1995). Our estimate of 15 mm yr-' is thus probably realistic for the present-day tectonic setting of the Calabrian Arc, although it is difficult to compare with direct observations due to a lack of data.
0 1996 RAS, GJI 126, 555-578
566 C. Giunchi et al.
Model SUBDL (a) 2
1 . . . . . I . . . . . I . . . . . . . . . . . . . . . . . . . . . . . . . . . . . , . . . . . ( . . . . .
...................... i s ::::I 1; ;
: , : I - , : :\t; :u; . . , i . . . . . . . . . . . . . . . . . . . . . . . . . . . . . . . . . . . . . . . . . ' ' . . . . . . . . .
0 300 600 900 1200 1500 1800 2100 2400 2700 Distance (km)
R 'E 0 -10 ~ ~ " ' ' ' " ' " ' " ' " ' " " " " " " " " " " ' " ' ' ' ' ' " ' ' ~
0 300 600 900 1200 1500 1800 2100 2400 2700 Distance (km)
0
100
200
3 f, 300 &
400
500
600
Distance (km)
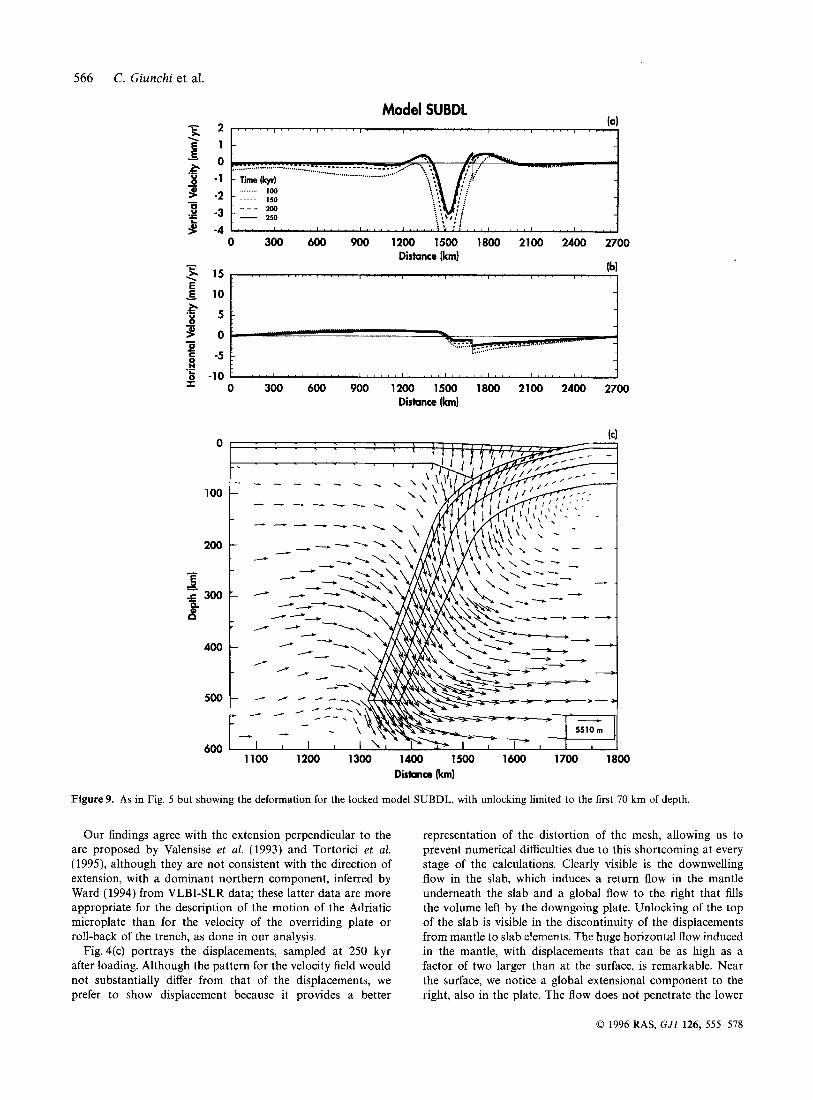
Figure 9. As in Fig. 5 but showing the deformation for the locked model SUBDL, with unlocking limited to the first 70 km of depth.
Our findings agree with the extension perpendicular to the arc proposed by Valensise et al. (1993) and Tortorici et al. (1995), although they are not consistent with the direction of extension, with a dominant northern component, inferred by Ward (1994) from VLBI-SLR data; these latter data are more appropriate for the description of the motion of the Adriatic microplate than for the velocity of the overriding plate or roll-back of the trench, as done in our analysis.
Fig. 4(c) portrays the displacements, sampled at 250 kyr after loading. Although the pattern for the velocity field would not substantially differ from that of the displacements, we prefer to show displacement because it provides a better
representation of the distortion of the mesh, allowing us to prevent numerical difficulties due to this shortcoming at every stage of the calculations. Clearly visible is the downwelling flow in the slab, which induces a return flow in the mantle underneath the slab and a global flow to the right that fills the volume left by the downgoing plate. Unlocking of the top of the slab is visible in the discontinuity of the displacements from mantle to slab elements. The huge horizontal flow induced in the mantle, with displacements that can be as high as a factor of two larger than at the surface, is remarkable. Near the surface, we notice a global extensional component to the right, also in the plate. The flow does not penetrate the lower
0 1996 RAS, GJI 126, 555-578
Subduction models in the Tyrrhenian Sea 561
0
100
200
- E
-Y f, 300 et
400
500
600
Model SUBDL la)
. - . . m 200 MPa L l
I I 1 I I I I I I I I I I I
Distance (km) 1100 1200 1300 1400 1500 1600 1700 1I
0
100
200
400
500
t 600
Distance (km)
0 25 55 05 115 140 170 200 230 260 205 315 345 375 400 430 460 490 520 t .-::El mmmmmmmmmm
MPa
Do
Do
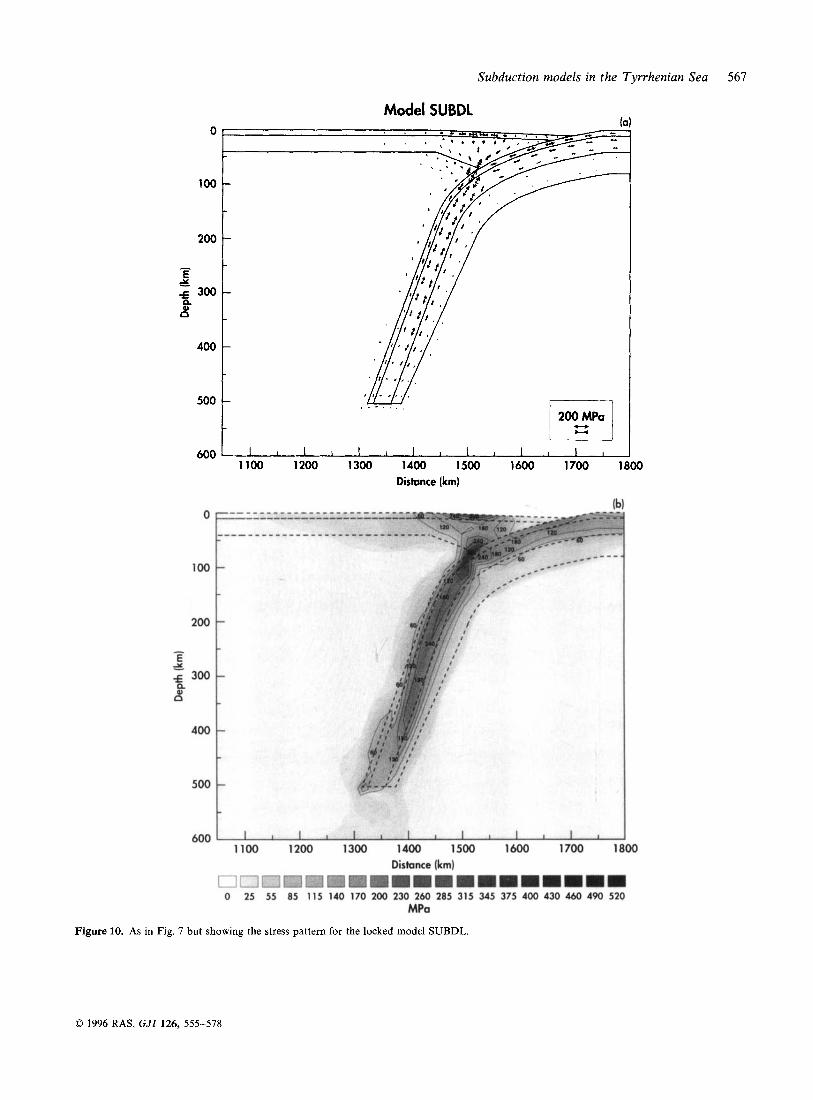
Figure 10. As in Fig. 7 but showing the stress pattern for the locked model SUBDL.
0 1996 RAS, GJI 126, 555-578
568 C. Giunrhi et al.
Model SUBDU-RVB (a)
. " " ' I ' " " I ' " " " " ' . I " ' " I " " ' I ' ' " ' I " ' " " " " . -E 2
'g - 1 - Tirnetkyr) -
0 300 600 900 1200 1500 1800 2100 2400 2700 Distance (km)
-
= o 300 600 900 1200 1500 1800 2100 2400 2700 Distance (km)
(4 0
100
200
- E Y f, 300 A
400
500
600
I
/-
L I I I I 1
1100 1200 1300 1400 1500 1600 1700 1800 Distance (km)
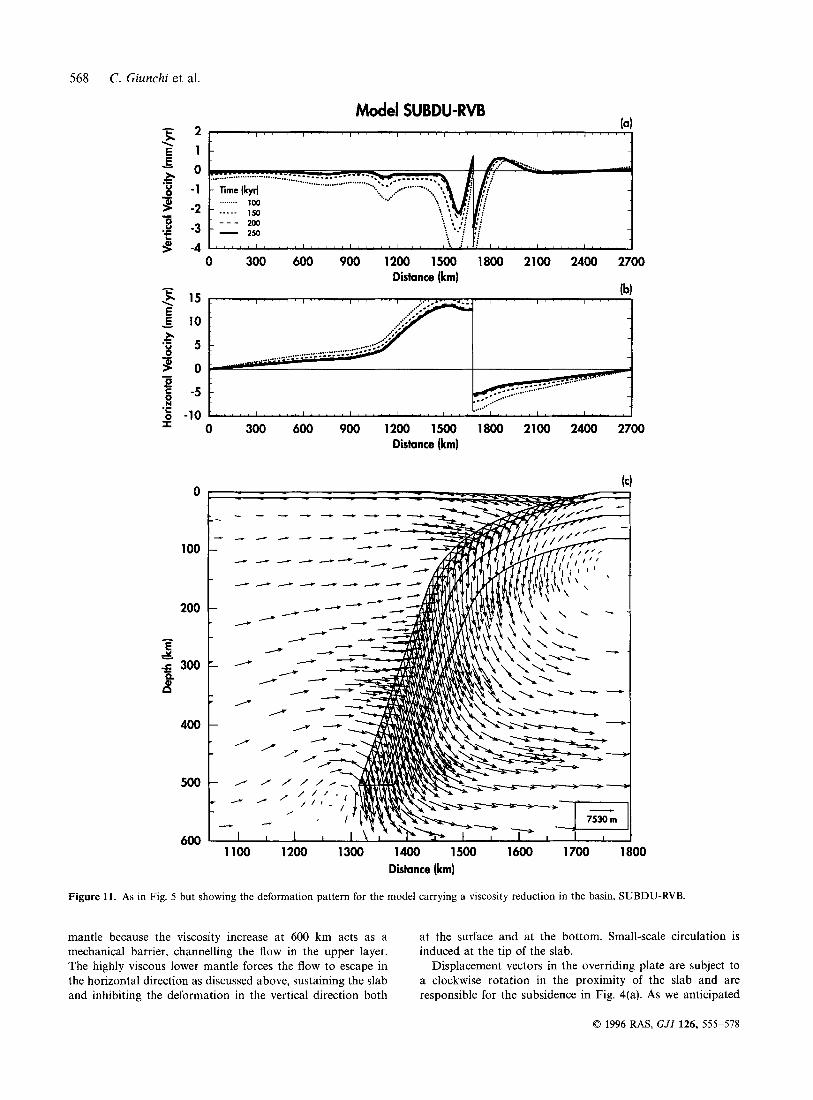
Figure 11. As in Fig. 5 but showing the deformation pattern for the model carrying a viscosity reduction in the basin, SUBDU-RVB.
mantle because the viscosity increase at 600 km acts as a mechanical barrier, channelling the flow in the upper layer. The highly viscous lower mantle forces the flow to escape in the horizontal direction as discussed above, sustaining the slab and inhibiting the deformation in the vertical direction both
at the surface and at the bottom. Small-scale circulation is induced at the tip of the slab.
Displacement vectors in the overriding plate are subject to a clockwise rotation in the proximity of the slab and are responsible for the subsidence in Fig. 4(a). As we anticipated
0 1996 RAS, GJI 126, 555-578
Subduction models in the Tyrrhenian
Model SUBDU-RVB
Sea 569
0
100
200
E r_ f, 300 8
400
500 300 MPo m
600 I I 1 1 1 1 1 1 1 1 1 1 1 1 1
1100 1200 1300 1400 1500 1600 1700 1800 Distance (km)
It 0
100
200
E r_ f, 300 8
400
500
600
0 25 55 85 115 140 170 200 230 260 285 315 345 375 400 430 460 490 520 MPa
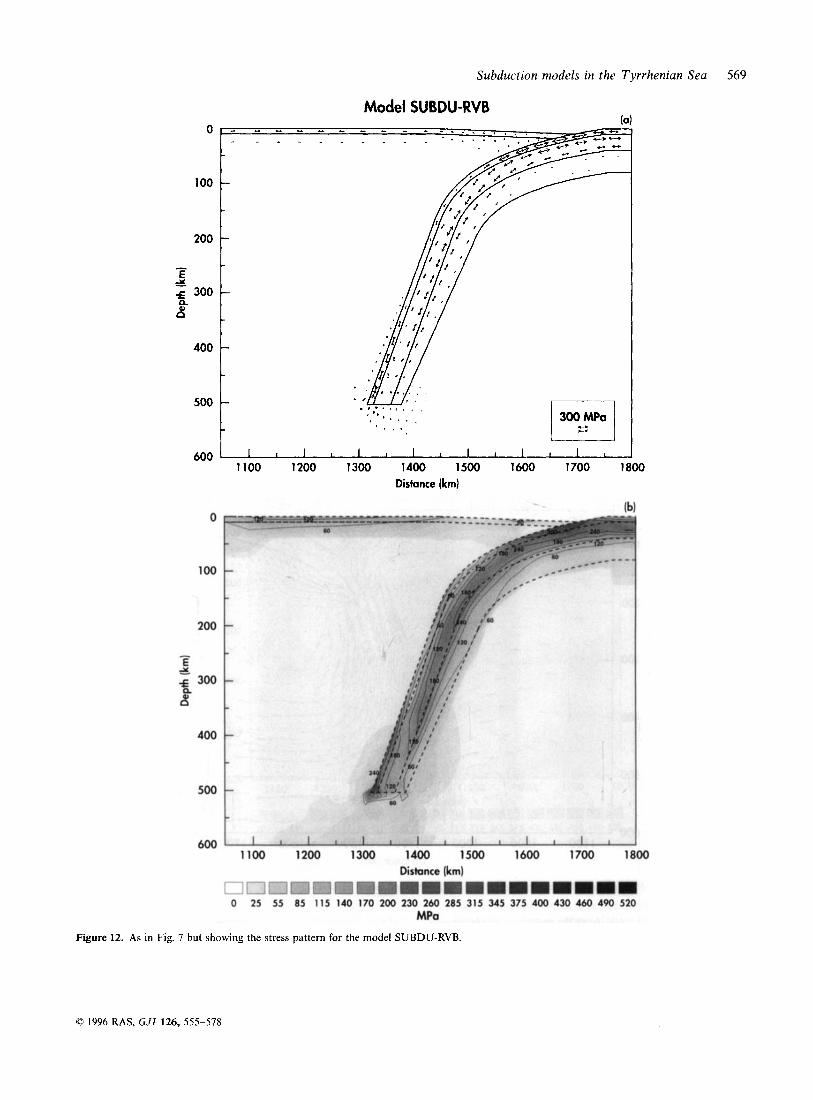
Figure 12. As in Fig. 7 but showing the stress pattern for the model SUBDU-RVB.
0 1996 RAS, G J l 126, 555-578
570 C . Giunchi et al.
Model SUBDU-D - (a) k 2 . " " " " " ' I ' ' " ' ~ ' ' " ' ~ " " ' ~ ' ' " ~ I ' ' " ' I " ' ' ' I " " ' _
\ E 1 - -
- 200 250
_ _ _ e - 3 1 -
3 -4 'f
. 1 , , , I , ' , I , ' , , I , I , , , I I , , I , , , , , ' , ' , , I ' , I ' , , , ,
0 300 600 900 1200 1500 1800 2100 2400 2700 Distance (km)
(b) - E 10
0
100
200
- E Y f, 300 A
400
500
600 1100 1200 1300 1400 1500 1600 1700 1800
Distance (km)
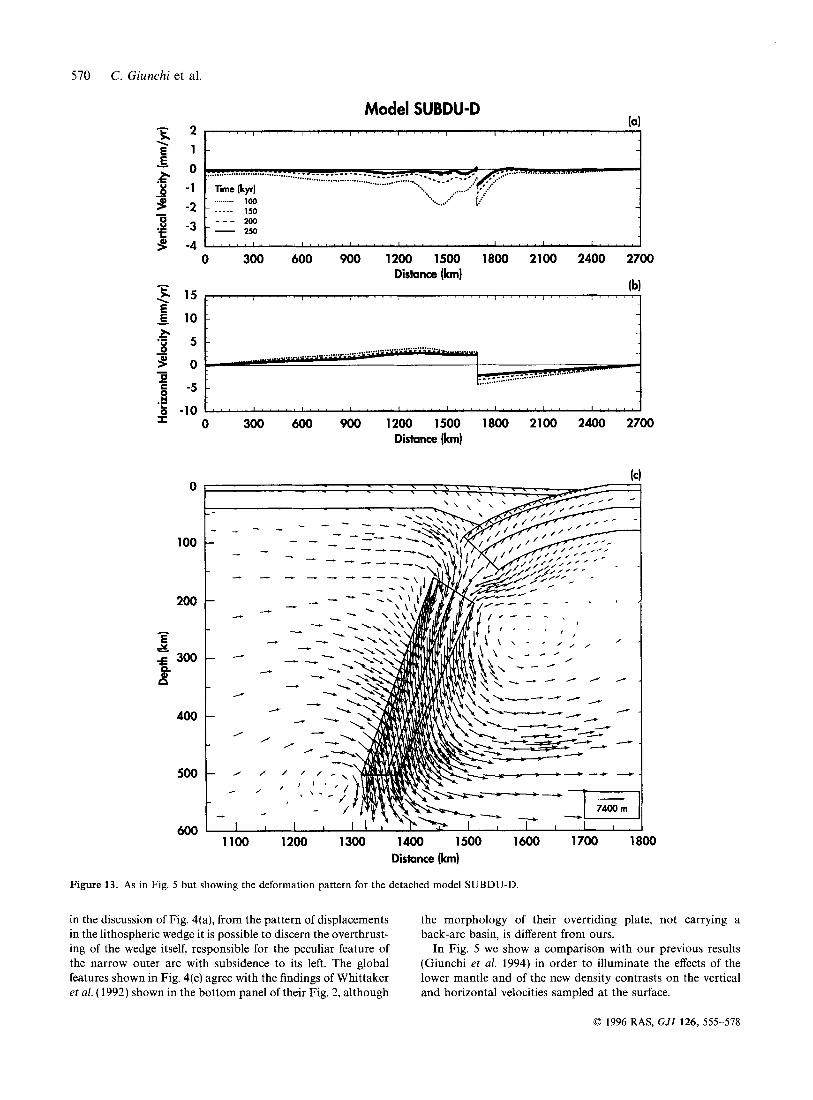
Figure 13. As in Fig. 5 but showing the deformation pattern for the detached model SUBDU-D.
in the discussion of Fig. 4(a), from the pattern of displacements in the lithospheric wedge it is possible to discern the overthrust- ing of the wedge itself, responsible for the peculiar feature of the narrow outer arc with subsidence to its left. The global features shown in Fig. 4(c) agree with the findings of Whittaker et al. (1992) shown in the bottom panel of their Fig. 2, although
the morphology of their overriding plate, not carrying a back-arc basin, is different from ours.
In Fig. 5 we show a comparison with our previous results (Giunchi et al. 1994) in order to illuminate the effects of the lower mantle and of the new density contrasts on the vertical and horizontal velocities sampled at the surface.
0 1996 RAS, GJI 126, 555-578
Subduction models in the Tyrrhenian Sea 571
0
100
200
- E ; 300 8
400
500
600
0
100
200
400
500
600
300 MPa m 1 ~ 1 ~ 1 1 1 1 1 1 1 , 1 ,
Distance (km) Ibl
Distance (km) mllimmmmuwu
0 25 55 85 115 140 170 200 230 260 285 315 345 375 400 430 460 490 520 MPa
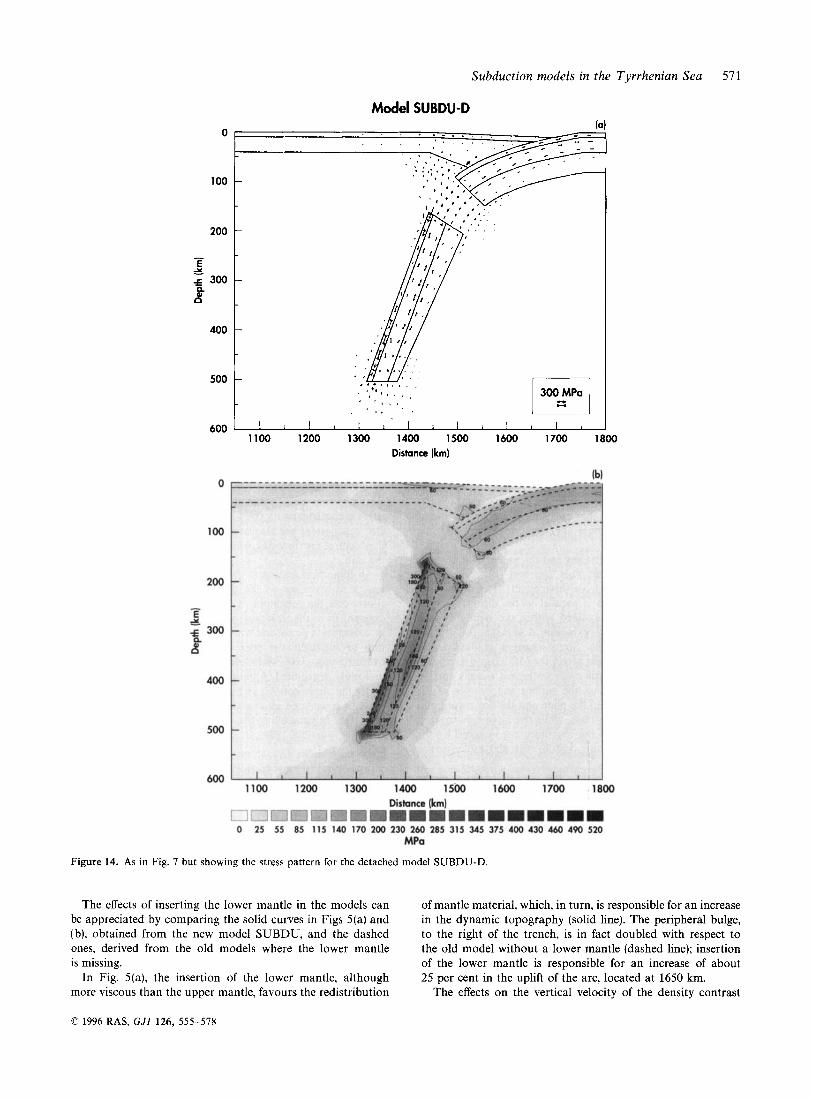
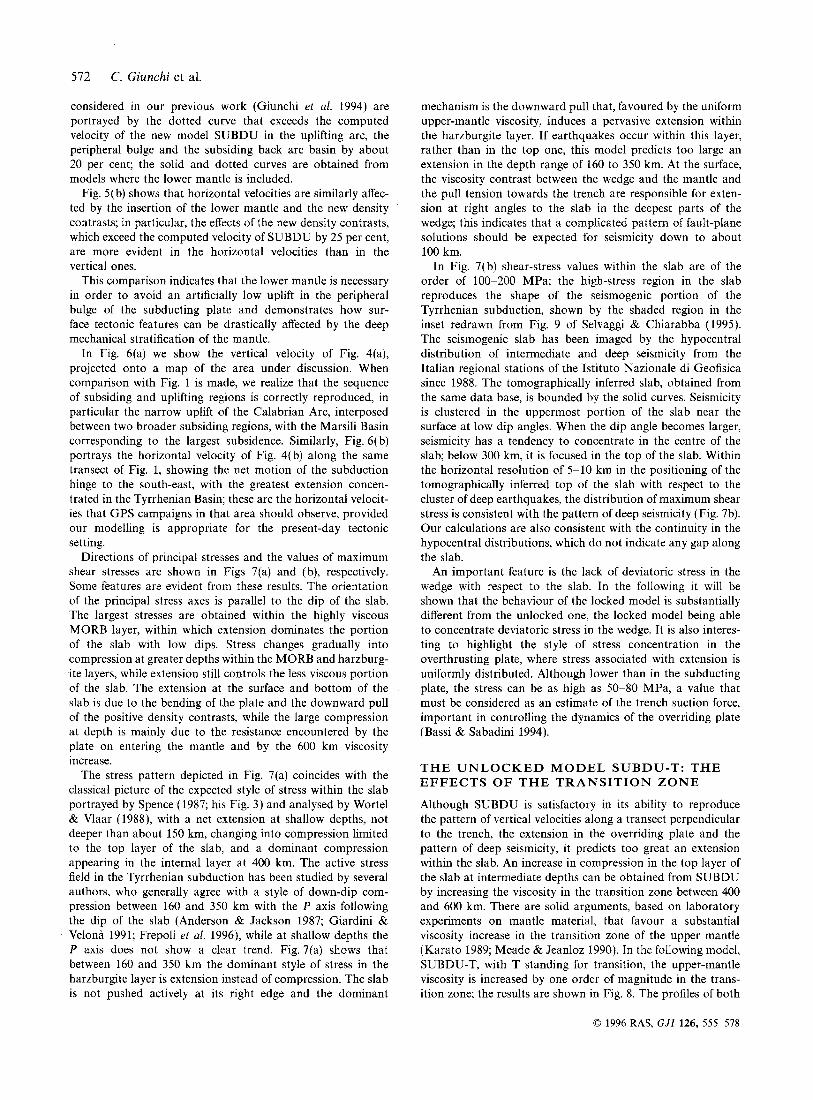
Figure 14. As in Fig. 7 but showing the stress pattern for the detached model SUBDU-D.
The effects of inserting the lower mantle in the models can be appreciated by comparing the solid curves in Figs 5(a) and (b), obtained from the new model SUBDU, and the dashed ones, derived from the old models where the lower mantle is missing.
In Fig. 5(a), the insertion of the lower mantle, although more viscous than the upper mantle, favours the redistribution
of mantle material, which, in turn, is responsible for an increase in the dynamic topography (solid line). The peripheral bulge, to the right of the trench, is in fact doubled with respect to the old model without a lower mantle (dashed line); insertion of the lower mantle is responsible for an increase of about 25 per cent in the uplift of the arc, located at 1650 km.
The effects on the vertical velocity of the density contrast
0 1996 RAS, GJI 126, 555-578
572 C. Giunchi et al.
considered in our previous work (Giunchi et al. 1994) are portrayed by the dotted curve that exceeds the computed velocity of the new model SUBDU in the uplifting arc, the peripheral bulge and the subsiding back arc basin by about 20 per cent; the solid and dotted curves are obtained from models where the lower mantle is included.
Fig. 5( b) shows that horizontal velocities are similarly affec- ted by the insertion of the lower mantle and the new density contrasts; in particular, the effects of the new density contrasts, which exceed the computed velocity of SUBDU by 25 per cent, are more evident in the horizontal velocities than in the vertical ones.
This comparison indicates that the lower mantle is necessary in order to avoid an artificially low uplift in the peripheral bulge of the subducting plate and demonstrates how sur- face tectonic features can be drastically affected by the deep mechanical stratification of the mantle.
In Fig. 6(a) we show the vertical velocity of Fig. 4(a), projected onto a map of the area under discussion. When comparison with Fig. 1 is made, we realize that the sequence of subsiding and uplifting regions is correctly reproduced, in particular the narrow uplift of the Calabrian Arc, interposed between two broader subsiding regions, with the Marsili Basin corresponding to the largest subsidence. Similarly, Fig. 6( b) portrays the horizontal velocity of Fig. 4( b) along the same transect of Fig. 1, showing the net motion of the subduction hinge to the south-east, with the greatest extension concen- trated in the Tyrrhenian Basin; these are the horizontal velocit- ies that GPS campaigns in that area should observe, provided our modelling is appropriate for the present-day tectonic setting.
Directions of principal stresses and the values of maximum shear stresses are shown in Figs 7(a) and (b), respectively. Some features are evident from these results. The orientation of the principal stress axes is parallel to the dip of the slab. The largest stresses are obtained within the highly viscous MORB layer, within which extension dominates the portion of the slab with low dips. Stress changes gradually into compression at greater depths within the MORB and harzburg- ite layers, while extension still controls the less viscous portion of the slab. The extension at the surface and bottom of the slab is due to the bending of the plate and the downward pull of the positive density contrasts, while the large compression at depth is mainly due to the resistance encountered by the plate on entering the mantle and by the 600 km viscosity increase.
The stress pattern depicted in Fig. 7(a) coincides with the classical picture of the expected style of stress within the slab portrayed by Spence (1987; his Fig. 3) and analysed by Wortel & Vlaar (1988), with a net extension at shallow depths, not deeper than about 150 km, changing into compression limited to the top layer of the slab, and a dominant compression appearing in the internal layer at 400 km. The active stress field in the Tyrrhenian subduction has been studied by several authors, who generally agree with a style of down-dip com- pression between 160 and 350 km with the P axis following the dip of the slab (Anderson & Jackson 1987; Giardini & Velona 1991; Frepoli et al. 19961, while at shallow depths the P axis does not show a clear trend. Fig.7(a) shows that between 160 and 350 km the dominant style of stress in the harzburgite layer is extension instead of compression. The slab is not pushed actively at its right edge and the dominant
mechanism is the downward pull that, favoured by the uniform upper-mantle viscosity, induces a pervasive extension within the harzburgite layer. If earthquakes occur within this layer, rather than in the top one, this model predicts too large an extension in the depth range of 160 to 350 km. At the surface, the viscosity contrast between the wedge and the mantle and the pull tension towards the trench are responsible for exten- sion at right angles to the slab in the deepest parts of the wedge; this indicates that a complicated pattern of fault-plane solutions should be expected for seismicity down to about 100 km.
In Fig. 7(b) shear-stress values within the slab are of the order of 100-200 MPa; the high-stress region in the slab reproduces the shape of the seismogenic portion of the Tyrrhenian subduction, shown by the shaded region in the inset redrawn from Fig. 9 of Selvaggi & Chiarabba (1995). The seismogenic slab has been imaged by the hypocentral distribution of intermediate and deep seismicity from the Italian regional stations of the Istituto Nazionale di Geofisica since 1988. The tomographically inferred slab, obtained from the same data base, is bounded by the solid curves. Seismicity is clustered in the uppermost portion of the slab near the surface at low dip angles. When the dip angle becomes larger, seismicity has a tendency to concentrate in the centre of the slab; below 300 km, it is focused in the top of the slab. Within the horizontal resolution of 5-10 kin in the positioning of the tomographically inferred top of the slab with respect to the cluster of deep earthquakes, the distribution of maximum shear stress is consistent with the pattern of deep seismicity (Fig. 7b). Our calculations are also consistent with the continuity in the hypocentral distributions, which do not indicate any gap along the slab.
An important feature is the lack of deviatoric stress in the wedge with respect to the slab. In the following it will be shown that the behaviour of the locked model is substantially different from the unlocked one, the locked model being able to concentrate deviatoric stress in the wedge. It is also interes- ting to highlight the style of stress concentration in the overthrusting plate, where stress associated with extension is uniformly distributed. Although lower than in the subducting plate, the stress can be as high as 50-80 MPa, a value that must be considered as an estimate of the trench suction force, important in controlling the dynamics of the overriding plate (Bassi & Sabadini 1994).
THE UNLOCKED MODEL SUBDU-T: THE EFFECTS OF THE TRANSITION ZONE
Although SUBDU is satisfactory in its ability to reproduce the pattern of vertical velocities along a transect perpendicular to the trench, the extension in the overriding plate and the pattern of deep seismicity, it predicts too great an extension within the slab. An increase in compression in the top layer of the slab at intermediate depths can be obtained from SUBDU by increasing the viscosity in the transition zone between 400 and 600 km. There are solid arguments, based on laboratory experiments on mantle material, that favour a substantial viscosity increase in the transition zone of the upper mantle (Karat0 1989; Meade & Jeanloz 1990). In the following model, SUBDU-T, with T standing for transition, the upper-mantle viscosity is increased by one order of magnitude in the trans- ition zone; the results are shown in Fig. 8. The profiles of both
0 1996 RAS, GJI 126, 555-578
Subduction models in the Tyrrhenian Sea 573
vertical and horizontal velocities at the surface present the same features as Fig. 4, except for the reduced amplitudes in the vertical and horizontal velocities. In the back-arc basin the subsidence is reduced to 1.5 mm yr-', while in the trench subsidence is now 1 mm yr-'; the uplift is reduced to 0.5 mm yr-'. Roll-back velocity decreases to 8 mm yr-l in Fig. 8( b). The most interesting result is the modification in the style of stress within the slab, where extension between 160 and 350 km is drastically reduced in the innermost layer and, with respect to Fig. 7(a), compression appears at shallower depths, between 150 and 350 km in the top of the slab. Near the transition and below 400 km, compression also becomes dominant in the harzburgite layer. At shallow depths the style of stress is identical to that predicted by SUBDU. The main conclusion that we can draw from this calculation is that in a tectonic configuration characterized solely by slab pull, without active convergence between the subducting and overriding plates, it is necessary to include a conspicuous viscosity increase in the transition zone of the upper mantle in order to favour compression in the slab.
The seismologically inferred depth of the transition between the extensional and compressional styles in the Tyrrhenian slab, which gives the location of the neutral down-dip stress zone (NDSZ), is certainly shallow but not anomalous when comparison is made with other subduction zones (hacks & Molnar 1971). Shallow NDSZs are also found along some sections of the NW Pacific and Tonga-Kermadec trenches, indicative of important 3-D effects along the trench regions (Zhou 1990). Our 2-D calculations of the stress pattern must thus be considered as broadly indicative of the state of stress within the slab, as the effects of three-dimensionality, ani- sotropy, detailed rheological variations and phase changes that are not considered in our modelling could affect our estimates of the stress style, at least locally. The stress distribution in the intermediate depth range down to 300 km is, on the other hand, the most difficult to interpret in comparison with the dominant compression below 400 km (Wortel & Vlaar 1988).
THE LOCKED MODEL SUBDL
In order to show that only the unlocked models have the ability to reproduce the pervasive extension within the overrid- ing plate, the roll-back of the trench, the vertical motions in the subduction zone and the pattern of deep seismicity in the southern Tyrrhenian Sea, we show for comparison the locked model SUBDL, where L stands for locked subduction fault; this model is also useful in highlighting the modifications that we must expect in the geological record and the pattern of deep seismicity because of changes in tectonic style from alternating locked and unlocked subduction faults, correspond- ing to negligible or conspicuous roll-back of the trench, respectively.
In Figs 9 and 10, all the parameters remain the same as in Figs 4-7, but the subduction fault is limited to the first 70 km, corresponding to the contact region between the lithospheric wedge and the slab (Furukawa 1993). When compared with Fig. 4(a), the main result of Fig. 9(a) for the vertical velocity is the substantial reduction of the spike at 1650 km; further, the subsiding region corresponding to the trench in Fig. 4(a) almost disappears, the subsidence in the back-arc is increased to 3 mm yr-' and the uplifting outer bulge of the subducting plate is displaced to the left by 100 km. In the vertical velocity
we still recognize, in the small amplitude discontinuity at 1650 km, the effects of the fault. This model fails to reproduce the alternating sequence of subsidence and uplift along the transect of Fig. 1 and is rather symmetric, with two uplifting bulges flanking the subsiding region. This finding suggests that, for the southern Tyrrhenian Basin, only the unlocked model, on the Myr time-scale, reproduces the rates of vertical deformation along the transect of Fig. 1; the locked model SUBDL predicts too large a subsidence in the basin, insignifi- cant uplift of Calabria and subsidence in the trench, accompanied by an excessive bulge in the Ionian Sea. Comparison between the findings from SUBDU and SUBDL clearly indicates that variations in the tectonic style from an unlocked to a locked subduction fault occur on the time-scale of 100 kyr and drastically modify both the extensional regime and the vertical velocities in the back-arc basin. Variations with time of subsidence velocities in the basin and of uplift in the arc thus provide the constraints to detail the changes in tectonic style of subduction (Argnani 1993).
Our results suggest, as a working hypothesis, that the Pleistocene uplift of the Calabrian Arc (Westaway 1993) could be attributed to the change in tectonic style, from a locked into an unlocked subduction fault, accompanied by an increase in the uplift velocity, as suggested by Figs 9(a) and 4(a). A more precise numerical modelling of the sequence of tectonic phases is beyond the scope of present-day analysis.
Horizontal velocities are also substantially affected by the coupling between the mantle and the top of the slab; in Fig. 9(b) horizontal velocities are reduced to at most a few millimetres, with roll-back of 1.5 mm yr -I, essentially negligible in comparison with the result of model SUBDU. A locked model can hardly explain the large extension in the southern Tyrrhenian Sea; the findings from both vertical and horizontal velocities combine to support the conclusion that only the family of unlocked models is consistent with the geological record.
A large 2-D picture of the deformation style is portrayed by Fig. 9(c), which can be compared with SUBDU results in Fig. 4(c). In contrast to Fig. 4(c), the overriding lithosphere is basically unaffected by extension; below 200 km, the pattern of deformation is quite similar to that of Fig. 4(c), indicating that at these depths both unlocked and locked models predict a similar flow pattern. Again, unlike Fig. 4(c), the strong coupling between the plate and the overlying mantle causes the lithospheric wedge to be dragged down by the subducting slab, prohibiting roll-back; points on the overriding plate, near the contact with the subducting plate, move horizontally in the opposite direction with respect to the same points in the unlocked models.
The counterparts of Figs 7(a) and (b) are shown in Figs 10(a) and (b); the largest modification, with respect to SUBDU, is the reduction of extension in the basin, the increase of com- pression in the lithospheric wedge, accompanied by the focus- ing of the maximum shear stress at the lower edge of the fault, and a global reduction of deviatoric stress within the slab (Fig. lob). The large deviatoric stresses in the lithospheric wedge are dominantly extensional, with horizontal com- pression only in the uppermost layer where the basin is bent downwards.
In contrast to Fig. 7(a), extension in the deepest portion of the wedge is parallel to the subducting plate, suggesting that fault-plane solutions in this region can provide an important
0 1996 RAS, GJI 126, 555-578
574 C. Giunchi et al.
set of data for discriminating between different styles of subduc- tion, with unlocked or locked subduction faults. It is remark- able that SUBDL predicts a large extension within the slab in comparison with the unlocked model SUBDU, as shown in Figs 7(a) and 10(a); this finding provides another argument in favour of unlocked models in the southern Tyrrhenian Sea, where compression rather than extension is indicated by deep seismicity.
Fig. 10( b) shows the deviatoric stress, for the same param- eters as in Fig. 10(a). The stress intensity scale on the bottom is the same as in Fig. 7(b), which makes it possible to compare the deviatoric stress patterns between the two models SUBDU and SUBDL. The most noticeable difference is the reduction of the stress in the deepest part of the slab and its increase within the lithospheric wedge, as already observed in Fig. 10(a). This locked model predicts that a certain amount of deviatoric stress is also stored in the mantle. In the wedge, deviatoric stress can be as high as 200 MPa, larger than the amount of stress stored within the slab below 300 km. Although our study focuses on the southern Tyrrhenian Basin, we can nevertheless draw a comparison between our results and the pattern of the intermediate seismicity along a transect perpen- dicular to the Northern Apennines (see inset, Fig. 1) . The pattern of diffuse stress within the wedge, as shown in Fig. 10(b), agrees with the seismicity recorded beneath the Northern Apennines, at depths not exceeding 90-100 km (Selvaggi & Amato 1992). If we add this observation to recent findings based on seismic tomography, which indicate a cold body underneath the Northern Apennines (Wortel & Spakman 1992; Amato et al. 1993), our results suggest that a type of subduction process is also operative beneath the Apennines, although of a different style to the Calabrian subduction, The differences in the stress patterns for the unlocked and locked models provide a possible explanation for the two different styles of seismicity underneath peninsular Italy: a different coupling between the mantle and the top of the subducted lithosphere modifies the depth of clustering of deviatoric stress, with the unlocked fault (SUBDU) responsible for seismicity at large depths underneath Calabria, and the locked model (SUBDL) focusing the stress at depths not exceeding 70-100 km in a region of triangular shape, as observed in the Northern Apennines. This hypothesis, based on the pattern of deep seismicity, is also supported by the different horizontal velocities and extensions predicted by the locked and unlocked models, with smaller values for the family of locked models, consistent with geological and petrological estimates that indicate a reduction of at least a factor of four in the velocity of trench retreat from the Calabrian Arc to northern Italy (Serri et al. 1993).
Although the locked model can explain the pattern of seismicity to depths of 90 km underneath the Northern Apennines, it fails to reproduce the present-day extension and uplift of the chain, deduced from borehole breakout units and focal-mechanism data (Amato, Montone & Cesaro 1995). Models of subduction in the Northern Apennines will be presented in future work, to account for the different depths and mechanical characteristics of the two subducting plates in southern and northern Italy. The present analysis will help us to understand the effects of subduction of oceanic lithosphere in comparison with other alternative hypotheses for the Northern Apennines, such as delamination and subduction of continental lithosphere, as suggested by Serri et al. ( 1993) on
the basis of the magmatism in the Northern Apennines that occurred in the last 15 Myr in an intracontinental setting.
THE MODEL SUBDU-RVB: R E D U C E D VISCOSITY I N THE BASIN
The high heat flow in the Tyrrhenian Basin (Mongelli et al. 1991) suggests that we must conidex the possibikty of a substantial reduction in the lithospheric viscosity within the basin with respect to previous models.
The following calculations pertain to a version of the unlocked model SUBDU containing a reduced viscosity in the basin (RVB). With respect to SUBDU we have reduced both the crustal and lithospheric viscosities in the basin, where the thicknesses of the crust and lithosphere are thinner than in the standard lithosphere (see Fig. 4). The viscosities of the crust and lithosphere are now 5 x 10" Pa s and 1021 Pa s, respect- ively. Figs 11 (a) and (b) must be compared with Figs 4(a) and (b). The most noticeable features in Fig. 11 are that, with respect to SUBDU, the back-arc basin and the trench become narrower and are displaced towards the arc while the subsid- ence rate is increased in the trench to 2.5 mm yr-' and reduced in the basin to 2 mm yr-l. Another remarkable difference with respect to SUBDU is the increased rate of uplift of the peripheral bulge, which varies from 0.5 mm yr-' in SUBDU to 0.75 mm yr-' in SUBDU-RVB. The viscosity reduction also has a major impact on the extension rates, clearly shown in Fig. l l (b ) . Roll-back is now increased, with respect to Fig. 10(b), from 15 mm yr-' to 20 mm yr-', with the largest extension concentrated in the basin from 1200 to 1700 km. Both vertical and horizontal velocities are quite sensitive to viscosity variations in the back-arc basin; further viscosity reduction in the basin does not change our estimate of roll- back.
The flow pattern portrayed at the bottom of Fig. l l (c ) has the same characteristics as in Fig. 4(c), indicating that viscosity variations in the basin do not affect the global circulation in the mantle. The large extension at the left, at all depths, due to the unlocked subduction fault, is remarkable; this global motion to the right controls the extension in the basin, which is particularly important in this model with respect to Fig. 4(c).
Comparison of Figs 7(a) and 12(a) indicates that viscosity reduction in the wedge is accompanied by a corresponding reduction in the stress, suggesting that rheological contrasts in this region affect the distribution of seismicity. In agreement with the computed horizontal velocity, the stress pattern also indicates that extension is concentrated in the basin. Within the slab, the stress pattern exhibits the same style as SUBDU, confirming that the global deformation, as already observed in the previous figure, is not affected by the rheology of the lithosphere within the basin. A similar conclusion is valid for the deviatoric stress, which is drastically reduced in the basin in comparison with Fig. 7( b). The stress stored in the slab has the same characteristics as SUBDU; viscosity reduction in the back-arc basin does not modify our conclusions about the agreement of the class of unlocked models with the hypocentral distribution of deep earthquakes.
A more detailed comparison of model results with data is not repeated here, since the conclusions are essentially the same as we have drawn for SUBDU. The only difference is the increase of roll-back velocity for SUBDU-RVB by about 30 per cent, which makes this model the favourite one to
10 1996 RAS, G J I 126, 555-578
Subduction models in the Tyrrhenian Sea 515
reproduce the extension in the basin if comparison is made with Malinverno & Ryan (1986). On the other hand, SUBDU is more appropriate to reproduce the 1 kO.1 mm yr-' of uplift of the Calabrian Arc, in comparison with the 0.75 mm yr-' of SUBDU-RVB.
THE MODEL S U B D U - D : A D E T A C H E D L I T H O S P H E R I C SLAB
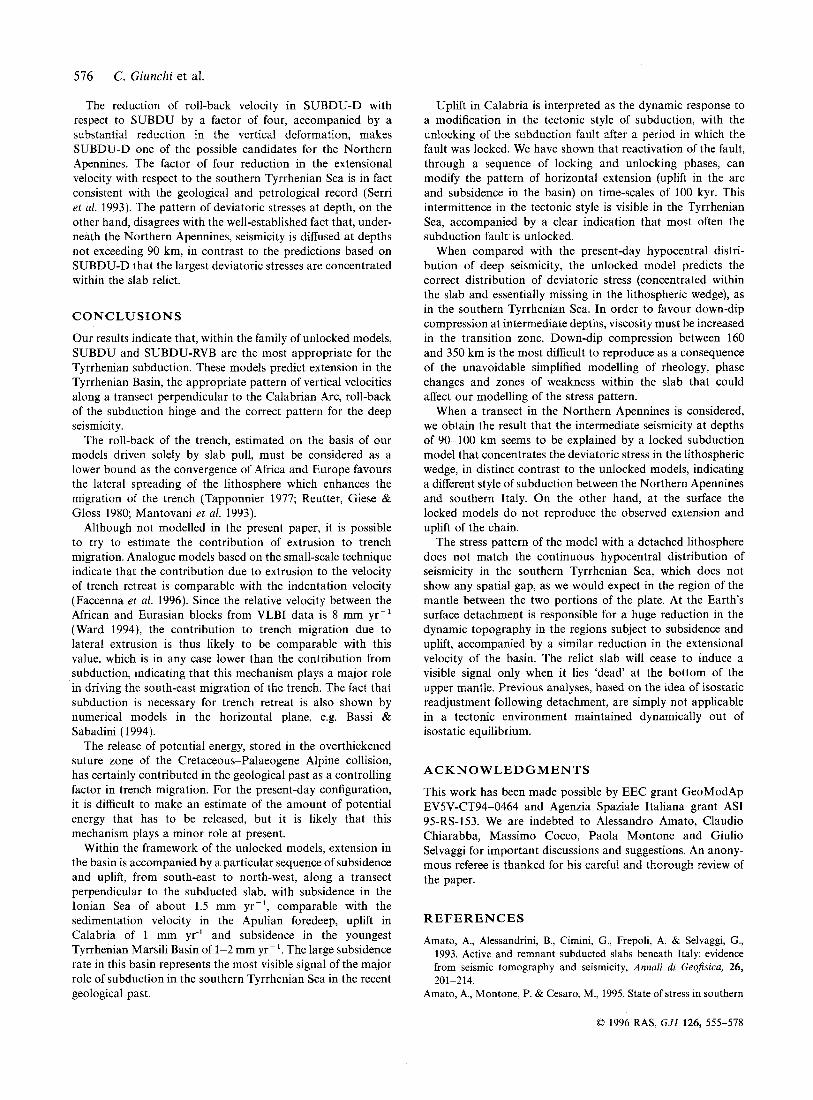
Model SUBDU-D deals with the deformation and stress styles of a detached subducting lithosphere (Figs 13 and 14). The possibility that the subducting lithosphere is detached has been proposed in the literature as a possible explanation for the uplift of Calabria (Westaway 1993). Model SUBDU-D is like SUBDU, except that the piece of slab between 90 and 160 km has been removed and changed into mantle material, as portrayed in Fig, 13(c). In the horizontal direction there is no density and rheology contrast between 90 and 160 km and the density and viscosity are those of the reference mantle, with the deep portion of the slab detached from its shallow part.
Predictions derived from this detached model are correct, and comparable with the present-day tectonic configuration, provided the time elapsed since the onset of detachment is longer than the characteristic time-scale of 100 kyr required by the model to erase the memory of its initial state. For a detachment of 70 km, as considered here, and a sinking rate of the relict slab of about 1 cm yr-', as expected on the basis of Fig. 13(b), this time span is 7 Myr, which certainly satisfies our requirements. In this case, the large bending stresses that are stored in the shallow portion of the slab, as shown in Fig. 7(b) for the undetached model SUBDU, are released, as correctly predicted by SUBDU-D. It would be incorrect to make predictions on the basis of SUBDU-D if the time since detachment occurred is comparable to, or shorter than, the characteristic relaxation time of the model.
When comparison is made with Figs 5(a) and (b), we notice that the profiles of both vertical and horizontal velocities for this detached model maintain the same general characteristic features of SUBDU, except that the velocities recorded at the surface, both vertical and horizontal, are substantially reduced. The largest rate of uplift near the discontinuity is reduced to 0.2 mm yr-', while the subsidence in the trench is diminished to 0.75 mm yr-', and lowering in the back-arc region is almost annihilated.
Comparison with the vertical velocities along the transect of Fig. 1 indicates that detachment, instead of increasing the uplift of the Calabrian Arc, as suggested by Westaway (1993), is responsible for a reduction in the uplift rate. An explanation for this behaviour is that the topography at the Earth's surface is dynamic, as clearly indicated by Fig. 13(c), which shows how the surface vertical velocity is maintained by the internal flow driven by the sinking slab. Detachment is responsible for a reduction of slab pull and, consequently, for a reduction of the topography and rates of vertical deformation. The argu- ment of Westaway (1993) neglects the dynamic effects on the surface topography due to the relict slab, being based solely on the estimate of the effects on the isostatic disequilibrium in SUBDU-D, which contains lower densities than SUBDU at the same depth interval. The problem with such an analysis is that it is not possible to apply the concept of isostatic compensation in an environment that is by its own nature always maintained out of isostatic equilibrium by the dynamic
flow in the mantle. Our approach accounts for the reduction in the density within the slab and, at the same time, accounts in a self-consistent manner for the dynamic effects of the flow. The downward-pull force of the SUBDU-D model, although reduced with respect to SUBDU, is responsible for the dynamic topography induced at the surface. Our findings demonstrate that a relict slab induces visible signatures at the surface, unless it has penetrated deeply into the upper mantle, close to the upper-lower mantle interface.
Roll-back is now 5 mm yr-', a factor of three lower than in SUBDU. Comparison of Figs 13(c) and 4(c) confirms that the global flow patterns induced by the continuous and detached lithosphere are essentially the same. The major differences are the larger vertical motions at great depths and the reduced extension in the overriding plate for the detached model. A striking feature is the suction effect induced by the detached slab (Fig. 13c) that is literally dragging the mantle behind the subducting slab.
The largest differences between the continuous and detached models occur in the stress patterns, shown in Fig. 14. In Fig. 14(a), extension is reduced everywhere, with respect to Fig. 7(a), both at intermediate and shallow depths within the slab. There is a slight increase in the extension at the rheological contrast between the detached lithosphere within the MORB and the mantle. In comparison with SUBDU, we notice an increase in extension in the top layer of the slab at intermediate depths, accompanied by an increase in compression at the bottom. Extension is also drastically reduced within the sub- horizontal portion of the slab. Some amount of stress is stored in the mantle surrounding the detached slab. Particular atten- tion must be devoted to the continuity of the stress field between the two pieces of slab and the interposed mantle. It is noteworthy that the principal stress directions follow the dip of the slab, even within the gap. It is the continuity of the stress components in the gap, and the fact that the mantle is sufficiently viscous, that is responsible for the downpulling force exerted by the relict slab on the surface remnant of the lithosphere, and, ultimately, for the dynamic topography that we observe at the surface.
The reduction in the amount of stress stored in the litho- sphere is better portrayed by Fig. 14(b), which shows large differences with respect to Fig. 7(b). The rheological gap between the detached slab and the shallow remnant of the lithosphere does not contain any significant amount of devi- atoric stress, with minor concentrations near the viscosity contrasts between the mantle and the stiffer lithospheric por- tions. In the shallow portion of the slab, deviatoric stress is substantially reduced with respect to SUBDU. Detachment maintains the same characteristics, already observed for the SUBDU model, of a negligible storage of stress within the lithospheric wedge. Deviatoric stresses of the order of 200-300 MPa are concentrated in the deepest portion of the slab due to the larger amount of compression suffered by the relict slab near the 600 km viscosity increase. If we compare the pattern of deviatoric stresses of SUBDU and SUBDU-D with the observed continuous distribution of seismicity (Fig. 7b), our preferred model for the subduction in the Tyrrhenian Basin is the continuous one that reproduces the most noticeable feature of the real distribution of seismicity within the slab, which is its continuity. SUBDU-D fails in the shallow portion of the plate, where deviatoric stress is essen- tially missing.
0 1996 RAS, GJI 126, 555-578
576 C. Giunchi et al.
The reduction of roll-back velocity in SUBDU-D with respect to SUBDU by a factor of four, accompanied by a substantial reduction in the vertical deformation, makes SUBDU-D one of the possible candidates for the Northern Apennines. The factor of four reduction in the extensional velocity with respect to the southern Tyrrhenian Sea is in fact consistent with the geological and petrological record (Serri et al. 1993). The pattern of deviatoric stresses at depth, on the other hand, disagrees with the well-established fact that, under- neath the Northern Apennines, seismicity is diffused at depths not exceeding 90 km, in contrast to the predictions based on SUBDU-D that the largest deviatoric stresses are concentrated within the slab relict.
CONCLUSIONS
Our results indicate that, within the family of unlocked models, SUBDU and SUBDU-RVB are the most appropriate for the Tyrrhenian subduction. These models predict extension in the Tyrrhenian Basin, the appropriate pattern of vertical velocities along a transect perpendicular to the Calabrian Arc, roll-back of the subduction hinge and the correct pattern for the deep seismicity.
The roll-back of the trench, estimated on the basis of our models driven solely by slab pull, must be considered as a lower bound as the convergence of Africa and Europe favours the lateral spreading of the lithosphere which enhances the migration of the trench (Tapponnier 1977; Reutter, Giese & Gloss 1980; Mantovani et nl. 1993).
Although not modelled in the present paper, it is possible to try to estimate the contribution of extrusion to trench migration. Analogue models based on the small-scale technique indicate that the contribution due to extrusion to the velocity of trench retreat is comparable with the indentation velocity (Faccenna et a/. 1996). Since the relative velocity between the African and Eurasian blocks from VLBI data is 8 mm yr-' (Ward 1994), the contribution to trench migration due to lateral extrusion is thus likely to be comparable with this value, which is in any case lower than the contribution from subduction, indicating that this mechanism plays a major role in driving the south-east migration of the trench. The fact that subduction is necessary for trench retreat is also shown by numerical models in the horizontal plane, e.g. Bassi & Sabadini (1994).
The release of potential energy, stored in the overthickened suture zone of the Cretaceous-Palaeogene Alpine collision, has certainly contributed in the geological past as a controlling factor in trench migration. For the present-day configuration, it is difficult to make an estimate of the amount of potential energy that has to be released, but it is likely that this mechanism plays a minor role at present.
Within the framework of the unlocked models, extension in the basin is accompanied by a particular sequence of subsidence and uplift, from south-east to north-west, along a transect perpendicular to the subducted slab, with subsidence in the Ionian Sea of about 1.5 mm yr-', comparable with the sedimentation velocity in the Apulian foredeep, uplift in Calabria of 1 mm yr-' and subsidence in the youngest Tyrrhenian Marsili Basin of 1-2 mm yr ~ '. The large subsidence rate in this basin represents the most visible signal of the major role of subduction in the southern Tyrrhenian Sea in the recent geological past.
Uplift in Calabria is interpreted as the dynamic response to a modification in the tectonic style of subduction, with the unlocking of the subduction fault after a period in which the fault was locked. We have shown that reactivation of the fault, through a sequence of locking and unlocking phases, can modify the pattern of horizontal extension (uplift in the arc and subsidence in the basin) on time-scales of 100 kyr. This intermittence in the tectonic style is visible in the Tyrrhenian Sea, accompanied by a clear indication that most often the subduction fault is unlocked.
When compared with the present-day hypocentral distri- bution of deep seismicity, the unlocked model predicts the correct distribution of deviatoric stress (concentrated within the slab and essentially missing in the lithospheric wedge), as in the southern Tyrrhenian Sea. In order to favour down-dip compression at intermediate depths, viscosity must be increased in the transition zone. Down-dip compression between 160 and 350 km is the most difficult to reproduce as a consequence of the unavoidable simplified modelling of rheology, phase changes and zones of weakness within the slab that could affect our modelling of the stress pattern.
When a transect in the Northern Apennines is considered, we obtain the result that the intermediate seismicity at depths of 90-100 km seems to be explained by a locked subduction model that concentrates the deviatoric stress in the lithospheric wedge, in distinct contrast to the unlocked models, indicating a different style of subduction between the Northern Apennines and southern Italy. On the other hand, at the surface the locked models do not reproduce the observed extension and uplift of the chain.
The stress pattern of the model with a detached lithosphere does not match the continuous hypocentral distribution of seismicity in the southern Tyrrhenian Sea, which does not show any spatial gap, as we would expect in the region of the mantle between the two portions of the plate. At the Earth's surface detachment is responsible for a huge reduction in the dynamic topography in the regions subject to subsidence and uplift, accompanied by a similar reduction in the extensional velocity of the basin. The relict slab will cease to induce a visible signal only when it lies 'dead' at the bottom of the upper mantle. Previous analyses, based on the idea of isostatic readjustment following detachment, are simply not applicable in a tectonic environment maintained dynamically out of isostatic equilibrium.
ACKNOWLEDGMENTS
This work has been made possible by EEC grant GeoModAp EV5V-CT94-0464 and Agenzia Spaziale Italiana grant AS1 95-RS-153. We are indebted to Alessandro Amato, Claudio Chiarabba, Massimo Cocco, Paola Montone and Giulio Selvaggi for important discussions and suggestions. An anony- mous referee is thanked for his careful and thorough review of the paper.
REFERENCES
Amato, A,, Alessandrini, B., Cimini, G., Frepoli, A. & Selvaggi, G., 1993. Active and remnant subducted slabs beneath Italy: evidence from seismic tomography and seismicity, Annuli di Geofisicu, 26,
Amato, A., Montone, P. & Cesaro, M., 1995. State of stress in southern 201-214.
0 1996 RAS, GJI 126, 555-578
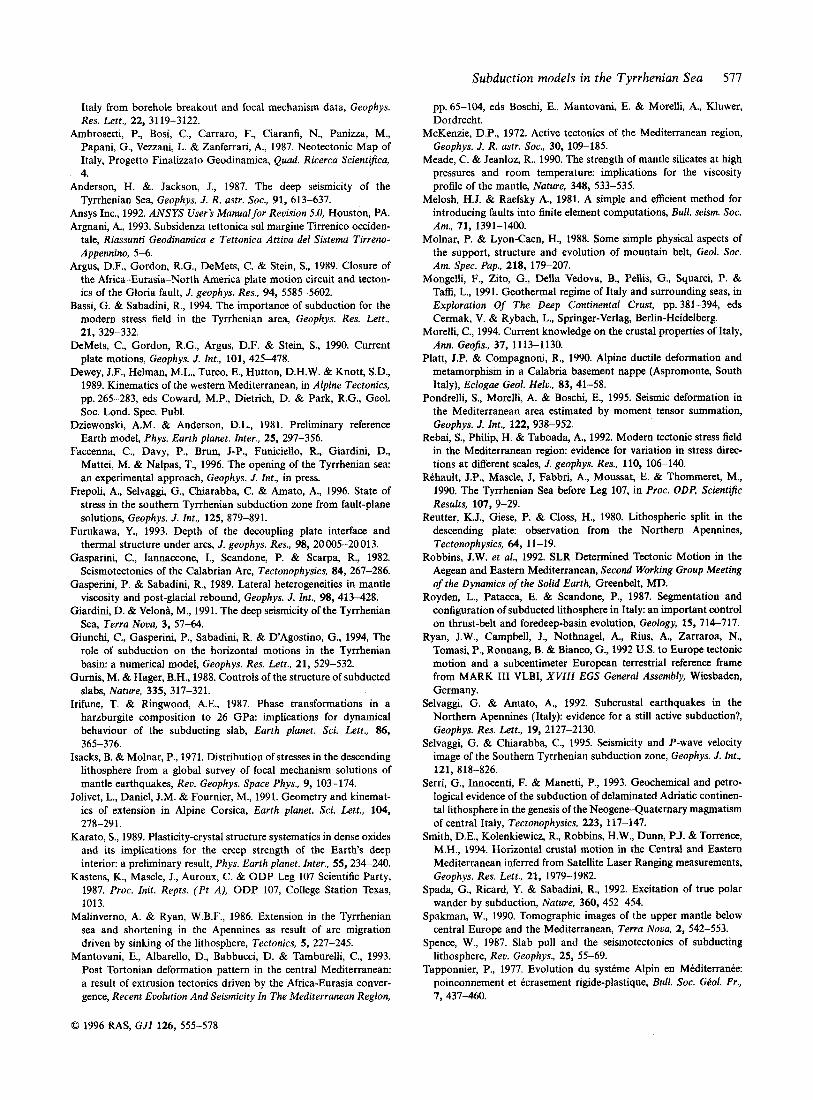
Subduction models in the Tyrrhenian Sea 577
Italy from borehole breakout and focal mechanism data, Geophys. Res. Lett., 22, 3119-3122.
Ambrosetti, P., Bosi, C., Carraro, F., Ciaranfi, N., Panizza, M., Papani, G., Vezzani, L. & Zanferrari, A., 1987. Neotectonic Map of Italy, Progetto Finalizzato Geodinamica, Quad. Ricerca Scientifca, 4.
Anderson, H. &. Jackson, J., 1987. The deep seismicity of the Tyrrhenian Sea, Geophys. J. R . astr. Soc.. 91, 613-637.
Ansys Inc., 1992. ANSYS User’s Manual for Revision 5.0, Houston, PA. Argnani, A., 1993. Subsidenza tettonica sul margine Tirrenico occiden-
tale, Riassunti Geodinamica e Tettonica Attiva del Sistema Tirreno- Appennino, 5-6.
Argus, D.F., Gordon, R.G., DeMets, C. & Stein, S., 1989. Closure of the Africa-Eurasia-North America plate motion circuit and tecton- ics of the Gloria fault, J. geophys. Rex, 94, 5585-5602.
Bassi, G. & Sabadini, R., 1994. The importance of subduction for the modern stress field in the Tyrrhenian area, Geophys. Res. Lett.,
DeMets, C., Gordon, R.G., Argus, D.F. & Stein, S., 1990. Current plate motions, Geophys. J. Int., 101, 425-478.
Dewey, J.F., Helman, M.L., Turco, E., Hutton, D.H.W. & Knott, S.D., 1989. Kinematics of the western Mediterranean, in Alpine Tectonics, pp. 265-283, eds Coward, M.P., Dietrich, D. & Park, R.G., Geol. SOC. Lond. Spec. Publ.
Dziewonski, A.M. & Anderson, D.L., 1981. Preliminary reference Earth model, Phys. Earth planet. Inter., 25, 297-356.
Faccenna, C., Davy, P., Brun, J-P., Funicielfo, R., Giardini, D., Mattei, M. & Nalpas, T., 1996. The opening of the Tyrrhenian sea: an experimental approach, Geophys. J. Int., in press.
Frepoli, A., Selvaggi, G., Chiarabba, C. & Amato, A., 1996. State of stress in the southern Tyrrhenian subduction zone from fault-plane solutions, Geophys. J. Int., 125, 879-891.
Furukawa, Y., 1993. Depth of the decoupling plate interface and thermal structure under arcs, J. geophys. Res., 98, 20005-20013.
Gasparini, C., Iannaccone, I., Scandone, P. & Scarpa, R., 1982. Seismotectonics of the Calabrian Arc, Tectonophysics, 84, 267-286.
Gasperini, P. & Sabadini, R., 1989. Lateral heterogeneities in mantle viscosity and post-glacial rebound, Geophys. J. Int., 98, 413-428.
Giardini, D. & Velona, M., 1991. The deep seismicity of the Tyrrhenian Sea, Terra Nova, 3, 57-64.
Giunchi, C., Gasperini, P., Sabadini, R. & DAgostino, G., 1994, The role of subduction on the horizontal motions in the Tyrrhenian basin: a numerical model, Geophys. Res. Lett., 21, 529-532.
Gurnis, M. & Hager, B.H., 1988. Controls of the structure of subducted slabs, Nature, 335, 317-321.
Irifune, T. & Ringwood, A.E., 1987. Phase transformations in a harzburgite composition to 26 GPa: implications for dynamical behaviour of the subducting slab, Earth planet. Sci. Lett., 86,
backs, B. & Molnar, P., 1971. Distribution of stresses in the descending lithosphere from a global survey of focal mechanism solutions of mantle earthquakes, Rev. Geophys. Space Phys., 9, 103-174.
Jolivet, L., Daniel, J.M. & Fournier, M., 1991. Geometry and kinemat- ics of extension in Alpine Corsica, Earth planet. Sci. Lett., 104,
Karato, S., 1989. Plasticity-crystal structure systematics in dense oxides and its implications for the creep strength of the Earth’s deep interior: a preliminary result, Phys. Earth planet. Inter., 55, 234-240.
Kastens, K., Mascle, J., Auroux, C. & ODP Leg 107 Scientific Party, 1987. Proc. Init. Repts. (Pt A), ODP 107, College Station Texas, 1013.
Malinverno, A. & Ryan, W.B.F., 1986. Extension in the Tyrrhenian sea and shortening in the Apennines as result of arc migration driven by sinking of the lithosphere, Tectonics, 5, 227-245.
Mantovani, E., Albarello, D., Babbucci, D. & Tamburelli, C., 1993. Post Tortonian deformation pattern in the central Mediterranean: a result of extrusion tectonics driven by the Africa-Eurasia conver- gence, Recent Evolution And Seismicity In The Mediterranean Region,
21, 329-332.
365-376.
278-291.
pp. 65-104, eds Boschi, E., Mantovani, E. & Morelli, A., Kluwer, Dordrecht.
McKenzie, D.P., 1972. Active tectonics of the Mediterranean region, Geophys. J. R . astr. SOC., 30, 109-185.
Meade, C. & Jeanloz, R., 1990. The strength of mantle silicates at high pressures and room temperature: implications for the viscosity profile of the mantle, Nature, 348, 533-535.
Melosh, H.J. & Raefsky A., 1981. A simple and efficient method for introducing faults into finite element computations, Bull. seism. SOC. Am., 71, 1391-1400.
Molnar, P. & Lyon-Caen, H., 1988. Some simple physical aspects of the support, structure and evolution of mountain belt, Geol. SOC. Am. Spec. Pap., 218, 179-207.
Mongelli, F., Zito, G., Della Vedova, B., Pellis, G., Squarci, P. & Taffi, L., 1991. Geothermal regime of Italy and surrounding seas, in Exploration Of The Deep Continental Crust, pp. 381-394, eds Cermak, V. & Rybach, L., Springer-Verlag, Berlin-Heidelberg.
Morelli, C., 1994. Current knowledge on the crustal properties of Italy, Ann. Geofs., 37, 1113-1130.
Platt, J.P. & Compagnoni, R., 1990. Alpine ductile deformation and metamorphism in a Calabria basement nappe (Aspromonte, South Italy), Eclogae Geol. Helv., 83, 41-58.
Pondrelli, S., Morelli, A. & Boschi, E., 1995. Seismic deformation in the Mediterranean area estimated by moment tensor summation, Geophys. J . Int., 122, 938-952.
Rebai, S., Philip, H. & Taboada, A., 1992. Modem tectonic stress field in the Mediterranean region: evidence for variation in stress direc- tions at different scales, J. geophys. Res., 110, 106-140.
Rehault, J.P., Mascle, J, Fabbri, A., Moussat, E. & Thommeret, M., 1990. The Tyrrhenian Sea before Leg 107, in Proc. ODE Scientific Results, 107, 9-29.
Reutter, K.J., Giese, P. & Closs, H., 1980. Lithospheric split in the descending plate: observation from the Northern Apennines, Tectonophysics, 64, 11-19.
Robbins, J.W. et al., 1992. SLR Determined Tectonic Motion in the Aegean and Eastern Mediterranean, Second Working Group Meeting of the Dynamics of the Solid Earth, Greenbelt, MD.
Royden, L., Patacca, E. & Scandone, P., 1987. Segmentation and configuration of subducted lithosphere in Italy: an important control on thrust-belt and foredeep-basin evolution, Geology, 15, 714-717.
Ryan, J.W., Campbell, J., Nothnagel, A., Rius, A., Zarraroa, N., Tomasi, P., Ronnang, B. & Bianco, G., 1992 US. to Europe tectonic motion and a subcentimeter European terrestrial reference frame from MARK 111 VLBI, XVIII EGS General Assembly, Wiesbaden, Germany.
Selvaggi, G. & Amato, A., 1992. Subcrustal earthquakes in the Northem Apennines (Italy): evidence for a still active subduction?, Geophys. Res. Lett., 19,2127-2130.
Selvaggi, G. & Chiarabba, C., 1995. Seismicity and P-wave velocity image of the Southern Tyrrhenian subduction zone, Geophys. J. Int.,
Serri, G., Innocenti, F. & Manetti, P., 1993. Geochemical and petro- logical evidence of the subduction of delaminated Adriatic continen- tal lithosphere in the genesis of the Neogene-Quaternary magmatism of central Italy, Tectonophysics, 223, 117-147.
Smith, D.E., Kolenkiewicz, R., Robbins, H.W., Dunn, P.J. & Torrence, M.H., 1994. Horizontal crustal motion in the Central and Eastern Mediterranean inferred from Satellite Laser Ranging measurements, Geophys. Res. Lett., 21, 1979-1982.
Spada, G., Ricard, Y. & Sabadini, R., 1992. Excitation of true polar wander by subduction, Nature, 360, 452-454.
Spakman, W., 1990. Tomographic images of the upper mantle below central Europe and the Mediterranean, Terra Nova, 2, 542-553.
Spence, W., 1987. Slab pull and the seismotectonics of subducting lithosphere, Rev. Geophys., 25, 55-69.
Tapponnier, P., 1977. Evolution du systtme Alpin en Mediterranee: poinconnement et Bcrasement rigide-plastique, Bull. SOC. GCol. Fr., 7, 437460.
121, 818-826.
0 1996 RAS, GJI 126, 555-578
578 C. Giunchi et al.
Tharp, T.M., 1985. Numerical models of subduction and forearc deformation, Geophys. J . R. astr. Soc., 80, 419-437.
Tortorici, L., Monaco, C., Tansi, C. & Cocina, O., 1995. Recent and active tectonics in the Calabrian arc (Southern Italy), Tectonophysics, 243, 37-55.
Valensise, G., Pantosti, D., DAddezio, G., Cinti, F.R. & Cucci, L., 1993. L'identificazione e la caratterizzazione di faglie sismogenetiche nell'Appennino centro-meridionale e nell'arco CaIabro: nuovi risul- tati e ipotesi interpretative, GNGTS, Atti X I I Conoegno, Rome.
Wallis, S., Platt, J.P. & Knott, S.D., 1993. Recognition of syn- convergence extension in accretionary wedge with examples from the Calabria arc and the eastern Alps, Am. J. Sci., 293, 463-495.
Ward, S.N., 1994. Constraints on the seismotectonics of the Central Mediterranean from Very Long Baseline Interferometry, Geophys. J . Int., 117, 441-452.
Watts, A.B. & TornC, M., 1992. Subsidence history, crustal structure, and thermal evolution of the Valencia trough a young extensional
basin in the Western Mediterranean, J. geophys. Res., 97,
Westaway, R., 1993. Quaternary uplift of southern Italy, J. geophys. Res., 98, 21 741-21 172.
Whittaker, A,, Bott, M.H.P. & Waghorn, G.D., 1992. Stresses and plate boundary forces associated with subduction plate margins, J. geophys. Res., 97, 1 1 933-1 1 944.
Williams, C.A. & Richardson, R.M., 1991. A rheologically layered three-dimensional model of the San Andreas fault in central and southern California, J. geophys. Res., 96, 16 597-16 623.
Wortel, M.J.R & Vlaar, N.J., 1988. Subduction zone seismicity and the thermomechanical evolution of downgoing lithosphere, Pure appl. Geophys., 128, 625-659.
Wortel, M.J.R. & Spakman, W., 1992. Structure and dynamic of subducted lithosphere in the Mediterranean, Proc. Kon. Ned. Akad. v. Wetensch., 95, 325-347.
Zhou, H., 1990. Observations on earthquake stress axes and seismic morphology of deep slabs, Geophys. J . Int., 103, 377-401.
20 021-20 041.
0 1996 RAS, GJI 126, 555-578