Embed Size (px)
Citation preview
1
DYNAMIC MODIFICATION OF SPHINGOMYELIN IN LIPID MICRODOMAINS CONTROLS DEVELOPMENT OF OBESITY, FATTY LIVER, AND TYPE 2 DIABETES
Susumu Mitsutakea1, Kota Zama1, Hazuki Yokota1, Tetsuya Yoshida3, Miki Tanaka3, Masaru Mitsui3, Masahito Ikawa4, Masaru Okabe4, Yoshikazu Tanaka3, Tadashi
Yamashita2, Hiroshi Takemoto3, Toshiro Okazaki5, Ken Watanabe6, and Yasuyuki Igarashi1
From 1Department of Biomembrane and Biofunctional Chemistry, 2Developmental Biotechnology, Faculty of Advanced Life Science, Hokkaido University 3Shionogi Innovation Center for Drug Discovery, Shionogi & Co., Ltd.
4Research Institute for Microbial Diseases and Pharmaceutical Sciences, Osaka University 5Department of Clinical Laboratory, Medicine/Hematology, Faculty of Medicine, Tottori
University 6Department of Bone and Joint Disease, National Center for Geriatrics and Geriatrics and
Gerontology Running Head: SMS2 is a novel regulator of lipid microdomains
aAddress correspondence to: Susumu Mitsutake, Ph.D., Kita 21, Nishi 11, Kita-ku, Sapporo 001-0021, JAPAN. Tel&Fax: +81-11-706-9047.
E-mail: [email protected] Lipid microdomains or caveolae, small invaginations of plasma membrane, have emerged as important element for lipid uptake and glucose homeostasis. Sphingomyelin (SM) is one of the major phospholipids of the lipid microdomains. In this study, we investigated the physiological function of sphingomyelin synthase 2 (SMS2) using SMS2-knockout mice, and found that SMS2 deficiency prevents high fat diet-induced obesity and insulin resistance. Interestingly, in the liver of SMS2-knockout mice, large and matured lipid droplets were scarcely observed. Treatment with siRNA for SMS2 also decreased the large lipid droplets in HepG2 cells. Additionally, the siRNA of SMS2 decreased the accumulation of triglyceride in liver of leptin-deficient (ob/ob) mice, strongly suggesting that SMS2 is involved in lipid droplets formation. Furthermore, we found that SMS2 exists in lipid microdomains and partially associates with the fatty acid transporter CD36/FAT and with caveolin 1, a scaffolding protein of caveolae. Since CD36/FAT and caveolin 1 exist in lipid microdomains and are coordinately involved in lipid droplets formation, SMS2 is implicated in modulation of the SM in lipid microdomains, resulting in the regulation of CD36/FAT and caveolae. Here, we established new cell lines, in which we can
completely distinguish SMS2 activity from SMS1 activity, and we demonstrated that SMS2 could convert ceramide produced in the outer leaflet of the plasma membrane into SM. Our findings demonstrate the novel and dynamic regulation of lipid microdomains via conformational changes in lipids on the plasma membrane by SMS2, which is responsible for obesity and type 2 diabetes. Obesity and insulin resistance are commonly associated with nonalcoholic fatty liver disease, leading to nonalcoholic steatohepatitis (NASH). Elucidation of the mechanisms underlying fat accumulation in liver is a very important matter. Studies have revealed that the biological membrane contains regions known as lipid microdomains that are enriched in sphingolipids, glycosphingolipid, or cholesterol. There are many types of microdomains, differing in lipid composition or detergent solubility and each microdomain might have a distinct function, such as acting as a “raft” or “glycosynapse” (1) (2) (3). Caveolae are small invaginations on the plasma membrane and are sites with many glycosphingolipid, sphingomyelin, and cholesterol-rich lipid microdomains. Mice deficient in caveolin 1, a scaffolding protein of caveolae, are lean and resistant to diet-induced obesity, suggesting that caveolae and lipid microdomains may be
http://www.jbc.org/cgi/doi/10.1074/jbc.M111.255646The latest version is at JBC Papers in Press. Published on June 13, 2011 as Manuscript M111.255646
Copyright 2011 by The American Society for Biochemistry and Molecular Biology, Inc.
by guest on May 24, 2019
http://ww
w.jbc.org/
Dow
nloaded from
by guest on May 24, 2019
http://ww
w.jbc.org/
Dow
nloaded from
by guest on May 24, 2019
http://ww
w.jbc.org/
Dow
nloaded from
by guest on May 24, 2019
http://ww
w.jbc.org/
Dow
nloaded from
by guest on May 24, 2019
http://ww
w.jbc.org/
Dow
nloaded from
by guest on May 24, 2019
http://ww
w.jbc.org/
Dow
nloaded from

2
important for the uptake of triglyceride (TG) and fatty acid (FA) (4). Both caveolae and lipid microdomains are now emerging as active centers for metabolism, with implications in obesity, diabetes, and other metabolic disorders (5). Along with cholesterol, sphingomyelin (SM) is a major component in lipid microdomains. Its synthetic enzyme is sphingomyelin synthase (SMS), for which the gene was identified in 2004 (6) (7). This enzyme has three isoforms, SMS1, SMS2, and SMSr. SMS1 is responsible for the bulk of SM production in the Golgi apparatus, and SMSr controls ceramide homeostasis in the ER, regulating the synthesis of ceramide phosphoethanolamine (8,9). In a recent report, SMS2 deficiency attenuated NFκB activation and decreased atherosclerosis (10,11) (12). However, the study did not fully address the mechanism of SMS2 involvement in atherosclerosis and NFκB activation, or whether SMS2 has a function distinct from SMS1. The SMS2 deficiency might also affect the metabolism of ceramide, sphingosine, and sphingosine 1-phosphate. Since these bioactive lipids act in signal transduction (13) (14), their effects could be complex requiring additional studies to elucidate mechanisms. In the study presented here, we reveal that SMS2 is responsible for diet-induced obesity and lipid droplets formation in liver. We further provide details implicating SMS2 as a novel regulator of lipid microdomain structure and function.
EXPERIMENTAL PROCEDURES Generation of SMS2 KO Mice And Animal Studies A vector for targeting deletion of the SMS2-exon 2, containing a cassette encoding β-galactosidase and neomycin-selectable marker (Nls-lac Z and PGK-neo), was electroporated into mouse D3 embryonic stem cells. Homologous recombinations were selected using G418 and Southern blotting, Recombinant cells were karyotyped to ensure that 2N chromosomes were present in most metaphase spreads. Chimeric mice derived from correctly targeted ES cells were mated
with C57BL/6 mice to obtain F1 Sgms2+/- mice. The recombination event was also confirmed by LA-PCR using tail samples of the mice obtained from Sgms2+/- x Sgms2+/- mating (Fig.1B). PCR primers used to the LA-PCR were: a, 5’-CCAAGTGACCTTCAAGTTTTGCTGTCTC-3’; b, 5'-CCAAGTGACCTTCAAGTTTTGCTGTCTC-3'; c, 5'-CAGGGTTTTCCCAGTCACGACGTTG-3'; d, 5'-TACATGATGTGTGATGACTACATGCCAG-3'; e, 5'-TCGCCTTCTATCGCCTTCTTGAC-3'; and f, 5'-GCATGCGTTCAGCGCGTTTGTATCCAC-3'. The primers positions were illustrated in Fig. 1A. All experiments were performed using N8 generation, which obtained by 8 rounds of backcrossing to C57BL/6 (B6.129-sgms2tm1Kenw). The generation of SMS1-knockout mice has previously described (15). Leptin-deficient ob/ob mice were obtained from Japan SLC Inc. (Hamamatsu, JAPAN). To establish diet-induced obesity, the mice were fed a high fat-diet (60% kcal from fat; 58Y1, TestDiet, Richmond, IN) from weeks 4 to 15 of age. Control mice were fed a standard chow diet (AIN76A, TestDiet) during the same period. Body weight was measured once a week. The amount of food intake was monitored during weeks 7 to 9. The amounts of triglycerides, free fatty acids, and cholesterol in plasma and liver tissues were determined using a Triglyceride E-test Wako Kit (Wako, Japan), a NEFA C-test Wako Kit (Wako), and a Cholesterol E-test Wako Kit (Wako), respectively. The isolated liver from each mouse was fixed with 4% paraformaldehyde, and 8 µm-tick frozen sections were prepared as described previously (16). The sections were stained with standard Hematoxilyn and Eosin, and lipid droplets were stained with Oil-Red-O as described elsewhere (17). Glucose-Tolerance Test (GTT) Following a 16-hour fast, mice were injected intraperitoneally with a glucose solution (2 g/ kg-body weight). Glucose levels in blood collected from the tail vein
by guest on May 24, 2019
http://ww
w.jbc.org/
Dow
nloaded from
3
before and after glucose injection (at 15, 30, 60, and 120 min) were measured using an ACCU-CHEK Aviva glucometer (Roche). Plasma insulin levels in 8-week old male mice were determined by a Mouse Insulin ELISA Kit (Shibayagi, Gunma, Japan). Real Time-PCR Using a combination of TRIsol® and PureLinkTM RNA Mini kits (Invitrogen), total RNA was extracted from the liver and adipose tissue of WT and SMS2 KO mice, according to kit instructions. First strand cDNA was synthesized using a PrimeScript RT Master Mix (TAKARA Bio, Otsu, Japan), then real time PCR was performed using selected primers (Supplemental Table I) by SYBR Premix EX Taq (TAKARA Bio) and a Thermal Cycler Dice Real Time System (TAKARA Bio) following the manufacture’s instructions. Transcript levels were normalized to glyceraldehyde-3-phosphate dehydrogenase (GAPDH) or hypoxanthine guanine phosphoribosyl transferase (HPRT) in liver or adipose, respectively. Quantification of SM, Cer, And PC SM and Cer amounts in isolated tissue or cells were determined using electron ionization mass spectrometry (ESI-LC/MS) (LC, Agilent1100, Agilent technologies, CA; MS, LCQ fleet, ThermoFisher Scientific, CA), as described previously (18) (19) (20). The amount of PC was determined using a phosphatidylcholine assay kit (BioVision, CA). We used Cer (C16:0, d18:1) and SM (C16:0, d18:1) as standards to quantify Cer and SM, respectively. Standards were obtained from Avanti Polar Lipid (Alabaster, AL). SDS−PAGE And Western Blotting SDS-PAGE and Western blotting (WB) were performed according to the standard methods of Laemmli (21) and Towbin (22), respectively. For protein detection on WB, we employed an anti-V5 monoclonal antibody (MAb) (SIGMA), anti-V5 polyclonal antibody (PAb) (SIGMA), anti-FLAG MAb (SIGMA), anti-FLAG PAb (SIGMA), anti-calnexin PAb (Abcam, Cambridge, MA), anti-caveolin 1 MAb (BD bioscience, San Jose, CA), or anti-CD36
MAb (eBio science, San Diego, CA) as a primary antibody, and an anti-mouse IgG-HRP antibody (GE healthcare), anti-rabbit IgG-HRP antibody (GE healthcare), or anti-rat IgG-HRP antibody (GE healthcare) as a secondary antibody. Bands were detected using a combination of an ECL plus kit (GE healthcare) and luminescent image analysis by an LAS4000 (Fuji Film, Tokyo). For CD36 detection in liver tissue, de-N-glycosidase (New England Biolab, Beverly, MA) was added to samples prior to performing SDS-PAGE. Preparation And Co-Immunoprecipitation Analysis of Detergent-Insoluble Lipid Microdomains COS7 cells were co-transfected with plasmids using Lipofectamine 2000 (Invitrogen) according to the manufacturer’s instructions, then the cells were incubated overnight. To isolate detergent-insoluble lipid microdomains, the cells were lysed, homogenized, and subjected to a sucrose density gradient according to the method previously described (23). In brief, the cells were incubated on ice with chilled lysis buffer containing 20 mM CHAPS (Sigma), CompleteTM protease inhibitor cocktail (Roche), and PhoStopTM phosphatase inhibitor cocktail (Roche) in TNE buffer (10 mM Tris-HCL buffer, pH7.5, 150 mM NaCl, 5 mM of EDTA). The resulting lysate was adjusted to 42% sucrose and overlayed with a discontinuous sucrose gradient (6 ml of 30% sucrose or 2 ml 0% sucrose) in TNE buffer. The tube was centrifuged at 34,100 rpm for 18 h in an SW41 rotor (Beckman), and the solution was fractionated from the top to the bottom. For co-immunoprecipitation experiments, the cells were lysed with lysis buffer containing 1% Brij 99 (Sigma) and CompleteTM and PhoStopTM inhibitor cocktails (Roche) in TNE buffer, then the lysates were incubated with anti-FLAG M2 beads (Sigma) at 4 ºC for 4 h. The beads were then washed 4-times with lysis buffer and subjected to SDS-PAGE. siRNA Experiments And Quantification of Lipid Droplet Formation HepG2 cells were grown in 6-well
by guest on May 24, 2019
http://ww
w.jbc.org/
Dow
nloaded from

4
plates and transiently transfected with siRNA (h-siSMS2-1: 5’–GGGCAUUGCCUUCAUAUAU-3’, h-siSMS2-2: 5’–GCACACGAACACUACACUA-3’, or control siRNA: 5’–UUCUCCGAACGUGUCACGU-3’) using LipofectamineTM RNAiMAX (Invitrogen) according to the manufacturer’s instructions. After 2 days, the formation of lipid droplets was induced by adding oleic acid / BSA mixture; final oleic acid concentration was 400 µM in culture media. After one-day incubation, the cells were fixed with 4% paraformaldehyde, and the lipid droplets were stained with Nile-Red. The size and number of the lipid droplets were quantified using a fluorescent microscopy (BZ-9000, KEYENCE, Osaka, Japan). In vivo siRNA experiments were performed as described previously using a siRNA delivery system of stable nucleic acid lipid particles (SNALP) (24). In brief, a SNALP-siRNA mixture containing SMS2 siRNA (m-siSMS2-1: 5’-GGCUCUUUCUGCGUUACAA-3’, m-siSMS2-2: 5’-GGAUGGUAUUGGUUGGGUU-3’, or control siRNA: 5’-UUCUCCGAACGUGUCACGU-3’) was administered intravenously into the tail vein of leptin-deficient ob/ob mice in a total volume of 10 ml/kg. After 10 days, the triglycerol amount in the liver of each mouse was determined. Generation of SM-Reconstituted Cells The generation and analysis of SMS1 knockout mice have been described previously (15). We generated double knockout mice lacking both SMS1 and SMS2, and isolated mouse embryonic fibroblasts (MEF) from the mouse embryo. The MEF were immortalized by SV40 T antigen as previously described (25). From the immortalized MEF, we cloned the cell line ZS2. V5-tagged SMS1 and SMS2 were stably expressed in ZS2 cells by retrovirus gene-transfer systems (Clontech, CA) using the pQCXIP-SMS1-V5 and pQCXIH-SMS2 vector, respectively, according to the manufacturer’s instructions. The obtained cells, which stably expressed SMS1 or SMS2, were named ZS2/SMS1 and ZS2/SMS2,
respectively. We also immortalized MEF from SMS2-knockout mice (SMS2 KO-MEF) and control litter mate WT mice (WT-MEF). Additionally, reconstituted cells (SMS2 KO/SMS2-MEF) were produced using a retrovirus gene-transfer systems with the pQCXIH-SMS2 vector as above. Cells were maintained in a humidified chamber with a 5 % CO2 atmosphere, and cultured in Dulbecco’s Modified Eagle’s medium (DMEM, Sigma) supplemented with 10% FBS. When we determined SM levels, the cells were cultured with the serum free medium OptiPro SFM (Invitrogen) to block the SM supply from serum. Metabolic Labeling of SM And Analysis of SMS Activity The in vitro SM synthase activity of cells was determined by BODIPY-C5-Cer, as described previously (26). Experiments using the CERT inhibitor HPA-12 were performed as described by Yasuda, et al. (27). For the recovery experiment of SM, cells were labeled with [14C]Choline for 5 h and preincubated for 30 min with 80 µM dynasore (a dynamin II inhibitor; Sigma) in DMEM containing 10% FBS. The medium was changed to DMEM containing 100 µU/ml bacterial SMase (Staphylococcus aureus, Sigma) and 80 µM dynasore, and the cells were incubated for 30 min. The cells were then washed twice with DMEM, and incubated for 60 min in DMEM containing 80 µM dynasore. In each step, lipids were extracted and separated on a silica gel 60 thin layer chromatography plate (Merck, Germany) as described previously (6). Bands corresponding to [14C]SM were quantified by imaging analyzer FLA7000 (Fuji film). Uptake Assay for [14C]Oleic Acid Uptake assays utilizing [14C]oleic acid (American Radiolabeled Chemicals, St. Louis, MO) were performed as described previously (28). Fluorescence Imaging A pcDNA6.2-GFP-SMS2, pHcRed-CD36/FAT or pHcRed-caveolin 1 plasmid was co-transfected to COS7 cells using LipofectamineTM2000 (Invitrogen) according to the manufacturer’s instructions.
by guest on May 24, 2019
http://ww
w.jbc.org/
Dow
nloaded from

5
After an overnight incubation at 37 ºC, fluorescent images were directly obtained by a confocal laser scanning microscope, FluoView®FV10i (Olympus, Tokyo). For immunofluorescent microscopy, ZS2/SMS1 or ZS2/SMS2 cells were fixed then permeabilized for 10 min in phosphate-buffered saline with 4 % paraformaldehyde and 0.2% Triton X-100. The cells were incubated at room temperature for 4 h with both an anti-V5 MAb (Invitrogen) and an anti-GM130 PAb (BD bioscience), then for 2 h with Alexa 488-conjugated anti-mouse IgG (Invitrogen) or Alexa 594-conjugated phalloidin (Invitrogen). Coverslips were mounted with Prolong Gold®antifade with DAPI (Invitrogen), and confocal images were obtained using the FluoView®FV10i microscope. Plasmid Construction All plasmids used in this study were made using the Gateway® recombination system (Invitrogen). The cDNA of SMS1, SMS2, CD36/FAT, or caveolin 1 was amplified from mouse liver cDNA (Clontech) by polymerase chain reaction (PCR) with selected primers (for SMS1, 5’-CACCATGTTGTCTGCCAGGACCATG-3’ and 5’-TGTGTCGTTTACCAGCCGG-3’ (the stop codon was disrupted for C-terminal protein fusion) ; for SMS2, 5’-CACCATGGATATCATAGAGACAGCAAAA-3’ and 5’-GGTAGACTTCTCATTATCCTCCC-3’ (the stop codon was disrupted for C-terminal protein fusion); for CD36/FAT, 5’-CACCATGGGCTGTGATCGGAACTGTG-3’ and either 5’-TTATTTTCCATTCTTGGATTTGCAAGCAC-3’ or 5’-TTTTCCATTCTTGGATTTGCAAGCAC-3’ (the stop codon was disrupted for C-terminal protein fusion); and for CAV1, 5’-CACCATGTCTGGGGGCAAATACGTAG-3’ and 5’-TCATATCTCTTTCTGCGTGCTGAT-3’ ). The cDNA was then cloned to a pENTRTMD-TOPO vector (Invitrogen). As a destination vector, we employed a pcDNA6.2/V5-DEST or pcDNA6.2/C-EmGFP-DEST vector
(Invitrogen). The pQCXIP (Clontech), pQCXIH (Clontech), pHcRed (Clontech), and p3XFLAG-myc-CMV26 (Sigma) vectors were converted to destination vectors using the Gateway®Vector Conversion System (Invitrogen), producing pQCXIP-DEST, pQCXIH-DEST, pHcRed-DEST, and p3XFLAG-DEST, respectively. Gateway®LR reactions were performed as described in the Gateway® instruction manual (Invitrogen), to finally produce the pcDNA6.2-SMS1-V5, pcDNA6.2-SMS2-V5, pcDNA6.2-CAV1, pcDNA6.2-SMS2-EmGFP, pHcRed-CD36/FAT, pHcRed-caveolin 1, p3XFLAG-CD36/FAT, p3XFLAG-caveolin 1, pQCXIP-SMS1-V5, and pQCXIH-SMS2-V5 plasmids.
All materials and reagents were of highest purity available.
RESULTS
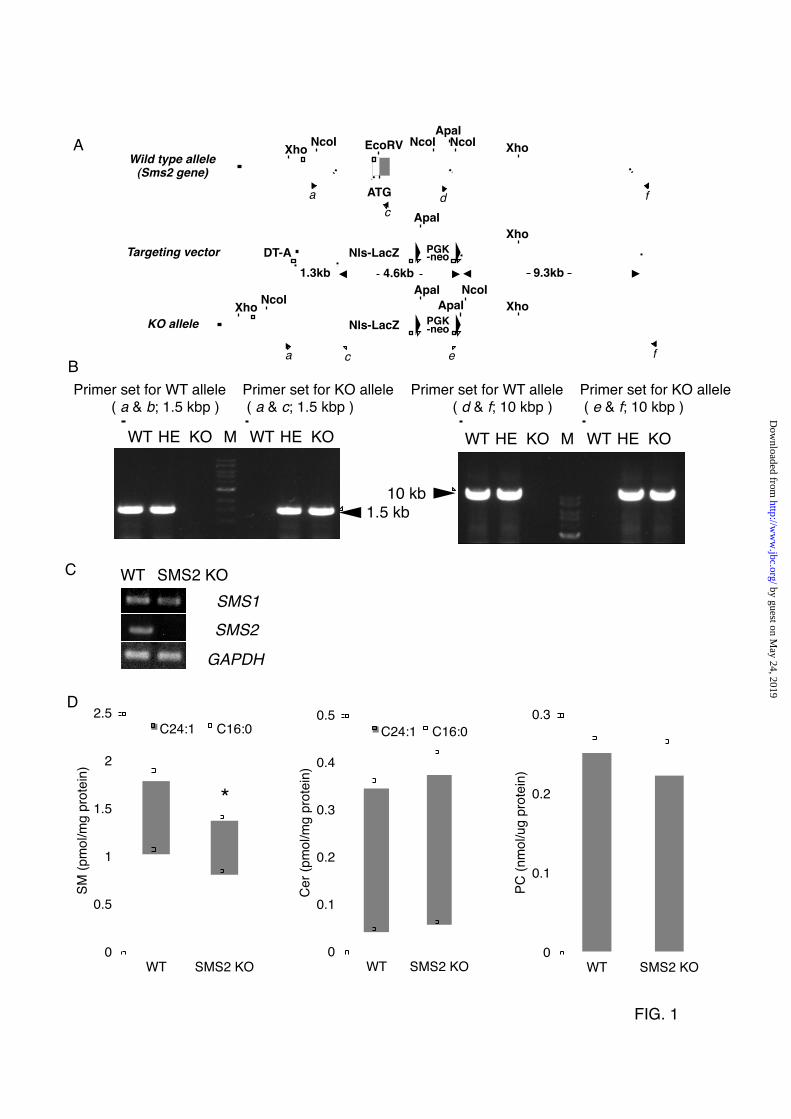
Generation of SMS2-Deficient Mice. The mouse SMS2 gene (Sgms2) in ES cells was targeted by homologous recombination (Fig. 1A). The SMS2-gene was successfully disrupted (Fig. 1B), and this disruption was associated with a loss of SMS2 expression (Fig. 1C). The obtained SMS2-knockout (SMS2 KO) mice were seemingly healthy, and displayed almost no apparent abnormalities. Initially, we determined the amounts of sphingomyelin (SM), ceramide (Cer), and phosphatidylcholine (PC) in the livers of the SMS2 KO mice and control wild-type (WT) mice (Fig. 1D). The SMS2 deficiency reduced SM levels by about 20%, with no apparent effect on Cer or PC levels. Our data indicate that most SM is synthesized by SMS1, and so the effect of SMS2 deficiency on SM levels is mild and restricted. This lack of effect on SM levels might account for the absence of abnormalities in SMS2-KO mice. These results prompted a question as to whether SMS2 might be simply redundant to SMS1. To identify a particular function of SMS2, we performed a diet-induced obesity (DIO) test. SMS2 Deficiency Prevents High Fat Diet-Induced Obesity And Insulin Resistance. In the diet-induced obesity (DIO) test, mice were fed a high fat diet (HFD) or normal diet
by guest on May 24, 2019
http://ww
w.jbc.org/
Dow
nloaded from
6
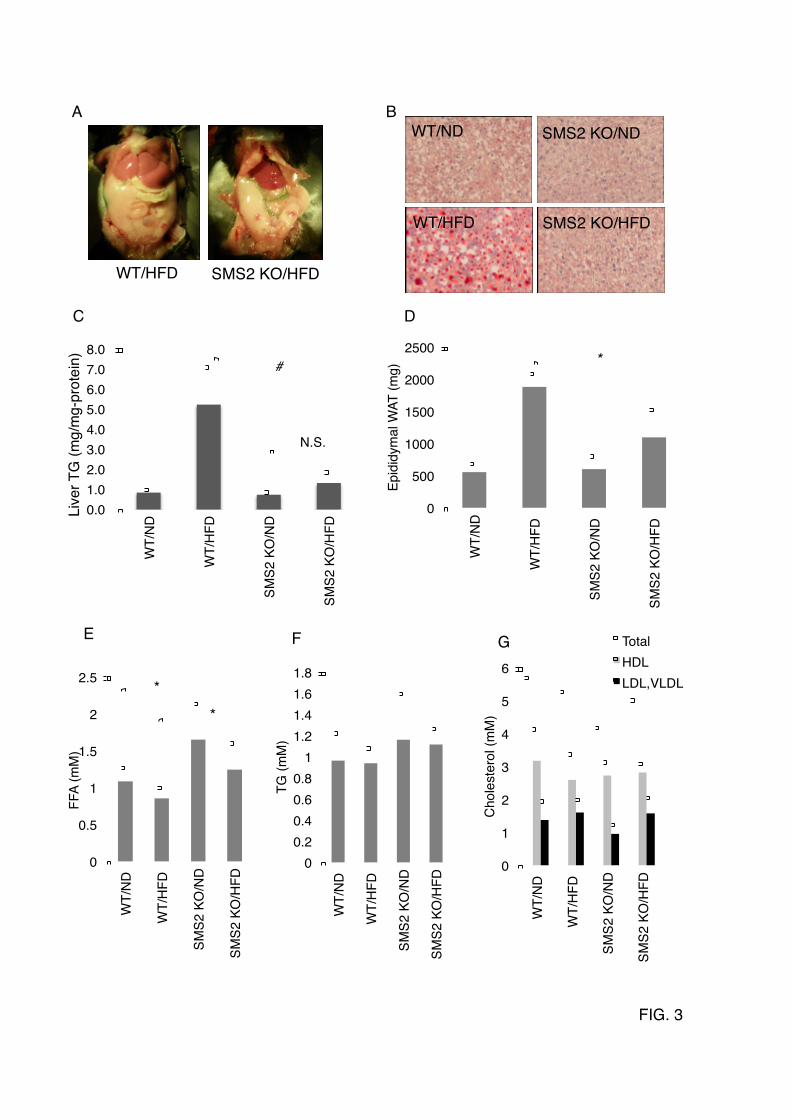
(ND) from 4 to 15 weeks of age. In the wild type (WT) mice, HFD potently increased the body weight (Fig. 2A). However, interestingly, there were no significant differences between the HFD-fed and ND-fed groups of SMS2 KO mice. The SMS2 deficiency completely prevented HFD-induced increase in body weight. The average amounts of food intake during the DIO test were not significantly different between the SMS2 KO and WT mice (Fig. 2B). We also examined the effect of SMS2 deficiency on HFD-induced glucose intolerance or insulin resistance. As expected, the fasting blood glucose was higher in the HFD-fed group of WT mice (Fig. 2C), indicating impaired insulin sensitivity in the liver. However, the HFD-fed group of SMS2 KO mice did not show any increase in fasting blood glucose, compared to the ND-fed group. A glucose tolerance test (GTT) reflected impaired blood glucose clearance in the HFD-fed group of WT. In contrast, the HFD-fed group of SMS2 KO mice exhibited levels of glucose clearance comparable to those of the ND-fed group of WT and SMS2 KO mice (Fig. 2D, E). SMS1 deficiency is known to severely impair islet and insulin secretion (15), yet SMS2 KO mice were able to secrete insulin in response to feeding (Fig. 2F), indicating that SMS2 deficiency does not impair insulin secretion. These results show that SMS2 deficiency prevents HFD-induced insulin resistance, indicating that SMS2 is likely to be involved in the development of diabetes. SMS2 Deficiency Prevents High Fat Diet-Induced Fatty Liver. Upon surgical examination of the HFD-fed mice during the DIO test period, an impressive difference was found in the livers of WT and SMS2 KO mice. As expected, the livers of the HFD-fed WT mice grossly appeared whitish-red, indicating a fatty liver (Fig. 3A). Oil-Red-O staining of liver sections clearly demonstrated that the liver of HFD-fed WT mice accumulated huge amounts of neutral lipids (red-stained spots), and large vacuous vesicles, which were the remains of large lipid droplets (Fig. 3B). In contrast, the livers of the HFD-fed SMS2 KO mice accumulated little or no Oil-Red-O-positive neutral lipids or large lipid droplets. The
amounts of triglyceride (TG), a major Oil-Red-O-positive neutral lipid, were determined in these livers (Fig. 3C). TG levels in the HFD-fed WT mice were 5 times higher than those in the corresponding ND-fed group. Interestingly, no statistically significant difference was observed between the HFD-fed group and ND-fed group in SMS2 KO mice. These results clearly demonstrate that SMS2 deficiency prevents HFD-induced accumulation of TG in the liver and the resulting development of large lipid droplets, fatty liver. Additionally, the amounts of epididymal white adipose tissue (WAT) were determined in each group of mice. The SMS2 deficiency clearly suppressed the growth of epididymal WAT, observed in HFD-fed WT mice (Fig. 3D). We also examined the levels of free fatty acid (FFA), TG, and cholesterol in plasma. There were no significant differences in plasma TG or cholesterol levels between WT and SMS2 KO mice in either the ND- or HFD-fed groups (Fig. 3F, G). However, SMS2 KO mice exhibited higher levels of FFA than WT mice did in both the HFD- and ND-fed groups (Fig. 3E). To gain insight into the mechanisms of how SMS2 deficiency prevents HFD-induced obesity and fatty liver, we examined the expression levels of genes implicated in obesity and fatty liver using real-time quantitative PCR in liver and adipose tissue. Interestingly, although HFD induced the expression of the fatty acid transporter CD36/FAT approximately 5 times in WT mice, SMS2 deficiency strongly suppressed this HFD-induced increase of CD36/FAT (Fig. 4A). Similar to the mRNA expression, HFD increased the protein of CD36/FAT in WT mice, yet there was almost no difference between HFD-fed and ND-fed SMS2 KO mice (Fig. 4C, D). The nuclear receptor PPARγ, a regulator of gene expression of many lipid metabolic enzymes in response to lipid ligands such as fatty acid or its oxidized derivatives, was elevated in HFD-fed WT mice. Interestingly, the HFD-induced increase of PPARγ was also strongly suppressed in SMS2 KO mice (Fig. 4A). Since the expression level of CD36/FAT is elevated by PPARγ, and CD36/FAT facilitates cellular uptake of fatty acid
by guest on May 24, 2019
http://ww
w.jbc.org/
Dow
nloaded from

7
(PPARγ ligand), their expressions are synergistically increased, leading to lipid droplets formation (29). In our WT mice, the synergistic elevations occurred in response to HFD. In contrast, the SMS2 deficiency suppressed the HFD-induced increase of CD36/FAT and PPARγ, suggesting that SMS2 could regulate CD36/FAT-mediated uptake of fatty acid. Indeed, the plasma of SMS2 KO mice possessed higher levels of FFA than that of WT mice (Fig. 3E), also indicating impaired fatty acid uptake in SMS2 KO mice. On the other hand, there were almost no differences between WT and SMS2 KO mice in either the HFD-fed groups or ND-fed groups in several genes tested (Fig. 4A). In the adipose tissue of WT mice, as expected, HFD decreased the expression of IR (insulin receptor), GLUT4 (major glucose transporter in adipose tissue), and adiponectin, typical symptoms of insulin resistance (Fig. 4B). However in SMS2 KO mice, HFD did not decrease the expression, indicating that the mice did not develop the insulin resistance. These results agree with the GTT results (Fig. 2D, E). SMS2 Is Involved in Large Lipid Droplet Formation in Liver. CD36/FAT on the cell surface localizes in detergent-insoluble membrane microdomains (DIM), which are rich in sphingolipids and cholesterol. Residing in DIM is important for the functions of CD36/FAT, such as the uptake of fatty acids (30). We prepared DIM fractions using CD36/FAT- and SMS2- overexpressing COS7 cells. As expected, CD36/FAT was recovered in the DIM fraction along with caveolin 1, a well-known marker for DIM. A membrane-integral protein of ER, calnexin was successfully separated from DIM fraction. Interestingly, SMS2 was also associated with the DIM fraction (Fig. 5A). Confocal images revealed that GFP-tagged SMS2 and HcRed-tagged CD36/FAT or HcRed-tagged caveolin 1 were co-localized in intracellular vesicular compartments of the cell (Fig. 5B-a, yellow; merged image). In Fig.5B-b, CD36-HcRed and caveolin 1-HcRed are also exist in plasma membrane as previous report (31,32). Caveolae, small intracellular invaginations of the membrane, contain many DIM, and provide a platform for signal transduction
and metabolism across the plasma membrane. Caveolin 1 is a major constituent of caveolae. Reportedly, caveolae-mediated endocytosis is important for cellular entry of lipids, viruses, and some nutrients; interestingly, exogenous cholesterol and glycolipids induce internalization of caveolin 1 into endosomes (31). CD36/FAT is known to promote uptake of oxLDL and fatty acid by dynamin-independent endocytosis, and exogenous oxLDL is internalized by CD36/FAT into endosomes. Serum contains oxLDL and cholesterol, so it is reasonable that both CD36/FAT and caveolin 1 localized in intracellular vesicles, results which agree with other studies (31,32). To further assess the association between SMS2 and CD36/FAT, 3XFLAG-tagged CD36/FAT or 3XFLAG-tagged caveolin 1 and V5-tagged SMS2 were co-expressed in COS7 cells, then immunoprecipitation assays were performed using anti-FLAG M2 beads. SMS2 was co-precipitated with CD36/FAT (Fig. 5C). Additionally, SMS2 was partially co-precipitated with caveolin 1 (Fig. 5C). There is recent evidence that caveolin 1 functionally interacts with CD36/FAT and regulates fatty acid uptake (33). Additionally, caveolin 1 knockout mice exhibited impaired fatty acid uptake and lipid droplet formation (4). We examined whether knock down of SMS2 would affect lipid droplet formation. We employed two types of siRNA, h-siSMS2-1 and h-siSMS2-2, which reduced SMS2-expression efficiently in HepG2 cells (~60% reduction in cells transfected with h-siSMS2-1 or h-siSMS2-2). The formation of lipid droplets was induced by adding oleic acid to the medium. Large and matured lipid droplets were observed in the control cells (Fig. 5D, arrowheads). Interestingly, large lipid droplets (>1.25 µm) were dramatically reduced in both SMS2-knockdown cells (Fig. 5E). Additionally, knockdown of SMS2 decreased the uptake of oleic acid significantly (Fig. 5F). These results strongly suggest that SMS2 is involved in fatty acid uptake, and in the growth and maturation of lipid droplets. The data coincide with impaired lipid droplet formation in the liver of HFD-fed SMS2 KO mice (Fig. 3E). Critical roles for lipid microdomain in fatty acid uptake and maturation of lipid droplets
by guest on May 24, 2019
http://ww
w.jbc.org/
Dow
nloaded from
8
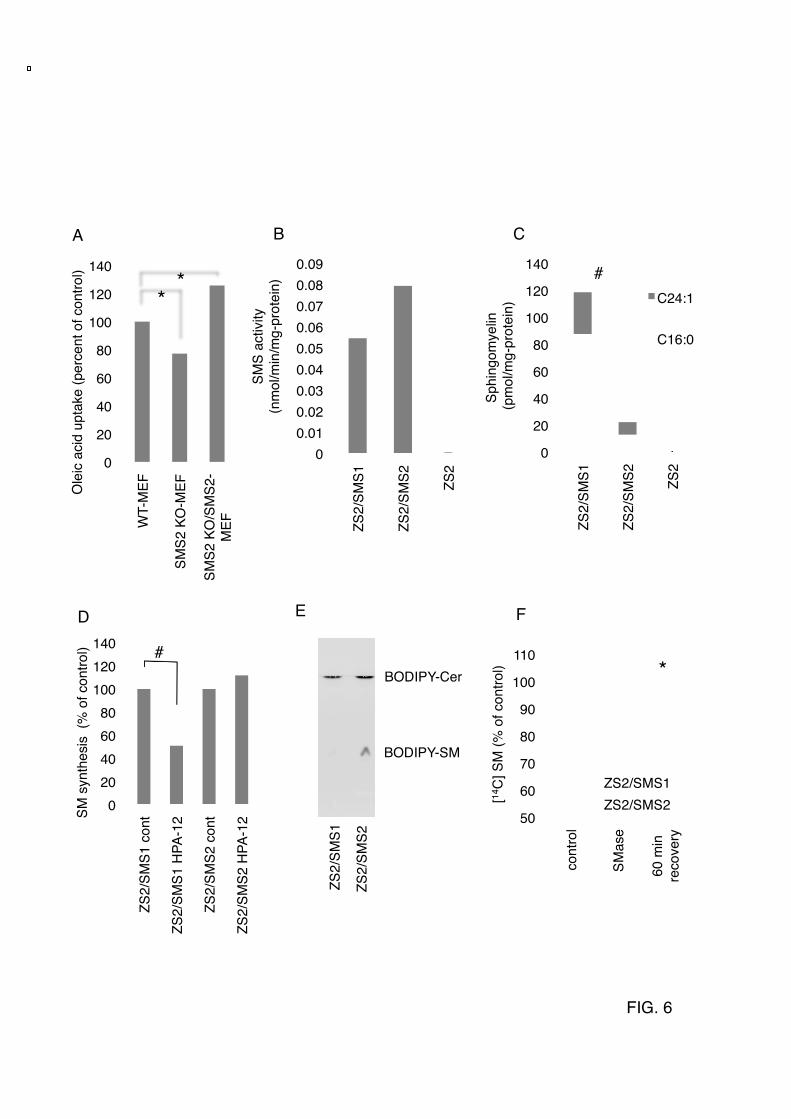
have been reported (28) (34). In addition, SMS2 deficiency reportedly reduced sensitivity to lysenin-mediated cytolysis, indicating that SMS2 alters the lipid microdomain (35). Methyl-β-cyclodextrin (MβCD) is known to reduce cholesterol levels, disrupt lipid microdomains, and induce cell death (36). Knockdown of SMS2 clearly decreased cell viability after an overnight treatment with MβCD (Fig. 5G). Decreased levels of SM in lipid microdomains would increase the sensitivity of MβCD-induced cell death. These results suggest that SMS2 deficiency could cause disorder in lipid microdomains, leading to impairments in fatty acid uptake and maturation of lipid droplets. In vivo experiments for SMS2-knockdown were also performed using a leptin-deficient obese model, ob/ob mice with a siRNA delivery system of SNALP (24). SMS2 siRNA efficiently suppressed SMS2 expression in liver (~70% reduction in cells transfected with m-siSMS2-1 or m-siSMS2-2). Interestingly, both siRNAs of SMS2 successfully reduced TG levels in liver without changes in food intake (Fig. 5 H). SMS2 Can Convert Cer to SM at The Outer Leaflet of The Plasma Membrane. To further confirm that SMS2 is involved in cellular fatty acid uptake, we isolated MEF from SMS2-knockout mice (SMS2 KO-MEF) and control litter mate WT mice (WT-MEF). We additionally produced reconstituted cells (SMS2 KO/SMS2-MEF). We then compared fatty acid uptake among these cells. The presence of SMS2 clearly elevated oleic acid uptake (Fig. 6A), indicating the importance of SMS2 in fatty acid uptake. However, it is not fully understood whether SMS2 has a function distinct from that of SMS1. In order to completely distinguish SMS2 function from SMS1 function, we generated a new cell line, ZS2, which lacks both SMS1 and SMS2, using mouse embryonic fibroblasts from a SMS1 and 2 double knockout mouse. We then generated reconstituted cell lines by reintroducing the gene encoding SMS1 or SMS2, named ZS2/SMS1 or ZS2/SMS2, respectively. The ZS2 has no SM-synthase activity or SM in the cell, indicating that only SMS1 and SMS2 are synthases for SM at least in mouse fibroblasts (Fig. 6B, C).
Interestingly, although SMS2 exhibits significant SM-synthase activity in vitro (Fig. 6B), it contributes only one-sixth the amount of SM compared to SMS1 (Fig. 6C). This result indicates that ceramide (Cer), a substrate of SM-synthesis, is not efficiently provided to SMS2 in vivo. Newly synthesized Cer on ER is transferred to Golgi by the Cer-transfer protein CERT, to be converted to SM (26). We examined the effect of a CERT-inhibitor HPA-12, on SM-synthesis in each reconstituted cell line. HPA-12 reduced SM-synthesis by about half compared to controls in ZS2/SMS1, agreeing with a previous report (27) (Fig. 6D). However, there was no effect from HPA-12 on SM synthesis in ZS2/SMS2 cells. These results indicate that CERT-dependent SM-synthesis is due to SMS1 activity, and that SMS2 contributes to SM-synthesis in a CERT-independent manner. The next question raised was whether SMS2 could alter where the Cer is produced from. The ZS2/SMS1 and ZS2/SMS2 cells were placed at 4 ºC to stop all active transport in the cell, and the fluorescent analogue of Cer, BODYPY-Cer was added to the medium. After 30 min, rapid conversion of BODIPY-Cer to BODIPY-SM was observed in ZS2/SMS2, but not in ZS2/SMS1 cells (Fig. 6E), indicating the SMS2 acts on the outer leaflet of the cell, the result agrees with previous report (37). To produce Cer on the outer leaflet of the plasma membrane, bacterial sphingomyelinase (SMase) was employed as described previously (38), and the endocytosis for recycling the produced Cer was blocked by the dynamin II-inhibitor dynasore. Interestingly, in ZS2/SMS2 cells, the SM levels were reduced by SMase treatment, but 60 min after removing the SMase, the SM levels had completely recovered (Fig. 6F). In contrast, only moderate recovery after SMase removal was observed in ZS2/SMS1 cells. These results indicate that SMS2 could convert Cer produced at the outer leaflet of the plasma membrane to SM. Moreover the reduction of SM levels after SMase-treatment in ZS2/SMS2 cells was milder than that observed in ZS2/SMS1 cells, indicating that produced Cer will be quickly converted to SM by SMS2. These results clearly show that
by guest on May 24, 2019
http://ww
w.jbc.org/
Dow
nloaded from
9
SMS2 can convert Cer to SM in lipid microdomains on the outer leaflet of the plasma membrane. Altogether, SMS2 was able to regulate the dynamic structure of SM-rich lipid microdomains on the plasma membrane, and could modify protein function, such as that of CD36/FAT or caveolin 1 located in the lipid microdomains. SMS2-knockout mice would exhibit disrupted regulation of the lipid microdomains function, leading to a prevention of lipid droplet formations, fatty liver, obesity, and insulin resistant.
DISCUSSION Recent studies have revealed that exocytosis of acid sphingomyelinase (ASM) by wounded cells promotes endocytosis and plasma membrane repair (39). Thus, the local elevation of Cer on the plasma membrane is important for endocytosis. It is also known that exogenously added bacterial SMase induces ATP-independent endocytosis (40). These studies suggested to us that conversion from SM to Cer causes a structural change in the plasma membrane, and facilitates the formation of endocytotic vesicles. So far, the destiny of produced Cer has not been determined. In this paper, we found that SMS2 could convert Cer to SM on the plasma membrane, indicating that SMS2 can modulate structural changes induced by ASM on the plasma membrane. Since SM is a major component of lipid microdomains, proteins located in these microdomains would be regulated in spatial-temporal manner by conversion of SM to Cer and reconversion of Cer to SM. Indeed, ASM-deficient mice exhibited abnormal lipid microdomains formation, indicating that the conversion of SM to Cer is also
necessary to maintain the homeostasis of these domains (41). Additionally, we found that SMS2 is localized in the membrane lipid microdomains and that it associate with CD36/FAT and caveolin 1 (Fig. 5A, C). Caveolae are responsible for the uptake of lipids or nutrients via caveolae-dependent endocytosis (42), which leading the maturation of lipid droplets (43). Thus, SMS2, caveolin 1, and/or CD36/FAT might act coordinately to drive endocytosis leading to the maturation of lipid droplets. Indeed, SMS2 and CD36/FAT or caveolin 1 are co-localized in intracellular vesicular compartments of the cell (Fig. 5B). SMS2 would modulate the approximal lipid environment of CD36/FAT and caveolin1 in lipid microdomains. Thus, SMS2 deficiency prevents HFD-induced fatty acid uptake and lipid droplet formation, which lead to fatty liver, obesity, and insulin resistance (Fig. 7). At this time, the functional regulation of the microdomains is thought to exclusively account for the modification of proteins such as their phosphorylation, lipidation, or ubiquitinations. Our findings suggest a novel regulation system for lipid microdomains that results from the dynamic modification of lipids on the plasma membrane. In this paper, we demonstrated that SMS2 is involved in fatty liver, obesity, and type 2 diabetes. Arteriosclerosis is also reduced by SMS2 deficiency (11). We also demonstrated that in vivo knock down of SMS2 improved triglyceride accumulation in the livers of ob/ob mice (Fig. 5H). SMS2 inhibitors might be one novel type of pharmaceuticals for obesity and type 2 diabetes, which would modulate lipid microdomain functions, and regulate protein functions in lipid microdomains.
References
1. Hakomori, S. I. (2000) Glycoconj J 17, 143-151 2. Hakomori, S. I. (2010) FEBS Lett 584, 1901-1906 3. Simons, K., and Gerl, M. J. (2010) Nat Rev Mol Cell Biol 11, 688-699 4. Razani, B., Combs, T. P., Wang, X. B., Frank, P. G., Park, D. S., Russell, R. G., Li, M.,
Tang, B., Jelicks, L. A., Scherer, P. E., and Lisanti, M. P. (2002) J Biol Chem 277, 8635-8647
5. Ortegren, U., Aboulaich, N., Ost, A., and Stralfors, P. (2007) Trends Endocrinol Metab 18, 344-349
by guest on May 24, 2019
http://ww
w.jbc.org/
Dow
nloaded from
10
6. Yamaoka, S., Miyaji, M., Kitano, T., Umehara, H., and Okazaki, T. (2004) J Biol Chem 279, 18688-18693
7. Huitema, K., van den Dikkenberg, J., Brouwers, J. F., and Holthuis, J. C. (2004) EMBO J 23, 33-44
8. Tafesse, F. G., Ternes, P., and Holthuis, J. C. (2006) J Biol Chem 281, 29421-29425 9. Vacaru, A. M., Tafesse, F. G., Ternes, P., Kondylis, V., Hermansson, M., Brouwers, J.
F., Somerharju, P., Rabouille, C., and Holthuis, J. C. (2009) J Cell Biol 185, 1013-1027 10. Hailemariam, T. K., Huan, C., Liu, J., Li, Z., Roman, C., Kalbfeisch, M., Bui, H. H.,
Peake, D. A., Kuo, M. S., Cao, G., Wadgaonkar, R., and Jiang, X. C. (2008) Arterioscler Thromb Vasc Biol 28, 1519-1526
11. Liu, J., Huan, C., Chakraborty, M., Zhang, H., Lu, D., Kuo, M. S., Cao, G., and Jiang, X. C. (2009) Circ Res 105, 295-303
12. Fan, Y., Shi, F., Liu, J., Dong, J., Bui, H. H., Peake, D. A., Kuo, M. S., Cao, G., and Jiang, X. C. (2010) Arterioscler Thromb Vasc Biol 30, 2114-2120
13. Hannun, Y. A., and Obeid, L. M. (2008) Nat Rev Mol Cell Biol 9, 139-150 14. Kim, R. H., Takabe, K., Milstien, S., and Spiegel, S. (2009) Biochim Biophys Acta 1791,
692-696 15. Yano, M., Watanabe, K., Yamamoto, T., Ikeda, K., Senokuchi, T., Lu, M., Kadomatsu,
T., Tsukano, H., Ikawa, M., Okabe, M., Yamaoka, S., Okazaki, T., Umehara, H., Gotoh, T., Song, W. J., Node, K., Taguchi, R., Yamagata, K., and Oike, Y. (2011) J Biol Chem, in press
16. Mitsutake, S., Yokose, U., Kato, M., Matsuoka, I., Yoo, J. M., Kim, T. J., Yoo, H. S., Fujimoto, K., Ando, Y., Sugiura, M., Kohama, T., and Igarashi, Y. (2007) Biochem Biophys Res Commun 363, 519-524
17. Dentin, R., Benhamed, F., Hainault, I., Fauveau, V., Foufelle, F., Dyck, J. R., Girard, J., and Postic, C. (2006) Diabetes 55, 2159-2170
18. Ohno, Y., Suto, S., Yamanaka, M., Mizutani, Y., Mitsutake, S., Igarashi, Y., Sassa, T., and Kihara, A. (2010) Proc Natl Acad Sci U S A 107, 18439-18444
19. Houjou, T., Yamatani, K., Nakanishi, H., Imagawa, M., Shimizu, T., and Taguchi, R. (2004) Rapid Commun Mass Spectrom 18, 3123-3130
20. Takagi, S., Tojo, H., Tomita, S., Sano, S., Itami, S., Hara, M., Inoue, S., Horie, K., Kondoh, G., Hosokawa, K., Gonzalez, F. J., and Takeda, J. (2003) J Clin Invest 112, 1372-1382
21. Laemmli, U. K. (1970) Nature 227, 680-685 22. Towbin, H., Staehelin, T., and Gordon, J. (1979) Proc Natl Acad Sci U S A 76,
4350-4354 23. Pohl, J., Ring, A., Korkmaz, U., Ehehalt, R., and Stremmel, W. (2005) Mol Biol Cell 16,
24-31 24. Semple, S. C., Akinc, A., Chen, J., Sandhu, A. P., Mui, B. L., Cho, C. K., Sah, D. W.,
Stebbing, D., Crosley, E. J., Yaworski, E., Hafez, I. M., Dorkin, J. R., Qin, J., Lam, K., Rajeev, K. G., Wong, K. F., Jeffs, L. B., Nechev, L., Eisenhardt, M. L., Jayaraman, M., Kazem, M., Maier, M. A., Srinivasulu, M., Weinstein, M. J., Chen, Q., Alvarez, R., Barros, S. A., De, S., Klimuk, S. K., Borland, T., Kosovrasti, V., Cantley, W. L., Tam, Y. K., Manoharan, M., Ciufolini, M. A., Tracy, M. A., de Fougerolles, A., MacLachlan, I., Cullis, P. R., Madden, T. D., and Hope, M. J. (2010) Nat Biotechnol 28, 172-176
25. Mitsutake, S., Suzuki, C., Akiyama, M., Tsuji, K., Yanagi, T., Shimizu, H., and Igarashi, Y. (2010) J Dermatol Sci 60, 128-129
26. Hanada, K., Kumagai, K., Yasuda, S., Miura, Y., Kawano, M., Fukasawa, M., and Nishijima, M. (2003) Nature 426, 803-809
27. Yasuda, S., Kitagawa, H., Ueno, M., Ishitani, H., Fukasawa, M., Nishijima, M., Kobayashi, S., and Hanada, K. (2001) J Biol Chem 276, 43994-44002
28. Pohl, J., Ring, A., Ehehalt, R., Schulze-Bergkamen, H., Schad, A., Verkade, P., and Stremmel, W. (2004) Biochemistry 43, 4179-4187
by guest on May 24, 2019
http://ww
w.jbc.org/
Dow
nloaded from
11
29. Nagy, L., Tontonoz, P., Alvarez, J. G., Chen, H., and Evans, R. M. (1998) Cell 93, 229-240
30. Ehehalt, R., Sparla, R., Kulaksiz, H., Herrmann, T., Fullekrug, J., and Stremmel, W. (2008) BMC Cell Biol 9, 45
31. Singh, R. D., Puri, V., Valiyaveettil, J. T., Marks, D. L., Bittman, R., and Pagano, R. E. (2003) Molecular biology of the cell 14, 3254-3265
32. Fujimoto, T., Kogo, H., Nomura, R., and Une, T. (2000) Journal of cell science 113 Pt 19, 3509-3517
33. Ring, A., Le Lay, S., Pohl, J., Verkade, P., and Stremmel, W. (2006) Biochim Biophys Acta 1761, 416-423
34. Fernandez, M. A., Albor, C., Ingelmo-Torres, M., Nixon, S. J., Ferguson, C., Kurzchalia, T., Tebar, F., Enrich, C., Parton, R. G., and Pol, A. (2006) Science 313, 1628-1632
35. Liu, J., Zhang, H., Li, Z., Hailemariam, T. K., Chakraborty, M., Jiang, K., Qiu, D., Bui, H. H., Peake, D. A., Kuo, M. S., Wadgaonkar, R., Cao, G., and Jiang, X. C. (2009) Arterioscler Thromb Vasc Biol 29, 850-856
36. Fukasawa, M., Nishijima, M., Itabe, H., Takano, T., and Hanada, K. (2000) The Journal of biological chemistry 275, 34028-34034
37. Ternes, P., Brouwers, J. F., van den Dikkenberg, J., and Holthuis, J. C. (2009) J Lipid Res 50, 2270-2277
38. Mitsutake, S., and Igarashi, Y. (2007) Biochem Biophys Res Commun 359, 622-627 39. Tam, C., Idone, V., Devlin, C., Fernandes, M. C., Flannery, A., He, X., Schuchman, E.,
Tabas, I., and Andrews, N. W. (2010) J Cell Biol 189, 1027-1038 40. Zha, X., Pierini, L. M., Leopold, P. L., Skiba, P. J., Tabas, I., and Maxfield, F. R. (1998)
J Cell Biol 140, 39-47 41. Otterbach, B., and Stoffel, W. (1995) Cell 81, 1053-1061 42. Doherty, G. J., and McMahon, H. T. (2009) Annu Rev Biochem 78, 857-902 43. Farese, R. V., Jr., and Walther, T. C. (2009) Cell 139, 855-860
FOOTNOTES
We are grateful to Dr. Kentaro Hanada (National Institute of Infectious Diseases, Tokyo) for kindly providing HPA12. We also thank Dr. Jinichi Inokuchi (Tohoku Pharmaceutical University, Sendai) for technical advices to adipose research. This work was supported by a Future Drug Discovery and Medical Care Innovation Program from the Ministry of Education, Culture, Sports, Science and Technology of Japan. The abbreviations used are: SMS, sphingomyelin synthase; TG, triglyceride; FA, fatty acid; DIO, diet-induced obesity; HFD, high fat diet; ND, normal diet; GTT, glucose tolerance test; WAT, white adipose tissue; oxLDL, oxidized LDL; PPAR, peroxisome proliferator activated receptor; DIM, detergent-insoluble membrane microdomains.
FIGURE LEGENDS FIGURE 1. Generation of SMS2 KO mice (A) Schematic of targeted disruption of SMS2. The top illustration is a wild type allele; the middle shows the targeting construct with the neomycin-resistant gene (PGK-neo), Diphtheria Toxin A chain gene (DT-A), and nuclear localization signal-LacZ (NLS-LacZ). The bottom illustration shows the allele mutated by homologous recombination. Closed and open arrowheads are corresponding to the primer position to detect wild type (WT) and knockout (KO) alleles, respectively. (B) Confirmation of homologous recombination by LA-PCR using the primers indicated in A. A ladder is 1-kb DNA ladder (M). The primer sets of a & b and d & f were for WT allele, a & c and e & f were for KO allele. (C) RT-PCR was performed for the expression of SMS1, SMS2, and GAPDH in WT and SMS2-KO mice. (D) The amount of
by guest on May 24, 2019
http://ww
w.jbc.org/
Dow
nloaded from
12
sphingomyelin (SM), ceramide (Cer), and phosphatidylcholine (PC) were determined as described in EXPERIMENTAL PROCEDURES. Data are presented as the mean ±S.D. of five distinct mice. *p<0.05 FIGURE 2. SMS2 deficiency improves diet-induced obesity and impaired glucose tolerance (A) Body weight was measured in male wild type (WT) or SMS2-knockout (SMS2 KO) mice fed a high-fat diet (HFD) or normal diet (ND). n = 15-24 mice per group; *p< 0.01 and #p<0.00001 between WT/HFD and SMS2 KO/HFD. (B) Food intake was determined using both HFD-fed and ND-fed groups of WT and SMS2 KO male mice during 7 to 9 weeks of age. Data are presented as the mean ± S.D., using 7 to 8 mice. N.S., not significant. (C) A fasting blood glucose was determined after an 18 h fast. (D) A glucose-tolerance test (GTT) was performed on the mice during the DIO-test. (E) The results of the GTT in D are expressed by the area under the curve (AUG). (F) Plasma insulin levels in 8-week old male mice were determined by ELISA as in EXPERIMENTAL PROCEDURES. C-F, Data are presented as the mean ±S.D. of experiments in 8 to 12 mice; *p< 0.05 between WT/HFD and SMS2 KO/HFD. FIGURE 3. The SMS2 deficiency prevents diet-induced fatty liver formation (A) After the DIO-test, surgical examination of the abdomen and liver of the mice were performed. (B) Oil-Red-O staining was performed using frozen sections of liver. Triglyceride levels in liver (C), plasma levels of free fatty acid (E; FFA), triglyceride (F; TG), and cholesterol (G) were determined as described in EXPERIMENTAL PROCEDURES. (D) The amount of epididymal white adipose tissue (WAT) was also measured. Data are presented as the mean ±S.D. for 9 mice. *p<0.05, #p<0.01, N.S: not significant. FIGURE 4. SMS2 deficiency suppresses diet-induced elevation of CD36/FAT and PPARγ in liver After the DIO-test, RNA was isolated from liver (A) and adipose tissue (B), and Real-time PCR was performed as described in EXPERIMENTAL PROCEDURES using primers listed in Table S1. Data are presented as the mean ±S.D. for 8 mice, *p<0.05. (C and D) Western blotting was performed using liver lysates from each mouse, and the bands corresponding to CD36/FAT were quantified. Data are presented as the mean ±S.D. for 5 mice. *p<0.05. The details of the all experiments were described in EXPERIMENTAL PROCEDURES. FIGURE 5. SMS2 associates with CD36/FAT and caveolin 1, and is involved in lipid droplet formation (A) FLAG-tagged SMS2 and V5-tagged CD36/FAT were co-expressed in COS7 cells, and detergent-insoluble membrane (DIM) fractions were prepared, then each protein was detected by Western blotting. (B) Confocal images of GFP-tagged SMS2 (green), HcRed-tagged CD36/FAT (red), and HcRed-tagged caveolin 1 (red) revealed partial co-localization of SMS2 and CD36/FAT or caveolin 1 (a; yellow; merged image). The COS7 cells that express HcRed-Cav1 or HcReD-CD36 but not express GFP-SMS2 (b). (C) COS7 cells expressing SMS2-V5 and 3XFLAG-CD36/FAT, or SMS2-V5 and 3XFLAG-caveolin 1, were lysed, and a co-precipitation assay was performed using anti-FLAG M2 beads. Proteins were detected by Western blotting as described in EXPERIMENTAL PROCEDURES. (D, E) After the treatment with indicated siRNA in HepG2 cells, the formation of lipid droplets was induced by adding oleic acid to the medium. Lipid droplets were stained with Nile-Red (D), and the number of large lipid droplets (>1.25 µm) were counted using a fluorescent microscope (E). (F) Fatty acid uptake (during 10 minutes) was examined in HepG2 cells after the treatment with indicated siRNA. (G) HepG2 cells were treated overnight with siRNA, then were incubated with 5 mM MeβCD for 24 hours. The viability of the cells was determined using a Cell Counting Kit-8 (Dojindo, Kumamoto, Japan). Data are presented as the mean ±S.D. for three independent experiments. *p<0.05 against control experiment. (H) In vivo silencing of SMS2 in ob/ob mice
by guest on May 24, 2019
http://ww
w.jbc.org/
Dow
nloaded from
13
was performed using a siRNA-delivery system of SNALP. Ten days after injection of siRNA for SMS2 (m-siSMS2-1, m-siRNA2-2), control, or saline, triglyceride levels in liver were determined. Data are presented as the mean ±S.D. for three mice. *p<0.05 against control experiment. The details of the all experiments were described in EXPERIMENTAL PROCEDURES. FIGURE 6. SMS2 can convert ceramide to SM on the outer leaflet of the plasma membrane (A) SMS2-deficient fibroblasts (SMS2 KO-MEF), SMS2-reconstituted fibroblasts (SMS2 KO/SMS2-MEF), and control fibroblasts (WT-MEF) were prepared as described in EXPERIMENTAL PROCEDURES, and fatty acid uptake (during 10 minutes) was examined. (B and C) SM-reconstituted cells ZS2, ZS2/SMS1, and ZS2/SMS2 were established as described in EXPERIMENTAL PROCEDURES, and their in vitro SMS activity (B) and the amount of SM (C) were determined. Prior to the analysis, the cells were cultured with the serum free medium OptiPro SFM (Invitrogen) for 48 hours to exclude the effect of SM supply from serum. (D) The effect of a CERT inhibitor, HPA-12, on SM synthesis in ZS2/SMS1 and ZS2/SMS2 cells was examined as described in EXPERIMENTAL PROCEDURES. (E) Cells were pre-labeled with [14C]Choline, and the bacterial sphingomyelinase (SMase) was added to generate ceramide on the plasma membrane. Recovery of SM in ZS2/SMS1 and ZS2/SMS2 cells was monitored. These experiments contained dynasore, a dynamin II inhibitor, to inhibit ceramide transport from the plasma membrane to the Golgi apparatus. In A, B, C, D, and F, values represent the mean ± S.D. from three independent experiments. *p<0.05, #<0.005. FIGURE 7. SMS2 could be a novel regulator of lipid microdomain structure and function CD36/FAT is located in lipid microdomains. PPARγ is responsible for the expression of CD36/FAT. After HFD-feeding, the increased fatty acid or oxLDL would be incorporated via CD36/FAT, activate PPARγ, and induce the hyper-expression of CD36/FAT, resulting in TG-accumulation and fatty liver. We found that SMS2 is localized in lipid microdomains and that it associates with CD36/FAT and caveolin 1. Furthermore, we clearly demonstrated that SMS2 could convert Cer to SM on the outer leaflet of the plasma membrane. We conclude that SMS2 could be a novel regulator of lipid microdomain structure and function, and the regulation would be crucial for obesity and type 2 diabetes.
by guest on May 24, 2019
http://ww
w.jbc.org/
Dow
nloaded from
B
D
0!
0.5!
1!
1.5!
2!
2.5!
WT! SMS2 KO!
SM (p
mol
/mg
prot
ein)!
C24:1! C16:0!
0!
0.1!
0.2!
0.3!
0.4!
0.5!
WT! SMS2 KO!
Cer
(pm
ol/m
g pr
otei
n)!
C24:1! C16:0!
0!
0.1!
0.2!
0.3!
WT! SMS2 KO!
PC (n
mol
/ug
prot
ein)!
*
WT HE KO M WT HE KO WT HE KO M WT HE KO
1.5 kb 10 kb
Primer set for WT allele! ( a & b; 1.5 kbp )
Primer set for KO allele! ( a & c; 1.5 kbp )
Primer set for WT allele! ( d & f; 10 kbp )
Primer set for KO allele! ( e & f; 10 kbp )
C WT SMS2 KO SMS1 SMS2
GAPDH
a c
Wild type allele!(Sms2 gene)!
Targeting vector!
ATG!
NcoI!
PGK!-neo!
KO allele!
Xho! EcoRV! NcoI! NcoI!ApaI!
Xho!
Nls-LacZ!DT-A!
ApaI!Xho!
PGK!-neo!Nls-LacZ!
ApaI!Xho!ApaI!
NcoI!NcoI!Xho!
1.3kb! 4.6kb! 9.3kb!
A
e f
f a c
d
FIG. 1
by guest on May 24, 2019
http://ww
w.jbc.org/
Dow
nloaded from
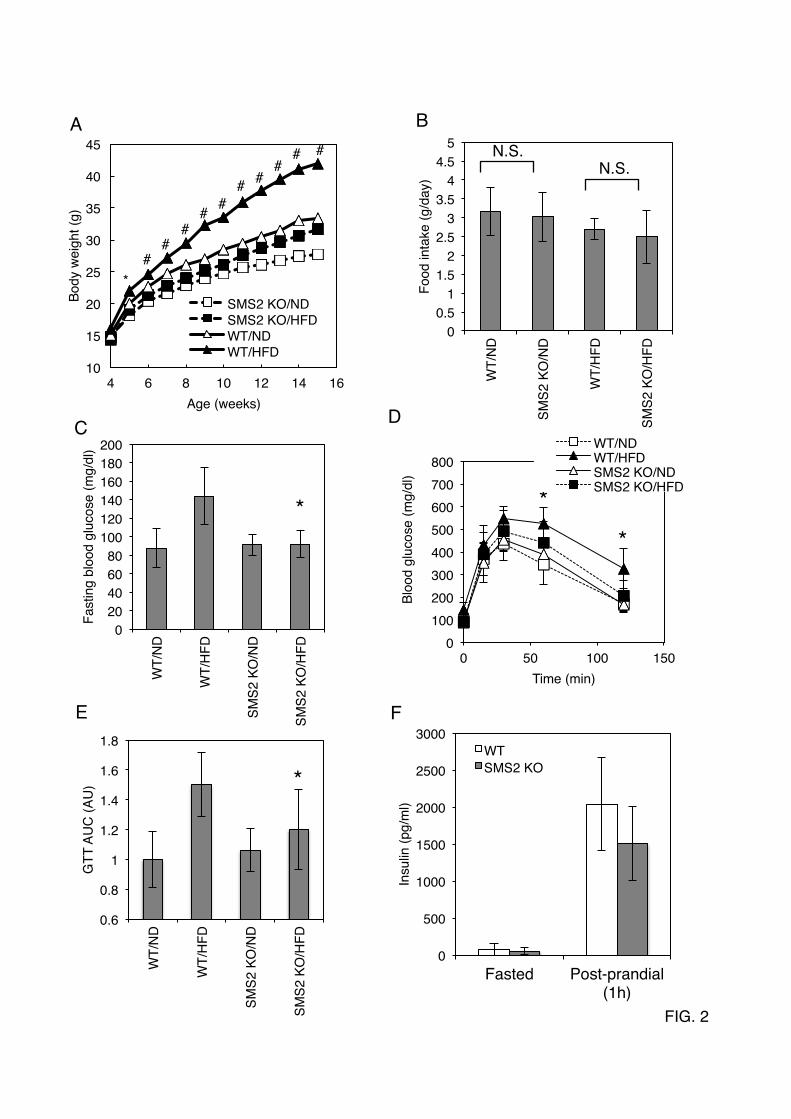
FIG. 2
A B
10!
15!
20!
25!
30!
35!
40!
45!
4! 6! 8! 10! 12! 14! 16!
Body
wei
ght (
g)
Age (weeks)
SMS2 KO/ND !SMS2 KO/HFD !WT/ND !WT/HFD!
* #
0.6!
0.8!
1!
1.2!
1.4!
1.6!
1.8!
WT/
ND!
WT/
HFD
!
SMS2
KO
/ND!
SMS2
KO
/HFD
!
GTT
AU
C (A
U)!
0!
500!
1000!
1500!
2000!
2500!
3000!
Fasted! Post-prandial (1h)!
Insu
lin (p
g/m
l)!
WT!SMS2 KO!
C
E
D
0!20!40!60!80!
100!120!140!160!180!200!
WT/
ND!
WT/
HFD
!
SMS2
KO
/ND!
SMS2
KO
/HFD
!
Fast
ing
bloo
d gl
ucos
e (m
g/dl
)!
F
# #
# # # #
# # #
* *
*
*
N.S. N.S.
0!0.5!
1!1.5!
2!2.5!
3!3.5!
4!4.5!
5!
WT/
ND!
SMS2
KO
/ND!
WT/
HFD
!
SMS2
KO
/HFD
!
Food
inta
ke (g
/day
)!
0!100!200!300!400!500!600!700!800!
0! 50! 100! 150!
Bloo
d gl
ucos
e (m
g/dl
)!
Time (min)!
WT/ND!WT/HFD!SMS2 KO/ND!SMS2 KO/HFD!
SMS2 KO/HFD WT/HFD
0.0 !1.0 !2.0 !3.0 !4.0 !5.0 !6.0 !7.0 !8.0 !
WT/
ND!
WT/
HFD
!
SMS2
KO
/ND!
SMS2
KO
/HFD
!Live
r TG
(mg/
mg-
prot
ein)!
#
N.S.
C D
0!
500!
1000!
1500!
2000!
2500!
WT/
ND!
WT/
HFD
!
SMS2
KO
/ND
!
SMS2
KO
/HFD
!
Epid
idym
al W
AT (m
g)!
A B
0!0.2!0.4!0.6!0.8!
1!1.2!1.4!1.6!1.8!
WT/
ND
!
WT/
HFD
!
SMS2
KO
/ND!
SMS2
KO
/HFD
!
TG (m
M)!
0!
1!
2!
3!
4!
5!
6!
WT/
ND
!
WT/
HFD
!
SMS2
KO
/ND!
SMS2
KO
/HFD
!
Cho
lest
erol
(mM
)!
Total !HDL!LDL,VLDL!
0!
0.5!
1!
1.5!
2!
2.5!
WT/
ND
!
WT/
HFD
!
SMS2
KO
/ND!
SMS2
KO
/HFD
!
FFA
(mM
)!
E F G
* *
*
FIG. 3
WT/ND
WT/HFD SMS2 KO/HFD
SMS2 KO/ND

0!
0.5!
1!
1.5!
2!
2.5!
3!
FABP
-pm
(-fo
ld)!
0!0.5!
1!1.5!
2!2.5!
3!
WT/
ND!
WT/
HFD
!SM
S2 K
O/N
D!
SMS2
KO
/HFD
!
SREB
P-1C
(-fo
ld)
0!0.1!0.2!0.3!0.4!0.5!0.6!0.7!0.8!0.9!
1!
WT/
ND!
WT/
HFD
!SM
S2 K
O/N
D!
SMS2
KO
/HFD
!
FAS
(-fol
d)!
0!
2!
4!
6!
8!
10!
12!
PPAR
γ (-fo
ld)!
0!
1!
2!
3!
4!
5!
CD
36/F
AT (-
fold
)!
0!0.2!0.4!0.6!0.8!
1!1.2!1.4!
WT/
ND!
WT/
HFD
!
SMS2
KO
/ND!
SMS2
KO
/HFD
!
DG
AT1
(-fol
d)!
0!0.2!0.4!0.6!0.8!
1!1.2!1.4!
WT/
ND!
WT/
HFD
!
SMS2
KO
/ND!
SMS2
KO
/HFD
!
DG
AT2
(-fol
d)!
0!
0.5!
1!
1.5!
GLU
T2 (-
fold
)!
A
0!1!2!3!4!5!6!7!8!9!
WT/
ND!
WT/
HFD
!
SMS2
KO
/ND!
SMS2
KO
/HFD
!
MC
P-1
(-fo
ld)!
0.00 !0.20 !0.40 !0.60 !0.80 !1.00 !1.20 !1.40 !
WT/
ND!
WT/
HFD
!
SMS2
KO
/ND!
SMS2
KO
/HFD
!
GLU
T4 (
-fold
)
0!0.2!0.4!0.6!0.8!
1!1.2!1.4!1.6!
WT/
ND!
WT/
HFD
!
SMS2
KO
/ND!
SMS2
KO
/HFD
!
IR (-
fold
)!
0!0.2!0.4!0.6!0.8!
1!1.2!1.4!1.6!1.8!
2!
WT/
ND!
WT/
HFD
!SM
S2 K
O/N
D!
SMS2
KO
/HFD
!
Adip
onec
tin (-
fold
)!
B
IB: CD36 IB: β-actin
C D
WT/
ND
WT/
HFD
SMS2
KO
/HFD
SMS2
KO
/ND
*
* * **
FIG.4
0 0.5
1 1.5
2 2.5
3
WT/
ND
WT/
HFD
SM
S2
KO
/ND
SM
S2
KO
/HFD
CD
36/F
AT p
rote
in
(nor
mal
ized
by β-
actin
)
*
*

A 1 2
B
1 2 3 4 5 6 7 8 9 10
FLAG (SMS2)
V5 (CD36)
caveolin 1
calnexin
IB:
DIM
3 4
IP: FLAG
Total IB: V5
IB: FLAG IP: FLAG
Total
SMS2-V5!3XFLAG-CD36!
3XFLAG-caveolin 1
+ + + + + - - -
- - - +
D
E
h-siSMS2-1 h-siSMS2-2
*!*!
0!
20!
40!
60!
80!
100!
120!
cont
rol!
h-si
SMS2
-1!
h-si
SMS2
-2!N
umbe
r of l
arge
lipi
d dr
ople
ts!
(>1.
25 m
m; p
erce
nt o
f con
trol)!
0!
50!
100!
150!
200!
250!
salin
e!
cont
rol!
m-s
iSM
S2-1!
m-s
iSM
S2-2!
Live
r trig
lyce
ride
(mm
ol/g
tiss
ue)!
* *
FIG. 5
GFP-SMS2 CD36-HcRed
Phase contrast Merge
C
GFP-SMS2 caveolin1-HcRed
Phase contrast Merge
control
F
0!
20!
40!
60!
80!
100!
120!
cont
rol!
h-si
SMS2
-1!
h-si
SMS2
-2!Ole
ic a
cid
upta
ke (%
of c
ontro
l) *!*!
G
0!
20!
40!
60!
80!
100!
120!
cont
rol!
h-si
SMS2
-1!
5 mM MebCD!
Cel
l via
bilit
y (%
of c
ontro
l)
5 mM MeβCD!
H
*
a
b
caveolin1-! HcRed
CD36-HcRed Phase contrast Merge
Merge Phase contrast
A
0!0.01!0.02!0.03!0.04!0.05!0.06!0.07!0.08!0.09!
ZS2/
SMS1!
ZS2/
SMS2!
ZS2!
SMS
activ
ity !
(nm
ol/m
in/m
g-pr
otei
n)!
0!
20!
40!
60!
80!
100!
120!
140!
ZS2/
SMS1!
ZS2/
SMS2!
ZS2!
Sphi
ngom
yelin!
(pm
ol/m
g-pr
otei
n)! C24:1!
C16:0!
B C
50!
60!
70!
80!
90!
100!
110!
cont
rol!
SMas
e!
60 m
in
reco
very!
[14C
] SM
(% o
f con
trol)!
ZS2/SMS1!ZS2/SMS2!0!
20!40!60!80!
100!120!140!
ZS2/
SMS1
con
t!
ZS2/
SMS1
HPA
-12!
ZS2/
SMS2
con
t!
ZS2/
SMS2
HPA
-12!SM
syn
thes
is (
% o
f con
trol)!
D E
#
#
*
FIG. 6
ZS2/
SMS1
ZS2/
SMS2
BODIPY-Cer
BODIPY-SM
F
0!
20!
40!
60!
80!
100!
120!
140!
WT-
MEF
!
SMS2
KO
-MEF
!
SMS2
KO
/SM
S2-
MEF
!
Ole
ic a
cid
upta
ke (p
erce
nt o
f con
trol)!
**
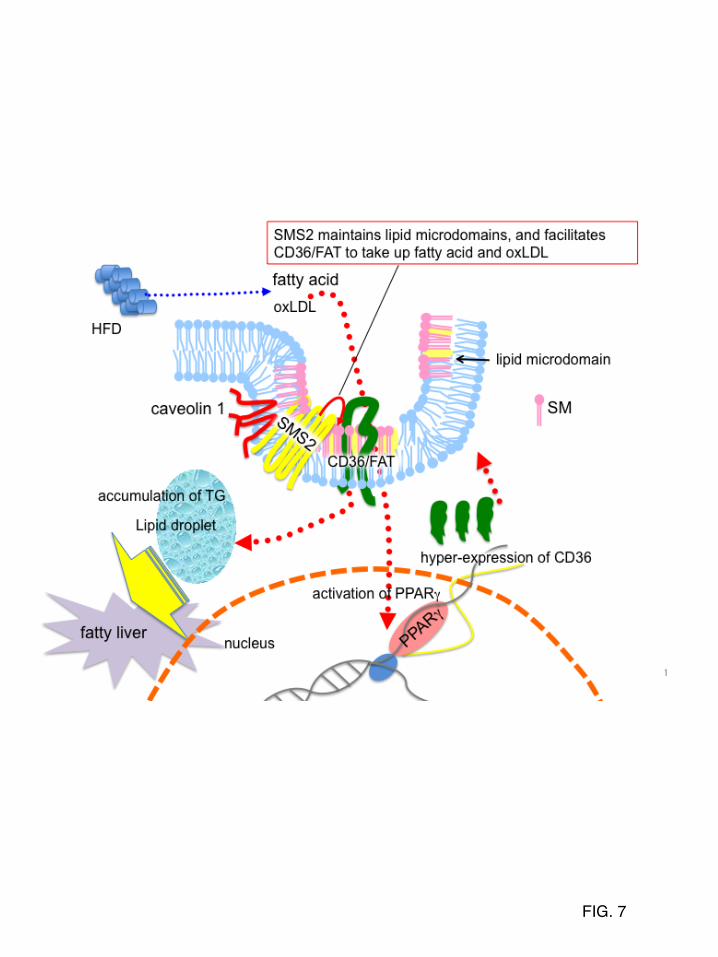
FIG. 7
Takemoto, Toshiro Okazaki, Ken Watanabe and Yasuyuki IgarashiHiroshiMitsui, Masahito Ikawa, Masaru Okabe, Yoshikazu Tanaka, Tadashi Yamashita,
Susumu Mitsutake, Kota Zama, Hazuki Yokota, Tetsuya Yoshida, Miki Tanaka, Masarudevelopment of obesity, fatty liver, and type 2 diabetes
Dynamic modification of sphingomyelin in lipid microdomains controls
published online June 13, 2011J. Biol. Chem.
10.1074/jbc.M111.255646Access the most updated version of this article at doi:
Alerts:
When a correction for this article is posted•
When this article is cited•
to choose from all of JBC's e-mail alertsClick here
Supplemental material:
http://www.jbc.org/content/suppl/2011/06/13/M111.255646.DC1
by guest on May 24, 2019
http://ww
w.jbc.org/
Dow
nloaded from


![Ultrastructure and lipid composition of detergent-resistant ......sphingomyelin (SM) and dipalmitoyl phosphatidyl choline] were used in these model systems and the composition of these](https://img.pdfslide.net/doc/110x75/601030814f7f4358012f9b10/ultrastructure-and-lipid-composition-of-detergent-resistant-sphingomyelin.jpg)