Embed Size (px)
Citation preview

Dynamic Risk Analysis of
Dust Explosions
BY
©Yuan Zhi
A Thesis submitted to the
School of Graduate Studies
in partial fulfillment of the requirements for the degree of
Doctor of Philosophy
Faculty of Engineering and Applied Science
Memorial University of Newfoundland
June 2015
St John’s Newfoundland

To my parents, Changxiu Chen and Douxu Yuan …

i
ABSTRACT
Dust explosion is a continuous threat to equipment safety and human health in process
industries. Although many works have been performed in the context of dust explosion
mechanism and its prevention measures, a comprehensive risk analysis model which can
be applied in various industries is absent. One of the barriers to such a risk model has
been the wide variety of industries threatened by dust explosions, as well as complex and
interlinked contributors to dust explosions. Selecting safety measures satisfying the
requirements of safety regulations and the limitation of budget at the same time has been
another barrier. Moreover, there has not been any work devoted to the propagation of
dust-domino-effects, although it has frequently been reported in process industries.
In this research, dust explosion root causes as well as other features such as ignition
sources have been collected and listed in a comprehensive database. Applying Bow-tie
(BT) diagram, a conventional quantitative risk analysis (QRA) method, a generic model
of risk assessment for dust explosions has been established using the developed database.
In this model, the basic causes contributing to dust explosions are organized according to
their cause-effect relationships. Furthermore, potential consequences of dust explosions
have been analyzed depending on the function/malfunction of relevant safety barriers.
The applicability and efficacy of proposed safety measures to reduce the risk of dust
explosions have also been discussed.
To overcome the limitations of BT such as its inability to model conditional dependencies
and common-cause failures, Bayesian network (BN) has been used in this research to
capture dependencies and to perform diagnostic analysis and sequential learning.

ii
According to the results, dust particle properties, oxygen concentration and lack of safety
training are identified as the most critical root causes leading to dust explosions.
Further, a risk-based methodology has been proposed for cost-effective allocation of
safety measures. Moreover, in this research, the occurrence probabilities of dust
explosions in dust-domino-effects have been estimated based on BN.

iii
ACKNOWLEDGEMENTS
My foremost gratitude goes to my supervisors: Dr. Faisal Khan and Dr. Paul Amyotte.
Thanks for their guidance and help over the four years of my Ph.D. program and towards
the completion of my thesis. Without their impressive encouragements, strategic advice,
consistent supports and enduring patience, this thesis could not have reached its present
form. I would also like to thank my PhD advisor committee member, Dr. Nima Khakzad,
for his valuable suggestions and infinite patience during all the stages of my research.
I also appreciate the Natural Science and Engineering Research Council of Canada
(NSERC) and Vale Research Chair Grant for their financial support throughout my
graduate degree. I also give my thanks to the School of Graduate Studies and the Faculty
of Engineering and Applied Science for their help in my program.
I would like to thank all former and present members of Safety and Risk Engineering
Group, whom I worked with and sought help: Dr. Ming Yang, Dan Chen, and Dr. Refaul
Ferdous. Thank you to all my friends in St John’s for your company during my Ph.D.
program.
I owe my special thanks to my parents for their understanding and continuous support
during my graduate studies. Their selflessness sacrifices encourage me to walk forward.

iv
Table of Contents
ABSTRACT .......................................................................................................................... i
ACKNOWLEDGEMENTS ............................................................................................... iii
Table of Contents ................................................................................................................ iv
List of Tables ....................................................................................................................... x
List of Figures .................................................................................................................. xiii
List of Symbols, Nomenclature or Abbreviations ............................................................ xvi
List of Appendices ............................................................................................................. xx
1 Introduction ....................................................................................................................... 1
1.1 Overview ................................................................................................................. 1
1.2 Dust explosion ........................................................................................................ 2
1.3 Risk assessment methods ........................................................................................ 3
1.4 Safety strategy determination ................................................................................. 4
1.5 Domino effects of dust explosions .......................................................................... 4
1.6 Problem statement ................................................................................................... 5
1.7 Motivation ............................................................................................................... 7
1.7.1 Accident statistics of dust explosions ........................................................... 7
1.7.2 Development of a generic risk analysis model for dust explosions .............. 7
1.7.3 Dynamic risk analysis of dust explosions ..................................................... 8
1.7.4 Optimal safety strategy methodology for dust explosions ............................ 9
1.7.5 Domino effects of dust explosions .............................................................. 10

v
1.8 Organization of this thesis .................................................................................... 11
1.9 References ............................................................................................................. 12
2 Novelty and Contribution ............................................................................................... 17
2.1 Overview ............................................................................................................... 17
2.2 Development of risk analysis model for dust explosions ..................................... 17
2.2.1 Developing a generic risk analysis model for dust explosions based on BT
.............................................................................................................................. 17
2.2.2 Dynamic risk analysis of dust explosions ................................................... 17
2.2.3 Domino effects analysis of dust explosions ................................................ 18
2.3 Modification of safety measures allocation in safety strategy based risk analysis
..................................................................................................................................... 18
3 Literature Review ............................................................................................................ 19
3.1 Dust explosions ..................................................................................................... 19
3.1.1 Mechanism of dust explosions .................................................................... 19
3.1.2 Safety measures for dust explosions ........................................................... 21
3.2 Quantitative risk analysis methods ....................................................................... 22
3.2.1 Fault tree ..................................................................................................... 22
3.2.2 Event tree .................................................................................................... 23
3.2.3 Bow-tie ........................................................................................................ 24
3.2.4 Bayesian network ........................................................................................ 25
3.3 Safety measure strategy determination ................................................................. 28
3.4 Domino effects of dust explosions ........................................................................ 30
3.5 References ............................................................................................................. 32

vi
4 Dust Explosions: a Threat to the Process Industries ....................................................... 40
4.1 Introduction ........................................................................................................... 41
4.2 Information collection of dust explosions ............................................................. 43
4.3 The characteristics of hazardous dust explosion accidents ................................... 45
4.3.1 Spatial distribution of dust explosions ........................................................ 46
3.2 Temporal distribution of dust explosions ...................................................... 48
4.3.3 The trend of fatalities in dust explosion accidents ...................................... 49
4.3.4 Statistic features of combustible dust involved in dust explosions ............. 51
4.3.5 Industrial distribution of dust explosions .................................................... 52
4.3.6 Ignition source for dust explosions ............................................................. 53
4.3.7 Equipment involved in dust explosions ...................................................... 54
4.4. Discussion ............................................................................................................ 58
4.1 Cases mainly distributed in countries/areas with higher industrial output ........... 58
4.2 Trends of dust explosions and casualties per dust explosion ................................ 58
4.5. Conclusion ........................................................................................................... 65
5 Risk-based Design of Safety Measures to Prevent and Mitigate Dust Explosion Hazards
............................................................................................................................................ 75
5.1. Introduction .......................................................................................................... 76
5.2 Background ........................................................................................................... 78
5.2.1 Bow-tie method ........................................................................................... 78
5.2.2 Safety measures .......................................................................................... 79
5.3 Dust explosion causes and consequences ............................................................. 81
5.3.1 Generic fault tree ......................................................................................... 81

vii
5.3.2 Generic event tree ....................................................................................... 87
5.3.3 Generic bow-tie ........................................................................................... 89
5.4 Dust explosion safety assessment ......................................................................... 90
5.4.1 Inventory of safety measures ...................................................................... 90
5.4.2 Implementation of safety measures to bow-tie ........................................... 95
5.5 Application of the methodology to a case study ................................................... 97
5.5.1 Case study ................................................................................................... 97
5.5.2 Bow-tie development .................................................................................. 97
5.5.3 Recommendation of safety measures .......................................................... 99
5.6 Conclusion .......................................................................................................... 102
5.7 Reference ............................................................................................................ 103
6 Risk Analysis of Dust Explosion Scenarios using Bayesian Network Model .............. 108
6.1 Introduction ......................................................................................................... 109
6.2 Background ......................................................................................................... 111
6.2.1 Dust explosion .......................................................................................... 111
6.2.2 Risk analysis methods ............................................................................... 113
6.2.2.1 Bow-tie method ...................................................................................... 113
6.2.2.2. Bayesian Network ................................................................................. 113
6.2.2.3 Mapping Bow-tie to Bayesian Network................................................. 114
6.3 Risk analysis of dust explosions ......................................................................... 115
6.3.1 Dust explosion Bow-tie ............................................................................. 115
6.3.2 Dust explosion Bayesian network ............................................................. 116
6.3.3 Predictive analysis .................................................................................... 119

viii
6.3.4 Risk updating ............................................................................................ 120
6.3.5 Sequential learning .................................................................................... 122
6.4 Application of the methodology ......................................................................... 124
6.5 Conclusions ......................................................................................................... 128
6.6 References ........................................................................................................... 129
7 Risk-based optimal safety measure allocation for dust explosions .............................. 133
7.1 Introduction ......................................................................................................... 135
7.2 Background ......................................................................................................... 137
7.2.1 Bayesian networks .................................................................................... 137
7.2.2 Safety measures ........................................................................................ 138
7.2.3 Potential losses from accidents ................................................................. 140
7.3 Approach for optimal safety strategies for dust explosions ................................ 142
7.4 Case study ........................................................................................................... 152
7.4.1 Introduction ............................................................................................... 153
7.4.2 Optimal safety measures allocation for Hayes Lemmerz dust explosion . 153
7.4.3 Sensitivity analysis .................................................................................... 161
7.5 Conclusions ......................................................................................................... 166
7.6 References ........................................................................................................... 167
8 Domino Effect Analysis of Dust Explosions Using Bayesian Networks ..................... 170
8.1 Introduction ......................................................................................................... 171
8.2 Background ......................................................................................................... 173
8.2.1 Dust explosion mechanism ....................................................................... 173
8.2.2 Domino effects of dust explosions ............................................................ 175

ix
8.2.3 Escalation probabilities ............................................................................. 177
8.2.4 Bayesian network and its application in domino effect analysis .............. 181
8.3 Development of domino effects model of dust explosions .......................... 182
8.4 Case study ........................................................................................................... 186
8.4.1 Introduction ............................................................................................... 186
8.4.2 Domino effect of dust explosions analysis for CTA Acoustics ................ 187
8.5 Conclusions ......................................................................................................... 192
8.6 References ........................................................................................................... 193
9 Conclusions and Future Research ................................................................................. 200
9.1 Conclusions ......................................................................................................... 200
9.1.1 World investigation of dust explosion accidents ...................................... 200
9.1.2 Developing generic risk analysis model for dust explosions .................... 201
9.1.3 Developing dynamic risk analysis model for dust explosions .................. 201
9.1.4 Proposing a methodology of safety measures allocation .......................... 202
9.1.5 Analyzing domino effects of dust explosions ........................................... 202
9.2 Future research .................................................................................................... 203
9.2.1 Extending the scope of hazards identification .......................................... 203
9.2.2 Dealing with uncertainty ........................................................................... 204
9.2.3 Settling multi-objective programming problem ........................................ 204
9.2.4 Introducing risk analysis in domino effects of dust explosions ................ 204
Appendix A ...................................................................................................................... 206

x
List of Tables
Table 5.1 Basic events of generic fault tree in Figure 5.1 (Eckhoff, 2003; Mannan, 2005;
Moss, 2005; Rathnayaka et al., 2011; Eckhoff and Amyotte, 2010) …………………….84
Table 5.2 Intermediate events and undeveloped events of generic fault tree in Figure
5.1. ………………………………………………………………………………….……86
Table 5.3 Safety measures in the context of dust explosion …………………....…….….91
Table 5.4 Examples of Safety Measures …………………………………………...........95
Table 5.5 Probabilities of consequences …………………………………………...........99
Table 5.6 Effects of additional safety measures on basic events of FT of the bow-tie
model …………………………………………………………………………………...100
Table 5.7 Effects of additional safety measures on the ET of bow-tie model …….........101
Table 6.1 Probability of critical event and consequences ………..……..…...…..….......116
Table 6.2 Records of abnormal events in 6 weeks …...…..………………….…............123
Table 6.3 Probabilities of Consequences …...…………………………………….…….126
Table 6.4 Probabilities and updated probabilities of basic events …..…………….........126
Table 7.1 Classification of consequences …...…...…………………………………..…141
Table 7.2. Consequence severity matrix (adopted from Kalantarnia, 2009) ………...…142
Table 7.3 Specific intermediate events added to the risk model of Figure 6.4 ….......…145
Table 7.4 Safety measures for critical factors ………………………...………..............146
Table 7.5 Probabilities of basic events with and without safety measures ………..........148
Table 7.6 Probabilities of critical events and consequences with and without safety
measures ………………………………………………………………………………..148

xi
Table 7.7 Potential losses of CTA Acoustics dust explosion …………………....…..….149
Table 7.8 Risk after application of safety measures and RRI ………………….............149
Table 7.9 OFC and Ci of safety measures ...……...………………………………….…151
Table 7.10 NRRG of safety measures …...………………………………………..........152
Table 7.11 Prior and Posterior Probabilities of Basic Events …..………....…………....155
Table 7.12 Safety measures for potential optimization objects …..…….………………156
Table 7.13 Effects of safety measures on critical events ..………………………...........157
Table 7.14 Probabilities of dust explosion and potential consequences with and without
safety measures …………………………………...……………………………….…....158
Table 7.15 Losses of consequences ...……………………………...……………...........158
Table 7.16 Risk of dust explosion with and without safety measures …...……..............159
Table 7.17 Operation and fixed cost of safety measures ………...…………...…...........160
Table 7.18 NRRG of safety measures ………………..………………….………..........161
Table 7.19 Safety strategy with different costs of SMX3 ………………………….........163
Table 7.20 Safety strategy with different risk reduction index of SMx3 ….…..…..........164
Table 7.21 Safety strategy of different estimation of weighting index ...….……..…….164
Table 7.22 NRRG of SMX3 and Risks under different estimations of importance indices
……………………………………………………..........................................................165
Table 8.1 Probabilities of initial dust explosion and safety barriers in event tree ….......185
Table 8.2 Probabilities of different situations in A2 resulting from initial dust explosion in
A1 ……………………………………………………………………………….............186
Table 8.3 CPT of node A2 ……………...…………………………………………….....186
Table 8.4 Values of Relevant Parameter ………………...……………...……….…...…190

xii
Table 8.5 CPT of A2 in Figure 7 …………………………...…………………………...191
Table 8.6 Occurrence probabilities of dust explosions in different units ………...…….192

xiii
List of Figures
Fig. 3.1 Dust explosion pentagon (Kauffman, 1982) ..……………………....…………..20
Fig.3.2 Structural representation of Bow-tie (BE: Basic event; IE: Intermediate event; CE:
Critical event; C: Consequence; SB: Safety barrier) ..………………………….…..…....24
Fig.3.3 Different definitions of nodes in BNs (A, B and D: Root nodes; C: Intermediate
node; E: Leaf node) ...………………………………………………………………...….26
Fig. 3.4 Probabilities relationships based on the chain rule and local dependencies …....27
Fig. 4.1 Dust explosion numbers in differentcountries ………………….…….…….......46
Fig. 4.2 GDP and industrial output of main industrial countries in the world (2002, 2012,
World bank) ……………………………………………………………………………...47
Fig. 4.3 Number of dust explosions in different time periods …………………....…..….48
Fig. 4.4 Number of dust explosions and industrial outputs in China from 2003 to
2012 ……………………………………………………………………………………...49
Fig. 4.5 Fatalities/injuries per accident in different periods ..……………..…………..…50
Fig. 4.6 Contribution of different dusts to dust explosions ……….………………….….51
Fig. 4.7 Dust explosions in various industrial types ………..……………………....……52
Fig. 4.8 Ignition sources for dust explosions ………………...…..……………................53
Fig. 4.9 Contribution of ignition sources in various industries ………………......….......54
Fig. 4.10 Equipment involved in dust explosions in various industries ………………....57
Fig. 4.11 Academic papers relating to dust explosions in various periods ……..………..59
Fig. 5.1 Generic fault tree of dust explosion including (a) the main part, and (b) transfer
gates ……………………………………………………………………………………...84

xiv
Fig. 5.2 Generic event tree of dust explosion ……………………………...………..…..88
Fig. 5.3 Generic bow-tie of dust explosion. The main fault tree of Fig. 5.1 is shown for
brevity ………………………………………………………………………………...…90
Fig. 5.4 Effects of safety measures on bow-tie …………………………………….........96
Fig. 5.5 Bow-tie of the dust explosion in the wool factory in Vigliano Biellese …....…..98
Fig. 5.6 Effects of additional safety measures in reducing the risk of explosion in the wool
factory ..…………………………………………………………………………..……..100
Fig. 6.1 Mapping BN from BT (Khakzad et al., 2013a) …………………….….............115
Fig. 6.2 Bayesian network model of dust explosions ………………………..…............118
Fig. 6.3 BN of IE26 ………………………………...……………………………...........119
Fig. 6.4 Probability Changes of critical events of dust explosions ………………….…121
Fig. 6.5 Probabilities of dust explosion and catastrophic damages …..…………..….....124
Fig. 6.6 BN Model of Wool Dust Explosion ……………………………………..…….125
Fig. 7.1 Simplified BN showing a marine evacuation scenario (Eleye-Datubo et al.,
2006) ……………………………………………………………………………………138
Fig. 7.2 Recommended preference of safety measures …………………………......….139
Fig. 7.3 Flow chart of the proposed optimization method ……….………………....….143
Fig. 7.4 Risk model of CTA dust explosion ………..…………………………………..144
Fig. 7.5 Critical factors of CTA Acoustics dust explosion ……………..……….…...…146
Fig. 7.6 Layout of equipment (CSB, 2005b) ……………….……………………….….153
Fig. 7.7 Risk analysis model of dust explosion for Hayes Lemmerz …...………..…….154
Fig. 7.8 Risk reduction index of various safety measures ………………………..…….160
Fig. 7.9 Number of safety measures and risks under different budgets ………..…...….162
xv
Fig. 8.1 Dust domino effects mechanism …………………….…………………….…..175
Fig. 8.2 Schematic of possible domino effects given a primary dust explosion in A1. A1,
A2, and A3 are units where dust explosions can occur. Dominant accident scenarios for B1
and B2 are determined as pool fire and VCE, respectively ………………..………..….176
Fig. 8.3 Secondary dust explosion triggered by a primary explosion ……….……....…179
Fig. 8.4 Domino effects of dust explosion based on BN ……………………….…....…185
Fig. 8.5 Simplified layout of CTA facility ………………..……...……………….....….187
Fig. 8.6 Domino effect of dust explosions originating from area around oven on line
405 ……………………………………………………………………………………...189

xvi
List of Symbols, Nomenclature or Abbreviations
Abbreviations
BE: Basic event
BLEVE: Boiling liquid expanding vapour explosion
BN: Bayesian Network
BT: Bow-tie
BP: British Petroleum
C: Consequence
CD: Catastrophic damage
CDC: the US Disease Control and Prevention
CE: Critical event
CFD: Computational Fluid Dynamics
CPT: Conditional probability tables
CSAWS: China State Administration of Work Safety
CSB: The U.S. Chemical Safety Board
DAG: Directed acyclic graph
DEA: Domino effect analysis
E: Evidence
EC: Explosion containment
EI: Explosion isolation
ES: Explosion suppression
EV: Explosion venting

xvii
EVA: Evacuation
ET: Event Tree
FT: Fault Tree
GDP: Gross Domestic Product
HUGIN: Bayesian Network Software Tool
IE: Intermediate Event
LOC: Limiting oxygen concentration
MD: Minor damage
MEC: Minimum explosible concentration
MIE: Minimum ignition energy
MIS: Mishap
MIT: Minimum ignition temperature
NIOSH: National Institute for Occupation Safety and Health
NM: Near miss
NFPA: National Fire Protection Association
NRRG: Net Risk Reduction Gain
OFC: Operation and Fixed Cost
OSHA: the US Occupational Safety & Health Administration
PSA: Probabilistic safety analysis
QRA: Quantitative risk analysis
RRI: Risk reduction index
RC: Regular cleaning
SB: Safety barrier

xviii
SD1: Suitable design
SD: Significant damage
SM: Safety measure
ST: Safety training
TE: Top Event
TM: Tramp metal
VCE: Vapor Cloud Explosion
Symbols
Ad: the area of dust layer
Afloor: min (enclosure floor area, 2000 m2)
AM: Mass of accumulated dust in a unit
C: The bulk density of the dust layer
CB: Budget allocated for the safety strategy
Ci: Cost potential index
Cj: Cost of safety measure j
D: Depth of the dust layer in a target area or unit
H: min (enclosure ceiling height, 12m)
Li: the corresponding losses
Mth: Corresponding threshold value
Pa(Ai): The parents of Ai
Pi: Probability of the i-th consequence
Pmax: Maximum pressure generated from a dust explosion
Pr: Overpressure reaching a dust layer

xix
P(Dp): Probability of dispersion
P(DL): Probability of a dust layer
P(O): Joint probability distribution of variables O
Pmax: Maximum explosion pressure
r: The distance of the target (dust layer in this study) from the vent
Rai: Risk of the system after the application of the i-th safety measure
Rb: Risk of the system before application of safety measures
Rs: The distance of the blast center from the vent
KSt: Maximum rate of pressure rise
Vj: Objective parameter
WR: Available resource
𝛚𝐢: A weighting factor indicating the importance of a particular objective estimated by
decision makers

xx
List of Appendices
Appendex A A part of dust explosions in the world from 1785 to 2012 ………………206

1
1 Introduction
1.1 Overview
Significant losses and damage to humans, assets, and the environment caused by dust
explosions are reported worldwide. The earliest record of dust explosions dates back to
the late 1800s (Eckhoff, 2003) and the most serious reported dust explosion in history
might be the one that occurred in a coal mine in Liaoning province, China, in 1942,
causing 1594 deaths and 246 injuries (Mining-technology, 2014). Accident statistics from
various countries illustrate the worldwide threat of dust explosions in process industries.
According to Yan and Yu (2012), dust explosions in China from 1980 to 2011 caused 518
injuries and 116 deaths. Zheng et al. (2009) collected 106 dust explosions that occurred in
Chinese coal mines from 1949 to 2007. This terrible safety situation due to dust
explosions can also be observed in the U.S. The U.S. Chemical Safety Board (CSB)
collected 197 dust explosions that took place in the U.S. from 1980 to 2005, which were
responsible for 109 fatalities and 592 injuries (CSB, 2006). Among the cases, an
aluminum dust explosion occurred in the Hayes Lemmerz plant, Huntington, Indiana, in
2003, causing 1 death, 6 injuries, and severe damage to equipment (CSB, 2005). The fuel
of this explosion was identified as aluminum dust in a dust collector, where the
combustible dust was probably ignited by heat, impact sparks or burning embers. In the
same year, another dust explosion in West Pharmaceutical Services, Kinston, North
Carolina, claimed 6 lives and caused 38 injuries (CSB, 2004). The CSB believed the
accumulation of combustible dust above a suspended ceiling was the main combustible
source. Also, the ignition of rubber vapor, overheated electrical ballast, an electrical

2
spark, or an electric motor have been the ignition source for the explosion. Reports about
dust explosions can also be seen in other literature (Blair, 2007; Giby and Luca, 2010;
Marmo, et al., 2004; Piccinini, 2008; John and Vorderbrueggen, 2011). Emerging accident
reports worldwide reveal the urgent problem in prevention and mitigation of dust
explosions as well as the imminence requirement for a comprehensive understanding of
dust explosions’ mechanism.
1.2 Dust explosion
The essential factors for a dust explosion can be attributed to combustible dust, oxidants,
ignition sources, mixing and confinement, according to research on the mechanism of
dust explosions. This implies a dust explosion will occur when a suspended combustible
dust cloud in a confined space is ignited (Ebadat, 2007). Among the factors, combustible
dust can be observed in a wide range of process industries (e.g. pharmaceutical
manufacturers). According to the U.S. NFPA (National Fire Protection Association), dust
can be defined as solids 420 μm or less in diameter. For individual material, the diameter
of particle size should be located in its explosible particle size range (Eckhoff, 2003).
Otherwise, dust is considered to be without explosibility. Mixing means the combustible
dust is suspended to form a combustible dust cloud which could be ignited by ignition
sources with enough temperature or energy. Oxidant mainly refers to the oxygen in the
air, and confinement means the spaces where dust explosions occur are confined or
partially confined to enable heat accumulation. To estimate the explosibility of
combustible dust, various factors are applied. The minimum ignition temperature
(MIT, °C) is defined as the temperature above which the combustible dust cloud will be
ignited. A higher MIT indicates the mixture of combustible dust and oxygen is more

3
difficult to ignite. Otherwise, the combustible dust cloud is ignited more easily. Similar to
MIT, the minimum ignition energy (MIE) expresses the energy required to ignite a
combustible dust cloud. Minimum explosible concentration (MEC, g/m3) means a
combustible dust cloud cannot be ignited when its concentration is lower than MEC.
Further, limiting oxygen concentration (LOC) is the amount of the oxidant, above which a
deflagration can occur. Further, the severity of a dust explosion can be represented by
other indicators, such as the maximum explosion pressure (Pmax), with the unit of bar(g),
and the maximum rate of pressure rise, usually represented as KSt (Hassan, 2014).
Moreover, the influence of certain factors on the severity of a dust explosion could also
be observed. For example, Pmax could increase with decreasing particle size and decrease
with increasing moisture content (Lees, 1996).
Compared to other types of explosion, dust explosions can lead to more severe damage.
This results from more combustible dust being involved in a series of dust explosions
triggered by a primary one, which gives rise to higher overpressures and temperatures. It
should also be noted that toxic gases, such as carbon monoxide, as likely byproducts of
dust explosions can noticeably increase the extent and intensity of damage.
1.3 Risk assessment methods
Risk analysis methods can be applied to qualitatively and quantitatively estimate risks of
accidents. The traditional qualitative risk assessment methods, i.e. HAZOP, are mainly
used to screen the possible hazard scenarios in a system. The quantitative risk analysis
(QRA) methods, e.g. Event Tree Analysis (ET), focuses on occurrence probability of
various accident scenarios with different losses. The widely applied QRA methods
include Fault Tree Analysis (FT), Bow-tie Analysis (BT) and Bayesian Network (BN).
4
Although conventional QRA methods are most commonly seen in risk analysis, the
limitations of these methods are in considering common unwanted factors resulting from
the independent assumption among these factors and the dynamic update of risk with the
latest available information from the system (Khakzad et al., 2011). To overcome these
limitations, BN, based on the Bayesian theorem, is introduced and has become a robust
method in risk assessment (Cai et al., 2012; Khakzad et al., 2013a; Khakzad et al., 2013b;
Khakzad et al., 2013c; Hanea and Ale, 2009; Langseth, 2007.).
1.4 Safety strategy determination
Many safety measures have been recommended to prevent dust explosions or mitigate the
damage caused by the explosions. One of the most applied methods to protect units from
dust explosions is venting, which will function when the pressure produced from a dust
explosion is beyond a designed value (Abbasi and Abbasi, 2007; Ferrara et al., 2014.).
Other efficient safety measures include housekeeping (Frank, 2004), containment and
installation of a fire suppression system (Going and Snoeys, 2002), et al. Further, inherent
principles, relying on the properties of materials or design of a process, are also
recommended for dust explosion prevention (Amyotte et al., 2009). For example, solid
inertants are usually mixed with coal dust to reduce its explosibility in coal mines.
Although various safety measures, categorized into different types, are alternatives, the
difficulty is how to select suitable safety measures to efficiently reduce the risks of dust
explosions in a system under the limitations, e.g. the budget.
1.5 Domino effects of dust explosions
Secondary/tertiary dust explosions triggered by the initial ones are usually the main
contributors to the severe losses in an accident due to more combustible dust being

5
involved. The chain of dust explosions is also called the domino effect of dust explosions
which originates from the primary dust explosion. The process of a secondary dust
explosion can be simply illustrated as: When the overpressure produced from an initial
one reaches a dust layer, it could be dispersed to form a combustible dust cloud which
could be ignited by the flames accompanying the overpressure (Abbasi and Abbasi,
2007). Moreover, secondary/tertiary dust explosions are often observed far from the
location where the primary one occurs, which induces difficulties in safety measures’
application. The other concern comes from various accidents potentially triggered by dust
explosions, e.g. toxic gas leakage, which can lead to more serious damage. Depending on
the layouts of equipment in workshops and the working conditions of safety barriers on
the propagation routes, physical effects from dust explosions on various target units might
be different, which further leads to different occurrence probabilities of dust explosions.
1.6 Problem statement
As mentioned, in the academic area of dust explosions, the focus has been mainly on dust
explosion mechanisms (Eckhoff, 2003, 2009; Callé et al., 2005; Amyotte et al., 2005;
Cashdollar and Zlochower, 2007; Pilão et al., 2006; Benedetto et al., 2010) or preventive
and mitigative safety measures (Eckhoff, 2003, 2009; Li et al., 2009; Myers, 2008; Marian
and Rudolf, 2012; Amyotte et al., 2007, 2009). Only a few publications have mentioned
risk analysis of dust explosions (van dert Voort et al., 2007; Abuswer et al., 2013). The
challenges in risk estimation of dust explosions are to include the wide variety of industries
related to dust explosions as well as the complex interlinked contributors. QRA methods,
e.g. fault tree (FT), are widely applied in estimation of occurrence probabilities of accident
scenarios, but in the area related to dust explosions they are seldom seen. To conveniently
6
evaluate the risk of dust explosions in various industries, it is necessary to establish a
generic risk analysis model for dust explosions, which can be tailored to different cases
with or without slight modifications.
Secondly, being static and taking advantage of generic failure data are the main limitations
of conventional risk assessment methods (Meel and Sieder, 2006; Rathnayaka et al., 2010;
Ferdous et al., 2007; Khakzad et al., 2011). Because variations almost always occur during
operational time, the conventional methods with the static structure, such as BT, cannot
easily reflect these changes. This raises the need for a dynamic risk analysis model that can
take varying operational and environmental parameters into consideration and adapt itself
as new observations become available.
Thirdly, a primary dust explosion is usually followed by a secondary or more dust
explosions, which are able to more seriously damage nearby units. In triggering a secondary
dust explosion, both the overpressure and flames from the primary dust explosion play an
important role. A magnitude of overpressure is required with enough strength to disperse
dust layers to form a combustible dust cloud, and the flames should have with enough
energy or a high enough temperature. However, due to the limited knowledge about chain
dust explosions, more research is needed.
Fourthly, though various safety measures have been recommended to prevent or mitigate
dust explosions, the method of estimating their effects is still absent. Further, in
determining safety measures strategies, engineers usually have to choose among various
available safety measures, even for one critical factor, which leads to the discussion about
a preference of safety measures selection. Another dilemma is to balance risk level of dust
explosions in a system and the available resources, e.g. budget. Thus, a reliable

7
methodology considering risk control as well as limited resources is required.
1.7 Motivation
Firstly, in this research, the characteristics of dust explosions in various industries are
investigated and discussed based on a statistical result for dust explosions worldwide.
Another aim in current research is to develop a generic risk analysis model of dust
explosions. To deal with the variety of contributors to dust explosions in systems, a
dynamic risk analysis method, i.e. BN, is also introduced in risk analysis of dust explosions.
Further, optimal methodology of safety strategy determination satisfying the requirements
of risk reductions and the limitation of budgets should be developed to reasonably allocate
resources for safety improvement. Finally, attention should also be paid to analyze the
domino effects of dust explosions. Brief introductions are presented in the following
section.
1.7.1 Accident statistics of dust explosions
Dust explosions in different industries exhibit individual characteristics. The accidents in
some countries during different periods will be gathered first. Based on the statistical
results, the features of dust explosions, i.e. the spatial and temporal distribution, will be
further discussed. To represent individual characteristics in the different economic
structures and safety management levels in developed and developing countries, the U.S.
will be compared with China, the largest developing country in the world.
1.7.2 Development of a generic risk analysis model for dust explosions
BT has already proved to be a reliable and efficient method in risk assessment due to its
ability to combine basic events, critic events, and safety barriers with consequence
categories regardless of its static characteristic. One of the motivations in this research is
8
to introduce the QRA method of BT into the area of risk analysis for dust explosions:
A generic risk assessment model for dust explosions is absent. Although the
essential factors for dust explosions and their sub-level factors (Eckhoff, 2003) are
widely discussed in the literature, interlinks among the factors are needed to be
further teased apart, which will be the basis of the generic risk model of dust
explosions.
BT is composed of an FT on the left and an ET on the right. Taking advantage of
the FT, various factors of dust explosions can be organized according to the cause-
effect relationships. In the ET, safety barriers and their relevant reliabilities are
taken into account to estimate the consequence scenarios resulting from accidents
and relevant occurrence probabilities.
The generic risk analysis model for dust explosions based on conventional BT lacks
the capacity for dynamic analysis. Due to the static characteristic of FTs and ETs,
conventional BTs are difficult to use in dynamic risk analysis using real-time data
obtained from operations.
1.7.3 Dynamic risk analysis of dust explosions
BN has been applied to perform dynamic risk analysis in many areas. Similar to
conventional QRA methods, such as BT, BN can be used in forward probability prediction.
Moreover, other advantages of BN make it a robust method in risk analysis.
By using BN, the vulnerable factors in a system for dust explosion can be
determined by backward analysis. In this step, the latest observed accidents are set
as evidence to renew the probability of each node, called posterior probability, in

9
BN. Based on the posterior probabilities of basic events, the vulnerable parts
needing to be improved can be determined.
The latest information from a system can be introduced into risk estimation using
BN. Taking advantage of probability adapting, the field records describing
abnormal events, such as misoperation, can be applied in the risk analysis model to
increase the accuracy of the results.
1.7.4 Optimal safety strategy methodology for dust explosions
Certainly, the efficiencies of safety measures should be considered first in safety strategy
determination for a system. However, it is not the only factor that needs to be taken into
account. In real cases, the available resources, such as the budget, are other factors which
cannot be ignored. For example, the available budgets for potential safety strategies should
also be satisfied, which means the cost of the safety strategies should be kept within the
budget.
This research also focuses on developing an optimal safety strategy method to reduce the
risk of dust explosions satisfying the limitations of budgets.
The number of available factors is usually huge. The numerous contributors to a
dust explosion increase the difficulty of determining safety strategy. However,
taking advantage of the developed risk analysis model of dust explosions, the
objectives of decision makers can be limited to the most vulnerable parts in a
system.
Efficiencies of safety measures can be estimated by the QRA model of dust
explosions. Based on the developed risk analysis model for dust explosions, the

10
efficacies of individual safety measures or potential safety strategies on risk
reduction can be calculated and compared.
Optimal safety strategy for dust explosion prevention and mitigation needs to be
discussed. The potential safety strategy should satisfy the requirements of both
system risk control and limited budgets. More safety measures’ application can
certainly benefit risk control for dust explosions in a system. However, the total cost
will no doubt increase.
1.7.5 Domino effects of dust explosions
The domino effects of accidents have been widely reported and relevant research has been
published. As five essential factors should be present for a dust explosion to occur, it is
difficult to estimate the physical effects of a dust explosion on nearby units where a
secondary dust explosion might be triggered. In this research, the escalation probability of
a dust explosion will be quantified to benefit domino effect analysis of dust explosions.
The escalation probability of a dust explosion is still absent. The essential factors
of dust explosions could influence the occurrence probability of a secondary dust
explosion. For example, the overpressure received by a dust layer should be strong
enough to arouse the dust layer to form a combustible dust cloud. In this research,
this problem could be addressed with ET, which can represent the dependency of
potential consequences on initial explosions.
Discussion about domino effects of dust explosions is seldom seen. Since a dust
explosion chain is usually observed in real cases, understanding the mechanism of
the dust explosion chain is critical for domino effects analysis of dust explosions

11
and further mitigation of the potential damages. In this research, taking advantage
of BN, the occurrence probability of a dust explosion chain will be analyzed.
1.8 Organization of this thesis
This thesis is organized based on five manuscripts in five different chapters (i.e., Chapters
4, 5, 6, 7 and 8). The outline of each part is presented as follows.
Chapter 1 introduces an overview about dust explosions and risk analysis methods. The
challenges in current research and the motivation of this research are also discussed.
Chapter 2 demonstrates the innovations and contributions of this research. Chapter 3 is
the literature review related to this thesis, including the mechanism of dust explosions, risk
analysis methods, i.e. BT and BN, application of risk analysis in dust explosions, etc.
Five research papers compose Chapter 4, Chapter 5, Chapter 6, Chapter 7 and Chapter
8 respectively, covering the research scope of dust explosion accident statistics, a generic
risk analysis model of dust explosions development, a dynamic risk analysis model of dust
explosions, an optimal safety strategy methodology and domino effects analysis of dust
explosions. Among these papers, four have been published and others have been submitted
for publication in international journals.
Research paper 1
Dust Explosions: a Threat to world Industries (2015). Process Safety and Environmental
Protection, 98(11): 57-71.
Research paper 2
Risk-based Design of Safety Measures to Prevent and Mitigate Dust Explosion Hazards
(2013). Industrial & Engineering Chemistry Research, 52(50):18095-18108.
Research paper 3

12
Risk Analysis of Dust Explosion Scenarios using Bayesian Networks (2015). Risk
Analysis: an international journal, 35(3): 278-291.
Research paper 4
Risk-based optimal safety measure allocation for dust explosions (2015). Safety Science.
74(4): 79-92.
Research paper 5
Domino Effects Analysis of Dust Explosion by Bayesian Networks. (Submitted to
Reliability Engineering & System Safety for publication, 2015)
Chapter 9 reports the summary and conclusions drawn from this research. Prospective
relevant work is also provided at the end of this thesis.
1.9 References
Abbasi, T., Abbasi, A.S., 2007. Dust explosions - Cases, causes, consequences, and control.
Journal of Hazardous Materials 140, 7-44.
Abuswer, A., Amyotte, P., Khan, F., 2013. A quantitative risk management framework for
dust and hybrid mixture explosions. Journal of Loss Prevention in the Process Industries
26, 283-289.
Amyotte, R.P., Pegg. J.M., Khan, I.F., 2009. Application of inherent safety principles to
dust explosion prevention and mitigation. Process safety and environment protection 87,
35-39.
Amyotte, P.R., Basu, A., Khan, F.I., 2005. Dust explosion hazard of pulverized fuel carry-
over. Journal of Hazardous Materials 122, 23-30.
Amyotte, P.R., Pegg, M.J., Khan, F.I., Nifuku, M., Tan, Y.X., 2007. Moderation of dust
explosions. Journal of Loss Prevention in Process Industries 20, 675-687.
13
Benedetto, A.Di., Russo, P., Amyotte, P., Marchand, N., 2010. Modelling the effect of
particle size on dust explosions. Chemical Engineering Science 65, 772-779.
Blair, A.S., 2007. Dust explosion incidents and regulation in the United States. Journal of
Loss Prevention in Process Industries 20, 523-529.
Cashdollar, L.K., Zlochower, A.I., 2007. Explosion temperatures and pressures of metal
and other elemental dust clouds. Journal of Loss Prevention in the Process Industries 20,
337-348.
Cai, B.P., Liu, Y.H., Liu, Z.K., Tian, X.J., Dong, X., Yu, S.L., 2012. Using Bayesian
networks in reliability evaluation for subsea blowout preventer control system. Reliability
Engineering and System Safety 108, 32-41.
Callé, S., Klaba, L., Thomas, D., Perrin, L., Dufaud, O., 2005. Influence of the size
distribution and concentration on wood dust explosion: Experiments and reaction model.
Powder Technology 157, 144-148.
CSB, 2006. Combustible dust hazard study. Investigation No. 2006-H-1. Washington, DC,
November 2006 http://www.csb.gov/assets/1/19/Dust_Final_Report_Website_11-17-
06.pdf (last checked on 15.01.15).
CSB, 2005. Aluminum Dust Explosion. Investigation No. 2004-01-I-IN. Washington, DC,
September, 2005 http://www.csb.gov/assets/1/19/Hayes_Report.pdf (last checked on
15.01.15).
CSB, 2004. Investigation Report: Dust Explosion. Investigation No. 2003-07-I-NC.
Washington, DC, September, 2004 http://www.csb.gov/assets/1/19/CSB_WestReport.pdf
(last checked on 11.03.15).
Ebadat, V., Prugh, R.W., 2007. Case study: Aluminum-Dust Explosion. Process Safety
14
Progress 12, 324-329.
Eckhoff, R.K., 2003. Dust Explosions in the Process Industries, 3rd edition. Elsevier
Science, Burlington, MA.
Eckhoff, R.K., 2009. Understanding dust explosions. The role of powder science and
technology. Journal of Loss Prevention in the Process Industries 22, 105-116.
Ferdous, R., Khan, F., Veitch, B., Amyotte R.P., 2009. Methodology for computer aided
fuzzy fault tree analysis 87, 217-226.
Ferrara, G., Yan, X.Q., Yu J.L., 2014. Dust explosion venting of small vessels at the
elevated static activation overpressure. Powder Technology 261, 250-256.
Frank, W. L., 2004. Dust explosion prevention and the critical importance of housekeeping.
Process safety progress 23, 175-184.
Giby, J., Luca, M., 2010. Case study of a nylon fibre explosion: An example of explosion
risk in a textile plant. Journal of Loss Prevention in Process Industries 23, 106 -111.
Going, J. E., Snoeys, J., 2002. Explosion protection with metal dust fuels. Process safety
progress 21, 305-312.
Hanea, Da., Ale, B., 2009. Risk of human fatality in building fires: A decision tool using
Bayesian networks. Fire safety journal 22, 704-706.
Hassan J., Khan F., Amyotte P., Ferdous R., 2014. A model to assess dust explosion
occurrence probability. Journal of Hazard Materials 268, 140-149.
John, B., Vorderbrueggen, P.E., 2011. Imperial sugar refinery combustible dust explosion
investigation. Process Safety Progress 30, 66-80.
Khakzad, N., Khan, F., Amyotte, P., 2011. Safety analysis in process facilities: Comparison
of fault tree and Bayesian network approaches. Reliability Engineering and System Safety

15
96, 925-932.
Khakzad, N., Khan, F., Amyotte, P., 2013a. Risk-based design of process systems using
discrete-time Bayesian networks. Reliability Engineering and System Safety 109, 5-17.
Khakzad, N., Khan, F., Amyotte, P., Cozzani, V., 2013b. Domino effect analysis using
Bayesian networks. Risk Analysis 33, 292-306.
Khakzad, N., Khan, F., Amyotte, P., 2013c. Quantitative risk analysis of offshore drilling
operations: A Bayesian approach. Safety Science 57, 108-117.
Langseth, H. 2007. Bayesian networks in reliability. Reliability Engineering and System
Safety 92, 92-108.
Lees, P.F., 1996. Loss Prevention in the Process Industries-Hazard Identification,
Assessment and Control, vol. 2, Butterworth-Heinemann, London.
Li, G., Yuan, C.M., Fu, Y., Zhong, Y.P., Chen, B.Z., 2009. Inerting of magnesium dust cloud
with Ar, N2 and CO2. Journal of Hazardous Materials 170, 180-183.
Marian, G., Rudolf, K., 2012. Effectiveness of an active dust and gas explosion suppression
system. Journal of Powder Technologies 92, 1-11.
Marmo, L., Cavallero, D., Debernardi, M.L., 2004. Aluminium dust explosion risk analysis
in metal workings. Journal of Loss Prevention in Process Industries 17, 449-465.
Meel, A., Seider, W.D., 2006. Plant-specific dynamic failure assessment using Bayesian
theory. Chemical Engineering Science 61, 7036–7056.
Mining-technology, 2014. http://www.mining-technology.com/features/feature-world-
worst-coal-mining-disasters-china/ (last checked on 15.01.15).
Myers, T.J., 2008. Reducing aluminum dust explosion hazards: Case study of dust in an
aluminum buffing operation. Journal of Hazardous Materials 159, 72-80.

16
Piccinini, N., 2008. Dust explosion in a wool factory: Origin, dynamics and consequences.
Fire Safety Journal 43, 189-204.
Pilão, R., Ramalho, E., Pinho, C., 2006. Overall characterization of cork dust explosion.
Journal of Hazardous Materials 133, 183-195.
Rathnayaka, S., Khan, F.I., Amyotte, P.R., 2011. SHIPP methodology: Predictive accident
modeling approach. Part I: Methodology and model description. Process Safety and
Environmental Protection 89, 151-164.
van dert Voort, M.M., Klein, A.J.J., de Maaijer, M., van den Berg A.C., J van Deursen, R.,
2007. A quantitative risk assessment tool for the external safety of industrial plants with a
dust explosion hazard. Journal of Loss Prevention in Process Industries 20, 375-386.
Yan, X.Q., Yu, J.L., 2012. Dust explosion incidents in China. Process Safety Progress 31,
187-189.
Zheng, Y. P., Feng, C.G., Jing, G.X., Qian, X.M., Li, X.J., Liu, Y.Z., Huang, P., 2009. A
statistical analysis of coal mine accidents caused by coal dust explosions in China. Safety
Science 22, 528-532.

17
2 Novelty and Contribution
2.1 Overview
The main contribution of this research can be classified into the following categories:
Development of a comprehensive model for risk analysis of dust explosions
Development of a cost-effective safety measure allocation to reduce the risk of dust
explosions
A brief explanation of the novelties and contributions is given in this chapter while more
details can be found in the next chapters.
2.2 Development of risk analysis model for dust explosions
2.2.1 Developing a generic risk analysis model based on BT
In this research, a generic risk analysis model is established using BT. In the generic BT
model, the factors potentially contributing to dust explosions as well as potential
consequences are listed and organized according to the cause-effect relationship. The
generic BT model can readily be tailored to analyze the risk of dust explosions in specific
cases. More details on the generic BT model can be found in Chapter 5.
2.2.2 Dynamic risk analysis
To model conditional dependencies and also to perform probability updating, the generic
BT model of dust explosions is transferred into a BN. Using BN, both probability prediction
and probability updating can be performed. As a result, the most critical factors contributing
to dust explosions can be identified. In addition to probability updating, the BN facilitates
the probability adapting which can be of great importance in sequential (experience)
learning. In Chapter 6, this issue is discussed in more detail.

18
2.2.3 Domino effects analysis
The domino effects of dust explosions are also discussed in this research. To quantify the
escalation probability of initial dust explosions, ET is introduced combining the essential
factors for a dust explosion with its potential consequences. Based on an analysis of
potential propagation routes of escalation vectors, the domino effects analysis model for
dust explosions can be developed using BN. A more detailed description of this innovation
can be found in Chapter 8.
2.3 Modification of safety measures allocation in safety strategy based risk analysis
In this research, a methodology of safety measures allocation for dust explosions,
combining an optimal method and risk analysis model, is proposed. To overcome the
limitation of qualitative analysis, widely used in safety strategy determination, the risk
analysis model of dust explosions is introduced in this method to estimate the effects of
safety measures on risk level of dust explosions in a system. The details about this
contribution are discussed in Chapter 7.

19
3 Literature Review
3.1 Dust explosions
3.1.1 Mechanism of dust explosions
Five factors, including combustible dust, oxidant, ignition source, dispersion of dust
(mixing) and confinement have been proven to be essential for a dust explosion and form
the pentagon of dust explosions shown in Figure 3.1. Among them, combustible dust
widely exists in process industries, such as coal mining and plastic manufacturing and
processing industries, and different definitions of dust can be found for different materials.
For example, dust is defined as having a particle diameter lower than 76 μm according to
BS2955 (CSB, 2006; BS2955, 1958). However, NFPA (National Fire Protection
Association) holds an opinion that a powder 420 μm or less in diameter should be called
dust (NFPA68, 2007). Oxidant usually refers to the oxygen in the air. The mixture of
combustible dust and oxygen in the form of a combustible dust cloud is the necessary
element for a dust explosion. Ignition sources, ranging from hot surfaces to friction sparks,
can provide enough temperature or energy required for a dust explosion. Confinement is
also needed for a dust explosion to accumulate enough heat.

20
Fig. 3.1 Dust explosion pentagon (Kauffman, 1982)
Various indices are applied to measure dust explosibility and the severity of a dust
explosion as aforementioned. And the research in relevant areas is continuously reported.
Kuai et al. (2011) revealed magnesium dust explosion characteristics under different
conditions, e.g. particle size, through experiments. Similarly, Mittal (2013) investigated the
limiting oxygen concentration of Indian coals by experiments. The influence of dust
properties on dust explosion parameters was also discussed (Lees, 1996). For example,
MEC increases with increasing moisture content, and decreases with decreasing particle
size. However, KSt increases with decreasing particle size. Recently, Kuai et al. (2013)
compared explosion behaviors of light metal and carbonaceous dusts triggered by different
ignition energies. Di Benedetto et al. (2010) developed a model to quantify the effect of
particle size on dust reactivity.
Besides the five essential factors listed above, there are a number of primary events,
identified as indirect causes of dust explosions, contributing to the essential ones. Thus, in
hazards assessment of industries prone to dust explosions, determining the primary events
should depend on a variety of factors, involving defects in design, operation and
management. For example, dust accumulation can result from an inefficient ventilation

21
system, which could further be the result of a series of sub-factors, e.g. equipment failure.
Poor housekeeping can also lead to dust accumulation in a system. However, in some
process industries (e.g. silos), dust accumulation is considered as a normal operation
condition. Therefore, hazards should be identified according to the characteristic of
individual processes.
3.1.2 Safety measures for dust explosions
Safety measures for dust explosion prevention or elimination are mainly concentrated on
removing one or more essential factors for dust explosions in a system, and damage
mitigation, also known as safety barriers, refers to reducing potential damage caused by
dust explosions. For prevention safety measures, housekeeping is a typical example, due to
the fuel elimination. Explosion suppression systems, applied to prevent further
development of a dust explosion, are among the commonly used safety barriers. Besides
above, venting system is also an efficient way to reduce damage caused by a dust explosion.
Holbrow (2013) tested reduced dust explosion pressures through small vessels venting and
flameless venting. Yan and Yu (2013) studied the influence of relief pipe diameter and pipe
length on overpressure characteristics of aluminum dust explosions.
Safety measures can be further classified into inherent, engineered and procedural safety
measures according to safety management principles. Inherent safety depends on reducing
the hazards due to the properties of a material or the design of a process. Four key principles
for inherent safety, including minimization, substitution, moderation, and simplification,
have been categorized (Amyotte et al., 2007, 2009; Kletz, 1978, 2003). The principles of
inherent safety are also introduced in dust explosion prevention (Amyotte et al., 2009, 2010,
2012). Among the three types of safety measures, inherent ones are normally considered

22
more reliable than the others which rely on the performance of additional safety devices or
the physical or psychological condition of operators. Engineered safety measures, such as
venting systems, are applied to reduce the frequency of accidents or to lower their severity
via setting additional barriers which could be further divided into passive and active
according to the type of operation (Dianous and Fievez, 2006). For passive safety measures,
no additional activator, actuator or human intervention is required (e.g. explosion relief
vents) whereas active safety measures depend on the function of additional control systems
(e.g. automatic suppression systems). Procedural or administrative safety measures, on the
other hand, rely on management methods to prevent accidents (e.g., training) or mitigate
their damage (e.g., evacuation and emergency response). These safety measures are
influenced by human factors such as safety training effectiveness or human response time.
3.2 Quantitative risk analysis methods
There are many methods for risk assessment of envisaged accident scenarios in the process
industries, such as quantitative risk assessment (QRA), and maximum credible accident
analysis (Khan, 2001; Khan and Abbasi, 1998c). Although these methods consist of
different steps and follow specific procedures, e.g. identifying the accident scenario causing
the most serious damage in maximum credible accident analysis, accident scenario
identification in terms of both mechanism and likelihood is a common and central step for
all of them. Among the different models available to identify and analyze accident scenarios,
the fault tree model (FT), event tree model (ET), and bow-tie model (BT) have been well
proven to be reliable and efficient tools.
3.2.1 Fault tree

23
FT is a diagnostic technique applied for presenting the possible causes contributing to
various sub-events which can result in an undesired event, also known as the top event
(Khan and Abbasi, 2000). An FT can be constructed downwards from the top event and
further details can be dissected according to causality until all primary factors leading to
the top event are known. In an FT, primary events, with binary (two) states, are considered
statistically independent. Various gates are applied to represent the relationships between
events. AND-gates and OR-gates are the two most widely used types among them. FTs can
be used in both qualitative analysis, based on Boolean algebra, and quantitative analysis,
calculating probability of the top event by obtaining the occurrence probabilities of the
primary events.
Usually, computerized methods, i.e. Monte Carlo simulation, are required in analysis of
complex FTs. Fuzzy set theory and evidence theory are also introduced in FT analysis to
reduce the margin of error due to inaccuracy and incompleteness of the data of the primary
events (Ferdous et al., 2009; Markowski et al., 2009; Yuhua and Datao, 2005).
FT has been widely used in estimating occurrence probabilities of unwanted accidents
(Khan et al., 2001b; Volkanovski et al., 2009; Zhang et al., 2014; Lindhe et al., 2009; Chen
et al., 2007). However, for complex systems, especially in which the factors dependent on
each other, the usage of FT is limited.
3.2.2 Event tree
ET, an inductive method, is widely used in safety analysis to assess potential consequence
scenarios caused by accidents. It originates from an unwanted event and analyzes possible
consequences along potential progression routes considering safety barriers in
chronological order. Using occurrence probability of the initiating event, consequence

24
scenarios can be quantified in ET depending on the working situations of safety barriers
(success or failure). When the safety barrier functions, the progression route will follow an
upward branch, otherwise the lower branch when it fails (shown in the Figure 3.2, the ET
part).
ET has been used in the field of accident modeling (Bearfield and Marsh, 2005; Rathnayaka
et al., 2011), dynamic failure assessment (Meel and Seider, 2006), and dynamic risk
assessment (Kalantarnia et al., 2009, 2010).
3.2.3 Bow-tie
Bow-tie (BT), a graphical method, combines FT and ET to explore both the primary causes
and consequences of a critical event. It also provides system reliability if effects of safety
measures are considered (as Figure 3.2. shows).
Fig. 3.2 Structural representation of Bow-tie (BE: Basic event; IE: Intermediate
event; CE: Critical event; C: Consequence; SB: Safety barrier)
A BT illustrates an accident scenario, beginning from the basic events (BE) and ending
with the potential consequences (C). These consequences result from the CE and the failure
of safety barriers (SB). Using the probabilities of primary causes, along with failure

25
likelihoods of safety measures, the probabilities of consequences can be estimated. As
Figure 3.2 shows,
P(C1) = P(CE) ∗ (1 − P(SB1)) ∗ (1 − P(SB2)) (3.1)
where P(CE) is calculated from the FT.
BT has been widely used in the risk analysis area. Dianous and Fiévez (2006) established
a risk assessment methodology based on BT to evaluate the efficacy of risk control
measures. Shahriar et al. (2012) introduced fuzzy theory into BT to analyze the risk of oil
and gas pipelines and provided suggestions for the risk management process. Khakzad et
al. (2012) coupled Bayesian analysis and physical reliability models with a BT diagram for
risk analysis of dust explosions in a sugar refinery. Bellamy et al. (2007) proposed a tool,
called Storybuilder, to identify the dominant patterns of safety barrier failures, barrier task
failures and underlying management flaws using BT. A systematic HAZID method based
on BT, named DyPASI, was suggested by Paltrinieri et al. for a comprehensive hazard
identification of industrial processes (2013). Khakzad et al. (2013a) introduced a
methodology to map BT into a Bayesian network (BN) and applied it to risk analysis.
Despite its wide applications in QRA, BT suffers from a static nature due to FT, and cannot
easily be updated when new information becomes available. However, there have recently
been efforts to overcome this limitation either by coupling BT with Bayesian updating
(Khakzad et al., 2012) or via using more dynamic methods such as Bayesian networks
(Khakzad et al., 2011, 2013a, 2013b).
3.2.4 Bayesian network

26
The Bayesian network (BN) is an inference probabilistic method. It is a directed acyclic
graph (DAG) which is composed of nodes, arcs and conditional probability tables (CPT).
Nodes represent random variables while arcs represent dependencies among linked nodes.
The types and strength of these dependencies are defined via CPTs (Torres-Toledano and
Sucar, 1998).
In BNs, if the direction of an arc is from node A to C, node A is called the parent node of
C. Node C is called a child node of A (as shown in Figure 3.3). The nodes without parent
nodes are called root nodes and the nodes without child nodes are named leaf nodes. The
other nodes are called intermediate nodes, each of which is companied with a CPT.
Fig. 3.3 Different definitions of nodes in BNs (A, B and D: Root nodes; C:
Intermediate node; E: Leaf node)
Another important definition in BN is “d-separation”, which is about the rules of
information transmission among nodes. There are three kinds of connections among nodes:
serial connections, diverging connections and converging connections (shown in Figure
3.4).

27
Fig. 3.4 Probabilities relationships based on the chain rule and local dependencies
As (a) and (b) in Figure 3.4 shows, if the state of B is known, then the chain is blocked and
information from A cannot transmit to C. In this case, A and C are independent, which
signifies that nodes A and C are d-separated given B. For converging connection (Fig. 3.4
(c)), nodes A and C are d-separated when B is unknown.
Based on the conditional independence and the chain rule, BNs represent the joint
probability distribution P(O) of variables O = {A1, A2, A3, … … , An} in BNs as:
P(O) = ∏ P(Ai|Pa(Ai))ni=1 (3.2)
where Pa(Ai) stands for the parents variables of Ai, P(Ai|Pa(Ai)) is the probability of Ai
given its parent variables, and P(O) reflects the properties of the BN (Jensen and Nielsen,
2007).
Based on equation (3.2), the joint probability of variables in BN in Figure 3.3 can be
presented as:
P(E) = P(A)P(B)P(D)P(C|A, B)P(E|C, D) (3.3)

28
BN takes advantage of new information over time (called evidence, represented as E in
equation 3.4), which means BN can be used in risk analysis for dynamic systems, such as
dust explosions. The risk of dust explosions and their potential consequences could be
updated as the system runs and will help to determine the most fragile factors in the system
and relative safety measures.
P(O|E) =P(E|O)
P(E)=
P(E,O)
∑ P(E,O)O (3.4)
In risk analysis for various types of accidents/systems, BN has be proven as a robust method.
Cai et al. (2012) proposed a Bayesian network model to estimate the reliability of a subsea
blowout preventer control system. A new methodology based on the Bayesian network is
proposed by Khakzad et al. (2013b, 2013c) to analyze domino effects and risk in offshore
drilling operations. Zhang et al. (2013) developed a model based on BN to estimate the
safety of the Yangtze River. A general framework for the risk-based reconfiguration of a
safety monitoring system logic of a dynamical system is proposed by Kohda and Cui (2007).
As aforementioned, the other advantage of BN is that it can be developed directly from FT,
ET or BT based on a mapping algorithm (Bobbio et al., 2001; Bearfield and Marsh, 2005;
Khakzad et al., 2011; Khakzad et al., 2013a). This bridges the gap between static and
dynamic risk analysis methods as well as considering the features of BT and BN.
3.3 Safety measure strategy determination
In safety management, risk control for potential hazards is usually the first concern for
decision makers. Ideally, after figuring out the defects of a system, the relevant safety
measures should be chosen to improve the safety level in a system. However, due to the
limited resources, i.e. budgets, not all safety measures can be allocated. Therefore,

29
maximizing the potential safety strategy’s effects on risk control with limited resources is
a big challenge for policy makers.
Some optimizing models have been introduced to benefit decision-making (Kim et al., 2006;
Caputo et al., 2011, 2013; Kazantzi et al., 2013; Bernechea and Arnaldos Viger, 2013;
Ramírez-Marengo et al., 2013), among which the knapsack problem is usually considered
to represent the dilemma of safety strategy allocation. The description of the knapsack
problem originates from the selection methodology of maximizing the total values of
materials put in a bag (the objective) with limited gross weight (the constraint). Therefore,
this kind of problem, the relationship between the objective and resource constraints, can
be expressed as
Maxz = ∑ Vjxjnj=1 (3.5)
s.t.{∑ Wjxj ≤ WR
nj=1
xj = 0 or 1 (j = 1, … , n)
where Vj and Wj stand for the objective parameter, i.e. the value of material j, and the
resource used to obtain the objective parameter, respectively. WR means the available
resource, i.e. the rated weight of the bag. In the knapsack case, when the material j is chosen,
1 will be given to xj, otherwise it equals 0.
The first function, called the objective function, means the goal of the potential strategy is
to maximize the sum of the objective parameter, i.e. the total value of selected materials.
The second function, named the constraint function, stands for the available resources, i.e.
the target weight, which should be considered in decision making.
Although optimizing models have already been applied in safety measure allocation, Cox
(Cox, Jr., 2012) suggested more attention should be given to the optimization of safety

30
management. Caputo et al. (2013) proposed a method based on a multi-criteria knapsack
model to help select the measures with the most efficient in safety management.
Combining the risk matrix with the knapsack model, Reniers and Sörensen (2013)
performed a cost-benefits analysis for determining safety strategy.
3.4 Domino effects of dust explosions
The domino effects of accidents have been widely reported (Gómez-Mares et al., 2008;
Abdolhamidzadeh et al., 2011; Hemmatian et al., 2014; Darbra et al., 2010). According to
the description of a domino event by Cozzani et al. (2006), it is “an accident in which a
primary event propagates to nearby equipment, triggering one or more secondary events
resulting in overall consequences more severe than those of the primary event.” In this
definition, the primary event means the original accident of the domino accidental sequence.
The physical effects of accidents (i.e. pool fire), named escalation vectors and categorized
into radiation, fire impingement, fragments, and overpressure, are responsible for the
escalation of triggering the secondary scenarios, and the relevant thresholds of escalation
vectors are also suggested using experimental data and regression methods for a number of
atmospheric and pressurized units as well as auxiliary equipment (Cozzani et al., 2006).
Generally, only when values of escalation vectors (i.e. radiation) generated from a primary
accident is beyond the relevant thresholds, could damage to secondary units and secondary
accidents occur. For estimating the probability of damage to a target unit, some methods
can be found in this area. Khan and Abbasi (Khan and Abbasi, 1998a, 1998b, 2001)
analyzed the likelihood of domino effects in a cluster of industries based on the developed
methodology, called domino effect analysis (DEA), with DOMIFFECT software. Cozzani
and Salzano (2004a, 2004b, 2004c) discussed the quantitative assessment of domino effects

31
caused by overpressure. Subsequently, Cozzani et al. (2005) developed a quantitative risk
assessment procedure for a domino effect and the impact probability triggered by fragments
was also discussed by Zhang and Chen (2009). A quantitative methodology based on
probabilistic models and physical equations was further proposed by Kadri et al. (2013) to
assess domino effects at industrial sites.
However, research about domino effects of dust explosions is seldom seen, though the
severe consequences of dust explosion chains are widely reported in accident reports (CSB,
2005). Compared to the domino effects of other accidents (i.e. projected fragments), the
mechanism of a secondary dust explosion is more complicated. As aforementioned, the
overpressures from primary dust explosions should have enough strength to arouse dust
layers providing enough dust to form a combustible dust cloud. The ignition sources (the
flame from a primary dust explosion or other existing ignition sources) should also have
enough energy or high enough temperature (Abbasi and Abbasi, 2007).
Propagation probability of flames and blast waves from a dust explosion can be observed
in limited published papers. According to the suggestion from van der Voort et al. (2007),
the propagation probabilities of dust explosions to nearby units can be given as 0.1 and 0.01
for a direct neighbouring module and a remote neighbouring module, respectively. Kosinski
and Hoffmann (2006) revealed that the probability of transmission of an explosion from
one unit to a nearby unit decreases with decreasing diameter and increasing length of the
connecting pipeline, based on simulation results using Computational Fluid Dynamics
(CFD). Zalosh and Greenfield (2014) proposed an empirical equation for calculation of
propagation probability between units based on test data. Besides blast wave propagation
among connected units, attention was also paid to dust lifting by overpressures. Kosinski

32
and Hoffmann (2005) studied the dust lifting behind blast waves using the Lagrangian
model. An experiment for dust lifting caused by a blast wave was also performed by
Klemens et al. (2006). Similarly, Utkilen et al. (2014) simulated dust lifting by strong
pressure waves using the Eulerian-Eulerian method. Based on reviewing the research in
relevant areas, the occurrence probabilities of dust explosions given an initial dust
explosion have not been seen, which will be discussed in section 8.
3.5 References
Abbasi, T., Abbasi, A.S., 2007. Dust explosions - Cases, causes, consequences, and control.
Journal of Hazardous Materials 140, 7-44.
Abdolhamidzadeh, B., Abbasi, T., Rashtchian, D., Abbasi, A.S., 2011. Domino effect in
process-industry accidents – An inventory of past events and identification of some patterns.
Journal of Loss Prevention in the Process Industries 24, 575-593.
Amyotte, P.R., Pegg, M.J., Khan, F.I., Nifuku, M., Tan, Y.X., 2007. Moderation of dust
explosions. Journal of Loss Prevention in Process Industries 20, 675-687.
Amyotte, R.P., Pegg. J.M., Khan, I.F., 2009. Application of inherent safety principles to
dust explosion prevention and mitigation. Process safety and environment protection 87,
35-39.
Bearfield, G., Marsh, W., 2005. Generalizing event trees using Bayesian networks with a
case study of train derailment. Lecture Notes in Computer Science 3688, 52-66.
Bernechea, E.J, Arnaldos Viger, J., 2013. Design optimization of hazardous substance
storage facilities to minimize project risk. Safety Science 51: 49-62.
Bellamy, J.L., Ale, J.M.B., Geyer, A.W.T., Goossens, H.J.L., Hale, R.A., Oh J., Mud, M.,
Bloemhof A., Papazoglou, A.I., Whiston, Y.J., 2007. Storybuilder-A tool for the analysis of

33
accident reports. Reliability Engineering & System Safety. 92, 735-744.
Bobbio, A., Portinale, L., Minichino, M., Ciancamerla, E., 2001. Improving the analysis of
dependable systems by mapping fault trees into Bayesian networks. Journal of Reliability
Engineering and System Safety 71, 249-260.
BS 2955: 1958 Glossary of Terms Relating to powders, No. 505, British Stan. Inst.,
London, 1958.
Cai, B.P., Liu, Y.H., Liu, Z.K., Tian, X. J., Dong, X., Yu, S.L., 2012. Using Bayesian
networks in reliability evaluation for subsea blowout preventer control system. Reliability
Engineering and System Safety 108, 32-41.
Caputo, A. C., Pelagagge, M. P., Palumbo, M., 2011. Economic optimization of industrial
safety measures using genetic algorithms. Journal of Loss Prevention in the Process
Industries 24, 541-551.
Caputo, A. C., Pelagagge, M. P., Salini, P., 2013. A multicriteria knapsack approach to
economic optimization of industrial safety measures. Safety Science 51, 354-360.
Chen, S.K., Ho, T.K.; Mao, B.H., 2007. IET Electric Power Applications 1, 161-172.
CSB, 2005. Aluminum Dust Explosion. Investigation No. 2004-01-I-IN. Washington, DC,
September, 2005 http://www.csb.gov/assets/1/19/Hayes_Report.pdf (last checked on
15.01.15).
Cozzani, V., Gubinelli, G., Salzano, E., 2006. Escalation thresholds in the assessment of
domino accidental events. Journal of Hazardous Materials 129, 1-21.
Cozzani, V., Salzano, E., 2004a. Threshold values for domino effects caused by blast
wave interaction with process equipment. Journal of Loss Prevention in the Process
Industries 17, 437-447.

34
Cozzani, V., Salzano, E., 2004b. The quantitative assessment of domino effects caused by
overpressure: Part I. Probit models. Journal of Hazardous Materials 107, 67-80.
Cozzani, V., Salzano, E., 2004c. The quantitative assessment of domino effect caused by
overpressure: Part II. Case studies. Journal of Hazardous Materials 107, 81-94.
Cozzani, V., Gubinelli, G., Antonioni, G., Spadoni, G., Zanelli, S., 2005. The assessment
of risk caused by domino effect in quantitative area risk analysis. Journal of Hazardous
Materials 127, 14-30.
Cox, L.A.T. Jr., 2012. Evaluating and Improving Risk Formulas for Allocating Limited
Budgets to Expensive Risk-Reduction Opportunities 32, 1244-1252.
Darbra, M.R., Palacios, A., Casal, J., 2010. Domino effect in chemical accidents: Main
features and accident sequences 133, 565-573.
Dianous, V., Fievez, C., 2006. ARAMIS project: A more explicit demonstration of risk
control through the use of bow-tie diagrams and the evaluation of safety barrier
performance. Journal of Hazardous Materials 130, 220-233.
Ferdous, R., Khan, F.I., Veitch, B., Amyotte, P., 2009. Methodology for computer aided
fuzzy FT analysis. Journal of Process safety and Environmental Protection 87, 217-226.
Gómez-Mares, M., Zárate, L., Casal, J., 2008. Jet fires and the domino effect. Fire Safety
Journal 43, 583-588.
Hassan J., Khan F., Amyotte P., Ferdous R., 2014. A model to assess dust explosion
occurrence probability. Journal of Hazard Materials 268, 140-149.
Hemmatian, B., Abdolhamidzadeh, B., Darbra, M.R., Casal, J., 2014. The significance of
domino effect in chemical accidents. Journal of Loss Prevention in the Process Industries
29, 30-38.

35
Jensen F.V., Nielsen T.D., 2007. Bayesian Networks and Decision Graphs, 2nd edition.
New York: Springer.
Kadri, F., Châtelet, E., Chen, G., 2013. Method for quantitative assessment of the domino
effect in industrial sites. Process Safety and Environmental Protection. 91, 452-462.
Kalantarnia, M., Khan, F., Hawboldt, K., 2009. Dynamic risk assessment using failure
assessment and Bayesian theory. Loss Prevention in the Process Industries 22, 600-606.
Kalantarnia, M., Khan, F., Hawboldt, K., 2010. Modeling of BP Texas City refinery
accident using dynamic risk assessment approach. Process Safety and Environmental
Protection Industries 88, 191-199.
Kazantzi, V., EI-Halwagi, A., Kazantzis, N., EI-Halwagi, M.M., 2013. Managing
uncertainties in a safety-constrained process system for solvent selection and usage: An
optimization approach with technical, economic, and risk factors. Clean Technologies and
Environmental Policy 15: 213-224.
Kauffman, C., 1982. Agricultural dust explosions in grain handling facilities, Waterloo:
University of Waterloo Press; p. 305-347.
Khan, I.F., Abbasi, A.S., 2001. An assessment of the likelihood of occurrence, and the
damage potential of domino effect (chain of accidents) in a typical cluster of industries.
Journal of Loss Prevention in the Process Industries 14, 283-306.
Khan, F.I., Abbasi, S.A., 1998a. Models for domino effect analysis in chemical process
industries. Process Safety Progress 17, 107-113;
Khan, F.I., Abbasi, S.A., 1998b. DOMIFFECT (DOMIno eFFECT): a new software for
domino effect analysis in chemical process industries. Environmental Modelling and
Software 13, 163-177.

36
Khan, I.F., 2001. Use maximum-credible accident scenarios for realistic and reliable risk
assessment. Chemical Engineering Progress 11, 56-64.
Khan, F., Abbasi, S.A., 1998c. Techniques and methodologies for risk analysis in chemical
process industries. Journal of Loss Prevention in the Process Industries 11, 261-77.
Khan, F., Abbasi, S.A., 2000. Analytical simulation and PROFAT П: a new methodology
and a computer automated tool for fault tree analysis in chemical process industries. Journal
of Hazardous Materials 75, 1-27.
Khan, I.F., Iqbal, A., Ramesh, N., Abbasi, S.A., 2001b. SCAP: A new methodology for
safety management based on feedback from credible accident-probabilistic fault tree
analysis system. Journal of Hazardous Materials 87, 23-56.
Khakzad, N., Khan, F., Amyotte, P., 2012. Dynamic risk analysis using bow-tie approach.
Reliability Engineering and System Safety 104, 36-44.
Khakzad, N., Khan F., Amyotte, P., 2013a. Dynamic safety analysis of process systems by
mapping bow-tie into Bayesian network. Process Safety and Environmental Protection
91, 46-53.
Khakzad, N., Khan, F., Amyotte, P., 2011. Safety analysis in process facilities:
Comparison of fault tree and Bayesian network approaches. Reliability Engineering and
System Safety 96, 925-932.
Khakzad, N., Khan, F., Amyotte, P., 2013b. Quantitative risk analysis of offshore drilling
operations: A Bayesian approach. Safety Science 57, 108-117.
Khakzad, N., Khan, F., Amyotte, P., Cozzani, V., 2013c. Domino effect analysis using
Bayesian networks. Risk Analysis 33, 292-306.
Kim, D., Kim, J., Moon, П, 2006. Integration of accident scenario generation and
37
multiobjective optimization for safety-cost decision making in chemical processes.
Journal of Loss Prevention in the Process Industries 19, 705-713.
Klemens, R., Zydak, P., Kaluzny, M., Litwin, D., Wolanski, P., 2006. Dynamics of dust
dispersion from the layer behind the propagating shock wave. Journal of Loss Prevention
in the Process Industries 19, 200-209.
Kletz, T. A., 1978. What you don’t have, can’t leak. Chemistry and Industry. pp 287-292.
Kletz, T. A., 2003. Inherently safer design-Its scope and future. Process Safety and
Environmental Protection 81, 401-405.
Kohda, T., Cui, W., 2007. Risk-based reconfiguration of safety monitoring system using
dynamic Bayesian network. Reliability Engineering and System Safety 92, 1716-1723.
Kosinski, P., Hoffmann, C.A., 2005. Modelling of dust lifting using the Lagrangian
approach. International Journal of Multiphase Flow 31, 1097-1115.
Kosinski, P., Hoffmann, C.A., 2006. An investigation of the consequences of primary dust
explosions in interconnected vessels. Journal of Hazardous Materials 137, 752-761.
Lees, P.F., 1996. Loss Prevention in the Process Industries-Hazard Identification,
Assessment and Control, vol. 2, Butterworth-Heinemann, London.
Lindhe, A., Rosén, L., Norberg, T., Bergstedt, O., 2009. Fault tree analysis for integrated
and probabilistic risk analysis of drinking water systems. Water Research 43, 1641-1653.
Markowski, A.S., Mannan, M.S., Bigoszewska, A., 2009. Fuzzy logic for process safety
analysis. Journal of Loss Prevention in the Process Industries 22, 695-702.
Meel, A., Seider, W.D., 2006. Plant-specific dynamic failure assessment using Bayesian
theory. Chemical Engineering Science 61, 7036-7056.
NFPA 68, 2002. Guide for Venting of Deflagrations, National Fire Protection Association.
38
Paltrinieri, N., Tugnoli, A., Buston, J., Wardman, M., Cozzani, V., 2013. Dynamic
Procedure for Atypical Scenarios Identification (DyPASI): A new systematic HAZID tool.
Journal of Loss Prevention in the Process Industries 26, 683-695.
Piccinini, N., 2008. Dust explosion in a wool factory: Origin, dynamics and consequences.
Fire safety Journal 43, 189-204.
Ramírez-Marengo, C., de Lira-Flores, J., López-Molina, A., Vázquez-Román,
R., Carreto-Vázquez, V., Mannan, M., S., 2013. A formulation to optimize the risk
reduction process based on LOPA. Journal of Loss Prevention in the Process Industries
26, 489-494.
Rathnayaka, S., Khan, F., Amyotte, P., 2011b. SHIPP methodology: predictive accident
modeling approach. Part II. Validation with case study. Process Safety and Environmental
Protection 89, 75-88.
Reniers, L.L.G., Sörensen, K., 2013. An approach for optimal allocation of safety resources:
using the knapsack problem to take aggregated cost-efficient preventive measures. Risk
Analysis: An International Journal 33, 2056-2067.
Shahriar, A., Sadiq, R., Tesfamariam, S., 2012. Risk analysis for oil & gas pipelines: A
sustainability assessment approach using fuzzy based bow-tie analysis. Journal of Loss
Prevention in the Process Industries 25, 505-523.
Torres-Toledano, J.G., Sucar. E.L., 1998. Bayesian Networks for reliability analysis of
complex systems. Progress in Artificial Intelligence 1484, 195-206.
Utkilen, H., Balakin, B.V., Kosinski, P., 2014. Numerical study of dust lifting using the
Eulerian-Eulerian approach. Journal of Loss Prevention in Process Industries 27, 89-98.

39
van der Voort, M. M., Klein, J. J. A., Maaijer, de M., Bergvan den A. C.; Deursenvan. J.
R., Versloot N. H. A., 2007. A quantitative risk assessment tool for the external safety of
industrial plants with a dust explosion hazard. Journal of Loss Prevention in Process
Industries 20, 375-386.
Volkanovski, A., Čepin, M., Mavko, B., 2009. Application of the fault tree analysis for
assessment of power system reliability. Reliability Engineering and System Safety 94,
1116-1127.
Yuhua, D., Datao, Y., 2005. Estimation of failure probability of oil and gas transmission
pipelines by fuzzy FT analysis. Journal of Loss Prevention in the Process Industries 18, 83-
88.
Zalosh, R., Greenfield, W., 2014. A probabilistic approach to dust explosion propagation
hazard evaluations. Tenth International Symposium on Hazards, Prevention, and Mitigation
of Industrial Explosions, Bergen, Norway, 10-14.
Zhang, X., Chen, G., 2009. The analysis of domino effect impact probability triggered by
fragments. Safety Science 47, 1026-1032.
Zhang, M., Kecojevic, V., Komljenovic, D., 2014. Investigation of haul truck-related fatal
accidents in surface mining using fault tree analysis. Safety Science 65, 106-117.
Zhang, D., Yan, P.X., Yang, L.Z., Wall, A., Wang, J., 2013. Incorporation of formal safety
assessment and Bayesian network in navigational risk estimation of the Yangtze River.
Reliability Engineering & System Safety 118, 93-105.

40
4 Dust Explosions: a Threat to the Process Industries
Zhi Yuan1, Nima Khakzad1, Faisal Khan1*, Paul Amyotte2
1-Safety and Risk Engineering Group (SREG), Faculty of Engineering & Applied Science,
Memorial University of Newfoundland, St. John's, NL, Canada A1B 3X5
2-Department of Process Engineering & Applied Science, Dalhousie University, Halifax,
NS, Canada B3J 2X4
* Corresponding author: Faisal Khan; [email protected]
Safety and Risk Engineering Group (SREG), Faculty of Engineering & Applied Science,
Memorial University of Newfoundland, St. John's, NL, Canada A1B 3X5
Preface
A version of this manuscript has been published by Process Safety and Environmental
Protection. The first author collected the accidents, analyzed the statistic characters in
various aspects and discussed causes leading to the situations. The co-authors, Dr(s)
Khakzad, Khan and Amyotte supervised and reviewed the methodology, proposed valuable
suggestions and corrections to improve the quality of the manuscript.

41
Abstract
This paper considers more than 2000 dust explosion accidents that occurred worldwide
between 1785 and 2012. The statistical features of these cases are first examined spatially
and temporally. Accident frequencies at different levels of economic development are
further discussed. China and the United States are chosen as examples to represent the
differences in distribution features of dust explosions in countries with different economic
development levels. Data for combustible dusts leading to dust explosions in both China
and the United States are also collected and categorized. The features of ignition sources
for dust explosions, the types of enterprises with high risk, and the critical equipment in
such enterprises are also analyzed. The results could help identify hazards of dust
explosions in various industries, monitor the critical equipment, and further suggest safety
improvement procedures to reduce the probability and damage of dust explosions.
Key words: Dust explosion, Data analysis, Accidents
4.1 Introduction
A dust explosion could be triggered when flammable particulates suspended in air
encounter ignition sources with sufficient energy (Amyotte and Eckhoff, 2010). According
to the Occupational Safety & Health Administration of the US (OSHA), combustible dust
can be considered as combustible materials in finely divided forms. Combustible dust can
be found in the form of byproduct in various industries such as drilled-charcoal powder in
coal mining and wood powder in the wood industry, or in the form of raw materials or
intermediate products such as sugar powder in food processing plants. Aside from high
temperatures and overpressures caused by dust explosions, toxic gases can also be produced

42
in such violent chemical reactions (Eckhoff, 2003). Thus, dust explosions present
significant threats to people, assets, and the environment. Dust explosions have caused
numerous losses in industry (CSB, 2006). The dust explosion that occurred in a coal mine
in Liaoning province, China, in 1942, causing 1594 deaths and 246 injuries, might be the
most serious case in history (Mining-technology, 2014).
According to previous research (Eckhoff, 2003), fuel, oxidant, ignition source, confinement,
and suspension are the essential factors for a dust explosion. For example, Callé et al. (2005)
discussed the effects of size distribution and concentration on wood dust explosion. Various
safety measures have also been proposed to eliminate the foregoing essential factors or
reduce damages caused by dust explosions (Eckhoff, 2003). For instance, altering the
composition of a dust by admixture of solid inertants, recommended by Amyotte et al.
(2009) as an inherent safety measure, can be applied to reduce the reactivity of the dust.
Similarly, effective housekeeping could also be considered a useful method to lower the
probability of dust explosions and their potential damage, because of the elimination of the
accumulated amount of combustible dust in high risk areas (Khakzad et al., 2012).
Also, there has been some research to estimate the occurrence probability and risk of dust
explosions. In this regard, Hassan et al. (2014) proposed a model based on characteristics
of combustible dust (e.g., dust particle diameter). Van der Voort et al. (2007) developed a
quantitative risk assessment tool for dust explosions consisting of a series of sub-models.
More recently, Yuan et al. (2013, 2015) proposed a dust explosion risk analysis model based
on the Bow-tie method and Bayesian network. In the aforementioned methodologies, the
common step is the identification of hazards, which requires wide knowledge of both dust
explosion mechanisms and examination of where the dust explosion takes place. However,

43
in real industrial plants, a large number of potential hazardous factors contributing to dust
explosions cannot usually be enumerated. Learning from past accidents could help identify
frequent hazardous factors as well as vulnerable units in various industries, and thus enforce
monitoring of vulnerable units and prevent dust explosions.
Relevant data for dust explosion accidents can be found in accident reports, literature,
reports from professional agencies, and the mass media. For example, the US Chemical
Safety Board (CSB) collected data for 197 dust explosions that happened in the US from
1980 to 2005, and these accidents were reported to have caused 109 fatalities and 592
injuries collectively (CSB, 2006). Similarly, data for accidental dust explosions in China
from 1980 to 2011 have been collected by Yan and Yu (2012). Zheng, et al (2009) collected
106 dust explosion cases in Chinese coal mines from 1949 to 2007, and analyzed
characteristics of Chinese coal dust explosions. Abbasi et al. (2007) gathered some cases in
2004 and made an attempt to investigate the causes, consequences, and prevention methods
of dust explosions. Also, according to a report from the National Fire Prevention
Association (NFPA) (1957), 1123 dust explosions occurred in the US from 1900 to 1956,
while 426 dust explosions happened in Germany from 1965 to 1985 (Eckhoff, 2003).
This chapter is organized as follows: resources for data collection are introduced in section
4.2. Spatial and temporal features of accidents and casualties, types of combustible dust,
the type of industries involved in dust explosions, ignition sources, and critical equipment
are discussed in section 4.3. In section 4.4, the contributors to the distributions of accidents,
combustible dusts and industries are discussed, while the main conclusions are summarized
in section 4.5.
4.2 Information of dust explosions collection

44
During information collection for the present research, some difficulties were met. First,
the number of reported dust explosions is far below their actual occurrence. According to
Mannan (2004), the gap between the reported and actual numbers decreases as damages
increase, implying that accidents with less damage tend to be more easily neglected by
related agencies, as opposed to those with severe damages. Second, different information
sources may include inconsistent data in terms of casualty and damage even for a similar
accident. Further, reporting time could affect the accuracy of the information. For example,
in many cases, fatalities and injuries may increase with time after an accident happens.
Therefore, seven days following an accident is considered as a term to record losses
resulting from the traffic accidents or fire accidents in China (Government of the People’s
Republic of China, 2007). Also, sometimes factories or governments are suspected to
intentionally under-report consequences of accidents to reduce or escape punishment,
which also leads to inaccurate information (a very serious problem in China). Related
punishment notices for hiding accidents can be found on the website of the China State
Administration of Work Safety (CSAWS). Aside from the above-mentioned problems,
uncertainty also exists throughout the dust explosion investigation process. For example,
assessments of dust explosion origins largely rely on experts’ opinions and experience as
the accident scenes are usually severely damaged. Moreover, it can be observed that some
information (e.g. ignition sources) is absent in accident reports as a result of limited budgets
and human resources, or seriously damaged scenes.
The collected dust explosion accident data in this work are mainly from the following
sources:
Reports and accident statistics from professional organizations and national

45
agencies such as NFPA, CSB, CSAWS and OSHA
Process safety text books presenting dust explosion cases
Academic papers
Local newspapers
Thirteen percent of the collected cases is shown in Appendix A and categorized according
to the following factors:
Date of accident
Country
Type of combustible dust
Equipment involved
Type of industries
Number of injuries and deaths
Ignition source
In Appendix A, metal dust mainly includes aluminum, magnesium, iron and associated
combustible alloy dusts. Flour, corn, sugar dusts, and other combustible edible dusts are
categorized as food dust. The inorganic dust, excluding metal dust and coal dust, includes
the other types of inorganic combustible dust such as sulfur powder.
4.3 The characteristics of hazardous dust explosion accidents
As shown in Appendix A, the collected cases come from a large range of times and
industrial types. Features of dust explosions, such as casualties, vary with individual
countries and periods. Due to the process characteristics of individual industries, various
features can also be observed in ignition source, involved equipment, and so forth.

46
4.3.1 Spatial distribution of dust explosions
Performing statistical analyses, the distribution of dust explosions in various countries is
presented in Figure 4.1.
Fig. 4.1 Dust explosion numbers in different countries
As can be seen from Figure 4.1, the dust explosion reports are mainly from the US, Europe,
Japan, China and Canada. Among them, the number of dust explosions in the US is 1611 -
far more than in other countries. The following is Europe, in which the numbers from
Germany and the UK account for the majority, holding 426 and 411 respectively. In other
European countries, including Norway, Sweden, France, Italy and Spain, the accident
reports are also observed.
One contributor to accident distribution might be differing economic development levels
in different countries, due to the close relationship between dust explosions and
manufacturing activities. The link between economic activities and occupational accidents
has been widely discussed (Van Beeck, et al., 2000; Gerdham and Ruhm, 2006, Wang, 2006;
Song, et al., 2011). In the current work, the Gross Domestic Product (GDP) and industrial
1611
857
195 14057 4 6
0
200
400
600
800
1000
1200
1400
1600
1800
US Europe Japan China Canada India Other
Nu
mb
er
of
du
st e
xplo
sio
ns
Countries
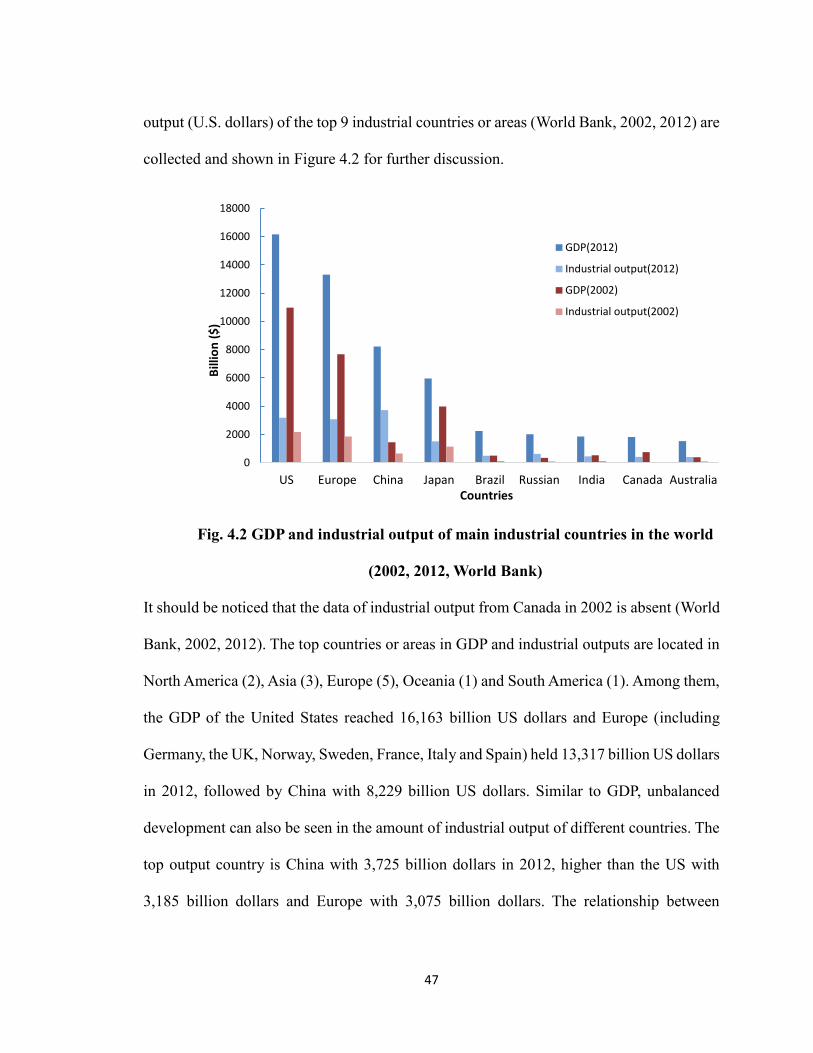
47
output (U.S. dollars) of the top 9 industrial countries or areas (World Bank, 2002, 2012) are
collected and shown in Figure 4.2 for further discussion.
Fig. 4.2 GDP and industrial output of main industrial countries in the world
(2002, 2012, World Bank)
It should be noticed that the data of industrial output from Canada in 2002 is absent (World
Bank, 2002, 2012). The top countries or areas in GDP and industrial outputs are located in
North America (2), Asia (3), Europe (5), Oceania (1) and South America (1). Among them,
the GDP of the United States reached 16,163 billion US dollars and Europe (including
Germany, the UK, Norway, Sweden, France, Italy and Spain) held 13,317 billion US dollars
in 2012, followed by China with 8,229 billion US dollars. Similar to GDP, unbalanced
development can also be seen in the amount of industrial output of different countries. The
top output country is China with 3,725 billion dollars in 2012, higher than the US with
3,185 billion dollars and Europe with 3,075 billion dollars. The relationship between
0
2000
4000
6000
8000
10000
12000
14000
16000
18000
US Europe China Japan Brazil Russian India Canada Australia
Bill
ion
($
)
Countries
GDP(2012)
Industrial output(2012)
GDP(2002)
Industrial output(2002)

48
economy and accidents will be discussed further in section 4.4.
4.3.2 Temporal distribution of dust explosions
The first reported dust explosion accident is possibly a flour explosion in Turin in 1785
(Echhoff, 2003). Subsequently, dust explosions were gradually recognized as accidents
capable of causing severe damage, stimulating research on the mechanisms of dust
explosions and related safety measures to prevent them or to protect plant personnel.
Research regarding combustible dusts and dust explosions inevitably affected the
operations at worksites. The distribution of accidents along with different time periods is
represented in Figure 4.3.
Fig. 4.3 Number of dust explosions in different time periods
The numbers of reported accidents worldwide appears to be generally decreasing with time,
especially over the past 20 years. Compared to 526 reported dust explosions before 1930,
the total number has been reduced to 193 since 2000. Though a spike appears during 1970-
1980, the trend is decreasing, which might result from the continual emergence of safety
0
100
200
300
400
500
600
Nu
mb
er
of
acci
de
nt
Year
World
China
USA

49
management system worldwide. From Figure 4.3, it can also be observed that the number
of reported accidents in China has greatly increased since 1980 from 7 during 1970-1980
to 41 in 1980-1990 to finally 70 since 2000. This might be explained by rising industrial
activities since the Chinese economic reform of the 1980s. The number of dust explosions
and industrial output from 2003 to 2012 in China are depicted in Figure 4. As can be noted,
the number of accidents increased during 2003-2012 along with the increase of industrial
output.
Fig. 4.4 Number of dust explosions and industrial outputs in China from 2003
to 2012
4.3.3 The trend of fatalities in dust explosion accidents
The fatalities and injuries per accident during various periods are provided in Figure 4.5.
0
0.5
1
1.5
2
2.5
3
3.5
4
0
1
2
3
4
5
6
7
8
9
2003 2004 2005 2006 2007 2008 2009 2010 2011 2012In
du
stri
al o
utp
ut
(Tri
llio
n $
)
Nu
mb
er
of
du
st e
xplo
sio
ns
Year
Number of accidents
Industrial output

50
Fig. 4.5 Fatalities/injuries per accident in different periods
The worldwide fatalities per dust explosion decreased from 4.6 before 1930 to 2.9 between
1930 and 1960. However, it increased to 5.0 between 1960 and 1990. After this period, the
downward tendency of casualties reappeared, and the value declined to 4.4. The higher
number of fatalities in developing countries, such as China, might be the main contributor
to the higher rate after 1960. As Figure 4.5 shows, the fatalities per accident in China
reached a high number, 29.8, during 1960 and 1990, which is much higher than the
worldwide level in the same period. Though the rate decreased drastically to 9.2 after 1990,
it is still twice as high as the average level of the world. It should be noted that the lack of
accident reports before 1960 in China made it impossible to calculate the number of
fatalities before 1960. Conversely, fatalities and injuries per dust explosion in the United
0
5
10
15
20
25
30
35
<1930 1930~1960 1960~1990 1990~2012
Fata
litie
s/In
juri
es
pe
r d
ust
exp
losi
on
Fatalities per dust explosion in the world
Injuries per dust explosion of the world
Fatalities per dust explosion in China
Injuries per dust explosion in China
Fatalities per dust explosion in US
Injuries per dust explosion in US

51
States are lower than that of the world in various periods, especially compared to China.
4.3.4 Statistic features of combustible dust involved in dust explosions
Combustible dust leading to dust explosions worldwide can be categorized as displayed in
Figure 4.6a.
a. Dust explosions worldwide
b. Dust explosions in US and China
Fig. 4.6 Contribution of different dusts to dust explosions
As shown in Figure 4.6a, 40% of dust explosions worldwide are caused by food dust, such
as wheat, flour and feed dust. This is an important type of combustible causing explosions
17%
40%7%
9%
10%
3% 10%
4% Wood
Food
Plastic/rubber
Coal
Metal
Inorganic
Other
unknown
16%
7%
10%
3%46%
7%
11%
US
Wood
Plastic/Rubber
Metal
Inorganic
Food
Coal
Other
7%7%
14%
3%
27%
35%
7%
China
Wood
Plastic/Rubber
Metal
Inorganic
Food
Coal
Other
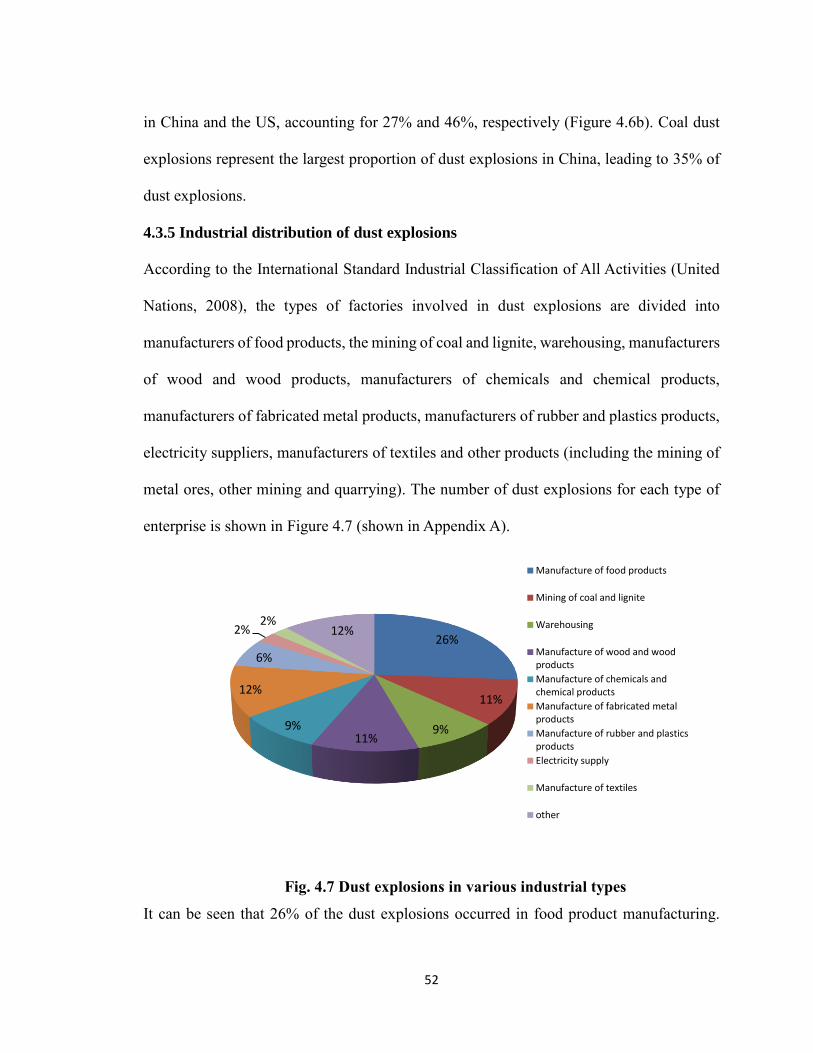
52
in China and the US, accounting for 27% and 46%, respectively (Figure 4.6b). Coal dust
explosions represent the largest proportion of dust explosions in China, leading to 35% of
dust explosions.
4.3.5 Industrial distribution of dust explosions
According to the International Standard Industrial Classification of All Activities (United
Nations, 2008), the types of factories involved in dust explosions are divided into
manufacturers of food products, the mining of coal and lignite, warehousing, manufacturers
of wood and wood products, manufacturers of chemicals and chemical products,
manufacturers of fabricated metal products, manufacturers of rubber and plastics products,
electricity suppliers, manufacturers of textiles and other products (including the mining of
metal ores, other mining and quarrying). The number of dust explosions for each type of
enterprise is shown in Figure 4.7 (shown in Appendix A).
Fig. 4.7 Dust explosions in various industrial types
It can be seen that 26% of the dust explosions occurred in food product manufacturing.
26%
11%
9%11%
9%
12%
6%
2%2%
12%
Manufacture of food products
Mining of coal and lignite
Warehousing
Manufacture of wood and woodproducts
Manufacture of chemicals andchemical products
Manufacture of fabricated metalproducts
Manufacture of rubber and plasticsproducts
Electricity supply
Manufacture of textiles
other

53
Other industries with high risk of dust explosions are also represented in Figure 4.7.
Compared with the statistical results of dust explosions in the US from 1980 to 2005
(Joseph and CSB Hazard Investigation Team, 2007), aforementioned important industrial
types, except coal and lignite mining, are also the critical areas which are more easily
threatened by dust explosions in the US.
4.3.6 Ignition source for dust explosions
Ignition sources, as an essential element of dust explosions, are divided into eight types:
flame and direct heat, hot work, electrical sparks, static electricity, impact sparks, self-
heating and smoldering, friction sparks, and hot surfaces (Abbasi and Abbasi, 2007), which
are also listed in Appendix A. The contribution of each type has been depicted in Figure
4.8.
Fig. 4.8 Ignition sources for dust explosions
As shown in Figure 4.8, flame and direct heat, accounting for 22% of the data set, is the
largest category of ignition sources contributing to dust explosions. Further ignition sources
22%
7%
8%
6%20%
10%
12%
6%
9%
Flame and direct heat
Hot work
Electrical sparks
Static electricity
Impact sparks
Self-heating and smoldering
Friction saprks
Hot surfaces
Other
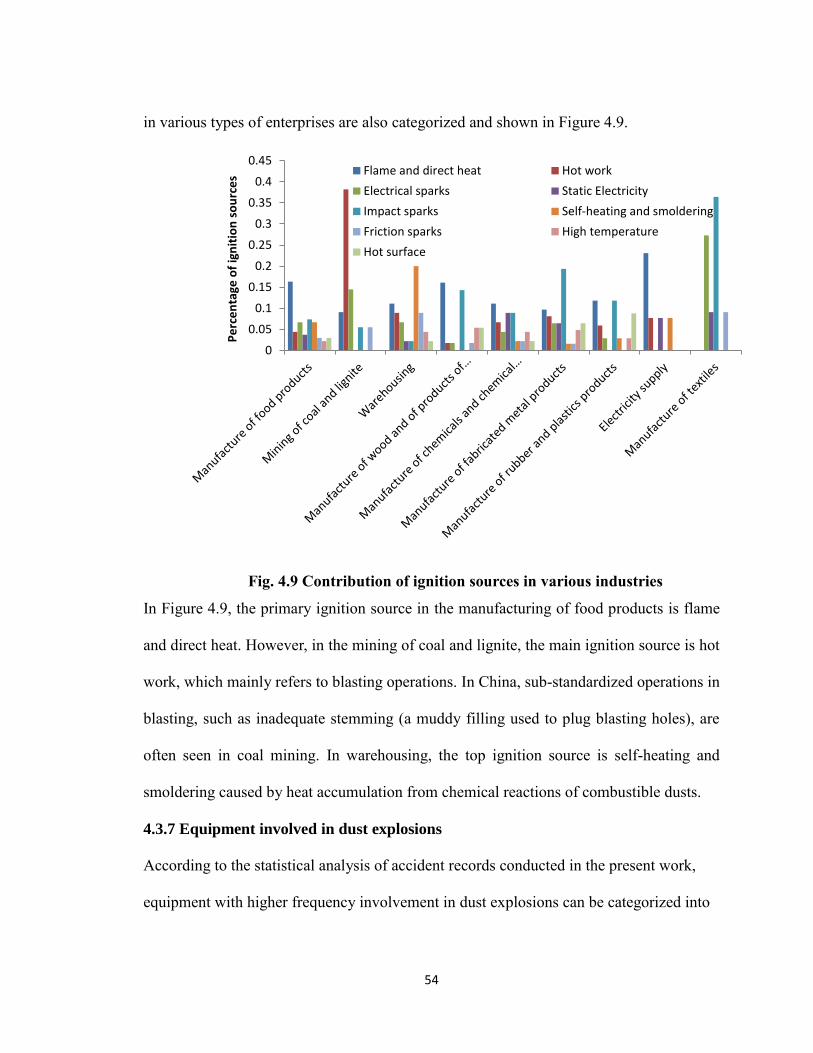
54
in various types of enterprises are also categorized and shown in Figure 4.9.
Fig. 4.9 Contribution of ignition sources in various industries
In Figure 4.9, the primary ignition source in the manufacturing of food products is flame
and direct heat. However, in the mining of coal and lignite, the main ignition source is hot
work, which mainly refers to blasting operations. In China, sub-standardized operations in
blasting, such as inadequate stemming (a muddy filling used to plug blasting holes), are
often seen in coal mining. In warehousing, the top ignition source is self-heating and
smoldering caused by heat accumulation from chemical reactions of combustible dusts.
4.3.7 Equipment involved in dust explosions
According to the statistical analysis of accident records conducted in the present work,
equipment with higher frequency involvement in dust explosions can be categorized into
0
0.05
0.1
0.15
0.2
0.25
0.3
0.35
0.4
0.45
Pe
rce
nta
ge o
f ig
nit
ion
so
urc
es Flame and direct heat Hot work
Electrical sparks Static Electricity
Impact sparks Self-heating and smoldering
Friction sparks High temperature
Hot surface

55
silos/bunkers, dust collecting systems, milling and crushing plants, conveying systems,
dryers, furnaces, mixing plants, grinding and polishing plants and others. The proportion
of each type of equipment is depicted in Figure 4.10a. Because of the differences in
production processes of various industries, different distributive characteristics can be
observed for respective critical equipment. Therefore, in this paper, the critical equipment
is also categorized according to individual industries with high risks of dust explosions
based on the results of Section 4.3.5. The results are presented in Figure 4.10b.
a. Equipment involved in dust explosions
14%
17%
12%
17%
5%
13%
5%
9%
8%
Silos/Bunkers
Dust collecting systems
Milling and crushing plants
Conveying systems
Dryers
Furnances
Mixing plants
Grinding and polishing plants
Others
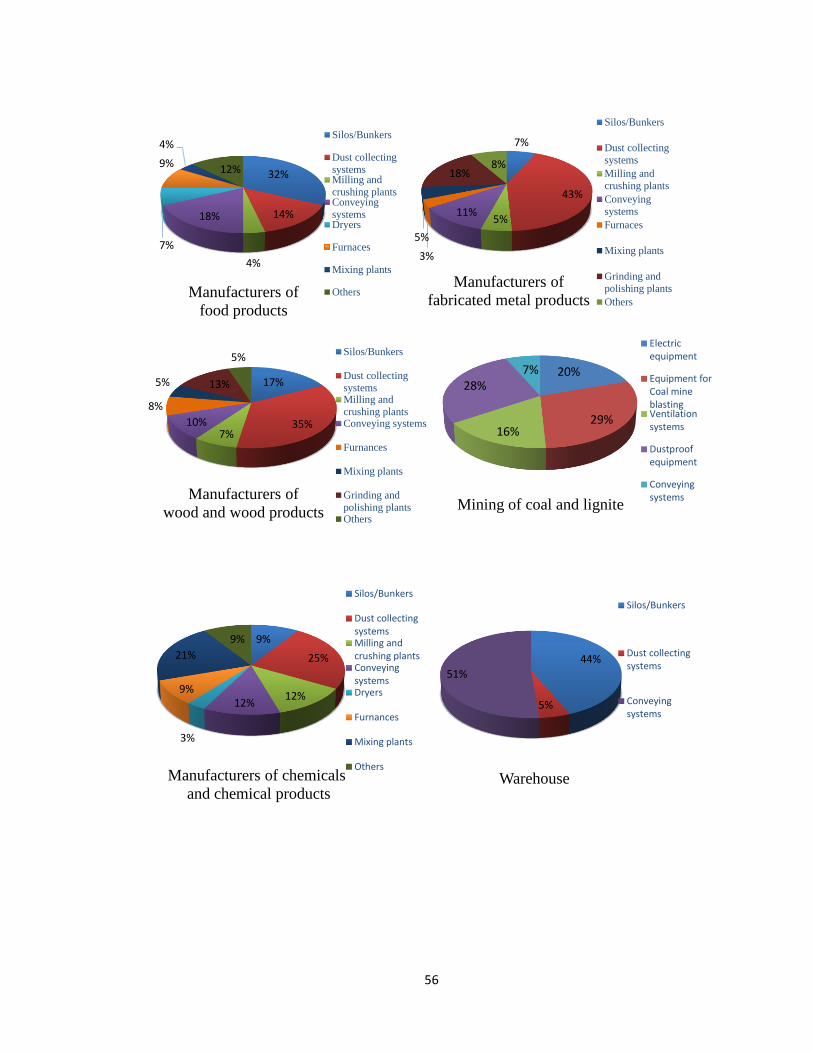
56
32%
14%
4%
18%
7%
9%
4%
12%
Manufacturers of
food products
Silos/Bunkers
Dust collecting
systemsMilling and
crushing plantsConveying
systemsDryers
Furnaces
Mixing plants
Others
7%
43%
5%11%
3%
5%
18%8%
Manufacturers of
fabricated metal products
Silos/Bunkers
Dust collecting
systems
Milling and
crushing plants
Conveying
systems
Furnaces
Mixing plants
Grinding and
polishing plants
Others
17%
35%7%
10%
8%
5% 13%
5%
Manufacturers of
wood and wood products
Silos/Bunkers
Dust collecting
systemsMilling and
crushing plantsConveying systems
Furnances
Mixing plants
Grinding and
polishing plantsOthers
20%
29%16%
28%7%
Mining of coal and lignite
Electricequipment
Equipment forCoal mineblastingVentilationsystems
Dustproofequipment
Conveyingsystems
9%
25%
12%12%
3%
9%
21%
9%
Manufacturers of chemicals
and chemical products
Silos/Bunkers
Dust collectingsystemsMilling andcrushing plantsConveyingsystemsDryers
Furnances
Mixing plants
Others
44%
5%
51%
Warehouse
Silos/Bunkers
Dust collectingsystems
Conveyingsystems

57
b. Equipment involved in various types of enterprises
Fig. 4.10 Equipment involved in dust explosions in various industries
As can be seen from Figure 4.10a, the critical equipment having the most contribution to
dust explosions are dust collecting systems and conveying systems. The critical equipment
in different industries is also represented in Figure 4.10b.
The techniques in either coal mining or warehouses differ from other types of industries.
As mentioned above, coal mining belongs to the mineral mining industry, and is involved
with fewer chemical reactions. Most dust explosions occur in underground roadways,
especially during blasting operations. So the equipment which is used in blasting, such as
detonators, accounts for the highest proportion, 29%, of the total number. Moreover,
dustproof systems, reported to be damaged in different degrees before or after dust
explosions accidents, are involved in 28% of accidents in mining coal and lignite. Another
critical unit in coal mining is electrical equipment or cable, which is reportedly participating
in 20% of dust explosions. On the other hand, warehouses are mainly used to store raw
materials or intermediate products, which is a simpler process compared to other types of
enterprises. Therefore, the diversity of equipment involved in warehouses is less than in
other industries. According to the statistical result, the conveying system is involved in dust
11%
26%
26%
8%
22%
7%
Manufacturers of rubber
and plastic products
Silos/Bunkers
Dust collectingsystemsMilling andcrushing plantsConveyingsystemsMixing plants
Others

58
explosions in more than half the cases, followed by silos and/or bunkers.
4.4. Discussion
4.4.1 Cases mainly distributed in countries/areas with higher industrial output
According to the statistical results, the majority of accidents are reported in the countries
with higher industrial output, such as the US, Germany, the UK, Japan and China, because
dust explosions are closely related to industrial activities. The other reason might be the
relatively well-organized systems of accident reporting and research in these countries,
which provide analysis with a more abundant and detailed inventory of accident records.
One typical example is the U.S. Occupational Safety & Health Administration (OSHA),
which provides not only standards and regulations about health and safety but also statistics
of occupational accidents (OSHA, 2013). Similar agencies can also be found in other
industrial countries. However, a large number of dust explosions are still missed or
unreported. According to the estimation by Eckhoff (2003), around 160 dust explosions
each year happened in Germany from 1965 to 1985, which means the total number of
accidents could be as high as 3200, but only 426 accidents were reported during the same
period as determined in the current work. Regardless of the huge gap between the number
of reported and actual dust explosions, the reported data could help to better understand the
mechanisms of dust explosions and further effectively prevent accidents.
4.4.2 Trends of dust explosions and casualties per dust explosion
Despite a limited statistical sample, the decreasing tendency of dust explosions numbers
can be seen from the analysis (Figure 4.3). The accident reduction could result from the
growing understanding about the mechanisms of dust explosions (Kauffman, 1982.;
Eckhoff, 1984, 1986, 1995, 2009; Edwards and Prugh, 1987; Dahoe, 1996; Benedetto et

59
al., 2010; Amyotte et al., 2006), the progress of prevention measures (Craven and Foster,
1967; Frank, 2004; Amyotte et al., 2009; Holbrow and Tyldesley, 2003; Going and
Lombardo, 2007; Amyotte et al., 2010; Eckhoff, 1996), and continuous research interest
in dust explosions. With the help of the Engineering Village database, the number of
published academic papers (journal papers in English only) relating to dust explosions in
various periods are collected (Figure 4.11). The number of academic papers about dust
explosions has vastly increased since 1990.
Fig. 4.11 Academic papers relating to dust explosions in various periods
However, in some countries or during a specific period, the increasing tendency of dust
explosions can be related to well-organized accident reporting systems. For example, a
spike of dust explosion number is observed during 1970 and 1980 as shown in Figure 4.3.
Another typical example is China, where there has been established a series of regulations
and laws about production safety and accident reporting (Duan et al., 2011), in order to
help prevent illegal activities such as purposely concealing accidents. This in turn has led
to a large number of reported dust explosions after 2000. Furthermore, considering the
0
100
200
300
400
500
600
700
800
900
1000
<1930 1930~1960 1960~1990 1990~2012
Nu
mb
er
Year
60
influence of the economy on occupational accidents at a national level (Song et al., 2011),
the number of dust explosions grew with the increasing industrial output in China (Figure
4.4). According to the five stages of production safety defined by Wang (2006), China is
estimated to be in the middle stage of industrialization with fluctuation in a high level of
safety accidents and with the positive relationship with economic development (Duan et
al., 2011).
Decreasing tendencies can also be found in both fatalities and injuries per dust explosion
before 1960. However, after 1960, the trend of either fatalities or injuries per dust
explosion has increased which is mainly caused by the accidents with severe damages in
developing countries, especially China. As Figure 5 shows, between 1960 and 1990, the
fatalities per dust explosion in China reached a very high level of 29.8, which is far higher
than the world average level in the same period. If the cases from developing countries
are left out of the analysis, the fatalities per dust explosion in the developed industrial
countries are greatly reduced to 0.8. After 1990, the fatalities per accident decreased to
4.4 worldwide, and this decrease also benefits from the reduction of fatalities per accident
in developing countries.
4.4.3 Contributors to the difference in the casualties between China and the United
States
Examining the casualties per dust explosion during various periods in China, it is obvious
that they are far higher than the world average levels in the same periods, whereas the
casualty levels in the U. S. are always much lower than worldwide. Many factors could
contribute to the enormous differences between China and the United States. Firstly, they
have different levels of safety management. As pointed out by Feng and Chen (2013), the

61
safety management level in the US is in a relatively mature stage characterized by the
priority of production safety, compared to China’s developing stage with the feature of
improving investment in safety. For production safety inputs, mainly in safety equipment
updating and safety training, in the two countries, there are huge differences too. The
budget for safety research at the National Institute for Occupation Safety and Health
(NIOSH) and the Center for Disease Control and Prevention (CDC) in the United States
is 208 times larger than for safety research in China in 2012 (Feng and Chen, 2013). At
the same time, according to the Fiscal Year of the Occupational Safety and Health
Administration (OSHA), 10.71 million dollars was used in safety training in 2012 and the
spending increased to 10.77 million dollars in 2013 (United States Department of Labor,
2014). However, a separate list of safety training budgets is not found in the Fiscal Year
of the China State Administration of Work Safety (2013). Finally, the gap between safety
supervision in China and the United States is also enormous. According to statistical
results by Duan et al. (2011), almost 90% of chemical accidents happened in small
enterprises between 2000 and 2006 in China. Enterprises, especially smaller ones, usually
lack the motivation to improve safety measures for workers because of the huge
investment required and the indirect benefits. Meanwhile, the lack of effective
supervision by relevant official departments or their indifferent enforcement worsened the
situation. However, for developed countries, like the US, there are a series of strict
regulations like NFPA 61, 69, 86 and 654, and laws (OSHA) in an attempt to assure
employers provide safe workplaces and also that enterprises use safety supervision at
different levels, from firms and independent organizations to local governments.
4.4.4 Distributions of combustible dusts and factories involved in dust explosions

62
The distributions of combustible dusts and factories involved in dust explosions largely
depend on the industrial structures of specific countries. As shown in Figures 6 and 7, a
large part of combustible dust leading to dust explosions can be classified as food dust.
Similarly, in the analysis of industries with high risk of dust explosions, food processing
or production is characterized as having the highest risk. This could be due to the high
output of the food industry. For example, the output value of food manufacturing and the
related processing is 8.3% of the total industrial output in China in 2011 (Statistical
Yearbook of China industrial economy, 2011). Similarly, the food industry accounts for
11.5% of industrial output in the US in 2012 (U.S. Department of Commerce, 2013).
Further, other important industry types with high output include chemicals and chemical
products manufacturing, electrical machinery and communication and computer, plastic
or rubber manufacturing, wood and wood products manufacturing, coal mining and
washing industries, which also have higher dust explosion risks, according to the
statistical results. It should be noted that the output of the coal mining and washing
industry only accounts for 3.4% of industrial output in China (Statistical Yearbook of
China industrial economy, 2011), but coal dust contributes to 35% of dust explosions,
which illustrates the severe lack of safety in coal production in China. High dependence
on coal for energy consumption is one of the main causes of dust explosions in China. As
Zheng et al. (2009) argue, the percentage of coal in total energy consumption is higher
than 70% in China. Furthermore, from BP Statistical Review of World Energy (BP, 2013),
coal production and consumption in China account for 47.5% and 50.2% of the world’s
coal production and consumption, respectively, in 2012. Both of the percentages are far
higher than any other country.

63
4.4.5 Distributions of ignition sources in various industries
Flame and direct heat, the most commonly seen ignition sources in dust explosions, could
originate from lamps, open lanterns, nearby explosions or unsuitable heating methods in
production. With the growing understanding of dust explosion mechanisms, lighting
equipment with potential to cause open fires, such as lamps and open lanterns, has been
prohibited by relevant regulations in areas with a high risk of dust explosions.
Meanwhile, safety barriers, such as the screw conveyor (Eckhoff, 2003), are proposed to
be installed between hazardous sources to isolate the propagation of fires and pressures
from nearby explosions. Next to flame and direct heat, impact sparks occupies the second
highest proportion in all kinds of ignition sources. They could be caused by many factors,
such as mechanical failure or tramp metal. The other ignition sources with higher
frequencies in dust explosions include friction sparks, self-heating and smoldering,
electrical sparks, hot work, static electricity and hot surfaces.
Further, the ignition sources appear to vary in different industries, as depicted in Figure
4.9. In food product manufacturing, flame and direct heat - the most commonly seen
ignition source - are mainly from heating equipment in different processes, such as drying
processes. A similar situation can also be found in other areas, such as wood and wood
product manufacturing, electricity supply, and chemicals and chemical product
manufacturing. However, in coal mining, as explosion accidents frequently occur during
blasting operations, hot work is the most frequent ignition source, especially in China
(Zheng, et al., 2009). In warehouses, with the heat coming from exothermic reactions, the
temperatures could increase beyond the threshold of self-ignition when warehouses have
no, or malfunctioning, suitable temperature control systems. As a result, the stored

64
combustible dust might be ignited, leading to more serious accidents.
4.4.6 The critical equipment involved in dust explosions
The statistical result regarding critical equipment shows that equipment that is managing
combustible dusts, such as ventilation systems, or equipment which are a potential
ignition sources themselves, such as dryers, are more often involved in dust explosions.
According to the analysis, the dust collecting system and conveying system are the two
most critical pieces of equipment for dust explosions, which is similar with the analysis
results from the Federal Republic Germany (Abbasi and Abbasi, 2007). One reason is that
these two systems are widely applied in various industries (Klinzing et al., 2010;
Piccinini, 2008; CSB, 2005). The other reason is that combustible dust clouds can be
easily formed in these units and thus could be ignited by heat, fire, or spark (Eckhoff,
2003; CSB, 2009). Therefore, more attention should be paid to these units in production.
For the dust collecting system, one effective way to prevent dust explosions is to reduce
the amount of accumulated dust, for example, by cleaning out the dust at filters or in
ducts regularly (Yuan et al., 2015). The other type of safety measure for a dust collecting
system is to eliminate potential ignition sources; for example, by installing magnetic
separators at the inlet to remove tramp metal to eliminate impact sparks (Amyotte et al.,
2009). The next critical unit is the silo/bunker, widely used to temporarily store
pulverized raw materials or products. As discussed above, the main ignition sources in
this type of equipment are self-heating and smoldering and external flame or heat.
Therefore, the safety measures are mainly focused on reducing accumulated heat, by the
installation of a temperature control system in silos/bunkers (Yuan et al., 2013), and
eliminating oxygen by installing inert gas devices (Amyotte et al., 2003). Furnaces,

65
similar to dryers, are the third critical equipment as providing enough heat for dust
explosions. Thus, the key measure is to isolate the heat from furnaces and combustible
dust clouds (NFPA 86, 2007). Other critical units include milling/crushing plants and
grinding/polishing plants. For these units, a large amount of heat could be produced along
with combustible dust clouds. Therefore, the main way to prevent dust explosions is to
reduce the concentration of the dust cloud by applying ventilation systems and dissipating
produced heat as soon as possible, by installing cooling systems (Eckhoff, 2003).
4.5 Conclusion
In industrial production, dust explosions are a threat worldwide and have caused huge
losses to operators, shareholders and the environment. By collecting accident records,
reviewing and analyzing the information, dust explosions can be better understood and
prevented in the future.
According to the analysis, dust explosions are closely related to industrial activities and the
number of dust explosions worldwide is decreasing with time. However, for specific
countries, like China, the number of reported dust explosions is increasing because of the
country’s rapid industrial development and the lack of enough investment in safety
improvement and safety management, which also leads to the far higher casualties per dust
explosion in China compared to other countries. Combustible dust categorizations and
enterprise types with dust explosion risk depend on the industrial structures of specific
countries. Usually, the larger the economic output of a specific industry, the more easily the
combustible dust in the industry could be found involved in dust explosions. Moreover,
flame and direct heat is estimated as the most commonly seen ignition source leading to
dust explosions, and dust collecting systems as well as conveying systems are determined

66
to be the most critical equipment in industrial production. Thus, for critical units in various
industries, particular attention and supervision should be dedicated in operations, and
suitable safety measures need to be applied to prevent dust explosions or mitigate potential
damage caused by such accidents.
Acknowledgments
The authors gratefully acknowledge the financial support provided by the Natural
Sciences and Engineering Research Council of Canada (NSERC) and Vale Research
Chair Grant.
4.6 References
Abbasi, T., Abbasi, A.S., 2007. Dust explosions - Cases, causes, consequences, and control.
Journal of Hazardous Materials 140, 7-44.
Abuswer, M., Amyotte, P., Khan, F., 2013. A quantitative risk management framework for
dust and hybrid mixture explosions. Journal of Loss Prevention in the Process Industries
26, 283-289.
Amyotte, P., Khan, F., Basu, A., Dastidar, A.G., Dumeah, R.K, Erving, W.L., 2006.
Explosibility parameters for mixtures of pulverized fuel and ash. Journal of Loss
Prevention in the Process Industries 19, 142-148.
Amyotte, P., Lindsay, M., Domaratzki, R., Marchand, N., Di Benedetto, A., Russo, P.,
2010. Prevention and mitigation of dust and hybrid mixture explosions. Process Safety
Progress 29, 17-21.
Amyotte, P.R., Eckhoff, R.K., 2010. Dust explosion causation, prevention and mitigation:
An overview. Journal of Chemical Health and Safety 17, 15-28.
Amyotte, P.R., Pegg, M.J., Khan, F.I., 2009. Application of inherent safety principles to
dust explosion prevention and mitigation. Process Safety and Environment Protection 87,
35-39.
Amyotte, P.R., Khan F.I., Dastidar, G.A., 2003. Reduce dust explosions the inherently safer
way. Chemical Engineering Progress 99, 36-43.

67
Anquan. http://anquan.28xl.com/wap/bencandy-147-58003-1.htm (in Chinese, last
checked on 15.01.15).
Di Benedetto, A., Russo, P., Amyotte, P.R., Marchand, N., 2010. Modelling the effect of
particle size on dust explosions. Chemical Engineering Science 65, 772-779.
BRIGHT HUB, 2012. http://www.brighthub.com/education/homework-
tips/articles/122532.aspx (last checked on 15.01.15).
British Petroleum, 2013. Statistical Review of World Energy.
http://www.bp.com/content/dam /bp/pdf/statistical-
review/statistical_review_of_world_energy_2013.pdf (last checked on 15.01.15).
Callé, S., Klaba, L., Thomas, D., Perrin, L., Dufaud, O., 2005. Influence of the size
distribution and concentration on wood dust explosion: Experiments and reaction model.
Powder Technology 157, 144-148.
Chinanews, 2002. http://www.chinanews.com/2002-11-23/26/246440.html (in Chinese,
last checked on 15.01.15).
Chinanews, 2005. http://www.js.chinanews.com/2005-04-23/1/12388.html and
http://news.qq.com/zt/2005/hljmk/ (in Chinese, last checked on 15.01.15).
Chinanews, 2007. http://www.gd.chinanews.com/2007/2007-08-01/8/50695.shtml and
http://nd.oeeee.com/special/book/publish/200711/t20071121_602654.shtml. (in Chinese,
last checked on 15.01.15).
Chinanews, 2008. http://roll.sohu.com/20120818/n350930847.shtml. and
http://www.9764.com/Tech/Chemical/200805/9709.shtml
(http://roll.sohu.com/20120818/n350930847.shtml. (in Chinese, last checked on
15.01.15).
Chinanews, 2009. http://www.chinanews.com/sh/news/2009/08-09/1810267.shtml (in
Chinese, last checked on 15.01.15).
Chinanews, 2010. http://www.aqsc.cn/101805/101882/201141.html,
http://www.aqsc.cn/101805/101882/167447.html and
http://info.fire.hc360.com/2010/08/030935261808.shtml (in Chinese, last checked on
15.01.15).
Chinanews, 2011. http://www.chinanews.com/df/2011/03-27/2933331.shtml,

68
http://big5.xinhuanet.com/gate/big5/news.xinhuanet.com/politics/2011-
04/02/c_121261551.htm, http://news.163.com/11/0522/23/74MP0TP200014JB5.html,
http://www.wzrb.com.cn/article320847show.html and http://sh.sina.com.cn/news/s/2011-
12-18/0947203433.html (in Chinese, last checked on 15.01.15).
Chinanews, 2012. http://news.sohu.com/20121121/n358187035.shtml and
http://www.xj.chinanews.com/html/V67/2012/05/16/97355.htm (in Chinese, last checked
on 15.01.15).
China State Administration of Work Safety, 2013. Fiscal Year 2013 Budget.
http://www.chinasafety.gov.cn/newpage/ (in Chinese, last checked on 15.01.15).
Comptroller General, 1979. Report to the congress of the United States.
http://www.gao.gov/assets/130/125953.pdf (last checked on 15.01.15).
Craven, A.D., Foster, M.G., 1967. Dust explosion prevention-determination of critical
oxygen concentration by vertical tube method. Combustion and Flame 11, 408-411.
CSB, 2006. Combustible dust hazard study. Investigation No. 2006-H-1. Washington,
DC, November 2006 http://www.csb.gov/assets/1/19/Dust_Final_Report_Website_11-17-
06.pdf (last checked on 15.01.15).
CSB, 2009. Sugar dust explosion and fire. Investigation No. 2008-05-I-GA. Washington,
DC, September 2009
http://www.csb.gov/assets/1/19/Imperial_Sugar_Report_Final_updated.pdf (last checked
on 15.01.15).
CSB, 2011. Metal Dust Flash Fire and Hydrogen Explosion. Investigation No. 2011-4-I-
TN. Washington, DC, December 2011
http://www.csb.gov/assets/1/19/CSB_Case_Study_Hoeganaes_Feb3_300-1.pdf (last
checked on 15.01.15).
CSB, 2005. Aluminum Dust Explosion. Investigation No. 2004-01-I-IN. Washington, DC,
September, 2005 http://www.csb.gov/assets/1/19/Hayes_Report.pdf (last checked on
15.01.15).
CSB, 2005. Combustible dust fire and explosions. Investigation No. 2003-09-I-KY.
Washington, DC, February 2005
http://www.csb.gov/assets/1/19/CSB_CTA_Investigation_Report.pdf (last checked on

69
15.01.15).
Dahoe, A.E., 1996. Dust explosions in spherical vessels: the role of flame thickness in the
validity of the ‘cube-root law’. Journal of Loss Prevention in the Process Industries 8, 33-
44;
Duan, W. L., Chen, G.H., Ye, Q., Chen, Q.G., 2011. The situation of hazardous chemical
accidents in China between 2000 and 2006. Journal of Hazardous Materials 186, 1489-
1494.
Eckhoff, R.K., 2003. Dust Explosions in the Process Industries, 3rd edition. Elsevier
Science, Burlington, MA.
Eckhoff, R.K., 2009. Understanding dust explosions. The role of powder science and
technology. Journal of Loss Prevention in the Process Industries 22, 105-116.
Eckhoff, R.K., 1995. Use of (Dp/dt)max from closed-bomb tests for prediction violence of
accidental dust explosions in industrial plants. Fire Safety Journal 8, 159-168.
Eckhoff, R.K., 1984. Dust explosion experiments in a vented 500 m3 silo cell. Journal of
Occupational Accidents 6, 229-240.
Eckhoff, R.K., 1986. Ignitability and explosibility of silicon dust clouds. Journal of the
Electrochemical Society 133, 2631-2637.
Eckhoff, R.K., 1996. Prevention and mitigation of dust explosions in the process
industries: a survey of recent research and development. Journal of Loss Prevention in
Process Industries 9, 3-20.
Edwards, D.H., 1987. Detonation limits of clouds of coal dust in mixtures of oxygen and
nitrogen. Combustion, Explosion and Shock Waves 23, 239-245.
Explosion Hazards Ltd. Dust Explosion Hazards and the Risks of explosion.
http://www.explosionhazards.co.uk/the-risks-of-explosion (last checked on 15.01.15).
Feng, Q., Chen, H., 2013. The safety-level gap between China and the US in view of the
interaction between coal production and safety management. Safety Science 54, 80-86.
Fire Department, 2007. http://119.china.com.cn/qxjy/txt/2007-
06/13/content_1615045.htm. (in Chinese, last checked on 15.01.15).
Failure Knowledge Database. http://www.sozogaku.com/fkd/en/cfen/CC1200047.html
(last checked on 15.01.15).

70
Frank, W.L., 2004. Dust explosion prevention and the critical importance of
housekeeping. Process Safety Progress 23, 175-185.
GenDisasters, 2009. Grain Elevator Explosion,
http://www3.gendisasters.com/nebraska/13154/lexington-ne-grain-dust-explosion-jan-
1979; Mine Explosion, http://www3.gendisasters.com/nova-scotia/12370/westray-ns-
mine-explosion-may-1992; Grain Elevator Explosion.
http://www3.gendisasters.com/texas/13373/galveston-tx-grain-elevator-explosion-dec-
1977; Gum factory Blast, http://www3.gendisasters.com/new-york/13386/long-island-
city-ny-gum-factory-blast-nov-1976 (last checked on 15.01.15).
GenDisasters, 2007. Corn Products Refining Starch Plant Explosion.
http://www3.gendisasters.com/illinois/1083/pekin,-il-corn-products-refining-starch-plant-
explosion,-jan-1924?page=0,0 (last checked on 15.01.15).
Gerdham, G.U., Ruhm, J.C., 2006. Deaths rise in good economic times: evidence from
the OECO. Economics and Human Biology 4, 298-316.
Going E.J., Lombardo, T., 2007. Dust collector explosion prevention and control. Process
Safety Progress 26, 164-176.
Government of the People’s Republic of China, 2007. Regulations on reporting,
investigation and handling of production safety accidents.
http://www.gov.cn/ziliao/flfg/2007-04/19/content_589264.htm. (in Chinese, last checked
on 15.01.15).
Hassan, J., Khan, F., Amyotte, P., Ferdous, R., 2014. A model to assess dust explosion
occurrence probability. Journal of Hazardous Materials 268, 140-149.
Holbrow, P., Tyldesley, A., 2003. Simple devices to prevent dust explosion propagation in
charge chutes and pipes. Journal of Loss Prevention in the Process Industries 16, 333-340.
Hoshino, Yoshiro, Lijima, 1992. Industrial pollution in Japan, chapter 5. United Nations
University Press. http://d-arch.ide.go.jp/je_archive/society/book_jes5_d06.html (last
checked on 15.01.15).
Kauffman, C.W., 1982. Agricultural Dust Explosion in Grain Handling Facilities. In Lee,
J.H.S., and Guirao, C.M. Canada: University of Waterloo Press.
Khakzad, N., Khan, F., Amyotte, P., 2012. Dynamic risk analysis using bow-tie approach.

71
Reliability Engineering and System Safety 104, 36-44.
Klinzing, E.G., Rizk, F., Marcus, R., Leung, S.L., 2010. Pneumatic Conveying of Solids:
A theoretical and practical approach. Netherlands: Springer.
Lees, F.P., 2004. Lees’ Loss Prevention in the Process Industries. London: Butterworth.
Masson, F., 1998. Explosion of a grain silo.
http://www.ineris.fr/centredoc/blaye_report_va.pdf (last checked on 15.01.15).
McAteer, D.J., Beck, A.J., McGinley, C.P., Monforton, C., Roberts, C.D., Spence, B.,
Weise, S., 2011. Report on the Upper Big Branch Mine Explosion.
http://zh.scribd.com/doc/55812536/McAteer-Report-Says-Upper-Big-Branch-Mine-
Explosion-Preventable (last checked on 15.01.15).
Muyung Ltd. http://www.docin.com/p-463808414.html. (in Chinese, last checked on
15.01.15).
National Bureau of Statistics of the People’s Republic of China, 2012. Statistical
Yearbook of China industrial economy of 2011. http://www.stats.gov.cn/tjsj/ (in Chinese,
last checked on 15.01.15).
NPR News, 2012. http://www.npr.org/2012/03/12/148421415/apple-workers-plant-
inspected-hours-before-blast (last checked on 15.01.15).
United Nations, 2008. International Standard Industrial Classification of All Economic
Activities (ISIC). http://unstats.un.org/unsd/publication/seriesM/seriesm_4rev4e.pdf (last
checked on 15.01.15).
OSHA. https://www.osha.gov/about.html (last checked on 15.01.15).
OSHA. https://www.osha.gov/law-regs.html (last checked on 15.01.15).
National Fire Protection Association , 2007. NFPA 86, Standard for Ovens and Furnaces.
National Fire Protection Association , 1957. Report of Important Dust Explosions.
PAPERSPAST. http://paperspas.natlib.govt.nz/cgi-bin /paperspast?a
=d&d=PBH19111230. 2. 88.43. (last checked on 15.01.15).
Piccinini, N., 2008. Dust explosion in a wool factory: Origin, dynamics and consequences.
Fire Safety Journal 43, 189-204.
Safethoo, 2009. http://www.9764.com/case/case/Blow/200908/28954.shtml (in Chinese,
last checked on 15.01.15).
72
Safethoo, 2011. http://www.9764.com/Tech/Burst/201106/186708.shtml (in Chinese, last
checked on 15.01.15).
Safethoo, 2013. http://www.9764.com/Case/Case/Blow/201307/318127.shtml (in
Chinese, last checked on 15.01.15).
Safethoo, 2008. http://www.safehoo.com/Case/Case/Blow/200810/3827.shtml (in
Chinese, last checked on 15.01.15).
China State Administration of Work Safety. http://media.chinasafety.gov.
cn:8090/iSystem/ shigumain.jsp (in Chinese, last checked on 15.01.15).
Sina, 2002. http://news.sina.com.cn/c/2002-01-10/439961.html and
http://news.sina.com.cn/c/2002-01-11/441167.html (in Chinese, last checked on
15.01.15).
China State Administration of Work Safety, 2008.
http://www.chinasafety.gov.cn/wangluocankao/2008-01/15/content_271131.htm (in
Chinese, last checked on 15.01.15).
Song, L., He, X.Q., Li, C.W., 2011. Longitudinal relationship between economic
development and occupational accidents in China. Accident Analysis and Prevention 1,
82-86.
The Energy Library. http://theenergylibrary.com/node/13076. (last checked on 15.01.15).
United States Department of Labor. Fiscal Year 2014 Budget
http://www.dol.gov/dol/budget/index-2014.htm (last checked on 15.01.15).
United States Department of Commerce. GDP by Industry, 1998-2013.
http://www.bea.gov/national/index.htm (last checked on 15.01.15).
van Beeck, E.F., Borsboom, G.J.J., Mackenbach, J.P., 2000. Economic development and
traffic accident mortality in the industrialized world, 1962-1990. International Journal of
Epidemiology 29, 503-509.
van dert Voort, M.M., Klein, A.J.J., de Maaijer, M., van den Berg A.C., van Deursen, J.R.,
Versloot N.H.A, 2007. A quantitative risk assessment tool for the external safety of
industrial plants with a dust explosion hazard. Journal of Loss Prevention in Process
Industries 20, 375-386.
Vijayaraghavan, G., 2011. Emerging emergency due to dust explosions in process

73
industry. Journal of Engineering Research and Studies П: 193-198.
Wang, J., Li, W., 2001. China’s coal mine accidents and comments of safety specialists.
Beijing: Coal Industry Press. (in Chinese)
Wang, X.Z., 2006. Report on Occupational Safety vs Economic and Social Development,
China Beijing: Coal Industry Publishing House. (in Chinese)
Mining-technology, 2014. http://www.mining-technology.com/features/feature-world-
worst-coal-mining-disasters-china/ (last checked on 15.01.15).
Wenku, 2012. http://wenku.baidu.com/view/570339d2360cba1aa811da7f.html (in
Chinese, last checked on 15.01.15).
Wenku, 2010. http://wenku.baidu.com/view/856ecf46fe4733687e21aa7f.html (in
Chinese, last checked on 15.01.15).
The World Bank. Data of GDP.
http://data.worldbank.org/indicator/NY.GDP.MKTP.CD/countries (last checked on
15.01.15).
Xinhua News, 2007. http://news.xinhuanet.com/society/2007-05/27/content_6158772.htm
(in Chinese, last checked on 15.01.15).
Xinhua News, 2009. http://news.xinhuanet.com/newscenter/2009-
03/16/content_11021413_1. htm (in Chinese, last checked on 15.01.15).
Yan, X.Q., Yu, J.L., 2012. Dust explosion incidents in China. Process Safety Progress 31,
187-189.
Yuan, Z., Khakzad, N., Khan, F., Amyotte, P., Reniers, G., 2013. Risk-based design of
safety measures to prevent and mitigate explosion hazards. Industrial & Engineering
Chemistry Research 52, 18095-18108.
Yuan, Z., Khakzad, N., Khan, F., Amyotte, P., 2015. Risk Analysis of Dust Explosion
Scenarios using Bayesian Network Model. Journal of Risk Analysis, 35, 278-291.
Yuan, Z., Khakzad, N., Khan, F., Amyotte, P., 2015. Risk-based optimal safety measure
allocation for dust explosions. Safety Science 74, 79-92.

74
Zheng, Y. P., Feng, C.G., Jing, G.X., Qian, X.M., Li, X.J., Liu, Y.Z., Huang, P., 2009. A
statistical analysis of coal mine accidents caused by coal dust explosions in China. Safety
Science 22, 528-532.

75
5 Risk-based Design of Safety Measures to Prevent and
Mitigate Dust Explosion Hazards
Zhi Yuan1, Nima Khakzad1, Faisal Khan1*, Paul Amyotte2, and Genserik Reniers3
1-Safety and Risk Engineering Group (SREG), Faculty of Engineering & Applied Science,
Memorial University of Newfoundland, St. John's, NL, Canada A1B 3X5
2-Department of Process Engineering & Applied Science, Dalhousie University, Halifax,
NS, Canada B3J 2X4
3- Safety and Security Science Group, Faculty TPM, Jaffalaan 5, 2628 BX Delft, Belgium
Preface
A version of this manuscript has been published in the Journal of Industrial Engineering &
Chemistry Research. The principal author developed the generic risk analysis model of dust
explosions based on extensive literature review, categorized safety measures and presented
the application of this generic model by a case study. The co-authors, Dr(s) Khakzad, Khan,
Amyotte and Reniers supervised and reviewed the methodology, proposed valuable
suggestions and corrections to improve the quality of the manuscript.

76
Abstract
Dust explosion is one of the main threats to equipment safety and human health in
industries. Complex factors leading to accidents, serious consequences and relevant safety
measures are the main interests of governmental agencies, researchers and industrial
companies. However, a generic risk analysis model for dust explosions is absent. The bow-
tie model can be used to investigate the relationships among basic causes, safety barriers
and possible consequences of an accident scenario. In this paper, a framework is established
for quantitative risk assessment of dust explosions based on bow-tie analysis method via
review and analysis of previous major dust explosions. A large inventory of relevant safety
measures is presented, and the implementation and efficacy of such safety measures to
reduce the risk of dust explosions is thoroughly discussed. Finally, the methodology is
applied to a case-study. The results show that the generic bow-tie developed in this study
can be tailored to a wide variety of dust explosion accident scenarios with minimal
manipulation; also, implementation of relevant safety measures can significantly reduce the
risk of dust explosions.
Keywords: Dust explosion; Quantitative risk analysis; Bow-tie method; Safety measures
5.1 Introduction
When suspended combustible dust in a confined space is ignited, a dust explosion occurs
(CSB, 2006). Compared to other types of explosion, dust explosions can lead to severe
damage as they may result in a series of secondary dust explosions, causing higher
overpressures and temperatures. It should also be noted that toxic gases as likely byproducts
of dust explosions can noticeably increase the extent and intensity of damage.

77
Dust explosions have been causing significant loss to humans, assets, and the environment.
According to the U.S. Chemical Safety Board (CSB, 2005), a dust explosion at the Hayes
Lemmerz plant, Huntington, Indiana, in 2003 caused 1 death and 6 injuries. The cause of
this accident was identified as aluminum dust in a dust collector, probably ignited by heat,
impact sparks or burning embers. In the same year, another dust explosion at West
Pharmaceutical Services, Kinston, North Carolina, claimed 6 lives and 38 injuries (CSB,
2004). The CSB believed the accumulation of combustible dust above a suspended ceiling
was the main source of the combustible material. Also, the ignition of rubber vapor, an
overheated electrical ballast, an electrical spark, or an electric motor was determined to be
the ignition source. Dust explosions have widely been reported in the literature (Blair, 2007;
Zheng et al., 2009; Giby and Luca, 2010; Marmo et al., 2004; Piccinini, 2008; John and
Vorderbrueggen, 2011). Therefore, conducting quantitative risk analysis (QRA) for dust
explosions is necessary for process facilities dealing with different types of dust-producing
activities, ranging from wool to food and metal industries. Usually, hazard identification is
the first step in QRA, followed by accident modeling, cause-consequence analysis, and risk
estimation.
In the context of dust explosion QRA, however, the focus has mainly been on dust
explosion mechanisms (Eckhoff, 2003, 2009; Callé et al., 2005; Amyotte et al., 2005;
Cashdollar and Zlochower, 2007; Pilão et al., 2006; Benedetto et al., 2010) or pertinent
safety measures to prevent or mitigate the damage of accidents (Eckhoff, 2003, 2009; Li et
al., 2009; Myers, 2008; Marian and Rudolf, 2013; Amyotte et al., 2007, 2009). van dert
Voort and Klein (2007) developed a QRA tool for the external safety assessment of
industrial plants prone to dust explosion hazards. In their method, the risk of the entire plant
78
is divided into individual risks of constituting units according to their size, shape and
constructional properties. However, sometimes, dividing a plant into units and choosing
proper explosion models for each unit are difficult, if not impractical, for complex
processing facilities. In this paper, a generic comprehensive risk analysis model based on
the bow-tie method is developed, which can be used in risk assessment and safety measure
design of dust explosions with different characteristics. This model can conveniently be
used to assess the risk of dust explosion in various industries.
The part is organized as follows: fundamentals of the bow-tie method and the role of safety
measures in risk analysis are recapitulated in Section 5.2. An inventory of potential
contributing factors to dust explosions is presented in the form of a generic bow-tie in
Section 5.3 while a list of pertinent safety measures, their applicability and implementation
are given in Section 5.4. To illustrate the generality and the efficacy of the developed bow-
tie, the approach is applied to a case-study in Section 5.5. Section 5.6 summarizes the main
conclusions of this study.
5.2 Background
5.2.1 Bow-tie method
Many probabilistic techniques have been used in QRA, among which fault tree analysis
(FT) and event tree analysis (ET) are the most popular. FT investigates primary causes of
a critical event (e.g., system failure, system unavailability, release of hazardous material,
etc.) while ET explores the possible consequences arising from a critical event (e.g., fire,
explosion, injury, death, etc.). Bow-tie (BT), a graphical method, integrates both the
primary causes and consequences of a critical event into a logical model. It also provides
system reliability if effects of safety measures are considered. Using the probabilities of

79
primary causes, along with failure likelihood of safety measures, the probabilities of
consequences can be estimated. Dianous and Fiévez (2006) established a risk assessment
methodology based on BT to evaluate the efficacy of risk control measures. Shahriar et al.
(2011) used fuzzy theory based on BT to analyze the risk of oil and gas pipelines and
provided suggestions for the risk management process. Bellamy et al. (2013) presented an
application of BT in industrial practice, ‘Storybuilder’ method, to identify the dominant
patterns of safety barrier failures, barrier task failures and underlying management flaws.
Their BT model comprises six lines of defense, three on either side of the critical event, a
loss of containment event. Despite its wide applications in QRA, BT suffers from a static
nature, and cannot easily be updated when new information becomes available. However,
there have recently been efforts to overcome this limitation either by coupling BT with
Bayesian updating (Khakzad et al., 2012) or via substituting with more dynamic methods
such as Bayesian networks (Khakzad et al., 2011, 2013).
5.2.2 Safety measures
In the context of risk management, safety measures are classified into three types: inherent,
engineered and procedural safety measures (Khan and Amyotte, 2003). When applying
safety measures to improve system safety, inherent safety measures are given priority over
the two other types of safety measures. Generally, inherent safety is aimed at reducing
hazards, relying on the properties of a material or the design of a process. Four key
principles for inherent safety have been suggested (Amyotte et al., 2007, 2009; Kletz, 1978,
2003):
Minimization: using smaller quantities of hazardous materials and performing a
hazardous procedure as few times as possible.

80
Substitution: using a less hazardous material or implementing a less hazardous
procedure.
Moderation: using hazardous materials in their least hazardous forms or under less
hazardous processing conditions.
Simplification: designing process equipment and procedures to eliminate opportunities
for errors.
Inherent safety measures are normally considered the most reliable as they do not depend
on the performance of additional safety devices or the physical or psychological condition
of operators.
Engineered safety measures refer to reducing the frequency of accidents or lowering their
severity via setting additional barriers. Based on the type of operation, these safety barriers
could be further divided into passive and active. For passive safety measures, no additional
activator, actuator or human intervention is required (e.g. explosion relief vents) whereas
active safety measures depend on the function of additional control systems (e.g. automatic
suppression systems). Usually, passive safety measures are preferred to active ones since
no additional interventions or control systems are required.
Procedural or administrative safety measures, on the other hand, rely on management
methods to prevent accidents (e.g., training) or mitigate their damage (e.g., evacuation and
emergency response). These safety measures are influenced by human factors such as
safety training effectiveness or human response time.

81
Once a BT is developed, the effect of safety measures can easily be analyzed. In the context
of BT method, safety measures can be categorized under four guide words (Dianous and
Fievez, 2007):
Avoid: making an event not happen. An “Avoid” safety measure functions before a
basic event occurs on the FT (i.e., is given temporal or spatial precedence over the
event). As a result, the basic events for which “Avoid” safety measures have been
implemented can be eliminated from the BT, and is no longer considered in the accident
scenario sequence.
Prevent: reducing the frequency of an event. A “Prevent” safety measure acts before a
basic event happens, whether on the FT or ET. For example, in an ET, emergency
training can be considered to reduce the failure probability of evacuation as a safety
measure.
Control: controlling an event or recovering a system to a safe state. A “Control” safety
measure acts before a basic event occurs on the FT while it acts after an event occurs
on the ET. For example, fire walls are installed to control flame and overpressure during
dust explosions.
Mitigate: reducing the effect of an event on equipment, human health or environment.
A “Mitigate” safety measure acts after an event occurs on the ET. For example, using
the emergency response and rescue system can reduce the probability of severe injury
and death.
5.3 Dust explosion causes and consequences
5.3.1 Generic fault tree

82
The primary causes of dust explosions have already been investigated and modeled using
FT (Abuswer et al., 2013). In the present study, a more detailed and broader range of
elements based on past accidents in the process industries are considered. These elements
are illustrated and organized according to their cause-effect relationships in the form of a
generic FT in Figure 5.1. This generic fault tree is comprehensive and can be fitted to a
wide variety of dust explosion accident. Basic events of the FT and their probabilities are
listed in Table 5.1. These probabilities have been either drawn from literature (OREDA,
2002; Mannan, 2005; Moss, 2005; Rathnayaka et al., 2011) or calculated using existing
relationships. For example, the probability of the basic event Particle size in explosive
range is calculated using an equation given by Eckhoff (2003), considering the percentage
of particle sizes ranging from 20μm to 125μm (see Table A1 in the appendix (Eckhoff,
2003)). Other data such as the probability of Calm which is related to the local atmospheric
condition is estimated using expert opinions. The intermediate events and undeveloped
events are also shown, in Table 5.2.
This generic FT is based on the dust explosion pentagon comprising five elements:
combustible dust, oxidant, ignition source, dispersion of dust, and confinement of dust, and
also 79 primary events, involved in various areas, such as human factors (e.g. Not wearing
protective clothes to eliminate electrostatic), leading to these five elements.

83
(a) Main fault tree

84
(a) Transfer gates
Fig. 5.1 Generic fault tree of dust explosion including (a) the main part, and
(b) transfer gates.
Table 5.1 Basic events of generic fault tree in Figure 5.1 (Eckhoff, 2003;
Mannan, 2005; Moss, 2005; Rathnayaka et al., 2011; Eckhoff and Amyotte,
2010)
Symbol Description Probability Symbol Description Probability
X1 Lack of inert dust for
explosible dust
0.3 X41 Misalignment of components 0.1
X2 Particle size in explosive
range
0.71 X42 Equipment with high potential
to produce friction sparks
0.085
X3 Lack of filter in air
ventilation system/Filter
system failure
0.01 X43 Malfunction of equipment
such as belt slip
0.04
X4 Not satisfying the latest
construction code
0.02 X44 Tramp metals impact internal
walls of metal equipment
0.05
X5 Equipment failure of
ventilation system
0.04 X45 Use of unsuitable tools 0.01
X6 Lack of written procedure
for housekeeping
0.033 X46 Equipment made of material
with high potential of sparking
0.067
X7 Incorrect housekeeping
methods
0.067 X47 Loose objects 0.03
X8 Lack of regular inspection 0.01 X48 Lack of daily documented
operation procedures to avoid
impact sparks
0.04

85
X9 Lack of design codes 0.033 X49 Improper operation procedures
to avoid impact sparks
0.067
X10 Improper design codes 0.04 X50 Lack of spark arresters 0.045
X11 Failure to follow design
codes
0.045 X51 Malfunction of spark arresters 0.05
X12 Dust collectors malfunction 0.04 X52 Unsuitable switches 0.1
X13 Leakage of air from
ventilation system
0.05 X53 Blown fuse 0.08
X14 Blockage in ventilation
system
0.145 X54 Short circuit 0.05
X15 Lack of enough knowledge
about previous system
before reconstruction
0.1 X55 Damaged insulation 0.01
X16 Not strictly applying
relevant guideline
0.045 X56 Lightning 0.000001
X17 Inadequate stewardship
program of manufacturers of
raw materials
0.09 X57 Not wearing protective clothes
to eliminate electrostatic
0.06
X18 Lack of methods to identify
hazards
0.033 X58 Electrically nonconductive
components
0.045
X19 Ignoring combustible dust in
hazard communication
program
0.09 X59 Lack of grounding device 0.01
X20 Employee unaware of dust
explosion hazard
0.1 X60 Failure of grounding device 0.004
X21 Inadequate safety training
about combustible dust
hazard
0.05 X61 Too high breakdown voltage 0.01
X22 Lack of coverings on
cleanout, inspection and
other openings
0.083 X62 Lack of gas/temperature
detection system
0.045
X23 Dust-tight system
malfunction
0.006 X63 Failure of gas/temperature
detection system
0.148
X24 Lack of dust-tight system 0.045 X64 No measures/procedures when
onset of self-heating is
detected or after certain
storage periods
0.067
X25 Lack of operational
procedures for dealing with
settled dust
0.04 X65 Unsuitable storage methods 0.045
X26 Inadequately safety trained
operators in high risk
working environment
0.1 X66 Lack of fire suppression
system
0.045
X27 Improper procedures to
clean settled dust
0.067 X67 Malfunction of fire
suppression system
0.1
X28 Lack of isolation devices 0.055 X68 Work permit not issued 0.033
X29 Failure of isolation devices 0.08 X69 Work permit/rules not strictly
performed
0.045
X30 Collapse of equipment 0.085 X70 Standard defect 0.067
X31 Lack of inert gas device 0.045 X71 Ignition of settled dust 0.005
X32 Inadequate inert gas device 0.067 X72 Poor dissipation of heat 0.067
X33 Failure of inert gas device 0.08 X73 Bad contact 0.02
X34 Overloading operation of 0.01 X74 Combustion 0.3

86
processing equipment
X35 Lack of surface
shielding/isolation for high
temperature equipment
0.067 X75 Lack of separation device to
prevent burning dust from
entering process system
0.045
X36 Incorrectly specified
electrical equipment
0.045 X76 Improper enclosure 0.045
X37 Mechanical failure of
equipment such as bearings
or blowers
0.04 X77 Calm 0.002
X38 Lack of excessive
temperature controlling
system
0.045 X78 Lack of dust suppressants 0.1
X39 Failure of excessive
temperature controlling
system
0.08 X79 Equipment erosion 0.0078
X40 Insufficient, excessive or
impure lubricant
0.05
Table 5.2 Intermediate events and undeveloped events of generic fault tree in Figure
5.1 Symbol Description Symbol Description Symbol Description
IE1 Explosible
concentration of
dust
IE17 Misoperation causing
collision of objects
IE32 Unwanted horizontal surfaces
are designed
IE2 Dust is suspended
in air
IE18 Electrical arc/ sparks IE33 Dust emission from process
equipment
IE3 Settled dust is
lofted
IE19 Electrostatic discharges IE34 Inadequate dust-tight system
IE4 Dust accumulation IE20 Field intensity exceeds
3MV/m
IE35 Heat accumulation leads to
temperature higher than auto-
ignition temperature
IE5 Lofting event IE21 Self-ignition IE36 Gas/temperature detection
system malfunction
IE6 Improper
operation to
activate dust layers
IE22 Open flame IE37 Inert gas device malfunction
IE7 Shockwave from
primary dust
explosion
IE23 Confinement IE38 Fire suppression system
failure
IE8 Oxidant
concentration>
LOC
IE24 Cramped space IE39 Fire
IE9 Ignition source
energy>MIE and
MIT
IE25 Inefficient ventilation IE40 Violation of open flame
standard
IE10 Heated surfaces IE26 Insufficient air volume IE41 Electrical equipment fire
IE11 Excessive
temperature
control system
malfunction
IE27 Deficiency in design IE42 Burning dust
IE12 Friction, impact or
other sparks
IE28 Ventilation equipment
malfunction

87
IE13 Friction sparks IE29 Improper reconstruction
of ventilation system
IE14 Impact sparks IE30 Poor housekeeping
IE15 Sparks from
engines and
motor-driven
equipment
IE31 Lack of awareness of
combustible dust hazard
IE16 Sparks produced
from collision of
objects
5.3.2 Generic event tree
Dust explosions are able to cause severe consequences, giving rise to significant human
losses and/or damages to facilities. Based on the severity and likelihood, dust explosion
consequences can be divided into five categories: near miss, mishap, minor damage,
significant damage and catastrophic damage. The severities of five consequences are in an
increasing manner depending on the functions of common used safety barriers in mitigating
dust explosions. However, their probabilities are decreasing accordingly. For example, the
severity of Near miss is the least comparing with other consequences but its probability is
the greatest among them. A brief definition of each category is presented below.
Near miss: the dust explosion is controlled at its initial stages, and the system can be
recovered quickly.
Mishap: the process is interrupted, and more time is needed to recover the system
compared to that of a Near miss. However, no damage is caused to apparatus/equipment
or operators.
Minor damage: equipment may be damaged, and superficial injuries are expected.
Significant damage: equipment is damaged along with the possibility of serious injury
or death.

88
Catastrophic damage: major facility damage is caused, and several fatalities are
expected.
Several safety barriers can be applied to prevent, reduce or control damage if a dust
explosion takes place: explosion suppression, explosion venting, explosion containment,
explosion isolation and evacuation (Eckhoff, 2003). The generic ET for dust explosions is
developed in Figure 5.2.
Fig. 5.2 Generic event tree of dust explosion.
The explosion suppression is activated when the pressure rises beyond a threshold due to a
dust explosion. If the explosion suppression functions successfully, further development of
the dust explosion can be prevented, and no damage would be caused. In this situation, the
outcome is classified as a near miss. A fast-response flame or pressure detector is an
essential component of a suppression system. The membrane pressure detector is an
example of these barriers (Eckhoff, 2003).
However, if the explosion suppression system fails to operate, and the explosion
overpressure proceeds further in the unit, the explosion venting barrier can be counted on

89
to relieve the pressure to a safe space. In this case, the equipment and operators will not be
seriously threatened by the overpressure. However, sufficient time will be needed to
recover the system to operating condition (e.g., overhauling the explosion suppression
system). This type of consequence is considered as a mishap.
If the venting system fails, the safety of the system will depend on explosion containment
and isolation. Explosion containment refers to the units involving high risk materials or
processes. These units are designed to withstand the maximum pressure or heat caused by
dust explosions. Explosion isolation, on the other hand, refers to the safety measures to
prevent the propagation of overpressure and fire (e.g., fire walls). When explosion
containment and explosion isolation function, the pressure and fire will be restricted to the
original unit and will not spread to nearby units. Thus, the system will suffer less damage,
and can be recovered after the explosion source fails. The outcome can be deemed as a
mishap. Otherwise, when the isolation system fails, the pressure and fire can spread to
adjacent units. In this case, if the operators are well trained and successfully evacuate, fatal
injuries are likely to be reduced, and the consequence can be classified as a minor damage.
However, in the case of the failure of this barrier, fatal injuries and even death could occur,
giving rise to catastrophic damage.
5.3.3 Generic bow-tie
After the generic FT and ET are developed, the generic BT can be constructed. As depicted
in Figure 5.3, the BT shows the possible events contributing to a dust explosion as well as
its potential consequences. The generic BT can also be used to implement a wide variety
of safety measures to help minimize the risk.

90
Fig. 5.3 Generic bow-tie of dust explosion. The main fault tree of Fig. 5.1 is shown
for brevity.
5.4 Dust explosion safety assessment
5.4.1 Inventory of safety measures
As previously mentioned, safety measures are divided into inherent, engineered and
procedural categories. In this study, the potential safety measures to reduce the probability
of dust explosions are discussed in accordance with the aforementioned categories. The aim
is to provide useful guidelines for safety measure implementation during different stages
of a process design and operation. The basic events contributing to a dust explosion and the
relevant safety measures are presented in Table 5.3 (Eckhoff and Amyotte, 2010).

91
Table 5.3 Safety measures in the context of dust explosion
Basic
Event
Safety
Measures
Inherent Safety Measures Engineered
Procedural Minimizati
-on Substitution Moderation
Simplific
-ation Passive Active
X1 Add inert dust
X2 Increase the
particle size
X3
Install filter system
or timely
maintenance
X4
Follow latest
ventilation
construction code
X5 Timely
maintenance
X6
Enact documented
procedures for
housekeeping
X7 Proper supervision
and training
X8 Ensuring regular
inspection
X9
Enact proper design
codes, such as
reducing unwanted
horizontal surfaces,
ventilation system,
and so on.
X10 Improve design
codes
X11 Proper supervision
and training
X12 Timely
maintenance
X13 Inspection/sealing
X14 Regular cleaning
X15 Safety training
X16 Supervision/Safety
training
X17
Establish integrated
management
system for raw
materials
X18
Systematic hazard
identification
techniques such as
HAZOP or HAZID
and effective use of
Material Safety
Data Sheets
X19 Supervision/
training/written

92
communication
rather than oral
communication
X20 Safety training
X21 Safety training
X22 Installation of
coverings if needed
X23 Regular inspection/
timely maintenance
X24 Install dust-tight
system
X25
Enact written
procedures for
housekeeping
X26 Safety training
X27
Improve operation
procedures of
settled dust
X28 Install isolation
devices
X29
Regular
inspection/timely
maintenance
X30
Improve design
codes to reduce
collapse of
equipment
X31 Add inert gas
X32 Ensure adequate
inert gas supply
X33
Install stand-by
inert gas device and
timely maintenance
X34 Supervision/
Training
X35
Install
shielding/isolation
for high
temperature
equipment
X36
Choose correct
electrical
equipment
X37
Regular
inspection/timely
maintenance
X38
Install excessive
temperature
controlling system
X39
Regular
inspection/timely
maintenance
X40 Use proper

93
lubricant
X41 Supervision/Training
X42
Improve design
codes to substitute
with safer
equipment
X43
Regular
inspection/timely
maintenance
X44
Install magnetic
separators at the
inlet to remove
tramp metal
X45 Workplace training
X46
Choose materials
with lower
potential for spark
generation
X47
Regular
inspection/timely
maintenance
X48
Enact daily
operation
procedures
X49
Improve daily
operation
procedures
X50 Install spark
arresters
X51
Regular
inspection/timely
maintenance
X52 Install arc control
device
X53
Regular
inspection/timely
maintenance
X54 Install circuit
breaker
X55 Regular
inspection/timely
maintenance
X56 Install lightning
protection device
X57 Safety training
X58
Choose proper
conductive
equipment
X59 Install grounding
devices
X60
Regular
inspection/timely
maintenance

94
X61
Control the
breakdown voltage
below 4KV
X62
Install
gas/temperature
detection system
X63 Regular inspection/
timely maintenance
X64
Rolling of bulk
material from one
silo to another
X65
Choose suitable
storage methods for
hazardous dust
X66 Install fire
suppression system
X67
Regular
inspection/timely
maintenance
X68 Safety training
X69 Safety training
X70 Improve work
permit system
X71 Proper and timely
housekeeping
X72 Install cooling
equipment
X73 Regular inspection/
timely maintenance
X75
Install separation
device to prevent
burning dust
entering system
X76
Safety training of
design to avoid
forming cramped
space
X78 Add suppressants
X79
Anti-corrosion
measures, regular
inspection
For example, for the basic event Particle size in explosive range, one possible safety
measure is to Increase the particle size, which is aimed at making the size of particles
beyond their explosive threshold. In other words, the process is modified to produce
particles larger in size than those which could cause a dust explosion. This safety measure

95
satisfies the characteristics of the inherent safety principle Moderation. Meanwhile, if
additional devices and mechanisms, such as humidifiers, are used to combine smaller
particles to form larger ones, the safety measure can also be classified as a passive safety
measure. Another example is Proper and timely housekeeping, which is meant to remove
dust layers from the workplace by correct methods. As smaller quantities of combustible
dust would be involved in processes, this safety measure can be attributed to Minimization.
Since the performance of this safety measure relies on the actions of operators, it can also
be classified as a procedural safety measure.
5.4.2 Implementation of safety measures to bow-tie
As previously mentioned, in the context of accident modeling and risk analysis, safety
measures can further be classified according to four guide words: avoid, prevent, control
and mitigate. Examples for each guide word and the effective location of each safety
measure regarding the BT of dust explosion are given in Table 5.4.
Table 5.4 Examples of Safety Measures Fault Tree Event Tree
Avoid If the explosiveness of particles is
reduced, the dust explosion will be
avoided. This is why in some cases
inert dust is added to raw materials to
decrease their explosiveness.
N/A
Prevent To prevent sparks produced in high
risk places, magnetic equipment can
be installed in inlets to prevent tramp
metal from entering the system.
Explosion suppression system is
used to prevent further development
of fire.

96
Control Ventilation system can be used to
control the airborne dust
concentration below MEC
(Minimum Explosible
Concentration).
Fire walls are used to control fire.
Mitigate N/A Venting system is used to release
overpressure to safe areas.
Similarly, all potential safety measures which can be applied to reduce hazards and improve
the performance of existing safety means are categorized. Figure 5.4 illustrates how these
safety measures are implemented into the BT.
Fig. 5.4 Effects of safety measures on bow-tie
As can be seen from Figure 5.4, the effects of some safety measures are twofold. For
instance, the safety measure Install isolation devices can not only avoid the basic event
Lack of isolation devices, but also adds a safety barrier Explosion Isolation into the system
to mitigate the damage caused by explosions. Likewise, Safety training and Regular

97
inspection/timely maintenance are able to reduce the occurrence probability of basic events
and improve the performance of safety measures (Figure 5.4). However, it should be noted
that some safety measures only have an effect on basic events or on specific safety measures.
For example, Improve the designed safety evacuation route only improves the reliability of
Evacuation.
5.5 Application of the methodology to a case study
5.5.1 Case study
To demonstrate the efficacy of the generic BT developed in Section 5.3, a dust explosion
in a wool factory in Vigliano Biellese, Biella, Italy on 9 January, 2001 was selected as the
case study. This accident caused five injuries, three deaths and considerable damage to the
factory (Piccinini, 2008). The wool processing facility included washing, carding, and
combing of wool. The burrs and noils, separated in the process, were conveyed by
pneumatic system and collected in storage cells. The possible ignition source of the primary
explosion was identified as the flames or embers, triggered by sparks from the electrical
equipment or the overheating of a component. The collapse of the net separating two cells
caused the formation of a dust cloud (i.e., dust dispersion) which was ignited and gave rise
to a primary dust explosion. When flames and overpressure of the primary explosion
reached nearby dust layers, more dust became suspended and the secondary explosion
resulted.
5.5.2 Bow-tie development
Based on the accident details (Piccinini, 2008), the generic BT of Figure 5.3 was tailored
to model the accident scenario as shown in Figure 5.5. The basic events and intermediate
events in Figure 5.5 have already been described in Table 5.1 and Table 5.2.

98
Fig. 5.5 Bow-tie of the dust explosion in the wool factory in Vigliano Biellese.
It should be noted that UEi (i=1, 2, 3) stands for undeveloped events which do not need
further resolution. For example, pneumatic conveyance of the burr is one of the reasons
leading to dust dispersion and suspension in air. As a normal working condition for this
case, it could be considered as an undeveloped event.
As shown in Figure 5.5, only two safety measures were installed in the facility, both of
which failed after the dust explosion had occurred. The path to the consequence
Catastrophic Damage is depicted in bold. The probabilities of the basic events used in the
analysis are obtained from Table 5.1; using these data the probability of the dust explosion
is calculated as 2.49E-02. Similarly, the occurrence probabilities of other consequences are
estimated, and detailed results are presented in Table 5.5 (the second column).

99
Table 5.5 Probabilities of consequences Factory with existing safety
measures
Factory with additional
safety measures
Dust explosion 2.49 E -02 0.99 E -03
Near miss N/A 0.89 E -03
Mishap
(Suppression fails and
Venting succeeds)
N/A 0.91 E -04
Mishap
(Suppression and
venting fail, other safety
barriers succeed)
N/A 0.71 E -05
Minor damage 2.06 E -02 0.59 E -06
Catastrophic damage
(Evacuation fails)
2.28 E -03 0.31 E -07
Significant damage
(Containment fails &
Isolation succeeds)
N/A 0.46 E -06
Significant damage
(Containment fails &
Evacuation succeeds)
1.86 E -03 0.38E -07
Catastrophic damage 2.07 E -04 0.2 E -08
5.5.3 Recommendation of safety measures
To reduce the risk, additional safety measures are recommended and implemented to the
BT (Figure 5.6). As can be seen, these safety measures help to avoid or prevent most of the
basic events and also improve the performance of existing safety measures. Further, some
of the suggested safety measures, in the generic BT, are also considered to mitigate the
damage caused by the accident. For example, an explosion suppression device is
recommended as the first safety measure.

100
Fig. 5.6 Effects of additional safety measures in reducing the risk of explosion in the
wool factory.
More examples illustrating how safety measures can improve the system’s safety are
given in Tables 5.6 and 5.7 for FT and ET, respectively.
Table 5.6 Effects of additional safety measures on basic events of FT of the bow-tie
model
Guide
word Symbol
Safety
Measures Effects
Avoid X8 Ensuring
regular
inspection
After ensuring regular inspection, the situation of lack of
regular inspection is avoided and the branch originating
from X8 could be deleted. The probabilities of related
events “Poor housekeeping” and “Heat surface” can be
calculated as:
P(IE30) = P(IE31) = 1 − (1 − P(X17)) ∗ (1 −
P(X18)) ∗ (1 − P(X20)) ∗ (1 − P(X21)) = 1 −(1 − 0.09) ∗ (1 − 0.033) ∗ (1 − 0.1) ∗ (1 − 0.05)) =0.248 (compare with the prior value of 0.255)
P(IE10) = 1 − (1 − P(IE4)) ∗ (1 − P(X35)) ∗
(1 − P(X37)) ∗ (1 − P(X38)) = 1 − (1 − 0.453) ∗(1 − 0.067) ∗ (1 − 0.04) ∗ (1 − 0.045)) = 0.532 (compare with the prior value of 0.537)

101
Avoid X17 Establish
integrated
management
system for
burrs
By establishing an integrated management system for
burrs, the branch including X17, Inadequate stewardship
program of manufacturers of raw materials, could be
eliminated from BT. The probability of the relevant
intermediate event, “Lack of awareness of combustible
dust hazard”, could be calculated as:
P(IE31) = 1 − (1 − P(X18)) ∗ (1 − P(X20)) ∗
(1 − P(X21)) = 1 − (1 − 0.033) ∗ (1 − 0.1) ∗(1 − 0.05) = 0.173 (compare with the prior value of 0.248)
Prevent X14 Regular
cleaning
(RC)
When “regular cleaning” is applied to prevent X14, the
probability of X14 could be calculated as:
P(X14) = P(X14|RC) ∗ P(RC) + P(X14|RC ) ∗ P(RC ) =0.145 ∗ 0.06 + 0.085 ∗ 0.94 = 0.089 (compare with the prior value of 0.145)
Thus, the probability of IE4, “dust accumulation”, would
be as:
P(IE4) = 1 − (1 − P(X14)) ∗ (1 − P(IE30)) ∗
(1 − P(IE33)) = 1 − (1 − 0.089) ∗ (1 − 0.256) ∗(1 − 0.1405) = 0.417 (compare with the prior value of 0.424)
Prevent X20 Safety
training (ST)
When safety training is taken to help operators increase
their knowledge of dust explosion hazards, the failure
probability of X20 will depend on safety training (ST),
where:
P(X20) = P(X20|ST) ∗ P(ST) + P(X20|ST ) ∗ P(ST ) =0.1 ∗ 0.01 + 0.05 ∗ 0.99 = 0.0505 (compare with the prior value of 0.1)
The probability P(IE31) of the relevant intermediate
event “Lack of awareness of combustible dust hazard”,
would be as:
P(IE31) = 1 − (1 − P(X17)) ∗ (1 − P(X18)) ∗
(1 − P(X20)) ∗ (1 − P(X21)) = 1 − (1 − 0.09) ∗(1 − 0.033) ∗ (1 − 0.0505) ∗ (1 − 0.05) = 0.206 (compare with the prior value of 0.248)
Table 5.7 Effects of additional safety measures on the ET of bow-tie model
Existing Safety
measure
Improvement Effects
Lack of
Explosion
suppression
Install
explosion
suppression
Explosion suppression system can reduce the severity of
consequences. For example, when fire is detected, the
suppression devices will be activated. If this works, the
102
system consequence will become a near miss. Otherwise, more
serious damage would be caused.
Failure of
explosion
containment
Suitable
design
(SD1)
Explosion containment should be considered in the design
stage. Therefore, taking suitable design could lessen the
probability of flaws. The failure probability of explosion
containment would be:
P(EC|SD1) ∗ P(SD1) + P(EC|SD1 ) ∗ P(SD1 ) = 0.085 ∗0.01 + 0.06 ∗ 0.99 = 0.06025 (compare with the prior value
of 0.085)
As may be seen from the examples given in Table 5.6, after implementation of “Avoid”
safety measures to the FT, the basic events X8 and X17 will not happen. That is, two
contributory factors of the dust explosion are eliminated, and hence the probabilities of
their upper events are reduced. “Prevent” safety measures are used to reduce the
probability of relative basic events instead of avoiding them, as is the case for X14 and
X20. The probability of either X14 or X20 is decreased and accordingly the probabilities of
their upper events are also reduced, which improves the safety of the system.
Aside from their effects on the FT, safety measures can be applied to the ET to mitigate
potential damage of dust explosions and improve safety performances. For this case study,
examples are shown in Table 5.7; via installing explosion suppression system to extinguish
fires and by taking proper supervision and training to detect potential flaws of explosion
containment, the damage caused by dust explosions is effectively mitigated.
Applying the above-mentioned safety measures to the facility, the occurrence probability
of dust explosions could significantly have been reduced and the damage of dust explosions
could thus have been lessened to a great extent. This helps to minimize the overall risk of
a dust explosion.
5.6 Conclusion

103
In the present study, the basic events and likely consequences of dust explosions along with
relevant safety measures are investigated and presented through a generic bow-tie. This
bow-tie can be tailored to model a wide variety of dust explosions in different industries. A
variety of safety measures are also suggested to reduce the probabilities of basic events.
The practical application of these safety measures under inherent, engineering and
procedural categories as well as avoid, prevent, control, and mitigate guide words are
discussed, which provide suggestions for choosing most effective safety measures. Further,
the efficacy of the generic bow-tie developed in this study is demonstrated via application
to a case study, illustrating how effective it can be used for risk analysis of dust explosions
with minimum complexity. The results also demonstrate the methodology presented in this
study is able to effectively address most of the basic events contributing to dust explosions
as well as to noticeably improve system safety.
Acknowledgment
The authors gratefully acknowledge the financial support provided by the Natural
Sciences and Engineering Research Council of Canada (NSERC) and Vale Research
Chair Grant.
5.7 Reference
Abuswer, M., Amyotte, P., Khan, F., 2013. A quantitative risk management frame work for
dust and hybrid mixture explosions. Journal of Loss Prevention in Process Industries 26,
283-289.
Amyotte, P.R., Basu, A., Khan, F.I., 2005. Dust explosion hazard of pulverized fuel carry-
over. Journal of Hazardous Materials 122, 23-30.

104
Amyotte, P.R., Pegg, M.J., Khan, F.I., Nifuku, M., Tan, Y.X., 2007. Moderation of dust
explosions. Journal of Loss Prevention in Process Industries 20, 675-687.
Amyotte, P.R., Pegg, M.J., Khan, F.I., 2009. Application of inherent safety principles to
dust explosion prevention and mitigation. Process Safety and Environmental Protection 87,
35-39.
Bellamy, L.J., Mud, M., Manuel, H.J., Oh, J., 2013. Analysis of underlying causes of
investigated loss of containment incidents in Dutch Seveso plants using the Storybuilder
method. Journal of Loss Prevention in Process Industries, In press.
Benedetto, A.Di., Russo, P., Amyotte, P., Marchand, N., 2010. Modelling the effect of
particle size on dust explosions. Chemical Engineering Science 65, 772-779.
Blair, A.S., 2007. Dust explosion incidents and regulation in the United States. Journal of
Loss Prevention in Process Industries 20, 523-529.
Callé, S., Klaba, L., Thomas, D., Perrin, L., Dufaud, O., 2005. Influence of the size
distribution and concentration on wood dust explosion: Experiments and reaction model.
Powder Technology 157, 144-148.
Cashdollar, K.L., Zlochower, I.A., 2007. Explosion temperatures and pressures of metal
and other elemental dust clouds. Journal of Loss Prevention in Process Industries 20, 337-
348
CSB, 2006. Combustible Dust Hazard Study. Investigation Report for dust accidents in
U.S.: Washington, DC.
CSB, 2005. Aluminum Dust Explosion – Hayes Lemmerz International-Huntington, Inc.
Investigation Report for Hayes Lemmerz International Huntington: Washington, DC.

105
CSB, 2004. Dust Explosion – West Pharmaceutical Services, Inc. Investigation Report for
West Pharmaceutical Services: Washington, DC.
Dianous, V., Fievez, C., 2006. ARAMIS project: A more explicit demonstration of risk
control through the use of bow-tie diagrams and the evaluation of safety barrier
performance. Journal of Hazardous Materials 130, 220-233.
Eckhoff, R.K., 2003. Dust Explosions in the Process Industries, 3rd ed.; Elsevier Science:
Burlington, MA.
Eckhoff, R.K., 2009. Understanding dust explosions. The role of powder science and
technology. Journal of Loss Prevention in Process Industries 22, 105-116.
Eckhoff, R. K., Amyotte, P. R., 2010. Process Plants: A Handbook for Inherently Safer
Design, 2nd ed. CRC press.
Giby, J., Luca, M., 2010. Case study of a nylon fibre explosion: An example of explosion
risk in a textile plant. Journal of Loss Prevention in Process Industries 23, 106 -111.
John, B., Vorderbrueggen, P.E., 2011. Imperial sugar refinery combustible dust explosion
investigation. Process Safety Progress 30, 66-80.
Khakzad, N., Khan, F. I., Amyotte, P. R., 2012. Dynamic risk analysis using bow-tie
approach. Reliability Engineering and System Safety 104, 36-44.
Khakzad, N., Khan, F. I., Amyotte, P. R., 2011. Safety analysis in process facilities:
comparison of fault tree and Bayesian network approaches. Reliability Engineering and
System Safety 96, 925-932.
Khakzad, N., Khan, F. I., Amyotte, P. R., 2013. Dynamic safety analysis of process systems
by mapping bow-tie into Bayesian network. Process Safety and Environmental Protection
91, 46-53.

106
Khan, F. I., Amyotte, P. R., 2003. How to make inherent safety practice a reality. Canadian
Journal of Chemical Engineering 81, 2-16.
Kletz, T. A., 1978. What you don’t have, can’t leak. Chemistry and Industry. 287-292.
Kletz, T. A., 2003. Inherently safer design-Its scope and future. Process Safety and
Environmental Protection 81, 401-405.
Li, G., Yuan, C.M., Fu, Y., Zhong, Y.P., Chen, B.Z., 2009. Inerting of magnesium dust cloud
with Ar, N2 and CO2. Journal of Hazardous Materials 170, 180-183.
Mannan, S., 2005. Lees’ Loss Prevention in the Process Industries, vol. 3. Elsevier Science:
Burlington, MA.
Marian, G., Rudolf, K., 2012. Effectiveness of an active dust and gas explosion suppression
system. Powder Technology 92, 1-11.
Marmo, L., Cavallero, D., Debernardi, M.L., 2004. Aluminium dust explosion risk analysis
in metal workings. Journal of Loss Prevention in Process Industries 17, 449-465.
Moss, T. R., 2005. The Reliability Data Handbook. Professional Engineering Publishing
Limited
Myers, T.J., 2008. Reducing aluminum dust explosion hazards: Case study of dust in an
aluminum buffing operation. Journal of Hazardous Materials 159, 72-80.
OREDA, 2002. Offshore Reliability Data Handbook. SINTEF Industrial Management:
Norway.
Piccinini, N., 2008. Dust explosion in a wool factory: Origin, dynamics and consequences.
Fire safety Journal 43, 189-204.
Pilão, R., Ramalho, E., Pinho, C., 2006. Overall characterization of cork dust explosion.
Journal of Hazardous Materials 133, 183-195.

107
Rathnayaka, S., Khan, F. I., Amyotte, P. R., 2011. SHIPP methodology: Predictive accident
modeling approach. Part I: Methodology and model description. Process Safety and
Environmental Protection 89, 151-164.
Shahriar, A., Sadiq, R., Tesfamariam, S., 2011. Risk analysis for oil & gas pipelines: A
sustainability assessment approach using fuzzy based bow-tie analysis. Journal of Loss
Prevention in Process Industries 25, 505-523.
van dert Voort, M.M., Klein, A.J.J., de Maaijer, M., van den Berg, C.A., van Deursen, R.J.,
2007. A quantitative risk assessment tool for the external safety of industrial plants with a
dust explosion hazard. Journal of Loss Prevention in Process Industries 20, 375-386.
Zheng, Y.P., Feng, Ch.G., Jing, G.X., 2009. A statistical analysis of coal mine accidents
caused by coal dust explosions in China. Journal of Loss Prevention in Process Industries
22, 528-532.

108
6 Risk Analysis of Dust Explosion Scenarios using Bayesian
Network
Zhi Yuan1, Nima Khakzad1, Faisal Khan1*, Paul Amyotte2
1-Safety and Risk Engineering Group (SREG), Faculty of Engineering & Applied
Science, Memorial University of Newfoundland, St. John's, NL, Canada A1B 3X5
2-Department of Process Engineering & Applied Science, Dalhousie University,
Halifax, NS, Canada B3J 2X4
Preface
A version of this manuscript has been published in the Risk Analysis: an international
journal. Under supervision of co-authors, Dr(s) Khakzad, Khan, and Amyotte, the
principal author developed the dynamic risk analysis model for dust explosions and
presented its application in dealing with common causes, diagnostics and information
adaptation. The co-authors also reviewed the methodology and proposed valuable
suggestions and corrections to improve the quality of the manuscript.

109
Abstract
In this study, a risk analysis model of dust explosion scenarios based on Bayesian networks
is proposed. This model is directly transformed from a Bow-tie model of dust explosions
taking advantage of the relationship between conventional risk estimation method and
Bayesian networks. By this model, the risks of dust explosions are evaluated, taking into
account common failure causes leading to dust explosions and dependencies among causes,
and also probabilities of potential consequences are analyzed. The most critical events
leading to dust explosions can be figured out by this model. According to posterior
probabilities of primary events of dust explosions, studied using a diagnostic approach, the
primary events related to dust particle properties, oxygen concentration and safety training
are identified as the most critical factors for dust explosions. The probability adaptation
concept is also used to learn from previous experience, which helps to dynamically revise
the Bayesian network and prefigure risk by taking steps to design and implement additional
safety barriers. This model is also applied to a case study that shows it can be used to depict
the process of the accident, to estimate the risk of accidents and potential consequences,
and, more importantly, to pick out the vulnerable parts of system for dust explosions.
Key words: Dust explosion; Risk analysis; Bow-tie model; Bayesian network
6.1 Introduction
Dust explosions are frequently reported industrial accidents. The earliest records of dust
explosions date back to the late 1800s (Eckhoff, 2003). Dust explosions have caused huge
damage to human beings and property. For example, a flax dust explosion caused 58 deaths
and 177 injuries in Haerbin, China, in 1987 (Eckhoff, 2003). Therefore, better
understanding of dust explosions mechanism is necessary to prevent dust explosions and

110
reduce their effects. To this end, many experiments and simulations have been done
(Eckhoff, 2003, 2009; Amyotte et al., 2005; Callé et al., 2005; Benedetto et al., 2007;
Dufaud et al., 2009). However, due to the complexity of dust explosions, arising from a
number of uncertain and interlinked primary causes, quantitative risk analysis (QRA) of
such accidents has been limited (Voort et al., 2007; Khakzad et al., 2012).
Bow-tie (BT) is one of the widely used risk analysis tools. It integrates primary causes,
potential consequences and safety measures of an accident scenario using a graphic
approach. Dianous and Fiévez (2006) proposed a risk assessment methodology based on
BT to evaluate the efficacy of risk control measures. Mokhtari et al. (2011) evaluated risk
factors in sea ports and offshore terminals operation and management using BT. Celeste
and Cristina (2010) proposed a semi-quantitative risk assessment methodology based on
BT in the ship building industry. Yang (2011) used BT to evaluate risks of maritime security
and proposed risk management strategies for maritime supply chains. However, due to its
static characteristics, BT cannot easily be used in dynamic risk analysis unless equipped
with extra models such as physical reliability models or Bayes’ theorem (Khakzad et al.,
2012).
The Bayesian network (BN) is able to perform both predictive (forward) analysis and
diagnostic (backward) analysis. It also can consider common causes of failures,
sequentially dependent failures, expert judgment, and structural and functional
uncertainties (Khakzad et al., 2011). BN is widely used in modeling and risk analysis of a
wide variety of accidents due to its flexible structure and robust reasoning engine (Khakzad
et al., 2012; Cai et al., 2012; Khakzad et al., 2013a, b, c, d).
The parallels between conventional methods such as fault tree (FT), event tree (ET) and

111
BN have been discussed in previous work (Bobbio et al., 2001; Bearfield and Marsh, 2005;
Khakzad et al., 2011). Further, Khakzad et al. (2013a) proposed an algorithm to transform
a BT into the corresponding BN. This provides a bridge between static risk analysis and
dynamic risk analysis by combining the features of BT and BN. The present study aims to
establish a real-time risk analysis model for dust explosions using BN as an extension of a
BT model. By this real-time model, risks of dust explosions and potential consequences
resulted from dust explosions could be updated if new information is available. Also, the
critical events for dust explosions in system could be picked out, which provides evidence
for applying safety measures in systems to reduce risks of dust explosions in future.
This chapter is organized as follows: Section 6.2 briefly introduces mechanism of dust
explosions, characteristics of BT, BN and the method of mapping BT into BN. In section
6.3, a generic BN is developed for accident modeling and risk analysis of dust explosions.
To illustrate the efficacy and applicability of the developed BN, it is applied to a real dust
explosion in Section 6.4. The conclusions drawn from this work are presented in Section
6.5.
6.2 Background
6.2.1 Dust explosion
Fuel (combustible dust), oxidants, ignition sources, dispersion of dust (mixing) and
confinement have been proven to be five essential factors for a dust explosion to occur.
These factors compose the dust explosion pentagon (Kauffman, 1982) and are
indispensable in any dust explosion accident (Fig. 3.1). Fuel refers to combustible dust, the
explosibility of which is mainly influenced by particle size, and combustible dust widely
exists in various industrial areas such as aluminum products processing factories. Oxidants,

112
usually in the form of oxygen in the air, affect the dust explosion process to a very large
extent (Abbasi and Abbasi, 2007). Ignition sources, with minimal ignition temperature
(MIT) or minimal ignition energy (MIE) for a specific dust, can be classified into various
types such as hot surfaces and friction sparks. A dust cloud will be formed if dust is
suspended in the air (mixing). Only if the dust concentration is within a certain limit, will
an explosion happen. Confinement is another factor needed to build up the dust explosion
energy to cause severe damage.
There are a number of primary events contributing to the aforementioned five essential
factors, identified as indirect causes of dust explosions. In hazards assessment of industries
prone to dust explosions, determining the primary events depends on a variety of factors
such as the process flow diagram, the equipment and raw materials involved, layout of the
work area, housekeeping and management. For example, the factor of unsuitable cleaning
methods can refer to improper use of pressure air to clean depositing dust, which in turn
can cause dust to disperse in the air, forming a combustible dust cloud. Other primary events
such as the collapse of equipment can also result in dust clouds. However, in some process
industries, dust suspensions are considered normal operating conditions. For example,
pneumatic conveying technology, which is widely applied in bulk material handling
systems, carries a mixture of powdery materials via a stream of air. Therefore, more
attention should be paid to identifying hazards for such systems. In the present work, many
factors are collected from accident reports (CSB, 2004, 2005, 2006), existing regulations
(NFPA, 65, 68, 69, 91, 650, 654), and the literature (Piccinini, 2008; Abbasi et al., 2007).
As dust explosions could lead to severe consequences, safety barriers are applied to control
and mitigate damage. Explosion suppression systems are among the commonly used

113
barriers. When an explosion occurs, an explosion suppression system could be activated to
prevent further development of the dust explosion. If the suppression system fails, pressure
resulting from the dust explosion could be vented to outer spaces through venting systems
to reduce risks. Otherwise, the dust explosion overpressure can be constrained in original
units if the explosion containment and explosion isolation systems perform successfully.
An explosion containment system is usually used in small-scale units such as grinding mills
(Abbasi and Abbasi, 2007). An isolation system, on the other hand, is applied to block
possible paths to prevent dust explosions spreading to nearby units or workshops.
6.2.2 Risk analysis methods
6.2.2.1 Bow-tie method
BT is a graphical method, composed of a critical event (CE) in the center, an FT on the left,
and an ET on the right hand side of the critical event (Fig. 3.2). The CE is the top event of
the FT, and the initiating event of the ET. A BT illustrates an accident scenario, beginning
from the basic events (BE) and ending with the potential consequences (C). These
consequences result from the CE and the failure of safety barriers (SB).
6.2.2.2 Bayesian Network
The Bayesian network is an inference probabilistic method. It is a directed acyclic graph
(DAG) which is composed of nodes, arcs and conditional probability tables (CPT). Nodes
represent random variables while arcs represent dependencies among linked nodes. The
type and strength of these dependencies are defined via CPTs.
One of BN’s advantages is probability updating when new information becomes available
over time. This makes BN a robust tool in risk analysis of dynamic systems. Therefore, the
probability of dust explosions, likelihood of consequences, and the envisaged risks can be

114
updated as new operational and functional data become available through the system’s
operation. More importantly, the most critical basic events can be determined and proper
safety measures can subsequently be applied to the weakest parts of the system.
Based on the conditional dependence of variables, the joint distribution P(U) of a set of
variables U=(A1, A2, ...... , An) can be expanded as the equation (3.2). In probability
updating, prior probabilities of variables are updated (posterior probabilities) through
Bayes’ theorem given the observation of variables E, called evidence and can be
represented as the equation (3.4).
6.2.2.3 Mapping Bow-tie to Bayesian Network
In order to consider dependencies and common causes of undesired accidents, a risk
analysis model based on BT needs to be transferred into dynamic risk analysis based on
BN, which has advantages in risk updating and sequential learning. Using the algorithm
proposed by Khakzad et al. (2013a), shown in Figure 6.1, a BT can be mapped into the
corresponding BN model.

115
Fig. 6.1 Mapping BN from BT (Khakzad et al., 2013a)
6.3 Risk analysis of dust explosions
6.3.1 Dust explosion Bow-tie
In previous research (Yuan et al. 2013), detailed bow-tie analysis of dust explosion
scenarios is established (a part of the bow-tie shown in Figure. 5.3). Descriptions and
probabilities (Column 3 and 6) of basic events are listed in Table 5.1. Intermediate events,
safety barriers and potential consequences are also listed in Table 5.2. The probabilities of
a critical event and its potential consequences are calculated and listed in Table 6.1.
(Column 2).

116
Table 6.1 Probability of critical event and consequences
Consequences
Probability
(Without considering common
causes)
Probability
(Considering common
causes)
Dust Explosion 0.49E-2 0.6E-2
Near Miss 0.44E-2 0.54E-2
Mishap
(Venting success)
0.4E-3 0.5E-3
Mishap
(Isolation success)
3.43E-5 4.19E-5
Minor Damage 2.69E-6 3.28E-6
Catastrophic damage 2.99E-7 3.64E-7
Significant Damage
(Isolation Success)
3.11E-6 3.79E-6
Significant Damage
(Evacuation Success)
2.43E-7 2.97E-7
Catastrophic Damage 2.7E-8 3.29E-8
As inherent limitations of BT, common cause failures and dependency cannot be
considered. For example, X9 (Lack of design codes), X10 (Improper design codes) and X11
(Failure to follow design codes) are basic events of IE27 (Deficiency in design of
ventilation system). Meanwhile, all of them also cause the intermediate event of improper
reconstruction of ventilation system (IE29). In the BT of Figure 5.1 (a), these basic events
have been considered twice; that is, once for IE27 and once for IE29. As is shown in the
next section, this lack of modeling can result in unrealistic probabilities for both the dust
explosion and its consequences. Compared to BT, however, common causes and
dependencies can be easily modeled in a BN.
6.3.2 Dust explosion Bayesian network
The BN model of dust explosion scenarios is developed as shown in Figure 6.2. For
example, if the suppression system successfully functions at the beginning stage of a dust
explosion, a Near miss will result (Figure 6.2). In the Bayesian network model of Figure

117
6.2, arcs are pointed to the consequence node Near miss from the safety measure node
Explosion Suppression and critical event node Dust Explosion representing the influence
of the safety measures and the critical event nodes on the consequence node. Similarly,
other consequences can be mapped into the Bayesian network of Figure 6.2 from the BT
of Figure 5.3.

118
Fig. 6.2 Bayesian network model of dust explosions

119
6.3.3 Predictive analysis
BN can be applied to perform predictive analysis to obtain the probability of a dust
explosion and its potential consequences (www.hugin.com). Results from the BN model
are shown in Table 6.1. (column 3). It is worth noting that there are some differences
between the results of the BN and those of the BT. The reason is whether common cause
failures are considered in the model or not. As an example, Figure 6.3 illustrates how
considering such dependency affects the results; for this purpose, the intermediate event
IE26 and its basic causes have been selected (Figure 6.3).
(a) Ignoring dependencies
(b) Considering dependencies
Fig. 6.3 BN of IE26

120
X9, X10 and X11 are the common failure causes of IE27 and IE29. In Figure 6.3 (a), when
ignoring the dependencies between IE27 and IE29 (as in the BT model), the probability of
IE26 can be calculated as 0.4484, which is the same as the result from the BT model.
However, when X9, X10 and X11 are considered as common parent nodes, the probability
of IE26 differs from the above result. As shown in Figure 6.3 (b), when X9, X10 and X11
are seen as common causes of IE27 and IE29, the probability of IE26 is obtained as 0.3778.
Thus, as can be seen, ignoring dependencies for this special case results in an
overestimation of probabilities.
6.3.4 Risk updating
One of the main applications of BN is backward analysis or probability updating given
new information (evidence), which is difficult performed using the BT without being
coupled with other techniques (Khakzad et al., 2012). In risk updating, given that an
accident has occurred, the probabilities of the basic causes along with the potential
consequences of the accident can be revised to obtain updated probabilities. This is
helpful particularly when the most probable configuration of basic causes of the accident
is to be determined to allocate preventive safety measures. Likewise, knowing the most
probable consequences of the accident, mitigation and/or control safety measures can be
applied to alleviate the risk.
In dust explosion risk analysis, if a dust explosion or a certain consequence is observed, it
could be considered as new information in the corresponding BN model to update
probabilities.

121
Fig. 6.4 Probability Changes of critical events of dust explosions
Figure 6.4 shows the posterior probabilities of some critical nodes contributing to the dust
explosion (i.e., conditional probabilities of primary events in a dust explosion). As can be
seen, the probabilities of nodes X1 (Lack of inert dust for explosible dust) and X2 (Particle
size in explosive range) have increased to 1.0, emphasizing the critical role of
combustible dust in dust explosions. Other important factors include the nodes pertinent
to the ventilation system, i.e., X14 (Blockage in ventilation system) and X13 (Leakage of
air from ventilation system), related to safety training, i.e., X26 (Inadequately safety
trained operators in high risk working environment) and X27 (Improper procedures to
clean settled dust). Also, X31 (Lack of inert gas device), X32 (Inadequate inert gas device)
and X33 (Failure of inert gas device), which are related to the control of oxidant
concentration in a dust explosion, become more important for dust explosions according
to the updated probabilities.
According to the most probable configuration technique of BN, the most probable set of
0
0.1
0.2
0.3
0.4
0.5
0.6
0.7
0.8
0.9
1
X1 X2 X13 X14 X26 X27 X31 X32 X33
Probability
Updated Probability

122
basic events leading to a dust explosion is determined as the occurrence of X1, X2, X14,
X26 and X33 and the nonoccurrence of other primary events. Considering this, priority will
be given to the most probable configuration of the basic events to reduce the probability
of a dust explosion and thus lower the envisaged risk.
6.3.5 Sequential learning
Another important application of BN is sequential learning, experience learning, or
probability adapting. Using sequential learning, the probabilities can be updated with
information accumulated over time (Jensen and Nielsen, 2007). This information can be
in the form of accident precursors, near misses, mishaps, and incidents occurring during
an operation.
In risk analysis of dust explosions, sequential learning can be implemented considering
the previous dust explosions, occurrence of basic events from the system of interest. For
example, it is assumed that the basic events X5 (Equipment failure of ventilation system),
X34 (Overloading operation of processing equipment), X43 (Malfunction of equipment
such as belt slip), X45 (Use unsuitable tools), and X73 (Bad contact) have been observed
and recorded over a 6-week period as shown in Table 6.2.

123
Table 6.2 Records of abnormal events in 6 weeks
Week 1 2 3 4 5 6
Equipment failure of ventilation
system _ 1 _ 1 1 _
Overloading operation of processing
equipment 1 _ 2 _ 1 1
Malfunction of equipment such as belt
slip 2 1 _ 1 _ 1
Use of unsuitable tools _ 1 1 _ 1 _
Bad contact 1 _ 2 2 _ 1
According to Table 6.2, probabilities of Equipment failure of ventilation system,
Overloading operation of processing equipment, Malfunction of equipment such as belt
slip, Use of unsuitable tools and Bad contact are adapted by using relative records in
Table 6.2. Using these new probabilities, the posterior probabilities of a dust explosion
and the potential consequences can be calculated at the end of each time interval (week).
Figure 6.5 shows posterior probabilities of dust explosions and the catastrophic damage
probability over 6 weeks of the system’s operation.

124
Fig. 6.5 Probabilities of dust explosion and catastrophic damages
As Figure 6.5 shows, the probabilities of dust explosion and catastrophic damage have
increased more than two times at the sixth week, compared with week 0: the probability
of dust explosion ascends from 0.06 in week 0 to 0.0124 in week 6 and the probability of
catastrophic damage rises from 3.29E-08 in week 0 to 6.82E-08 in week 6. Although only
the trend of catastrophic damage is shown here, other consequences’ probabilities also
show a rising trend with time (weeks).
6.4 Application of the methodology
To illustrate the application of the BN developed for dust explosions, it is applied to risk
analysis of a dust explosion accident in a wool factory in Vigliano Biellese, Biella, Italy
on January 9, 2001 (Piccinini, 2008). According to the accident report (Piccinini, 2008),
the generic BN model in Figure 6.2 is tailored to model the accident scenario (Figure 6.6).
0.00E+00
1.00E-08
2.00E-08
3.00E-08
4.00E-08
5.00E-08
6.00E-08
7.00E-08
8.00E-08
0.004
0.005
0.006
0.007
0.008
0.009
0.01
0.011
0.012
0.013
0 1 2 3 4 5 6
Pro
bab
ility
of
Cat
astr
op
hic
Dam
age
Pro
bab
ility
of
Du
st E
xplo
sio
n
Week
Dust explosion
Catastrophic damage

125
Fig. 6.6 BN Model of Wool Dust Explosion
In Figure 6.6, all the node indices are the same as those in Table 5.1.
The probability of a dust explosion in the wool factory is calculated as 4.35E-02
(compared with 2.49E-02 obtained from the BT model). Also, the probabilities of the
different consequences are presented in Table 6.3.

126
Table 6.3 Probabilities of Consequences
BT model BN model
Dust explosion 2.49 E -02 4.35E-02
Minor damage 2.06 E -02 3.59E -02
Catastrophic damage
(Evacuation fails)
2.28 E -03 3.99E-03
Significant damage
(Containment fails &
Evacuation succeeds)
1.86E -03 3.25E-03
Catastrophic damage 2.07E -04 3.61E-04
Given the dust explosion, the updated probabilities of the basic events (descriptions of
basic events are shown in Table 5.1.) are shown in Table 6.4.
Table 6.4 Probabilities and updated probabilities of basic events
Symbol Description Probability Updated
Probability Symbol Description Probability
Updated
Probability
X2 Particle size in
explosive range
0.71 1.0 X35 Lack of surface
shielding/isolati
on for high
temperature
equipment
0.067 0.067
X8 Lack of regular
inspection
0.01 0.022 X37 Mechanical
failure of
equipment such
as bearings or
blowers
0.04 0.04
X14 Blockage in
ventilation
system
0.145 0.32 X38 Lack of
excessive
temperature
controlling
system
0.045 0.045
X17 Inadequate
stewardship
program of
manufacturers of
raw materials
0.09 0.20 X62 Lack of
gas/temperature
detection
system
0.045 0.045
X18 Lack of methods
to identify
hazards
0.033 0.73 X65 Unsuitable
storage methods
0.045 0.045
X20 Employee
unaware of dust
0.1 0.22 X66 Lack of fire
suppression
0.045 0.043

127
explosion hazard system
X21 Inadequate safety
training about
combustible dust
hazard
0.05 0.11 X71 Ignition of
settled dust
0.005 0.005
X24 Lack of dust-tight
system
0.045 0.099 X74 Combustion 0.3 0.3
X28 Lack of isolation
devices
0.055 0.41 X75 Lack of
separation
device to
prevent burning
dust from
entering process
system
0.045 0.045
X30 Collapse of
equipment
0.085 0.63 X78 Lack of dust
suppressants
0.1 0.22
According to the updated probabilities of Table 6.4., the most critical events are X2, X18,
X30, X28, X14, X20, X78, X17 and X21, showing the highest increase in their probabilities.
The particle size of burrs and noils in explosion range (X2) is an essential factor for this
accident. The explosivity of dust, sticking to the nets of the burr cells or gathering in an
air conditioning system, have been proven to be high according to the accident report of
Piccinini (2008). Further, the stewardship program of burrs is inadequate (X17) in this
wool factory; there is a lack of methods to identify hazards (X18). Also, employees being
unaware of dust explosion hazards (X20) and inadequate safety training about burrs
hazard (X21) are some reasons for a lack of awareness of a combustible dust hazard (IE31)
causing poor housekeeping (IE32). Small smouldering combustion events occurred almost
daily, according to the accident report (Piccinini, 2008). As one of the injured technicians
described, “the underground is a kingdom of dust” due to the lack of dust suppressant
(X78) and the application of the pneumatic conveying system. Collapse of the net that
separated the two cells (X30) was considered by Piccinini (2008) as the likely cause of
cloud dust formation. After the primary explosion happened, the dust accumulated at bag

128
filters of the air conditioning system, resulting from the blockage in the ventilation system
in storage cells (X14), was aroused by pressure waves caused by the primary explosion
and the lack of isolation devices between cells and bag filters (X28) leading to the pressure
transmission from cells to bag filters. According to Piccinini (2008), at least 400-500kg
flammable fibers, mainly on the ground floor equipment, such as bag filters of air
conditioners, were involved in this deflagration. Further, based on the most probable
configuration analysis, the particle size of burrs and noils in explosion range (X2),
blockage in the ventilation system in storage cells (X14), and collapse of the net that
separated the two cells (X30) are determined as the most probable causes of the accident.
All these events are the essential components of the dust explosion pentagon as are
oxygen underground and complex ignition sources in this case. Therefore, the results
obtained from the BN model in this study are in agreement with those of the accident
report (Piccinini, 2008). Also, the most critical events for this dust explosion have been
explored through Bayesian model analysis, illustrating the priority of safety measures for
this wool factory.
6.5 Conclusions
In the present research, a risk analysis model of dust explosions was developed based on
the Bayesian network. Probabilities of dust explosions and potential consequences were
calculated using the BN compared with BT developed in a previous study. The
differences between the results of BT and BN highlight the importance of considering
common failure causes and dependencies in complex accident scenarios such as dust
explosions.
Taking advantage of probability updating and sequential learning of BN, a dynamic risk

129
analysis of dust explosions was also conducted. The critical basic events as well as the
most probable configuration of basic events leading to a dust explosion were identified.
These are particle properties, oxygen concentration and safety training. The current study
also demonstrated the value of experience learning when accident related data over time
is available. The model is tested and verified using the study of a past accident.
Acknowledgments
The authors gratefully acknowledge the financial support provided by the Natural Science
and Engineering Research Council of Canada (NSERC) and a Vale Research Chair Grant.
6.6 References
Abbasi, T., Abbasi, S., 2007. Dust explosions-Cases, causes, consequences and control.
Journal of Hazardous Materials 140, 7-44.
Amyotte, P., Basu, A., Khan, F., 2005. Dust explosion hazard of pulverized fuel carry-
over. Journal of Hazardous Materials 122, 23-30.
Amyotte, P., Eckhoff, R., 2010. Dust explosion causation, prevention and mitigation: An
overview. Journal of Chemical Health and Safety 17, 15-28.
Bearfield, G., Marsh, W., 2005. Generalising event trees using Bayesian networks with a
case study of train derailment. Computer Safety, Reliability, and Security 3688, 52-66.
Benedetto, A., Russo, P., 2007. Thermo-kinetic modeling of dust explosions. Journal of
Loss Prevention in Process Industries 20, 303-309.
Bobbio, A., Portinale, L., Minichino, M., Ciancamerla, E., 2001. Improving the analysis
of dependable systems by mapping fault trees into Bayesian networks. Reliability
Engineering and System Safety 71, 249-260.

130
Cai, B. P., Liu, Y. H., Liu, Z. K., Tian, X. J., Dong, X., Yu, S. L., 2012. Using Bayesian
networks in reliability evaluation for subsea blowout preventer control system. Reliability
Engineering and System Safety 108, 32-41.
Callé, S., Klaba, L., Thomas, D., Perrin, L., Dufaud, O., 2005. Influence of the size
distribution and concentration on wood dust explosion: Experiments and reaction model.
Powder Technology 157, 144-148.
CSB, 2006. Combustible Dust Hazard Study. Investigation Report for dust accidents in
U.S.: Washington, DC.
CSB, 2005. Aluminum Dust Explosion – Hayes Lemmerz International-Huntington, Inc.
Investigation Report for Hayes Lemmerz International Huntington: Washington, DC.
CSB, 2004. Dust Explosion – West Pharmaceutical Services, Inc. Investigation Report for
West Pharmaceutical Services: Washington, DC.
Celeste, J., Cristina, S., 2010. A semi-quantitative assessment of occupational risk using
bow-tie representation. Safety Science 48, 973-979.
Dianous, V., Fievez, C., 2006. ARAMIS project: A more explicit demonstration of risk
control through the use of bow-tie diagrams and the evaluation of safety barrier
performance. Journal of Hazardous Materials 130, 220-233.
Dufaud, O., Perrin, L., Traore, M., Chazelet, S., Thomas, D., 2009. Explosions of
vapour/dust hybrid mixture: A particular class. Powder Technology 190, 269-273.
Eckhoff, R., 2003. Dust Explosions in the Process Industries. 3rd ed. Oxford: Gulf
Professional Publishing.
Eckhoff, R., 2009. Understanding dust explosions: The role of powder science and
technology. Journal of Loss Prevention in Process Industries 22, 105-116.

131
Jensen, F., Nielsen, T., 2007. Bayesian network and Decision Graphs. 2nd ed. New York:
Springer.
Kauffman, C., 1982. Agricultural dust explosions in grain handling facilities, Waterloo:
University of Waterloo Press; 305–347.
Khakzad, N., Khan, F., Amyotte, P., 2011. Safety analysis in process facilities:
Comparison of fault tree and Bayesian network approaches. Reliability Engineering and
System Safety 96, 925-932.
Khakzad, N., Khan, F., Amyotte, P., 2012. Dynamic risk analysis using bow-tie approach.
Reliability Engineering and System Safety 104, 36-44.
Khakzad, N., Khan, F., Amyotte, P., 2013a. Dynamic safety analysis of process systems
by mapping bow-tie into Bayesian network. Process Safety and Environmental Protection
91, 46-53.
Khakzad, N., Khan, F., Amyotte, P., 2013b. Risk-based design of process systems using
discrete-time Bayesian networks. Reliability Engineering and System Safety 109, 5-17.
Khakzad, N., Khan, F., Amyotte, P., Cozzani, V., 2013c. Domino effect analysis using
Bayesian networks. Risk Analysis 33, 292-306.
Khakzad, N., Khan, F., Amyotte, P., 2013d. Quantitative risk analysis of offshore drilling
operations: A Bayesian approach. Safety Science 57, 108-117.
Mokhtari, K., Ren, J., Roberts, C., Wang, J., 2011. Application of a generic bow-tie based
risk analysis framework on risk management of sea ports and offshore terminals. Journal
of Hazardous Materials 192, 465-475.
NFPA 65, 1970. Code for the Processing and Finishing of Aluminum, National Fire
Protection Association.

132
NFPA 68, 2002. Guide for Venting of Deflagrations, National Fire Protection Association.
NFPA 69, 1997. Standard on explosion prevention system. National Fire Protection
Association.
NFPA 91, 2010. Standard for Exhaust Systems for Air Conveying of Vapors, Gases, Mists,
and Noncombustible Particulate Solids. National Fire Protection Association.
NFPA 650, 1998. Standard for Pneumatic Conveying Systems for Handling Combustible
Particulate Solids. National Fire Protection Association.
NFPA 654, 2000. Standard for the prevention of fire and dust explosions from the
manufacturing, processing and handling of combustible particulate solids. National Fire
Protection Association.
Piccinini, N., 2008. Dust explosion in a wool factory: Origin, dynamics and consequences.
Fire safety Journal 43, 189-204.
Van dert Voort, M. M., Klein, A.J. J., de Maaijer, M., van den Berg, A. C., van Deursen, J.
R., 2007. A quantitative risk assessment tool for the external safety of industrial plants
with a dust explosion hazard. Journal of Loss Prevention in Process Industries 20, 375-
386.
Yang, Y. Ch., 2011. Risk management of Taiwan’s maritime supply chain security. Safety
Science 49, 382-393.
Yuan, Z., Khakzad, N., Khan, F., Amyotte, P., Reniers, G., 2013. Risk-based Design of
Safety Measures to Prevent and Mitigate Dust Explosion Hazards. Industrial &
Engineering Chemistry Research 52, 18095-18108.

133
7 Risk-based Optimal Safety Measure Allocation for Dust
Explosions
Zhi Yuan1, Nima Khakzad1, Faisal Khan1*, Paul Amyotte2
1-Safety and Risk Engineering Group (SREG), Faculty of Engineering & Applied Science,
Memorial University of Newfoundland, St. John's, NL, Canada A1B 3X5
2-Department of Process Engineering & Applied Science, Dalhousie University, Halifax,
NS, Canada B3J 2X4
Preface
A version of this manuscript has been published the journal of Safety Science. Under
supervision of co-authors, Dr(s) Khakzad, Khan, and Amyotte, the principal author
developed the research on the entitled topic. The co-authors also reviewed the methodology
and proposed valuable and necessary suggestions and corrections to improve the quality of
the manuscript.

134
Abstract
Optimal allocation of safety measures in order to reduce threats of dust explosions is very
challenging, particularly when all potential accident contributors and various safety
measures are to be taken into account. In this paper, we have proposed a risk-based optimal
allocation of safety measures while considering both available budget and acceptable
residual risk. The methodology is based on a Bayesian network (BN) to model the risk of
dust explosions, which in turn helps to identify key contributing factors, assess
performances of relative safety measures, and decide on those safety measures to most
efficiently control the risks of dust explosions within a limited budget. The Bayesian
network also facilitates the implementation of diagnostic analysis to determine vulnerable
parts in the system to which special attention should be paid in safety measure allocation.
The Net Risk Reduction Gain (NRRG) for each relevant safety measure is also used to
simultaneously account for both the cost of a safety measure and the respective risk
reduction. Accordingly, the risk-based optimal allocation of safety measures will be
achieved by maximizing the sum of the NRRG of all relevant safety measures under limited
budgets, which is regarded as a knapsack problem. We applied the methodology to the
aluminum dust explosion that occurred at Hayes Lemmerz International, Huntington,
Indiana, US in October 2003. The result shows the efficacy and applicability of the
proposed methodology for optimal risk reduction within a limited budget.
Key Words: Risk analysis model, dust explosions, safety measures, optimization, Bayesian
network

135
7.1 Introduction
Dust explosions have been reported as a wide-ranging threat to industrial safety in recent
decades (Blair, 2007; Zheng et al., 2009; Giby and Luca, 2010), having caused huge losses
in terms of operators, shareholders, assets and the environment (CSB, 2004, 2005a, b, 2006).
According to previous work (Abbasi, 2007), fuel, oxidant, ignition source, suspension, and
confinement are five essential elements for every dust explosion. Accordingly, safety
measures proposed to avoid or prevent dust explosions are mainly aimed at eliminating one
or more of these essential factors. For example, the use of an explosion-proof vacuum to
remove accumulated dust layers is usually intended to eliminate the possibility of
suspension in areas with high explosion risks (Amyotte et al., 2009). In real cases, each
essential element might be provided or triggered by a series of factors. For example, settled
dust might be suspended by various causes such as incorrect methods of housekeeping or
pressure waves from nearby explosions, to form a combustible dust cloud. Since each
causation factor could further result from other lower level root causes, a large number of
factors, directly or indirectly, could contribute to industrial dust explosions. Further, there
are numerous relevant safety measures to prevent and control dust explosions, ranging from
inherent to engineering to procedural safety measures, each with their own specific
characteristics and applications. The complexities of potential dust explosions on one hand,
and the versatility of pertinent safety measures on the other, introduce significant
challenges in optimal allocation of safety strategies for dust explosions. Ideally, safety
measures should be assigned to all dust explosion contributing factors in a process plant;
however, the available budgets for system safety improvements are usually limited in reality.
Therefore, decision-makers often face the dilemma of balancing risk reduction with the

136
costs of safety measures.
Recently, there have been attempts to develop probabilistic models for risk analysis and
safety assessment of combustible dust (Hassan et al., 2013) and dust explosions (Van der
Voort et al., 2007; Yuan et al., 2013; Yuan et al., 2014). Van der Voort et al. (2007) proposed
a quantitative risk analysis tool for the external safety assessment of industrial plants prone
to dust explosion hazards. Yuan et al. (2013, 2014) developed a generic risk model for
likelihood modeling and safety analysis of dust explosions based on the bow-tie and
Bayesian network (BN). In their model, an attempt has been made both to consider as many
dust explosion root causes as possible and to collect and categorize pertinent safety barriers.
Since the present work is based on the work of Yuan et al. (2014), the BN and the
explanation of its components are shown in Figure 6.2 and Tables 5.1 and 5.2, respectively.
Caputo et al. (2013) proposed a multi-criteria “knapsack” model to select safety measures
via a balancing between risk reduction (benefit) and cost of safety measures. In a similar
approach, Reniers and Sörensen (2013) proposed an optimization model based on a risk
matrix. However, the lack of risk models in the foregoing methods means that the risk of
accidents and the effects of safety measures on estimated risk are based mainly on
subjective judgments of decision-makers. The current paper proposes a risk-based
optimization method for allocation of safety measures to avoid or prevent dust explosions
based on dynamic risk analysis with the advantage of identifying the most critical factors
when assigning the safety measures.
The paper is organized as follows. The fundamentals of the risk analysis model for dust
explosions and the functions of relevant safety measures are recapitulated in Section 7.2.
The developed methodology for risk-based optimal allocation of safety measures is then

137
presented in Section 7.3. To verify the efficacy of the model, it is applied to a case-study in
Section 7.4 while the main conclusions are summarized in Section 7.5.
7.2 Background
7.2.1 Bayesian networks
BN are directed acyclic graphs used to represent random variables and dependencies among
them by means of chance nodes and directed arcs. Accordingly, the type and strength of
such dependencies are modeled via conditional probability tables. Like conventional risk
analysis methods such as fault tree and bow-tie, BN can be used to perform prognostic
(forward) analysis. However, the main advantage of BN over fault tree and bow-tie is its
ability to perform diagnostic (backward) analysis or probability updating when new
information becomes available. Compared to prior probabilities, posterior (updated)
probabilities are more reliable and reflect the real-time situation of the system of interest,
as the newest information and operational data are taken into account (Khakzad et al., 2011).
Therefore, the most critical factors contributing to an accident can be defined based on a
comparison between prior and posterior probabilities if the occurrence of the accident is set
as the evidence.
According to the local conditional dependence of variables, the joint distribution P(X) of a
set of variables X=(X1, X2, ... , Xn) can be factored as the equation 3.2.
Using Bayes’ theorem, prior probabilities of variables can be updated given the evidence
E, as the equation 3.4.
The following case is a simplified evacuation model by using a free-fail boat and a rescue
boat in an offshore system (Eleye-Datubo et al., 2006). The explanations of the symbols
are shown in Figure 7.1.

138
Fig. 7.1 Simplified BN showing a marine evacuation scenario (Eleye-Datubo et al.,
2006)
Based on equation 7.1, the probability of free-fail boat launch, P(B), and the probability
of rescue boat launch, P(C), can be calculated as:
𝑃(𝐵) = 𝑃(𝐵|𝐴)𝑃(𝐴) + 𝑃(𝐵|��)𝑃(��) = 0.96 ∗ 0.355 + 0.08 ∗ 0.645 = 0.392
𝑃(𝐶) = 𝑃(𝐶|𝐴)𝑃(𝐴) + 𝑃(𝐶|��)𝑃(��) = 0.65 ∗ 0.355 + 0.05 ∗ 0.645 = 0.263
Assuming the launching of free-fail boat already happened, which is set as the evidence,
the prior probabilities of A and C can be updated respectively as:
𝑃(𝐴|𝐵) =𝑃(𝐵|𝐴)𝑃(𝐴)
𝑃(𝐵)=
0.96 ∗ 0.355
0.392= 0.869
𝑃(𝐶) = 𝑃(𝐶|𝐴)𝑃(𝐴) + 𝑃(𝐶|��)𝑃(��) = 0.65 ∗ 0.869 + 0.05 ∗ 0.131 = 0.571
7.2.2 Safety measures
Based on risk management principles, safety measures can be divided into three types:
inherent, engineered, and procedural. Inherent safety measures eliminate hazards by
focusing on the properties of materials or making improvements in the design stage without
additional equipment. Minimization, substitution, moderation and simplification are the
four key principles in inherent safety (Amyotte et al., 2007, 2009; Kletz, 1978, 2003). For

139
example, the removal of deposited combustible dust via good housekeeping can effectively
reduce the concentration in a potentially combustible dust cloud. Therefore, it can be
considered as minimization in the context of inherent safety measures, with strong
overtones of procedural safety (Amyotte et al., 2009). However, engineered safety
measures rely on additional safety equipment. According to their method of operation, they
are further classified into passive or active devices. Unlike active safety measures, passive
safety measures do not depend on an external activator, actuator or human intervention,
making them more reliable than active safety measures. For procedural safety measures
(e.g., safety training), however, the focus is mainly on system management to improve
human performance (e.g., reducing human response time) or eliminate human errors.
In safety decision making, inherent safety measures are usually given priority, compared to
the other types of safety measures. Aside from inherent safety measures, passive safety
measures are preferred next as they do not depend on external controlling or activating
systems. Next to passive are active safety measures while the last option would be
procedural safety measures. The recommended order of safety measures selection is shown
in Figure 7.2 (in the direction of the arrowhead).
Fig. 7.2 Recommended preference of safety measures
In terms of the influence safety measures have on risk, they can be further labeled according
to four keywords: avoid, prevent, control and mitigate. To be labelled using the avoid and

140
prevent keywords, a safety measure should be applied before an accident occurs. After
application of an avoid safety measure, the abnormal event will not happen. However, a
prevent safety measure reduces the occurrence probability of a certain event. Classifying
the control and mitigate keywords, these safety measures are mainly employed after an
accident occurs in order to control or reduce the resulting damage (Dianous et al., 2006).
Depending on the functioning or malfunctioning of safety measures, their impacts on the
likelihood of abnormal events can be derived using the “Law of Total Probability”. For
example, if magnetic equipment (SMme) is installed in an inlet to prevent tramp metal from
entering the system to prevent impact sparks, then the probability of tramp metal entering
the system, P(TM) is:
P(TM) = P(TM|SMme) ∗ P(SMme) + P(TM|SMme ) ∗ P(SMme
) (7.1)
In the above equation, P(SMme) stands for the failure probability of magnetic equipment;
P(TM|SMme) refers to the conditional probability of tramp metal entering the system given
the failure of magnetic equipment. Similarly, P(TM|SMme ) is the conditional probability
of tramp metal entering the system given the functioning of the magnetic equipment.
Further information about the classification and function of safety measures can be found
in Dianous et al. (2006) and Yuan et al. (2013).
7.2.3 Potential losses from accidents
To calculate the risk of an accident scenario, the essential information needed is the
potential damage resulting from the accident along with the probability of the accident.
Usually, accidents result in damage to either tangible assets such as equipment or intangible
assets such as market value or company reputation. Compared to tangible losses, the

141
intangible damages are more difficult to assess and are thus often ignored in risk
assessments. For example, Capelle-Blancard and Marie-Aude (2010) discussed the loss of
market value caused by accidents and found that shareholders suffer a significant loss of
about 1.3% in the two days following an accident.
In the current research based on the severity of dust explosions, potential consequences are
classified as: near miss, mishap, minor damage, significant damage and catastrophic
damage. Category definitions were given in our previous work (Yuan et al., 2013), and are
also listed in Table 7.1.
Table 7.1 Classification of consequences
Consequence Description
Near miss Dust explosion is controlled at its initial stages, and the system can be recovered
quickly.
Mishap
Process is interrupted, and more time is needed to recover the system compared
to that of a near miss. However, no damage is caused to apparatus/equipment or
harm to operators.
Minor damage Equipment may be damaged, and superficial injuries are expected.
Significant
damage Equipment is damaged along with the possibility of serious injury or death.
Catastrophic
damage Major facility damage is caused, and several fatalities are expected.
The damage of different consequences can be weighted by equivalent economic losses as
shown in Table 7.2, which is adopted from the consequence severity matrix proposed by
Kalantarnia (2009).

142
Table 7.2 Consequence severity matrix (adopted from Kalantarnia, 2009)
Consequence Dollar
value
equivalent
Asset loss Human loss Environment loss Reputation
Near miss 0.01K-1K Short term production
interruption No injury
Around the operating
unit, easy recovery
and remediation
Get noticed by the
operation line
workers/line supervisor
Mishap 1K-50K Medium term
production interruption No injury
Around the operating
line, easy recovery
and remediation
Get noticed in plant
Minor
damage 50K-0.5M
Equipment damage of
one or more units
requiring repair/long
term production
interruption
Superficial
injuries
Within plant, short
term remediation
effort
Get attention in the
industrial complex,
information shared with
neighboring units
Significant
damage 0.5M-50M
Loss of major portion
of equipment/product
Multiple major
injuries, potential
disabilities,
potential threat to
life, or one fatality
Minor offsite impact
Local media coverage
or regional media
coverage, brief national
media note
Catastrophic
damage >50M
Loss of all
equipment/product Multiple fatalities
Community
evacuation
National media
coverage, brief note on
international media
7.3 Approach for optimal safety strategies for dust explosions
The main steps for risk-based optimization of safety measures are expressed in Figure
7.3. The protocol is a combination of a risk analysis model for dust explosions and an
optimization method to help decision-makers search for the most efficient safety strategy.
Explanation of these steps can be found in the following subsections.

143
Fig. 7.3 Flow chart of the proposed optimization method
Step 1-Development of risk analysis model for dust explosions using Bayesian network:
Considering a specific case study, the generic BN developed in Figure 6.2 for risk
analysis of dust explosions will be tailored by adding or eliminating factors to fit the case
study of interest.
The dust explosion accident at CTA Acoustics, Inc. in Corbin, USA, in 2003 (CSB,
2005a) caused seven deaths and 37 injuries, and is chosen as an example to illustrate the

144
methodology. According to the accident report provided by CSB (2005a), the phenolic
resin dust was identified as the contributor for this accident. The dust explosion was
triggered by the fire escaping through an open oven door and occurred in the area near the
oven in line 405. It the risk model of the dust explosion is developed as shown in Figure
7.4.
Fig. 7.4 Risk model of CTA dust explosion
Most of the symbols appearing in Figure 7.4 are the same as those used in the generic
model. Some alteration, however, is required to better represent the case study under

145
consideration. For example, in the CTA Acoustics case, the ignition source might have
been the fire caused by combustible materials in the oven of line 405. At the same time,
as the oven door was improperly opened, the fire would have propagated from the oven to
nearby spaces. To accurately depict this process, IE43, standing for Fire propagated from
oven in line 405, is added to the risk model as shown in Figure 7.4. This modification and
other specific nodes for this case and their corresponding descriptions are listed in Table
7.3.
Table 7.3 Specific intermediate events added to the risk model of Figure 6.4
Symbol Description
IE43 Fire propagated from oven in line 405
IE44 Accumulated combustible materials caught fire in oven
IE45 Door of oven was improperly opened
Step 2- Analyze critical factors in system: As mentioned above, one of the advantages of
BN is to utilize the latest known information (evidence) of some nodes to renew the
probabilities of other nodes of a system. In this step, the occurrence of the critical event,
i.e., dust explosion, is set as evidence. Then the probability of all contributing factors can
be updated accordingly to yield posterior probabilities. Among these posterior
probabilities, the factors with the highest values are considered as more important
contributors to the dust explosion than others. Therefore, they should be given priority in
safety improvement design. For this reason, the posterior probabilities of the CTA
Acoustics dust explosion have been calculated, and the most important contributing
factors are presented in Figure 7.5 and their descriptions are shown in Table 7.4 (column
2).

146
Fig. 7.5 Critical factors of CTA Acoustics dust explosion
Step 3- Selection of safety measures for critical factors: After obtaining the critical factors
for the system, individual safety measures should be proposed according to suggestions
made by experts. Some safety measures for each factor of the generic model of dust
explosions have been recommended in our previous work (Yuan et al., 2013). In the case
that more than one safety measure is suggested for a critical factor, the safety measures
should be categorized first according to risk management principles. Priority should then
be given to inherent, engineered and procedural safety measures in that order.
For the CTA Acoustics case, potential safety measures for each critical factor and the
relevant categories are listed in Table 7.4:
Table 7.4 Safety measures for critical factors
Symbol Description Safety Measures Category
X8 Inadequate regular
cleaning
Ensure combustible materials could be
removed from oven in time
Inherent,
Procedural
X16 Not strictly
applying relevant
guideline
Strictly follow NFPA 654, NFPA 86 and
CTA Acoustics incident investigation
program
Procedural
0
0.1
0.2
0.3
0.4
0.5
0.6
0.7
0.8
0.9
1
X8 X16 X39
Pro
ba
bil
ity
Basic Event
Prior
Posterior

147
X39
Failure of
excessive
temperature
controlling system
Install excessive temperature controller
with higher reliability Inherent
Install new excessive temperature
controller (same type)
Active
Engineered
Repair broken excessive temperature
controller in time Procedural
As shown in Table 7.4, three possible safety measures have been proposed for basic event
X39 and classified into inherent, engineered and procedural safety, respectively (shown in
dashed box). According to the recommended order of preference, the inherent safety
measure, Install excessive temperature controller with higher reliability, is chosen as the
safety measure for X39 together with the safety measures for X8 and X16 as presented in
Table 7.4.
Step 4- Estimate effects of safety measures on risk reduction: Risk can be defined as:
Risk = ∑ Pi ∗ Lini=1 (7.2)
where Pi refers to the probability of the i-th consequence, and Li stands for the
corresponding losses, which are usually converted into equivalent financial losses.
Risk Reduction Index (RRI) is defined to represent the effect of a safety measure on the
system risk:
RRIi =(Rb − Rai)
Rb⁄ (7.3)
where Rb is the risk of the system before application of safety measures; Rai is the risk of
the system after the application of the i-th safety measure.
Thus, RRIi must fall between 0 and 1. The closer to 1, the more efficient the i-th safety
measure is with respect to risk reduction.
148
To obtain the RRI of each safety measure in the CTA Acoustics case, safety measure effects
on either the probabilities of the basic events (Table 7.5) or those of the accident and
potential consequences (Table 7.6) should be calculated.
Table 7.5 Probabilities of basic events with and without safety measures
Safety
Measure
Without
safety
measure
With safety measure
X8 0.010 P(X8) = P(X8|SMX8)P(SMX8) + P(X8|SMX8 )P(SMX8
)
= 0.01 ∗ 0.01 + 0.005 ∗ 0.99 = 0.005
X16 0.045 P(X16) = P(X16|SMX16)P(SMX16) + P(X16|SMX16 )P(SMX16
)
= 0.045 ∗ 0.01 + 0.025 ∗ 0.99 = 0.025
X39 0.080 P(X39) = 0.040 (new controller with higher reliability)
Table 7.6 Probabilities of critical events and consequences with and without safety
measures
Without safety
measure
With
SMX8
With
SMX16
With
SMX39
Dust Explosion 4.97E-5 2.63E-5 2.78E-5 3.23E-5
Near Miss * * 2.50E-5 *
Significant Damage(Isolation Success) 4.57E-5 2.42E-5 2.56E-6 2.97E-5
Significant Damage(Evacuation
Success) 3.58E-6 1.90E-6 2.00E-7 2.32E-6
Catastrophic Damage(Evacuation
failure) 3.97E-7 2.11E-7 2.22E-8 2.58E-7
To calculate the RRI of each safety measure, the potential financial losses caused by the
dust explosion are also estimated according to Table 7.2. For example, according to the
description of a near miss in Table 7.2, the losses are mainly from the short term
production interruption. Here, we assume the time for recovering a unit is one hour and
the loss resulting from the production interruption is $850/hour. Therefore, the loss of a

149
near miss equals $850. Similarly, the other losses for different categories of damage can
be estimated for the CTA Acoustics case and the results are listed in Table 7.7.
Table 7.7 Potential losses of CTA Acoustics dust explosion
Near Miss
Significant
Damage
(Isolation success)
Significant Damage
(Evacuation success)
Catastrophic
Damage
(Evacuation fail)
Dollar value
equivalent
($)
850 7 000 000 50 000 000 170 000 000
Then, based on Equation (7.4), the risk before application of safety measures can be
calculated as:
Rb = 4.57e − 5 ∗ 7000000 + 3.58e − 6 ∗ 50000000 + 3.97e − 7 ∗ 170000000 = 566.320
Similarly, the risk after the application of a certain safety measure and the corresponding
RRI can be obtained (Table 7.8).
Table 7.8 Risk after application of safety measures and RRI
Safety
measure
Risk after application of safety
measure RRI
SMX8 300.270 0.470
SMX16 31.715 0.944
SMX39 367.760 0.351
Step 5- Estimate cost of each safety measure: In this research, fixed cost and regular
operation cost are estimated to form an Operation and Fixed Cost (OFC) index as
expressed by Equation (7.4):
OFC = fixed cost + regular operation cost (7.4)

150
For safety measures requiring additional equipment, such as installation of fire
extinguishing equipment in the system, the fixed cost refers to the expense for purchasing
equipment and regular operation cost mainly includes the costs of installation, personnel
training for new equipment, and regular maintenance.
For different types of safety measures, expenditure on equipment and on operation
presents different characteristics. For example, for safety measures relying on
management, the majority of the cost is due to regular operation. For example, the cost of
the safety measure taking safety training to enforce consciousness for combustible dust
hazards is mainly used for organizing safety training and hiring safety trainers. However,
for safety measures involving additional equipment, the fixed cost might be much higher
than the operation cost. Compared to the fixed cost of equipment, the cost of operation
will accompany each operation and maintenance procedure. A typical example is the
installation of suppression systems. After purchasing the equipment, maintenance and
training might continue throughout the equipment’s lifetime. The fixed cost of equipment
can usually be readily obtained from suppliers. Operation cost should be further analyzed
for individual cases.
Cost potential index (Ci) of safety measure i can be expressed as:
Ci = OFC/CB (7.5)
where CB stands for the budget allocated for the safety strategy.
According to this definition, Ci of a suitable safety measure should be between 0 and 1. If
Ci>1; then, the cost of a given safety measure is beyond the budget, which means the safety
measure must be excluded from the potential safety measure list. The closer to 0, the less

151
amount of the budget the safety measure costs.
To better represent the usage of the methodology, assuming the budget for safety
improvement at CTA Acoustics is $23000 (because of less than this number, this optimal
problem will be simplified as an either-or question, either SMX8 and SMX39 or SMX16 and
SMX39.). Then OFC and Ci for each safety measure can be calculated respectively (Table
7.9).
Table 7.9 OFC and Ci of safety measures
Safety Measure Fixed cost Operation cost OFC Ci
SMX8 0 $8000 $8000 0.348
SMX16 $2000 $13000 $15000 0.652
SMX39 $1500 $3000 $4500 0.196
Step 6- Calculate Net Risk Reduction Gain of each safety measure: Net Risk Reduction
Gain (NRRG) index of safety measure i is also defined in this work as:
NRRGi = ω1 ∗ RRIi − ω2 ∗ Ci (7.6)
Where ωi is a weighting factor indicating the importance of a particular objective estimated
by decision makers. It should be noted that ω1 + ω2 = 1.
The net gain of risk reduction brought about by safety measure i will be reduced, because
the high cost of safety measure i might make an analyst hesitate to apply the safety
measure.
In the CTA Acoustics case, assuming that both risk reduction and cost are of the same
importance would result in ω1=ω2=0.5. Table 7.10 presents the results for NRRG
calculation.

152
Table 7.10 NRRG of safety measures
SMX8 SMX16 SMX39
NRRG 0.061 0.146 0.078
Step 7- Develop optimization model to select suitable safety measure: The objective is to
maximize the sum of NRRGi; that is, the net gain of risk reduction should be the greatest
after the application of the optimal safety strategy under the constraint of the limited
available budget, which appears to be a typical knapsack problem. So the objective and
constraint functions can be established as:
Maxz = ∑ NRRGjxjnj=1 (7.7)
s.t.{∑ Cjxj ≤ CB
nj=1
xj = 0 or 1 (j = 1, … , n)
where Cj is the cost of safety measure j, and CB is the budget for safety improvement. When
safety measure j is chosen, xj equals 1. Otherwise, xj equals 0.
The objective and constraint functions can be developed for the CTA Acoustics case as:
Maxz = ∑ NRRGjxjj for j=8, 16, and 39 (7.8)
s.t.{∑ Cjxj ≤ 23000$ j
xj = 0 or 1 (for j = 8, 16, and 39)
Solving the above set of equations, the results will be x= (0, 1, 1), which means SMX8 will
not be considered while SMX16 and SMX39 should be taken into account in an optimal safety
strategy. As a result, the maximum net risk reduction 0.2235 will be gained while satisfying
the financial constraints.
7.4 Case study

153
7.4.1 Introduction
To further illustrate the application of the methodology, the dust explosion at Hayes
Lemmerz International-Huntington, Inc. Indiana, USA, in 2003 (CSB, 2005b) is considered.
According to the investigation report, this accident “occurred in the scrap reprocessing area,
destroyed the dust collection system outside the building, lifted a portion of the building
roof above one furnace and ignited a fire for several hours”(CSB, 2005b). CSB (2005b)
concluded this explosion might have originated in the dust collector and propagated to the
drop box, then traveled to Furnace 5 and ignited accumulated dust in the vortex box. The
layout of the equipment is shown in Figure 7.6.
Fig. 7.6 Layout of equipment (CSB, 2005b)
7.4.2 Optimal safety measures allocation for Hayes Lemmerz dust explosion
The risk analysis model given in Figure 7.7 for the dust explosion at Hayes Lemmerz was
established using the generic model and using the details in CSB (2005b). The
corresponding symbols appearing in this model and their descriptions can be found in

154
Tables 5.1 and 5.2.
Fig. 7.7 Risk analysis model of dust explosion for Hayes Lemmerz
Most of the symbols in Figure 7.7 are the same as those presented in the generic model in
Figure 6.2. However, some new nodes have been added, and small changes have been made
to tailor the generic model to fit this specific case study. For example, the basic event
chemical reaction between rusty tramp metal and aluminum dust is suspected as one of the
likely ignition sources for this accident (CSB, 2005b). Therefore, this event is added to the
model as X80 as shown in Figure 7.7. Likewise, lack of vibratory separator at dryer outlet,
X81, which leads to dust accumulation on surfaces inside vortex box, side well and fume

155
hood, IE43, are added to the model accordingly.
Based on the above risk analysis model for Hayes Lemmerz, the occurrence of the dust
explosion is set as evidence to update prior probabilities of all the basic events (Columns 3
and 7 in Table 7.11).
The increased ratio can be simply calculated as: Increased ratio = (Posterior − Prior) ⁄
Prior. Results are listed in Columns 4 and 8 of Table 7.11.
It can be seen that all posterior probabilities are greater than the respective prior
probabilities. Basic events with the highest increased ratios and higher posterior values
are assumed to have made a greater contribution to the dust explosion and are thus
selected as critical factors that need to be improved (shown in bold type in Table 7.11).
Table 7.11 Prior and Posterior Probabilities of Basic Events
Symbol Prior Posterior Increased
Ratio Symbol Prior Posterior
Increased
Ratio
X3 0.010 0.01428 0.428 X44 0.050 0.08077 0.615
X6 0.033 0.03308 0.002 X50 0.045 0.07594 0.688
X8 0.010 0.01002 0.002 X71 0.005 0.00728 0.456
X15 0.100 0.95547 8.555 X74 0.300 0.43694 0.457
X18 0.033 0.03308 0.002 X75 0.045 0.23496 4.221
X19 0.090 0.09022 0.002 X79 0.0078 0.00873 0.119
X20 0.100 0.10024 0.002 X80 0.050 0.76825 14.365
X21 0.050 0.05012 0.002 X81 0.083 0.11856 0.428
X28 0.055 0.09708 0.765
Having identified the critical factors, relevant safety measures for each critical factor are
proposed, as listed in Table 7.12.
As can be seen from Table 7.12, there could be more than one potential safety measure
allocated to critical event X28 (shown in dashed box). Based on the proposed risk
management principles, the safety measure Install new isolation equipment belongs to the
category of active engineered safety measures. Thus, compared to the other two

156
procedural safety measures, i.e., Conduct safety training to ensure correct installation of
isolation devices and Conduct regular inspection, the engineered safety measure is given
priority, and is selected as the potential safety measure for X28. Further, it can be observed
that if a magnetic separator is installed in the system, probabilities of impact sparks
caused by tramp metal and chemical reaction between rusty tramp metal and aluminum
powders could be reduced at the same time. Thus, for these two critical events, the same
safety measure is adopted.
Table 7.12 Safety measures for potential optimization objects
Symbol Safety Measure Symbol Safety Measure
X3 Clean up accumulated dust at filter X74 Enforce housekeeping or maintenance of
fume hood to reduce deposits
X15 Improve structure of dust collector system
and ensure it meets NFPA requirements
X75 Install proper covers to reduce ingress of
embers
X28
Install new isolation equipment Conduct safety training to ensure correct
installation of isolation devices
Conduct Regular inspection
X80 Install magnetic separators at inlet to
remove rusty tramp metal
X44 Install magnetic separators at inlet to
remove tramp metal
X81 Install vibratory separator at dryer outlet
X50 Install spark box
To seek the effect of chosen safety measures on the critical events (see Table 7.13),
probabilities of these critical events are considered before and after implementation of the
safety measures, as shown in Table 7.13.

157
Table 7.13 Effects of safety measures on critical events
Safety
Measure
Probabilities
without safety
measures
Probabilities of basic events with safety measures
X3 0.010 P(X8) = P(X3|SMX3) ∗ P(SMX3) + P(X3|SMX3 ) ∗ P(SMX3
)
= 0.01 ∗ 0.06 + 0.005 ∗ 0.94 = 0.005
X15 0.100 P(X15) = P(X15|SMX15) ∗ P(SMX15) + P(X15|SMX15 ) ∗ P(SMX15
)
= 0.1 ∗ 0.01 + 0.02 ∗ 0.99 = 0.021
X28 0.055 P(X28) = 0.05 (Equal to the reliability of new isolation equipment)
X44 0.050 P(X44) = P(X44|SMX44) ∗ P(SMX44) + P(X44|SMX44 ) ∗ P(SMX44
)
= 0.05 ∗ 0.08 + 0.02 ∗ 0.92 = 0.022
X50 0.045 P(X50) = P(X50|SMX50) ∗ P(SMX50) + P(X50|SMX50 ) ∗ P(SMX50
)
= 0.045 ∗ 0.05 + 0.03 ∗ 0.95 = 0.031
X74 0.300 P(X74) = P(X74|SMX74) ∗ P(SMX74) + P(X74|SMX74 ) ∗ P(SMX74
)
= 0.3 ∗ 0.06 + 0.1 ∗ 0.94 = 0.112
X75 0.045 P(X75) = P(X75|SMX75) ∗ P(SMX75) + P(X75|SMX75 ) ∗ P(SMX75
)
= 0.045 ∗ 0.2 + 0.03 ∗ 0.8 = 0.033
X80 0.050 P(X80) = P(X80|SMX80) ∗ P(SMX80) + P(X80|SMX80 ) ∗ P(SMX80
)
= 0.05 ∗ 0.08 + 0.02 ∗ 0.92 = 0.022
X81 0.083 P(X81) = P(X81|SMX81) ∗ P(SMX81) + P(X81|SMX81 ) ∗ P(SMX81
)
=0.083*0.04+ 0.04*0.96=0.042
Comparing the probabilities (columns 2 and 3 in Table 7.13), the influence of each safety
measure on the reduction of both dust explosion likelihood and potential consequences
can be calculated and is presented in Table 7.14.

158
Table 7.14 Probabilities of dust explosion and potential consequences
with and without safety measures
Without
SM
With
SMX3
With
SMX15
With
SMX28
With
SMX44/
SMx80
With
SMX50
With
SMX74
With
SMX75
With
SMX81
Dust Explosion 6.81E-3 6.80E-3 1.68E-3 6.78E-3 3.84E-3 6.74E-3 5.98E-3 6.45E-3 6.68E-3
Mishap 6.23E-3 6.24E-3 1.54E-3 6.22E-3 3.52E-3 6.18E-3 5.48E-3 5.92E-3 6.13E-3
Significant damage
(Isolation success) - - - 5.35E-4 - - - - -
Significant damage
(Evacuation success) 5.08E-4 5.08E-4 1.26E-4 2.53E-5 2.87E-4 5.04E-4 4.47E-4 4.82E-4 4.99E-4
Catastrophic damage 5.64E-5 5.64E-5 1.40E-5 2.82E-6 3.19E-5 5.60E-5 4.96E-5 5.35E-5 5.55E-5
Besides the likelihood reduction, another consequence with less damage, Significant
damage (Isolation success), is added to the model as a potential consequence when SMX28
is implemented.
In order to calculate the risk reduction index (RRI), the potential financial loss of each
consequence is estimated according to CSB (2005b) (Table 7.15).
Table 7.15 Losses of consequences
Mishap
Significant
Damage
(Isolation Success)
Significant
Damage
(Evacuation
Success)
Catastrophic Damage
(Evacuation Fail)
Dollar Valve
Equivalent
($)
1000 500 000 1 000 000 50 000 000
Then, the risk of the dust explosion without the safety measures can be calculated as:
RISK = ∑ Pci ∗ Li
n
i=1
= 6.23E − 3 ∗ 1000 + 5.08 ∗ 10E − 4 ∗ 1000000 + 5.64E − 5 ∗ 50000000
= 3334.230
It should be noted that the risk of an accident could be reduced not only by adding safety

159
barriers into the system to reduce the probabilities of the consequences (using preventive
safety measures such as X28) but also by reducing the severities of the potential
consequences (using mitigative safety measures). For example, if SMx3-Clean up
accumulated dust at filter- functions, the amount of accumulated dust at the filter will
decrease. Thus, even if a dust explosion occurs in the filter, its damage to the dust
collector and to the entire dust collecting system will be reduced. This could decrease the
severity of Mishap and Significant damage (Evacuation success). For illustrative
purposes, assume 60% of damage of the consequences Mishap and Significant damage
(Evacuation success) can be reduced by decreasing the amount of accumulated dust.
Therefore, the risk after applying SMx3 can be calculated as:
RISK = ∑ Pci ∗ Li
n
i=1
= 6.23E − 3 ∗ 1000 ∗ 0.4 + 5.08 ∗ 10E − 4 ∗ 1000000 ∗ 0.4 + 5.64E − 5 ∗ 50000000
= 3026.614
Similarly, the risk after application of other safety measures can be calculated as
presented in Table 7.16.
Table 7.16 Risk of dust explosion with and without safety measures
Without
SM
With
SMX3 With
SMX15 With
SMX28
With
SMX44/S
mx80
With
SMX50 With
SMX74 With
SMX75 With
SMX81
3334.230 3026.614 749.438 440.011 1885.524 3307.182 2664.580 3164.715 2978.267
According to the Risk Reduction Index (RRI) equation, RRI of SMX3 can be calculated
as:
RRISMX3=
3334.230 − 3026.614
3334.230= 0.092

160
Thus, the RRI for each safety measure can be calculated (Figure 7.8).
Fig. 7.8 Risk reduction index of various safety measures
The next step is to estimate the cost of each potential safety measure (Table 7.17),
including fixed cost and regular operation cost, according to suppliers and experts. Based
on the definitions of Operation and fixed cost (OFC) and cost potential index (Ci), both
parameters can be calculated for each safety measure (Columns4 and 5of Table 7.17)
when the budget for safety improvement is assumed as $80,000.
Table 7.17 Operation and fixed cost of safety measures
Safety
Measure Fixed Cost Operation Cost OFC Ci
SMX3 0 $5760 $5760 0.072
SMX15 $20000 $30000 $50000 0.625
SMX28 $2000 $1000 $3000 0.038
SMX44 $10000 $1000 $11000 0.138
SMX50 $400 $400 $800 0.010
SMX74 0 $1920 $1920 0.024
SMX75 $10000 $300 $10300 0.129
SMX81 $10000 $1000 $11000 0.138
0
0.1
0.2
0.3
0.4
0.5
0.6
0.7
0.8
0.9
1
X3 X15 X28 X44/X80 X50 X74 X75 X81
Ris
k re
du
ctio
n in
de
x
Safety measures

161
In this case, risk reduction caused by application of a safety measure is assumed to be as
important as its cost when selecting a safety measure. Therefore, ω1=ω2=0.5. Then,
NRRG of each safety measure can be calculated (Table 7.18).
Table 7.18 NRRG of safety measures
SMX3 SMX15 SMX28 SMX44/x80 SMX50 SMX74 SMX75 SMX81
0.011 0.075 0.415 0.149 0.000 0.089 -0.038 -0.014
Thus, the objective and constraint functions for this case can be established as:
Maxz = ∑ NRRGjxjj
s.t.{∑ 𝐶𝑗𝑥𝑗 ≤ $80000 𝑗
𝑥𝑗 = 0 𝑜𝑟 1 (𝑗 = 3, 15, 28, 44/80, 50, 74, 75, 81)
The optimal solution is calculated as: X=(1,1,1,1,1,1,0,0).
This means SMX3, SMX15, SMX28, SMX44/X80, SMX50 and SMX74 should be considered as
required safety measures in the safety strategy under this pre-defined budget. By this
safety strategy, the net risk reduction gain for this system can be maximized.
7.4.3 Sensitivity analysis
An optimal safety strategy is decided by various factors, such as budget and weighting
factors. As a result, this methodology can be applied to a variety of situations to search for
optimal safety strategies. A higher budget means more financial resources are available
and this could affect the NRRG index of each safety measure. Therefore, a safety strategy
decision is inevitably influenced by the amount of the budget. In this work, changes in
risk with different safety strategies under different budgets are analyzed (Figure 7.9).

162
Fig. 7.9 Number of safety measures and risks under different budgets
As can be seen from Figure 7.9, with an increase in budget, the number of safety
measures in the safety strategy can also increase. For example, the safety measures
number in the safety strategy increases from 2 to 6 when the budget increases from
$15000/year to $90000/year. The role of a budget increase is twofold: firstly, the higher
budget can lead to lower Ci, which means a less negative influence is caused by the cost
of safety measures in calculation of the NRRG index, and secondly, the higher budget
implies the relaxation of financial constraints. For example, when the budget is
$20000/year, the safety measure of X15 is obviously excluded. However, when the budget
increases to $80000/year, the safety measure X15 is considered as an alternative safety
measure in the safety strategy. At the same time, risks under different safety strategies are
decreased with increases in budget. However, it also can be seen that this decreasing
tendency of risk does not mean that the larger the financial investment, the better. As
shown in Figure 7.9, risk decreases from 29 to 27.1 with increasing the budget from
0
50
100
150
200
250
300
350
400
0
1
2
3
4
5
6
7
15000 30000 50000 70000 90000
Ris
k
Nu
mb
er
of
Safe
ty M
eas
ure
s
Budget ($/year)
Number of safety measures
Risk

163
$70000/year to $90000/year. Compared with the increased amount of financial
investment, the risk slightly declined, which means that it may not be economically
justifiable to go beyond a $70000/year budget for a lower risk.
Besides the influence of a budget on the selection of safety measures, the cost of safety
measures will also affect the process of decision-making. For example, increasing the
frequency of cleaning of the dust collector, safety measure for X3, will lead to higher
expenditure in terms of human resources. Considering that the costs of SMX3 with
different cleaning frequencies will increase from $5760/year to four hypothetical costs of
$6260/year, $6760/year, $7260/year and $7760/year, via the safety measures optimization
method, optimal safety strategies under these different costs are calculated for SMX3
(Table 7.19),
Table 7.19 Safety strategy with different costs of SMX3
Cost
(per year) SMX3 SMX15 SMX81 SMX28
SMX44/
X80 SMX50 SMX74 SMX75 SMX80
$ 5760 × × × × × × × $ 6260 × × × × × × × $6760 × × × × × × × $7260 × × × × × × × $7760 × × × × × ×
When the cost of SMX3 increases from $7260/year to $7760/year, SMX3 is excluded from
the optimal safety strategy and the risk increases from 27.1 to 27.6. This shows that
estimation of the cost of safety measures will influence the safety strategy decision and
also the risk level of the system. The reason is the higher cost could bring a higher value
of Ci and thus reduce the NRRG of the safety measure.
RRI is another important factor influencing safety strategy decision-making. According to

164
the above analysis, it is already known that SMX3 is included in the safety strategy under a
budget of $80000/year. Now, considering five different values for the RRI of SMX3 as
0.094, 0.085, 0.080, 0.075 and 0.070 (only for the purpose of representing the influences
of different RRIs on the allocation of safety strategy), the optimal safety strategy is
obtained by using the optimization method (Table 7.20).
Table 7.20 Safety strategy with different risk reduction index of SMx3
RRI SMX3 SMX15 SMX28 SMX44/X80 SMX50 SMX74 SMX75 SMX80 SMX81 0.094 × × × × × × × 0.085 × × × × × × × 0.080 × × × × × × × 0.075 × × × × × × × 0.070 × × × × × ×
As shown in Table 7.20, SMX3 is removed from the safety strategy when the respective
RRI decreases to 0.070, showing the role of the RRI index in the final decision. This also
results from the lower NRRG caused by the smaller RRI.
As mentioned earlier, the weighting indices ω1 and ω2 are introduced into the calculation
of the NRRG index of safety measures to represent decision-makers’ estimation of the
importance of RRI and Ci, respectively. Therefore, the emphasis of analysts on RRI or Ci
could also impact the decision about the optimal safety strategy. Safety strategies under
different combinations of the weighting index are presented in Table 7.21.
Table 7.21 Safety strategy of different estimation of weighting index
Category SMX3 SMX15 SMX28 SMX44/X80 SMX50 SMX74 SMX75 SMX81
1 𝛚𝟏=0.9,𝛚𝟐=0.1 × × × × × × 2 𝛚𝟏=0.7,𝛚𝟐=0.3 × × × × × 3 𝛚𝟏=0.5,𝛚𝟐=0.5 × × × × × × 4 𝛚𝟏=0.3,𝛚𝟐=0.7 × × × 5 𝛚𝟏=0.1,𝛚𝟐=0.9 ×
It should be noted that the number of safety measures decreases with increasing the

165
weighting index ω2. For example, when ω2 increases from 0.1 to 0.9, the number of
safety measures in the optimal strategy decreases from 6 (category 1) to 1 (category 5).
Moreover, the changes of importance indices can greatly influence compositions in safety
strategy. For example, although the number of safety measures under category 1 and 3
both equal 6, their corresponding members are different. For category 1, the safety
strategy is constituted by SMX15, SMX28, SMX44/X80, SMX50, SMX74 and SMX81. However,
the members of the safety strategy change to SMX3, SMX15, SMX28, SMX44/X80, SMX50,
SMX74 when both ω1and ω2 are estimated as 0.5. The higher ω2 implies that decision
makers treat Ci as a more important factor than RRI in calculation of the NRRG index.
Hence, the higher cost could notably depress the desire of a safety engineer to apply the
respective safety measure. The effects of weighting factors on NRRG of the same safety
measure are shown in Table 7.22 (the second row). One extreme situation is the case in
which only the risk reduction is considered by decision makers, i.e., ω1 = 1.0 and ω2 =
0.0. Then the optimization model is simplified to maximize the risk reduction brought by
safety measures under the budget constraint.
Table 7.22 NRRG of SMX3and Risks under different estimations of importance
indices
𝛚𝟏=0.9,𝛚𝟐=0.1 𝛚𝟏=0.7,𝛚𝟐=0.3 𝛚𝟏=0.5,𝛚𝟐=0.5 𝛚𝟏=0.3,𝛚𝟐=0.7 𝛚𝟏=0.1,𝛚𝟐=0.9
NRRG 0.077 0.044 0.011 -0.022 -0.055
Risk 25.739 303.082 27.265 173.079 440.021
Finally, dust explosion risks can be affected by different safety strategies under different
combinations of importance indices (Table 7.22, the third row). The results show that the
risk reduction of the system brought about by an optimal safety strategy depends on the

166
estimation of importance indices by decision makers.
7.5 Conclusions
When considering the safety improvement of process plants, the most efficient allocation
of limited financial resources to available safety measures becomes very challenging. The
issue becomes even more complicated in the case of dust explosions due to the large
number of contributing factors and interlinked correlations. To efficiently utilize budgets
for risk reduction of dust explosions, a risk-based optimization approach for optimal
allocation of safety measures has been proposed in this paper. In this approach, the most
critical factors contributing to dust explosions can be identified using a Bayesian network
generic risk model developed for this purpose. This way, not only a smaller number of
potential factors would need to be considered in safety improvement strategies, but also
an efficient allocation of limited financial resources to the most vulnerable parts of the
system would be possible. Further, the dust explosion generic Bayesian network
facilitates the quantification of the safety measures’ effects on risk reduction, relaxing the
need for experts’ estimations or qualitative risk ranking methods such as a risk matrix. In
the present work we applied a knapsack–based formulation in optimization so that the
optimal safety strategy can be easily obtained using conventional solvers. Applying the
developed methodology to a dust explosion that occurred at Hayes Lemmerz
International, US, in 2003, it was demonstrated that the developed optimal safety strategy
is able to efficiently reduce the risk of dust explosions under a limited budget. However,
since our methodology relies on a generic Bayesian network risk model developed for
dust explosions, minor changes would be made to tailor the generic risk model to a dust
explosion of interest, demanding knowledge by the analyst of the dust explosion under
167
consideration as well as constraints.
Acknowledgments
The authors gratefully acknowledge the financial support provided by the Natural
Sciences and Engineering Research Council of Canada (NSERC) and Vale Research
Chair Grant.
7.6 References
Amyotte, P. R., Pegg, J. M., Khan, I. F., Nifuku, M., Tan, Y. X., 2007. Moderation of dust
explosions. Journal of Loss Prevention in Process Industries 20, 675-687.
Amyotte, P. R., Pegg, J. M., Khan, I. F., 2009. Application of inherent safety principles to
dust explosion prevention and mitigation. Process Safety and Environmental Protection 87,
35-39.
Blair, A. S., 2007. Dust explosion incidents and regulation in the United States. Journal of
Loss Prevention in Process Industries 20, 523-529.
Capelle-Blancard, G., Marie-Aude, L., 2010. How does the stock market respond to
chemical disasters. Journal of Environmental Economics and Management 59, 192-205.
Caputo, A. C., Pelagagge, M. P., Salini, P., 2013. A multicriteria knapsack approach to
economic optimization of industrial safety measures. Safety Science 51, 354-360.
CSB, 2005a. Combustible Dust Fire and Explosions. Investigation Report for CTA
Acoustics, Inc: Washington, DC.
CSB, 2004. Dust Explosion – West Pharmaceutical Services, Inc. Investigation Report for
West Pharmaceutical Services: Washington, DC.
CSB, 2006. Combustible Dust Hazard Study. Investigation Report for dust accidents in

168
U.S.: Washington, DC.
CSB, 2005b. Aluminum Dust Explosion – Hayes Lemmerz International-Huntington, Inc.
Investigation Report for Hayes Lemmerz International Huntington: Washington, DC.
Dianous, V., Fievez, C., 2006. ARAMIS project: A more explicit demonstration of risk
control through the use of bow-tie diagrams and the evaluation of safety barrier
performance. Journal of Hazardous Materials 130, 220-233.
Eleye-Datubo, A.G., Wall, A., Saajedi, A., Wang, J., 2006. Enabling a powerful marine and
offshore decision-support solution through Bayesian network technique. Risk Analysis: An
International Journal 26, 695-721.
Giby, J., Luca, M., 2010. Case study of a nylon fibre explosion: An example of explosion
risk in a textile plant. Journal of Loss Prevention in Process Industries 23, 106 -111.
Hassan, J., Khan, F., Amyotte, P., Ferdous R., 2014. A model to assess dust explosion
occurrence probability. Journal of Hazardous Materials 268, 140-149.
Kalantarnia, M., 2009. Dynamic risk assessment using accident precursor data and
Bayesian theory. Master of Engineering Thesis, Memorial University, St. John's, N.L.,
Canada.
Khakzad, N., Khan, F. I., Amyotte, P. R., 2013. Dynamic safety analysis of process
systems by mapping bow-tie into Bayesian network. Process Safety and Environmental
Protection 91, 46-53.
Khakzad, N., Khan, F. I., Amyotte, P. R., 2011. Safety analysis in process facilities:
comparison of fault tree and Bayesian network approaches. Reliability Engineering
&System Safety 96, 925-932.
Kletz, T. A., 1978. What you don’t have, can’t leak. Chemistry and Industry, 287-292.

169
Kletz, T. A., 2003. Inherently safer design–Its scope and future. Process Safety and
Environment Protection 81, 401-405.
Reniers, L. L. G., Sörensen, K., 2013. An approach for optimal allocation of safety
resources: using the knapsack problem to take aggregated cost-efficient preventive
measures. Risk Analysis: An International Journal 33, 2056-2067.
Tasneem Abbasi, Abbasi, A. S., 2007. Dust explosions–Cases, causes, consequences, and
control. Journal of Hazardous Materials 140, 7-44.
Van der Voort M. M., Klein, J. J. A., Maaijer, de M., Bergvan den A. C.; Deursenvan. J.
R., Versloot N. H. A., 2007. A quantitative risk assessment tool for the external safety of
industrial plants with a dust explosion hazard. Journal of Loss Prevention in Process
Industries 20, 375-386.
Yuan, Z., Khakzad, N., Khan, F., Amyotte, P., Reniers, G., 2013. Risk-based Design of
Safety Measures to Prevent and Mitigate Dust Explosion Hazards. Industrial &
Engineering Chemistry Research 52, 18095-18108.
Yuan, Z., Khakzad, N., Khan, F., Amyotte, P., 2015. Risk Analysis of Dust Explosion
Scenarios using Bayesian Network Model. Journal of Risk Analysis 35: 278-291.
Zheng, Y. P., Feng, Ch. G., Jing, G. X., 2009. A statistical analysis of coal mine accidents
caused by coal dust explosions in China. Journal of Loss Prevention in Process Industries
22, 528-532.

170
8 Domino Effect Analysis of Dust Explosions Using Bayesian
Networks
ZhiYuan1, Nima Khakzad1, Faisal Khan1*, Paul Amyotte2
1-Safety and Risk Engineering Group (SREG), Faculty of Engineering & Applied
Science, Memorial University of Newfoundland, St. John's, NL, Canada A1B 3X5
2-Department of Process Engineering & Applied Science, Dalhousie University, Halifax,
NS, Canada B3J 2X4
* Corresponding author: Faisal Khan; [email protected]
Preface
This manuscript about domino effects of dust explosions has been submitted to the
journal of Reliability Engineering & System Safety. Under supervision of co-authors,
Dr(s) Khakzad, Khan, and Amyotte, the principal author developed the model and
relevant research on the entitled topic. The co-authors also reviewed the methodology and
proposed valuable and necessary suggestions and corrections to improve the quality of the
manuscript.

171
Abstract
In most dust explosion accidents, a series of explosions constituting a primary (dust)
explosion and one or more subsequent secondary dust explosions has been reported. Such
chains of related dust explosions can be referred to as dust-explosion domino effects.
Dust-explosion domino effects are capable of causing severe damage to humans, assets,
and the environment both on-site and off-site. Thus, a detailed understanding of the
causes, consequences, probabilities, and escalation of such domino effects is of great
importance for protecting humans and assets. In this research, we have proposed a
methodology for modeling and probability estimation of a chain of dust explosions based
on Bayesian networks. The application and efficacy of the proposed methodology have
been demonstrated via a real case study, CTA Acoustics, in the U.S. in 2003.
Keywords: Dust explosion; Domino effect; Bayesian network.
8.1 Introduction
A domino effect is a chain of unintended events in which a primary event triggers secondary
events, the total consequences of which are much more severe than the primary event in
terms of human and asset losses (Reniers and Cozzani, 2013). In most process plants, a
number of major hazardous installations (MHIs) are located and are operating in a limited
space. Because of the flammability and explosibility of the contained chemical substances
which are usually stored, processed or transported under high pressure and high
temperature conditions, a primary accident is likely to lead to a domino effect. The presence
of numerous flow conduits and conveying systems in chemical plants further facilitates the
propagation of accidents and ensuing physical effects such as fire, flames and overpressure

172
among separate MHIs, thus increasing the probability of domino effects. A variety of safety
measures such as internal safety distances has been proposed to reduce the likelihood of
domino effects (National Fire Prevention Association (NFPA), 2012); however, in many
cases, the implementation of such safety barriers would be difficult due to the inherent
restrictions of complex industrial processes such as limited land available.
Among domino effects, dust-explosion-induced domino effects (hereafter called dust
domino effects) have drawn less attention due to either complex cause-consequence
relationships or the complicated escalation probabilities involved. Combustible dust is
widely involved in process industries either as raw production materials or byproducts. It
can be found in the form of raw materials such as cotton in textile mills, intermediate
products such as synthetic resin powders in plastic product manufacturers, or as
byproducts such as aluminum dust in casting forges. Combustible dust can be easily
suspended in the air and cause a dust explosion if ignited. Reports on dust explosions and
the huge harm and damage to humans, assets and the environment are commonly seen in
the media (Eckhoff, 2009; Ebadat and Prugh, 2007; Piccinini, 2008; Wang and Li, 2001).
Recently, a metal dust explosion at AL Solutions, U.S. in 2010 resulted in three deaths
and one injury (U.S. Chemical Safety Board (CSB), 2011).
The mechanisms of dust explosions have widely been studied (Eckhoff, 2003; Amyotte et
al., 2005; Cashdollar and Zlochower, 2007; Pilão et al., 2006; Di Benedetto, et al., 2010)
and a variety of preventive and mitigating safety measures has been proposed (Amyotte et
al., 2009; Amyotte et al., 2010; Myers, 2008; Holbrow, 2013; Liu et al., 2013). Recently,
methods of quantitative risk assessment (QRA) have been applied to estimate the risk of
dust explosions (van dert Voort et al., 2007; Yuan et al., 2013, 2015; Khakzad et al., 2012).

173
Nevertheless, the attempts made to assess dust domino effects have been very few (van dert
Voort et al., 2007). The present work aims to develop a methodology for modeling and
estimating the probability of dust domino effects using the Bayesian network (BN). BN has
successfully been employed to model domino effects triggered by fires and explosions
(other than dust explosions) (Khakzad et al., 2013, 2014, 2015). However, to the best
knowledge of the authors, the present study is the first work devoted to the application of
BN for modeling dust domino effects.
This paper is organized as follows: Section 8.2 briefly explains the mechanism of dust
explosions and introduces the basis of dust domino effects. In Section 8.3, a BN
methodology is developed to model and assess the likelihood of dust domino effects. The
application of the methodology is demonstrated using a case study in Section 8.4. The
conclusions drawn from this work are presented in Section 8.5.
8.2 Background
8.2.1 Dust explosion mechanism
Combustible dust, oxidant, mixing, ignition and confinement are determined as essential
factors for a dust explosion as shown in Figure 3.1 (Eckhoff, 2003, 2009; Pilão et al, 2006;
Abbasi and Abbasi, 2007; Amyotte and Eckhoff, 2010; Kauffman, 1982). When all these
factors coexist, a dust explosion will happen.
Combustible dust in Figure 3.1 can be produced from natural organic materials (e.g., grain,
coal and peat), synthetic organic materials (e.g., plastics), or metals (e.g., aluminium
powder) (Eckhoff, 2003). Oxidant mainly refers to the oxygen in the air. Mixing refers to
the deposited combustible dust suspended in the air by, for example, improper

174
housekeeping methods or pressure waves from falling objects or explosions. Ignition
source includes but is not limited to impact sparks, flames, and hot surfaces (Abbasi and
Abbasi, 2007). For a rapid and violent combustion and energy build-up, confinement is an
essential factor in dust explosions. In summary, a dust explosion will occur when
combustible dust which has been suspended in a confined space meets an adequate ignition
source. Nevertheless, dust explosibility can be influenced by various factors such as the
minimum ignition temperature (MIT) and the minimum ignition energy (MIE). MIT is the
temperature above which a combustible dust cloud be ignited. A higher MIT (°C) indicates
the mixture of combustible dust and oxygen is more difficult to ignite and thus less likely
to cause a dust explosion. MIE (mJ), likewise, expresses the minimum energy required to
ignite a combustible dust suspension. The severity of a dust explosion can be represented
using the maximum explosion pressure (Pmax) or the normalized maximum rate of pressure
rise (KSt) (Hassan, 2014).
Compared to other types of explosion, a dust explosion usually leads to greater damage
because of higher pressure and temperature generated (Eckhoff, 2003). For example, the
experimental results of dust explosions with various combustible dusts in the standard 1m3
ISO vessel or in the 20-L Siwek sphere show the value of Pmax ranging from 8.0 bar(g) to
10.4 bar(g) (Hassan et al., 2014). However, similar experiments for methane-air explosions
show the values of Pmax around 8.0 bar(g) (Razus et al., 2006). Aside from more destructive
overpressures generated by dust explosions, toxic gases produced from dust explosions can
cause even more casualties. For example, in polyvinylchloride dust explosions, hydrogen
chloride gases can be produced, leading to pulmonary edema in exposed workers (Eckhoff,
2003).

175
8.2.2 Domino effects of dust explosions
The mechanism of a dust domino effect is shown in Figure 8.1. The dust explosion chain
originates from a primary explosion (not necessarily a dust explosion). If the blast wave
generated by the primary explosion is able to suspend settled dust layers and form a
combustible dust cloud, it is very likely that a secondary dust explosion will take place.
As mentioned earlier, the occurrence likelihood of such a secondary dust explosion also
depends on the presence of an ignition source with adequate MIT or MIE. Compared to
the primary dust explosion, the secondary dust explosion(s) can cause more severe
consequences due to larger quantities of combustible dust involved (Lees, 2005).
Fig. 8.1 Dust domino effects mechanism
As the primary and secondary dust explosions could occur in different units of a process
plant, safety barriers are difficult to implement between different hazardous units to block
the propagation of pressure and flames in different units in case of a primary explosion. A
176
typical example is the phenolic resin dust explosion at CTA Acoustics, Inc., U.S. in 2003
(CSB, 2005a). The initial dust explosion occurred at production line 405 while another dust
explosion took place at line 401, more than 80 ft (24.38 m) away from the initial explosion.
Another case is the aluminum dust explosion at Hayes Lemmerz International-Huntington,
Inc., U.S., where a primary dust explosion in the aluminum dust collector located outside
of the building propagated through ducts and caused a secondary dust explosion around
furnace 5 in the workshop (CSB, 2005b), due to the lack of an explosion isolation device
between the dust collector and the connected units.
For illustrative purposes, consider a process plant in Figure 8.2 where A1, A2, and
A3represent the units susceptible to dust explosions whereas B1 and B2 are the units for
which a pool fire and vapor cloud explosion (VCE), respectively, have been determined as
dominant accident scenarios. It should be noticed that potential accidents in B1 and B2 are
not limited in listed above and should be determined according to individual process.
B1
A1 A2
B2
A3
3 (a)
B1
A1 A2
B2
A3
3 (b)
B1
A1 A2
B2
A3
3 (c)
Fig. 8.2 Schematic of possible domino effects given a primary dust explosion in A1.
A1, A2, and A3 are units where dust explosions can occur. Dominant accident
scenarios for B1 and B2 are determined as pool fire and VCE, respectively.
With a primary dust explosion in A1, several domino effects can be envisaged (Figure
8.2(a)). The first one is a chain of dust explosions. For example, in Figure 8.2(b), the

177
primary dust explosion in A1 could trigger a dust explosion in A2 which in turn could
cause a dust explosion in A3 without causing credible damage to B1 or B2. Thus, the dust
explosions in A2 and A3 can be considered as secondary and tertiary dust explosions,
respectively. However, it is worth noting that the dust explosion in A1 could directly cause
a dust explosion in A3 depending on the magnitude of overpressure received by A3 from
A1. In this case, A2 and A3 are both considered as secondary dust explosions. As another
chain of accidents in Figure 8.2(c), the primary dust explosion in A1 can result in a VCE
in B2; the overpressure and flame caused by VCE can then trigger simultaneous dust
explosions in A2 and A3. As a result of these dust explosions, B1 can be heavily damaged,
leading to a release of chemical containment and a subsequent pool fire. Therefore, each
domino effect depicted in Figure 8.2 could occur. To determine which domino effects are
likely to take place, the magnitudes of overpressures and escalation probabilities have to
be calculated. This issue is discussed in more detail in the next section.
8.2.3 Escalation probabilities
Generally speaking, for a primary accident to cause significant damage to a target unit,
the magnitude of the physical effects – also known as escalation vectors – such as heat
flux and explosion overpressure should be higher than some threshold values. These
threshold values are usually determined using experimental data and regression methods
for a number of atmospheric and pressurized units as well as auxiliary equipment (e.g.,
pumps) and pipelines (Gledhill and Lines, 1998; Contini et al., 1996; Pettitt et al., 1993;
Cozzani, 2001; Cozzani and Salzano, 2004). An escalation vector that is greater than the
respective threshold value is likely to cause significant damage to a target unit, leading to

178
loss of containment of the target unit. Based on the type of loss of containment
(catastrophic, major or minor) and type of the released chemical substance (flammable,
explosible or both) a secondary accident could occur. There are several methods to
estimate the probability of damage to a target unit – the so-called escalation probability –
among which probit functions are very popular due to their flexibility and applicability to
a wide range of equipment and escalation vectors (Cozzani et al., 2005).
In the case of target units or installations that are prone to secondary dust explosions, most
of the afore-mentioned threshold values and probit functions cannot be employed. As stated
earlier, to have a secondary dust explosion in a target unit, the magnitude of the
overpressure received by the target unit from a primary explosion should be able to suspend
layers of dust settled on the floor, ceiling, or equipment. In addition, the density of
suspended dust, presence of an ignition source, and confinement should effectively have
been taken into consideration as influential factors. For the sake of clarity, the event tree in
Figure 8.3 illustrates different accident scenarios likely to occur in a target unit given a
primary explosion.

179
Fig. 8.3 Secondary dust explosion triggered by a primary explosion
In the event tree of Figure 8.3, the essential factors for a secondary dust explosion, i.e.,
the dust layer, dispersion, ignition and confinement, are depicted. As can be seen, a
secondary dust explosion will occur only if all contributing factors coexist. It should be
noted that the essential factor, oxygen, is not included in the event tree, since it has been
assumed the oxygen would be present in most units involved in the process industries. In
Figure 8.3, an initial dust explosion (or other types of explosion such as VCE and
BLEVE) can cause two different secondary accidents in a dust-containing unit, that is, a
flash fire or secondary dust explosion, depending on the presence/absence of essential
factors. Knowing the occurrence probabilities of the initial dust explosion and essential
factors, the probability of a secondary dust explosion can be estimated using the event
tree in Figure 8.3.
For confinement, the probabilities of 0 and 1 are given to the situations of no-confinement
and complete confinement, respectively, based on the type of target units. For example, if

180
the target unit is a dust collector, the probability of confinement is considered as 1.0
whereas in the case of dust settled on the roof of a warehouse the probability of
confinement is taken as 0.0. Since flames are observed in most dust explosions, a
probability of 0.3, is assumed for the ignition in Figure 8.3. For the probability of a dust
layer, 𝑃(𝐷𝐿), an exponential equation can be used, considering both the mass of
accumulated dust in a target unit or area and the threshold of accumulated dust mass:
𝑃(𝐷𝐿) = 1 − exp (−𝐴𝑀/𝑀𝑡ℎ) (8.1)
where 𝐴𝑀 is the mass of accumulated dust in the unit, and 𝑀𝑡ℎ is the corresponding
threshold value.
𝑀𝑡ℎcan be calculated according to relevant regulations, such as NFPA 654 (2000):
𝑀𝑡ℎ = 0.004 ∗ 𝐴𝑓𝑙𝑜𝑜𝑟 ∗ 𝐻 (8.2)
where 𝐴𝑓𝑙𝑜𝑜𝑟 = min (𝑒𝑛𝑐𝑙𝑜𝑠𝑢𝑟𝑒 𝑓𝑙𝑜𝑜𝑟 𝑎𝑟𝑒𝑎, 2000 𝑚2);
𝐻 = min (𝑒𝑛𝑐𝑙𝑜𝑠𝑢𝑟𝑒 𝑐𝑒𝑖𝑙𝑖𝑛𝑔 ℎ𝑒𝑖𝑔ℎ𝑡 , 12 𝑚). The unit of 𝑀𝑡ℎ is kg.
𝐴𝑀 can be conveniently calculated based on observation of the real situation:
𝐴𝑀 = 𝐷 ∗ 𝐴𝑑 ∗ 𝐶 (8.3)
In Equation (8.3), 𝐷 (m) is the depth of the dust layer in the target area or unit; 𝐴𝑑(𝑚2)
means the area of dust layer; C (kg/m3) is the bulk density of the dust layer. The values of
D and 𝐴𝑑 can be identified by inspection while the value of C can be estimated by
experiments.
When the overpressure from a primary dust explosion reaches the dust layer, the
accumulated dust can be dispersed and result in a combustible dust cloud if the magnitude
of the overpressure is greater than some threshold value. Because the overpressure will

181
decay along the distance from the location where the primary explosion occurs, the
magnitude of overpressure reaching a dust layer can be estimated by the equation listed in
the German standard VDI 3673 (2002):
𝑃𝑟 = 𝑃𝑀𝐴𝑋 ∗ (𝑅𝑠/𝑟)1.5 (8.4)
where 𝑃𝑀𝐴𝑋 is the maximum pressure generated from a dust explosion; 𝑅𝑠 is the distance
of the blast center from the vent (m); 𝑟 is the distance of the target (dust layer in this
study) from the vent (m). Note that 𝑅𝑠 could also be considered as the distance from the
blast center to the connections with other units if no venting system is installed. An
overpressure (𝑃𝑟) with the value of 1.0 psig (7.0 kPa) can lead to partial demolition of
houses and make them uninhabitable (National Oceanic and Atmospheric
Administration). An overpressure at this level is thus assumed to be able to disperse the
dust layer in the form of a combustible dust cloud. Thus, in this study the probability of
dispersion, 𝑃(𝐷𝑝) is considered as 1.0 when the magnitude of overpressure equals or is
higher than 1.0 psig. For overpressures magnitudes lower than 1.0 psig Equation (8.5) can
be employed to estimate P(𝐷𝑝).
𝑃(𝐷𝑝) = 1 − 0.2 ∗ (7 − 𝑃𝑟) (8.5)
A secondary dust explosion would be able to trigger other tertiary accidents. However, if
the primary dust explosion results in a flash fire (see event tree of Figure 8.3), the
probability of tertiary accidents triggered by the flash fire can be ignored (Cozzani et al.,
2014).
8.2.4 Bayesian network and its application in domino effect analysis
The Bayesian network (BN) is a directed acyclic graph (DAG) (Neapolitan, 2003; Jensen

182
and Nielsen, 2007), in which nodes stand for random variables and arcs between nodes
refer to the direct dependency between them. The type and strength of dependencies are
determined by conditional probability tables (CPTs). One of the main applications of BN
is probability updating by taking advantage of the latest information so that the accuracy
of predictions can be improved.
The joint distribution P(U) of a set of variables U=(X1, X2, ...... , Xn) can be expanded in
equation (3.2) according to the conditional dependence of variables.
Similarly, if the latest information is observed, called evidence E, the posterior
probabilities can be estimated based on Bayes’ theorem as shown by the equation (3.4).
Due to its flexibility and robust probabilistic reasoning engine, BN has been widely used
in risk analysis and safety assessment (Khakzad et al., 2013b, 2013c, 2013d; Zhao et al.,
2012; Holický et al., 2013; Eleye-Datubo et al., 2006; Nordgård and Sand, 2010; Donald
et al., 2009). Further, applications of BN to risk analysis of dust explosions (Yuan et al.,
online) and domino effects (Khakzad et al., 2013a, 2014, 2015) have been examined. In the
current work, the risk of dust explosions with respect to domino effects is assessed using
BN, with a main focus on a chain of dust explosions (e.g., A1→ A2→ A3 in Figure 8.2(b)).
8.3 Development of domino effects model of dust explosions
The developed methodology for dust domino effects analysis is composed of several steps
as follow:
Step 1: Locate areas or units with potential risk of dust explosions.
According to the characteristics of the process equipment, the units and the areas where
combustible dust can be generated, either as a cloud or as settled layers, are identified as

183
potential units and areas for dust explosion. For example, at Hayes Lemmerz
International-Huntington, Inc. (Hayes, hereafter) (CSB, 2005b), the whole chip-
processing system, including the chip mill and dry chip hopper, and the dust collection
system including drop box and dust collector can be considered as areas where dust
explosions might occur.
Step 2: Identify the most critical unit/area for the location of primary dust explosions.
As can be noted from Hayes, more than one unit can be determined as a potential location
for a dust explosion. In this step, among the units identified in Step 1, the unit with the
highest risk is determined as the location of the primary dust explosion. The presence and
intensity of essential factors for a dust explosion (Figure 3.1) are used to further screen
the equipment/areas. The more the necessary elements of a dust explosion coexist in a
unit, the higher the likelihood of a dust explosion; such a unit can be considered as the
initiating unit in a domino effect (such as A1 in Figure 8.2). For example, at Hayes, the
dryer burner is excluded as the primary unit due to the incomplete combustion process
involved, though it was identified as a potential unit for dust explosion in Step 1.
Historical data and accident records can be effectively used to identify the most critical
units for dust explosion occurrence.
Step 3: Calculate the strength of escalation vectors and identify target units.
For the escalation vector of dust explosions, the maximum pressure caused by the primary
dust explosion can be obtained from relevant sources (Eckhoff, 2003; ASTM E1226-09).
After calculating the magnitude of overpressure reached at target dust layers using
equation (8.4), the probabilities of dispersion can be determined by equation (8.5).
Step 4: Estimate escalation probabilities and develop the BN.

184
Based on the methodology proposed by Khakzad et al. (2013a), a potential domino effect
can be illustrated and modeled using a BN. The domino effects of dust explosions, 3(b)
and 3(c), in Figure 8.2 are represented by 5(a) and 5(b) respectively in Figure 8.4. The
units/locations with a risk of an accident triggered by a primary dust explosion in A1 are
represented by respective nodes. The influence relationship among nodes can be
represented by directed arcs, i.e. A1→A2. It should be kept in mind that this research
focuses on the chain of dust explosions, shown as A1→A2→A3. The occurrence
probability of a dust explosion in nodes Ai (i=1, 2, 3) can be calculated using a QRA
method, i.e. fault tree (Yuan et al., 2013). In the current work, a developed generic risk
analysis model for a dust explosion based on BN (Yuan et al., 2015), being tailored to
various cases, is recommended.

185
Fig. 8.4 Domino effects of dust explosion based on BN
The conditional probability table (CPT) of each node in the BN can be calculated using
the event tree developed in Figure 8.3 once all the probabilities of essential factors are
obtained in step 2. For illustrative purposes, the probabilities of dust explosion in node A1
and A2 and the probability of each essential factor in the event tree shown in Figure 8.3
are demonstrated in Table 8.1.
Table 8.1 Probabilities of initial dust explosion and safety barriers in event tree
Initial Dust
Explosion in A1
Dust
Explosion in A2
Dust
Layer Dispersion Ignition Confinement
Probability 0.50E-5 0.40E-6 0.20 0.10 0.30 1.0
Like unit A1, unit A2 is also determined to have a dust explosion risk in step 1, which
means a dust explosion could occur even if unit A2 is not affected by a dust explosion in
A1. This is called the inherent probability of A2 (Khakzad et al., 2013a).
Based on the assumed data used in Table 8.1, the probabilities of potential consequence
categories in unit A2 triggered by the initial dust explosion in A1 can be calculated and
listed in Table 8.2.

186
Table 8.2 Probabilities of different situations in A2 resulting from
initial dust explosion in A1
Outcome No Secondary
Accident Flash Fire
Secondary Dust
Explosion
Probability 0.41E-5 2.70E-7 0.30E-7
Thus, the CPT of A2 can be represented in Table 8.3:
Table 8.3 CPT of node A2
No Secondary
Accident Flash Fire
Secondary Dust
Explosion
Yes No Yes No Yes No
Initial Dust
Explosion
Yes 0.41E-5 0.999 2.7E-7 0.999 0.30E-7 0.999
No 0 1 0 1 0.40E-6 0.999
Repeating the above steps, the CPT for each node can be established and the model of
domino effect analysis for dust explosions is developed using BN.
8.4 Case study
8.4.1 Introduction
On Feb. 20, 2003, a dust explosion occurred at CTA Acoustics, Inc., KY, U.S., causing 7
deaths and 37 injuries (CSB, 2005a). CTA manufactures acoustical and thermal insulation
products involving fiberglass, phenolic resin powder and facing. According to CSB
(2005a) the phenolic resin dust was the fuel for this explosion, and the primary dust
explosion occurred near the oven in line 405 and led to a secondary dust explosion in the
space above the blend room in line 405. Then the pressure wave and fireball from the
secondary dust explosion propagated along the ceiling toward line 403, line 402 and line
401. In the southeast corner of the blend room on line 401, another dust explosion

187
occurred and caused extensive damage. The layout of the facility is shown in Figure 8.5.
Fig. 8.5 Simplified layout of CTA facility
8.4.2 Domino effect of dust explosions analysis for CTA Acoustics
According to the descriptions of the production process and daily operations, the areas
around the ovens, the blend houses and the spaces above the blend houses on production
lines can be identified as the units/areas susceptible to dust explosions because
combustible layers are often observed in these areas. Among them, the area around the
oven in line 405 can be identified with the highest risk of a dust explosion (CSB, 2005a).
One of the reasons is that the accumulated dust above the production lines cannot be
effectively removed by the housekeeping program, and can even arise because of
improper housekeeping methods (e.g., compressed air forming a combustible dust cloud

188
around ovens in different lines). The other reason is that the fires ignited in the residual
material in the oven with enough ignition energy for a dust explosion can propagate
outside of the oven through the improperly opened oven door on line 405 to reduce the
unexpected high temperature in the oven due to the malfunction of temperature control
equipment. Therefore, tailoring the generic likelihood estimation model for dust
explosions to this case, the occurrence probability of initial dust explosions around the
oven on line 405 has been calculated in previous research (Yuan et al., 2015) and equals
4.97E-5.
Once a dust explosion occurred around the oven on line 405, the propagation routes of
produced flames and pressure blast can be classified into two possible scenarios. One is
spreading into the space above the blend room on line 405 (as shown in Figure 8.5), where
accumulated dust layers on flat surfaces resulting from inadequate housekeeping could be
dispersed to form a combustible dust cloud, and further lead to a secondary dust explosion.
The other propagation path is to the outer spaces of line 405, where a fireball from the
initial dust explosion is less likely to be further transferred. As the CSB found (2005a),
when the fireball reached the molding department, it dissipated. Moreover, the semi-cured
pelts stored between line 403 and 405 was ignited. Therefore, in domino effect analysis,
the space above the blend room on line 405 is considered as the potential area where a
secondary dust explosion could occur. Due to the similar production process and safety
management in lines 403, 402 and 401 as in line 405, phenolic resin powders can easily
accumulate on the flat surfaces in and above the blend rooms, which are able to be the fuel
for fires and further dust explosions. Thus, the blend rooms on lines 403, 402 and 401 and
their overhead spaces are also determined as the units with dust explosion risks. Based on

189
above analysis about the production process, origins of dust explosions and potential
propagation routes of dust explosions, the model for the domino effect of dust explosions
can be established using BN and is shown in Figure 8.6.
Fig. 8.6 Domino effect of dust explosions originating from area around oven on line
405
In Figure 8.6, A1 and A2 stand for the area around the oven and the space above the blend
room in line 405, respectively. Similarly, the blend rooms on lines 403, 402 and 401 are
represented by A3, A4, and A5, respectively. Using the tailored occurrence probability
model of dust explosions for unit A2, the probability of a dust explosion in A2 can be
calculated as 5.31E-6. Due to the similar working circumstances and maintenance
strategies as in A2, the probabilities of dust explosions in A3, A4, and A5 can be considered
as equal to that in unit A2.
Before obtaining the CPT of each node based on the event tree in Figure 8.3, the
probability for each safety barrier should be calculated as discussed in section 8.2.3. For
this case, the probability of a dust layer is first calculated using equations (8.1) to (8.3).
According to the investigation report (CSB, 2005a), the area above the blend rooms can
be calculated as 112 m2 (listed in Table 8.4, column 1) and the mass threshold of
combustible dust accumulating in the areas above the blend rooms can be calculated as
1.366 kg using equation (8.2) (Table 8.4, column 3).

190
Table 8.4 Values of Relevant Parameter
Afloor (m2) H (m) Mth (kg) AM (kg) Pr (psi)
112 3.05 1.366 7.2 5.98
Further, the depth and area of the dust layer can be observed during the regular
investigation and operation. However, due to the extensive fire and explosion damage,
both parameters of the dust layer cannot be determined from CSB (2005a). For the
purpose of analysis, 0.0008 m, recommended by NFPA above which the area needs
immediate cleaning (NFPA654, 2000), is taken as the depth of accumulated dust layer and
the area of dust layer is estimated as 20 m2. The CSB report also revealed the test result
for the diameters of phenolic resin samples from CTA ranged from 10 to 50 μm (CSB,
2005a). Thus, the bulk density of the dust layer can be estimated as 450 kg/m3 according
to Janès et al. (Janès et al., 2014). With equation (8.3), the mass of accumulated dust can
be calculated as 7.2 kg (column 4 in Table 8.4) and the probability of the dust layer in this
case can be calculated as 1.0 according to equation (8.1). Because of the similar operation
processes and housekeeping in the blend rooms on lines 403, 402 and 401, the
probabilities of dust layers in these units can also be considered as 1.0
For the estimation of the probability of dispersing dust layers, the strength of overpressure
received by a dust layer should be first calculated. According to the test by CSB (2005)
using ASTM E1226-09, the Standard Test Method for Pressure and Rate of Pressure Rise
for Combustible Dust (ASTM, 2000), the Pmax of combustible dust collected from CTA can
be up to around 110 psig (7.59 bar(g)). According to the layout of the CTA facility (CSB,
2005a), the longest distance between two units is 80 ft (24.38m) between line 405 and line

191
403. Therefore, if the dust layer in the blend room in line 403 can be lifted by the
overpressure from line 405, the dust layers in other production lines can also be dispersed
by the overpressure from a nearby dust explosion. Using equation (8.4), the overpressure
propagating from line 405 to line 403 (Pr) can be calculated as 5.98 psig (0.41 bar(g))
(column 5 in Table 8.4). This value is much greater than the threshold of overpressure with
the ability of dispersing dust layers as discussed in 8.2.3. Therefore, in this case, the
probability of dispersion can be considered as 1.0. Further, as the result of estimating the
confinement of the space above the blend rooms and the blend rooms themselves, the
probability of confinement can be considered as 1.0. Based on the event tree in Figure 8.3,
the probabilities of two outcomes in node A2, secondary dust explosion and no secondary
accident (the paths are depicted in bold in Figure 8.3), given an initial dust explosion in
node A1, can be calculated. For example, the conditional probability of a secondary dust
explosion, given an initial dust explosion, P (secondary dust explosion given initial dust
explosion), can be calculated as 0.3. Thus, the CPT of node A2 can be obtained as shown
in Table 8.5. Following similar steps, the CPT of each node can be established.
Table 8.5 CPT of A2 in Figure 7
A2
Secondary Dust Explosion No Secondary Accident
A1 Dust Explosion 0.30 0.70
No Dust Explosion 5.31E-6 0.999
Note that the CPTs for node A3, A4 and A5 are considered to be the same as for node A2 due
to their similar operating conditions and maintenance strategy in this case. Otherwise, the
CPT of each node should be individually calculated by tailoring the event tree in Figure 8.3
to the units with different operating conditions and maintenance.

192
After obtaining the CPT of each node, the occurrence probability of dust explosions in each
unit can be calculated taking advantage of HUGIN 8.0 (http://www.hugin.com) (2010). The
results are given in Table 8.5. The occurrence probabilities of dust explosions in various
units from A1 to A5 are decreasing, which reveals that the threats from dust explosions in
different units are reduced along with domino effects of the primary dust explosion in unit
A1. However, due to the effects of the initial dust explosions, the occurrence probabilities
of dust explosions in A2, A3, A4 and A5 increase in different degrees. For example, the
occurrence probability of a dust explosion in A2 increases from 5.31E-06 to 2.02E-05.
Table 8.6 Occurrence probabilities of dust explosions in different units
A1 A2 A3 A4 A5
Probability of
dust explosion 4.97E-5 2.02E-5 1.14E-5 8.72E-6 7.93E-6
8.5 Conclusions
Domino effects of accidents are usually difficult to analyze especially in complex process
industrial scenes. Due to the presence of multiple essential factors of dust explosions, the
issue is more complicated in the analysis of the chain of dust explosions. In the current
research, a methodology is proposed to analyze domino effects of dust explosions using
BN.
In this methodology, the units or locations with risks of dust explosions are identified first
according to the production processes in specific industries. Among them, the unit or
location with the maximum number of essential factors for dust explosions is considered to
have the highest risk of dust explosions and the dust explosion occurring in it is located as
the primary one. Then, taking advantage of BN, the potential propagation routes of the

193
escalation vectors, the overpressures, are represented considering facility layout. After
developing an event tree to quantify the occurrence probabilities of different consequence
categories triggered by an initial dust explosion, the CPT of corresponding nodes in the BN
model can be calculated. By tailoring the developed risk analysis model of dust explosions
to target units, the inherent probability of dust explosions in each node on the BN can be
further estimated. Then, based on the developed domino effect analysis model of dust
explosions, the occurrence probability of a dust explosion in each unit can be calculated.
CTA Acoustics, Inc. was chosen to illustrate the usage of this method.
Acknowledgments
The authors gratefully acknowledge the financial support provided by the Natural
Sciences and Engineering Research Council of Canada (NSERC) and a Vale Research
Chair Grant.
8.6 References
Abbasi, T., Abbasi, A. S., 2007. Dust explosions-Cases, causes, consequences, and control.
Journal of Hazardous Materials 140, 7-44.
Amyotte, P. R., Basu, A., Khan, F. I., 2005. Dust explosion hazard of pulverized fuel carry-
over. Journal of Hazardous Materials 122, 23-30.
Amyotte, P. R., Pegg, M. J., Khan, F. I., 2009. Application of inherent safety principles to
dust explosions. Process Safety and Environmental Protection 87, 35-39.
Amyotte, P., Lindsay, M., Domaratzki, R., Marchand, N., Di Benedetto, A., Russo, P., 2010.
Prevention and mitigation of dust and hybrid mixture explosions. Process Safety Progress
29, 17-21.

194
Amyotte, P. R., Eckhoff, R. K., 2010. Dust explosion causation, prevention and mitigation:
An overview. Journal of Chemical Health and Safety 17, 15-28.
ASTM E1226-09, 2000. Standard Test Method for Pressure and Rate of Pressure Rise for
Combustible Dust. American Society for Testing and Materials.
Cashdollar, K. L., Zlochower, I. A., 2007. Explosion temperatures and pressures of metal
and other elemental dust clouds. Journal of Loss Prevention in Process Industries 20, 337-
348.
Contini, S., Boy, S., Atkinson, M., Labath, N., Banca, M., Nordvik, J. P., 1996. Domino
effect evaluation of major industrial installations: a computer aided methodological
approach, in: Proceedings of the European Seminar on Domino Effects. Leuven; p. 1.
Cozzani, V., Gozzi, F., Mazzoni, A., Zanelli, S., 2001. Proceedings of the European
Conference on Safety and Reliability, ESREL, Torino; p. 807.
Cozzani, V., Salzano, E., 2004. The quantitative assessment of domino effects caused by
overpressure. Part I. Probit models. Journal of Hazardous Materials 107, 67.
Cozzani, V., Gubinelli, G., Antonioni, G., Spadoni, G., Zanelli, S., 2005. The assessment
of risk caused by domino effect in quantitative area risk analysis. Journal of Hazardous
Materials 127, 14–30.
Cozzani, V., Antonioni, G., Landucci, G., Tugnoli, A., Bonvicini, S., Spadoni, G., 2014.
Quantitative assessment of domino and NaTech scenarios in complex industrial areas.
Journal of Loss Prevention in Process Industries 28, 10-22.
CSB, 2005a. Combustible Dust Fire and Explosions. Investigation Report for CTA
Acoustics, Inc: Washington, DC.
CSB, 2005b. Aluminum Dust Explosion-Hayes Lemmerz International-Huntington, Inc.

195
Investigation Report for Hayes Lemmerz International Huntington: Washington, DC.
CSB, 2011. AL Solutions, Inc., New Cumberland, WV, Metal Dust Explosion and Fire,
Washington, DC.
Di Benedetto, A., Russo, P., Amyotte, P., Marchand, N., 2010. Modelling the effect of
particle size on dust explosions. Chemical Engineering Science 65, 772-779.
Donald, M., Cook, A., Mengersen, K., 2009. Bayesian Network for Risk of Diarrhea
Associated with the Use of Recycled Water. Risk Analysis 29, 1672-1685.
Ebadat, V., Prugh, R. W., 2007. Case study: Aluminum-Dust Explosion. Process Safety
Progress 12, 324-329.
Eckhoff, R. K., 2003. Dust Explosions in the Process Industries, 3rded.; Elsevier Science:
Burlington, MA.
Eckhoff, R. K., 2009. Understanding dust explosions. The role of powder science and
technology. Journal of Loss Prevention in Process Industries 22, 105-116.
Eleye-Datubo, A. G., Wall, A., Saajedi, A., Wang, J., 2006. Enabling a powerful marine and
offshore decision-support solution through Bayesian network technique. Risk Analysis 26,
695-721.
Gledhill, J., Lines, I., 1998. Development of methods to assess the significance of domino
effects from major hazard sites, CR Report 183, Health and Safety Executive.
Hassan, J., Khan, F., Amyotte, P., Ferdous, R., 2014. A model to assess dust explosion
occurrence probability. Journal of Hazardous Materials 268, 140-149.
Holbrow, P., 2013. Dust explosion venting of small vessels and flameless venting. Process
Safety and Environmental Protection 91, 183-190.
Holický, M., Marková, J., Sýkora, M., 2013. Forensic assessment of a bridge downfall

196
using Bayesian networks. Engineering Failure Analysis 30, 1-9.
HUGIN Expert software version 8.0, 2010. http://www.hugin.com.
Janès, A., Vignes, A., Dufaud, O., Carson, D., 2014. Experimental investigation of the
influence of inert solids ignition sensitivity of organic powders. Process Safety and
Environmental Protection 92, 311-323.
Jensen, F., Nielsen, T., 2007. Bayesian network and Decision Graphs. 2nd ed. Springer;
New York.
Kauffman, C., 1982. Agricultural dust explosions in grain handling facilities, Waterloo:
University of Waterloo Press. Waterloo; 305–347.
Khakzad, N., Khan, F., Amyotte, P., 2012. Dynamic risk analysis using bow-tie approach.
Reliability Engineering and System Safety 104, 36-44.
Khakzad, N., Khan, F., Amyotte, P., Cozzani, V., 2013a. Domino effect analysis using
Bayesian networks. Journal of Risk Analysis 33, 292-306.
Khakzad, N., Khan, F., Amyotte, P., 2013b. Risk-based design of process systems using
discrete-time Bayesian networks. Reliability Engineering and System Safety 109, 5-17.
Khakzad, N., Khan, F., Amyotte, P., 2013c. Dynamic safety analysis of process systems by
mapping bow-tie into Bayesian network. Process Safety and Environmental Protection 91,
46-53.
Khakzad, N., Khan, F., Amyotte, P., 2013d. Quantitative risk analysis of offshore drilling
operations: A Bayesian approach. Safety Science 57, 108-117.
Khakzad, N., Khan, F., Amyotte, P., Cozzani, V., 2014. Risk management of domino effects
considering dynamic consequence analysis. Risk Analysis 34, 1128-1138.
Khakzad, N., 2015. Application of dynamic Bayesian network to risk analysis of domino

197
effects in chemical infrastructures. Reliability Engineering and System Safety 138, 263-
272.
Lees, P. F., 2005. Lees’ Loss Prevention in the Process Industries, vols. 1-3,
Elsevier/Butterworth-Heinemann, Oxford.
Liu, Q., Hu, Y., Bai, C., Chen, M., 2013. Methane/coal dust/air explosions and their
suppression by solid particle suppressing agents in a large-scale experimental tube. Journal
of Loss Prevention in Process Industries 26, 310-316.
Myers, T. J., 2008. Reducing aluminum dust explosion hazards: Case study of dust
inerting in an aluminum buffing operation. Journal of Hazardous Materials 159, 72-80.
National Oceanic and Atmospheric Administration,
http://response.restoration.noaa.gov/oil-and-chemical-spills/chemical-
spills/resources/overpressure-levels-concern.html. (last checked on 06. 03.15).
NFPA 484, 2012. Standard for Combustible Metals. National Fire Protection Association.
NFPA 654, 2000. Standard for the prevention of fire and dust explosions from the
manufacturing, processing and handling of combustible particulate solids. National Fire
Protection Association.
Nordgård, E. D., Sand, K., 2010. Application of Bayesian networks for risk analysis of
MV air insulated switch operation. Reliability Engineering and System Safety 95, 1358-
1366.
Pettitt, G. N., Schumacher, R. R., Seeley, L. A., 1993. Evaluating the probability of major
hazardous incidents as a result of escalation events. Journal of Loss Prevention in Process
Industries 6, 37-46.
Piccinini, N., 2008. Dust explosion in a wool factory: Origin, dynamics and consequences.

198
Fire safety Journal 43, 189-204.
Pilão, R., Ramalho, E., Pinho, C., 2006. Overall characterization of cork dust explosion.
Journal of Hazardous Materials 133, 183-195.
Razus, D., Movileanua, C., Brinzea, V., Oancea, D., 2006. Explosion pressures of
hydrocarbon-air mixtures in closed vessel. Journal of Hazardous Materials 135, 58-65.
Reniers, G., Cozzani, V., 2013. Domino effects in the process industries: Modeling,
Prevention and Managing. Elsevier Science: Burlington, MA.
Richard Neapolitan, 2003. Learning Bayesian Networks, Prentice Hall.
van dert Voort, M. M., Klein, A. J. J., de Maaijer, M., van den Berg, A. C., van Deursen, J.
R., Versloot, N. H. A., 2007. A quantitative risk assessment tool for the external safety of
industrial plants with a dust explosion hazard. Journal of Loss Prevention in Process
Industries 20, 375-386.
VDI 3673, Part 1, 2002. Pressure venting of dust explosions.
Wang, J., Li, W., 2001. China’s coal mine accidents and comments of safety specialists.
Coal Industry Press Beijing.
Yuan, Z., Khakzad, N., Khan, F., Amyotte, P., Reniers, G., 2013. Risk-based design of
safety measures to prevent and mitigate explosion hazards. Industrial & Engineering
Chemistry Research 52, 18095-18108.
Yuan, Z., Khakzad, N., Khan, F., Amyotte, P., 2015. Risk Analysis of Dust Explosion
Scenarios using Bayesian Network Model. Journal of Risk Analysis 35: 278-291.
Yuan, Z., Khakzad, N., Khan, F., Amyotte, P., 2015. Risk-based optimal safety measure
allocation for dust explosions. Safety Science 74, 79-92.
Zhao, L. J., Wang, X. L., Qian, Y., 2012. Analysis of factors that influence hazardous

199
material transportation accidents based on Bayesian networks: A case study in China.
Safety Science 50, 1049-1055.

200
9 Conclusions and Future Research
Dust explosions are commonly occurring accidents in process industries and cause severe
financial losses to shareholders and insurance companies and physical damage to operators.
The research about dust explosions mainly focuses on the occurrence mechanisms as well
as prevention technologies and there are few risk estimations about dust explosions. At the
same time, the domino effects of dust explosions are seldom seen due to the complex
mechanisms and complex scenes. Therefore, a versatile QRA model for dust explosions,
considering interlinks among contributors, still needs to develop. Further, the features of
dynamic analysis should be integrated in this model to represent the dynamic characteristics
in process industries. Moreover, the dust explosion chain should be analyzed, which can
help to prevent accidents’ propagation and mitigate severe consequences caused by dust
explosions in a system.
9.1 Conclusions
The main conclusions of this study are as follows:
9.1.1 Investigation of dust explosion accidents worldwide
This study analyzed statistical characteristics of dust explosions worldwide. The huge
differences among the statistical results in various countries, periods, and industries, shows
the contributors to these accidents need to be further discussed, but usually have been
ignored due to the limitations in data collection.
More than 2000 dust explosions cases are collected to overcome the limitation of
insufficient samples. Also differences in developing and developed countries are compared
and further discussed. However, note that the number of reported accidents is far lower than

201
that of the actual occurrences, which limits the representativeness of this study. Moreover,
the missing critical information (e.g. ignition source) and intentional underestimation of the
casualties in some accident reports also limit the value of this study.
9.1.2 Developing generic risk analysis model for dust explosions
In this study, a generic risk analysis model of dust explosions is established based on BT.
Due to the numerous factors contributing to dust explosions and their complex internal
relationships, utilizing them in QRA is a big challenge, as is integrating various safety
barriers with potential consequences.
Taking advantage of BT, the primary causes of dust explosions are integrated according to
cause-effect relationships on the left side; at the same time, common applied safety barriers
as well as potential consequences categories are presented on the right. After obtaining the
probabilities of basic events, the reliabilities of safety barriers and loss of each consequence
category, the risk of a dust explosion is calculated. The tailoring ability of this generic
model is also illustrated through a case study which shows its adaptability. Moreover, a
potential safety measure is recommended for each basic factor, and the implementation of
the safety measures as well as their efficacies in risk reduction for dust explosions are
discussed.
9.1.3 Developing dynamic risk analysis model for dust explosions
Although the risk of dust explosions can be obtained by tailoring this generic risk analysis
model to specific cases, the limitation of ignoring the dependencies among basic events
restricts its application. Moreover, since BT is composed of FT and ET, this also brings the
static characteristic into BT.
To overcome these limitations, in this research, the BT model of dust explosions is
202
transformed to BN, which enables analysts to perform dynamic risk analysis, including
probability prediction, probability updating and sequential learning. In addition, the
dependencies among primary causes of dust explosions are conveniently represented.
Moreover, utilizing the latest information from a dynamic system in the risk analysis of
dust explosions using a BN model leads to more accurate results compared to the
conventional QRA (i.e. BT). These functions are represented by taking advantage of a case
study.
9.1.4 Proposing a methodology of safety measures allocation
A risk-based optimal methodology of safety measures allocation for dust explosions is
proposed in this research. The barrier in selecting suitable safety measures is to satisfy the
risk control requirement within a limited budget. Moreover, considering various potential
safety measures for a basic event, the selection priority should be determined.
Safety measures are proposed and categorized first according to risk management
principles in this study. Further, the priorities of safety measures are recommended to
follow inherent, engineered and procedural safety measures. To obviate the aforementioned
dilemma in determining a safety strategy for dust explosions, optimization methods are
introduced and integrated with the developed risk analysis model of dust explosions to
establish the methodology for safety measures allocation. In this method, an index, NRRG,
is also defined for each safety measure to account for the cost of a safety measure and its
efficacy in risk reduction.
9.1.5 Analyzing domino effects of dust explosions
The chain of dust explosions is analyzed based on BN. Although the effects of blast waves
and flames can be analyzed using conventional methods (i.e. probit method) in the

203
academic area, discussion about the dust explosion chain is seldom seen due to the lack of
comprehensive research in the propagating mechanisms of dust explosions.
To quantify the escalation probabilities of dust explosions, ET is resorted to in this study
considering the five essential factors of dust explosions as safety barriers. After obtaining
their occurrence probabilities, the probability of a secondary dust explosion given the
primary one can be calculated, which is taken as the targeted escalation probability. Then,
taking advantaging of the BN model, the occurrence probability of each dust explosion on
the chain can be obtained.
9.2 Future research
The current research includes establishing a generic risk analysis model of dust explosions,
overcoming its static characteristics by introducing BN, analyzing domino effects of dust
explosions and developing optimal methodology to help decision makers to determine
safety strategies. Distribution characteristics of dust explosion accidents worldwide are also
discussed. Based on this research, the following recommendations for future research can
be made.
9.2.1 Extending the scope of hazards identification
In this research, the contributors to dust explosions, involving defects in design, operations
and management, and so forth, were drawn as comprehensively as possible from accident
investigations, academic papers, and relevant regulations, and the total number of primary
events is 79. However, due to the characteristics of individual industries and productions,
some potential factors might be missed in the generic model. Though the defects can be
overcome along with continuously tailoring the generic model to different cases to some
extent, by which new basic events can be added, it is also recommended to expand the
204
range of hazards identification based on the latest accident investigations, updated
regulations and research.
9.2.2 Dealing with uncertainty
Though this research focuses on developing a risk model for dust explosions, a large
amount of probability data of basic events is essential in risk estimation. The crisp values
were obtained from academic papers, relevant handbooks and expert opinions. However,
the arbitrary estimations from experts are usually questioned. In the future work, the fuzzy
set theory, being available in the situation where complete or precise information is lacking,
could be introduced to both the developed BT model and the BN model to improve the
accuracy of estimation.
9.2.3 Settling multi-objective programming problem
In this research, an index of Net Risk Reduction Gain (NRRG) was defined to simplify the
problem of safety measures allocation as a knapsack problem. However, in a more complex
case, both the objectives of experts and constraint conditions could be multiple. For
example, the cost of a potential safety strategy can be considered as the other objective in
safety measures allocation, besides controlling the risk level of a system. Therefore, a multi
objective programming model might be introduced to solve the complex issues.
9.2.4 Introducing risk analysis in domino effects of dust explosions
In this research, the domino effects of dust explosions are analyzed. However, the work
focuses on estimating the occurrence probability of a dust explosion in the chain. In order
to obtain the risks of dust explosions, the loss caused by an individual dust explosion should
be further considered. Based on analysis of risks caused by dust explosions, the areas with
a higher risk can be evaluated which will efficiently help to introduce safety measures to

205
mitigate potential damage caused by dust explosions. For this purpose, loss functions,
estimating the potential losses with the changes of process characteristics, could be
introduced in the risk analysis of domino effects. By this method, both the probabilities of
occurrence categories and their individual potential loss could be updated with dynamic
processes.

206
Appendix A
A partial case of dust explosions around the world from 1785 to 2012
Date Country Material Equipment Involved Types of Industries Dead/
Injured Ignition Source Reference
1785 IT F Warehouse Food plant 2i Flame and direct heat Eckhoff, 2003
1866 UK C _ _ 388d Hot work Mining-technology,
2014
1878 US F _ Mill 18d _ Explosion Hazards
Ltd
1906 FR C _ Coal mine 1099d Flame and direct heat Energy Liabrary
1911 UK F Store Flour mills 5d/7i Flame and direct heat PAPERSPAST
1911 UK F _ Food and feed plant 39d/100i Electrical sparks Explosion Hazards
Ltd
1911 UK _ _ _ 3d/5i _ Abbasi & Abbasi,
2007
1916 US F Steel bin Silo/elevator/warehouse _ _ Vijayaraghavan, 2011
1919 US F _ Food and feed plant 43d _ Explosion Hazards
Ltd
1924 US F Starch powder house Food and feed plant 42d/100i Static electricity GenDisasters, 2007
1930 UK F Silo Food and feed plant 11d/32i Self-heating and smoldering Explosion Hazards
Ltd
1936 US In Coal handling equipment Chemical plant 2d _ NFPA, 1957
1956 US F Elevator Food and feed plant 1i Hot work NFPA, 1957
1960 CHN C Electric locomotive, tripper Coal mine 684d Electrical sparks Wang & Li, 2001
1960 AUS F Elevator Silo/elevator/warehouse _
Hot work
Explosion Hazards
Ltd
1963 JPN C Mining slope Coal mine 458d/839i Friction sparks Hoshino et al., 1992
1963 CHN M Dust collector Metal products plant 19d/24i Impact friction Wenku, 2012
1965 IN C Mining slope Coal mine 375d Flame and direct heat Mining technology,
2014
1969 CHN C Electric locomotive Coal mine 115d/108i Electrical sparks Wang & Li, 2001
1970 GER F Grain silo Silo/elevator/warehouse 6d/17i _ Eckhoff, 2003
1973 CHN C Switch/ cable Coal mine 50d/10i Flame and direct heat Wang & Li, 2001
1975 IN C _ Coal mine 372d _ Mining technology,
2014
1977 US F Tunnel connected to
elevator Silo/elevator/warehouse 18d/22i Friction sparks GenDisasters, 2009
1977 US F Elevator Silo/elevator/warehouse 36d/10i Static electricity Bright Hub,2012
1978 CHN M Multiclone dust collector Metal products plant 5d/6i Impact sparks Safehoo, 2011
1980 US F Bin, conveyor Food and feed plant 8d/1i _ CSB, 2006

207
1981 CHN F Store house Silo/elevator/warehouse 7i Flame and direct heat MuYung Ltd
1985 CHN C Working surface Coal mine 63d/3i Hot work Wang & Li, 2001
1985 US IN Electric equipment Animal pesticide packaging plant 13d/1i Flame and direct heat CSB, 2006
1986 JPN CH Weighing hopper Chemical plant 1i Static electricity Failure Knowledge
Database
1986 CHN F _ Food and feed plant 2d/5i _ Yan & Yu, 2012
1986 CHN O Dust collector Textile mill 5d/15i Friction sparks Safethoo, 2009
1986 US W Incinerator, propane heater Manufacturer of "smoke" flavoring for
food products 4d Flame and direct heat CSB, 2006
1987 CHN C Working surface Coal mine 3d/1i Hot work Wang & Li, 2001
1987 CHN F _ Food and feed plant 1i _ Yan & Yu, 2012
1987 CHN O Dust collection system Textile mill 58d/177i Static electricity Explosion Hazards
Ltd
1987 CHN F _ _ 1i _ Yan & Yu, 2012
1987 US M Grinder, aluminum fuser
rolls
Coating, Engraving, and Allied
Services 5d/1i _ CSB, 2006
1988 CHN C Working surface,
ventilation Coal mine 26d/3i Hot work Wang & Li, 2001
1989 US M Dust collection system,
grinder/polisher Metal products plant 2d/1i Hot work CSB, 2006
1989 US W
Tyler model 2400 multi-
spindle panel router
s/n2984-87
Unsupported Plastics Profile shapes 2d Hot surface CSB, 2006
1990 CHN C Detonators,
roadway Coal mine 12d/4i _ Wang & Li, 2001
1990 JPN O Storage Chemical plant 9d/17i _ Abbasi & Abbasi,
2007
1990 US M Magnesium batching
hopper Chemical plant 1d/2i Impact sparks CSB, 2006
1991 CHN C Roadway, cable Coal mine 29d/14i Electrical spark Wang & Li, 2001
1991 CHN C Working surface Coal mine 35d/1i Hot work Wang & Li, 2001
1991 CHN C Working surface Coal mine 16d/7i Hot work Wang & Li, 2001
1991 US IN Granulator Pharmaceutical preparations 1d/1i _ CSB, 2006
1991 US W Conveyor belt Wood products plant 2d/1i _ CSB, 2006
1991 US M Machine press, acetylene
torch Plastic products factory 2d Flame and direct heat CSB, 2006
1992 JPN M Mixing operation Firework manufacturing plant 3d/58i Friction sparks Explosion Hazards
Ltd
1992 CA C _ Coal mine 26d Flame and direct heat GenDisasters, 2009
1992 US W Dust collection system Wood products plant 2d _ CSB, 2006
1993 CHN C Roadway Coal mine 40d/4Si Hot work Wang & Li, 2001
1993 US PR
Air arc gauge with
Plasmarc and Mappgas;
mixing tank
Plastic products factory 2d/2i Electrical sparks CSB, 2006

208
1993 US F _ Food and feed plant 9d Flame and direct heat CSB, 2006
1994 CHN C Coal lane Coal mine 79d/129i Friction sparks Wang & Li, 2001
1994 US C Turbine generator hopper Electric Services 22d Flame and direct heat CSB, 2006
1994 US O Metal duct Metal products plant 6d/1i Friction sparks CSB, 2006
1994 US W Halogen light, Dust
collection system Facilities support services 2d Hot surface CSB, 2006
1996 US PR Blending Tote Automobile brake pads and lining
manufacturer 1d _ CSB, 2006
1997 JPN M Bag filter dust-collecting
device _ 1d/1i _
Abbasi & Abbasi,
2007
1997 FR F Storage Silo/elevator/warehouse 11d/1i Impact sparks Masson, 1998
1997 US O Dust collection system,
welding device Motor vehicle parts and assessories 5d _ CSB, 2006
1998 US C Tripper, Vacuum Electric Services 17d _ CSB, 2006
1998 US PR Dust collector; air handling
ducts Sports equipment manufacturer 16d _ CSB, 2006
1999 US C Boiler Power station 30d/6i Flame and direct heat CSB, 2006
1999 US PR Oven; dust collection
system Grey and duct tile foundries 9d/3i Flame and direct heat CSB, 2006
1999 US W Silo Wood products plant 4d _ CSB, 2006
1999 US PR Machine that grinds plastic
pellets Plastic manufacturing 2d Hot work CSB, 2006
2000 CHN W Dust removal equipment Wood products plant 4d/7i _ Chinanews, 2008
2000 US F _ Food and feed plant 3d Hot work CSB, 2006
2001 CHN C Roadway Coal mine 17d/23i _ CSAWS
2001 IT O Storage Wool factory 3d/5i Electrical sparks Piccinini, 2008
2001 CHN W Ventilation system Wood products processes 6i Static Electricity Safehoo,2011
2001 CHN O Silo Food and feed plant 1d/7i Self-heating and smoldering Chinanews, 2008
2001 US W _ Wood Products plant 10d/3i _ CSB, 2006
2001 US IN Saw, vacuum cleaner Rocket propellant/motor manufacturing
plant 3d/1i Hot work CSB, 2006
2001 US M Dust collector Metal products plant 2d _ CSB, 2006
2002 CHN F Agitator Food and feed plant 8i _ Sina, 2002
2002 CHN W _ _ _ Flame and direct heat Anquan
2002 CHN F _ Food and feed plant 6d/12i _ Chinanews, 2002
2002 CHN C _ Coal mine 9d/14i _ CSAWS
2002 CHN F Workshop Maintenance 17i Hot work Sina, 2002
2002 US PR Tire bin Tire recycling 13d _ CSB, 2006
2003 CHN C _ Coal mine 3d _ CSAWS

209
2003 US PR Milling equipment Mechanical rubber goods 38d/6i _ CSB, 2006
2003 US W _ _ 2d _ CSB, 2006
2003 US PR Oven _ 37d/7i _ CSB, 2006
2003 US W _ _ 9d/2i _ CSB, 2006
2004 CHN C Coal lane Coal mine 2d/16i _ CSAWS
2004 UK PR LPG tank Plastic products factory 9d/33i Flame and direct heat Explosion Hazards
Ltd
2004 US W _ _ 2d _ CSB, 2006
2004 US W Dust collection system Wood products plant 3d Impact sparks CSB, 2006
2004 US F Bag house Tofu manufacturer 16d/1i _ CSB, 2006
2005 CHN C Underground coal bin Coal mine 171d _ Chinanews, 2005
2006 CHN C _ _ 7i _ Yan & Yu, 2012
2006 CHN C _ Coal mining 14d _ CSAWS
2007 CHN W Conveyor Wood pelts manufacturer 4d/5i _ Xinhuanews, 2007
2007 CHN F Workshop, pulverizer Rice process factory _ Hot surface Wenku, 2010
2007 CHN F Hopper Feed processing 5i Self-heating and smoldering Fire department,
2007
2007 CHN W Packing workshop Wood products processes 1d/1i Electrical sparks Chinanews, 2007
2007 CHN C _ Coal mining 31d _ CSAWS
2008 CHN F _ Starch/Candy 12i _ Yan & Yu, 2012
2008 CHN M Dust collection system Metal fabrication 10i Electrical sparks Chinanews, 2008
2009 CHN M Workshop Aluminum products manufacturer 11d/20i Self-heating and smoldering Xinhua news, 2009
2009 CHN W _ Wood products plant 8i _ Yan & Yu, 2012
2009 CHN IN Dust collection system Chemical preparations 2i _ Chinanews, 2009
2010 US M Silo Titanium plant 3d _ CSB, 2006
2010 CHN M Dust setting chamber Metal polishing 2d/6i Impact sparks Chinanews, 2010
2010 US C Coal lane Coal mine 29d/2i Flame and direct heat McAteer, 2011
2011 US M Pipes, furnace Iron Powder plant 3d/2i Impact sparks CSB, 2011
2011 CHN M Polishing workshop Aluminum products plant 5d/1i Flame and direct heat China news, 2011
2012 CHN M Polishing workshop Metal polishing plant 13d/16i Electrical sparks Safehoo,2013
2012 CHN M Polishing workshop Apple supplier factory 59i _ NPR news, 2012
2012 CHN C _ Coal mine 6d _ China news, 2012
M: Metal; W: Wood; F: Food; C: Coal; IN: Inorganic; PR: Plastic/Rubber; CH: Chemical; O: Others;