Embed Size (px)
Citation preview

Dynamic Simulation and Visualisation of Fermentation: Effect of Process Conditions on Beer Quality
Alistair D. Rodman, Dimitrios I. Gerogiorgis
Institute for Materials & Processes (IMP), School of Engineering, University of Edinburgh The King’s Buildings, Mayfield Road, Edinburgh EH9 3JL, UK (e-mail: [email protected])
Abstract: Fermentation is the central, most important unit operation in alcoholic beverage manufacturing and has already been studied by means of first-principles dynamic models, which explicitly consider the temperature effects and employ parameterisations obtained using industrial beer brewing campaign data. Nevertheless, the precise effect of initial conditions on beer quality and flavour has not been documented. Multi-objective optimisation encompasses ethyl alcohol maximization and batch duration minimisation, but must also quantitatively monitor all the critical flavour components (Rodman & Gerogiorgis, 2016). Dynamic simulation and visualisation of the key (ethyl alcohol, ethyl acetate, diacetyls) concentrations is pursued for varying initial condition (sugar concentration, pitching rate, active yeast fraction) parameters, and hundreds of thousands of possible temperature manipulation profiles over the entire brewing horizon. Feed sugar content is confirmed to govern attainable alcohol concentration, but our notable finding is that pitching rate is a very efficient manipulation, in contrast to the weak effect of initial active yeast fraction.
Keywords: dynamic simulation, visualisation, beer, fermentation, initial conditions, attainable envelope.
1. INTRODUCTION
Fermentation is an essential brewing process unit operation: biomass (yeast) is introduced at concentrations of 10 to 20 million cells per mL of cooled wort (pitching), as soon as it enters the fermentation vessels (Hudson & Birtwistle, 1966). The primary chemical reaction pathway is the conversion of two sugar into one ethanol and one carbon dioxide molecule, coupled with exothermic reaction heat and biomass growth. Concurrently, a wide range of organic compounds (many of which contribute to or compromise beer flavour) are formed at low concentrations, due to the multitude of side reactions.
Fermentation progression is sensitive to yeast pitching rate, dissolved oxygen content, batch pressure and temperature. The system temperature strongly affects yeast growth and metabolic rate: as long as yeast cells are kept below 30 ºC and not damaged, higher temperatures accelerate fermentation. Beyond this critical temperature, ethanol and volatile flavour compound loss rates are too severe, coupled with increased production of undesirable substances and bacterial growth. Brewers control fermentor temperature within a narrow range during batch progression, to accelerate the fermentation while also ensuring that yeast is not deactivated due to denaturation and that no undesirable flavour compounds are produced.
Once fermentable sugar content has been consumed, beer requires further processing prior to bottling and consumption: fresh green beer must be matured, carbonated and finished. Fermentation duration varies by product and flavour sought. Lagers are fermented at temperatures around 10 ºC, thus requiring a fermentation time of about one week (160 hours). Ales are fermented at higher temperatures (~22 ºC) and need less time, between 3 and 4 days (Boulton & Quain, 2008).
The worldwide diversity of brewing plants and operations has induced an enormous variety of fermentor vessel types. Many fermentors are cylindro-conical stainless steel vessels (Fig. 1a), thus promoting circulation and mixing due to CO2 bubbling, since contents are not agitated mechanically: a uniform vessel temperature is easier and quicker to achieve. Yeast recovery is thus facilitated via settling into the cone (lager-producing bottom yeasts) or flotation and skimming of the free surface in the cylinder (ale-producing top yeasts). Fermentors typically comprise a cooling jacket, controlling the wort temperature in order to follow the prescribed profile. Larger tanks may include separate cooling mechanisms on the conical and the cylindrical portions (Fig. 1b), allowing for control of the circulation pattern (Boulton & Quain, 2008). The selection and implementation of a suitable temperature profile throughout fermentation is the goal we pursue here, to ensure high product quality, eliminate composition variations and safeguard brand consistency and customer satisfaction.
Figure 1. Industrial fermentation vessel and mixing pattern.
Preprint, 11th IFAC Symposium on Dynamics and Control of Process Systems,including BiosystemsJune 6-8, 2016. NTNU, Trondheim, Norway
Copyright © 2016 IFAC 615
1.1 Beer Maturation and Finishing
Maturation (also known as secondary fermentation) achieves numerous objectives: insoluble material is removed, stability is increased, flavour is finalised and the beverage is carbonated by 3 distinct strategies employed for conditioning:
Lagering: the beer is cooled causing a considerable portion of the yeast to flocculate: beer is then transferred to a new vessel where any remaining sugar is fermented slowly, while the CO2 produced remains entrapped toward natural carbonation.
Aging: the temperature of the green beer is reduced below freezing (0 ºC) and maintained for up to 2 weeks, after which external beer carbonation with pressurised CO2 is conducted.
Krausening: a portion of wort which has only recently begun fermenting is added to the green beer, which is maintained at a moderately low temperature (T = 8 ºC) for several weeks. During this period, additional sugars are slowly consumed and the CO2 which is produced achieves natural carbonation.
During maturation, the concentrations of certain undesirable flavour-modifying compounds are reduced by conversion to substances which do not discernibly influence beer flavour. Beer is then filtered to achieve a clear final product (haze is perceived as a negative product trait), and stabilising agents are added to ensure prolonged beer clarity until consumption. Chill-haze is a well-known undesirable phenomenon during which beer develops opacity when chilled prior to drinking, as a result of the protein/polyphenol content in the beverage. Speciality chemicals remove such compounds, ensuring that beer remains attractive to the consumer; it is then ready to be sealed into cans, kegs or bottles for distribution and sale.
Online measurements are cumbersome (Corrieu et al., 2000), so each beer production line has a proprietary temperature manipulation profile, faithfully used for every single batch in order to guarantee product consistency (Trelea et al., 2001). Offline measurements for assessing fermentation progression are often very limited (wort density or specific gravity only). The Plato (specific gravity) scale is used in many breweries as a surrogate for equivalent sucrose concentration, since sugar depletion is a reliable indicator of fermentation extent.
1.2 Product Flavour
Beer production requires few raw materials and relatively straightforward processing, however the fermentation output is a complex mixture of many chemical compounds, whose balance governs flavour and product quality (Hanke, 2010). Their varying composition combinations render each brand taste unique, but become unpleasant at certain concentrations. Diacetyl (2,3-butanedione) has a pungent banana-like aroma, and is often produced on purpose above the flavour threshold. Esters also contribute greatly to beer aroma due to volatility. Ethyl acetate is used as an indicator of all esters present: its adverse (nail varnish remover) odour is harmful to brewing. Acetaldehyde has a recognizable (green apple) taste, which is also well outside the target flavour profile of beer products. Ensuring that organic compounds which influence flavour are kept within acceptable margins is critical for viable brewing.
2. MATHEMATICAL MODELLING
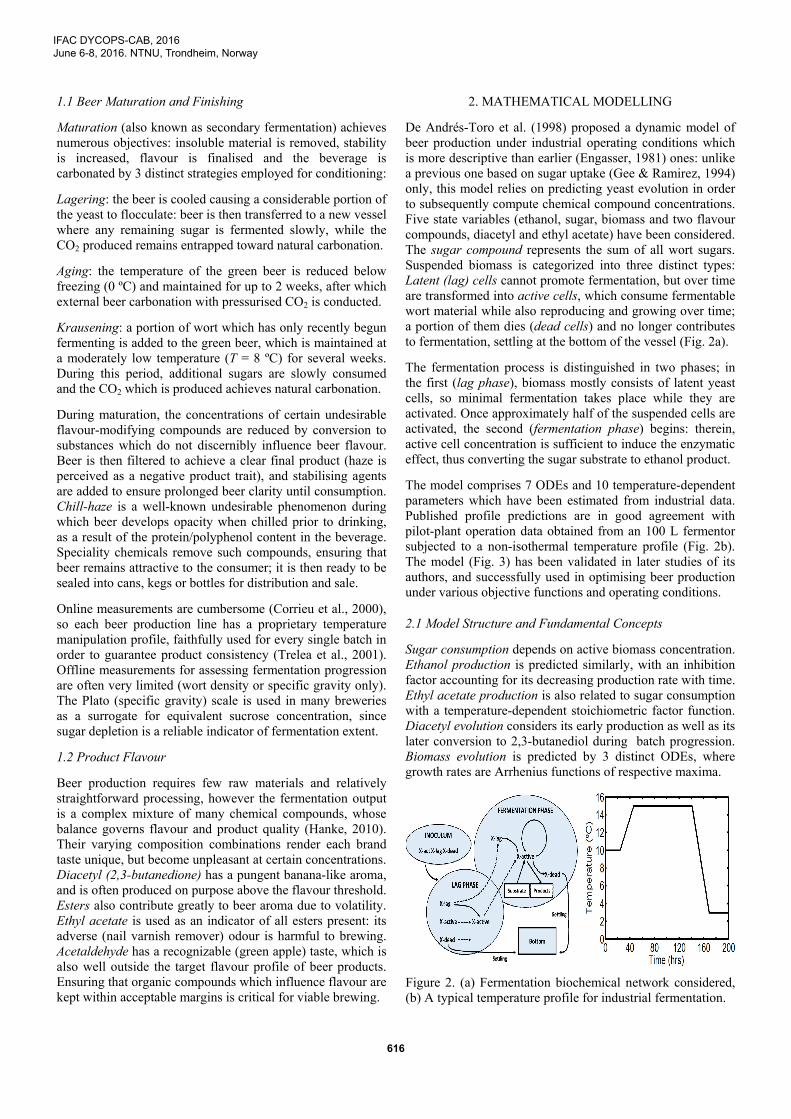
De Andrés-Toro et al. (1998) proposed a dynamic model of beer production under industrial operating conditions which is more descriptive than earlier (Engasser, 1981) ones: unlike a previous one based on sugar uptake (Gee & Ramirez, 1994) only, this model relies on predicting yeast evolution in order to subsequently compute chemical compound concentrations. Five state variables (ethanol, sugar, biomass and two flavour compounds, diacetyl and ethyl acetate) have been considered. The sugar compound represents the sum of all wort sugars. Suspended biomass is categorized into three distinct types: Latent (lag) cells cannot promote fermentation, but over time are transformed into active cells, which consume fermentable wort material while also reproducing and growing over time; a portion of them dies (dead cells) and no longer contributes to fermentation, settling at the bottom of the vessel (Fig. 2a).
The fermentation process is distinguished in two phases; in the first (lag phase), biomass mostly consists of latent yeast cells, so minimal fermentation takes place while they are activated. Once approximately half of the suspended cells are activated, the second (fermentation phase) begins: therein, active cell concentration is sufficient to induce the enzymatic effect, thus converting the sugar substrate to ethanol product.
The model comprises 7 ODEs and 10 temperature-dependent parameters which have been estimated from industrial data. Published profile predictions are in good agreement with pilot-plant operation data obtained from an 100 L fermentor subjected to a non-isothermal temperature profile (Fig. 2b). The model (Fig. 3) has been validated in later studies of its authors, and successfully used in optimising beer production under various objective functions and operating conditions.
2.1 Model Structure and Fundamental Concepts
Sugar consumption depends on active biomass concentration. Ethanol production is predicted similarly, with an inhibition factor accounting for its decreasing production rate with time. Ethyl acetate production is also related to sugar consumption with a temperature-dependent stoichiometric factor function. Diacetyl evolution considers its early production as well as its later conversion to 2,3-butanediol during batch progression. Biomass evolution is predicted by 3 distinct ODEs, where growth rates are Arrhenius functions of respective maxima.
Figure 2. (a) Fermentation biochemical network considered, (b) A typical temperature profile for industrial fermentation.
IFAC DYCOPS-CAB, 2016June 6-8, 2016. NTNU, Trondheim, Norway
616

Table 1. Mathematical model employed for dynamic simulation of beer fermentation (de Andrés-Toro et al., 1998).
Active cells: (1) Ethyl acetate: (7)
Latent cells: (2) Active cell growth: (8)
Dead cells:
(3) Dead cell settling: (9)
Sugar: (4) Sugar consumption:
(10)
Ethanol:
(5) Ethanol production:
(11)
Diacetyls: (6) Inhibition factor: (12)
3. BASE-CASE DYNAMIC SIMULATION
To validate our MATLAB® code for fermentation simulation versus the broadly cited de Andrés-Toro et al. (1998) model, published temperature profiles have been used as code inputs in order to compare computed species trajectories with those previously illustrated in published model implementations. Optimal temperature manipulations by Carrillo-Ureta (2001) and Xiao et al. (2004) are used, with concentration profiles of all dynamic variables reproduced with excellent agreement. Remarkably, Xiao et al. (2004) omit ethyl acetate profiles, possibly due to an error discovered in the respective equation.
Our industrial partner (WEST Beer) has provided data for the temperature manipulation used in their fermentation (Fig. 3a). Dynamic concentration profiles of all key species considered have been computed and depicted in Fig. 3(b-d) for two cases (namely, industrial protocol vs. isothermal operation at 13 ºC, which are denoted by a solid and a dashed line, respectively). Sugar and ethanol trajectories show that both temperature profiles achieve fermentation within realistic time (Fig. 3b): the higher final temperature of the industrial protocol ensures greater fermentation efficiency (higher ethanol production). The industrial profile however stresses biomass (cell death), as evidenced by the dead cell curve maximum (Fig. 3c), thus inducing a longer time required for fermentation completion. The lag phase is shorter in the isothermal case, as the higher (ΔT = 2 ºC) initial temperature accelerates yeast activation.
Significant differences are observed in computed dynamic profiles of flavour by-product concentrations seen in Fig. 3d: [DY] production reaches a higher maximum and thereafter remains clearly higher under industrial operation, but so does its consumption, resulting in comparably low final values. Conversely, the [EA] concentration under industrial operation is double of that in the isothermal profile, due to the elevated temperature employed during most of the fermentation time.
Comparing the industrial manipulation (WEST Beer) with various other profiles reveals that it produces a comparatively high ethanol but also a favourably low diacetyl concentration. Nevertheless, batch duration is the longest of all T(t) profiles simulated, indicating a very strong incentive for optimisation. There is also scope for reducing the moderately high ethyl acetate concentration (which is notably higher in the given industrial case compared to many simulated T(t) alternatives), as it implies a noted risk of undesirable flavour contribution. These results confirm that the imposed temperature profile which a brewery implements has a vast impact on product (beer quality) and process (fermentation performance), a fact well known to brewers (Vanderhaegen et al., 2006) and worth addressing by systematic modelling and process optimisation. To this end, we have developed a heuristics-based strategy of generating an ensemble of all plausible candidate T(t) profiles used for computational study (Rodman & Gerogiorgis, 2016).
Figure 3. Dynamic variable trajectories for isothermal vs. industrial (base-case) fermentation (Rodman & Gerogiorgis, 2016).
IFAC DYCOPS-CAB, 2016June 6-8, 2016. NTNU, Trondheim, Norway
617

Figure 4. Effect of fermentation initial conditions on beer flavour and quality for the set of temperature manipulation profiles.
IFAC DYCOPS-CAB, 2016June 6-8, 2016. NTNU, Trondheim, Norway
618
4. RESULTS & DISCUSSION
The dynamic simulation and visualisation analysis of beer brewing is conducted considering two (low/high) values for each of the three identified system parameters of interest. Initial wort sugar concentration ([S]0), pitching rate ([XINC]0) and active yeast fraction concentration ([XA]0) (Fig. 4) have been varied between realistic bounds for industrial operation, thus producing 23=8 distinct initial condition combinations. The base case considered is the one for which all foregoing initial condition parameters are set at the lower bound values.
Dynamic process simulation for all initial condition triplets and all 175,252 plausible temperature manipulation profiles has been performed by original code in MATLAB® (R2015a) in order to visualise and comparatively evaluate the impact and relative importance of each condition parameter on each beer quality attribute, i.e. [EtOH], [DY], and [EA] (ethanol, diacetyl and ethyl acetate final concentrations, respectively). Dynamic simulation results are summarised in Fig. 4 via three-dimensional attainable envelopes of attributes (row 1) and two-dimensional sensitivity analysis plots (rows 2-5), illustrating the output ensembles of all measurable attributes versus all three ([S]0, [XINC]0, [XA]0) initial condition steps.
Two-dimensional plots are attainable envelope projections constructed in order to facilitate the pairwise comparisons of possible operational changes against the industrial base case. Final ethanol concentration is the main beer quality attribute, whose maximisation is the foremost process efficiency index. The time axis has been normalised (rows 3-5) to portray the required interval to consume 99.5% of initial sugar feed, [S]0; it has also been represented (row 2) as the required interval to achieve 99.5% of final ethanol concentration, [EtOH]max, to elucidate the full envelope of attainable alcohol production. Filled black circles represent this base case in all Fig. 4 plots, while open grey circles depict each other alternative scenario.
4.1 Initial Wort Sugar Concentration
The impact of raising the initial wort sugar concentration [S]0 (from 130 to 150 g L-1) on fermentation process performance and beer quality attributes is illustrated in Fig. 4 (column 1). Evidently, increasing fermentable material correspondingly increases final attainable ethanol concentrations (rows 2-3). The maximum attainable limit (row 2) is horizontal (virtually independent of batch time), but shorter times lead to higher flavour compound contents and thus compromise beer taste. Moreover, identical temperature manipulations require longer fermentation time at higher initial sugar concentrations, due to the inhibition on ethanol production in the relevant ODE (this minimal time penalty is quite acceptable in high-gravity brewing strategies, as it offers the benefit of even higher final product capacity due to the post-processing dilution stage). Both flavour compounds attain higher final concentrations for increased initial sugar concentration, a trend which implies that high-intensity fermentation practice should be monitored judiciously in order to remain safely below taste thresholds. This effect is apparent but limited for [DY] (row 4), and more pronounced for [EA] (row 5) in the entire duration spectrum.
4.2 Initial Yeast Concentration (Pitching Rate)
The effect of raising the initial yeast concentration [XINC]0 (pitching rate) from 4 to 6 g L-1 is shown in Fig. 4 (column 2). The maximum attainable ethanol concentration barely varies: it is marginally higher at low pitching rate for longer batches (t > 110 hrs), but also at high pitching rate for shorter fermentations (t < 110 hrs), as in this comparison the initial fermentable sugar content is constant for all profiles (row 2). Attainable [EtOH] variability increases with batch time, but it is wide at high pitching rate even for shorter batches (row 3).
Lower pitching rates induce longer fermentation durations, as shown by the consistent black band on the right (row 2); thus, a few more hours are required for most [EtOH] targets. Higher pitching rates may though induce cases in which short batches yield low [EtOH] concentrations (Guido et al., 2004), even lower than that for low [XINC]0 (grey triangular swarm). Another remarkable observation is that higher pitching rates also yield a few cases in which fermentation is spectacularly accelerated without any discernible loss in attainable ethanol.
Flavour compound production levels strongly depend on the initial pitching rate and demonstrate extreme variability. Lower pitching rates induce higher by-product concentrations of diacetyls and ethyl acetate; higher initial yeast loads drastically reduce maximum [DY] and [EA] levels produced. For both pitching rates, the shortest batch times correspond to the highest final concentrations of undesirable compounds. The diacetyl concentration Pareto front (row 4) embodies the trade-off observed for both pitching rates: maximum diacetyl concentration decreases monotonically with batch duration. Higher pitching rates narrow the [DY] concentration range for all batch times (as high [XINC]0 reduces variability by 50%). By-product formation is higher in many faster fermentations, but there is a subset of T(t) profiles which can simultaneously reduce batch durations as well as by-product concentrations.
4.3 Active Yeast Cell Fraction
The active yeast fraction [XA]0 used in previous studies (2%) has been compared to a higher (5%) level (Fig. 4, column 3). Dynamic simulation results do indicate remarkable similarity and identical trends for all observables in both [XA]0 cases, with very limited variation seen in all attainable sets (< 2%). Higher initial active cell population marginally reduces the final concentration of undesirable compounds (rows 4-5); nevertheless, this minimal effect is barely discernible and therefore not useful in improving current industrial practice.
Figure 5. Three promising temperature manipulation profiles.
IFAC DYCOPS-CAB, 2016June 6-8, 2016. NTNU, Trondheim, Norway
619

Table 2. Effect of pitching rate on critical beer quality attributes and fermentation performance.
Product/Process Attribute Fermentation time, t (hr) [EtOH] (g L-1) [DY] (ppm ≡ mg L-1) [EA] (ppm ≡ mg L-1) Pitching rate (g L-1) 4 6 4 6 4 6 4 6 Profile A 119.5 102.5 58.9 59.0 0.10 0.16 1.19 1.16 B 115.0 106.5 58.0 58.2 0.16 0.15 0.99 0.92 C 119.5 108.0 58.9 59.1 0.09 0.11 1.28 1.22 Current Industrial Practice 129.5 – 59.0 – 0.06 – 1.16 –
5. OPERATIONAL IMPROVEMENTS
The multitude of temperature manipulation profiles whose final attributes are depicted in Fig. 4 can be systematically screened to identify those capable of superior product quality and/or process performance over current industrial practice: three promising alternative T(t) profiles are depicted in Fig. 5, with their key product and process attributes listed in Table 2. Profiles A and C achieve a notable (7.7%) reduction in batch duration, at a minimal (<0.2%) penalty in [EtOH] (even more insignificant in case of high-density brewing and dilution). Profile B demonstrates that even higher (11.2%) time savings are attainable, at the price of slight (1.7%) [EtOH] reduction. Flavour compound concentrations ([DY], [EA]) are higher in all cases, but never beyond the discernible taste thresholds, reported as 0.2 ppm and 1.5 ppm, respectively (WEST Beer).
6. CONCLUSIONS
Dynamic simulation and visualisation of attainable envelopes of beer fermentation are extremely useful techniques in order to pictorially capture industrial brewing operation protocols, capitalize on embedded organizational knowledge but most notably identify, suggest and evaluate feasible improvements. Our multi-dimensional sensitivity analysis of key beer quality attributes versus plausible initial condition modifications for an enormous ensemble (hundreds of thousands of possible temperature manipulation profiles possible for prescription) demonstrates that initial sugar concentration clearly affects final ethanol concentration and thus beer product quality; the most remarkable finding is that fermentation efficiency and batch duration can be improved by manipulating the initial biomass concentration (yeast pitching rate) fed to fermentors. Moreover, what is also noteworthy is that the active fraction of fed yeast has a quite minor (virtually insignificant) effect on process efficiency (as long as a potent yeast strain is used) because the active cell population quickly rises if enough heat is provided by the selected temperature manipulation profile.
Exploring and identifying improved temperature profiles enhancing fermentor productivity in tandem with beer quality has already been a focal point (Rodman & Gerogiorgis, 2016) which has been further accentuated by the present results. The vast operational space of plausible T(t) profiles has been reduced on the basis of previously published heuristics and explored via large-scale dynamic simulations which have been visualised to identify promising profile improvements. New plots thus assist in capturing and mapping differences in current practice (and possible changes) for various products. Operational improvements suggested here are scheduled for implementation in a new WEST brewing production facility.
ACKNOWLEDGEMENTS
The authors gratefully acknowledge the financial support of the Eric Birse Charitable Trust for a Doctoral Fellowship awarded to Mr Alistair Rodman, as well as Engineering and Physical Sciences Research Council (EPSRC) funding from an Impact Acceleration Account (IAA) administered by ERI. We also thank Dr Martin Sweatman for insightful comments. Furthermore, we are grateful to WEST Beer (Glasgow, UK) and Hilary Jones, Simon P. Roberts and Udo Zimmermann, for inspiring discussions and collaboration during the project.
REFERENCES
de Andrés-Toro, B. et al. (1998). A kinetic model for beer production under industrial operational conditions. Math. Comput. Simulat., 48(1), 65-74.
Boulton, C., Quain, D. (2001). Brewing Yeast and Fermentation, Wiley-Blackwell, Oxford, UK.
Carrillo-Ureta, G.E. (2003). Optimal control of a fermentation process. City University, London, UK.
Corrieu, G., Trelea, I.C., Perre, B. (2000). On-line estimation and prediction of density and ethanol evolution in the brewery. MBAA Tech. Q. 37(2), 173-181.
Engasser, J.M. et al. (1981). Kinetic modelling of beer fermentation, Proceedings of the 18th Congress of the European Brewery Convention (579-586), Copenhagen.
Gee, D.A., Ramirez, W.F. (1994). A flavour model for beer fermentation. J. I. Brewing, 100(5), 321-329.
Guido, L. et al. (2004). The impact of the physiological condition of the pitching yeast on beer flavour stability: An industrial approach. Food Chem., 87(2), 187-193.
Hanke, S. et al. (2010). Influence of ethyl acetate, isoamyl acetate and linalool on off-flavour perception in beer. Brewing Sci., 63(7/8), 94-99.
Hudson, J.R., Birtwistle, S.E. (1966). Wort-boiling in relation to beer quality. J. I. Brewing, 72(1), 46-50.
Rodman, A.D., Gerogiorgis, D.I. (2016). Multi-objective process optimisation of beer fermentation via dynamic simulation, Food Bioprod. Proc., accepted (in press).
Trelea, I.C. et al. (2001). Predictive modelling of brewing fermentation: From knowledge-based to black-box models. Math. Comput. Simulat., 56(4-5), 405-424.
Vanderhaegen, B. et al. (2006). The chemistry of beer aging – a critical review. Food Chemistry, 95(3), 357-381.
Xiao, J., Zhou, Z.K., Zhang, G.X. (2004). Ant colony system algorithm for the optimization of beer fermentation control. J. Zhejiang Univ., 5(12), 1597-1603.
IFAC DYCOPS-CAB, 2016June 6-8, 2016. NTNU, Trondheim, Norway
620


![Da anni - epulae.it1].pdf · Frazione San Rocco Seno d’Elvio, 31 - 12051 Alba (CN) tel. 0173 35689 - fax 0173 440703 - apiazzo@piazzo.it - Barbaresco Docg Sörì Valgrande 2005](https://img.pdfslide.net/doc/110x75/5b1c99a47f8b9af2348bd3a7/da-anni-1pdf-frazione-san-rocco-seno-delvio-31-12051-alba-cn-tel.jpg)


![(1) It 25 )JI] < D 69 Ic 'c lc TEL 0173-57-2146 FAX 0173-57 ...(1) It 25 )JI] < D 69 Ic 'c lc TEL 0173-57-2146 FAX 0173-57-2519 E-mail ta i sho@r66. 7-dj. com YIU 12 27 26 23 (4) 11](https://img.pdfslide.net/doc/110x75/60878ec28948bf1d363af074/1-it-25-ji-d-69-ic-c-lc-tel-0173-57-2146-fax-0173-57-1-it-25-ji.jpg)