Embed Size (px)
Citation preview

ISSN: 2277-3754
ISO 9001:2008 Certified International Journal of Engineering and Innovative Technology (IJEIT)
Volume 4, Issue 2, August 2014
137
Dynamic Stability of Articulated Offshore Tower
under Seismic Loading Prashant Atreya
1, Nazrul Islam
2, Mehtab Alam
1, Syed Danish Hasan
3 1Department of Civil Engineering, Jamia Millia Islamia University, New Delhi, India
2Civil Engineering Department, Islamic University, Madina, KSA
3University Polytechnic, Aligarh Muslim University, Aligarh, India
Abstract - Offshore compliant structures such as articulated
towers, tension leg platforms, guyed platforms etc. are
economically attractive for deep-water conditions because of
their reduced structural weight as compared to conventional
platforms. These structures yield to the impact of wave and
earthquake forces and the restoring moments are provided by
large buoyant force. Compliant structures when subjected to
stochastic natured sea waves, earthquake or wind loads or a
combination of these loads, undergo large displacements
depicting non-linear transient behaviour. These non-linearties
are produced by non-linear excitation and restoring forces,
damping non-linearity, etc. which may lead to complex response
behaviour of articulated offshore tower. Non-linear restoring
force is from the geometric non-linearity of the structure. Studies
of Dynamic Stability phenomenon in such non-linear transient
systems have always created interest amongst the researchers.
Instant study investigates the transient behaviour of Single
Hinged Articulated Tower (SHAT) under different categories of
wave and earthquake loads followed by determination of its
dynamic stability during various phases of loading. Minimum
potential energy concept has been used to evaluate stability of
the Tower followed by study of its dynamic stability pattern using
two dimensional phase plots.
Keywords: Single Hinged Articulated Tower, Earthquake,
Dynamic Stability, Time History, and Phase Plot.
I. INTRODUCTION
With the exhaustion of natural resources available on
land, ocean has attracted human beings for minerals. More
and more exploration activities are taking place in sea
environment which have resulted in development of
offshore platforms / base. The journey began with the
erection of fixed type of offshore structure which in order
to overcome large bending moments at base, required high
strength base and large amount of material. In deep seas,
these structures were found to be costly and their erection
also provided challenges. This led to the development of
compliant offshore structures. These structures are found to
be suitable for deep sea water operations since they avoid
unacceptably high hydro-dynamic loads by yielding to
wave and current actions leading to economic designs.
These structures float on sea water by virtue of buoyancy
and are held at the sea base though latticed tower, teethers,
mooring lines, chains etc. Fig.-1 shows the various types of
compliant offshore structures. These structures have proved
to be cost effective and offshore industry is now moving
ahead with continued use of such structures. Due to their
flexible nature, these structures have large displacements
with inherent non-linearities, so prediction of behavior of
these structures in oceanic environment is difficult and is
met with many challenges. To get insight into the response
behavior of these structures and to explore the possibility of
their dynamic instability and chaotic motion, eefforts have
been made to use simplified realistic mathematical models.
(Fig.-1 compliant offshore structures)
The presence of strong geometric non-linearity and non-
linearity arising due to fluid structure interaction led to the
possibility of dynamic instability of the systems. On
account of these non-linearities, numerical investigations of
compliant offshore structures have revealed complex
behaviour involving sub-harmonic, super-harmonic and
periodic solutions. Although, during last more than a
decade, researchers have carried out seismic response of
compliant offshore structures (Jain, A.K., and Datta,
T.K.(1991)[1]; Lina, H., Youngang, T. and Cong, YI.,
(2006)[2]; Islam, N. and Ahmad, S.(2006)[3];
Chandrasekaran et al. 2008[4]; Islam, N., Zaheer, M.M. and
Ahmad, S.(2009)[5]; Hasan, S. D., Islam, N. and Moin, K.
2011[6]), more efforts are required for stability analysis in
non-linear environment. The stability analysis may consist
of perturbating an approximate solution. Various methods
of dynamic stability analysis of non-linear system in closed
form by using analytical, semi-analytical and numerical
techniques have been developed (Banik and others (2003-
2009)[7,8 &9]; Friedmann et al. 1977[10]; Chua and
Ushida, 1981[11]; Burton, 1982[12], Cai, G.Q. (1995)[13],
Lin, Y.K. and Cai, G.Q., 1995[14]). Application of these
techniques covers a wide range of application problems
including standard problems of Van-Der-Pol oscillator,
Duffing Oscillator, Double Pendulum etc. (Hamdan and
Burton, (1993)[15]; Ravindra and Mallik, (1994)[16]; Blair
et al. (1997)[17]; Yu and Bi, (1998)[18]; Mallik, A.K. and
Bhattacharjee, J.K.(2005)[19]). The main focus of
application problems was to study and investigate
capabilities of the methods to bring out all possible
instability phenomenon latent in the system. Islam Saiful,
A.B.M (20130[19] has recently used two dimensional phase
plots to determine dynamic stability phenomenon in SPAR

ISSN: 2277-3754
ISO 9001:2008 Certified International Journal of Engineering and Innovative Technology (IJEIT)
Volume 4, Issue 2, August 2014
138
platforms. Single Hinged Articulated tower platform
[SHAT] (Fig.- 2) is one of the widely used compliant
offshore structure which is economically attractive
especially as loading and mooring terminal in deep waters.
In the instant study, single hinged articulated tower with
geometrical and mechanical parameters mentioned in
Table-I have been used. This platform is comparatively
very light as compared to the conventional fixed platforms.
The tower itself is a linear structure, flexibly connected to
the sea bed through a cardon / universal joint and held
vertically by the buoyancy force acting on it. The part of the
tower emerging from the water i.e. deck supports the super
structure designed to suit the particular application e.g. a
tanker to be loaded, flaring of waste gases, etc. The
buoyancy chamber just below the deck provides requisite
amount of buoyancy to balance the tower, ballast and deck
weight. As the connection to the sea bed is through the
articulation, the structure is free to oscillate in any direction
and does not transfer any bending moment to the base. The
ballast chamber at the bottom lowers down the centre of
gravity and provides stability to the Tower. With the impact
of wind, wave or earthquake load, the tower deflects to one
side thereby increasing the submerged volume of buoyancy
chamber and hence uplifting force which brings back the
tower to its mean position. The articulated tower which can
be used at larger water depth may also have one or more
number of joints at the intermediate level. Such towers
having joints at the intermediate level are called multi
hinged articulated tower. As the articulated tower is
compliant in nature, it moves with the waves and thus the
wave force and bending moment along the tower will be
less as compared to a fixed structure. Usually the natural
period of the towers is of the order of 40 to 90 seconds and
hence dynamic amplification-factor is also small.
(Fig.-2 Amerada Hess Compliant Tower at Baldpate Garden
Banks (First freestanding, non-guyed compliant tower
installed in 1998)
II. METHODOLOGY
In the present work firstly a nonlinear dynamic analysis
of the said structure under waves / earthquake has been
carried out for its time domain responses using Langrangian
approach which has the capability of equating kinetic and
potential energies of the system to the rotational degrees of
freedom. The random waves have been simulated by
Monte-Carlo technique represented by Modified PM
spectra. Modified Morison‟s equation has been used for
estimation of hydro-dynamic loading. Water particle
kinematics has been governed by Airy‟s linear wave theory.
To incorporate variable submergence, Chakraborty‟s
correction [20 & 21] has been applied. Seismic inputs have
been applied using Northridge, Imperial valley CA, Duzce,
Turkey spectra. Stability assessment has been carried out
using concept of minimum potential energy and two
dimensional phase plots.
A. Assumptions and Structural Idealizations
In the present study, the following assumptions and
structural idealizations have been made for formulation of
the problem in respect of single hinged articulated tower
(Fig.-3):
1) Articulated tower is modelled as a stick with masses
lumped at the nodes. The universal joint at base is
modelled as mass-less rotational spring of zero stiffness.
2) Flexural deformations of the tower have been assumed
to be negligible as compared to its displacements as a
rigid body.
3) The entire tower has been discretized into „np‟ number
of elements of uniform length for the estimation of
conservative and non-conservative forces, while
diameter, mass and buoyancy may vary. The submerged
elements of the tower have been subjected to time
dependent hydro-dynamic loading. Due to nonlinear
forces acting on the tower, the number of submerged
elements shall also vary with respect to time.
4) Drag force is assumed to be proportional to the relative
water particle velocity w.r.t. the structure, oscillating
under wave and ground motion. The structural damping
of the system is specified as a fraction of the critical
damping corresponding to the un-deflected
configuration of the tower.
5) Earthquake is assumed to be a broad band random
stationary process described with the help of an
accelogram.
6) The behaviour of the fluid surrounding the structure
shall not be affected by the slow motion of the compliant
tower.
7) Analysis due to earthquake excitation and due to wave
forces are carried out independently, and therefore water
particle kinematics is taken to be negligible for the
seismic forces. Only two dimensional motion of the
tower in the plane of the environment loading have been
considered in the analysis.
III. ESTIMATION OF LOAD ON STRUCTURE
A. Wave Loads
A variety regular waves as suggested by Hasan, S. D.,
Islam, N. and Moin, K.(2011)[6] and Jameel & Ahmad
(2011)[22] have been considered. In order to investigate the
combined effect of current and earthquake, current
velocities of 1.0 m/s, uniform throughout the depth have
also been considered. The influence of various parameters
such as variable buoyancy, added mass, instantaneous
towers orientation, variable submergence and effect of
current, on the response of SHAT and its stability aspects

ISSN: 2277-3754
ISO 9001:2008 Certified International Journal of Engineering and Innovative Technology (IJEIT)
Volume 4, Issue 2, August 2014
139
has been investigated in detail. To calculate the wave force
on latticed articulated tower, the latticed tower has been
replaced with cylindrical shaft of equivalent diameter.
Wave forces on the submerged part of the latticed tower
(cylindrical shaft) have been estimated by the modified
Morison‟s equations, which duly takes into account the
relative motion of the structure and water. The water
particle velocities and accelerations have been stipulated by
Airy‟s wave theory. To incorporate the effect of variable
submergence, Chakrabarti‟s approach has been adopted.
The transformation matrix has been used to compute the
normal and tangential component of the hydrodynamic
forces on each element of the tower corresponding to
instantaneous deformed configuration of the tower. The
updated mass-moment of inertia of the tower has been
incorporated in the consistent mass and damping matrices.
Newmark‟s Beta integration scheme has been deployed to
solve the equation of motion taking into account all non-
linearities involved in the system.
B. Seismic Loading
Accelograms (Northridge, Imperial Valley CA, and
Duzce Turkey) have been used to provide input for ground
acceleration time history (Fig.-4) for calculating seismic
response of the tower by time history analysis. The wave
loading are not correlated with seismic loadings. The two
analysis are carried out independently. The analysis under
earthquake alone is carried out using water particle
kinematics as zero. To observe the behaviour due to the
combined wave and earthquake forces, numerical studies
are conducted to investigate the effects of initial conditions,
current and wave on the seismic response of the tower.
Without wave, the tower is assumed to have zero
displacement and zero velocity at time t=0. When wave and
earthquake are considered to act together, different initial
conditions of the tower are assumed depending upon the
oscillating state of the tower at the instant when the
structure encounters the earthquake. Further, it is assumed
that the earthquake forces act on the structure when it
oscillates in a steady state under the regular sea. The
responses induced due to earthquake are further compared
with the responses due to strong sea-state / waves / waves in
order to establish relative severity of the two independent
events. The commencement of the earthquake has been
considered such that the first prominent peak of accelogram
matches with the crest of the wave in order to get the
maximum impact of wave and earthquake load. The seismic
responses of tower are further compared with the response
due to strong sea states.
(Fig. 3- SHAT Model)

ISSN: 2277-3754
ISO 9001:2008 Certified International Journal of Engineering and Innovative Technology (IJEIT)
Volume 4, Issue 2, August 2014
140
(Fig.-4(A) – Earthquake Accelograms)
*Source of Earthquake Data-http://peer.berkeley.edu/smcat/earthquakes.html
IV. EQUATIONS FOR PROBLEM SOLUTION
A. Equation of Motion
The equation of Motion is derived using Lagrange‟s
approach wherein kinetic and potential energy of the
system are related in terms of rotational degrees of
freedom.
[ ] – + = MƟ (4.1.1)
K.E. of Tower = I 2
(4.1.2)
Where
I = m*
i (ri )2
+ mi(ri )2 + Id + md
I = I* + Id
+ md
Similarly Potential Energy of the tower (P.E. =∑ mgh)
obtained as
P.E.= { miri - fbi ri }g.cos Ɵ
+md g. lc cos Ɵ
(4.1.3)
= 2 I = I (4.1.4)
[ ] = I Ӫ and = 0 (4.1.5)
= -{ miri - f bi ri
}gsin - md glc sin
(4.1.6)
Putting these values in equation (4.1.1), equation of
motion is obtained as
I – +{ f bi ri -
miri -md lc} g sin = MƟ
or
[I] + [{ f bi ri - miri
-mdlc } g ] = MƟ
or [M] { Ӫ} + [K] { Ɵ } = { MƟ } (4.1.7)
From above it is shown that [M] consists of mass moment
of Inertias of all the elements including the deck, about
the hinge and MƟ is Moment due to Non conservative
forces and
[K] = { f bi ri - miri
-
mdlc } g
Referring Fig.-3, = angular displacement, = angular
velocity, = angular acceleration, I = Total mass
moment of Inertia of the Tower, fbi is the buoyancy of ith
element [fbi = (𝜌w
dsi], DEB = Equivalent
diameter for buoyancy of the element, 𝜌w = mass density
of sea water (taken as 1025 kg/m3 presently)position, mi =
Structural mass of the ith element, m*
i = Total mass (mi
+a mi ) of the submerged element[ami = added mass of

ISSN: 2277-3754
ISO 9001:2008 Certified International Journal of Engineering and Innovative Technology (IJEIT)
Volume 4, Issue 2, August 2014
141
the ith element =(CM-1)𝜌w (DEI)2
idsi], ri = position vector
of the number ith element to the universal joint , dsi =
height of each element of tower, l = total height of tower,
np = number of discretized parts, nsp = number of
submerged elements at any instant of time, , (CM-1) =
coefficient of added mass, CM = coefficient of inertia (its
value is taken as 2.0), (DEI)i = coefficient diameter of
inertia for the ith
element, md = mass of deck, Id =
Moment of Inertia of deck about its centre, lc = height of
centre of mass of deck from hinge [lc = l + 𝜌cm], 𝜌cm =
position of Centre of mass of deck above top of the tower,
g = acceleration due to gravity.
B. Wave Velocities and loads
Wave Velocity
Airy‟s linear wave theory has been deployed for
calculating wave velocities as stated:
Horizontal velocity:
u = cos (kx – 𝜎t) (4.2.1)
Vertical velocity:
v = sin (kx – 𝜎t) (4.2.2)
Corresponding water particle accelerations are obtained
by time derivatives as:
Horizontal acceleration:
= = sin (kx – 𝜎t) (4.2.3)
Vertical acceleration:
= = cos (kx – 𝜎t) (4.2.4)
Where, L= wave length, H = Wave height = Wave period,
d= Water depth, k = = Wave number, 𝜎 = = wave
frequency, s = vertical distance of the point under
consideration, x = horizontal distance of the point
measured in X- direction as the wave travel from the
initial position of the tower, t = time at an instant To
incorporate the effect of variable submergence,
Chakrabarti‟s(1975) approach shall be adopted in which
instantaneous sea surface elevation or fluctuating free
surface effect can be incorporated as (d + 𝜂) instead of
water depth (d). The fluctuating free surface effect can be
significant when the wave height is not small in
comparison to the water depth.
Wave Load
The force dF(t) due to wave on differential section of
length dsi of the cylinder is made up of two components
namely inertia force component which is proportional to
the normal component of the fluid particle acceleration
and drag force which is proportional to the square of the
normal component of the fluid particle velocity thus:
dF(t)= [ D2 𝜌w CM ( )+ 𝜌wDCD │ │] dsi (4.2.5)
Where, D = Outer diameter of the cylinder, = fluid
particle velocity normal to the member, = fluid particle
acceleration, CM = Inertia co-efficient, CD = Drag co-
efficient.
When both wave and current forces are considered
together, equation (3.2.5) shall be modified as follows:
dF(t) = [ CM 𝜌w ( D2 ) ( ) + 𝜌w CD D (vc + )
│ vc + │] ds (4.2.6)
where vc is the water particle velocity normal to the
member due to current only. Equation (4.2.5) can also be
modified to account for relative velocity and acceleration
between the fluid particle and the structure ( and ).
The drag and inertia forces get modified as under:
dF(t) = [ CM 𝜌w ( D2
) ( - ) + 𝜌w CD D ( - ) │ -
│ + D2 𝜌w ] dsi (4.2.7)
The above equations, through integration, shall be used
to determine the instantaneous hydrodynamic loading
along the submerged height of the shaft. Moments about
the axes of rotation, due to these forces are determined by
multiplying the differential force equation by the
appropriate moment arms and then integrating over the
length of the cylindrical shaft to obtain the total moment.
As the total height of the shaft shall be divided into a
finite number of elements for determination of the wave
forces and moments, the total force is obtained by the
summation of all elemental values.
C. Equation of motion under seismic forces
The equation of motion in terms of rotational degrees
of freedom for combined earthquake and wave loading is
written as:
[I]{ }+[C]{ }+[K]{ }={ (t)}+{ (t) } (4.3.1)
Where, { (t)}–Moment due to hydrodynamic loading
including the effect of non-linearities and current, { (t
}- Moment due to earthquake loads
The forcing functions due to wave and current only are
expressed as:
(t) =[Me] { ü- ẍ}+[ M] { ẍ}+0.5𝛒w CD [A] {( ủ- ẋ + vc)
ủ- ẋ + vc } (4.3.2)
Under the combined effect of wave and earthquake, the
drag and inertia forces will be modified by replacing (ẋ)
by ( + ẋ ) and (ẍ) by ( + ẍ ) leading to the following
expressions:

ISSN: 2277-3754
ISO 9001:2008 Certified International Journal of Engineering and Innovative Technology (IJEIT)
Volume 4, Issue 2, August 2014
142
(t) = [-Me]{ }+[M ]{ü}+0.5𝛒wCD[A] { (ủ- ( + ẋ)+
vc ) ủ - ( + ẋ)+ vc } (4.3.3)
For the consideration of earthquake alone the forcing
function is modified by replacing (ü) = 0 and ( ) = 0.
Thus
(t) alone = - [Me]{ }+0.5𝛒w CD [A] { - ( + ẋ ) }
- ( + ẋ ) (4.3.4)
Where,
Me = [M]+ [Ma] i.e. total mass matrix, [Ma] = Added mass
matrix =(CM – 1) 𝛒wV, V = lumped volume of the tower at
a node, A = Projected Area, x, ẋ, ẍ = tower‟s linear
displacement, linear velocity and linear acceleration
respectively.
u, ủ, ü = water particle linear displacement, linear
velocity and linear acceleration respectively.
, = seismic ground velocity and ground acceleration
respectively.
V. DETERMINATION OF STABILITY OF TOWER
A. Stability solutions Using Minimum Potential Energy
Concept
If the amplitude of vibration decreases with time, the
system is said to be stable. If the transient increases
indefinitely with time, the system is said to be unstable.
For stable systems, the total energy in the system
decreases with time. The loss of energy is usually
dissipated as heat due to friction. Therefore damping for
stable systems must be positive. For unstable systems,
energy must have been kept adding to the system because
there is continuous increase in amplitude of vibration.
Work is therefore done on the system by the damping
force. Hence damping for unstable systems is negative.
For conservative systems, the principle of minimum
potential energy (Seto, William W. (1989)[24])can be
used to test the stability of a system. A system will be
stable at an equilibrium position if the potential energy of
the system is a minimum for that position, i.e.,
= 0 and > 0 (5.1.1)
Where P.E. = Potential energy of the system, q =
Generalised coordinates In the instant work, stability has
been worked out by evaluating net impact of stabilizing
forces on the tower. However, serviceability requirements
which are determined on the basis of inclination of the
tower from the mean position have also been kept in
mind. In most of the cases, although the stabilizing forces
may bring back the tower to its mean position, the towers
have been declared as unserviceable due to larger
inclinations on application of loads (viz. more than 2
degrees in case of drilling terminals, more than 4 degrees
in case of mooring terminals and more than 5 degrees in
case of flaring terminals).
B. Determination of Dynamic Stability using Two
Dimensional Phase Plots
A phase portrait is a collection of trajectories that
represent the solution of these equations in the phase
space. To obtain phase plots, velocities are plotted on
abscissa and displacement / rotation are plotted on x-axis.
A trajectory is closed if and only if it corresponds to a
periodic solution of a system. When a system approaches
periodic behaviour and a closed curve in phase plane is
observed, the closed path is called a limit cycle. A close
trajectory of a dynamic system which has nearby open
trajectories spiralling towards it both from inside and
outside is called stable limit cycle(Fig-4a). If nearby open
trajectories spiral away from closed path on both sides,
the close trajectory is unstable limit cycle(Fig-4b). The
thick line closed trajectory is limit cycle and other paths
are neighbouring open trajectories. When the
neighbouring trajectories spiral towards the limit cycle
from one side and spiral away from the other side, it is
semi-stable limit cycle (Fig-4c). If nearby trajectories
neither approach nor recede from closed trajectory, it is
neutrally-stable limit cycle (Fig-4d).
(Fig.-4(B) Limit Cycles)
In Phase Plots, instability phenomenon is shown in
form of symmetry breaking bifurcations caused by nT
sub-harmonic / super-harmonic oscillations and a periodic
responses. In a dynamical system, a bifurcation occurs
when a small smooth change made to the bifurcation
parameter causes a sudden qualitative or topological
alteration in structural behaviour(Fig.5). When the
symmetry of a phase plot is disturbed, bifurcation is
termed as symmetry breaking bifurcation. Sub-harmonic
oscillations occur when the time period of subsequent
cycle lessens by 1/n times than the previous time period.
When the time period of subsequent cycle increases n
times of previous time period, the oscillation is super-
harmonic.

ISSN: 2277-3754
ISO 9001:2008 Certified International Journal of Engineering and Innovative Technology (IJEIT)
Volume 4, Issue 2, August 2014
143
No Bifurcation and Stable
System
Bifurcation and Unstable System
(Fig.5 Phase plots of stable / Unstable Systems)
VI. DISCUSSION OF RESULTS ON SEISMIC
RESPONSE AND DYNAMIC STABILITY
In the Instant study, SHAT was subjected to a variety
of regular wave load along with Northridge, Imperial
valley CA, Duzce Turkey earthquake excitation at
different starting time. The responses are obtained in
terms of heel angle rotation, tip displacement; shear force,
bending moment, axial force, net stabilizing moments and
time required for dynamic stability etc. are given in
Table-II. Further, response and stability parameters
examined under four categories of earthquakes are given
in Table III. Tower was also subjected to variation in
dimensions of Buoyancy chamber height and diameter
and its behaviour was examined. Table IV and Table V
contains response and stability parameters when Tower
was subjected to variation in Buoyant chamber height and
diameter respectively. Stability of tower was checked
using principles of minimum potential energy. Net
positive stabilizing moments under various loading
conditions bring the tower back to its mean position.
Time to achieve dynamic stability status was determined
using two dimensional phase plots.
Table 1 - Geometrical and mechanical Properties of SHAT Under Study
GEOMETRIC CHARACTERISTICS Effective Diameter for added mass 4.5 m
Height of Tower (l) 400 m Effective Diameter for Drag 13 m
Water depth (d) 350 m Effective Diameter for Inertia 4.5m
Height of Ballast (HBL ) 120 m MECHANICAL PROPERTIES
Height of Buoyancy chamber (H) 70 m Deck Mass (MD) 2.5 x 10⁶ Kg
Position of Buoyancy chamber (PBC ) 310 m Structural Mass (SMT) of Tower 2.0 x 10⁴ Kg/m
For Chamber Mass of Ballast (MBT) 44840 Kg/m
Effective Diameter for Buoyancy (DB) 20 m MECHANICAL OSCILLATIONS
Effective Diameter for Added Mass 7.5 m Time period 29.47 sec.
Effective Diameter for Drag 14.5 m HYDRODYNAMIC SPECIFICATIONS
Effective Diameter for Inertia 7.5 m Drag Coefficient (CD) 0.6
For Tower shaft Inertia Coefficient (CM) 2.0
Effective Diameter for Buoyancy (DB) 7.5 m Mass Density of Sea Water 1024 Kg / cu-m
Table –II – Comparative study of responses for SHAT subjected to variety of regular waves and Northridge earthquake
Sl.
No.
Load Case Net
Stabilizi
ng
Moment
(Nm)
Abs.
Maxm
Heel
Angle
Rotatio
n(Deg.)
Abs.
Maxm
Deck
Disp.
(m)
Abs.
Maxm
SF
(N)
Abs.
Maxm
AF
(N)
Abs.
Maxm
BM
(N)
Dynamic
Stabilizati
on Period
after Wave
/ EQ (sec)
Remark
1 Regular Wave Alone(H-
2.15m, T-4.69 s)
5.49E+1
0 0.44
3.08 4.24E+0
6
2.26E+0
8
8.73E+1
0
610 S,S&US
2 Regular Wave Alone(H-
11.15m, T-10.69 s)
5.48E+1
0 1.32
9.25 5.50E+0
6
2.26E+0
8
1.15E+1
1
350 S,S&US
3 Regular Wave Alone(H-
17.15m, T-13.26 s)
5.47E+1
0 1.71
12.02 6.16E+0
6
2.26E+0
8
1.28E+1
1
250 S,S&US
4 Regular Wave Alone(H-
17.15m, T-13.26 s, C-1 m/s)
5.48E+1
0 1.67
11.69 6.15E+0
6
2.26E+0
8
1.31E+1
1
230 S,S&US
5 Regular Wave (H-2.15m, T-
4.69 s)with Northridge EQ at
0.0 sec
5.42E+1
0
4.19 29.34 1.03E+0
7
2.42E+0
8
2.15E+1
1
610 US,S&
US
6 Regular Wave (H-2.15m, T-
4.69 s)with Northridge EQ at
653.1 sec(After stabilization
and at crest of wave)
5.40E+1
0
4.43 31.03 1.04E+0
7
2.42E+0
8
2.15E+1
1
610 US,S&
US
7 Regular Wave with(H-
17.15m, T-13.26 s) with
Northridge EQ at 308.7 sec at
wave crest
5.40E+1
0
5.00 35.03 1.14E+0
7
2.39E+0
8
1.88E+1
1
300 US,S&
US

ISSN: 2277-3754
ISO 9001:2008 Certified International Journal of Engineering and Innovative Technology (IJEIT)
Volume 4, Issue 2, August 2014
144
8 Regular Wave with(H-
17.15m, T-13.26 s, C-1m/s
with Northridge EQ at 308.7
sec.)
5.41E+1
0
4.92 34.51 1.09E+0
7
2.39E+0
8
1.80E+1
1
280 US,S&
US
9 Strong large size Regular
wave alone (H-30m T-15 s)
5.35E+1
0
2.52 17.66 1.28E+0
7
2.30E+0
8
2.77E+1
1
200 US,S&
US
10 Only Northridge EQ in calm
sea at 0 sec
4.64E+1
0
8.14 56.96 8.48E+0
7
2.77E+0
8
1.75E+1
2
1000 US,S&
US
S,S&US - Serviceable, Safe & Unstable during Initial
Wave / EQ
US,S&US - Unserviceable, Safe & Unstable during Initial wave /
EQ
Table-III – Comparative study of responses for SHAT subjected to Regular Wave & Variety of Earthquakes
Sl.
No.
Load Case Net
Stabilizi
ng
Moment
(Nm)
Abs.
Maxm
Heel
Angle
Rotatio
n
(Deg.)
Abs.
Maxm
Deck
Disp.
(m)
Abs.
Maxm
SF
(N)
Abs.
Maxm
AF(N)
Abs.
Maxm
BM(N)
Dynamic
Stabilizati
on Period
after Wave
/ EQ(sec.)
Remark
1 Regular Wave Alone 5.65E+1
0
0.64 4.47 2.60E+0
6
3.55E+0
7
5.42E+1
0
610 S&S
2 Regular Wave with
Northridge NWH360
EQ(loading at Crest at 616
sec.)
5.62E+1
0
2.14 15.04 3.04E+0
6
2.34E+0
8
6.25E+1
0
640 S&US-
EQ
3 Regular Wave with
Northridge NWH360 EQ
loading at Trough at 611.1
sec.)
5.62E+1
0
2.41 16.94 3.02E+0
6
2.35E+0
8
6.46E+1
0
640 S&US-
EQ
4 Regular Wave with Imperial
Valley, CA H-E11140 EQ
(loading at Trough at 611.1
sec.)
5.62E+1
0
2.41 16.88 2.96E+0
6
2.28E+0
8
6.28E+1
0
640 S&US-
EQ
5 Regular Wave with Imperial
Valley, CA H-E13140 EQ
(loading at Trough at 611.1
sec.)
5.63E+1
0
2.41 16.88 2.96E+0
6
2.22E+0
8
6.28E+1
0
640 S&US-
EQ
6 Regular Wave with Duzce,
Turkey 1062-N EQ (loading
at Trough at 611.1 sec.)
5.63E+1
0
2.41 16.91 3.16E+0
6
2.22E+0
8
7.02E+1
0
640 S&US-
EQ
S&S - Stable and Serviceable S&US-EQ - Stable and Unserviceable during EQ
Table-IV – Effect of change in Buoyancy Chamber Height on Stability
Buoyant
Chamber
Height(m)
Total Destabilizing
Moment(Nm)
Net Stabilizing
Moment(Nm)
Maxm Angular
Disp.(Deg.)
Maxm Deck
Displacement(m)
Remarks
70 3.13E+10 4.58E+10 3.19 22.38 S&U
90 3.16E+10 5.68E+10 2.90 20.36 S&U
130 3.21E+10 9.02E+10 2.26 15.83 S&U
170 3.26E+10 1.12E+11 2.08 14.59 S&S
Note:-Efforts have been made to bring the Heel Angle disp near to 2 deg. by varying Height of Buoyancy Chamber so that SHAT is
within serviceable limits
S&S - Stable and Serviceable S&U - Stable and Unserviceable
Table-V – Effect of change in Buoyancy Chamber Diameter on Stability
Buoyant
Chamber
Diameter (m)
Total Desabilizing
Moment(Nm)
Net Stabilizing
Moment(Nm)
Maxm Angular
Disp.(Deg.)
Maxm Deck
Displacement(m)
Remarks
20 3.13E+10 4.58E+10 3.19 22.38 S&U
22 3.12E+10 5.83E+10 2.55 17.89 S&U
24 3.12E+10 7.19E+10 2.07 14.54 S&S

ISSN: 2277-3754
ISO 9001:2008 Certified International Journal of Engineering and Innovative Technology (IJEIT)
Volume 4, Issue 2, August 2014
145
25 3.11E+10 7.93E+10 1.87 13.09 S&S
Note:-Efforts have been made to bring the Heel Angle disp near to 2 deg. by varying Dia of Buoyancy Chamber so that SHAT is within
serviceable limits during EQ as well. Effect of change is Diameter size is much faster as buoyancy is proportional to square of Diameter.
S&S - Stable and Serviceable S&U - Stable and Unserviceable
To illustrate the dynamic stability phenomenon during
various phases of loading, one of the load case wherein
SHAT has been subjected to regular wave load of H-
2.15m and T-4.69s and Northridge earthquake at starting
time of 653.1 seconds is demonstrated. Wave load was
initially applied at 0 second. After initial wave load,
hydrodynamic dampening took 610 seconds to bring the
motion to dynamically stable state. Thereafter, Northridge
Earthquake was applied at 653.1 second i.e. at the crest of
wave. Time history plot for Hinge angle rotation, is given
at Fig.6, which provides information about magnitude of
hinge angle responses generated due to Wave and
Earthquake loads. The phase plots as shown from Fig.7 to
Fig.11 have been generated for the complete period of
2000 seconds, from 653.1 to 693.08 seconds, from 693.08
to 1000 seconds, from 1000 to 1300 seconds and from
1300 to 2000 seconds. From phase plots, it was observed
that motion from 653.1 to 693.08 seconds was under
earthquake impact and showed bifurcations and chaos.
During Earthquake, absolute Maximum heel angle was
4.43 degrees, which was outside the permitted serviceable
limits of the Tower. The earthquake of 39.98 seconds
duration was applied at 653.1seconds, after the
earthquake impact i.e. at 693.08 seconds the
hydrodynamic dampening started affecting the motion.
However, from 693.08 to 1000 seconds period, the
motion has been non-harmonic, a periodic and
asymmetric. It took another 300 seconds for trajectories
to further settle down under the impact of hydrodynamic
dampening forces and to start moving towards stable limit
cycle. By 1300 seconds, i.e. after 650 seconds of removal
of Earthquake impact, the responses became harmonic,
symmetric and periodic and perfectly stable. From above
discussion it is clear that with the onset of Northridge
earthquake at 653.1 seconds, the tower becomes
unserviceable as well as dynamically unstable for a
period of approximately another 350 seconds. Then it
showed the stable behaviour. During the entire motion,
the tower has been safe due to net positive stabilizing
moments acting on the tower.
(Fig.6-Time history plot showing SHAT motion during
entire duration of wave loading and EQ at 653.1 second)
(Fig.7- Two dimensional Phase Plot for complete duration)
(Fig.8- Phase Plot during Northridge EQ loading phase of
39.98 seconds showing bifurcations in dynamically unstable
motion)
(Fig.9- Phase plot after EQ loading-still showing
dynamically unstable motion with still existing bifurcations)
(Fig.10-Phase plot after EQ loading- showing trajectories
moving towards stable limit cycle)
ISSN: 2277-3754
ISO 9001:2008 Certified International Journal of Engineering and Innovative Technology (IJEIT)
Volume 4, Issue 2, August 2014
146
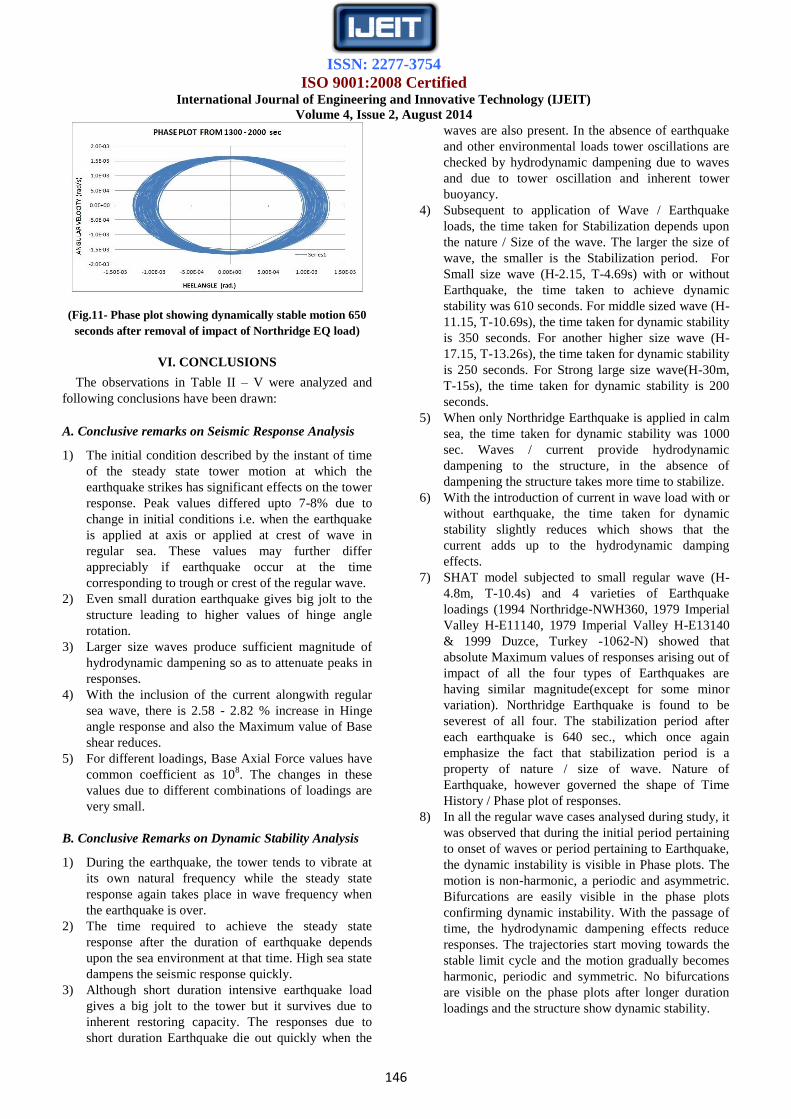
(Fig.11- Phase plot showing dynamically stable motion 650
seconds after removal of impact of Northridge EQ load)
VI. CONCLUSIONS
The observations in Table II – V were analyzed and
following conclusions have been drawn:
A. Conclusive remarks on Seismic Response Analysis
1) The initial condition described by the instant of time
of the steady state tower motion at which the
earthquake strikes has significant effects on the tower
response. Peak values differed upto 7-8% due to
change in initial conditions i.e. when the earthquake
is applied at axis or applied at crest of wave in
regular sea. These values may further differ
appreciably if earthquake occur at the time
corresponding to trough or crest of the regular wave.
2) Even small duration earthquake gives big jolt to the
structure leading to higher values of hinge angle
rotation.
3) Larger size waves produce sufficient magnitude of
hydrodynamic dampening so as to attenuate peaks in
responses.
4) With the inclusion of the current alongwith regular
sea wave, there is 2.58 - 2.82 % increase in Hinge
angle response and also the Maximum value of Base
shear reduces.
5) For different loadings, Base Axial Force values have
common coefficient as 108. The changes in these
values due to different combinations of loadings are
very small.
B. Conclusive Remarks on Dynamic Stability Analysis
1) During the earthquake, the tower tends to vibrate at
its own natural frequency while the steady state
response again takes place in wave frequency when
the earthquake is over.
2) The time required to achieve the steady state
response after the duration of earthquake depends
upon the sea environment at that time. High sea state
dampens the seismic response quickly.
3) Although short duration intensive earthquake load
gives a big jolt to the tower but it survives due to
inherent restoring capacity. The responses due to
short duration Earthquake die out quickly when the
waves are also present. In the absence of earthquake
and other environmental loads tower oscillations are
checked by hydrodynamic dampening due to waves
and due to tower oscillation and inherent tower
buoyancy.
4) Subsequent to application of Wave / Earthquake
loads, the time taken for Stabilization depends upon
the nature / Size of the wave. The larger the size of
wave, the smaller is the Stabilization period. For
Small size wave (H-2.15, T-4.69s) with or without
Earthquake, the time taken to achieve dynamic
stability was 610 seconds. For middle sized wave (H-
11.15, T-10.69s), the time taken for dynamic stability
is 350 seconds. For another higher size wave (H-
17.15, T-13.26s), the time taken for dynamic stability
is 250 seconds. For Strong large size wave(H-30m,
T-15s), the time taken for dynamic stability is 200
seconds.
5) When only Northridge Earthquake is applied in calm
sea, the time taken for dynamic stability was 1000
sec. Waves / current provide hydrodynamic
dampening to the structure, in the absence of
dampening the structure takes more time to stabilize.
6) With the introduction of current in wave load with or
without earthquake, the time taken for dynamic
stability slightly reduces which shows that the
current adds up to the hydrodynamic damping
effects.
7) SHAT model subjected to small regular wave (H-
4.8m, T-10.4s) and 4 varieties of Earthquake
loadings (1994 Northridge-NWH360, 1979 Imperial
Valley H-E11140, 1979 Imperial Valley H-E13140
& 1999 Duzce, Turkey -1062-N) showed that
absolute Maximum values of responses arising out of
impact of all the four types of Earthquakes are
having similar magnitude(except for some minor
variation). Northridge Earthquake is found to be
severest of all four. The stabilization period after
each earthquake is 640 sec., which once again
emphasize the fact that stabilization period is a
property of nature / size of wave. Nature of
Earthquake, however governed the shape of Time
History / Phase plot of responses.
8) In all the regular wave cases analysed during study, it
was observed that during the initial period pertaining
to onset of waves or period pertaining to Earthquake,
the dynamic instability is visible in Phase plots. The
motion is non-harmonic, a periodic and asymmetric.
Bifurcations are easily visible in the phase plots
confirming dynamic instability. With the passage of
time, the hydrodynamic dampening effects reduce
responses. The trajectories start moving towards the
stable limit cycle and the motion gradually becomes
harmonic, periodic and symmetric. No bifurcations
are visible on the phase plots after longer duration
loadings and the structure show dynamic stability.

ISSN: 2277-3754
ISO 9001:2008 Certified International Journal of Engineering and Innovative Technology (IJEIT)
Volume 4, Issue 2, August 2014
147
REFERENCES
[1] Jain, A.K., and Datta, T.K.,”Non-linear behavior of
articulated tower in random sea.” J. Eng. Ind. 1991,
pp.238-240.
[2] Lina, H., Youngang, T. and Cong, YI. “Seismic response
analysis of articulated tower platform in the still water”.
China Offshore Platform, period 03, 2006.
[3] Islam, N. and Ahmad, S., “Earthquake Response of
Articulated offshore tower.” European Earthquake
Engineering, 1, 2006, 48-58.
[4] Chandrasekaran and Gaurav, S., “Offshore Triangular TLP
earthquake motion analysis under distinctly high sea
waves”. International Journal of Ships and Offshore
Structures (Taylor & Francis), Vol. 3, No. 3, 2008, 173-
184.
[5] Islam, N., Zaheer, M.M. and Ahmad, S.”Double Hinged
Articulated tower interaction with wind and waves.”
Journal of Wind Eng. Ind. Aerodyn.2009, 97(5-6), 287-
297.
[6] Hasan, S. D., Islam, N. and Moin, K., “Multi-hinged
Articulated Offshore Tower under Vertical Ground
Excitation”. ASCE Journal of Structural Engineering, Vol.
137, No. 4, 2011, pp. 469-480, DOI:
10.1061/(ASCE)ST.1943-541X.0000284.
[7] Banik, A.K.and Datta T.K., “Stochastic response and
Stability of Single leg Articulated Tower”, Proceeding of
International Conference on Offshore Mechanics and
Arctic Engineering (OMAE), June 8-13, 2003Cancun,
Mexico, pp. 431-438.
[8] Banik, A.K. and Datta, T.K., “Stability Analysis of an
Articulated Loading Platform in Regular Sea” Journal of
Computational Nonlinear Dynamics, ASME, Vol.
3/011013-1, 2009, Issue doi:10.1115/1.2815332.
[9] Banik, A.K., “Dynamic Stability Analysis of Compliant
Offshore Structures”, IIT, Delhi, 2004.
[10] Friedmann, P., Hammond, C.E., and Woo, Tze-hsin,
“Efficient Numerical Treatment of Periodic Systems with
Application to Stability Problems.” International Journal
for Numerical Methods in Engineering, Vol.11, 1977,
pp.1117-1136.
[11] Chua, L.O. and Ushida, A., “Algorithms for Comuting
Almost Periodic Steady-State Response of Nonlinear
Systems to Multiple Input Frequencies” IEEE Transactions
on Circuits and Systems, Vol.CAS-28, 1981, pp.953-971.
[12] Burton, T.D., “Nonlinear Oscillator Limit Cycle Analysis
using a Finite Transformation Approach.” International
Journal of Nonlinear Mechanics, Vol. 17, 1982, pp.7-19.
[13] Cai, G.Q., “Random Vibration of Nonlinear Systems under
Non-White Excitations.” Journal of Engineering
Mechanics, ASCE, Vol.121 (5), 1995, pp.633-639.
[14] Lin, Y.K. and Cai, G.Q., Probabilistic Structural
Dynamics” Advanced Theory and Mechanics, McGraw-
Hill, New York, 1995.
[15] Hamdan, M.N. and Burton, T.D., “On the Steady State
Response and Stability of Non-Linear Oscillators using
Harmonic balance.” Journal of Sound and Vibration,
Vol.166 (2), 1993, pp.255-266.
[16] Rabindra, B., and Mallik, A.K., “Stability Analysis of Non-
linearly Damped Duffing Oscillator,” Journal of Sound and
Vibration, Vol.171 (5), 1994, pp.708-716.
[17] Blair, K.B., Krousgrill, C.M., and Farris, T.N., “Harmonic
Balance and Continuation Techniques in the Dynamic
Analysis of the Duffing‟s Equation.” Journal of Sound and
Vibration, Vol.202 (5), 1997, pp.717-731.
[18] Yu, P., and Bi. Q., “Analysis of Nonlinear Dynamics and
Bifurcations of a Double Pendulum.” Journal of Sound
and Vibration, Vol. 217(4), 1998, pp.691-736.
[19] Mallik, A.K. and Bhattacharjee, J.K., “Stability Problems
in Applied Mechanics”. Narosa Publishing House, 2005
Chapter2-3.
[20] Islam Saiful, A.B.M, “Nonlinear Dynamic Behavior of
Fully Coupled SPAR Platform”, PhD. Thesis, Deptt. Of
Civil Engg., University of Malaya, Kuala Lumpur,2013.
[21] Chakrabarti S.K., “Stability Analysis of Interaction of an
articulated tower with waves”, Proceedings of Fluid
interaction, Heikidiki, Greece. Vol.1, 2001, pp.281-292.
[22] Chakrabarti, S. And Cotter, D., “Motion Analysis of
Articulated Tower”, Journal of Waterway, Port, Coastal
and Ocean Division, ASCE, Vol.105, 1979, pp.281-292.
[23] Jameel, M., & Ahmad, S., “Fatigue Reliability Assessment
of Coupled Spar-Mooring System”. Paper presented at the
ASME 30th International Conference on Ocean, Offshore
and Arctic Engineering (OMAE 2011-49687), Rotterdam,
Netherlands, 2011.
[24] Seto, William W.”Schaum‟s outline series, Theory and
problems of Mechanical Vibrations” McGraw Hill,
International Edition., 1989.

![LOADS AND DYNAMICS IN LATTICE TOWER SUPPORT … · 2014. 11. 17. · Lattice tower − 120m, 4 legs, 10 sections Leg distance y [m] Wind Power R&D seminar – Deep sea offshore wind](https://img.pdfslide.net/doc/110x75/60b1ab8a714e9d60a637f769/loads-and-dynamics-in-lattice-tower-support-2014-11-17-lattice-tower-a-120m.jpg)


![A coupled floating offshore wind DeepWind 2016 turbine ... · • DTU 10MW reference wind turbine[1] – Designed for offshore application – Only tower is designed, no floating](https://img.pdfslide.net/doc/110x75/5f81b71936937067e57f6929/a-coupled-floating-offshore-wind-deepwind-2016-turbine-a-dtu-10mw-reference.jpg)