Embed Size (px)
Citation preview
Vol.:(0123456789)
Journal of Civil Structural Health Monitoring (2021) 11:833–849 https://doi.org/10.1007/s13349-021-00483-y
123
ORIGINAL PAPER
Dynamic structural health monitoring of a model wind turbine tower using distributed acoustic sensing (DAS)
Peter G. Hubbard1 · James Xu1 · Shenghan Zhang1 · Matthew Dejong1 · Linqing Luo1 · Kenichi Soga1 · Carlo Papa2 · Christian Zulberti2 · Demetrio Malara3 · Fabio Fugazzotto3 · Francisco Garcia Lopez3 · Chris Minto4
Received: 15 October 2020 / Revised: 3 April 2021 / Accepted: 13 April 2021 / Published online: 5 May 2021 © The Author(s) 2021
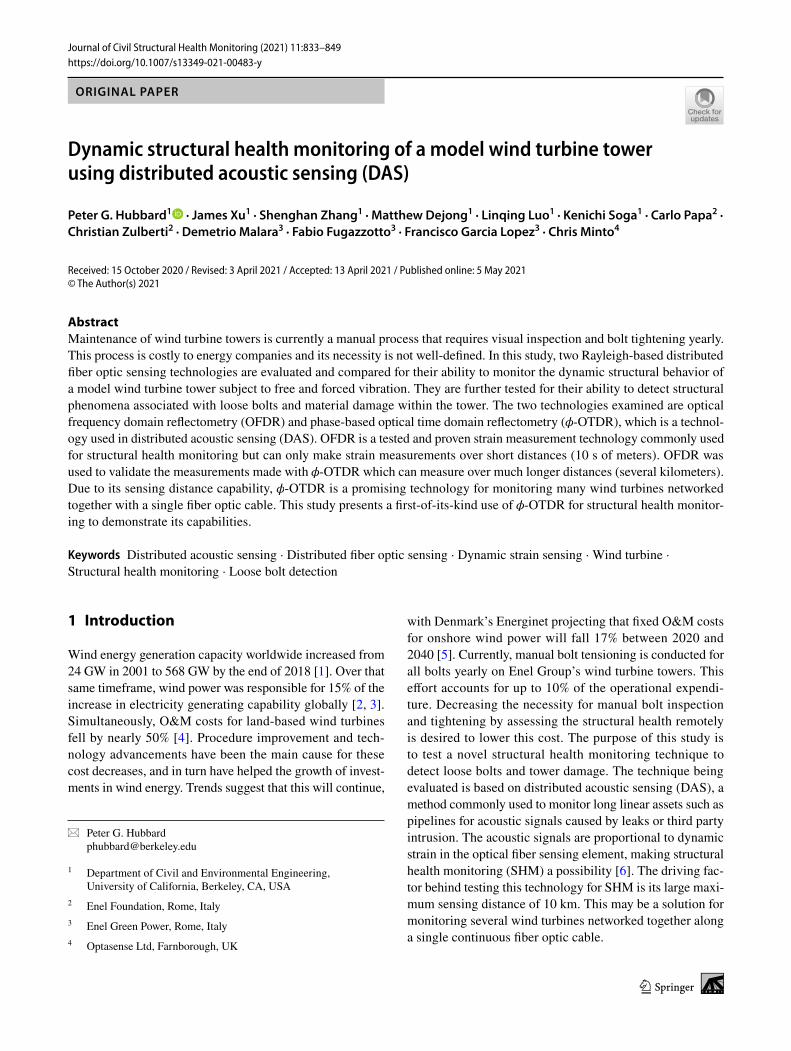
AbstractMaintenance of wind turbine towers is currently a manual process that requires visual inspection and bolt tightening yearly. This process is costly to energy companies and its necessity is not well-defined. In this study, two Rayleigh-based distributed fiber optic sensing technologies are evaluated and compared for their ability to monitor the dynamic structural behavior of a model wind turbine tower subject to free and forced vibration. They are further tested for their ability to detect structural phenomena associated with loose bolts and material damage within the tower. The two technologies examined are optical frequency domain reflectometry (OFDR) and phase-based optical time domain reflectometry ( �-OTDR), which is a technol-ogy used in distributed acoustic sensing (DAS). OFDR is a tested and proven strain measurement technology commonly used for structural health monitoring but can only make strain measurements over short distances (10 s of meters). OFDR was used to validate the measurements made with �-OTDR which can measure over much longer distances (several kilometers). Due to its sensing distance capability, �-OTDR is a promising technology for monitoring many wind turbines networked together with a single fiber optic cable. This study presents a first-of-its-kind use of �-OTDR for structural health monitor-ing to demonstrate its capabilities.
Keywords Distributed acoustic sensing · Distributed fiber optic sensing · Dynamic strain sensing · Wind turbine · Structural health monitoring · Loose bolt detection
1 Introduction
Wind energy generation capacity worldwide increased from 24 GW in 2001 to 568 GW by the end of 2018 [1]. Over that same timeframe, wind power was responsible for 15% of the increase in electricity generating capability globally [2, 3]. Simultaneously, O&M costs for land-based wind turbines fell by nearly 50% [4]. Procedure improvement and tech-nology advancements have been the main cause for these cost decreases, and in turn have helped the growth of invest-ments in wind energy. Trends suggest that this will continue,
with Denmark’s Energinet projecting that fixed O&M costs for onshore wind power will fall 17% between 2020 and 2040 [5]. Currently, manual bolt tensioning is conducted for all bolts yearly on Enel Group’s wind turbine towers. This effort accounts for up to 10% of the operational expendi-ture. Decreasing the necessity for manual bolt inspection and tightening by assessing the structural health remotely is desired to lower this cost. The purpose of this study is to test a novel structural health monitoring technique to detect loose bolts and tower damage. The technique being evaluated is based on distributed acoustic sensing (DAS), a method commonly used to monitor long linear assets such as pipelines for acoustic signals caused by leaks or third party intrusion. The acoustic signals are proportional to dynamic strain in the optical fiber sensing element, making structural health monitoring (SHM) a possibility [6]. The driving fac-tor behind testing this technology for SHM is its large maxi-mum sensing distance of 10 km. This may be a solution for monitoring several wind turbines networked together along a single continuous fiber optic cable.
* Peter G. Hubbard [email protected]
1 Department of Civil and Environmental Engineering, University of California, Berkeley, CA, USA
2 Enel Foundation, Rome, Italy3 Enel Green Power, Rome, Italy4 Optasense Ltd, Farnborough, UK
834 Journal of Civil Structural Health Monitoring (2021) 11:833–849
123
1.1 Structural health monitoring of wind turbine towers
Structural health monitoring for wind turbine tower struc-tures has heavily focused on modal analysis, usually from accelerometer data and using widely varying data analytic methods [7–10]. These methods quantify the dynamic struc-tural properties of the towers based on their observed vibra-tional characteristics. Many studies have been conducted on detecting damage based upon changes in these dynamic properties, which have been met with generally good results [9–12]. Vibration-based techniques evaluate the global structural behavior and can identify changes that indicate damage. They cannot localize where the damage occurs or make observations about the cause, be it bolt loosening or something else. In fact, studies have been done to evaluate modal analysis for its ability to detect loose bolts specifi-cally [13, 14]. These studies found that the first-mode fun-damental frequency of large turbine towers can be minimally affected by bolt loosening, making detection difficult. When detection succeeds, localization is still difficult. Practically, there is little value in detecting loose bolts in a turbine tower structure if localization is not possible. This is because the entire tower where a loose bolt is detected would need to be manually inspected. If, however, both detection and localiza-tion are possible, engineers would be able to make informed decisions about the importance of addressing bolt tightness on a tower by tower, joint by joint basis. This would provide significant value by reducing O&M costs because currently each bolt is manually tightened yearly regardless of if it is loose or not.
More recently, dynamic measurements of material strain have been made to quantify the behavior of towers and detect damage. Changes in both the strain fields and dynamic properties have been examined for their damage identification abilities. The main challenge of the methods that have been investigated is that material strain has been measured at discrete locations, again making localization of damage difficult. This has required researchers to make assumptions about the strain fields and use indirect methods for quantifying if damage has occurred between two points. These measurement technologies have included foil strain gauges and Fiber Bragg Grating (FBG) fiber optic sensing [15, 16]. FBG-based fiber optic sensing is considered quasi-continuous because it makes measurements at discrete loca-tions along an optical fiber. FBGs are periodic changes in the refractive index of an optical fiber spanning about 50 mm of the optical fiber that are created during the manufacturing process [17]. Strain is measured at the specific location of the FBG.
This study investigates a completely different method for monitoring wind turbine tower structures. Distributed
fiber optic sensing (DFOS) uses the distributed length of a sensing fiber to make measurements that describe the entire length of the sensor [18]. With proper data analytics, the behavior of the entire sensing length can be resolved without leaving spatial gaps along a sensing line. In the case of wind turbine towers, the geometry leads perfectly to this type of sensing. A tower can be measured with vertical sensing lines that are directly adhered to the extreme axis extents of the tower. The distributed strain measurements can be made dynamically with certain DFOS technologies, and is referred to here as dynamic, distributed fiber optic sensing (DDFOS) [19]. When distributed strain measurements are made at suf-ficiently high rates that the natural vibrational frequencies of the structure can be measured without time-aliasing, a comprehensive observation set of the structure can be made. These observations fully resolve the 3-D dynamic structural behavior including vibrational modes and magnitudes, while giving the added benefit of being able to localize strain con-centrations caused by damage or bolt loosening over the tower length.
1.2 DFOS applications in civil infrastructure
DFOS techniques have been widely used for civil infrastruc-ture monitoring applications including piles, retaining walls, bridges, buildings, dams, tunnels, and pipelines [20, 21]. Techniques vary based on light scattering phenomena and analysis method. Scattering phenomena include Rayleigh, Brillouin, and Raman scattering. Rayleigh and Brillouin scattering are used in distributed strain and temperature sensing (DSTS), while Raman scattering is only used for distributed temperature sensing (DTS) [21]. For most civil infrastructure monitoring applications, it is adequate to take strain measurements at sparse time intervals. Common time sampling intervals are anywhere from several hours to days or even weeks between measurements [22–24]. In specific scenarios, however, data acquisition is desired at much higher rates. An example of this is the detection of a tran-sient crack that only opens briefly during dynamic loading. The strain across the crack would need to be measured as a sufficiently high rate to both measure the strain and describe the behavior in time.
DDFOS techniques have been used to monitor trans-portation infrastructure. These deployments have included technologies based on both Brillouin and Rayleigh scatter-ing. Brillouin-based DDFOS methods have been validated in a laboratory setting to detect damage in steel bridge structures [25]. This study presented a configuration where data were acquired at 13 Hz and reported a sen-sitivity of 40 με. More recently, Brillouin-based DDFOS was deployed in the field on both a precast post-tensioned concrete box girder bridge and a three-span continuous steel girder bridge [26]. In this study, the measurements
835Journal of Civil Structural Health Monitoring (2021) 11:833–849
123
were used to compute damage indices. It was determined that the system was efficient in detecting the majority of anomalies in the bridges.
Rayleigh-based DDFOS has been used to monitor rein-forced concrete beams in a laboratory setting [27] and rail-ways in both the laboratory and field [28]. The Rayleigh-based DDFOS methods reported in the civil SHM literature make use of commercial optical frequency-domain reflec-tometry (OFDR) systems. Such systems have high accu-racy and spatial resolution, but limited sensing distance. The study conducted by Broth and Hoult, 2020 [27] on the dynamic behavior of reinforced concrete beams used a system (Luna Innovations ODiSI-B) with an accuracy, spa-tial resolution, and maximum sensing distances of ± 25 µε, 5.2 mm and 5 m, respectively [29]. This study uses a similar system to [27] as a verification tool for a new, much longer range DDFOS system. The principles of both Rayleigh-based DDFOS systems are introduced in the next section.
1.3 Rayleigh‑based DDFOS technologies
In this study, two DDFOS technologies were deployed to monitor the dynamic structural behavior of a model wind turbine tower. The technologies used are optical frequency domain reflectometry (OFDR) and phase-based optical time domain reflectometry ( �-OTDR). �-OTDR is the measure-ment technique used in high-end distributed acoustic sensing (DAS). DAS is used commercially for pipeline leak detec-tion, perimeter security, powerline fault detection, geophysi-cal monitoring, and transportation flow monitoring [30–33]. The measurements made by DAS systems are typically pre-sented as unitless waveforms proportional to acoustic signals or particle velocity. This study shows that the measurements made with �-OTDR can be interpreted as dynamic strain and are useful for SHM. This makes long distance DDFOS for SHM possible using �-OTDR.
Both DDFOS technologies used in this study rely on Ray-leigh scattered light within an optical fiber to make measure-ments. In fiber optic cables, inhomogeneities due to varia-tions in refractive index, changes in waveguide geometry and local inhomogeneities that exist naturally in the glass fiber cause Rayleigh scattering [34]. These scattering points are distributed throughout the fiber core so densely that the scattering process is continuous along the fiber length. Some of this scattering occurs in the opposite direction of the inci-dent light and is guided back to the beginning of the fiber. This is extremely useful for distributed sensing because the returning light can be analyzed, making the entire length of the fiber a sensing element capable of providing spatially continuous data.
1.3.1 OFDR
In OFDR, a laser with variable frequency is used to send a swept pulse of light into the fiber. Each point in the fiber has a unique scattering profile for both the intensity and frequency of light that it reflects. This creates a Rayleigh backscatter spectrum (RBS) for each point along the fiber. The frequency shift of the RBS is linearly related to the strain in the fiber at the scattering location. Since this change can be observed for very small lengths of fiber, extremely small spatial resolutions (< 1 mm) are possible. However, the length of a sensing fiber is governed by the tuning speed and range of the laser. Therefore, the possible sensing dis-tance is typically limited to 50 m for dynamic sensing [35]. Measurement frequency can vary from 250 Hz for a 2.5 m fiber to 20 Hz for a 50 m fiber. In this work, a Luna Innova-tions ODiSI6000 commercial OFDR system was used with a spatial resolution of 2.6 mm and a measurement frequency of 25 Hz. The total sensing cable length was 50 m.
1.3.2 �‑OTDR
�-OTDR is the comparison of phase of Rayleigh backscatter originating from separate regions of a fiber [19]. This change in phase is directly proportional to strain in the region of the fiber between the compared Rayleigh backscatter [6]. The length of this region is referred to as the gauge length. The gauge length directly determines the localization ability of the �-OTDR system. The gauge length is different than the readout interval, which is the longitudinal spacing of meas-urements. In this study, an Optasense ODH-4 interrogator was used with a gauge length of 2 m, a readout spacing of 1 m and an acquisition rate of 4 kHz. Measurement rates of up to 100 kHz are possible, but for this study and most infra-structure applications, much slower acquisition is needed. The maximum sensing range of the ODH-4 interrogator used in this study is 10 km, which is 200 times larger than that of the OFDR system.
Both technologies detect mechanical changes in a sensing fiber due to externally applied strain and thermal expansion [21]. Though theoretically present in the measured informa-tion, the thermal effects can be ignored in this case. Data are acquired over such a short period of time in a laboratory setting that temperature changes are negligible.
2 Experimental configuration and progression
A model wind turbine tower was constructed to emulate the behavior of a full-scale tower. Flanged pipe sections were chosen due to their low thickness-diameter ratio. The cross section of the flanged pipe was chosen to have an
836 Journal of Civil Structural Health Monitoring (2021) 11:833–849
123
inner diameter of 30.810 cm, a thickness of 0.365 cm (10 gage), and an outer flange diameter of 38.43 cm. The bolt pattern on the flanges consisted of 8 bolt holes equally radi-ally spaced on the flanges with a bolt centerline diameter of 35.56 cm. Six pipe sections, 1.22 m long each, were used to construct the 7.32 m tower. Each flange had slots cut 90° apart up against the pipe body to allow the fiber optic sens-ing cables to be threaded through the joints while remaining attached to the tower. The flanges were continuously welded on the inside of the pipe and tack welded on the outside of the pipe. The pipe sections were connected to each other with 0.794 cm bolts using a torque gun.
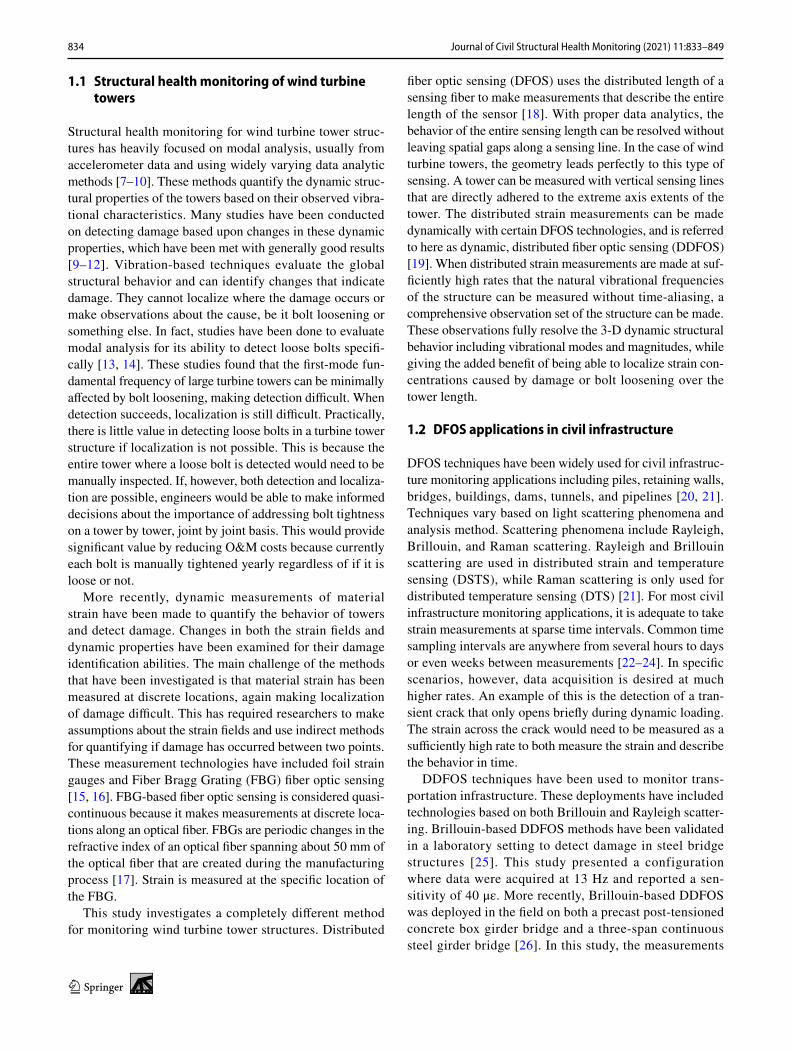
The fully constructed tower is shown in Fig. 1. The tower was welded at the top and bottom to steel plates. The top plate was used to mount a vibration generator and the bottom plate was used to bolt the tower to a strong floor. The vibra-tion generator was bolted to the top plate using 2.54 cm bolts tightened with a torque gun. To ensure proper load trans-fer, steel gusset stiffeners were attached to the base and first flange above the base. 10 steel stiffeners were attached to the base of the tower. They were placed asymmetrically, with 5 clustered at the north and south extent of the tower. Simi-larly, the first flange was asymmetrically stiffened, with 6 stiffeners clustered at each the north and south extent. These orientations stiffened the north–south axis more than the
east–west direction. The vibration generator was configured to create a 1-D sinusoidal force in the north–south direction. The stiffeners were placed for safety to prevent tower col-lapse caused by local yielding where the maximum bending moment would be experienced during forced vibration.
The vibration generator consisted of two steel baskets that spin opposite one another in the horizontal plane. This spe-cific machine was designed for testing full-scale structures under dynamic loads and its design is detailed in [36]. The rotation of the two baskets generates a 1-D sinusoidal force. The maximum output inertial force exerted by this type of vibration generator is a function of the mass and speed of rotation of the baskets. The mass of the vibration genera-tor and top plate were measured to be 245 kg and 150 kg, respectively.
This vibration generator was used because the configura-tion mimics the mass distribution of a wind turbine and true dynamic loading could be created to resonate the structure, as opposed to controlled displacement. The mass of the vibration generator and mounting plate simulates the mass of the nacelle, gearbox, generator, rotor hub and rotors of a full-scale wind turbine. When the vibration generator is off, free vibration tests were conducted by displacing the top of the tower to directly excite the first-mode natural frequency. The vibration generator was only turned on to resonate the
Fig. 1 Photographs of the experimental configuration
837Journal of Civil Structural Health Monitoring (2021) 11:833–849
123
structure and cause damage to be detected by the employed sensing system, so the forcing magnitudes produced were not meant to simulate typical wind loading.
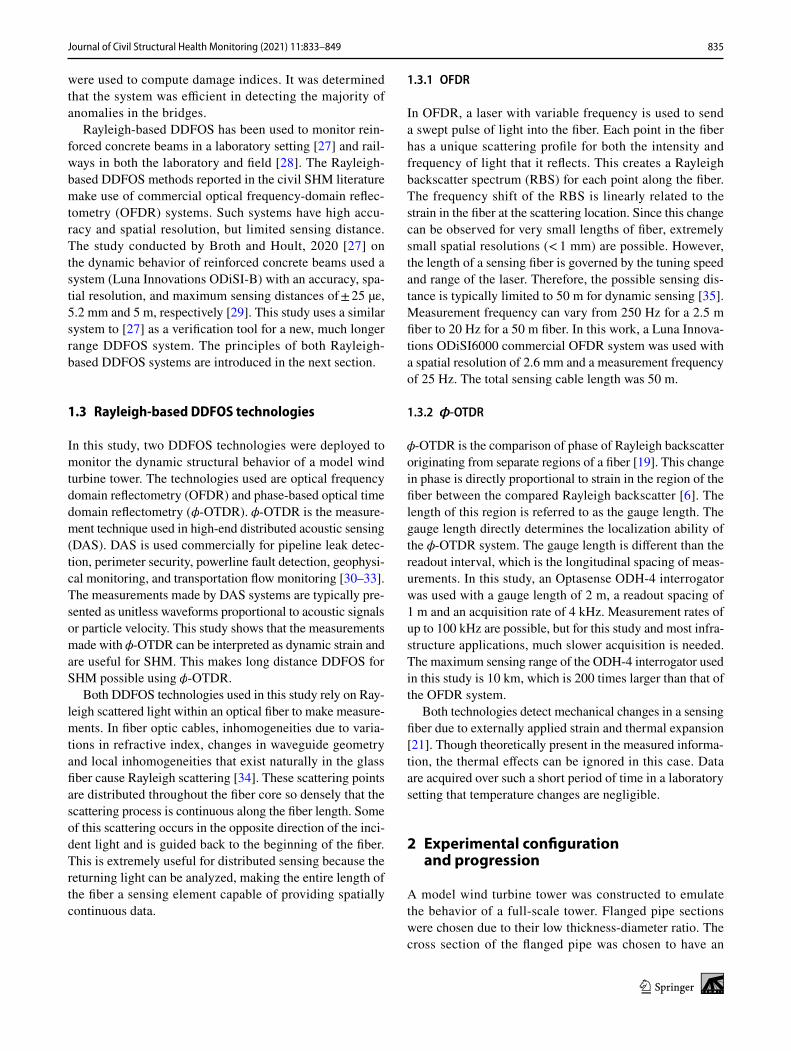
NanZee Sensing NZS-DSS-C02 single mode, tightly buff-ered fiber optic cables were used for OFDR and �-OTDR measurement. The cross section of this cable is shown in Fig. 2. The cable is made of a tightly buffered single-mode core wrapped inside six helically-wound steel braids. The steel braids are inside a rugged polyethylene (PE) sheath.
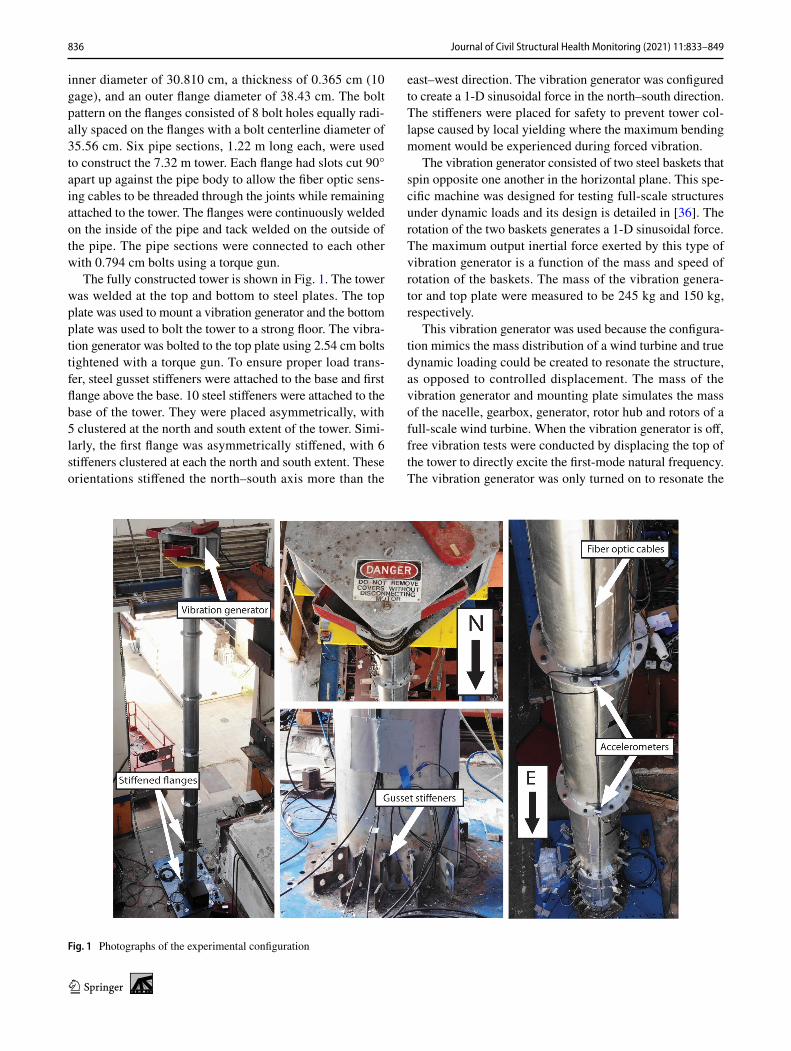
The cables were epoxied continuously to the tower on north, south, east, and west axes using 3 M DP8010 plas-tic structural adhesive. The sensing cables were threaded through slots in the flanges and were unbonded 1.25 cm above and below each flange. The slots were directly against the tower body, so the cables remained flush against the structure continuously. Epson M-A351 accelerometers were adhered to the flanges and the top plate using an industrial adhesive tape, seven in total were used. The accelerometers were placed on the top of the flange at each joint along the east axis. Figure 3 shows instrumentation plan of the tower as viewed from the east.
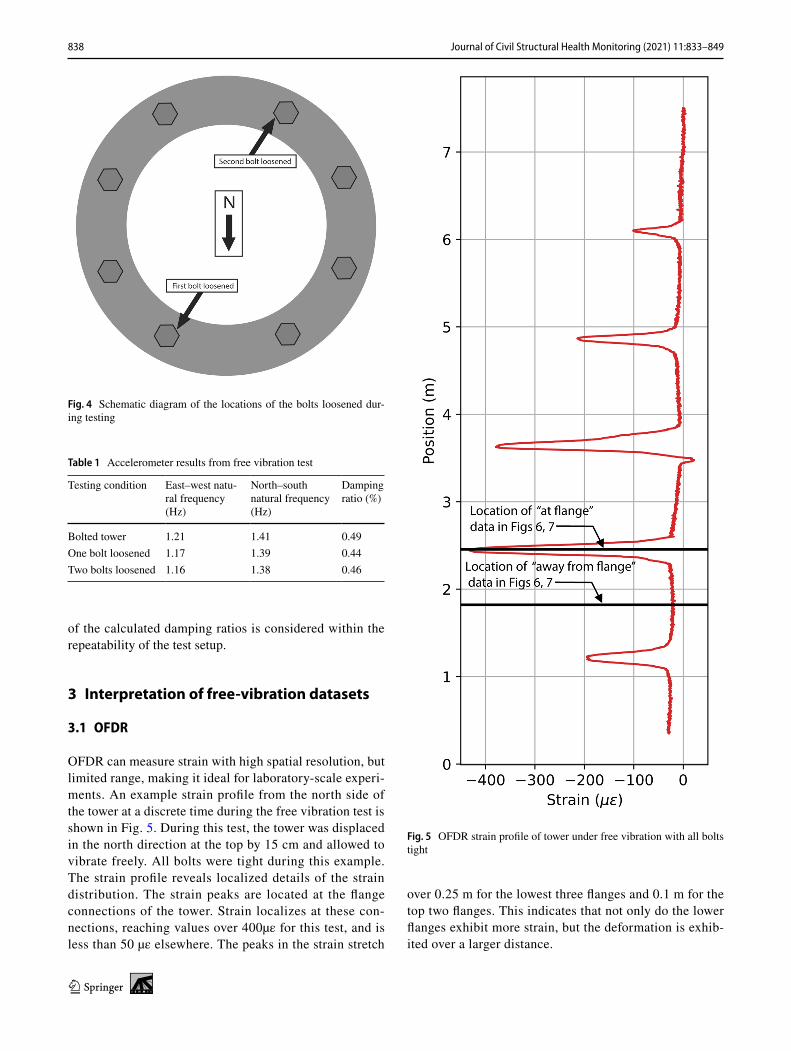
First, the tower was manually displaced at the top towards the north by 15 cm and allowed to vibrate freely. This test was completed when all bolts were tightened, when one bolt was loosened, and when two bolts were loosened. The bolts that were loosened are indicated in Fig. 4.
After the sequence of free vibration tests, the bolts were all re-tightened and the tower was vibrated using the vibra-tion generator. The generator was ramped from approxi-mately 0.3 Hz, its idle speed, to approximately 3 Hz. The first-mode natural frequencies of the north–south and east–west axes were both less than 3 Hz, so the tower briefly was excited at its resonant frequency during each ramp. The ramping took approximately 45 s each, and the generator was immediately shut off when it finished speeding up. This process was repeated three times.
To compare the DFOS results with the industry accepted modal analysis methods, the dynamic properties of the tower were first calculated using the accelerometer
data for each test. The damping ratios were calculated using the log-decrement method, which is valid for small damping ratios. Also, when the damping ratio is suffi-ciently small, the damped and undamped natural frequen-cies can be considered equal. The natural frequencies can then be determined using the accelerometer data by cal-culating the power spectrum as:
where rxx is the autocorrelation of the time series.It was observed that the tower possessed two clear first-
mode natural frequencies because of the asymmetrically stiffened base and first flange. The north–south axis pos-sessed a natural frequency slightly higher than the east–west axis. Each natural frequency and damping ratio as meas-ured with the Epson M-A351 accelerometers during the free vibration tests are shown in Table 1. The damping of tower is not significantly changed by bolt loosening. The variability
(1)PS[m] =
N∑
n=0
rxx[n]e−
j2�mn
N m = 0, 1, 2, 3...N,
Fig. 2 Cross section of NZS-DSS-C02 distributed strain sensing cable
Fig. 3 Instrumentation plan of the model tower
838 Journal of Civil Structural Health Monitoring (2021) 11:833–849
123
of the calculated damping ratios is considered within the repeatability of the test setup.
3 Interpretation of free‑vibration datasets
3.1 OFDR
OFDR can measure strain with high spatial resolution, but limited range, making it ideal for laboratory-scale experi-ments. An example strain profile from the north side of the tower at a discrete time during the free vibration test is shown in Fig. 5. During this test, the tower was displaced in the north direction at the top by 15 cm and allowed to vibrate freely. All bolts were tight during this example. The strain profile reveals localized details of the strain distribution. The strain peaks are located at the flange connections of the tower. Strain localizes at these con-nections, reaching values over 400µε for this test, and is less than 50 µε elsewhere. The peaks in the strain stretch
over 0.25 m for the lowest three flanges and 0.1 m for the top two flanges. This indicates that not only do the lower flanges exhibit more strain, but the deformation is exhib-ited over a larger distance.
Fig. 4 Schematic diagram of the locations of the bolts loosened dur-ing testing
Table 1 Accelerometer results from free vibration test
Testing condition East–west natu-ral frequency (Hz)
North–south natural frequency (Hz)
Damping ratio (%)
Bolted tower 1.21 1.41 0.49One bolt loosened 1.17 1.39 0.44Two bolts loosened 1.16 1.38 0.46
Fig. 5 OFDR strain profile of tower under free vibration with all bolts tight
839Journal of Civil Structural Health Monitoring (2021) 11:833–849
123
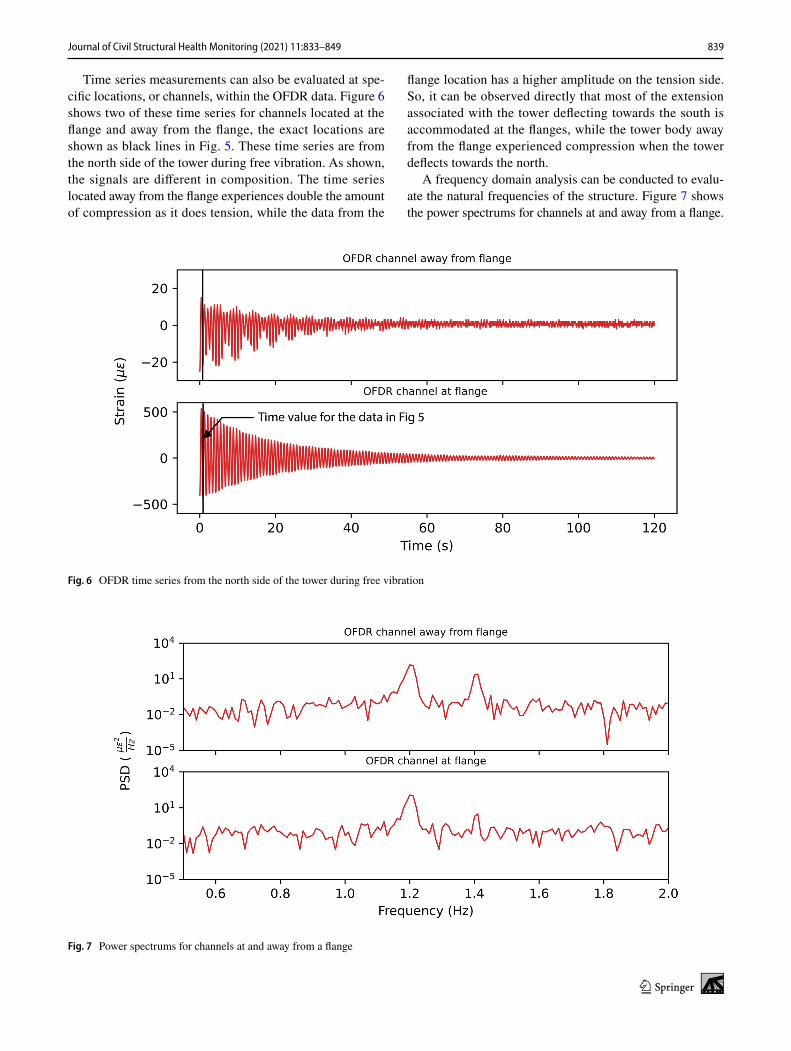
Time series measurements can also be evaluated at spe-cific locations, or channels, within the OFDR data. Figure 6 shows two of these time series for channels located at the flange and away from the flange, the exact locations are shown as black lines in Fig. 5. These time series are from the north side of the tower during free vibration. As shown, the signals are different in composition. The time series located away from the flange experiences double the amount of compression as it does tension, while the data from the
flange location has a higher amplitude on the tension side. So, it can be observed directly that most of the extension associated with the tower deflecting towards the south is accommodated at the flanges, while the tower body away from the flange experienced compression when the tower deflects towards the north.
A frequency domain analysis can be conducted to evalu-ate the natural frequencies of the structure. Figure 7 shows the power spectrums for channels at and away from a flange.
Fig. 6 OFDR time series from the north side of the tower during free vibration
Fig. 7 Power spectrums for channels at and away from a flange
840 Journal of Civil Structural Health Monitoring (2021) 11:833–849
123
Both dominant frequencies can be clearly seen in these repre-sentations which match the accelerometer data with values of 1.21 and 1.41 Hz. The signal-to-noise ratio (SNR) can also be examined for both channel locations. Away from the flange, the SNRs are 31.3 dB, and 24.3 dB for the two respective fre-quencies, and at the flange they are 52.6 dB and 27.4 dB. In each case, the strength of the signal is adequate to determine the natural frequencies of the structure.
3.2 �‑OTDR
�-OTDR measures changes in optical path length across a gauge length of a sensing cable. This measurement is in radi-ans of the light wave. The data are converted to meaningful strain measurement using the equation [6]:
where d� is the optical phase shift in radians, � is the opera-tional optical wavelength in vacuum, n is the refractive index of the sensing fiber, G is the gauge length of the �-OTDR
(2)d� =4�nG�
��,
system, � is the photo-elastic scaling factor, and � is the strain.
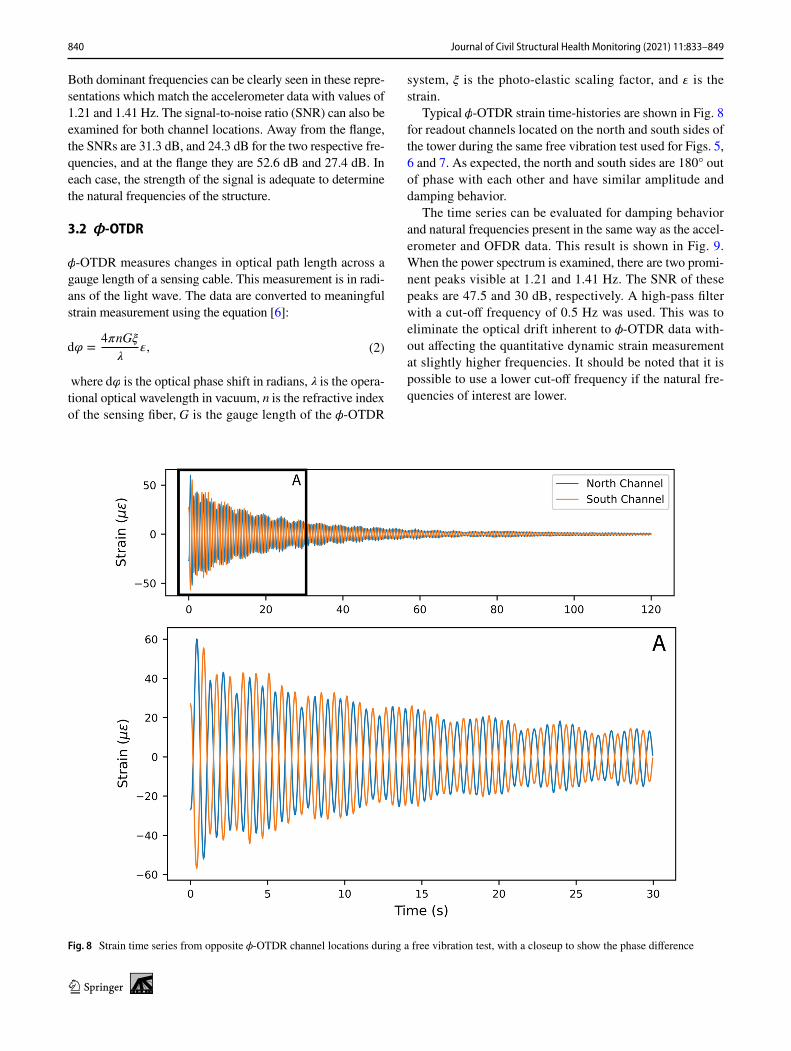
Typical �-OTDR strain time-histories are shown in Fig. 8 for readout channels located on the north and south sides of the tower during the same free vibration test used for Figs. 5, 6 and 7. As expected, the north and south sides are 180° out of phase with each other and have similar amplitude and damping behavior.
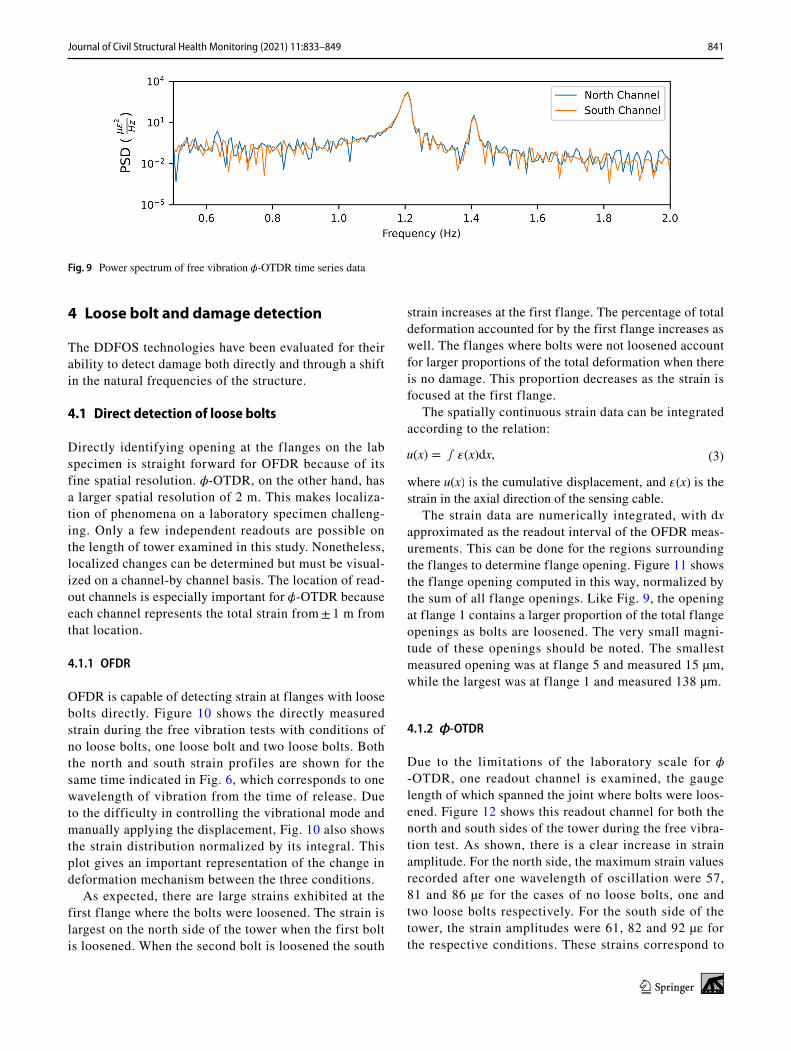
The time series can be evaluated for damping behavior and natural frequencies present in the same way as the accel-erometer and OFDR data. This result is shown in Fig. 9. When the power spectrum is examined, there are two promi-nent peaks visible at 1.21 and 1.41 Hz. The SNR of these peaks are 47.5 and 30 dB, respectively. A high-pass filter with a cut-off frequency of 0.5 Hz was used. This was to eliminate the optical drift inherent to �-OTDR data with-out affecting the quantitative dynamic strain measurement at slightly higher frequencies. It should be noted that it is possible to use a lower cut-off frequency if the natural fre-quencies of interest are lower.
Fig. 8 Strain time series from opposite �-OTDR channel locations during a free vibration test, with a closeup to show the phase difference
841Journal of Civil Structural Health Monitoring (2021) 11:833–849
123
4 Loose bolt and damage detection
The DDFOS technologies have been evaluated for their ability to detect damage both directly and through a shift in the natural frequencies of the structure.
4.1 Direct detection of loose bolts
Directly identifying opening at the flanges on the lab specimen is straight forward for OFDR because of its fine spatial resolution. �-OTDR, on the other hand, has a larger spatial resolution of 2 m. This makes localiza-tion of phenomena on a laboratory specimen challeng-ing. Only a few independent readouts are possible on the length of tower examined in this study. Nonetheless, localized changes can be determined but must be visual-ized on a channel-by channel basis. The location of read-out channels is especially important for �-OTDR because each channel represents the total strain from ± 1 m from that location.
4.1.1 OFDR
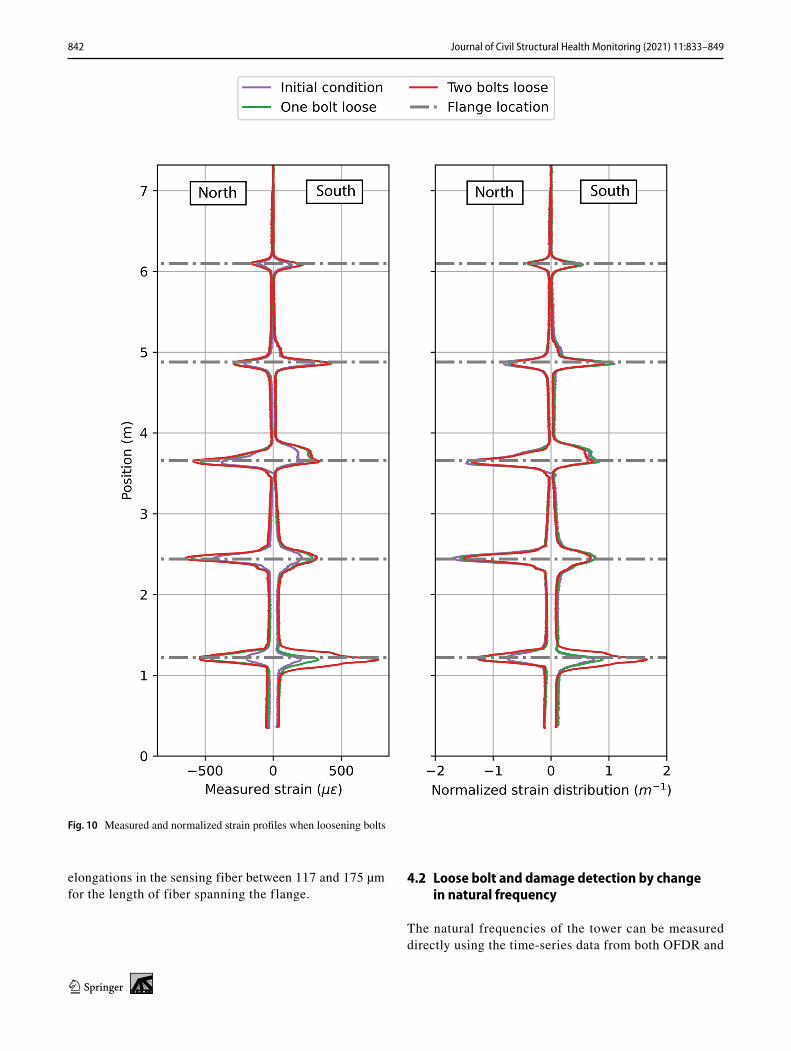
OFDR is capable of detecting strain at flanges with loose bolts directly. Figure 10 shows the directly measured strain during the free vibration tests with conditions of no loose bolts, one loose bolt and two loose bolts. Both the north and south strain profiles are shown for the same time indicated in Fig. 6, which corresponds to one wavelength of vibration from the time of release. Due to the difficulty in controlling the vibrational mode and manually applying the displacement, Fig. 10 also shows the strain distribution normalized by its integral. This plot gives an important representation of the change in deformation mechanism between the three conditions.
As expected, there are large strains exhibited at the first flange where the bolts were loosened. The strain is largest on the north side of the tower when the first bolt is loosened. When the second bolt is loosened the south
strain increases at the first flange. The percentage of total deformation accounted for by the first flange increases as well. The flanges where bolts were not loosened account for larger proportions of the total deformation when there is no damage. This proportion decreases as the strain is focused at the first flange.
The spatially continuous strain data can be integrated according to the relation:
where u(x) is the cumulative displacement, and �(x) is the strain in the axial direction of the sensing cable.
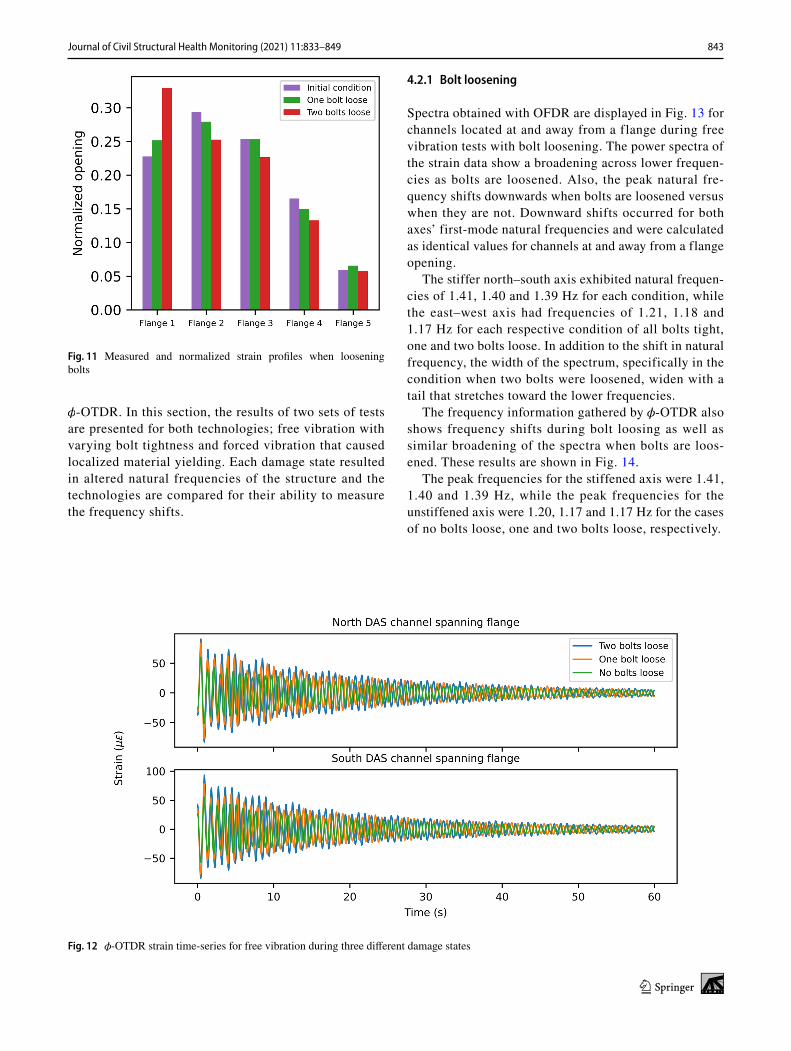
The strain data are numerically integrated, with dx approximated as the readout interval of the OFDR meas-urements. This can be done for the regions surrounding the flanges to determine flange opening. Figure 11 shows the flange opening computed in this way, normalized by the sum of all flange openings. Like Fig. 9, the opening at flange 1 contains a larger proportion of the total flange openings as bolts are loosened. The very small magni-tude of these openings should be noted. The smallest measured opening was at flange 5 and measured 15 µm, while the largest was at flange 1 and measured 138 µm.
4.1.2 �‑OTDR
Due to the limitations of the laboratory scale for �-OTDR, one readout channel is examined, the gauge length of which spanned the joint where bolts were loos-ened. Figure 12 shows this readout channel for both the north and south sides of the tower during the free vibra-tion test. As shown, there is a clear increase in strain amplitude. For the north side, the maximum strain values recorded after one wavelength of oscillation were 57, 81 and 86 µε for the cases of no loose bolts, one and two loose bolts respectively. For the south side of the tower, the strain amplitudes were 61, 82 and 92 µε for the respective conditions. These strains correspond to
(3)u(x) = ∫ �(x)dx,
Fig. 9 Power spectrum of free vibration �-OTDR time series data
842 Journal of Civil Structural Health Monitoring (2021) 11:833–849
123
elongations in the sensing fiber between 117 and 175 µm for the length of fiber spanning the flange.
4.2 Loose bolt and damage detection by change in natural frequency
The natural frequencies of the tower can be measured directly using the time-series data from both OFDR and
Fig. 10 Measured and normalized strain profiles when loosening bolts
843Journal of Civil Structural Health Monitoring (2021) 11:833–849
123
�-OTDR. In this section, the results of two sets of tests are presented for both technologies; free vibration with varying bolt tightness and forced vibration that caused localized material yielding. Each damage state resulted in altered natural frequencies of the structure and the technologies are compared for their ability to measure the frequency shifts.
4.2.1 Bolt loosening
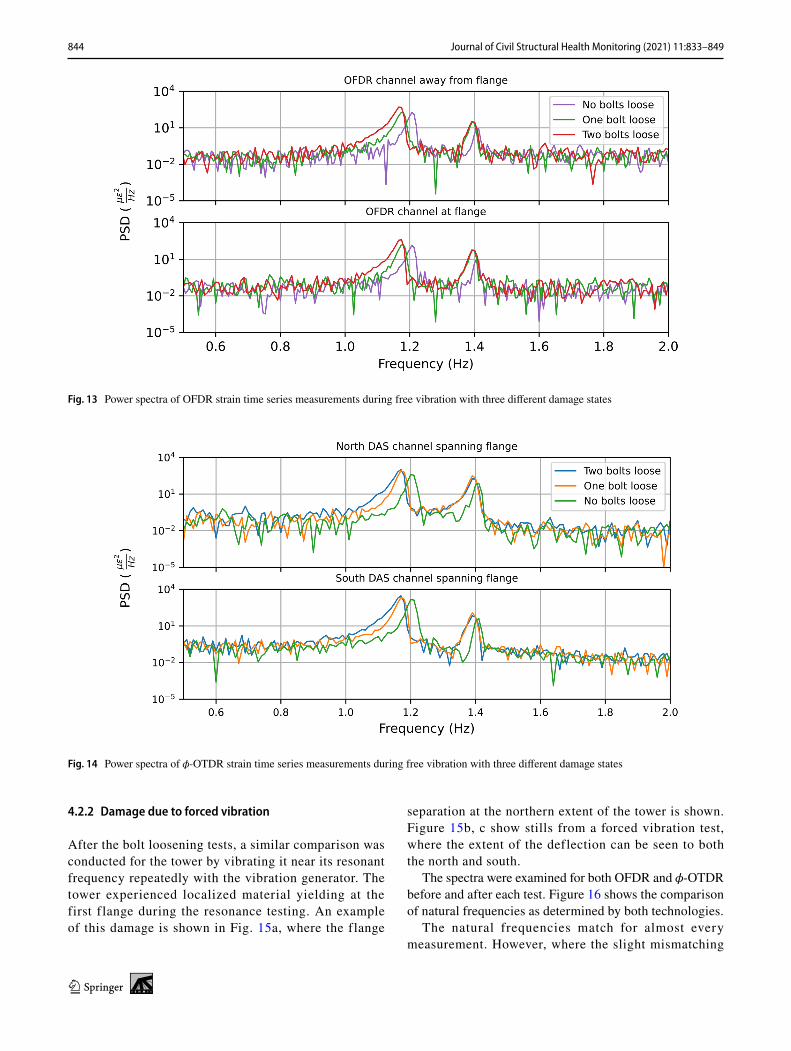
Spectra obtained with OFDR are displayed in Fig. 13 for channels located at and away from a flange during free vibration tests with bolt loosening. The power spectra of the strain data show a broadening across lower frequen-cies as bolts are loosened. Also, the peak natural fre-quency shifts downwards when bolts are loosened versus when they are not. Downward shifts occurred for both axes’ first-mode natural frequencies and were calculated as identical values for channels at and away from a flange opening.
The stiffer north–south axis exhibited natural frequen-cies of 1.41, 1.40 and 1.39 Hz for each condition, while the east–west axis had frequencies of 1.21, 1.18 and 1.17 Hz for each respective condition of all bolts tight, one and two bolts loose. In addition to the shift in natural frequency, the width of the spectrum, specifically in the condition when two bolts were loosened, widen with a tail that stretches toward the lower frequencies.
The frequency information gathered by �-OTDR also shows frequency shifts during bolt loosing as well as similar broadening of the spectra when bolts are loos-ened. These results are shown in Fig. 14.
The peak frequencies for the stiffened axis were 1.41, 1.40 and 1.39 Hz, while the peak frequencies for the unstiffened axis were 1.20, 1.17 and 1.17 Hz for the cases of no bolts loose, one and two bolts loose, respectively.
Fig. 11 Measured and normalized strain profiles when loosening bolts
Fig. 12 �-OTDR strain time-series for free vibration during three different damage states
844 Journal of Civil Structural Health Monitoring (2021) 11:833–849
123
4.2.2 Damage due to forced vibration
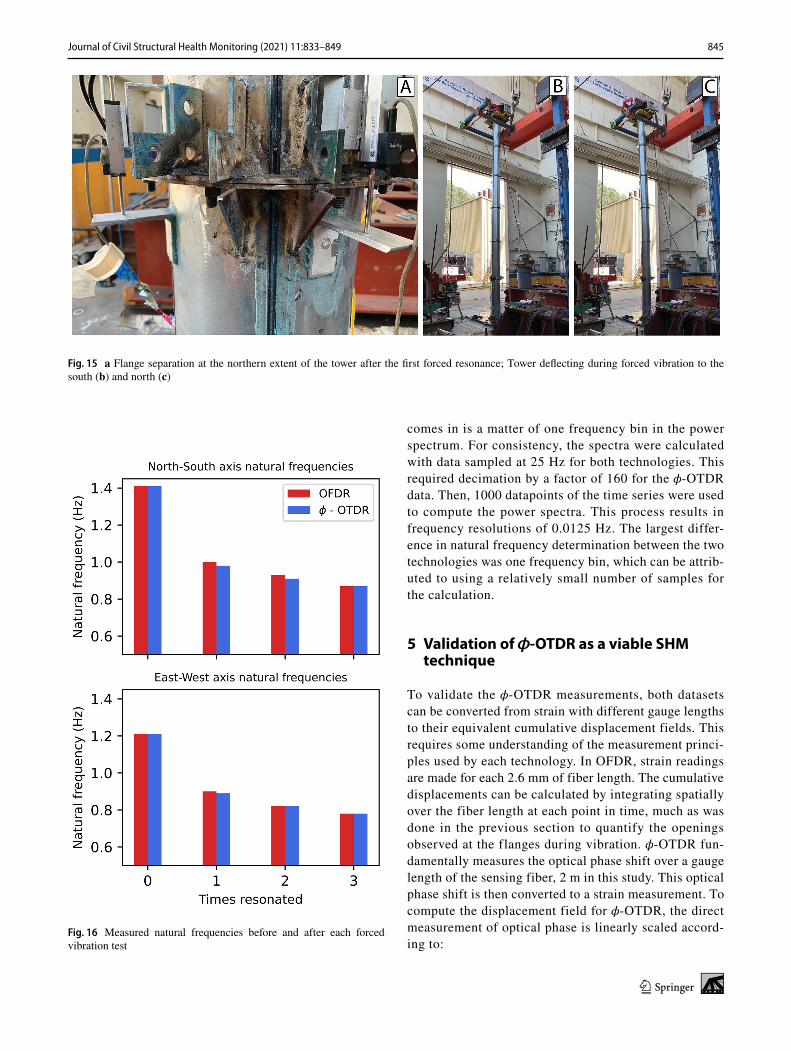
After the bolt loosening tests, a similar comparison was conducted for the tower by vibrating it near its resonant frequency repeatedly with the vibration generator. The tower experienced localized material yielding at the first flange during the resonance testing. An example of this damage is shown in Fig. 15a, where the flange
separation at the northern extent of the tower is shown. Figure 15b, c show stills from a forced vibration test, where the extent of the deflection can be seen to both the north and south.
The spectra were examined for both OFDR and �-OTDR before and after each test. Figure 16 shows the comparison of natural frequencies as determined by both technologies.
The natural frequencies match for almost every measurement. However, where the slight mismatching
Fig. 13 Power spectra of OFDR strain time series measurements during free vibration with three different damage states
Fig. 14 Power spectra of �-OTDR strain time series measurements during free vibration with three different damage states
845Journal of Civil Structural Health Monitoring (2021) 11:833–849
123
comes in is a matter of one frequency bin in the power spectrum. For consistency, the spectra were calculated with data sampled at 25 Hz for both technologies. This required decimation by a factor of 160 for the �-OTDR data. Then, 1000 datapoints of the time series were used to compute the power spectra. This process results in frequency resolutions of 0.0125 Hz. The largest differ-ence in natural frequency determination between the two technologies was one frequency bin, which can be attrib-uted to using a relatively small number of samples for the calculation.
5 Validation of �‑OTDR as a viable SHM technique
To validate the �-OTDR measurements, both datasets can be converted from strain with different gauge lengths to their equivalent cumulative displacement fields. This requires some understanding of the measurement princi-ples used by each technology. In OFDR, strain readings are made for each 2.6 mm of fiber length. The cumulative displacements can be calculated by integrating spatially over the fiber length at each point in time, much as was done in the previous section to quantify the openings observed at the flanges during vibration. �-OTDR fun-damentally measures the optical phase shift over a gauge length of the sensing fiber, 2 m in this study. This optical phase shift is then converted to a strain measurement. To compute the displacement field for �-OTDR, the direct measurement of optical phase is linearly scaled accord-ing to:
Fig. 15 a Flange separation at the northern extent of the tower after the first forced resonance; Tower deflecting during forced vibration to the south (b) and north (c)
Fig. 16 Measured natural frequencies before and after each forced vibration test
846 Journal of Civil Structural Health Monitoring (2021) 11:833–849
123
where dU is the displacement over a single gauge length, d� is the optical phase shift in radians, � is the operational optical wavelength in vacuum, n is the refrac-tive index of the sensing fiber, and � is the photo-elastic scaling factor.
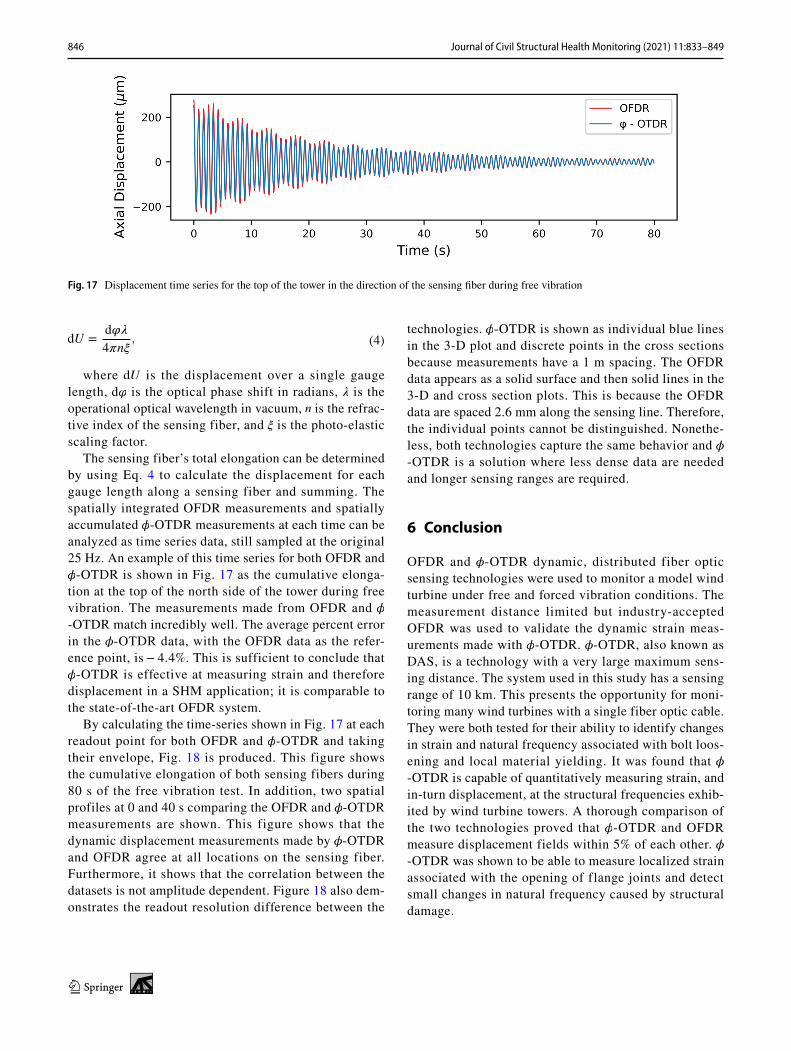
The sensing fiber’s total elongation can be determined by using Eq. 4 to calculate the displacement for each gauge length along a sensing fiber and summing. The spatially integrated OFDR measurements and spatially accumulated �-OTDR measurements at each time can be analyzed as time series data, still sampled at the original 25 Hz. An example of this time series for both OFDR and �-OTDR is shown in Fig. 17 as the cumulative elonga-tion at the top of the north side of the tower during free vibration. The measurements made from OFDR and �-OTDR match incredibly well. The average percent error in the �-OTDR data, with the OFDR data as the refer-ence point, is − 4.4%. This is sufficient to conclude that �-OTDR is effective at measuring strain and therefore displacement in a SHM application; it is comparable to the state-of-the-art OFDR system.
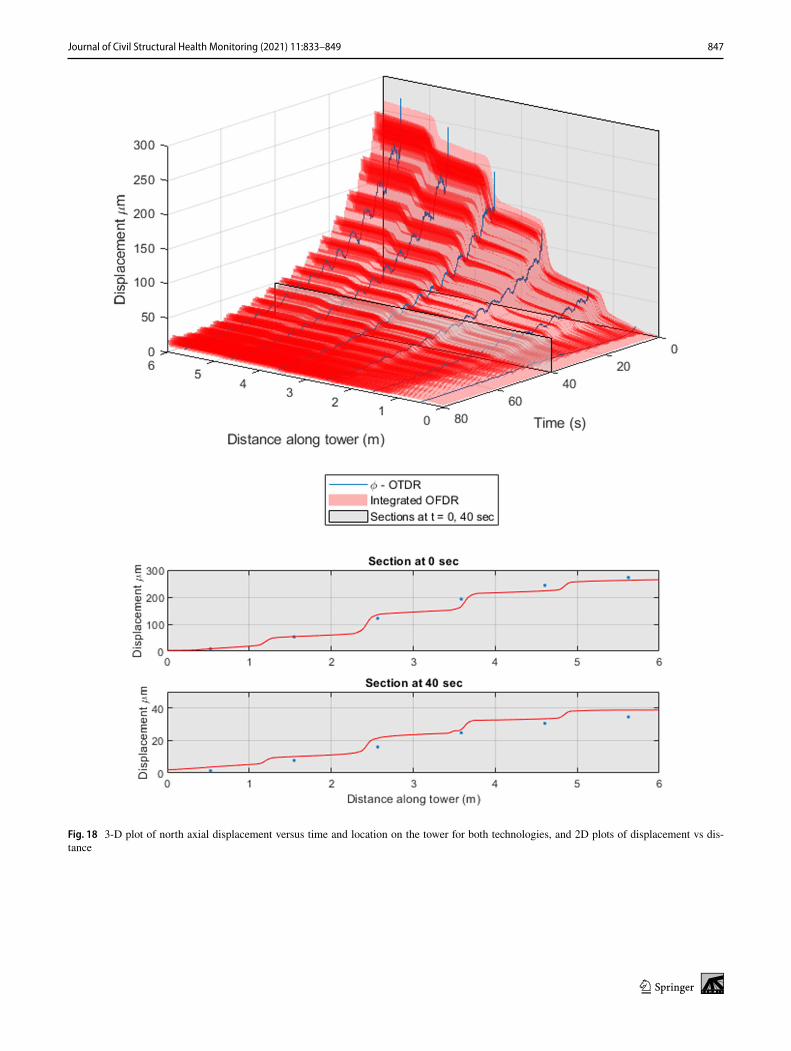
By calculating the time-series shown in Fig. 17 at each readout point for both OFDR and �-OTDR and taking their envelope, Fig. 18 is produced. This figure shows the cumulative elongation of both sensing fibers during 80 s of the free vibration test. In addition, two spatial profiles at 0 and 40 s comparing the OFDR and �-OTDR measurements are shown. This figure shows that the dynamic displacement measurements made by �-OTDR and OFDR agree at all locations on the sensing fiber. Furthermore, it shows that the correlation between the datasets is not amplitude dependent. Figure 18 also dem-onstrates the readout resolution difference between the
(4)dU =d��
4�n�,
technologies. �-OTDR is shown as individual blue lines in the 3-D plot and discrete points in the cross sections because measurements have a 1 m spacing. The OFDR data appears as a solid surface and then solid lines in the 3-D and cross section plots. This is because the OFDR data are spaced 2.6 mm along the sensing line. Therefore, the individual points cannot be distinguished. Nonethe-less, both technologies capture the same behavior and �-OTDR is a solution where less dense data are needed and longer sensing ranges are required.
6 Conclusion
OFDR and �-OTDR dynamic, distributed fiber optic sensing technologies were used to monitor a model wind turbine under free and forced vibration conditions. The measurement distance limited but industry-accepted OFDR was used to validate the dynamic strain meas-urements made with �-OTDR. �-OTDR, also known as DAS, is a technology with a very large maximum sens-ing distance. The system used in this study has a sensing range of 10 km. This presents the opportunity for moni-toring many wind turbines with a single fiber optic cable. They were both tested for their ability to identify changes in strain and natural frequency associated with bolt loos-ening and local material yielding. It was found that �-OTDR is capable of quantitatively measuring strain, and in-turn displacement, at the structural frequencies exhib-ited by wind turbine towers. A thorough comparison of the two technologies proved that �-OTDR and OFDR measure displacement fields within 5% of each other. �-OTDR was shown to be able to measure localized strain associated with the opening of flange joints and detect small changes in natural frequency caused by structural damage.
Fig. 17 Displacement time series for the top of the tower in the direction of the sensing fiber during free vibration
847Journal of Civil Structural Health Monitoring (2021) 11:833–849
123
Fig. 18 3-D plot of north axial displacement versus time and location on the tower for both technologies, and 2D plots of displacement vs dis-tance
848 Journal of Civil Structural Health Monitoring (2021) 11:833–849
123
Acknowledgements The authors thank Enel Foundation and the Center for Information Technology Research in the Interest of Soci-ety and the Banatao Institute for supporting this research. They would also like to thank Enel Green Power’s Wind Technology and Innova-tion Department leads José Alba and Nicola Rossi for their technical advice. Figures 5–14, 16 and 17 were generated using Matplotlib [37].
Funding This work was funded by the Enel Foundation and the Center for Information Technology Research in the Interest of Society and the Banatao Institute (CITRIS).
Availability of data and code Data appearing in this study and the cus-tom code used for its processing are available from the corresponding author upon reasonable request.
Open Access This article is licensed under a Creative Commons Attri-bution 4.0 International License, which permits use, sharing, adapta-tion, distribution and reproduction in any medium or format, as long as you give appropriate credit to the original author(s) and the source, provide a link to the Creative Commons licence, and indicate if changes were made. The images or other third party material in this article are included in the article’s Creative Commons licence, unless indicated otherwise in a credit line to the material. If material is not included in the article’s Creative Commons licence and your intended use is not permitted by statutory regulation or exceeds the permitted use, you will need to obtain permission directly from the copyright holder. To view a copy of this licence, visit http:// creat iveco mmons. org/ licen ses/ by/4. 0/.
References
1. Lee J, Zhao F (2019) Global wind report 2019. Global Wind Energy Council, Brussels
2. United Nations (2004) 2001 Energy statistics yearbook. UN, New York
3. United Nations (2021) 2018 Energy statistics yearbook. UN, New York
4. Wiser R, Bolinger M, Lantz E (2019) Assessing wind power oper-ating costs in the United States: results from a survey of wind industry experts. Renew Energy Focus 30:46–57. https:// doi. org/ 10. 1016/j. ref. 2019. 05. 003
5. Danish Energy Agency and Energinet (2016) Technology data: generation of electricity and district heating. IOP Publishing Danish Energy Agency. https:// ens. dk/ sites/ ens. dk/ files/ Stati stik/ techn ology_ data_ catal ogue_ for_ el_ and_ dh_-_ 0009. pdf. Accessed 1 Oct 2010
6. SEAFOM (2018) Measuring Sensor Performance Document – 02 (SEAFOM MSP-02). IOP Publishing SEAFOM Fiber Optic Monitoring Group. https:// seafom. com/ mdocs- posts/ seafom_ msp_ 02- august- 2018- pdf. Accessed 15 Dec 2020
7. Weijtjens W, Verbelen T, Capello E, Devriendt C (2017) Vibra-tion based structural health monitoring of the substructures of five offshore wind turbines. Proc Eng 199:2294–2299. https:// doi. org/ 10. 1016/j. proeng. 2017. 09. 187
8. Kim W, Yi J-H, Kim J-T, Park J-H (2017) Vibration-based struc-tural health assessment of a wind turbine tower using a wind turbine model. Proc Eng 188:333–339. https:// doi. org/ 10. 1016/j. proeng. 2017. 04. 492
9. Nguyen C-U, Huynh T-C, Kim J-T (2018) Vibration-based dam-age detection in wind turbine towers using artificial neural net-works. Struct Monit Maint 5(4):507–519
10. Ciang CC, Lee J-R, Bang H-J (2008) Structural health monitoring for a wind turbine system: a review of damage detection meth-ods. Meas Sci Technol. https:// doi. org/ 10. 1088/ 0957- 0233/ 19/ 12/ 122001
11. Oliveira G, Magalhaes F, Cunha A, Caetano E (2018) Vibration-based damage detection in a wind turbine using 1 year of data. Struct Control Health Monit. https:// doi. org/ 10. 1002/ stc. 2238
12. Avendano-Valencia LD, Fassois SD (2015) Natural vibration response based damage detection for an operating wind turbine via random coefficient linear parameter varying AR modelling. J Phys Conf Ser 628:24–26. https:// doi. org/ 10. 1088/ 1742- 6596/ 628/1/ 012073
13. Xianlong H, Tianli S (2019) A new identification method for bolt looseness in wind turbine towers. Shock Vib. https:// doi. org/ 10. 1155/ 2019/ 60561 81
14. Nguyen CT, Huynh TC, Yi J-H, Kim J-T (2017) Hybrid bolt-loosening detection in wind turbine tower structures by vibra-tion and impedance responses. Wind StructInt J 24(4):385–403. https:// doi. org/ 10. 12989/ was. 2017. 24.4. 385
15. Benedetti M, Fontanari V, Zonta D (2011) Structural health moni-toring of wind towers: remote damage detection using strain sen-sors. Smart Mater Struct. https:// doi. org/ 10. 1088/ 0964- 1726/ 20/5/ 055009
16. Bang H-J, Kim H-I, Lee K-S (2012) Measurement of strain and bending deflection of a wind turbine tower using arrayed FBG sensors. Int J Precis Eng Manuf 13:2121–2126. https:// doi. org/ 10. 1007/ s12541- 012- 0281-2
17. Moyo P, Brownjohn J, Suresh R, Tjin S (2005) Development of fiber bragg grating sensors for monitoring civil infrastructure. Eng Struct 27(12):1828–1834. https:// doi. org/ 10. 1016/j. engst ruct. 2005. 04. 023
18. Soga K, Luo L (2018) Distributed fiber optics sensors for civil engineering infrastructure sensing. J Struct Integr Maint 3:1–21. https:// doi. org/ 10. 1080/ 24705 314. 2018. 14261 38
19. Masoudi A, Newson TP (2016) Contributed review: distributed optical fibre dynamic strain sensing. Rev Sci Instrum 87:011501. https:// doi. org/ 10. 1063/1. 49394 82
20. Glišic B, Inaudi D (2007) Fibre optic methods for structural health monitoring. Wiley, Chichester
21. Kechavarzi C, Soga K, de Battista N, Pelecanos L, Elshafie M, Mair RJ (2016) Distributed optical fibre sensing for monitor-ing geotechnical infrastructure: a practical guide. Westminster, London
22. Di Murro V, Pelecanos L, Soga K, Kechavarzi C, Morton RF, Scibile L, (2019) Long-term deformation monitoring of CERN concrete-lined tunnels using distributed fibre-optic sensing. Geo-tech Eng J SEAGS & AGSSEA 50(2). http:// seags. ait. asia/ journ als/ 32613- seags- agssea- journ al- june- 2019/. Accessed 6 Jan 2021
23. Li Z, Soga K, Kechavarzi C (2018) Distributed fibre optic sensing of a deep excavation adjacent to pre-existing tunnels. Geotech Lett. https:// doi. org/ 10. 1680/ jgele. 18. 00031
24. Pelecanos L, Soga K, Elshafie M, de Battista N, Kechavarzi C, Gue CY, Ouyang Y, Seo H (2018) Distributed fibre optic sensing of axially loaded bored piles. J Geotech Geoenviron Eng. https:// doi. org/ 10. 1061/ (ASCE) GT. 1943- 5606
25. Liu RM, Babanajad SK, Taylor T, Ansari F (2015) Experimen-tal study on structural defect detection by monitoring distributed dynamic strain. Smart Mater Struct 24(11):115038. https:// doi. org/ 10. 1088/ 0964- 1726/ 24/ 11/ 115038
26. Oskoui EA, Taylor T, Ansari F (2021) Reference-free dynamic distributed monitoring of damage IN multispan bridges. J Struct Eng 147(1):04020292. https:// doi. org/ 10. 1061/ (asce) st. 1943- 541x. 00028 58
27. Broth Z, Hoult NA (2020) Dynamic distributed strain sensing to assess reinforced concrete behaviour. Eng Struct 204:110036. https:// doi. org/ 10. 1016/j. engst ruct. 2019. 110036
849Journal of Civil Structural Health Monitoring (2021) 11:833–849
123
28. Wheeler LN, Pannese E, Hoult NA, Take WA, Le H (2018) Meas-urement of distributed dynamic rail strains using a Rayleigh back-scatter based fiber optic sensor: lab and field evaluation. Transport Geotech. https:// doi. org/ 10. 1016/j. trgeo. 2017. 10. 002
29. Luna Innovations Incorporated (2020) Introducing the ODiSI-B 5.1 for Strain & Temperature. https:// lunai nc. com/ sites/ defau lt/ files/ assets/ files/ data- sheet/ LUNA- ODiSI- 6000- Data- Sheet. pdf. Accessed 12 Jan 2021
30. Hartog AE (2017) An introduction to distributed optical fiber sen-sors. CRC Press
31. Hall A, Minto C (2019) Using fibre optic cables to deliver intel-ligent traffic management in smart cities. In: Proceedings: Inter-national Conference on smart infrastructure and construction 2019 (ICSIC). https:// doi. org/ 10. 1680/ icsic. 64669. 125
32. Daley TM, Freifeld BM, Ajo-Franklin J, Dou S, Pevzner R, Shu-lakova V, Lueth S (2013) Field testing of fiber-optic distributed acoustic sensing (DAS) for subsurface seismic monitoring. Lead Edge. https:// doi. org/ 10. 1190/ tle32 060699.1
33. Zuo J, Zhang Y, Xu H, Zhu X, Zhao Z, Wei X, Wang X (2020) Pipeline leak detection technology based on distributed optical fiber acoustic sensing system. IEEE Access 8:30789–30796. https:// doi. org/ 10. 1109/ access. 2020. 29732 29
34. Samiec, D (2012) Optical metrology: distributed fibre-optic tem-perature and strain measurement with extremely high spatial reso-lution. IOP Publishing Photonik International. https:// www. lambd aphoto. co. uk/ pdfs/ LUNA/ Artic le% 20-% 20Dis tribu ted% 20fib re- optic% 20tem perat ure% 20and% 20str ain% 20mea surem ent% 20wit hextr emely% 20high% 20spa tial% 20res oluti on. pdf. Accessed 19 Jan 2021
35. Luna Innovations Incorporated (2020) ODiSI 6000: Optical Dis-tributed Sensor Interrogators. IOP Publishing Luna Innovations Incorporated. https:// lunai nc. com/ sites/ defau lt/ files/ assets/ files/ data- sheet/ LUNA- ODiSI- 6000- Data- Sheet. pdf. Accessed 30 Jan 2021
36. Hudson DE (1962) Synchronized vibration generators for dynamic tests of full-scale structures. California Institute of Technology. https:// autho rs. libra ry. calte ch. edu/ 26490/1/ Hudson_ 1962. pdf. Accessed 30 Jan 2021
37. Hunter JD (2007) Matplotlib: A 2D graphics environment. Com-puting Sci Eng 9(3). https:// doi. org/ 10. 5281/ zenodo. 46499 59
Publisher’s Note Springer Nature remains neutral with regard to jurisdictional claims in published maps and institutional affiliations.