Embed Size (px)
Citation preview
8/3/2019 Dynamic Viscosity and Thermal Conductivity Prediction of Refriger
http://slidepdf.com/reader/full/dynamic-viscosity-and-thermal-conductivity-prediction-of-refriger 1/11
Purdue University
Purdue e-Pubs
International Refrigeration and Air ConditioningConference
School of Mechanical Engineering
1992
Dynamic Viscosity and Thermal Conductivity Prediction of Refrigerants and Refrigerant Mixtures
G. LatiniUniversita di Ancona; Italy
P. PierpaoliUniversita di Ancona; Italy
F. PolonaraUniversita di Ancona; Italy
This document has been made available through Purdue e-Pubs, a service of the Purdue University Libraries. Please contact [email protected] for
additional information.
Complete proceedings may be acquired in print and on CD-ROM directly from the Ray W. Herrick Laboratories at https://engineering.purdue.edu/
Herrick/Events/orderlit.html
Latini, G.; Pierpaoli, P.; and Polonara, F., "Dynamic Viscosity and Thermal Conductivity Prediction of Refrigerants and RefrigerantMixtures" (1992). International Refrigeration and Air Conditioning Conference. Paper 188.http://docs.lib.purdue.edu/iracc/188
8/3/2019 Dynamic Viscosity and Thermal Conductivity Prediction of Refriger
http://slidepdf.com/reader/full/dynamic-viscosity-and-thermal-conductivity-prediction-of-refriger 2/11
8/3/2019 Dynamic Viscosity and Thermal Conductivity Prediction of Refriger
http://slidepdf.com/reader/full/dynamic-viscosity-and-thermal-conductivity-prediction-of-refriger 3/11
means of a correlation proposed by the authors in /4,5,6/; one of the three paramete(s contained
in the fonnula had to be calculated by means of reliable experimental data. The correlation was
not. therefore, a real prediction method, even i f only one e,;perimenta l datum was enough to
estimate accumtely the fluid behaviour from the melting point to beyond the boiling point. In the
present work this drawback has been overcome, and an actual predictive equation is g
iven: the
new fonnula can predict liquid viscosities in the reduced temperature range 0.40-0.75.
2., THERMAL CONDUCTIVITY
Pure fluids
The correlation proposed has the fonn,/1,2/:
where A.T
Tc
Tr
A
{1- Tr)0.3S
"-"'A · 116
thermal conductivity, [W·m-I.K-1],
tempemture, [K],
critical tempemturc, [K],
T/Tc, reduced temperature,
constant, [W·m-l.K-1].
Tr
(I)
The constant A has th(ee main features: it is characteristic of each liquid. it is practically
tempemture independent and depends on the molecular structure. The value of A can
be either
calculated by linear regression from experimental data (only one experimental datum at Tro.ss
can be sufficient), or estimated, through the knowledge of fluid physical properties, with:
T-' A=:A• ..::&....
where M molecular weight,
A* constant whose value is:
" '0 .494 for refrigerants RIO to Rl4 and RllO to Rl60
= 0.562 for refrigerants R20 to R23
a. =0.166667
=0.5
(2)
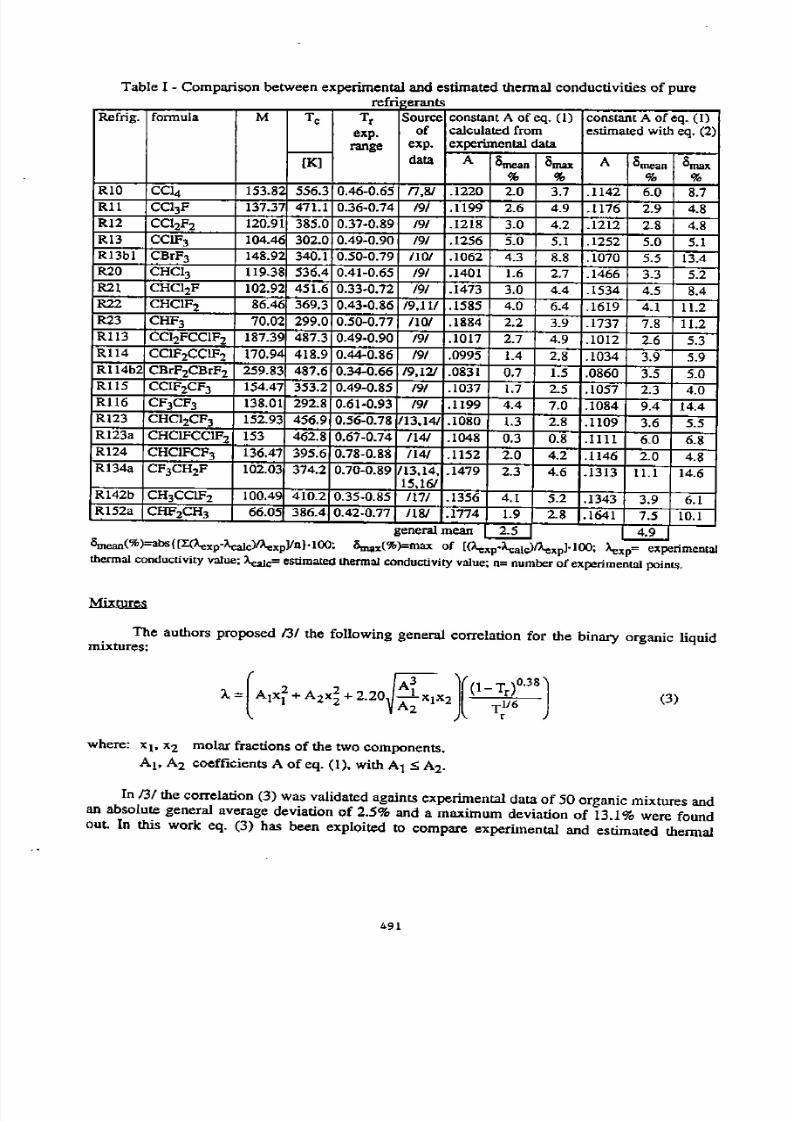
Comparisons between estimated !henna! conductivities and experimenta l data are reported
in Table I for several pure refrigerants. When using coefficients A calculated fro
m experimental
data, absolute general mean deviation is 2.5% and maximum deviation is 8.8%. When using
coefficients A predicted from eq. (2) general mean and maximum deviations are 4.9% and 14.6%
respectively.
490
8/3/2019 Dynamic Viscosity and Thermal Conductivity Prediction of Refriger
http://slidepdf.com/reader/full/dynamic-viscosity-and-thermal-conductivity-prediction-of-refriger 4/11
Table I - Com parison between eltperimcntal and estimated thermal conduc tivitie s o f pure f" e n eran ts
Ref ig. formula M Tc T r Source constant A of cq. (I) constant A of eq. (I)
exp. of calculated from estimated with cq. (2)
range eltp. eltperimental data
r-oo- data A Sme.n Omax A Omean Omax
% % % % RIO CCI4 153.8" 556.3 0.46-0.65 n,81 .1220 2.0 3.7 .1142 6.0 8.7 Rll CC13F 137.37 471.1 0.36-0.74 191 .1199 2.6 4.9 .1176 2.9 4.8Rl2 CC12F2 120.91 385.0 0.37-0.89 191 .1218 3.0 4.2 .1212 2.8 4.8 Rl3 CCIF3 104.4(i 302.0 0.49-0.90 191 .1256 5.0 5.1 .1252 5.0 5.1 R13bl CBrF3 148.92 340.1 0.50-0.79 /10/ .1062 4.3 8.8 .1070 5.5 13.4 R20 CHCI3 119.38 536.4 0.41-0.65 191 .1401 1.6 2.7 .1466 3.3 5.2 R21 CHCI2F 102.92 451.6 0.33-0.72 191 .1473 3.0 4.4 .1534 4.5 8.4 R22 CHC!Fz 86.46 369.3 0.43-0.86 /9,11/ .1585 4.0 6.4 .1619 4.1 11.2 R23 CHF3 70.02 299.0 0.50-0.77 /10/ .1884 2.2 3.9 .1737 7.8 11.2Rll3 CCI2FCCIF2 187.39 487.3 0.49-0.90 191 .1017 2.7 4.9 .1012 2.6 5.3 Rll4 CCIF2CCIF2 418.9 0.44-0.86 191 .0995 1.4 2.8 .1034 3.9 5.9R114b2 CBrF2CBrF2 259.83 487.6 0.34-0.66 /9,121 .0831 0.7 1.5 .0860 3.5 5.0Rll5 CC1F2CF3 154.47 353.2 0.49-0.85 191 .1037 1.7 2.5 .1057 2.3 4.0 Rl16 CF3CF3 138.01 292.8 0.61-0.93 191 .1199 4.4 7.0 .1084 9.4 14.4 R!23 CHCI2CF3 152.93 456.9 0.56-0.78 /13,14/ .1080 1.3 2.8 .1109 3.6 5.5R123a CHCIFCCIF2 153 462.8 0.67-0.74 /14/ .1048 0.3 0.8 .1111 6.0 6.8 R124 CHC1FCF3 136.47 395.6 0.78-0.88 /14/ .1152 2.0 4.2 .1146 2.0 4.8
R134a CF3CH2F 102.03 374.2 0.70-0.89 /13,14, .1479 2.3 4.6 .1313 11.1 14.6 15,16/
R142b CH3CCIF2 100.49 410.2 0.35-0.85 /17/ .1356 4.1 5.2 .1343 3.9 6.1 Rl52a CHF2CH3 66.0 386.4 0.42-0.77 /18/ .1774 1.9 2.8 .1641 7.5 10.1
general mean ....1:L . n ) a ( p ' a x J ) ; Smax<%)=max of [(Aexp·A.:alc)fi..expl·IOO; Aexp= experimental ther mal co ndu ct ivity value ; l.e..Jc= esti m ate d th ermal o d t i va lue ; n= number of experim ent al points .
The authors proposed 13/ the following general correlation for the binary organic liquidmixtures:
(3 )
where: x I• ltz molar fractions of the two components.
AJ> A2 coefficients A of eq. (1). with A1 :> Az.
In /3 / the correlation (3) was validated againts exper imental data of 50 organic mixtures and an absolute general average deviation of 2.5% and a maximum deviation of 13.1% were foundout. In this work eq. (3) has been eltploited to compare experimental and estimated thermal
491
8/3/2019 Dynamic Viscosity and Thermal Conductivity Prediction of Refriger
http://slidepdf.com/reader/full/dynamic-viscosity-and-thermal-conductivity-prediction-of-refriger 5/11
conductivities of mixtures R502 as reported in Table II. To the authors knowledge no other
reliable experimental data exist in literature for liquid thermal conductivity of refrigerant
mixtures.
Table I I · Comparison between experimental and estimated thermal conductivities of refrigerant
mixtures
mixture comp. % comp. % Tr Source Omoan 3m a.
1 weight 2 weight exp. of % %
range exp.
data
azeotropic mixtures
R502 R22 0.488 IR 115 0.512 .I 0.85·0 .9 0 I 1141 I 2.9 7.0
3. DYNAMIC VISCOSITY
Pure fluids
A correlation of this type has been recently proposed /4,5,6/:
I ' A -= ---B 1-1. C-Tr
(4)
where: 1-1. dynamic viscosity, [mPa·s],
A,B constants, characteristic of the fluid, [mPa·Ls·l], C constant, dimensionless.
The parameter C depends on the fluid molecular structure; it has the same value for all the
refrigerants of the methane series and the same value for all the refrigerants of the ethane series.
A is related to the most important physical properties of the fluid and can be evaluated with
simple monomial expressions; the evaluation of B. on the other hand, requires the knowledge of
experimental viscosity data; even only one reliable datum would be sufficient.
The analysis of many reliable experimental data recently appeared in literature over wide
temperature ranges make possible an important improvement of equation (4): a proper choice of
the value of factor C allows to assume the value of A to be equal to the value of B with very good approximation. In particular, C:: l.30 for methane series refrigerants, and C=1.35 for ethane
series refrigerants; the equation (4) becomes then as follows:
(5 )
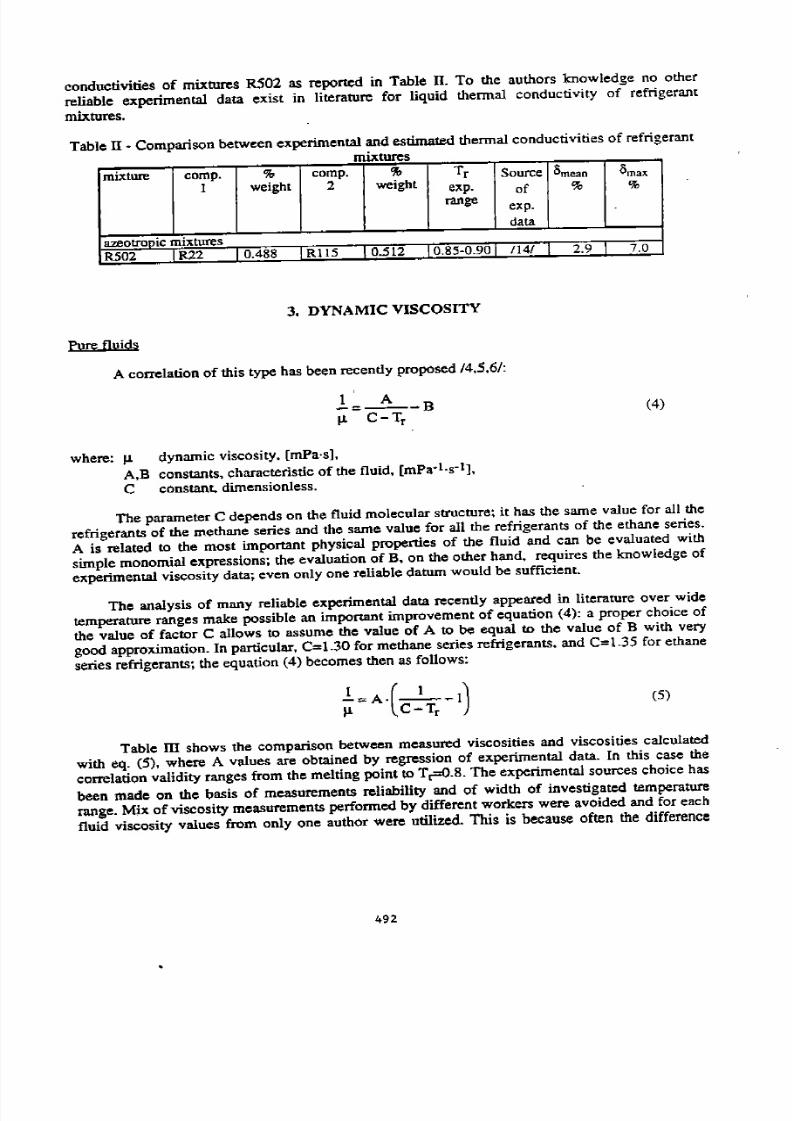
Table m shows the comparison between measured viscosities and viscosities calculated
with eq. (5), where A values are obtained by regression of experimental data. In this case the
correlation validity ranges from the melting point toT =0.8. The experimental sources choice has
been made on the basis of measurements reliability and of width of investigated temperature
range. Mix of viscosity measurements performed by different workers were avoided and for each
fluid viscosity values from only one author were utilized. This is because often the difference
492
8/3/2019 Dynamic Viscosity and Thermal Conductivity Prediction of Refriger
http://slidepdf.com/reader/full/dynamic-viscosity-and-thermal-conductivity-prediction-of-refriger 6/11
between two f..1. values obtained with different techniques is too high with respect to the two
claimed accuracies.
Tab le m Com parison be tw een experimental and calculated
viscosiues o · pure re ngerf · ants
Refrig. formula Tc Tr Source c A Omean Omax
exp. ofcalc.
% % from
r---exp.
[K ) range exp.data dala
RIO CCI4 556.3 0.53-0.65 /19/ 1.30 3.9496 5.6 10.6
R1l CCI3F 471.1 0.44-0.75 120/ 1.30 4.6866 3.5 9.4
R12 CCI2F2 385.0 0.52-0.81 /20/ 1.30 5.4785 3.0 6.2
Rl3 CCIF3 302.0 0.33-0.99 121/ 1.30 6.5097 1.3 5.9
Rl3 bl CBrF3 340.1 0.53-1.00 /10/ 1.30 4.9607 4.1 10.7
R20 CHCI3 536.4 0.39-0.661201
1.30 5.2557 1.6 3.9R21 CHCJ2F 451.6 0.46-0.77 1201 ·uo 5.5696 3.2 8.5
R22 CHCIF2 369.3 0.54-0.73 120/ 1.30 5.8974 2.8 5.1
R23 CHF3 299.0 0.63-0.86 1201 1.30 6.0713 2.6 3.8
R30 CH2CI2 510 0.41-0.73 1201 1.30 5.9250 2.4 6.7
R31 CHzClF 426.6 0.45-0.74 1201 1.30 6.2212 2.2 4.6R32 CH2F2 351.6 0.57-'0.82 1201 1.30 5.4335 1.0 3.7
R40 CH3Cl 416.3 0.66-0.82 /221 1.30 8.0351 0.7 1.8
R113 CC12FCC1Fz 487.3 0.56-0.73 1231 1.35 4.3987 4.5 9.0Rll4 CCIF2CCIF2 418.9 0.65-0.84 123/ 1.35 4.9978 1.7 2.9
R115 CCIF2CF3 353.2 0.53-0.88 /24/ 1.35 5.0207 5.6 l1.5R123 CHCI2CF3 456.9 0.60-0.77 1231 1.35 5.5220 1.4 2.8 R123a CHC!FCCIF2 458.4 0.60-0.77 /23/ 1.35 5.3333 1.9 3.8R133a CH2CICF3 395.6 0.52-0.79 /201 1.35 5.9812 2.0 3.8Rl34a CF3CH2F 374.2 0.67-0.92 1251 1.35 5.8600 0.9 1.5R142b CH3CClF2 410.2 0.59-0.81 1261 1.35 5.6899 4.9 9.5Rl52a CHF2CH3 386.4 0.52-0.82 1201 1.35 8.3482 1.2 3.1 Rl60 CH 3CH 2Cl 460.4 0.55-0.68 127/ 1.35 9.5695 3.4 6.7RSO CH4 19Q.4 0.50-1.00 128/ 1.20 3.3043 1.3 3.0R170 CH3CH3 305.4 0.31-0.98 1291 1.22 9.6448 2.3 6.6R290 CH3CH2CH3 369.8 0.24-0.81 1291 1.26 8.8591 1.1 3.3R600 CH3CH2CH2CH 425.2 0.31-0.66 /301 1.27 8.1922 1.3 2.6R600a CH(CH3)J 425.2 0.28-0.69 /30/ 1.30 8.0262 3.4 7.5
general mean .....1:Llimean(%)=abs[[I:UJ.ewllcaicYJ.Iexpl/n)·IOO: Ornax(%)=max of [(J.Iexp-llcaJJIIlexpl·IOO; llexp'" experimental
viscosity value: llcaJc= estimated viscosity value; I I " number of experimemal points.
But, to make the correlation a real pred ictive one, a method to calculate the coe fficien t Awithout any experimental datum has to be given. The link between A and the physical propertiesof the fluid can be well exp ressed by the relationship:
rx.va A=h·-c __ _
MY --r:
493
(6)
8/3/2019 Dynamic Viscosity and Thermal Conductivity Prediction of Refriger
http://slidepdf.com/reader/full/dynamic-viscosity-and-thermal-conductivity-prediction-of-refriger 7/11
where: Vc critical volume, [cm3·gmole-1],
Tb normal boiling temperature (at 101.325 kPa), [K],
constants.
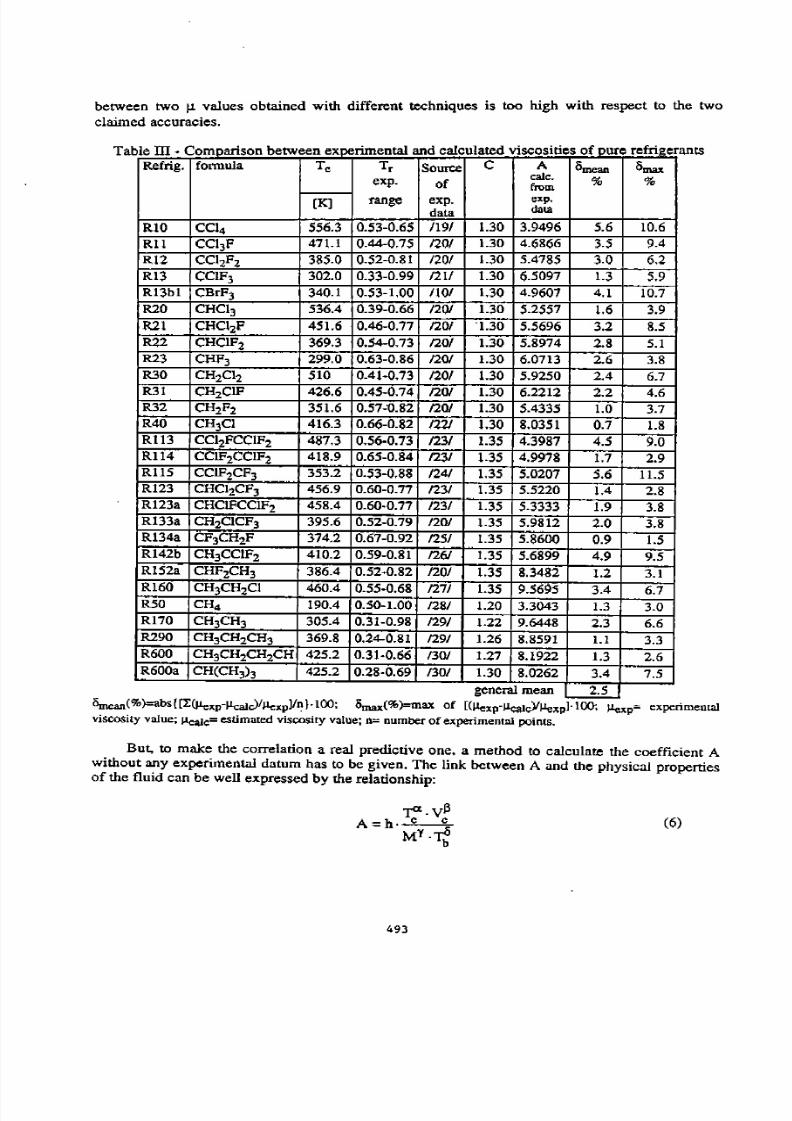
The values of the constants in eq. (6) have been obtained for the methane and ethane series
with the mean squares method, as shown in Table IV. It must be noted that eq. (6) with the
constants of Table IV can be used only with halogenated hydrocarbon refrigerants. More
appropriate formulations have to be studied for methane, ethane, propane and n- and iso-butane.
which have to be considered as belonging to the family of alkanes.
a e - oe 1c1ents o eq. bl IV C ffi . f (6)
refrigerants h ex y 8
methane series 11.46125 6.147103 1.200513 0.69352 7.35470
ethane series 9.15130 0.367119 0.528526 0.82114 0.29033
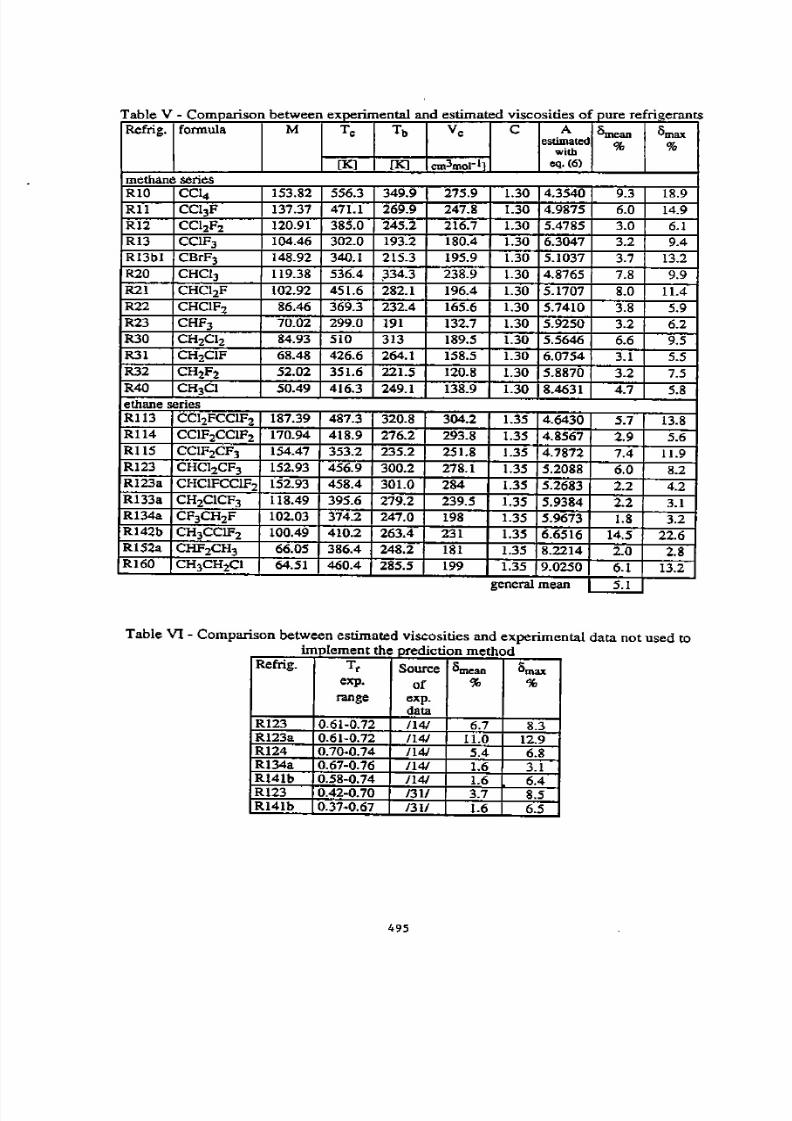
In Table V the same comparisons of Table III are reported, but this time the A values for
the different fluids are estimated with eq. (6). Of course deviations are higher when A is
estimated rath er than regressed from experimental data, but an absolute general mean deviation
of 5% and maximum deviations usually less than 13% are still satisfactory for engineering
purposes. Very few higher lirnax are due to experimental data near the melting point. At this point
has to be noted that the prediction methods available in literature 121 use more complicate
techniques and do not reach better accuracies, where the method proposed in the present paper
requires only the knowledge of easily available physical properties as M, T b• Tc• and V c·
Further comparisons have been developed between estimated values and reliable
experimental data recently published but not used to implement the method. These comparisons
are shown in Table VI. The comparison between estimates on Rl34a and data obtained in f311
showed mean and maximum deviations of 14.4 and 32% respectively and are not reported in Tab
VI.
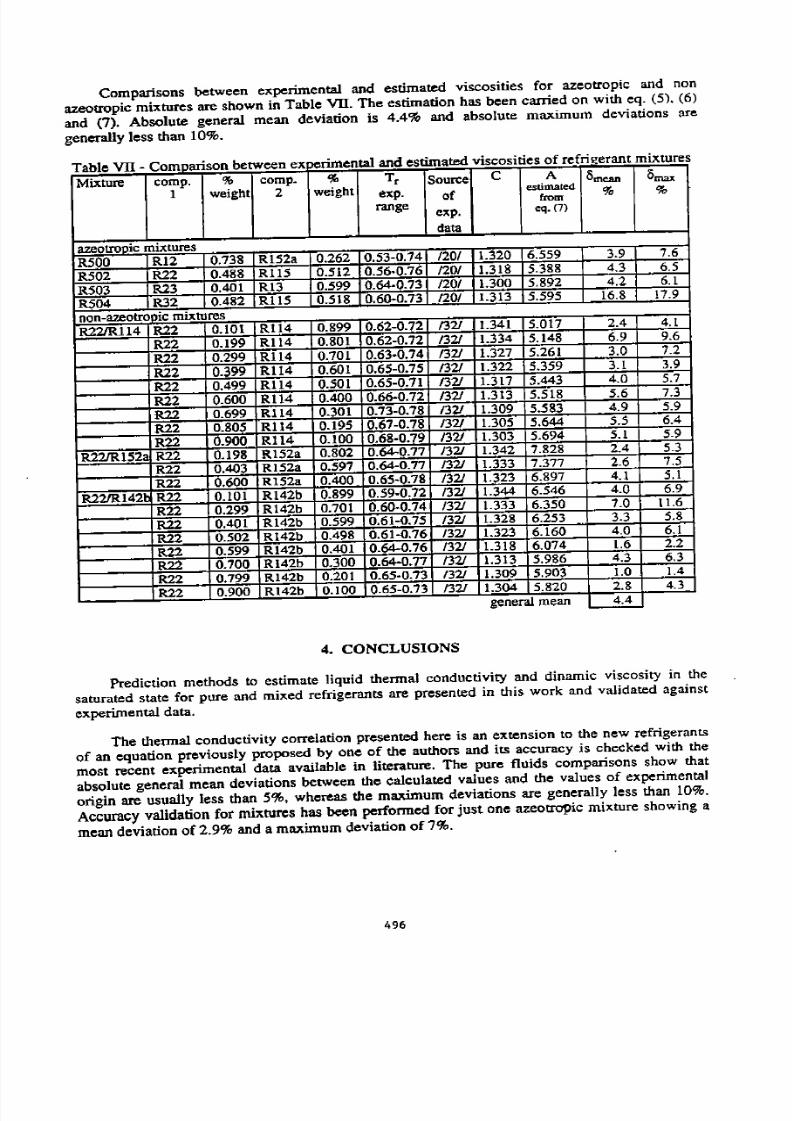
The following mixing rule has been used here /6/:
(7 )
where At• A2 are the A coefficients of eq. (5) for the mixture components. with A 1 !:> A2. and
x1, x2 are the molar
494
8/3/2019 Dynamic Viscosity and Thermal Conductivity Prediction of Refriger
http://slidepdf.com/reader/full/dynamic-viscosity-and-thermal-conductivity-prediction-of-refriger 8/11
Table V - Com parison be tween experimen ta l dn estimate VISCOSities o pure re ngerants.f f '
Refrig. formula M Tc Tb Vc c A Smean Smaxestimated
% %
witb[KJ [K] cm3mol-ll eq.(6)
methane seriesRIO CC14 153.82 556.3 349.9 275.9 1.30 4.3540 9.3 18.9
Rll CC13F 137.37 471.1 269.9 247.8 1.30 4.9875 6.0 14.9
R12 CC1zFz 120.91 385.0 245.2 216.7 1.30 5.4785 3.0 6.1
R13 CCIF3 104.46 302.0 193.2 180.4 1.30 6.3047 3.2 9.4
R13b1 CBrF3 148.92 340.1 215.3 195.9 1.30 5.1037 3.7 13.2
R20 CHCI3 119.38 536.4 .334.3 238.9 1.30 4.8765 7.8 9.9
R21 CHC12F 102.92 451.6 282.1 196.4 1.30 5.1707 8.0 11.4
R22 CHC1F2
86.46 369.3 232.4 165.6 1.30 5.7410 3.85.9 R23 CHF3 70.02 299.0 191 132.7 1.30 5.9250 3.2 6.2
R30 CH2Ct2 84.93 510 313 189.5 1.30 5.5646 6.6 9.5
R31 CH2C1F 68.48 426.6 264.1 158.5 1.30 6.0754 3.1 5.5
R32 CHzFz 52.02 351.6 22!.5 120.8 1.30 5.8870 3.2 7.5
R40 CH3C1 50.49 416.3 249.1 138.9 1.30 8.4631 4.7 5.8ethane seriesRll3 CCI2FCCIFz 187.39 487.3 320.8 304.2 1.35 4.6430 5.7 13.8Rll4 CCIF2CCIFz 170.94 418.9 276.2 293.8 1.35 4.8567 2.9 5.6RllS CCIF2CF3 154.47 353.2 235.2 251.8 1.35 4.7872 7.4 11.9
R123 CHCI2CF3 152.93 456.9 300.2 278.1 1.35 5.2088 6.0 8.2R123a CHCIFCCIF2 152.93 458.4 301.0 284 1.35 5.2683 2.2 4.2Rl33a CH2CICF3 118.49 395.6 279.2 239.5 1.35 5.9384 2.2 3.1R134a CF3CH2F 102,03 374.2 247.0 198 1.35 5.9673 1.8 3.2 R142b CH3CCIF2 100.49 410.2 263.4 231 1.35 6.6516 14.5 22.6R152a CHF2CH3 66.05 386.4 248.2 181 1.35 8.2214 2.0 2.8RI60 CH3CHzCI 64.51 460.4 285.5 199 1.35 9.0250 6.1 13.2
general mean c.2!..
Table VI- Comparison between es tim ated viscosities and experimen tal data no t used to
im plement the prediction method
Refrig. T , Source Smean Smaxexp. of % %
range exp.data
R123 0.61-0.72 1141 6.7 8.3 R123a 0.61-0.72 /141 11.0 12.9Rl24 0.70-0.74 /141 5.4 6.8 R134a 0.67-0.76 /141 1.6 3.1R141b 0.58-0.74 1141 1.6 6.4Rl23 0.42-0.70 /31/ 3.7 8.5 Rl41b 0.37-0.67 /31/ 1.6 6.5
495
8/3/2019 Dynamic Viscosity and Thermal Conductivity Prediction of Refriger
http://slidepdf.com/reader/full/dynamic-viscosity-and-thermal-conductivity-prediction-of-refriger 9/11
8/3/2019 Dynamic Viscosity and Thermal Conductivity Prediction of Refriger
http://slidepdf.com/reader/full/dynamic-viscosity-and-thermal-conductivity-prediction-of-refriger 10/11
The viscosity correlation has been improved from a previous version in order to make it a
real predictive method. The new method proposed 'in this ,work allows to p r e ~ i c t d y ~ a m i c viscosity in the reduced temperature range 0.40-0.75; only the knowledge of easily ava1lable
physical properties as M, Tb, TC• and V c is necessary to run the method. The comparisons used
to check the method accuracy showed mean deviations between calculated and reliableexperimental values generally less than 6% and muimum deviations usually Jess than 13%. The
s&ne method was applied to mixtures, using appropriate mixing rules and, when checked, meanand maximum deviations usually less than 5% and 10% were noticed.
ACKNOWLEDGMENTS
The authors are gratefully indebted to W. M. Haynes, NIST, Boulder, Co., and to I. R.
Shankland, Allied Signal, Buffalo, NY, for their help in providing literature.
Work supported by Consiglio Nazionale delle Ricerche of Italy and by Ministero dell'Universita'
e della Ricerca Scientifica e Tecnologica of Italy.
REFERENCES
1. C. BARONCINI, P. DI FTI...IPPO, G. LATINI. M. PACETII: Organic Liquid Thermal
Conductivity: A Prediction Method in the reduced Temperature Range 0.3 to 0.8. Int. J.Thermophysics, Vol. 1 (1981) No. 1, pp. 21-38.
2. R. C. REID, J. M. PRAUSNITZ. B. E. POLING: The Properties of Gases & Liquids. 4thEdition, McGraw-Hill. New York (1987), pp. 549-550.
3. C. BARONCINI, G. LATINI, P. PIERPAOLI: Thermal Conductivity of Organic LiquidBinary Mixtures: Measurements and Prediction Method. Int. J. Tbermophysics, Vol. 5
(1984) No.4, pp. 387-401.
4. G. LATINI, F. MARCOTUILIO, P. PIERPAOU, A. PONTICIELLO: Dynamic Viscosity
of refrigerants and Refrigerant Mixtures: a Prediction Method. Proc. of I.I.R. Comm. B1, B2,
El, E2 Meeting, Purdue University, West Lafayette, Ind. (1988), pp. 73-80.
5. G. LATINI: A Prediction Method for Liquid Dynamic Viscosity. lOth Japan Symposium onThermophysical Properties, Sapporo, Japan (1989), pp. 19-22.
6. G. LATINI, L. LAURENT!, F. MARCOTUILIO, P. PIERPAOU: Dynamic Viscosity: A
general prediction method with application to refrigerants and refrigerant mixtures. Int. J.
Refrigeration, Vol. 13 (1990) July, pp. 248-255.
7. D. R. TREE, W. LEIDENFROST: Thermal Conductivity Measurements of liquid tolueneand carbon tetrachloride. In C.Y. HO, R.E. TAYLOR, Thermal Conductivity, pp. 611-618,8th Conf. on Thermal Conductivity, Purdue Univ. (1968).
8. L. RIEDEL: New Measurements of Thermal Conductivity of Organic Liquids. Chern. Ingr.Tech., Vol. 23, No. 13 (1951), pp. 321-324.
9. W. TAUSCHER: Thermal Conductivity of Liquid Refrigerants Measured by un Unsteady
State Hot Wire Method. Kaltetechnik-Klimatisierung, Vol. 19, No. 9 (1967), pp. 288-29210. ASHRAE Handbook, Fundamentals Volume (1989).
11. A. SADYKOV et al.: Coefficient of Thermal Conductivity of some Freons of the Methane
Series. Trudy Kazan. Khim. Tekbnol Inst., Vol. 47 (1971), pp. 35-39
12. Z. I. GELLER et al.:· Experimental Investigation on the Thermal Conductivity of the
Brominated Freons Fll3b2 and Fll4b2. lnzh-fiz. Zf., Vol22, No.2 (1972), pp. 209-214.
13. U. GROSS, Y. W. SONG, 1. KALLWEIT, E. HAHNE: Thermal Conductivity of Saturated
R123 and Rl34a- Transient Hot Wire Measurements. I.I.R. Comm. Bl Meeting, Herzlia,
497
8/3/2019 Dynamic Viscosity and Thermal Conductivity Prediction of Refriger
http://slidepdf.com/reader/full/dynamic-viscosity-and-thermal-conductivity-prediction-of-refriger 11/11