Embed Size (px)
Citation preview
“A map does not just chart, it unlocks and formulates meaning; it forms bridges between here and there, between disparate ideas that we did not know were previously connected.” This quote from Reif Larsen’s novel, The Selected Works of T.S. Spivet, is the perfect quote to describe how I view this mapping project. With technology constantly growing and evolving, it is important for people to realize just what they can accomplish with it. If we choose to use technology in a positive way then it can help us see things we have never noticed before, like Larsen’s quote describes. Using the computer code, that Professor Winiski and I found and modified to my map’s needs, we created a relationship that could translate the meaning of a simple latitude and longitude or address into a map that can display a much different, deeper meaning. According to the authors of Using Collaborative Web-Based Documents to Instantly Collect and Analyze Whole-Class Data, by Herr et al. (2011), “Google Documents is currently the best suite of development tools, and one can be confident that these tools will continue to improve even as new tools are introduced by Google and other parties.” Google has a wide array of tools through their Google Drive. This “Drive” portion of their website includes ways to create documents, presentations, spreadsheets, forms, and drawings. Through my research I have found multiple articles claiming that Google and their website is ahead of the curve with their easy to use interface, accessibility from anywhere, and ability to hold large amounts of information. Also Herr et al. (2011) describes a “mash-up” technology, which allows people, particularly students, to input their address information into a Google Doc and a web application combines the data from each person, turns it into a Google Spreadsheet, and then into a Google Map. This is a similar idea to my project, the difference is that my process starts directly from a Google Spreadsheet. According to Lefer et al. (2008), Google Maps has numerous benefits, along with some disadvantages. He says that Google Maps is free, simple, and can be transferred easily among users. Yet, it cannot map certain regions as easily. Boulos (2005), agrees with Lefer on the fact that Google Maps has some down-falls. Boulos claims that Google Maps, along with its other online mapping services competitors, do not have an easy enough API for average user to understand and change to their needs. Google has also been known to discontinue or drastically their change products. Despite these disadvantages, Google Maps was the perfect choice for my project because of the easily recognizable advantages.
As far as future research, I see myself being able to use the coding skills I have acquired through this project to use with my Communications degree. This map concept was theorized to use for Furman University Admissions to be able to quickly and efficiently map Furman Ambassadors, making it easier for prospective or newly admitted students to find a Furman student in their area. Therefore, for future research this map concept might be used to show concepts similar to that. It would also be beneficial to add a section to the code that shows images with the descriptions.
Dynamic Web Mapping Using Code to Automatically Connect Google Excel Spreadsheets to a Google Map Webpage
Sarah Stevens EES201 – Introduction to Geographic Information Systems – Fall 2013, Furman University, Greenville, SC
Abstract
IV. Results and Discussion
I. Introduction / Lit Review
II. Methodology
VII. Acknowledgements
VI. Future Research
VIII. References/ Data Sources
V. Conclusion
This project is unlike any other Geographic Information Systems project this semester because it involves dynamic mapping with computer codes. In other words, instead of a traditional map that can only be changed or added to by the user going through multiple steps, my map can be changed by simply adding in a latitude and longitude or address onto the Google Spreadsheet. This Google Spreadsheet is attached to my online Google Map through JavaScript coding and loops. Therefore, whenever new information is added to my spreadsheet my online map automatically reflects that addition or change which makes it more user-friendly and convenient than normal static maps.
First, in order to prepare myself to begin my project I completed courses online at Codeacademy on coding. In particular, I learned about JavaScript code and JavaScript Loops. This was an extremely important first step for my project because JavaScript coding, along with its loops, are what made my interactive map work. After my extensive research I found websites and tutorials that were also focused on making a Google Excel Spreadsheet communicate with a Google Earth website through coding. With these websites’ help I created a Google Excel Spreadsheet which I made accessible to anyone who has a link, they can view and edit this spreadsheet. In this spreadsheet I had a column for; title, description, latitude, and longitude. Next, Professor Winiski and I used a JavaScript code to connect my public Google Excel Spreadsheet with the Google Map Website. This was done by using the JavaScript code which made up the website, and is shown in portion below. We wrote the code on Dreamweaver. We also used Firefox and a special web-development tool for Firefox, Firebug, to test the code on a web-based page. Then I added a section of code that geocodes my addresses automatically in latitude and longitude. Finally, I double-checked my project and its effectiveness by finding the addresses and latitudes and longitudes of the cities and states of places where my fellow Geographic Information Systems classmates have visited or lived and entered them into my excel spreadsheet. After doing this, I refreshed the Google Map web page, these are the current points that you see on the map on the right were mapped, and they correlate directly to the latitude and longitude or address columns on my Excel Spreadsheet.
The most unique part of my mapping project is that I made a dynamic map that used JavaScript coding to make a relationship between the Google Excel Spreadsheet and Google Map Website. Currently, dynamic mapping is not commonly used and if it is used it is not used to its full advantages. Dynamic mapping, similar to mapping on the fly, is important because as Yuan (2008) said, “when a GIS is able to capture and handle information about geographic dynamics, we are empowered to study the world not just spatially or temporally but holistically from a system’s perspective.” Dynamic mapping is at times difficult to achieve because of certain websites APIs or coding. With knowledge of coding and Google API anyone can manipulate the internet in ways that could benefit them greatly in life, especially with technology constantly growing. Geocoding, which I used in my project, is where a process that converts an address into a latitude and longitude automatically. To where on the Google Excel Spreadsheet instead of a latitude and longitude columns there could simply be address, city, and state columns. This makes the Google Excel format much easier for the average person to understand and use. With knowledge and experience with other APIs you could easily change the map into a different format.
In conclusion, the process of “mapping-on-the-fly” or dynamic mapping with Google Excel Spreadsheets is possible, and theoretically an easy process to perform. I performed this type of mapping by manipulating the webpage’s code with JavaScript coding and loops. Dynamic mapping is particularly convenient for groups or companies who want to be able to have a spreadsheet online that participants can enter names, addresses, and other simple information onto and when they refresh they receive a map that is automatically made. Geocoding can also be added to “mapping-on-the-fly” to make it more user-friendly. It would also be easy to switch to another data source, other than a Google Spreadsheet, which could open up other opportunities.
First and foremost I would like to thank Professor Winiski for always being willing to help and for believing that I could perform this project. Along with my fellow Geographic Information Systems classmates who were always ready to listen to my questions and would assist me whenever they could. I also would like to thank Codeacademy for their truly innovative idea of making coding easy to understand for everyone. Finally, I would like to thank the Earth and Environmental Science department at Furman University.
Boulos, M. N. K., “Web GIS in practice III: creating a simple interactive of England’s Strategic Health Authorities using Google Maps API, Google Earth KML, and MSN Virtual Earth Map Control”. 2005. International Journal of Health Geographics. 4:22. Herr, N., Rivas, M., Foley, B., Vandergon, V., Simila, G., d’Alessio, M., and Postma, H. 2011, Using Collaborative Web-Based Documents to Instantly Collect and Analyze Whole-Class Data”. Hawaii International Conference on Education. Lefer, T. B., Anderson, M. R., Fornari, A., Lambert, A., Fletcher, J., and Baquero, M. “Using Google Earth as an Innovative Tool for Community Mapping.” 2008. Public Health Reports. Pages 474-480. Yuan, May. “Dynamics GIS: Recognizing the Dynamic Nature of Reality”. 2008. ArcNews Online. http://www.esri.com/news/arcnews/spring08articles/dynamics-gis.html. Accessed October, 2013. Data is from Geographic Information Systems classmates.
III. Code Academy Before this project I did not know anything about the complex act of coding. Therefore, I went to Codeacademy online and completed their courses about JavaScript programming and JavaScript loops. Throughout this program I learned, in a general sense, how to build and manipulate a code. JavaScript is commonly known as an object-orientated computer programming language most often used to create interactive effects within web browsers. In Codeacademy I learned how to program with JavaScript through different hands-on lessons and activities. This skill was very important for my Geographic Information System project because my map’s information for the points come from a Google Excel Spreadsheet, which is connected to the web Google Map through JavaScript coding. The JavaScript coding allows my map to be automatically updated, with new information that I have put on the spreadsheet, when I refresh the webpage. This is also known as “mapping-on-the-fly”. Codeacademy and the JavaScript coding that I learned on the website was the key to making my project work.
Figure 3 - My Google Excel Spreadsheet which has the names, descriptions, latitudes, and longitudes, and addresses of Furman University and Clemson University and students from the Geographic Information Systems Fall 2013 class.
Figure 1 - A portion of the dynamic code used to connect the Google Excel Spreadsheet to the Google Earth Map, taken on Dreamweaver. Figure 5 - A map of the places that people in our Geographic Information Systems class have lived or visited which is connected to the Google Excel Spreadsheet through JavaScript coding.
Figure 4 - My typical work area with codes on the left, Google Excel Spreadsheet on the top right, and the dynamic map on the bottom right.
Figure 6 - An excerpt of the code which tells the code to grab my Google Spreadsheet and its information through the command callback=getData.
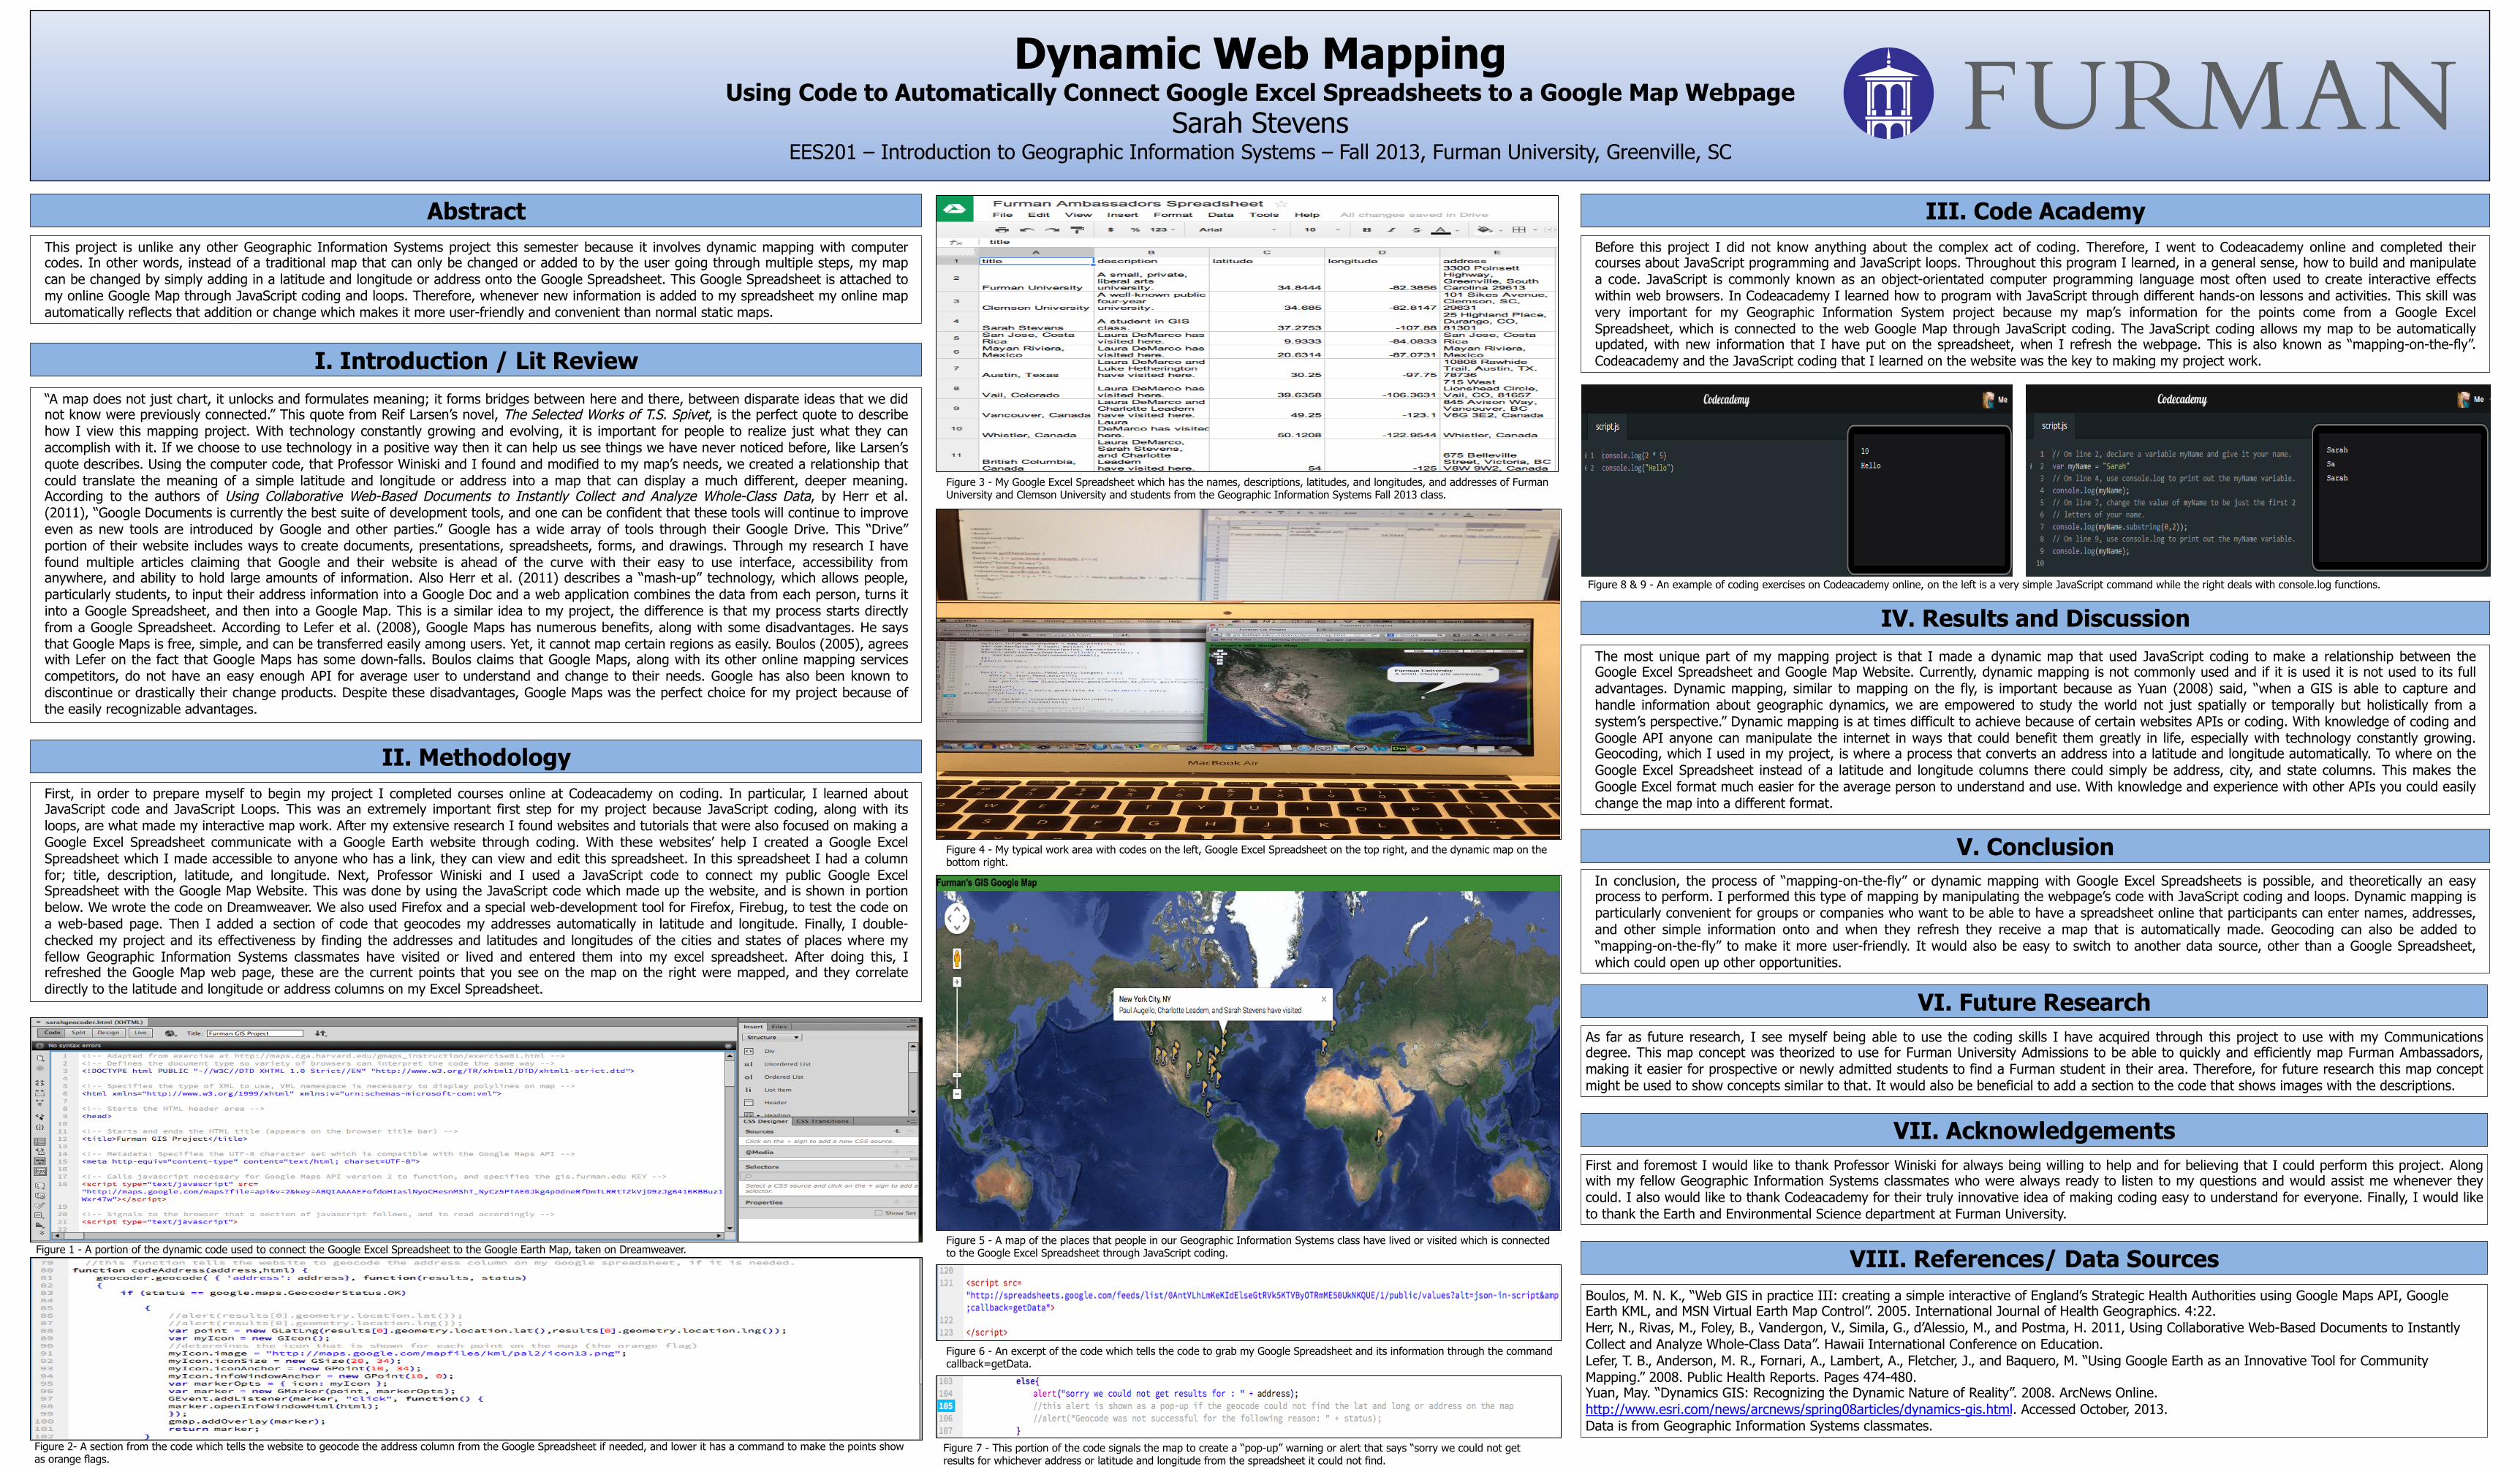
Figure 8 & 9 - An example of coding exercises on Codeacademy online, on the left is a very simple JavaScript command while the right deals with console.log functions.
Figure 7 - This portion of the code signals the map to create a “pop-up” warning or alert that says “sorry we could not get results for whichever address or latitude and longitude from the spreadsheet it could not find.
Figure 2- A section from the code which tells the website to geocode the address column from the Google Spreadsheet if needed, and lower it has a command to make the points show as orange flags.