Embed Size (px)
Citation preview
Dynamic Zoom-in Network for Fast Object Detection in Large Images
Mingfei Gao1 Ruichi Yu1 Ang Li2∗ Vlad I. Morariu3∗ Larry S. Davis11University of Maryland, College Park 2DeepMind 3Adobe Research
{mgao,richyu,lsd}@umiacs.umd.edu [email protected] [email protected]
Abstract
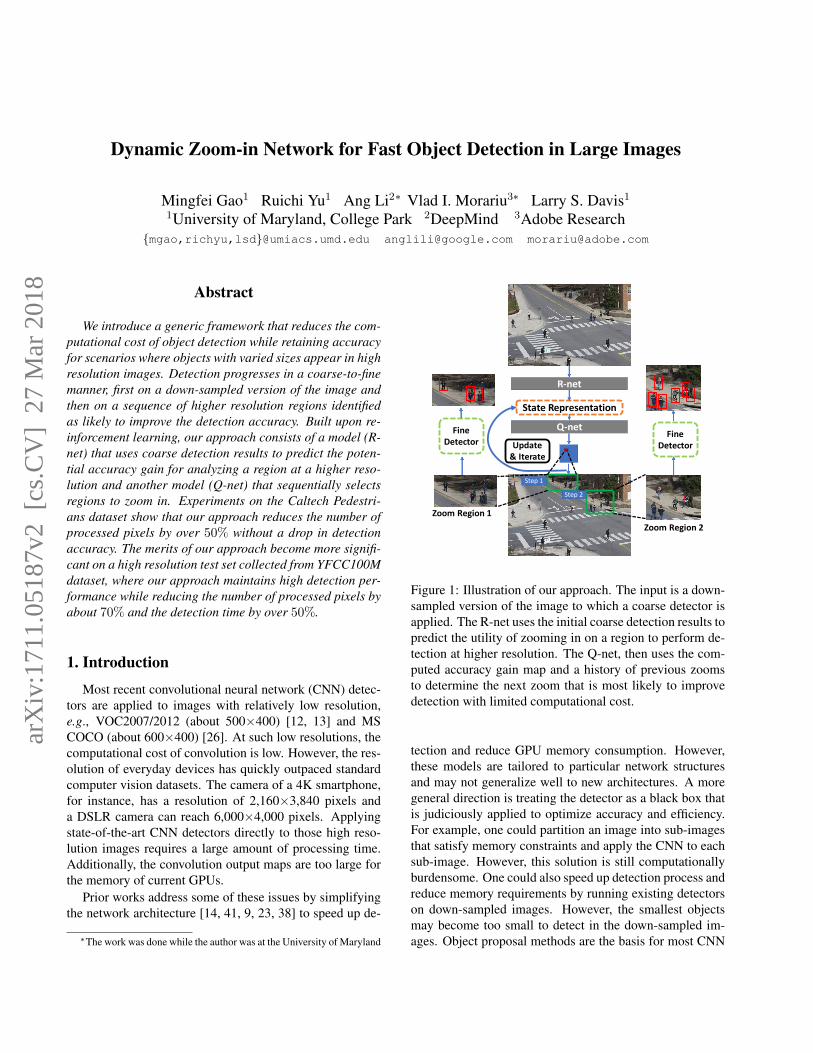
We introduce a generic framework that reduces the com-putational cost of object detection while retaining accuracyfor scenarios where objects with varied sizes appear in highresolution images. Detection progresses in a coarse-to-finemanner, first on a down-sampled version of the image andthen on a sequence of higher resolution regions identifiedas likely to improve the detection accuracy. Built upon re-inforcement learning, our approach consists of a model (R-net) that uses coarse detection results to predict the poten-tial accuracy gain for analyzing a region at a higher reso-lution and another model (Q-net) that sequentially selectsregions to zoom in. Experiments on the Caltech Pedestri-ans dataset show that our approach reduces the number ofprocessed pixels by over 50% without a drop in detectionaccuracy. The merits of our approach become more signifi-cant on a high resolution test set collected from YFCC100Mdataset, where our approach maintains high detection per-formance while reducing the number of processed pixels byabout 70% and the detection time by over 50%.
1. Introduction
Most recent convolutional neural network (CNN) detec-tors are applied to images with relatively low resolution,e.g., VOC2007/2012 (about 500×400) [12, 13] and MSCOCO (about 600×400) [26]. At such low resolutions, thecomputational cost of convolution is low. However, the res-olution of everyday devices has quickly outpaced standardcomputer vision datasets. The camera of a 4K smartphone,for instance, has a resolution of 2,160×3,840 pixels anda DSLR camera can reach 6,000×4,000 pixels. Applyingstate-of-the-art CNN detectors directly to those high reso-lution images requires a large amount of processing time.Additionally, the convolution output maps are too large forthe memory of current GPUs.
Prior works address some of these issues by simplifyingthe network architecture [14, 41, 9, 23, 38] to speed up de-
∗The work was done while the author was at the University of Maryland
StateRepresentation
R-net
Q-net
Update&Iterate
Step1
Step2
ZoomRegion1ZoomRegion2
FineDetector
FineDetector
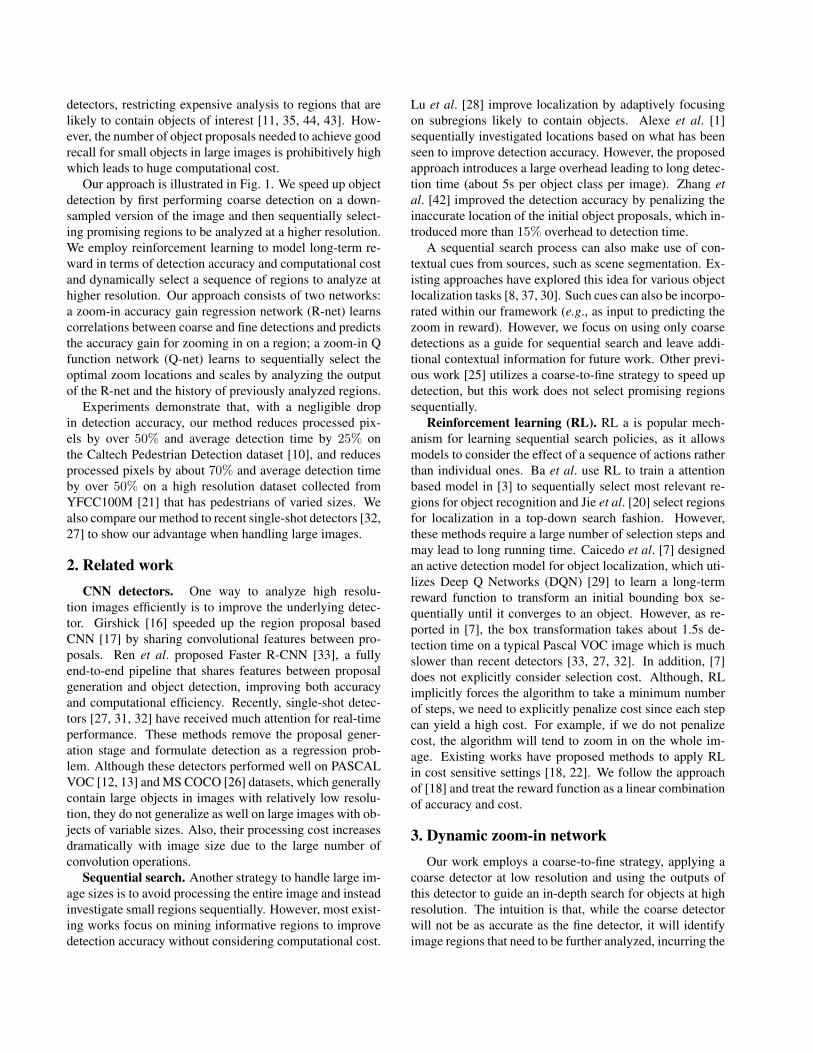
Figure 1: Illustration of our approach. The input is a down-sampled version of the image to which a coarse detector isapplied. The R-net uses the initial coarse detection results topredict the utility of zooming in on a region to perform de-tection at higher resolution. The Q-net, then uses the com-puted accuracy gain map and a history of previous zoomsto determine the next zoom that is most likely to improvedetection with limited computational cost.
tection and reduce GPU memory consumption. However,these models are tailored to particular network structuresand may not generalize well to new architectures. A moregeneral direction is treating the detector as a black box thatis judiciously applied to optimize accuracy and efficiency.For example, one could partition an image into sub-imagesthat satisfy memory constraints and apply the CNN to eachsub-image. However, this solution is still computationallyburdensome. One could also speed up detection process andreduce memory requirements by running existing detectorson down-sampled images. However, the smallest objectsmay become too small to detect in the down-sampled im-ages. Object proposal methods are the basis for most CNN
arX
iv:1
711.
0518
7v2
[cs
.CV
] 2
7 M
ar 2
018
detectors, restricting expensive analysis to regions that arelikely to contain objects of interest [11, 35, 44, 43]. How-ever, the number of object proposals needed to achieve goodrecall for small objects in large images is prohibitively highwhich leads to huge computational cost.
Our approach is illustrated in Fig. 1. We speed up objectdetection by first performing coarse detection on a down-sampled version of the image and then sequentially select-ing promising regions to be analyzed at a higher resolution.We employ reinforcement learning to model long-term re-ward in terms of detection accuracy and computational costand dynamically select a sequence of regions to analyze athigher resolution. Our approach consists of two networks:a zoom-in accuracy gain regression network (R-net) learnscorrelations between coarse and fine detections and predictsthe accuracy gain for zooming in on a region; a zoom-in Qfunction network (Q-net) learns to sequentially select theoptimal zoom locations and scales by analyzing the outputof the R-net and the history of previously analyzed regions.
Experiments demonstrate that, with a negligible dropin detection accuracy, our method reduces processed pix-els by over 50% and average detection time by 25% onthe Caltech Pedestrian Detection dataset [10], and reducesprocessed pixels by about 70% and average detection timeby over 50% on a high resolution dataset collected fromYFCC100M [21] that has pedestrians of varied sizes. Wealso compare our method to recent single-shot detectors [32,27] to show our advantage when handling large images.
2. Related workCNN detectors. One way to analyze high resolu-
tion images efficiently is to improve the underlying detec-tor. Girshick [16] speeded up the region proposal basedCNN [17] by sharing convolutional features between pro-posals. Ren et al. proposed Faster R-CNN [33], a fullyend-to-end pipeline that shares features between proposalgeneration and object detection, improving both accuracyand computational efficiency. Recently, single-shot detec-tors [27, 31, 32] have received much attention for real-timeperformance. These methods remove the proposal gener-ation stage and formulate detection as a regression prob-lem. Although these detectors performed well on PASCALVOC [12, 13] and MS COCO [26] datasets, which generallycontain large objects in images with relatively low resolu-tion, they do not generalize as well on large images with ob-jects of variable sizes. Also, their processing cost increasesdramatically with image size due to the large number ofconvolution operations.
Sequential search. Another strategy to handle large im-age sizes is to avoid processing the entire image and insteadinvestigate small regions sequentially. However, most exist-ing works focus on mining informative regions to improvedetection accuracy without considering computational cost.
Lu et al. [28] improve localization by adaptively focusingon subregions likely to contain objects. Alexe et al. [1]sequentially investigated locations based on what has beenseen to improve detection accuracy. However, the proposedapproach introduces a large overhead leading to long detec-tion time (about 5s per object class per image). Zhang etal. [42] improved the detection accuracy by penalizing theinaccurate location of the initial object proposals, which in-troduced more than 15% overhead to detection time.
A sequential search process can also make use of con-textual cues from sources, such as scene segmentation. Ex-isting approaches have explored this idea for various objectlocalization tasks [8, 37, 30]. Such cues can also be incorpo-rated within our framework (e.g., as input to predicting thezoom in reward). However, we focus on using only coarsedetections as a guide for sequential search and leave addi-tional contextual information for future work. Other previ-ous work [25] utilizes a coarse-to-fine strategy to speed updetection, but this work does not select promising regionssequentially.
Reinforcement learning (RL). RL a is popular mech-anism for learning sequential search policies, as it allowsmodels to consider the effect of a sequence of actions ratherthan individual ones. Ba et al. use RL to train a attentionbased model in [3] to sequentially select most relevant re-gions for object recognition and Jie et al. [20] select regionsfor localization in a top-down search fashion. However,these methods require a large number of selection steps andmay lead to long running time. Caicedo et al. [7] designedan active detection model for object localization, which uti-lizes Deep Q Networks (DQN) [29] to learn a long-termreward function to transform an initial bounding box se-quentially until it converges to an object. However, as re-ported in [7], the box transformation takes about 1.5s de-tection time on a typical Pascal VOC image which is muchslower than recent detectors [33, 27, 32]. In addition, [7]does not explicitly consider selection cost. Although, RLimplicitly forces the algorithm to take a minimum numberof steps, we need to explicitly penalize cost since each stepcan yield a high cost. For example, if we do not penalizecost, the algorithm will tend to zoom in on the whole im-age. Existing works have proposed methods to apply RLin cost sensitive settings [18, 22]. We follow the approachof [18] and treat the reward function as a linear combinationof accuracy and cost.
3. Dynamic zoom-in networkOur work employs a coarse-to-fine strategy, applying a
coarse detector at low resolution and using the outputs ofthis detector to guide an in-depth search for objects at highresolution. The intuition is that, while the coarse detectorwill not be as accurate as the fine detector, it will identifyimage regions that need to be further analyzed, incurring the
Coarsedetector CR LayerAGmap 0.5 0.3
0.7 0.1
0.6 0.5 -1
-1 -1
1.2 -1
0.3
-1
max
R-net Q-net Outputmaps Regionselectiondownsample/pooling
1×16×16:(16,16)
Conv64×3×3:(1,1)
Conv128×10×13:(5,6)
Conv1×3×3:(1,1)
Conv1×3×3:(1,1)Conv
128×15×20:(7,10)State
Downsampledimage
Update&Iterate
Runfinedetector
Zoom-inregion
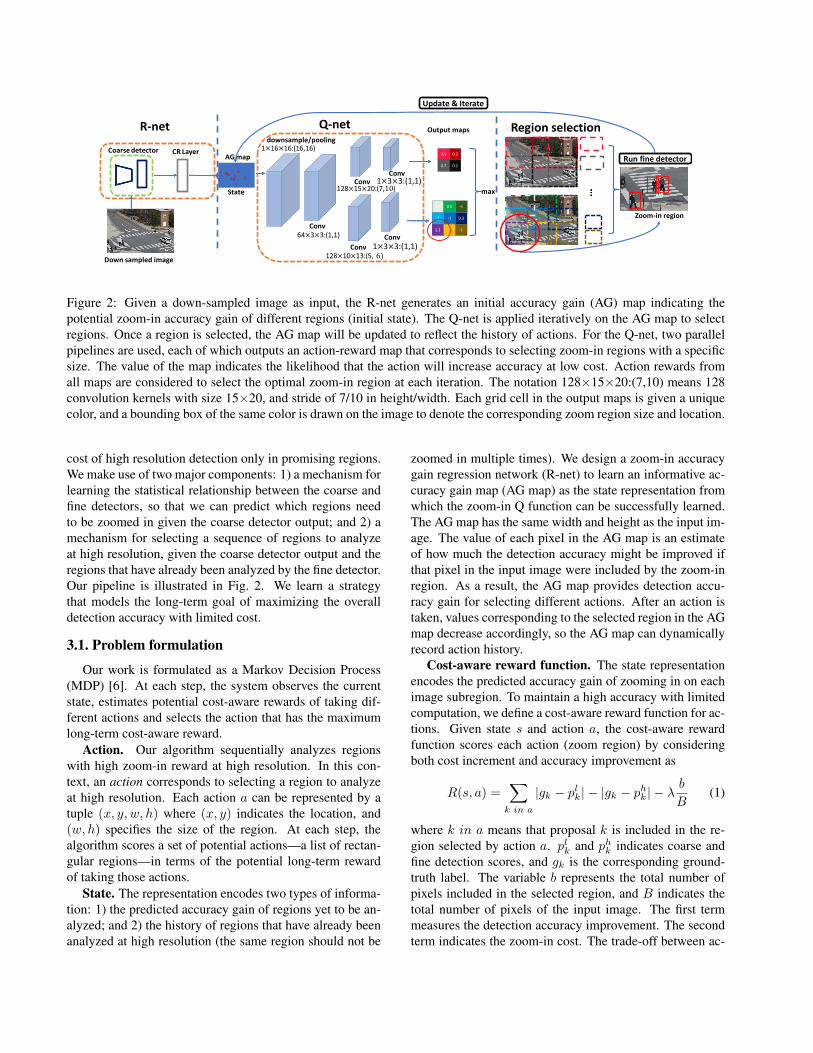
Figure 2: Given a down-sampled image as input, the R-net generates an initial accuracy gain (AG) map indicating thepotential zoom-in accuracy gain of different regions (initial state). The Q-net is applied iteratively on the AG map to selectregions. Once a region is selected, the AG map will be updated to reflect the history of actions. For the Q-net, two parallelpipelines are used, each of which outputs an action-reward map that corresponds to selecting zoom-in regions with a specificsize. The value of the map indicates the likelihood that the action will increase accuracy at low cost. Action rewards fromall maps are considered to select the optimal zoom-in region at each iteration. The notation 128×15×20:(7,10) means 128convolution kernels with size 15×20, and stride of 7/10 in height/width. Each grid cell in the output maps is given a uniquecolor, and a bounding box of the same color is drawn on the image to denote the corresponding zoom region size and location.
cost of high resolution detection only in promising regions.We make use of two major components: 1) a mechanism forlearning the statistical relationship between the coarse andfine detectors, so that we can predict which regions needto be zoomed in given the coarse detector output; and 2) amechanism for selecting a sequence of regions to analyzeat high resolution, given the coarse detector output and theregions that have already been analyzed by the fine detector.Our pipeline is illustrated in Fig. 2. We learn a strategythat models the long-term goal of maximizing the overalldetection accuracy with limited cost.
3.1. Problem formulation
Our work is formulated as a Markov Decision Process(MDP) [6]. At each step, the system observes the currentstate, estimates potential cost-aware rewards of taking dif-ferent actions and selects the action that has the maximumlong-term cost-aware reward.
Action. Our algorithm sequentially analyzes regionswith high zoom-in reward at high resolution. In this con-text, an action corresponds to selecting a region to analyzeat high resolution. Each action a can be represented by atuple (x, y, w, h) where (x, y) indicates the location, and(w, h) specifies the size of the region. At each step, thealgorithm scores a set of potential actions—a list of rectan-gular regions—in terms of the potential long-term rewardof taking those actions.
State. The representation encodes two types of informa-tion: 1) the predicted accuracy gain of regions yet to be an-alyzed; and 2) the history of regions that have already beenanalyzed at high resolution (the same region should not be
zoomed in multiple times). We design a zoom-in accuracygain regression network (R-net) to learn an informative ac-curacy gain map (AG map) as the state representation fromwhich the zoom-in Q function can be successfully learned.The AG map has the same width and height as the input im-age. The value of each pixel in the AG map is an estimateof how much the detection accuracy might be improved ifthat pixel in the input image were included by the zoom-inregion. As a result, the AG map provides detection accu-racy gain for selecting different actions. After an action istaken, values corresponding to the selected region in the AGmap decrease accordingly, so the AG map can dynamicallyrecord action history.
Cost-aware reward function. The state representationencodes the predicted accuracy gain of zooming in on eachimage subregion. To maintain a high accuracy with limitedcomputation, we define a cost-aware reward function for ac-tions. Given state s and action a, the cost-aware rewardfunction scores each action (zoom region) by consideringboth cost increment and accuracy improvement as
R(s, a) =∑
k in a
|gk − plk| − |gk − phk | − λb
B(1)
where k in a means that proposal k is included in the re-gion selected by action a. plk and phk indicates coarse andfine detection scores, and gk is the corresponding ground-truth label. The variable b represents the total number ofpixels included in the selected region, and B indicates thetotal number of pixels of the input image. The first termmeasures the detection accuracy improvement. The secondterm indicates the zoom-in cost. The trade-off between ac-
curacy and computation is controlled by the parameter λ.During training, the Q-net uses this reward function to cal-culate the immediate rewards of taking actions and learns along-term reward function by Q learning [36].
3.2. Zoom-in accuracy gain regression network
The zoom-in accuracy gain regression network (R-net)predicts the accuracy gain of zooming in on a particular re-gion based on the coarse detection results. The R-net istrained on pairs of coarse and fine detections so that it canobserve how they correlate with each other to learn a suit-able accuracy gain.
Toward this end, we apply two pre-trained detectorsto a set of training images and obtain two sets of imagedetection results: low-resolution detections {(dl
i, pli, f
li )}
in the down-sampled image and high-resolution detections{(dh
j , phj )} in the high resolution version of each image,
where d is the detection bounding box, p is the probabil-ity of being the target object and f indicates a feature vec-tor of the corresponding detection. We use the superscriptsh and l to indicate the high resolution and low resolution(down-sampled) images. For the model to learn whether ornot a high resolution detection improves the overall results,given a set of coarse detections at training time, we intro-duce a match layer which associates detections produced bythe two detectors. In this layer, we pair the coarse and finedetection proposals and generate a set of correspondencesbetween them. The object proposals i in the down-sampledimage and j in the high-resolution image are defined as cor-responding to each other if we find a j with sufficiently largeintersection over union IoU(dli, d
hj ) with i (IoU >0.5).
Given a set of correspondences, {(dlk, p
lk, p
hk , f
lk)}, we
estimate the zoom-in accuracy gain of a coarse detection.A detector can handle only objects within a range of sizes,so applying the detector to the high-resolution image doesnot always produce the best accuracy. For example, largerobjects might be detected with higher accuracy at lower res-olution if the detector was trained on mostly smaller objects.So, we measure which detection (coarse or fine) is closer togroundtruth using the metric |gk − plk| − |gk − phk | wheregk ∈ {0, 1} indicates the groundtruth label. When the highresolution score phk is closer to the groundtruth than the lowresolution score plk, the function indicates that this proposalis worth zooming in on. Otherwise, applying a detector onthe down-sampled image is likely to yield a higher accuracy,so we should avoid zooming in on this proposal. We use aCorrelation Regression (CR) layer to estimate the zoom-inaccuracy gain of proposal k such that
minW
(|gk − plk| − |gk − phk | − Φ(W, f lk))2 , (2)
where Φ represents the regression function and W indicatesthe parameters. The output of this layer is the estimated
accuracy gain. The CR layer contains two fully connectedlayers where the first layer has 4,096 units and the secondone has only one output unit.
The AG map can be generated given the learned accu-racy gain of each proposal. We assume that each pixel in-side a proposal bounding box has equal contribution to itsaccuracy gain. Consequently, the AG map is generated as
AG(x, y) =
{α
Φ(W,f lk)
bkif (x, y) in dl
k,
0 otherwise,(3)
where (x, y) in dlk means point (x, y) is inside the bound-
ing box dlk and bk denotes the number of pixels included in
dlk. α is a constant number. W denotes the estimated pa-
rameters of the CR layer. The AG map is used as the staterepresentation and it naturally contains the information ofcoarse detections’ qualities. After zooming in and perform-ing detection on a region, all the values inside the region areset 0 to prevent future zooming on the same region.
3.3. Zoom-in Q function learning network
The R-net provides information about which image re-gion is likely to be the most informative if it is inspectednext. Since the R-net is embedded within a sequential pro-cess, we use reinforcement learning to train a second net-work, the Q-net, to learn a long-term zoom-in reward func-tion. At each step, the system takes an action by consider-ing both immediate (Eq. 1) and future rewards. We formu-late our problem in a Q learning framework, which approx-imates the long-term reward function for actions by learn-ing a Q function. Based on the Bellman equation [5], theoptimal Q function, Q∗(s, a), obeys an important identity:given the current state, the optimal reward of taking an ac-tion equals the combination of its immediate reward and adiscounted optimal reward at the next state triggered by thisaction (4)
Q∗(s, a) = Es′ [R(s, a) + γmaxa′
Q∗(s′, a′)|s, a] (4)
where s is the state and a is an action. Following [29], welearn the Q function for candidate actions by minimizingthe loss function at the i-th iteration, i.e.,
Li =(R(s, a) + γmaxa′Q(s′, a′; θ−i )−Q(s, a; θi))
2 (5)
where θi and θ−i are parameters of the Q network and thoseneeded to calculate future reward at iteration i, respectively.
Eq. 5 implies that the optimal long-term reward can belearned iteratively if the immediate reward R(s, a) is pro-vided for a state-action pair. Since R(s, a) is a cost-awarereward, the Q-net learns a long-term cost-aware rewardfunction for the action set.
In practice, θ−i = θi−C where C is a constant parameter.γ is future reward discount factor. We choose C = 10 and
γ = 0.5 empirically in our experiments. We also adopt theε-greedy policy [34] at training to balance between explo-ration and exploitation. The ε setting is the same as in [7].
The structure of our Q-net is shown in Fig. 2. The in-put is the AG map and each pixel in the map measures thepredicted accuracy gain if the pixel at that location in theinput image is included in the zoom region. The output isa set of maps and each value of a map measures the long-term reward of taking the corresponding action (selectinga zoom region at a location with a specified size). To al-low the Q-net to choose zoomed-in regions with differentsizes, we use multiple pipelines, each of which outputs amap corresponding to zoomed-in regions of a specific size.These pipelines share the same features extracted from thestate representation. In the training phase, actions from allmaps are concatenated to produce a unified action set andtrained end-to-end together by minimizing the loss functionin Eq. 5 so that all actions values compete with each other.
After zooming in on a selected region, we get both coarseand fine detections on the region. We just replace the coarsedetections with fine ones in each zoom-in region.
Window selection refinement. The output of the Q-netcan be directly used as a zoom-in window. However, be-cause candidate zoom windows are sparsely sampled, thewindow can be adjusted slightly to increase the expected re-ward. The Refine module takes the Q-net output as a coarseselection and locally moves the window towards a better lo-cation, as measured by the accuracy gain map by
a = arg maxa∈A
∑(x,y) in a
AG(x, y) (6)
where a selects the refined window and A =(xq ± µx, yq ± µy, w, h) corresponds to the local refine-ment area controlled by parameter µ, where (xq, yq, w, h)indicates the output window of Q-net. We show aqualitative example of refinement in Fig. 3.
4. ExperimentsWe perform experiments on the Caltech Pedestrian De-
tection dataset (CPD) [10] and a Web Pedestrian dataset(WP) collected from YFCC100M [21]. Datasets like Pas-cal VOC [12] and MS COCO [26] are not chosen to vali-date our method, because they are not close to our scenario.In [12] and [26], there are generally very few objects perimage and most objects are large, which leads to 1) close-to-zero rewards for regions, since large objects are likelyto maintain high detection accuracy after reasonable downsampling; and, 2) large zoom-in windows in order to en-close large objects. Low region rewards discourage the win-dow selection process and large zoom-in windows producehigh cost, which make our method invalid.
Caltech Pedestrian Detection (CPD). There are dif-ferent settings according to different annotation types, i.e.
Overall, Near scale, Medium scale, No occlusion, Partialocclusion and Reasonable [10]. Similar to the Reasonablesetting, we only train and test on pedestrians at least 50 pix-els tall. We sparsely sample images (every 30 frames) fromthe training set. There are 4,321 images in the training setand 4,088 images in the test set. We rescale the images to600 pixels on the shorter side to form the high resolutionversion of image during both training and testing. All ofour model components are trained on this training set.
Web Pedestrian (WP) dataset. The image resolutionin the CPD dataset is low (640×480). To better demon-strate our approach, we collect 100 test images with muchhigher resolution from the YFCC100M [21] dataset. Theimages are collected by searching for keywords ”Pedes-trian”, ”Campus” and ”Plaza”. An example is shown inFig. 4 where pedestrians have varied sizes and are denselydistributed in the images. For this dataset, we annotate allthe pedestrians with at least 16-pixel width and less than50% occlusion. Images are rescaled to 2,000 pixels on thelonger side to fit for our GPU memory.
4.1. Baseline methods
We compare to the following baseline algorithms:Fine-detection-all. This baseline directly applies the
fine detector to the high resolution version of image. Thismethod leads to high detection accuracy with high compu-tational cost. All of the other approaches seek to maintainthis detection accuracy with less computation.
Coarse-detection-all. This baseline applies the coarsedetector on down-sampled images with no zooming.
GS+Rnet. Given the initial state representation gener-ated by the R-net, we use a greedy search strategy (GS) todensely search for the best window every time based on thecurrent state without considering the long-term reward.
ER+Qnet. The entropy of the detector output (objectvs no object) is another way to measure the quality of acoarse detection. [2] used entropy to measure the qualityof a region for a classification task. Higher entropy implieslower quality of a coarse detection. So, if we ignore thecorrelation between fine and coarse detections, the accuracygain of a region can also be computed as
− plilog(pli)− (1− pli)log(1− pli) (7)
where pl indicates the score of the coarse detection. Forfair comparison, we fix all parameters of the pipeline exceptreplacing the R-net output of a proposal with its entropy.
SSD and YOLOv2. We also compare our method withoff-the-shelf SSD [27] and YOLOv2 [32] trained on CPD,to show the advantage of our method on large images.
4.2. Variants of our framework
We use Qnet-CNN to represent the Q-net developed us-ing a fully convolutional network (see Fig. 2). To ana-
Before refinement After refinement
Step1Step1
Step2Step2
Step3Step3
Step1Step1 Step2Step2
Step3Step3
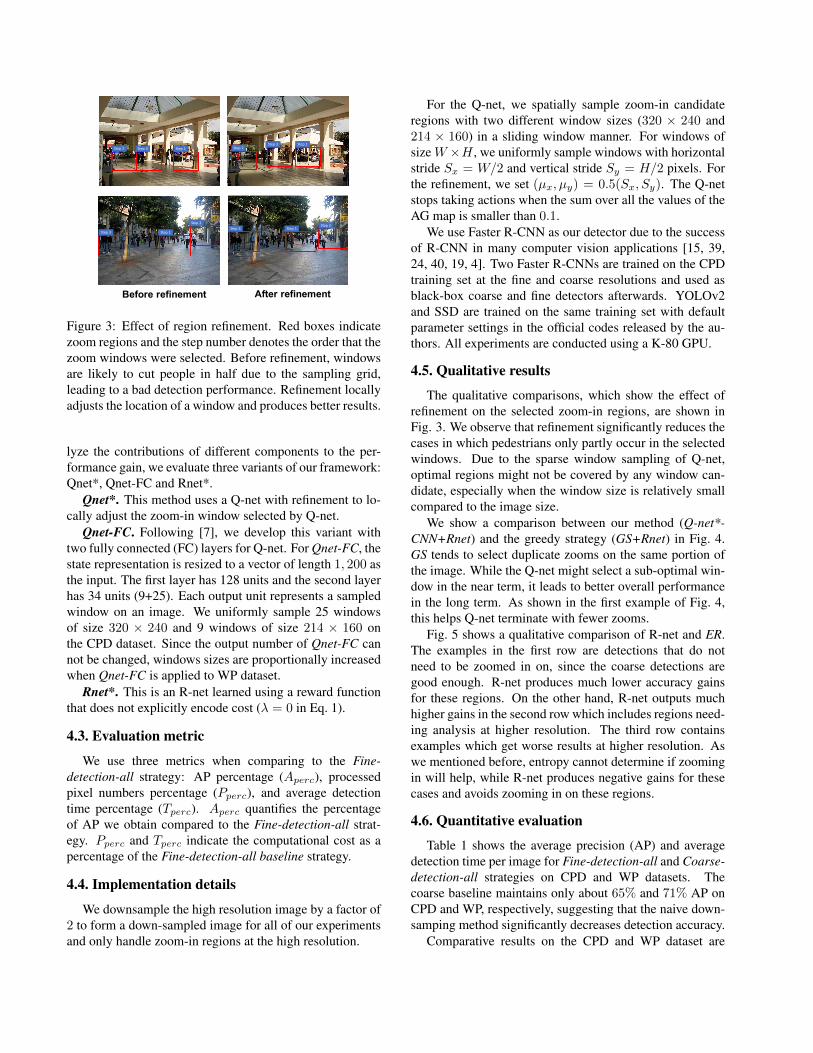
Figure 3: Effect of region refinement. Red boxes indicatezoom regions and the step number denotes the order that thezoom windows were selected. Before refinement, windowsare likely to cut people in half due to the sampling grid,leading to a bad detection performance. Refinement locallyadjusts the location of a window and produces better results.
lyze the contributions of different components to the per-formance gain, we evaluate three variants of our framework:Qnet*, Qnet-FC and Rnet*.
Qnet*. This method uses a Q-net with refinement to lo-cally adjust the zoom-in window selected by Q-net.
Qnet-FC. Following [7], we develop this variant withtwo fully connected (FC) layers for Q-net. For Qnet-FC, thestate representation is resized to a vector of length 1, 200 asthe input. The first layer has 128 units and the second layerhas 34 units (9+25). Each output unit represents a sampledwindow on an image. We uniformly sample 25 windowsof size 320 × 240 and 9 windows of size 214 × 160 onthe CPD dataset. Since the output number of Qnet-FC cannot be changed, windows sizes are proportionally increasedwhen Qnet-FC is applied to WP dataset.
Rnet*. This is an R-net learned using a reward functionthat does not explicitly encode cost (λ = 0 in Eq. 1).
4.3. Evaluation metric
We use three metrics when comparing to the Fine-detection-all strategy: AP percentage (Aperc), processedpixel numbers percentage (Pperc), and average detectiontime percentage (Tperc). Aperc quantifies the percentageof AP we obtain compared to the Fine-detection-all strat-egy. Pperc and Tperc indicate the computational cost as apercentage of the Fine-detection-all baseline strategy.
4.4. Implementation details
We downsample the high resolution image by a factor of2 to form a down-sampled image for all of our experimentsand only handle zoom-in regions at the high resolution.
For the Q-net, we spatially sample zoom-in candidateregions with two different window sizes (320 × 240 and214 × 160) in a sliding window manner. For windows ofsizeW ×H , we uniformly sample windows with horizontalstride Sx = W/2 and vertical stride Sy = H/2 pixels. Forthe refinement, we set (µx, µy) = 0.5(Sx, Sy). The Q-netstops taking actions when the sum over all the values of theAG map is smaller than 0.1.
We use Faster R-CNN as our detector due to the successof R-CNN in many computer vision applications [15, 39,24, 40, 19, 4]. Two Faster R-CNNs are trained on the CPDtraining set at the fine and coarse resolutions and used asblack-box coarse and fine detectors afterwards. YOLOv2and SSD are trained on the same training set with defaultparameter settings in the official codes released by the au-thors. All experiments are conducted using a K-80 GPU.
4.5. Qualitative results
The qualitative comparisons, which show the effect ofrefinement on the selected zoom-in regions, are shown inFig. 3. We observe that refinement significantly reduces thecases in which pedestrians only partly occur in the selectedwindows. Due to the sparse window sampling of Q-net,optimal regions might not be covered by any window can-didate, especially when the window size is relatively smallcompared to the image size.
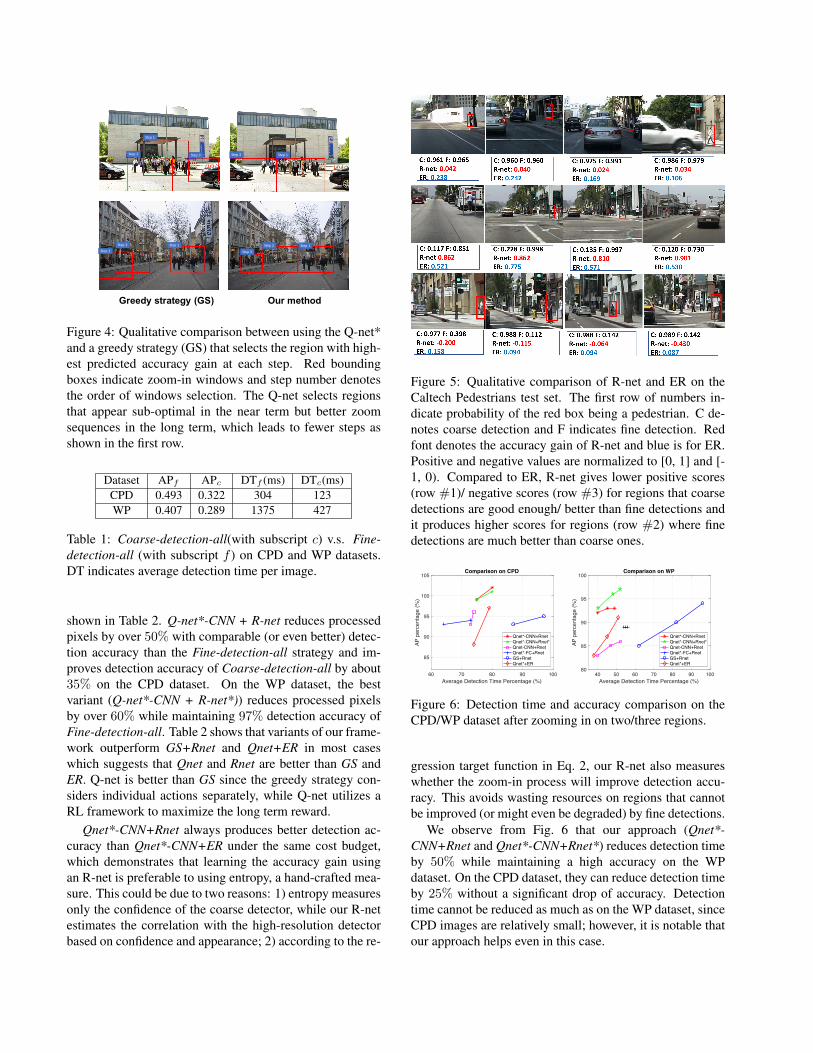
We show a comparison between our method (Q-net*-CNN+Rnet) and the greedy strategy (GS+Rnet) in Fig. 4.GS tends to select duplicate zooms on the same portion ofthe image. While the Q-net might select a sub-optimal win-dow in the near term, it leads to better overall performancein the long term. As shown in the first example of Fig. 4,this helps Q-net terminate with fewer zooms.
Fig. 5 shows a qualitative comparison of R-net and ER.The examples in the first row are detections that do notneed to be zoomed in on, since the coarse detections aregood enough. R-net produces much lower accuracy gainsfor these regions. On the other hand, R-net outputs muchhigher gains in the second row which includes regions need-ing analysis at higher resolution. The third row containsexamples which get worse results at higher resolution. Aswe mentioned before, entropy cannot determine if zoomingin will help, while R-net produces negative gains for thesecases and avoids zooming in on these regions.
4.6. Quantitative evaluation
Table 1 shows the average precision (AP) and averagedetection time per image for Fine-detection-all and Coarse-detection-all strategies on CPD and WP datasets. Thecoarse baseline maintains only about 65% and 71% AP onCPD and WP, respectively, suggesting that the naive down-samping method significantly decreases detection accuracy.
Comparative results on the CPD and WP dataset are
Our methodGreedy strategy (GS)
Step1Step2
Step3 Step1Step2
Step3
Step1Step2
Step1
Step2 Step3
Figure 4: Qualitative comparison between using the Q-net*and a greedy strategy (GS) that selects the region with high-est predicted accuracy gain at each step. Red boundingboxes indicate zoom-in windows and step number denotesthe order of windows selection. The Q-net selects regionsthat appear sub-optimal in the near term but better zoomsequences in the long term, which leads to fewer steps asshown in the first row.
Dataset APf APc DTf (ms) DTc(ms)CPD 0.493 0.322 304 123WP 0.407 0.289 1375 427
Table 1: Coarse-detection-all(with subscript c) v.s. Fine-detection-all (with subscript f ) on CPD and WP datasets.DT indicates average detection time per image.
shown in Table 2. Q-net*-CNN + R-net reduces processedpixels by over 50% with comparable (or even better) detec-tion accuracy than the Fine-detection-all strategy and im-proves detection accuracy of Coarse-detection-all by about35% on the CPD dataset. On the WP dataset, the bestvariant (Q-net*-CNN + R-net*)) reduces processed pixelsby over 60% while maintaining 97% detection accuracy ofFine-detection-all. Table 2 shows that variants of our frame-work outperform GS+Rnet and Qnet+ER in most caseswhich suggests that Qnet and Rnet are better than GS andER. Q-net is better than GS since the greedy strategy con-siders individual actions separately, while Q-net utilizes aRL framework to maximize the long term reward.
Qnet*-CNN+Rnet always produces better detection ac-curacy than Qnet*-CNN+ER under the same cost budget,which demonstrates that learning the accuracy gain usingan R-net is preferable to using entropy, a hand-crafted mea-sure. This could be due to two reasons: 1) entropy measuresonly the confidence of the coarse detector, while our R-netestimates the correlation with the high-resolution detectorbased on confidence and appearance; 2) according to the re-
Figure 5: Qualitative comparison of R-net and ER on theCaltech Pedestrians test set. The first row of numbers in-dicate probability of the red box being a pedestrian. C de-notes coarse detection and F indicates fine detection. Redfont denotes the accuracy gain of R-net and blue is for ER.Positive and negative values are normalized to [0, 1] and [-1, 0). Compared to ER, R-net gives lower positive scores(row #1)/ negative scores (row #3) for regions that coarsedetections are good enough/ better than fine detections andit produces higher scores for regions (row #2) where finedetections are much better than coarse ones.
40 50 60 70 80 90 100Average Detection Time Percentage (%)
80
85
90
95
100AP
per
cent
age
(%)
Comparison on WP
Qnet*-CNN+RnetQnet*-CNN+Rnet*Qnet-CNN+RnetQnet*-FC+RnetGS+RnetQnet*+ER
60 70 80 90 100Average Detection Time Percentage (%)
85
90
95
100
105
AP p
erce
ntag
e (%
)
Comparison on CPD
Qnet*-CNN+RnetQnet*-CNN+Rnet*Qnet-CNN+RnetQnet*-FC+RnetGS+RnetQnet*+ER
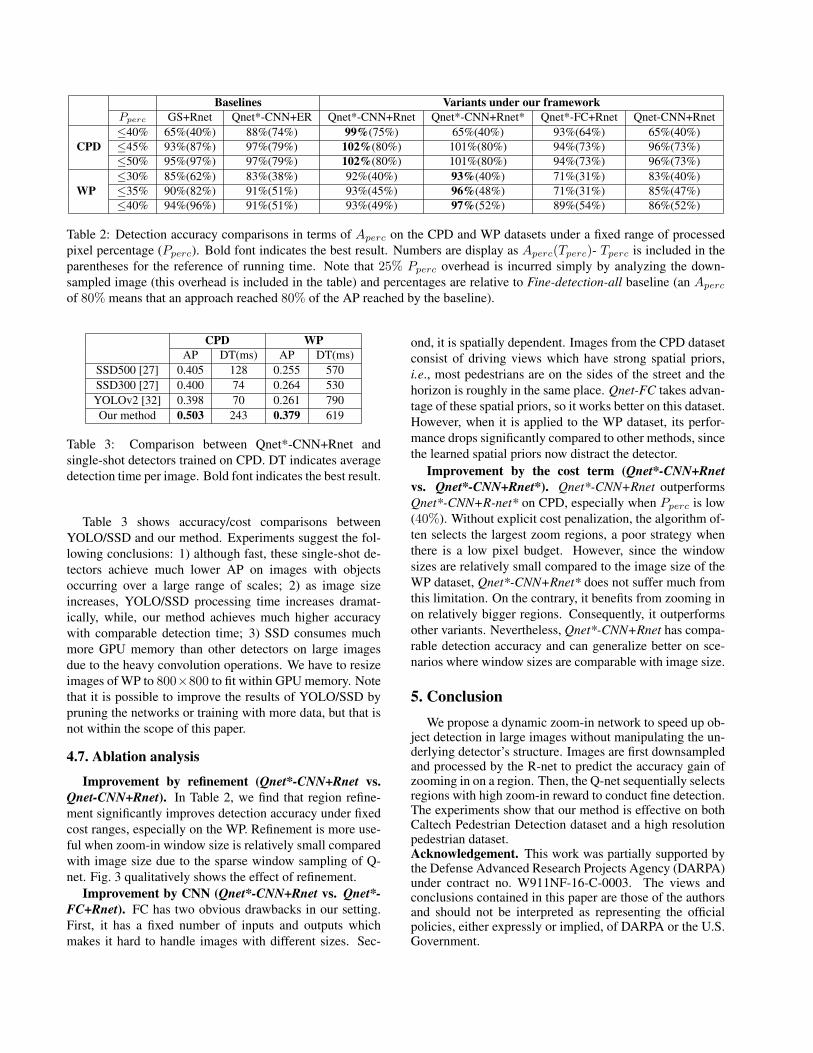
Figure 6: Detection time and accuracy comparison on theCPD/WP dataset after zooming in on two/three regions.
gression target function in Eq. 2, our R-net also measureswhether the zoom-in process will improve detection accu-racy. This avoids wasting resources on regions that cannotbe improved (or might even be degraded) by fine detections.
We observe from Fig. 6 that our approach (Qnet*-CNN+Rnet and Qnet*-CNN+Rnet*) reduces detection timeby 50% while maintaining a high accuracy on the WPdataset. On the CPD dataset, they can reduce detection timeby 25% without a significant drop of accuracy. Detectiontime cannot be reduced as much as on the WP dataset, sinceCPD images are relatively small; however, it is notable thatour approach helps even in this case.
Baselines Variants under our frameworkPperc GS+Rnet Qnet*-CNN+ER Qnet*-CNN+Rnet Qnet*-CNN+Rnet* Qnet*-FC+Rnet Qnet-CNN+Rnet
CPD≤40% 65%(40%) 88%(74%) 99%(75%) 65%(40%) 93%(64%) 65%(40%)≤45% 93%(87%) 97%(79%) 102%(80%) 101%(80%) 94%(73%) 96%(73%)≤50% 95%(97%) 97%(79%) 102%(80%) 101%(80%) 94%(73%) 96%(73%)
WP≤30% 85%(62%) 83%(38%) 92%(40%) 93%(40%) 71%(31%) 83%(40%)≤35% 90%(82%) 91%(51%) 93%(45%) 96%(48%) 71%(31%) 85%(47%)≤40% 94%(96%) 91%(51%) 93%(49%) 97%(52%) 89%(54%) 86%(52%)
Table 2: Detection accuracy comparisons in terms of Aperc on the CPD and WP datasets under a fixed range of processedpixel percentage (Pperc). Bold font indicates the best result. Numbers are display as Aperc(Tperc)- Tperc is included in theparentheses for the reference of running time. Note that 25% Pperc overhead is incurred simply by analyzing the down-sampled image (this overhead is included in the table) and percentages are relative to Fine-detection-all baseline (an Aperc
of 80% means that an approach reached 80% of the AP reached by the baseline).
CPD WPAP DT(ms) AP DT(ms)
SSD500 [27] 0.405 128 0.255 570SSD300 [27] 0.400 74 0.264 530YOLOv2 [32] 0.398 70 0.261 790Our method 0.503 243 0.379 619
Table 3: Comparison between Qnet*-CNN+Rnet andsingle-shot detectors trained on CPD. DT indicates averagedetection time per image. Bold font indicates the best result.
Table 3 shows accuracy/cost comparisons betweenYOLO/SSD and our method. Experiments suggest the fol-lowing conclusions: 1) although fast, these single-shot de-tectors achieve much lower AP on images with objectsoccurring over a large range of scales; 2) as image sizeincreases, YOLO/SSD processing time increases dramat-ically, while, our method achieves much higher accuracywith comparable detection time; 3) SSD consumes muchmore GPU memory than other detectors on large imagesdue to the heavy convolution operations. We have to resizeimages of WP to 800×800 to fit within GPU memory. Notethat it is possible to improve the results of YOLO/SSD bypruning the networks or training with more data, but that isnot within the scope of this paper.
4.7. Ablation analysis
Improvement by refinement (Qnet*-CNN+Rnet vs.Qnet-CNN+Rnet). In Table 2, we find that region refine-ment significantly improves detection accuracy under fixedcost ranges, especially on the WP. Refinement is more use-ful when zoom-in window size is relatively small comparedwith image size due to the sparse window sampling of Q-net. Fig. 3 qualitatively shows the effect of refinement.
Improvement by CNN (Qnet*-CNN+Rnet vs. Qnet*-FC+Rnet). FC has two obvious drawbacks in our setting.First, it has a fixed number of inputs and outputs whichmakes it hard to handle images with different sizes. Sec-
ond, it is spatially dependent. Images from the CPD datasetconsist of driving views which have strong spatial priors,i.e., most pedestrians are on the sides of the street and thehorizon is roughly in the same place. Qnet-FC takes advan-tage of these spatial priors, so it works better on this dataset.However, when it is applied to the WP dataset, its perfor-mance drops significantly compared to other methods, sincethe learned spatial priors now distract the detector.
Improvement by the cost term (Qnet*-CNN+Rnetvs. Qnet*-CNN+Rnet*). Qnet*-CNN+Rnet outperformsQnet*-CNN+R-net* on CPD, especially when Pperc is low(40%). Without explicit cost penalization, the algorithm of-ten selects the largest zoom regions, a poor strategy whenthere is a low pixel budget. However, since the windowsizes are relatively small compared to the image size of theWP dataset, Qnet*-CNN+Rnet* does not suffer much fromthis limitation. On the contrary, it benefits from zooming inon relatively bigger regions. Consequently, it outperformsother variants. Nevertheless, Qnet*-CNN+Rnet has compa-rable detection accuracy and can generalize better on sce-narios where window sizes are comparable with image size.
5. ConclusionWe propose a dynamic zoom-in network to speed up ob-
ject detection in large images without manipulating the un-derlying detector’s structure. Images are first downsampledand processed by the R-net to predict the accuracy gain ofzooming in on a region. Then, the Q-net sequentially selectsregions with high zoom-in reward to conduct fine detection.The experiments show that our method is effective on bothCaltech Pedestrian Detection dataset and a high resolutionpedestrian dataset.Acknowledgement. This work was partially supported bythe Defense Advanced Research Projects Agency (DARPA)under contract no. W911NF-16-C-0003. The views andconclusions contained in this paper are those of the authorsand should not be interpreted as representing the officialpolicies, either expressly or implied, of DARPA or the U.S.Government.

References[1] B. Alexe, N. Heess, Y. W. Teh, and V. Ferrari. Searching for
objects driven by context. In Advances in Neural InformationProcessing Systems, pages 881–889, 2012.
[2] A. Almahairi, N. Ballas, T. Cooijmans, Y. Zheng,H. Larochelle, and A. Courville. Dynamic capacity net-works. In International Conference on Machine Learning,pages 2549–2558, 2016.
[3] J. Ba, V. Mnih, and K. Kavukcuoglu. Multiple object recog-nition with visual attention. arXiv preprint arXiv:1412.7755,2014.
[4] S. Bell, C. L. Zitnick, K. Bala, and R. B. Girshick. Inside-outside net: Detecting objects in context with skip pool-ing and recurrent neural networks. CoRR, abs/1512.04143,2015.
[5] R. Bellman. Dynamic programming and lagrange multi-pliers. Proceedings of the National Academy of Sciences,42(10):767–769, 1956.
[6] R. Bellman. A markovian decision process. Indiana Univ.Math. J., 6:679–684, 1957.
[7] J. C. Caicedo and S. Lazebnik. Active object localizationwith deep reinforcement learning. In Proceedings of theIEEE International Conference on Computer Vision, pages2488–2496, 2015.
[8] X. S. Chen, H. He, and L. S. Davis. Object detection in 20questions. In Applications of Computer Vision (WACV), 2016IEEE Winter Conference on, pages 1–9. IEEE, 2016.
[9] E. L. Denton, W. Zaremba, J. Bruna, Y. Lecun, and R. Fer-gus. Exploiting linear structure within convolutional net-works for efficient evaluation. In Advances in Neural In-formation Processing Systems 27, pages 1269–1277. CurranAssociates, Inc., 2014.
[10] P. Dollar, C. Wojek, B. Schiele, and P. Perona. Pedes-trian detection: An evaluation of the state of the art. IEEEtransactions on pattern analysis and machine intelligence,34(4):743–761, 2012.
[11] I. Endres and D. Hoiem. Category independent object pro-posals. In European Conference on Computer Vision, pages575–588. Springer, 2010.
[12] M. Everingham, L. Van Gool, C. K. I. Williams, J. Winn,and A. Zisserman. The PASCAL Visual Object ClassesChallenge 2007 (VOC2007) Results. http://www.pascal-network.org/challenges/VOC/voc2007/workshop/index.html.
[13] M. Everingham, L. Van Gool, C. K. I. Williams, J. Winn,and A. Zisserman. The PASCAL Visual Object ClassesChallenge 2012 (VOC2012) Results. http://www.pascal-network.org/challenges/VOC/voc2012/workshop/index.html.
[14] M. Figurnov, D. P. Vetrov, and P. Kohli. Perforatedcnns:Acceleration through elimination of redundant convolutions.CoRR, abs/1504.08362, 2015.
[15] M. Gao, A. Li, R. Yu, V. I. Morariu, and L. S. Davis. C-wsl:Count-guided weakly supervised localization. arXiv preprintarXiv:1711.05282, 2017.
[16] R. Girshick. Fast r-cnn. In Proceedings of the IEEE Inter-national Conference on Computer Vision, pages 1440–1448,2015.
[17] R. Girshick, J. Donahue, T. Darrell, and J. Malik. Rich fea-ture hierarchies for accurate object detection and semanticsegmentation. In Computer Vision and Pattern Recognition,2014.
[18] H. He, H. Daume III, and J. Eisner. Cost-sensitive dynamicfeature selection. In ICML Inferning Workshop, 2012.
[19] K. He, G. Gkioxari, P. Dollar, and R. B. Girshick. MaskR-CNN. CoRR, abs/1703.06870, 2017.
[20] Z. Jie, X. Liang, J. Feng, X. Jin, W. Lu, and S. Yan. Tree-structured reinforcement learning for sequential object local-ization. In Advances in Neural Information Processing Sys-tems, pages 127–135, 2016.
[21] S. Kalkowski, C. Schulze, A. Dengel, and D. Borth. Real-time analysis and visualization of the yfcc100m dataset.In Proceedings of the 2015 Workshop on Community-Organized Multimodal Mining: Opportunities for Novel So-lutions, pages 25–30. ACM, 2015.
[22] S. Karayev, M. Fritz, and T. Darrell. Anytime recognitionof objects and scenes. In Proceedings of the IEEE Con-ference on Computer Vision and Pattern Recognition, pages572–579, 2014.
[23] Y. Kim, E. Park, S. Yoo, T. Choi, L. Yang, and D. Shin.Compression of deep convolutional neural networks for fastand low power mobile applications. CoRR, abs/1511.06530,2015.
[24] A. Li, J. Sun, J. Y.-H. Ng, R. Yu, V. I. Morariu, and L. S.Davis. Generating holistic 3d scene abstractions for text-based image retrieval. IEEE Conference on Computer Visionand Pattern Recognition (CVPR), 2017.
[25] H. Li, Z. Lin, X. Shen, J. Brandt, and G. Hua. A convolu-tional neural network cascade for face detection. In Proceed-ings of the IEEE Conference on Computer Vision and PatternRecognition, pages 5325–5334, 2015.
[26] T.-Y. Lin, M. Maire, S. Belongie, J. Hays, P. Perona, D. Ra-manan, P. Dollar, and C. L. Zitnick. Microsoft coco: Com-mon objects in context. In European conference on computervision, pages 740–755. Springer, 2014.
[27] W. Liu, D. Anguelov, D. Erhan, C. Szegedy, S. Reed, C.-Y.Fu, and A. C. Berg. SSD: Single shot multibox detector. InECCV, 2016.
[28] Y. Lu, T. Javidi, and S. Lazebnik. Adaptive object detec-tion using adjacency and zoom prediction. arXiv preprintarXiv:1512.07711, 2015.
[29] V. Mnih, K. Kavukcuoglu, D. Silver, A. A. Rusu, J. Veness,M. G. Bellemare, A. Graves, M. Riedmiller, A. K. Fidjeland,G. Ostrovski, et al. Human-level control through deep rein-forcement learning. Nature, 518(7540):529–533, 2015.
[30] R. Mottaghi, X. Chen, X. Liu, N.-G. Cho, S.-W. Lee, S. Fi-dler, R. Urtasun, and A. Yuille. The role of context for objectdetection and semantic segmentation in the wild. In Proceed-ings of the IEEE Conference on Computer Vision and PatternRecognition, pages 891–898, 2014.
[31] J. Redmon, S. Divvala, R. Girshick, and A. Farhadi. Youonly look once: Unified, real-time object detection. In Pro-ceedings of the IEEE Conference on Computer Vision andPattern Recognition, pages 779–788, 2016.
[32] J. Redmon and A. Farhadi. Yolo9000: Better, faster, stronger.arXiv preprint arXiv:1612.08242, 2016.
[33] S. Ren, K. He, R. Girshick, and J. Sun. Faster r-cnn: Towardsreal-time object detection with region proposal networks. InAdvances in neural information processing systems, pages91–99, 2015.
[34] R. S. Sutton and A. G. Barto. Reinforcement learning: Anintroduction, volume 1. MIT press Cambridge, 1998.
[35] J. R. Uijlings, K. E. Van De Sande, T. Gevers, and A. W.Smeulders. Selective search for object recognition. Interna-tional journal of computer vision, 104(2):154–171, 2013.
[36] C. J. Watkins and P. Dayan. Q-learning. Machine learning,8(3-4):279–292, 1992.
[37] R. Yu, X. Chen, V. I. Morariu, and L. S. Davis. The roleof context selection in object detection. In British MachineVision Conference (BMVC), 2016.
[38] R. Yu, A. Li, C.-F. Chen, J.-H. Lai, V. I. Morariu, X. Han,M. Gao, C.-Y. Lin, and L. S. Davis. Nisp: Pruning networksusing neuron importance score propagation. arXiv preprintarXiv:1711.05908, 2017.
[39] R. Yu, A. Li, V. I. Morariu, and L. S. Davis. Visual relation-ship detection with internal and external linguistic knowl-edge distillation. IEEE International Conference on Com-puter Vision (ICCV), 2017.
[40] R. Yu, H. Wang, and L. S. Davis. Remotenet: Efficient rel-evant motion event detection for large-scale home surveil-lance videos. IEEE Winter Conference on Applications ofComputer Vision (WACV), 2018.
[41] X. Zhang, J. Zou, X. Ming, K. He, and J. Sun. Efficientand accurate approximations of nonlinear convolutional net-works. In The IEEE Conference on Computer Vision andPattern Recognition (CVPR), June 2015.
[42] Y. Zhang, K. Sohn, R. Villegas, G. Pan, and H. Lee. Im-proving object detection with deep convolutional networksvia bayesian optimization and structured prediction. In Pro-ceedings of the IEEE Conference on Computer Vision andPattern Recognition, pages 249–258, 2015.
[43] Z. Zhang, Y. Liu, T. Bolukbasi, M.-M. Cheng, andV. Saligrama. Bing++: A fast high quality object proposalgenerator at 100fps. arXiv preprint arXiv:1511.04511, 2015.
[44] C. L. Zitnick and P. Dollar. Edge boxes: Locating objectproposals from edges. In European Conference on ComputerVision, pages 391–405. Springer, 2014.