Embed Size (px)
Citation preview
Dynamical Characterization of a Cellulose Acetate Polysaccharide
Miriam Sousa,† Ana Rita Bras,† Helena Isabel M. Veiga,‡ Frederico Castelo Ferreira,§
Maria Norberta de Pinho,| Natalia T. Correia,† and Madalena Dionısio*,†
REQUIMTE, Departamento de Quımica, Faculdade de Ciencias e Tecnologia, UniVersidade NoVa de Lisboa,2829-516 Caparica, Portugal, Instituto de Tecnologia Quımica e Biologica, UniVersidade NoVa de Lisboa, AV.Republica, Apart. 127, 2780-901 Oeiras, Portugal, IBB-Institute for Biotechnology and Bioengineering, Centrefor Biological and Chemical Engineering, Instituto Superior Tecnico, AV. RoVisco Pais, 1049-001 Lisboa,Portugal, and UniVersidade Tecnica de Lisboa, Instituto Superior Tecnico, ICEMS/DQEB,1049-001 Lisboa, Portugal
ReceiVed: February 24, 2010; ReVised Manuscript ReceiVed: June 21, 2010
This work brings together dynamical and structural information at a molecular level for cellulose acetatebeing an original contribution to the general description of polysaccharide properties. In particular, it allowedreinterpreting the secondary relaxation mechanisms that are still controversial in the literature; a compilationof data provided by different authors is provided. Detailed dynamical information is provided by dielectricrelaxation spectroscopy (DRS) (10-1-106 Hz) for cellulose acetate (CA) in the sub-Tg region below ambienttemperature; results were compared with cellulose acetate structured as an asymmetric membrane (CAmb).In samples with low water content, two secondary relaxation processes between 173 and 298 K were identifiedby DRS, associated with localized mobility. The process located at the lowest temperatures (process I) hasa different mobility in CA relative to CAmb. The identical crystalline/amorphous state of both materialsallowed rationalizing the distinct behavior in terms of polymeric arrangement and ability for water uptake.The looser structure of the CA relative to CAmb as confirmed by FTIR, TGA, and DSC analysis makes moresites accessible to water molecules, resulting in a higher water retention in CA (2.73% w/w) relative to CAmb(1.60% w/w) and an increased molecular mobility in the former due to a plasticizing effect. In both materials,process I is significantly influenced by hydration, shifting to higher frequencies and lower temperatures uponwater uptake. This process seems to be associated with mobility occurring within the monomeric unit, whichembraces the two anhydroglucose rings connected by the glycosidic linkage and the polar groups directlyattached to it. It should involve a very limited length scale, as suggested by its location, far below the glasstransition, and the τ∞ value with a low entropic effect. The relaxation process that emerges later, process II,is similar for both samples being much less influenced by water but experiencing a slight antiplasticizingeffect shifting to lower frequencies and higher temperatures upon hydration. It should involve side groupmotions, strongly coupled to the mobility of the anhydroglucose rings, which become hindered probably dueto establishment of H-bonds with water molecules. The plasticizing/antiplasticizing effect is being discussedonly on the basis of the frequency position of the relaxation peak. Processes I and II merge into a broadrelaxation (γdry) upon water removal in both CA and CAmb, however evolving slower in the former withdrying, due to a more disordered structure of CA that allows water to interact with more internal sites in thepolymer. At higher temperatures (T g 353 K), a process emerges in the high frequency side of the dynamicR-relaxation which is compatible with a �JG-relaxation. The structured specimen CAmb provided an additionalway to probe the morphological changes undergone by the material when annealed to temperatures higherthan 353 K, originating an increase in the dielectric response. This effect can be associated with a skindensification and partial collapse of the membrane porous network, as observed by SEM.
Introduction
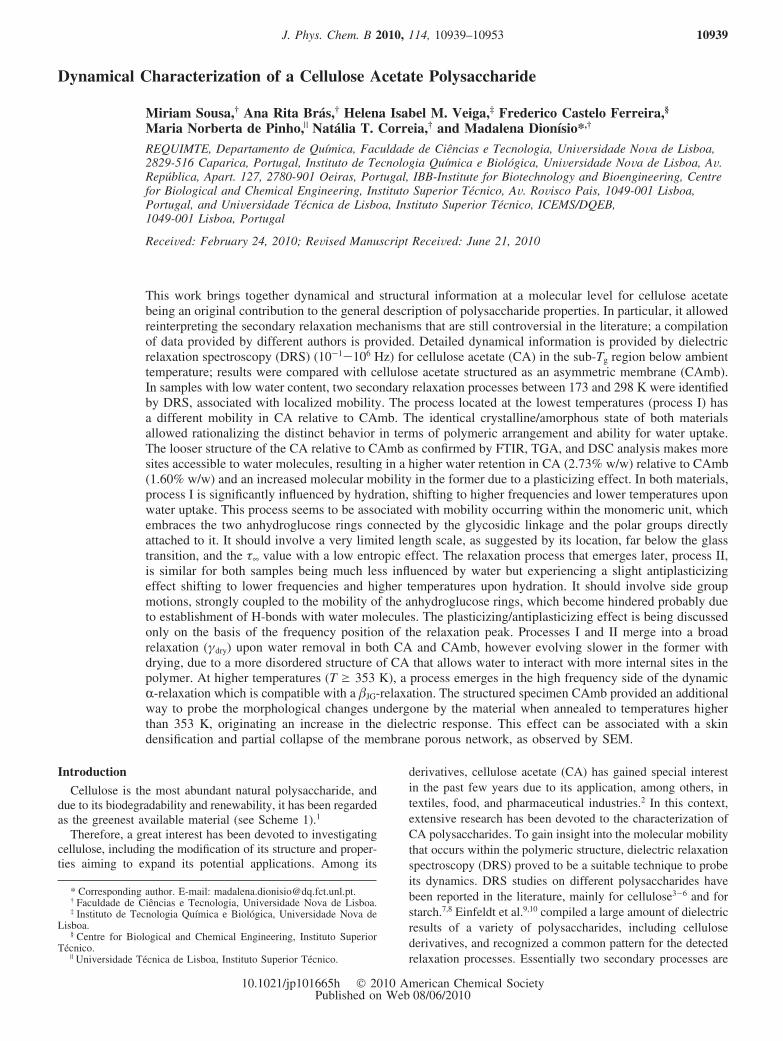
Cellulose is the most abundant natural polysaccharide, anddue to its biodegradability and renewability, it has been regardedas the greenest available material (see Scheme 1).1
Therefore, a great interest has been devoted to investigatingcellulose, including the modification of its structure and proper-ties aiming to expand its potential applications. Among its
derivatives, cellulose acetate (CA) has gained special interestin the past few years due to its application, among others, intextiles, food, and pharmaceutical industries.2 In this context,extensive research has been devoted to the characterization ofCA polysaccharides. To gain insight into the molecular mobilitythat occurs within the polymeric structure, dielectric relaxationspectroscopy (DRS) proved to be a suitable technique to probeits dynamics. DRS studies on different polysaccharides havebeen reported in the literature, mainly for cellulose3-6 and forstarch.7,8 Einfeldt et al.9,10 compiled a large amount of dielectricresults of a variety of polysaccharides, including cellulosederivatives, and recognized a common pattern for the detectedrelaxation processes. Essentially two secondary processes are
* Corresponding author. E-mail: [email protected].† Faculdade de Ciencias e Tecnologia, Universidade Nova de Lisboa.‡ Instituto de Tecnologia Quımica e Biologica, Universidade Nova de
Lisboa.§ Centre for Biological and Chemical Engineering, Instituto Superior
Tecnico.| Universidade Tecnica de Lisboa, Instituto Superior Tecnico.
J. Phys. Chem. B 2010, 114, 10939–10953 10939
10.1021/jp101665h 2010 American Chemical SocietyPublished on Web 08/06/2010
observed in the low-temperature range from 138 to 293 K thathave been assigned differently by several authors. The diverseinterpretations for the origin of these two processes were recentlysummarized by Kaminsky et al.11,12 Mainly, the faster relaxationprocess, designated as γ-relaxation, has been assigned torotations of side groups13,14 or motions in the repeating unithaving intramolecular character;12 the second one, observed athigher temperatures, was mainly attributed to local main chainmotions involving fluctuations within the glycosidic linkage innonsubstituted dissacharides.11 Additionally, this slower relax-ation process has also been considered as the precursor of thestructural relaxation in polysaccharides5,15 identified with theJohari-Goldstein relaxation.12 This process seems to involvethe superposition of different contributions, being claimed thatit may own some degree of cooperativity.8,16 However, Diogoand Moura-Ramos17 in a detailed study by TSDC showed thatthe components of the distributed secondary relaxation in ethylcellulose are noncooperative being assigned to local motionalrelaxation processes; the claimed cooperativity was attributedto the fact that it is an energy distributed process.
In wet cellulosic polysaccharide samples, an additionalrelaxation process is detected at the room-temperature range.The molecular origin of this process, designated as �wet, is notyet well established; however, it has been assigned to theorientational motions of a mixed phase of both polysaccharideand water (or other swelling solvents), formed in wet systemsby a swelling process.10
Concerning the importance of water in cellulosic materials,previous studies have shown that water molecules and hydrogenbonds in both inter-and intra-polymer chains play a major rolein molecular stabilization and also in the connection betweenneighboring chains forming microfibrils.18 These interactionsare also responsible for the complexity of the material structure,with the polymer chains forming specific morphologies withsystems of holes, pores, and capillaries.10,15 To investigate theinterplay of the hydrogen bond on the polymer matrix and todistinguish different kinds of H-bonds in cellulose acetate,several techniques have been applied, such as FTIR1,18 and solidstate NMR.19 In particular, Guo and Wu1 recently investigatedthe structural evolution of hydrogen bonding in cellulosediacetate upon heating, following the modification of the O-Hstretching vibration by FTIR. The interaction of adsorbed waterto oxygen atoms was also investigated by NMR19 where it wasobserved that water associates preferentially with carbonylgroups in side chains. However, in less structured CA, watermolecules access the oxygen atoms easier in both the polymericside chains and main chain, and thus water can act as aplasticizer. In a different study, Murphy and Pinho25 providethe detailed assignment of OH modes detected by ATR-FTIRin wet and dry CA asymmetric membrane, establishing a
correlation between the water structure and the pore size andthe permeation performance.
On the other hand, for cellulosic materials submitted toannealing at 453 K, an increase of the dielectric response isreported with a different origin than the rise caused by thepresence of water.20 This effect is attributed to the phenomenonof “hornification” described as irreversible morphologicalchanges (see ref 20 and references therein).
Despite the numerous experimental studies devoted to thesecondary mobility of cellulose and its derivatives, both in wetand dried states, the molecular motions underlying the differentrelaxation processes are still a matter of debate.11,12,17
Therefore, the present dynamical study by DRS focused onthe subglass mobility in cellulose acetate (CA) intends to be anadditional contribution to the comprehension of the molecularorigin of the detected relaxation processes. Furthermore, cel-lulose acetate will be investigated in this work under twostructurally/morphologically different forms: the initial poly-meric state and structured as a membrane. The latter offers away to further evaluate by a microscopy technique such as SEMthe effect of annealing the material at high temperatures.
To complement the dynamical description, a physicochemicalcharacterization was also carried out by FTIR, SEM, DSC, andTGA, allowing correlating structural properties of the CApolysaccharide and its dynamical behavior. This approach fora porous membrane is a pioneer in the literature, to our bestknowledge.
Experimental Section
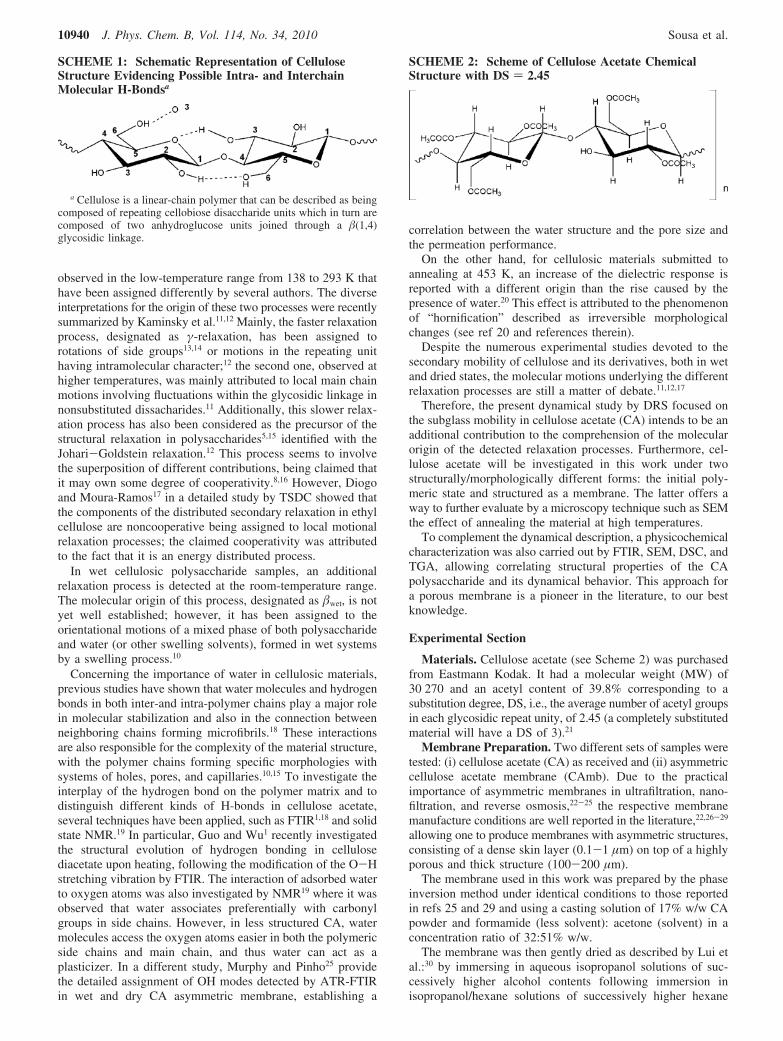
Materials. Cellulose acetate (see Scheme 2) was purchasedfrom Eastmann Kodak. It had a molecular weight (MW) of30 270 and an acetyl content of 39.8% corresponding to asubstitution degree, DS, i.e., the average number of acetyl groupsin each glycosidic repeat unity, of 2.45 (a completely substitutedmaterial will have a DS of 3).21
Membrane Preparation. Two different sets of samples weretested: (i) cellulose acetate (CA) as received and (ii) asymmetriccellulose acetate membrane (CAmb). Due to the practicalimportance of asymmetric membranes in ultrafiltration, nano-filtration, and reverse osmosis,22-25 the respective membranemanufacture conditions are well reported in the literature,22,26-29
allowing one to produce membranes with asymmetric structures,consisting of a dense skin layer (0.1-1 µm) on top of a highlyporous and thick structure (100-200 µm).
The membrane used in this work was prepared by the phaseinversion method under identical conditions to those reportedin refs 25 and 29 and using a casting solution of 17% w/w CApowder and formamide (less solvent): acetone (solvent) in aconcentration ratio of 32:51% w/w.
The membrane was then gently dried as described by Lui etal.:30 by immersing in aqueous isopropanol solutions of suc-cessively higher alcohol contents following immersion inisopropanol/hexane solutions of successively higher hexane
SCHEME 1: Schematic Representation of CelluloseStructure Evidencing Possible Intra- and InterchainMolecular H-Bondsa
a Cellulose is a linear-chain polymer that can be described as beingcomposed of repeating cellobiose disaccharide units which in turn arecomposed of two anhydroglucose units joined through a �(1,4)glycosidic linkage.
SCHEME 2: Scheme of Cellulose Acetate ChemicalStructure with DS ) 2.45
10940 J. Phys. Chem. B, Vol. 114, No. 34, 2010 Sousa et al.

contents in order to remove the more polar solvent and slowlyaccommodate the membrane structure to a less polar environ-ment. The hexane was then removed by gentle evaporation ina desiccator at room temperature (295-298 K) for 13 days.The obtained average membrane thickness was about 80 µm.
Conventional drying processes like thermo-vacuum treatmentwere not undertaken, since a complete drying of the membranecan irreversibly damage and/or destroy the membrane structure.31
Notice that membrane preparation does not involve anychemical or physical modification of the polymer structure andthe different architectures obtained for the membrane samplesare only obtained by dissolution of the polymer on solvents andcontrolling solvent evaporation and polymer precipitation rates.
Sample Characterization. Scanning Electron Microscopy.The membrane morphology at a microscale was characterizedthrough scanning electron microscopy (SEM) imaging using aHitachi S2400, fitted with a Rontec standard energy dispersive(EDS) detector. In order to get the membrane cross section, thesample was freeze-fractured in liquid nitrogen. The sample, withabout 0.5 cm2 area, was mounted onto the aluminum stubs usingcarbon cement (D-400, Neubaeur Chemikalien), and a thickcoating of 3 ( 6 nm gold particles was deposited using a dualion beam sputter coater.
Figure 1 presents the respective SEM micrograph, providingan overview of the membrane cross section. From the snapshot,it is possible to visualize the asymmetric structure of themembrane: the dense skin layer is located in the upper sidewhere the resolution of the microscope does not allow distin-guishing nanopores; the increasing dimension of the pores inthe network becomes evident from top to bottom.
Thermal Analysis. ThermograVimetry experiments (TGA)were performed in a TA Instruments model TGA Q50, usinghigh purity nitrogen (water free) as a purge gas at a flow rateof 60 mL ·min-1. TGA data were obtained in open aluminumpans. The samples, with an initial weight of ∼10 mg (celluloseacetate powder) and ∼3 mg (membrane), were submitted to thefollowing temperature scan: (i) a temperature ramp from 298up to 383 K, (ii) an isotherm at 383 K for 10 min, and (iii) asecond ramp up to 973 K. In paths i and iii, the heating ratewas set to 10 K ·min-1.
Thermogravimetry was performed to quantify the watercontent and monitor decomposition in both samples. Although
the asymmetric CA membrane was subjected to a solvent dryingprocedure, it is known that, due to its hydrophilicity, CAmaterials promptly recapture water by the hydroxyl and acetylgroups through hydrogen bonds.1
Figure 2 shows the thermograms obtained for both CA andCAmb. The water content in each sample, corresponding tomolecules which are weakly bonded, physically adsorbed in thesurface, and inside the pores, was estimated from the weightloss observed from the beginning of the temperature scan untilaround 423 K (see a scale-up in the inset): the estimated valueswere 2.73 and 1.60% w/w for CA and CAmb, respectively. Themajor mass loss detected by TGA is due to decomposition ofthe CA matrix having a starting temperature around 525 and555 K, respectively, for CA and CAmb, and occurs up to700 K.
Differential Scanning Calorimetry. DSC measurements wereperformed in a SETARAM DSC 131 calorimeter. Dry highpurity N2 gas was purged through the sample during themeasurements. Both CA and CAmb were analyzed. The sampleswere heated up to 543 K (membrane sample mass ∼5 mg) and573 K (CA mass ∼18 mg). The thermograms were collected at10 K ·min-1.
Infrared Spectroscopy. Infrared spectra of both (i) KBr pelletof cellulose acetate powder with 3% (weight of CA/KBr) and(i) CAmb were recorded, at room temperature, using an ATIMattson Genesis Series Fourier transform infrared spectrometer.Spectra were taken with a resolution of 4 cm-1; 64 scans wereaveraged.
Dielectric Relaxation Spectroscopy. For the analysis of thecellulose acetate as received (CA), approximately 40 mg of thispowder was compressed under a pressing force of ∼50 kN, toproduce a disk (∼10 mm diameter). The membrane was cutinto disks of about 20 mm in diameter for the dielectricspectroscopy measurements. The samples were then placedbetween two gold plated electrodes in a parallel plate capacitor,BDS 1200. The sample cell was mounted on a cryostat, BDS1100, and exposed to a heated gas stream being evaporated fromliquid nitrogen in a Dewar. The temperature control was assuredby the Quatro Cryosystem and performed within (0.5 K (allmodules supplied by Novocontrol). The complex dielectricfunction ε*(f) ) ε′(f) - iε′′(f) (f, frequency; ε′, real part; ε′′,imaginary part) was measured by an Alpha-N analyzer also fromNovocontrol GmbH, covering a frequency range from 10-1 Hzto 1 MHz. After an initial cooling ramp at 10 K ·min-1, from
Figure 1. SEM image of the asymmetric CA membrane (7000×)evidencing the asymmetric structure with a dense layer in the top partand a more open porous network in the bottom.
Figure 2. Thermogravimetric curves obtained on heating at 10K ·min-1 for the as received cellulose acetate (CA) and membrane(CAmb). Inset: Detailed view evidencing the temperature region (upto ∼423 K) where the mass loss is due to water release. The onset ofthermal decomposition of each sample is indicated by the arrows.
Dynamical Characterization of a CA Polysaccharide J. Phys. Chem. B, Vol. 114, No. 34, 2010 10941
298 to 173 K, isothermal dielectric measurements were carriedfrom 173 to 298 K, in steps of 5 K.
To analyze the influence of dehydration, an additionalexperiment was performed. Each sample was submitted tothermal cycling by measuring isothermally in successive runsstarting always from Ti ) 173 K, in steps of 5 K, up tosuccessive higher final temperatures (Tf); each time that thefrequency scan is completed at the final presetted Tf, the sampleis cooled down to 173 K and a new run begins up to a higherend temperature (Tf ) 298, 313, 333, 353, 373 (2×), and 413K; see Scheme 3).
For dried CA, isothermal measurements were extended upto 473 K.
The dielectric relaxation data obtained were deconvolutedusing a sum of the model function introduced by Havriliak-Negami:32
where j is the number of relaxation processes, ∆ε ) εs - ε∞ isthe dielectric strength, i.e., the difference between the realpermittivity values at, respectively, the low and high frequencylimits, τ ≈ (2πfmax)-1 is the characteristic relaxation time, andRHN and �HN are the shape parameters (0 < RHN < 1, 0 < RHN ·�HN
< 1). When the data are influenced by low frequency conductiv-ity contribution, an additional term iσ/ωcε0 was added to thedielectric loss, where ε0 is the vacuum permittivity, σ and c arefitting parameters: σ is related to the dc conductivity of thesample and the parameter c (0 < c e 1) describes for c ) 1Ohmic and for c < 1 non-Ohmic effects in the conductivity.From the estimated values of τHN, RHN, and �HN fittingparameters, it is possible to estimate a model-independentrelaxation time, τmax () 1/2πfmax) (for details, see refs 33 and34).
Results and Discussion
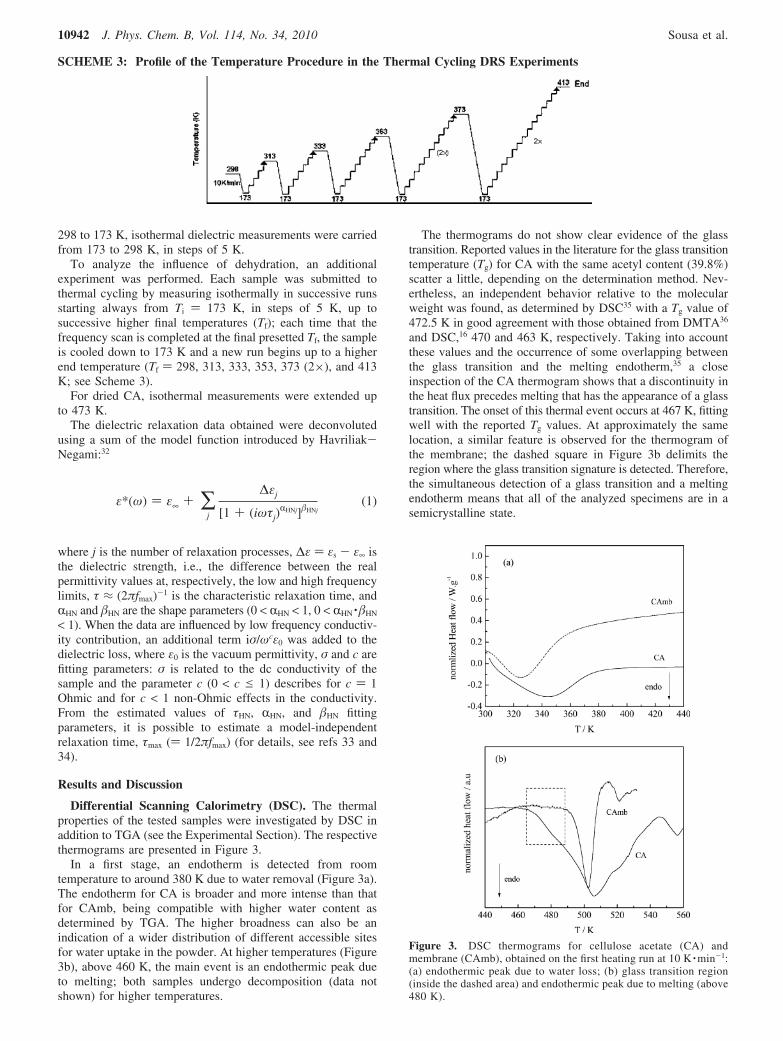
Differential Scanning Calorimetry (DSC). The thermalproperties of the tested samples were investigated by DSC inaddition to TGA (see the Experimental Section). The respectivethermograms are presented in Figure 3.
In a first stage, an endotherm is detected from roomtemperature to around 380 K due to water removal (Figure 3a).The endotherm for CA is broader and more intense than thatfor CAmb, being compatible with higher water content asdetermined by TGA. The higher broadness can also be anindication of a wider distribution of different accessible sitesfor water uptake in the powder. At higher temperatures (Figure3b), above 460 K, the main event is an endothermic peak dueto melting; both samples undergo decomposition (data notshown) for higher temperatures.
The thermograms do not show clear evidence of the glasstransition. Reported values in the literature for the glass transitiontemperature (Tg) for CA with the same acetyl content (39.8%)scatter a little, depending on the determination method. Nev-ertheless, an independent behavior relative to the molecularweight was found, as determined by DSC35 with a Tg value of472.5 K in good agreement with those obtained from DMTA36
and DSC,16 470 and 463 K, respectively. Taking into accountthese values and the occurrence of some overlapping betweenthe glass transition and the melting endotherm,35 a closeinspection of the CA thermogram shows that a discontinuity inthe heat flux precedes melting that has the appearance of a glasstransition. The onset of this thermal event occurs at 467 K, fittingwell with the reported Tg values. At approximately the samelocation, a similar feature is observed for the thermogram ofthe membrane; the dashed square in Figure 3b delimits theregion where the glass transition signature is detected. Therefore,the simultaneous detection of a glass transition and a meltingendotherm means that all of the analyzed specimens are in asemicrystalline state.
SCHEME 3: Profile of the Temperature Procedure in the Thermal Cycling DRS Experiments
ε*(ω) ) ε∞ + ∑j
∆εj
[1 + (iωτj)RHNj]�HNj
(1)
Figure 3. DSC thermograms for cellulose acetate (CA) andmembrane (CAmb), obtained on the first heating run at 10 K ·min-1:(a) endothermic peak due to water loss; (b) glass transition region(inside the dashed area) and endothermic peak due to melting (above480 K).
10942 J. Phys. Chem. B, Vol. 114, No. 34, 2010 Sousa et al.
It is interesting to note that the melting endotherm is muchsharper for the membrane having a peak location at 502 K. Thisvalue fits within the reported temperature range (500-520 K)for the melting of CA with DS ) 2.46.16,35 The broadness ofthe melting endotherm in CA could indicate a less perfectcrystalline arrangement relative to the membrane. This conclu-sion seems to be corroborated by previous TGA analysis. Infact, it was previously observed for celullose acetate that a betterchain packing leads to higher thermal stability;37 therefore, theinferior onset for degradation of CA indicates a less orderedchain arrangement than that for the membrane sample.
The crystallinity degree was estimated by the ratio betweenthe melting enthalpy of the material under study (∆Hm) andthe respective value for the totally crystalline material, (∆Hm° ),i.e.,
where ∆Hm° ) 58.8 J ·g-1 as proposed by Cerqueira et al.38 Themelting enthalpy value calculated from the thermogram forCAmb was 6.8 J ·g-1. For CA, it is difficult to accuratelydetermine ∆Hm due to the high overlap between the meltingendotherm and the glass transition. However, a value of 6.8J ·g-1 was also obtained. From eq 2, it was possible to estimatethe crystallinity degree, �c, as 12% for both CA and CAmb. Inspite of the uncertainty affecting the value of �c for CA, thetwo samples have very similar low crystallinity degrees, beingmainly amorphous.
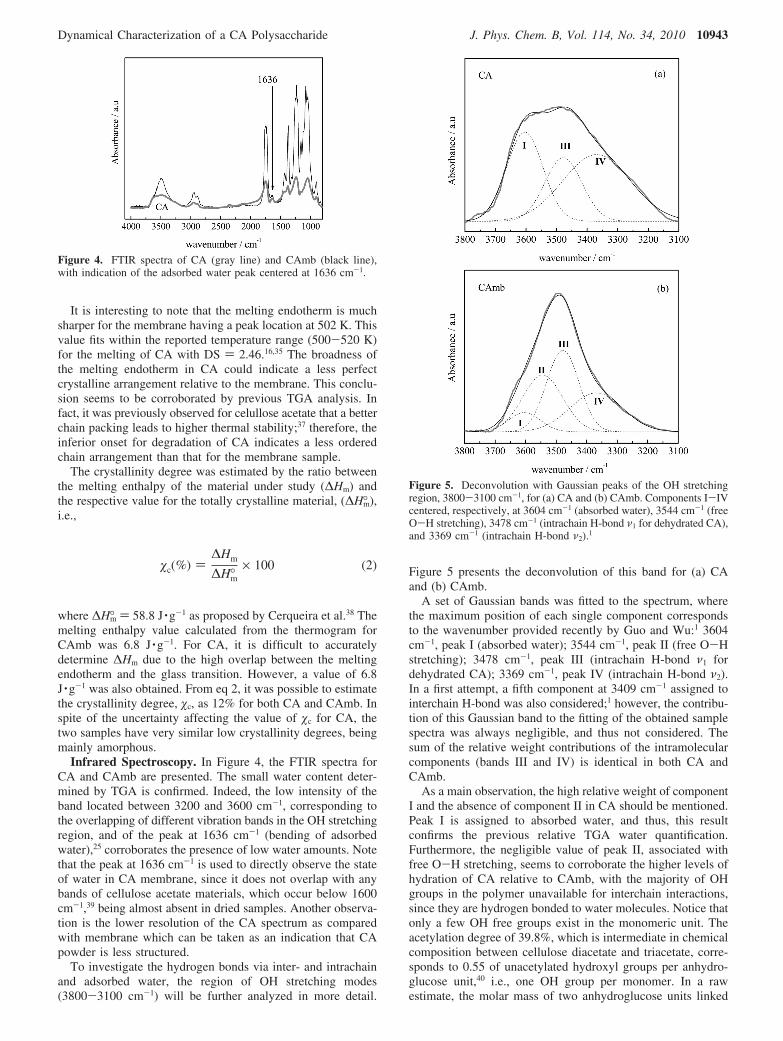
Infrared Spectroscopy. In Figure 4, the FTIR spectra forCA and CAmb are presented. The small water content deter-mined by TGA is confirmed. Indeed, the low intensity of theband located between 3200 and 3600 cm-1, corresponding tothe overlapping of different vibration bands in the OH stretchingregion, and of the peak at 1636 cm-1 (bending of adsorbedwater),25 corroborates the presence of low water amounts. Notethat the peak at 1636 cm-1 is used to directly observe the stateof water in CA membrane, since it does not overlap with anybands of cellulose acetate materials, which occur below 1600cm-1,39 being almost absent in dried samples. Another observa-tion is the lower resolution of the CA spectrum as comparedwith membrane which can be taken as an indication that CApowder is less structured.
To investigate the hydrogen bonds via inter- and intrachainand adsorbed water, the region of OH stretching modes(3800-3100 cm-1) will be further analyzed in more detail.
Figure 5 presents the deconvolution of this band for (a) CAand (b) CAmb.
A set of Gaussian bands was fitted to the spectrum, wherethe maximum position of each single component correspondsto the wavenumber provided recently by Guo and Wu:1 3604cm-1, peak I (absorbed water); 3544 cm-1, peak II (free O-Hstretching); 3478 cm-1, peak III (intrachain H-bond ν1 fordehydrated CA); 3369 cm-1, peak IV (intrachain H-bond ν2).In a first attempt, a fifth component at 3409 cm-1 assigned tointerchain H-bond was also considered;1 however, the contribu-tion of this Gaussian band to the fitting of the obtained samplespectra was always negligible, and thus not considered. Thesum of the relative weight contributions of the intramolecularcomponents (bands III and IV) is identical in both CA andCAmb.
As a main observation, the high relative weight of componentI and the absence of component II in CA should be mentioned.Peak I is assigned to absorbed water, and thus, this resultconfirms the previous relative TGA water quantification.Furthermore, the negligible value of peak II, associated withfree O-H stretching, seems to corroborate the higher levels ofhydration of CA relative to CAmb, with the majority of OHgroups in the polymer unavailable for interchain interactions,since they are hydrogen bonded to water molecules. Notice thatonly a few OH free groups exist in the monomeric unit. Theacetylation degree of 39.8%, which is intermediate in chemicalcomposition between cellulose diacetate and triacetate, corre-sponds to 0.55 of unacetylated hydroxyl groups per anhydro-glucose unit,40 i.e., one OH group per monomer. In a rawestimate, the molar mass of two anhydroglucose units linked
Figure 4. FTIR spectra of CA (gray line) and CAmb (black line),with indication of the adsorbed water peak centered at 1636 cm-1.
�c(%) )∆Hm
∆Hm°× 100 (2)
Figure 5. Deconvolution with Gaussian peaks of the OH stretchingregion, 3800-3100 cm-1, for (a) CA and (b) CAmb. Components I-IVcentered, respectively, at 3604 cm-1 (absorbed water), 3544 cm-1 (freeO-H stretching), 3478 cm-1 (intrachain H-bond ν1 for dehydrated CA),and 3369 cm-1 (intrachain H-bond ν2).1
Dynamical Characterization of a CA Polysaccharide J. Phys. Chem. B, Vol. 114, No. 34, 2010 10943
by an oxygen atom containing only one free OH is around 500g ·mol-1; thus, a percentage of 2.73% w/w, as found for thewater content in CA, is 14 g ·mol-1, which roughly correspondsto one water molecule per monomeric unit. In the limit,assuming that each water molecule is H-bonded to a single OHgroup, no free OH groups will be left in the CA powder.Moreover, given that the nonsubstituted OH groups are respon-sible for the establishment of interchain interactions,41 it is notsurprising that no component in the FTIR spectra associatedwith these intermolecular OH- vibrations was found. Further-more, since the acetyl side groups are unable to establishH-bonds between neighboring chains, it may be concluded thatthe studied CA samples do not form microfibrils.18 As theinterchain interactions are responsible for the three-dimensionalorder that is in the origin of the crystalline fraction, their absencethus corroborates the highly amorphous nature of the studiedCA samples as found by DSC.
To get further insight into the crystallinity of the samples,the crystallinity index, which is a measure of how far anunknown sample is between the extremes of the most amorphousand most crystalline samples obtainable for a polymer species,42
was estimated from FTIR data. The ratio of the absorbance at1425 and 900 cm-1 is often used to evaluate the crystallinityindex in cellulosic materials.43-45 The values thus estimated forboth samples were similar, indicating that no major differencesexist between the crystallinity ratios of the tested specimens.
This is coherent with the similarity in the crystallinity degreesestimated from DSC; therefore, CA and CAmb have an identicalamount of crystalline phase.
A summary of the properties determined by thermal andinfrared analysis is presented in Table 1.
Dynamic Molecular Characterization. Dielectric Measure-ments Taken from Runs up to 298 K. Dielectric relaxationspectroscopy (DRS) probes the molecular dynamics through themotions of dipoles, which fluctuate under the influence of anouter oscillating electric field. The measured dielectric permit-tivity, ε*(ω) ) ε′(ω) - iε′′(ω), is a complex quantity whosereal part (ε′(ω)) decreases as a sigmoid curve and the imaginarypart (ε′′(ω)), also designated as dielectric loss, passes througha maximum at fmax (τmax ) 1/2πfmax), when the dipoles are nolonger able to follow the electric field oscillations. Themaximum location allows inferring about molecular mobility.
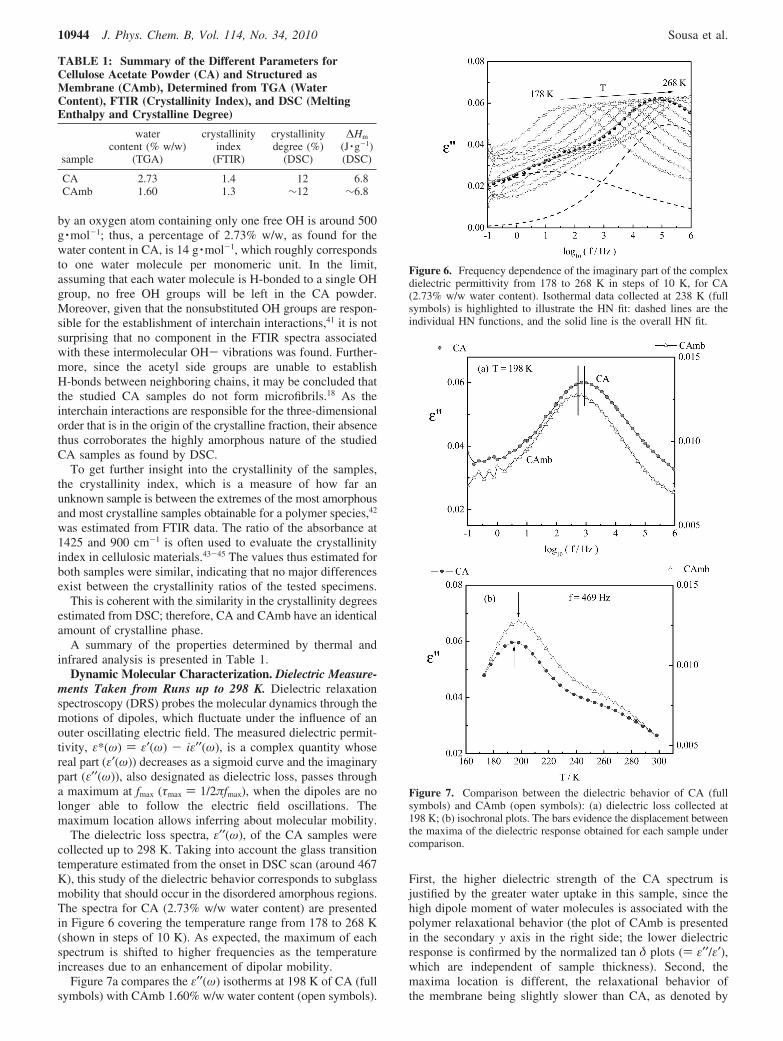
The dielectric loss spectra, ε′′(ω), of the CA samples werecollected up to 298 K. Taking into account the glass transitiontemperature estimated from the onset in DSC scan (around 467K), this study of the dielectric behavior corresponds to subglassmobility that should occur in the disordered amorphous regions.The spectra for CA (2.73% w/w water content) are presentedin Figure 6 covering the temperature range from 178 to 268 K(shown in steps of 10 K). As expected, the maximum of eachspectrum is shifted to higher frequencies as the temperatureincreases due to an enhancement of dipolar mobility.
Figure 7a compares the ε′′(ω) isotherms at 198 K of CA (fullsymbols) with CAmb 1.60% w/w water content (open symbols).
First, the higher dielectric strength of the CA spectrum isjustified by the greater water uptake in this sample, since thehigh dipole moment of water molecules is associated with thepolymer relaxational behavior (the plot of CAmb is presentedin the secondary y axis in the right side; the lower dielectricresponse is confirmed by the normalized tan δ plots () ε′′/ε′),which are independent of sample thickness). Second, themaxima location is different, the relaxational behavior ofthe membrane being slightly slower than CA, as denoted by
TABLE 1: Summary of the Different Parameters forCellulose Acetate Powder (CA) and Structured asMembrane (CAmb), Determined from TGA (WaterContent), FTIR (Crystallinity Index), and DSC (MeltingEnthalpy and Crystalline Degree)
sample
watercontent (% w/w)
(TGA)
crystallinityindex
(FTIR)
crystallinitydegree (%)
(DSC)
∆Hm
(J ·g-1)(DSC)
CA 2.73 1.4 12 6.8CAmb 1.60 1.3 ∼12 ∼6.8
Figure 6. Frequency dependence of the imaginary part of the complexdielectric permittivity from 178 to 268 K in steps of 10 K, for CA(2.73% w/w water content). Isothermal data collected at 238 K (fullsymbols) is highlighted to illustrate the HN fit: dashed lines are theindividual HN functions, and the solid line is the overall HN fit.
Figure 7. Comparison between the dielectric behavior of CA (fullsymbols) and CAmb (open symbols): (a) dielectric loss collected at198 K; (b) isochronal plots. The bars evidence the displacement betweenthe maxima of the dielectric response obtained for each sample undercomparison.
10944 J. Phys. Chem. B, Vol. 114, No. 34, 2010 Sousa et al.
the shift to lower frequencies of the dielectric loss peak ofCAmb. The same effect can be visualized in a differentrepresentation where loss data are plotted at a fixed frequencyagainst temperature (isochronal plot). This is shown in Figure7b at 469 Hz, where the maximum position of the CA mainpeak slightly deviates to lower temperatures, evidencing itsenhanced mobility relative to the process detected in themembrane.
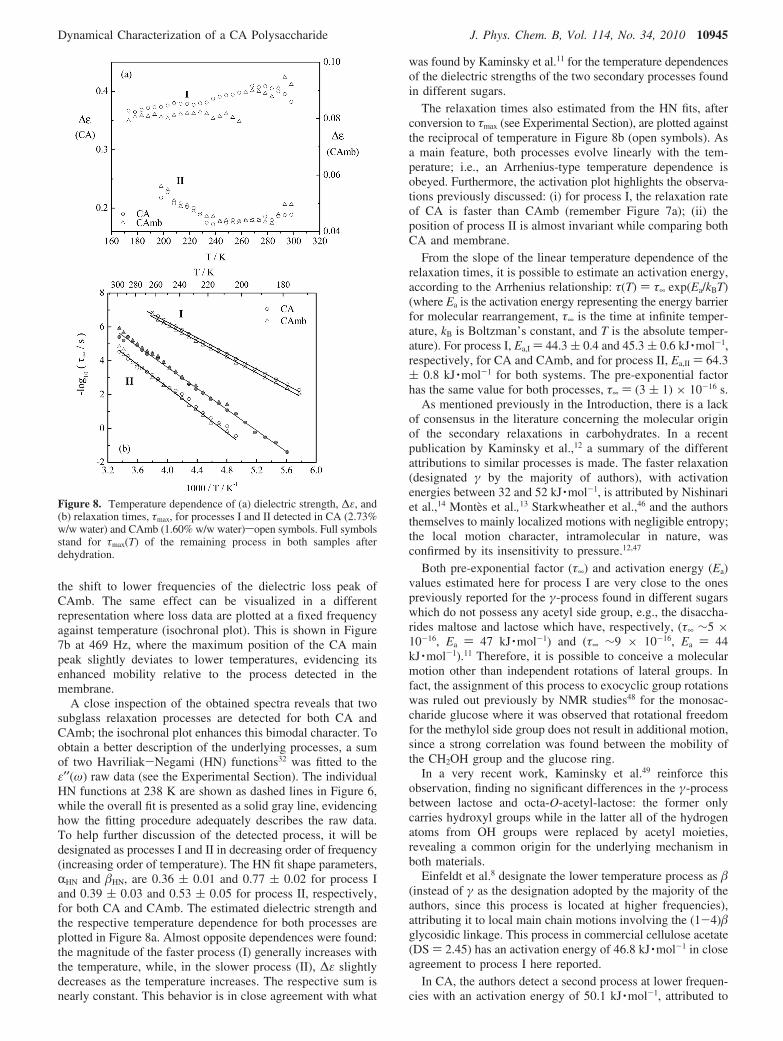
A close inspection of the obtained spectra reveals that twosubglass relaxation processes are detected for both CA andCAmb; the isochronal plot enhances this bimodal character. Toobtain a better description of the underlying processes, a sumof two Havriliak-Negami (HN) functions32 was fitted to theε′′(ω) raw data (see the Experimental Section). The individualHN functions at 238 K are shown as dashed lines in Figure 6,while the overall fit is presented as a solid gray line, evidencinghow the fitting procedure adequately describes the raw data.To help further discussion of the detected process, it will bedesignated as processes I and II in decreasing order of frequency(increasing order of temperature). The HN fit shape parameters,RHN and �HN, are 0.36 ( 0.01 and 0.77 ( 0.02 for process Iand 0.39 ( 0.03 and 0.53 ( 0.05 for process II, respectively,for both CA and CAmb. The estimated dielectric strength andthe respective temperature dependence for both processes areplotted in Figure 8a. Almost opposite dependences were found:the magnitude of the faster process (I) generally increases withthe temperature, while, in the slower process (II), ∆ε slightlydecreases as the temperature increases. The respective sum isnearly constant. This behavior is in close agreement with what
was found by Kaminsky et al.11 for the temperature dependencesof the dielectric strengths of the two secondary processes foundin different sugars.
The relaxation times also estimated from the HN fits, afterconversion to τmax (see Experimental Section), are plotted againstthe reciprocal of temperature in Figure 8b (open symbols). Asa main feature, both processes evolve linearly with the tem-perature; i.e., an Arrhenius-type temperature dependence isobeyed. Furthermore, the activation plot highlights the observa-tions previously discussed: (i) for process I, the relaxation rateof CA is faster than CAmb (remember Figure 7a); (ii) theposition of process II is almost invariant while comparing bothCA and membrane.
From the slope of the linear temperature dependence of therelaxation times, it is possible to estimate an activation energy,according to the Arrhenius relationship: τ(T) ) τ∞ exp(Ea/kBT)(where Ea is the activation energy representing the energy barrierfor molecular rearrangement, τ∞ is the time at infinite temper-ature, kB is Boltzman’s constant, and T is the absolute temper-ature). For process I, Ea,I ) 44.3 ( 0.4 and 45.3 ( 0.6 kJ ·mol-1,respectively, for CA and CAmb, and for process II, Ea,II ) 64.3( 0.8 kJ ·mol-1 for both systems. The pre-exponential factorhas the same value for both processes, τ∞ ) (3 ( 1) × 10-16 s.
As mentioned previously in the Introduction, there is a lackof consensus in the literature concerning the molecular originof the secondary relaxations in carbohydrates. In a recentpublication by Kaminsky et al.,12 a summary of the differentattributions to similar processes is made. The faster relaxation(designated γ by the majority of authors), with activationenergies between 32 and 52 kJ ·mol-1, is attributed by Nishinariet al.,14 Montes et al.,13 Starkwheather et al.,46 and the authorsthemselves to mainly localized motions with negligible entropy;the local motion character, intramolecular in nature, wasconfirmed by its insensitivity to pressure.12,47
Both pre-exponential factor (τ∞) and activation energy (Ea)values estimated here for process I are very close to the onespreviously reported for the γ-process found in different sugarswhich do not possess any acetyl side group, e.g., the disaccha-rides maltose and lactose which have, respectively, (τ∞ ∼5 ×10-16, Ea ) 47 kJ ·mol-1) and (τ∞ ∼9 × 10-16, Ea ) 44kJ ·mol-1).11 Therefore, it is possible to conceive a molecularmotion other than independent rotations of lateral groups. Infact, the assignment of this process to exocyclic group rotationswas ruled out previously by NMR studies48 for the monosac-charide glucose where it was observed that rotational freedomfor the methylol side group does not result in additional motion,since a strong correlation was found between the mobility ofthe CH2OH group and the glucose ring.
In a very recent work, Kaminsky et al.49 reinforce thisobservation, finding no significant differences in the γ-processbetween lactose and octa-O-acetyl-lactose: the former onlycarries hydroxyl groups while in the latter all of the hydrogenatoms from OH groups were replaced by acetyl moieties,revealing a common origin for the underlying mechanism inboth materials.
Einfeldt et al.8 designate the lower temperature process as �(instead of γ as the designation adopted by the majority of theauthors, since this process is located at higher frequencies),attributing it to local main chain motions involving the (1-4)�glycosidic linkage. This process in commercial cellulose acetate(DS ) 2.45) has an activation energy of 46.8 kJ ·mol-1 in closeagreement to process I here reported.
In CA, the authors detect a second process at lower frequen-cies with an activation energy of 50.1 kJ ·mol-1, attributed to
Figure 8. Temperature dependence of (a) dielectric strength, ∆ε, and(b) relaxation times, τmax, for processes I and II detected in CA (2.73%w/w water) and CAmb (1.60% w/w water)sopen symbols. Full symbolsstand for τmax(T) of the remaining process in both samples afterdehydration.
Dynamical Characterization of a CA Polysaccharide J. Phys. Chem. B, Vol. 114, No. 34, 2010 10945
reorientations of the acetyl side groups in the positions C2 andC3 (γ-(C2-O-Ac and C3-O-Ac) in short γ(C2,C3)). Theexistence of additional processes relative to cellulose wasobserved for cellulose-like oligomers such as cellobiose or�-cyclodextrin and derivatives of cellulose and starches.9,10,50
They are called γ-C-side group processes and are associatedwith the reorientation of more or less bulky side groups,implying a simultaneous motion of the main chain for spatialreasons.50 Consequently, the position and the distribution onthe frequency scale of these γ-C-side group relaxations areindirectly determined by the dominant �-relaxation (process Iin the present work or the usually designated γ-relaxation). Insome substituted cellulose materials, e.g., hydroxyl-propyl-cellulose, the γ-C-side group process is more intense, becomingmore resolved from the low temperature process.9,10,50 Moreover,a dependence on the degree of substitution was observed in sucha way that all relaxations can be separated in the dielectricspectra only for derivatives with low DS; the position of thesubstituent group at the anhydroglucose unit also influences theside group relaxation.50
This kind of side-group-related process is distinct from the�-relaxation detected in cellulosic materials without substituentgroups, which is claimed by several authors as involvingrestricted motions of the main chain segments12,13,51 and beingthe precursor of the structural relaxation.5 It is also identifiedwith the Johari-Goldstein (JG) relaxation for well drieddisaccharides.12 This process always becomes faster and itsintensity increases upon hydration; it is sensitive to physicalaging and senses the pressure like the R-relaxation associatedwith the dynamic glass transition as summarized in Table 2,where a compilation of literature data is provided.
To discern if process II detected in this work for CA is a�JG-process instead of the slower process due to the influenceof bulky side groups, an unequivocal definition of the shape ofthe R-process would be required, allowing a proper estimationof the �KWW parameter; the latter parameter determines thelocation of �JG according the coupling-model theory as proposedby K. Ngai.52 Due to the influence of conductivity that masksthe reorientational dielectric response, it was not possible todefine the R-process associated with the dynamic glass transitionand, thus, to estimate τJG. The temperature dependence of thedielectric strength observed in this work for process II (Figure8a) nicely compares with the behavior found for the �JG-relaxation observed for several sugars including, e.g., lactose,11
which could lead us to conceive a similar origin for process IIdetected in CA. Nevertheless, the temperature range where the�JG-process of lactose is observed is much higher than that atwhich process II is detected for CA, the latter having a superiorTg value (Tg,CA ∼ Tg,lactose + 80 K). Thus, it will be expectedthat the process precursor of the R-relaxation will appear at ahigher temperature for CA. Moreover, the pre-exponential factor,τ∞, found for the �-process detected by DRS in polysaccharidesis, in general, lower than the one obtained for CA either asmembrane or powder (τ∞ ) 3 × 10-16 s) lying within the range10-17-10-20 s.13,51 Values of the pre-exponential factor, τ∞,lower than the value predicted for a Debye-type process(∼10-12-10-14 s) correspond to an activation entropy greaterthan zero, according to the Eyring formalism,53 being associatedwith molecular mechanisms involving some degree of cooper-ativity. In process II, the entropic effect is not so accentuated.Therefore, it seems unlikely that process II in CA is associatedwith a �JG-relaxation; this will be further clarified in the nextsection.
Dielectric Measurements Taken from Runs up to 413 K:Influence of Dehydration. To get further insight into the originof these processes, several studies have been performed inhydrated and dried samples. As mentioned in the Introduction,distinct results are reported concerning the water effect overthe secondary relaxations in polysaccharides. For instance,Montes et al.13 through dynamic mechanical analysis (DMA)of cellulose and Laredo et al.51 using the thermally stimulateddepolarization currents (TSDC) technique to analyze starch bothfound that water plasticizes the �-process by decreasing itsrespective activation energy and insignificantly influences theγ-process. In starch,51 two secondary processes are observed atthe lowest temperatures, γ1 and γ2, both insensitive to water(Ea, τ∞(TSDC) ) (40 ( 2 kJ ·mol-1, 10-14.3(0.2 s)<15,5%wet and (42( 2 kJ ·mol-1, 10-13.8(0.1 s)dry for γ1; (28 ( 2 kJ ·mol-1,10-11.6(0.5 s)<15,5%wet and (25 ( 2 kJ ·mol-1, 10-10.6(0.5 s)dry forγ2); the average value of these activation energies is in closeagreement with the Ea value estimated for the γ-relaxationobserved in amorphous cellulose13 (Ea, τ∞(DMA) ) (34 kJ ·mol-1,10-13 s)e6%wet and (36 kJ ·mol-1, 10-12 s)dry). On the other hand,Jafarpour and co-workers5,6 report how water affects differentlythe two secondary relaxations in microcrystalline cellulose,studied by TSDC (f ∼10-3 Hz): (i) a plasticizing effect wasobserved for the �-process that deviates to lower temperaturesand decreases the respective activation energy, and (ii) anantiplasticizing effect was observed over the γ-relaxation wherean increase of the activation energy and a shift to highertemperatures was found with water uptake; for the sameγ-process, the authors observed by DRS5 a decrease in theactivation energy and an increase of the pre-exponential factorupon dehydration (Ea, τ∞(DRS) ) (50.9 ( 0.2 kJ ·mol-1, (1.2 (0.1) × 10-17 s)4%wet and (35 kJ ·mol-1, 10-13s)dry); however, thepeak position of the relaxation process shifts to lower frequen-cies for spectra collected at T g 183 K.54 A similar behavior isreported by Einfeldt et al.10,20 for the relaxation observed at thelowest temperatures (called � by the authors) in different typesof cellulose (both amorphous and semicrystalline) studied byDRS: a decrease of the activation energy (Ea, τ∞(DRS) ) (55.0kJ ·mol-1, 1 × 10-18 s)10%wet and (42.5 kJ ·mol-1, 3 × 10-15
s)dry), and a shift of the position of the relaxation peak to lowerfrequencies is also found. Table 2 summarizes the activationparameters provided for the monosaccharide glucose55-57 andseveral polysaccharides in both dried and wet state. Besideshydration, the influence of physical aging and pressure, whenreported in the literature, in the secondary relaxations is alsodescribed.
The estimated activation parameters for the γ-relaxation asinvestigated by TSDC and DMA, either in the wet or dried state,are compatible with very localized mobility with pre-exponentialfactors close to the Debye prefactor. By DRS, in general, lowerpre-exponential factors are found, since for an energy distributedprocess the technique probes a mean relaxation time.
In the present work, to evaluate the influence of dehydrationin the secondary processes observed in cellulose acetate,dielectric measurements were isothermally performed in bothCA and CAmb in successive runs starting from 173 K up toincreasing final temperatures (thermal cycling as described inExperimental Section), with each successive run correspondingto drier samples. Figure 9 shows the isochronal plots of tan δ() ε′′/ε′) for the different runs for (a) CA and (b) CAmb; thelast run is illustrated in full circles corresponding to datacollected after attaining 413 K.
Interesting enough, it is the dramatic influence of water inthe dielectric spectrum, even at such small amounts as the one
10946 J. Phys. Chem. B, Vol. 114, No. 34, 2010 Sousa et al.
TA
BL
E2:
Sum
mar
yof
the
Act
ivat
ion
Ene
rgy,
Ea,
and
the
Pre
-Exp
onen
tial
Fac
tor,
τ ∞,
ofth
eA
rrhe
nius
Fit
,τ(
T))
τ ∞ex
p(E
a/k B
T),
Obt
aine
dby
DR
S,T
SDC
,and
DM
Afo
rSe
cond
ary
Rel
axat
ions
Obs
erve
din
the
Gla
ssy
Stat
eof
Glu
cose
and
Seve
ral
Pol
ysac
char
ides
,in
the
Dri
edan
dW
etSt
ates
a
aC
ellu
lose
acet
ate
stud
ied
inth
isw
ork
isal
soin
clud
ed.
bT
heau
thor
sca
lled
this
fast
erpr
oces
s�-
rela
xatio
n.c
As
conc
lude
dfr
omFi
gure
2of
ref
6.d
Proc
esse
sI
and
IIob
serv
edin
the
wet
stat
em
erge
into
asi
ngle
broa
don
ein
the
drie
dst
ate,
γ dry
;a
thir
dlo
win
tens
ityre
laxa
tion
isvi
sibl
ein
itshi
ghfr
eque
ncy
flank
.
Dynamical Characterization of a CA Polysaccharide J. Phys. Chem. B, Vol. 114, No. 34, 2010 10947
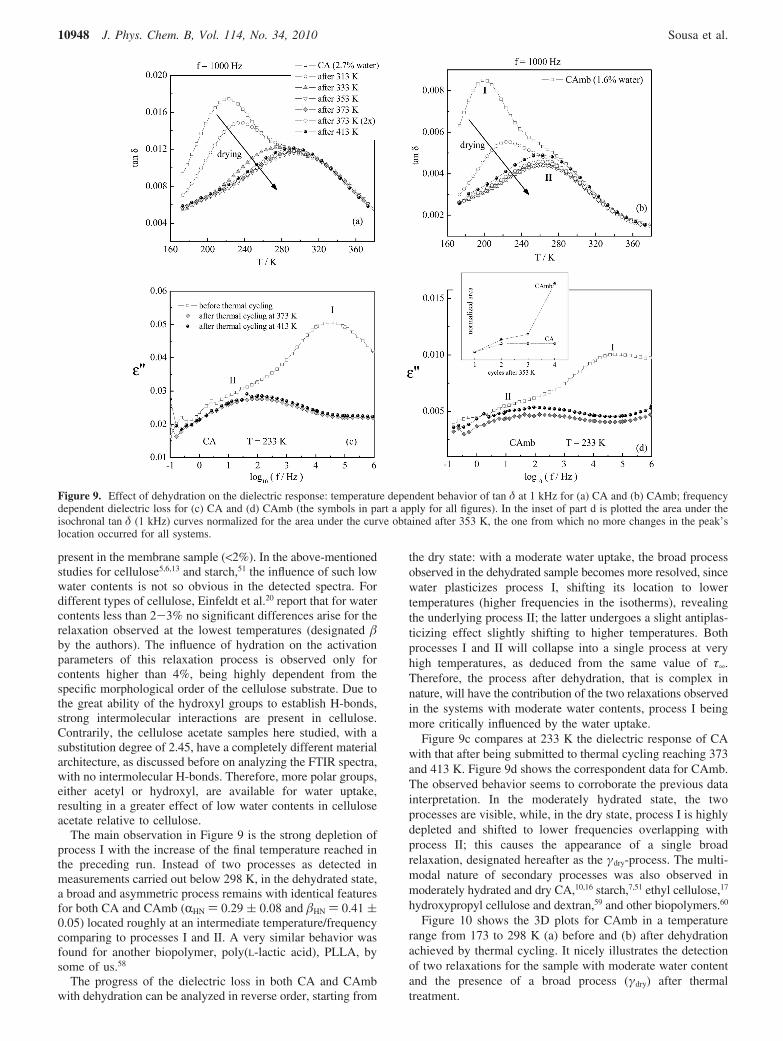
present in the membrane sample (<2%). In the above-mentionedstudies for cellulose5,6,13 and starch,51 the influence of such lowwater contents is not so obvious in the detected spectra. Fordifferent types of cellulose, Einfeldt et al.20 report that for watercontents less than 2-3% no significant differences arise for therelaxation observed at the lowest temperatures (designated �by the authors). The influence of hydration on the activationparameters of this relaxation process is observed only forcontents higher than 4%, being highly dependent from thespecific morphological order of the cellulose substrate. Due tothe great ability of the hydroxyl groups to establish H-bonds,strong intermolecular interactions are present in cellulose.Contrarily, the cellulose acetate samples here studied, with asubstitution degree of 2.45, have a completely different materialarchitecture, as discussed before on analyzing the FTIR spectra,with no intermolecular H-bonds. Therefore, more polar groups,either acetyl or hydroxyl, are available for water uptake,resulting in a greater effect of low water contents in celluloseacetate relative to cellulose.
The main observation in Figure 9 is the strong depletion ofprocess I with the increase of the final temperature reached inthe preceding run. Instead of two processes as detected inmeasurements carried out below 298 K, in the dehydrated state,a broad and asymmetric process remains with identical featuresfor both CA and CAmb (RHN ) 0.29 ( 0.08 and �HN ) 0.41 (0.05) located roughly at an intermediate temperature/frequencycomparing to processes I and II. A very similar behavior wasfound for another biopolymer, poly(L-lactic acid), PLLA, bysome of us.58
The progress of the dielectric loss in both CA and CAmbwith dehydration can be analyzed in reverse order, starting from
the dry state: with a moderate water uptake, the broad processobserved in the dehydrated sample becomes more resolved, sincewater plasticizes process I, shifting its location to lowertemperatures (higher frequencies in the isotherms), revealingthe underlying process II; the latter undergoes a slight antiplas-ticizing effect slightly shifting to higher temperatures. Bothprocesses I and II will collapse into a single process at veryhigh temperatures, as deduced from the same value of τ∞.Therefore, the process after dehydration, that is complex innature, will have the contribution of the two relaxations observedin the systems with moderate water contents, process I beingmore critically influenced by the water uptake.
Figure 9c compares at 233 K the dielectric response of CAwith that after being submitted to thermal cycling reaching 373and 413 K. Figure 9d shows the correspondent data for CAmb.The observed behavior seems to corroborate the previous datainterpretation. In the moderately hydrated state, the twoprocesses are visible, while, in the dry state, process I is highlydepleted and shifted to lower frequencies overlapping withprocess II; this causes the appearance of a single broadrelaxation, designated hereafter as the γdry-process. The multi-modal nature of secondary processes was also observed inmoderately hydrated and dry CA,10,16 starch,7,51 ethyl cellulose,17
hydroxypropyl cellulose and dextran,59 and other biopolymers.60
Figure 10 shows the 3D plots for CAmb in a temperaturerange from 173 to 298 K (a) before and (b) after dehydrationachieved by thermal cycling. It nicely illustrates the detectionof two relaxations for the sample with moderate water contentand the presence of a broad process (γdry) after thermaltreatment.
Figure 9. Effect of dehydration on the dielectric response: temperature dependent behavior of tan δ at 1 kHz for (a) CA and (b) CAmb; frequencydependent dielectric loss for (c) CA and (d) CAmb (the symbols in part a apply for all figures). In the inset of part d is plotted the area under theisochronal tan δ (1 kHz) curves normalized for the area under the curve obtained after 353 K, the one from which no more changes in the peak’slocation occurred for all systems.
10948 J. Phys. Chem. B, Vol. 114, No. 34, 2010 Sousa et al.
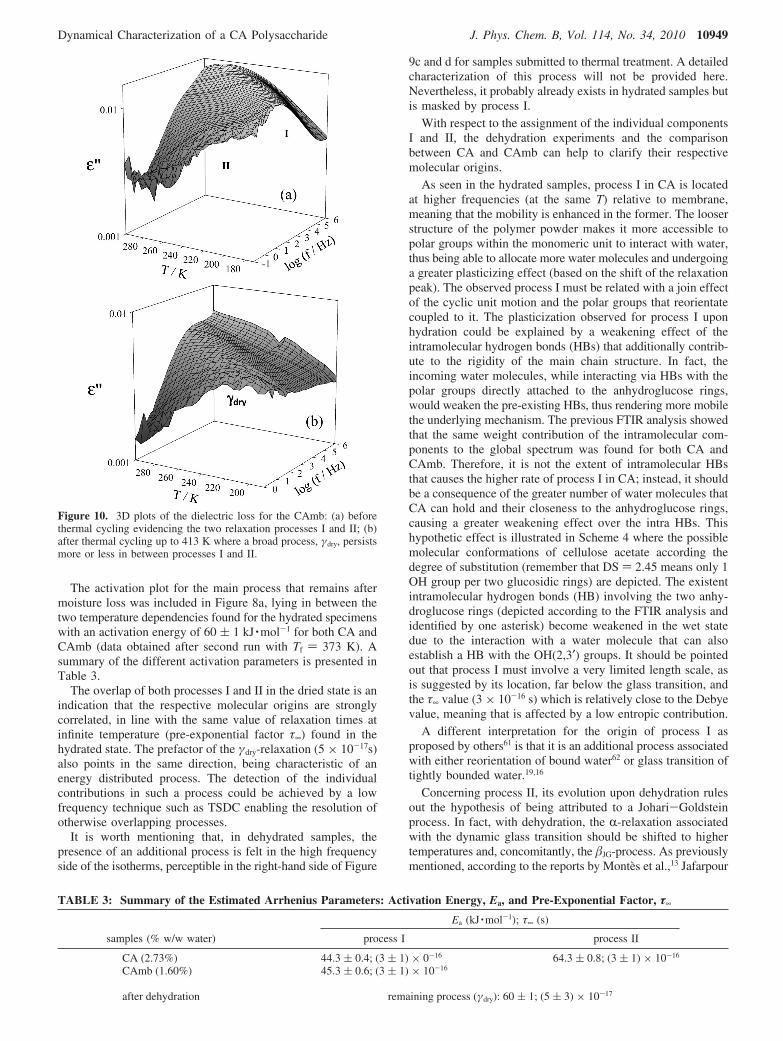
The activation plot for the main process that remains aftermoisture loss was included in Figure 8a, lying in between thetwo temperature dependencies found for the hydrated specimenswith an activation energy of 60 ( 1 kJ ·mol-1 for both CA andCAmb (data obtained after second run with Tf ) 373 K). Asummary of the different activation parameters is presented inTable 3.
The overlap of both processes I and II in the dried state is anindication that the respective molecular origins are stronglycorrelated, in line with the same value of relaxation times atinfinite temperature (pre-exponential factor τ∞) found in thehydrated state. The prefactor of the γdry-relaxation (5 × 10-17s)also points in the same direction, being characteristic of anenergy distributed process. The detection of the individualcontributions in such a process could be achieved by a lowfrequency technique such as TSDC enabling the resolution ofotherwise overlapping processes.
It is worth mentioning that, in dehydrated samples, thepresence of an additional process is felt in the high frequencyside of the isotherms, perceptible in the right-hand side of Figure
9c and d for samples submitted to thermal treatment. A detailedcharacterization of this process will not be provided here.Nevertheless, it probably already exists in hydrated samples butis masked by process I.
With respect to the assignment of the individual componentsI and II, the dehydration experiments and the comparisonbetween CA and CAmb can help to clarify their respectivemolecular origins.
As seen in the hydrated samples, process I in CA is locatedat higher frequencies (at the same T) relative to membrane,meaning that the mobility is enhanced in the former. The looserstructure of the polymer powder makes it more accessible topolar groups within the monomeric unit to interact with water,thus being able to allocate more water molecules and undergoinga greater plasticizing effect (based on the shift of the relaxationpeak). The observed process I must be related with a join effectof the cyclic unit motion and the polar groups that reorientatecoupled to it. The plasticization observed for process I uponhydration could be explained by a weakening effect of theintramolecular hydrogen bonds (HBs) that additionally contrib-ute to the rigidity of the main chain structure. In fact, theincoming water molecules, while interacting via HBs with thepolar groups directly attached to the anhydroglucose rings,would weaken the pre-existing HBs, thus rendering more mobilethe underlying mechanism. The previous FTIR analysis showedthat the same weight contribution of the intramolecular com-ponents to the global spectrum was found for both CA andCAmb. Therefore, it is not the extent of intramolecular HBsthat causes the higher rate of process I in CA; instead, it shouldbe a consequence of the greater number of water molecules thatCA can hold and their closeness to the anhydroglucose rings,causing a greater weakening effect over the intra HBs. Thishypothetic effect is illustrated in Scheme 4 where the possiblemolecular conformations of cellulose acetate according thedegree of substitution (remember that DS ) 2.45 means only 1OH group per two glucosidic rings) are depicted. The existentintramolecular hydrogen bonds (HB) involving the two anhy-droglucose rings (depicted according to the FTIR analysis andidentified by one asterisk) become weakened in the wet statedue to the interaction with a water molecule that can alsoestablish a HB with the OH(2,3′) groups. It should be pointedout that process I must involve a very limited length scale, asis suggested by its location, far below the glass transition, andthe τ∞ value (3 × 10-16 s) which is relatively close to the Debyevalue, meaning that is affected by a low entropic contribution.
A different interpretation for the origin of process I asproposed by others61 is that it is an additional process associatedwith either reorientation of bound water62 or glass transition oftightly bounded water.19,16
Concerning process II, its evolution upon dehydration rulesout the hypothesis of being attributed to a Johari-Goldsteinprocess. In fact, with dehydration, the R-relaxation associatedwith the dynamic glass transition should be shifted to highertemperatures and, concomitantly, the �JG-process. As previouslymentioned, according to the reports by Montes et al.,13 Jafarpour
Figure 10. 3D plots of the dielectric loss for the CAmb: (a) beforethermal cycling evidencing the two relaxation processes I and II; (b)after thermal cycling up to 413 K where a broad process, γdry, persistsmore or less in between processes I and II.
TABLE 3: Summary of the Estimated Arrhenius Parameters: Activation Energy, Ea, and Pre-Exponential Factor, τ∞
Ea (kJ ·mol-1); τ∞ (s)
samples (% w/w water) process I process II
CA (2.73%) 44.3 ( 0.4; (3 ( 1) × 0-16 64.3 ( 0.8; (3 ( 1) × 10-16
CAmb (1.60%) 45.3 ( 0.6; (3 ( 1) × 10-16
after dehydration remaining process (γdry): 60 ( 1; (5 ( 3) × 10-17
Dynamical Characterization of a CA Polysaccharide J. Phys. Chem. B, Vol. 114, No. 34, 2010 10949
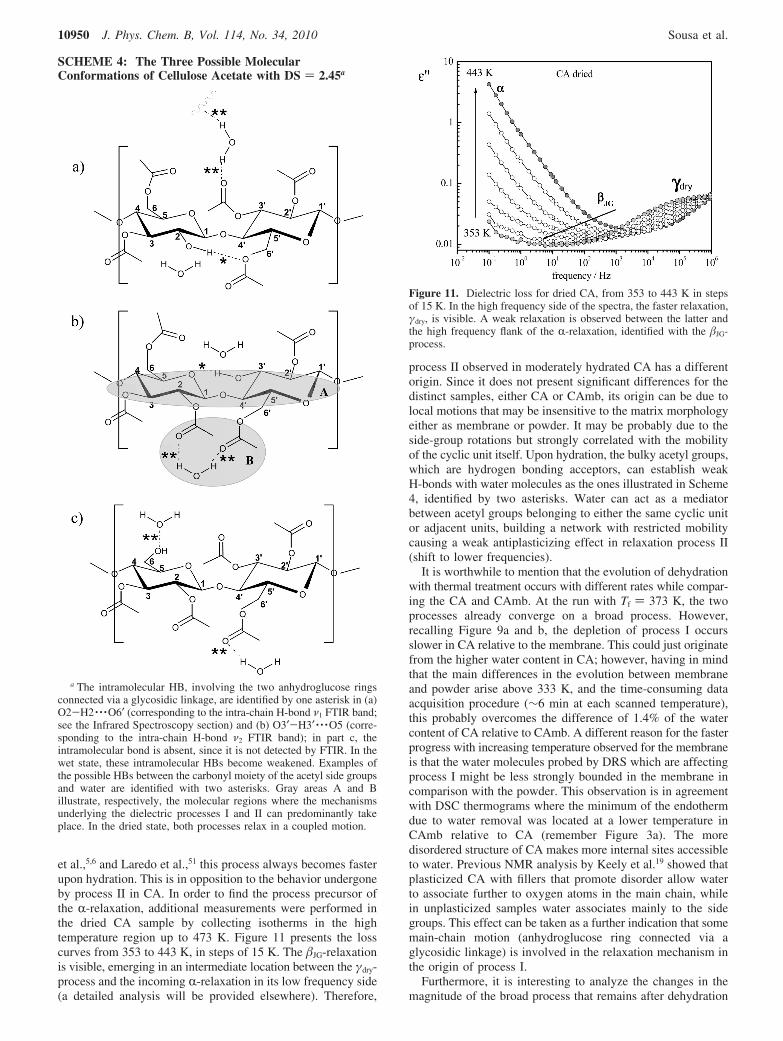
et al.,5,6 and Laredo et al.,51 this process always becomes fasterupon hydration. This is in opposition to the behavior undergoneby process II in CA. In order to find the process precursor ofthe R-relaxation, additional measurements were performed inthe dried CA sample by collecting isotherms in the hightemperature region up to 473 K. Figure 11 presents the losscurves from 353 to 443 K, in steps of 15 K. The �JG-relaxationis visible, emerging in an intermediate location between the γdry-process and the incoming R-relaxation in its low frequency side(a detailed analysis will be provided elsewhere). Therefore,
process II observed in moderately hydrated CA has a differentorigin. Since it does not present significant differences for thedistinct samples, either CA or CAmb, its origin can be due tolocal motions that may be insensitive to the matrix morphologyeither as membrane or powder. It may be probably due to theside-group rotations but strongly correlated with the mobilityof the cyclic unit itself. Upon hydration, the bulky acetyl groups,which are hydrogen bonding acceptors, can establish weakH-bonds with water molecules as the ones illustrated in Scheme4, identified by two asterisks. Water can act as a mediatorbetween acetyl groups belonging to either the same cyclic unitor adjacent units, building a network with restricted mobilitycausing a weak antiplasticizing effect in relaxation process II(shift to lower frequencies).
It is worthwhile to mention that the evolution of dehydrationwith thermal treatment occurs with different rates while compar-ing the CA and CAmb. At the run with Tf ) 373 K, the twoprocesses already converge on a broad process. However,recalling Figure 9a and b, the depletion of process I occursslower in CA relative to the membrane. This could just originatefrom the higher water content in CA; however, having in mindthat the main differences in the evolution between membraneand powder arise above 333 K, and the time-consuming dataacquisition procedure (∼6 min at each scanned temperature),this probably overcomes the difference of 1.4% of the watercontent of CA relative to CAmb. A different reason for the fasterprogress with increasing temperature observed for the membraneis that the water molecules probed by DRS which are affectingprocess I might be less strongly bounded in the membrane incomparison with the powder. This observation is in agreementwith DSC thermograms where the minimum of the endothermdue to water removal was located at a lower temperature inCAmb relative to CA (remember Figure 3a). The moredisordered structure of CA makes more internal sites accessibleto water. Previous NMR analysis by Keely et al.19 showed thatplasticized CA with fillers that promote disorder allow waterto associate further to oxygen atoms in the main chain, whilein unplasticized samples water associates mainly to the sidegroups. This effect can be taken as a further indication that somemain-chain motion (anhydroglucose ring connected via aglycosidic linkage) is involved in the relaxation mechanism inthe origin of process I.
Furthermore, it is interesting to analyze the changes in themagnitude of the broad process that remains after dehydration
SCHEME 4: The Three Possible MolecularConformations of Cellulose Acetate with DS ) 2.45a
a The intramolecular HB, involving the two anhydroglucose ringsconnected via a glycosidic linkage, are identified by one asterisk in (a)O2-H2 · · ·O6′ (corresponding to the intra-chain H-bond ν1 FTIR band;see the Infrared Spectroscopy section) and (b) O3′-H3′ · · ·O5 (corre-sponding to the intra-chain H-bond ν2 FTIR band); in part c, theintramolecular bond is absent, since it is not detected by FTIR. In thewet state, these intramolecular HBs become weakened. Examples ofthe possible HBs between the carbonyl moiety of the acetyl side groupsand water are identified with two asterisks. Gray areas A and Billustrate, respectively, the molecular regions where the mechanismsunderlying the dielectric processes I and II can predominantly takeplace. In the dried state, both processes relax in a coupled motion.
Figure 11. Dielectric loss for dried CA, from 353 to 443 K in stepsof 15 K. In the high frequency side of the spectra, the faster relaxation,γdry, is visible. A weak relaxation is observed between the latter andthe high frequency flank of the R-relaxation, identified with the �JG-process.
10950 J. Phys. Chem. B, Vol. 114, No. 34, 2010 Sousa et al.
upon further heating: in CA, the dielectric response keeps almostinvariant when the sample is heated up to 413 K; however, inthe membrane, there is a continuous increase of intensity, thatis even more enhanced after heating up to 413 K. The inset ofFigure 9d presents the variation of the area under the isochronalcurves, normalized by the area of the curve taken after 353 K(temperature from which no more changes in location occurredfor any system); the number of scanned temperature cycles inthis region is represented in the x axis, cycle 1 correspondingto data obtained after 353 K. While the plot for CA reaches aplateau, an enhancement of the dielectric response in themembrane is observed clearly differentiating it from the CAbehavior.
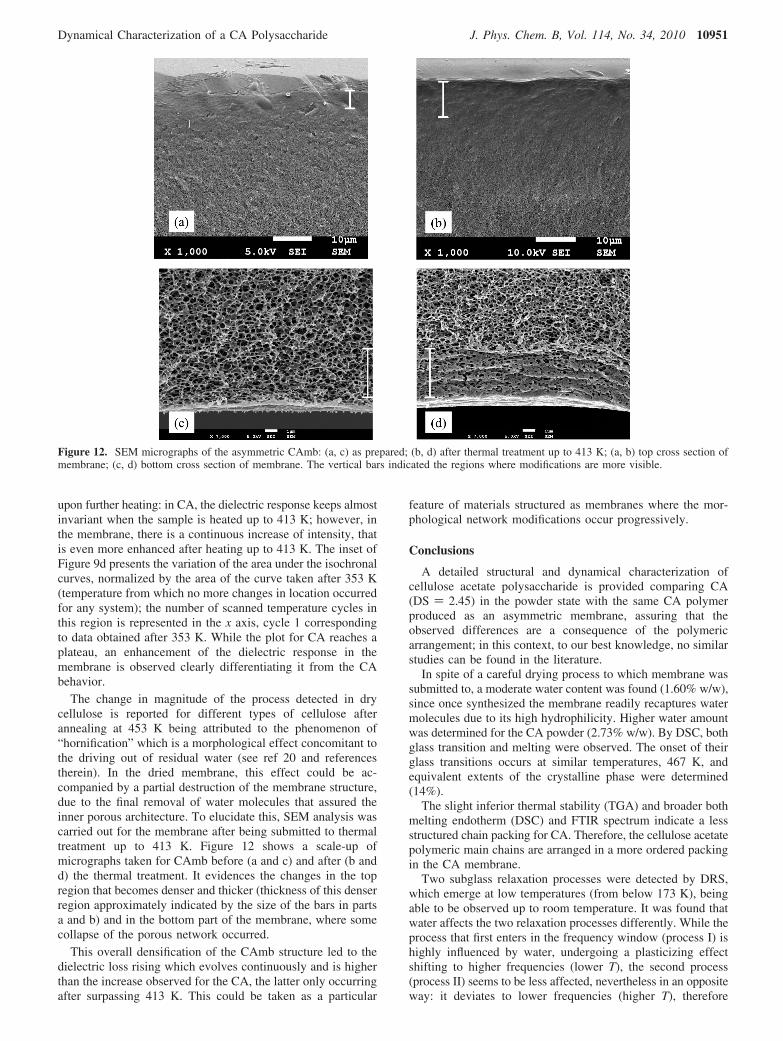
The change in magnitude of the process detected in drycellulose is reported for different types of cellulose afterannealing at 453 K being attributed to the phenomenon of“hornification” which is a morphological effect concomitant tothe driving out of residual water (see ref 20 and referencestherein). In the dried membrane, this effect could be ac-companied by a partial destruction of the membrane structure,due to the final removal of water molecules that assured theinner porous architecture. To elucidate this, SEM analysis wascarried out for the membrane after being submitted to thermaltreatment up to 413 K. Figure 12 shows a scale-up ofmicrographs taken for CAmb before (a and c) and after (b andd) the thermal treatment. It evidences the changes in the topregion that becomes denser and thicker (thickness of this denserregion approximately indicated by the size of the bars in partsa and b) and in the bottom part of the membrane, where somecollapse of the porous network occurred.
This overall densification of the CAmb structure led to thedielectric loss rising which evolves continuously and is higherthan the increase observed for the CA, the latter only occurringafter surpassing 413 K. This could be taken as a particular
feature of materials structured as membranes where the mor-phological network modifications occur progressively.
Conclusions
A detailed structural and dynamical characterization ofcellulose acetate polysaccharide is provided comparing CA(DS ) 2.45) in the powder state with the same CA polymerproduced as an asymmetric membrane, assuring that theobserved differences are a consequence of the polymericarrangement; in this context, to our best knowledge, no similarstudies can be found in the literature.
In spite of a careful drying process to which membrane wassubmitted to, a moderate water content was found (1.60% w/w),since once synthesized the membrane readily recaptures watermolecules due to its high hydrophilicity. Higher water amountwas determined for the CA powder (2.73% w/w). By DSC, bothglass transition and melting were observed. The onset of theirglass transitions occurs at similar temperatures, 467 K, andequivalent extents of the crystalline phase were determined(14%).
The slight inferior thermal stability (TGA) and broader bothmelting endotherm (DSC) and FTIR spectrum indicate a lessstructured chain packing for CA. Therefore, the cellulose acetatepolymeric main chains are arranged in a more ordered packingin the CA membrane.
Two subglass relaxation processes were detected by DRS,which emerge at low temperatures (from below 173 K), beingable to be observed up to room temperature. It was found thatwater affects the two relaxation processes differently. While theprocess that first enters in the frequency window (process I) ishighly influenced by water, undergoing a plasticizing effectshifting to higher frequencies (lower T), the second process(process II) seems to be less affected, nevertheless in an oppositeway: it deviates to lower frequencies (higher T), therefore
Figure 12. SEM micrographs of the asymmetric CAmb: (a, c) as prepared; (b, d) after thermal treatment up to 413 K; (a, b) top cross section ofmembrane; (c, d) bottom cross section of membrane. The vertical bars indicated the regions where modifications are more visible.
Dynamical Characterization of a CA Polysaccharide J. Phys. Chem. B, Vol. 114, No. 34, 2010 10951
undergoing an antiplasticizing effect. Process I is more mobilefor CA than CAmb, as showed by its shift to higher frequenciesat the same T, or to lower temperatures at the same f. Since theamorphous/crystallinity extent in CA and CAmb are equivalent,the observed differences were rationalized in terms of distinctpolymeric arrangements and ability for water takeover. The lessordered packing in CA powder offers more internal sites to beaccessible for water uptake, not only by the side groups butalso by the polar groups within the anhydroglucose rings playinga more effective plasticizing phenomenon, resulting in an overallenhanced mobility for CA than for CAmb. The results reportedhere suggest that process I must be related to a join effect ofthe cyclic unit motion and the polar groups that reorientatecoupled to it. Nevertheless, it should involve a very limitedlength scale, as is suggested by its location, far below the glasstransition, and the value found for the pre-exponential factoraffected by a low entropic contribution.
Upon hydration, the pre-existing intramolecular bonds becomeweakened due to establishment of HBs between the oxygenatoms directly attached to the glucosidic rings and the incomingwater molecules, enhancing the mobility of the underlyingmechanism.
Process II seems to be associated with side-group rotationsbut strongly correlated with the cyclic unit motion, being moreinsensitive to both matrix morphology and water content; uponhydration, the water molecules associate via H-bonds with theacetyl groups hindering its mobility.
Both processes seem to be highly correlated collapsing intoa broad one, designated γdry, in the full dried state as monitoredby DRS. The respective (τ∞)γdry value is compatible with anenergy distributed process coherent with the simultaneouscontribution of processes I and II. The detection of the individualcomponents could be achieved by a low frequency techniquesuch as TSDC which enables the resolution of otherwiseoverlapping processes.
At temperatures above 353 K, a distinct process emerges,with features compatible with the �JG-relaxation precursor ofthe dynamic glass transition, as found in several saccharides.
Additionally, when membrane is submitted to high temper-atures, a partial collapse of their inner porous architecture occurs,resulting in a densification of the structure as confirmed by SEM(taken after 413 K); DRS proved to also be sensitive to thiseffect that reflects in an accentuated increase in the dielectricresponse upon heating above 353 K, which does not occur inthe CA powder (in the studied temperature range). In spite ofthe lack of a definitive attribution of the relaxation detectedprocesses, the present work represents an additional contribution,clearly illustrating the dramatic effect of water in the secondaryprocess of moderately hydrated cellulose acetate specimens andevidencing the multimodal nature of the process detected in thedried state.
From the comparison of data in the literature, it is importantto point out that the �-process taken as the precursor of theR-relaxation (�JG), to which data provided by different authorsare very coherent, should be distinguished from the slowerprocess found in substituted cellulosic materials that is influ-enced by several factors such as the bulkiness of side groupsand degree of substitution. The apparent contradiction in resultsfound for the faster subglass relaxation, mainly how it behavesunder hydration, can be related to the amount of water(moderated hydrated samples behave differently from highlywetted materials) and to morphologic differences. From theresults reported here, we conclude that small amounts of water
can act as a probe of the different sites where water can beabsorbed/bounded in such morphological different materials.
Therefore, the demand for a universal description of thebehavior in complex systems is not a trivial task, since multiplefactors concur to the observed behavior, among which wateramount, substitution degree, and even crystallinity degree canplay a relevant role.
Acknowledgment. The authors thank Professor Luis PauloN. Rebelo (ITQB/UNL) for the equipment facilities for thermalanalysis. Financial support to Fundacao para a Ciencia eTecnologia (FCT, Portugal) through the project PTDC/CTM/64288/2006 is acknowledged. A.R.B. acknowledges FCT for aPh.D. grant (SFRH/BD/23829/2005).
References and Notes
(1) Guo, Y.; Wu, P. Carbohydr. Polym. 2008, 74, 509.(2) Aoki, D.; Teramoto, Y.; Nishio, Y. Biomacromolecules 2007, 8,
3749.(3) Radloff, D.; Boeffel, C.; Spiess, H. W. Macromolecules 1996, 29,
1528.(4) Mei�ner, D.; Einfeldt, L.; Einfeldt, J. J. Polym. Sci., Part B: Polym.
Phys. 2001, 39, 2491.(5) Jafarpour, G.; Dantras, E.; Boudet, A.; Lacabanne, C. J. Non-Cryst.
Solids 2007, 353, 4108.(6) Jafarpour, G.; Roig, F.; Dantras, E.; Boudet, A.; Lacabanne, C. J.
Non-Cryst. Solids 2009, 355, 1669.(7) Butler, M. F.; Cameron, R. E. Polymer 2000, 41, 2249.(8) Einfeldt, J.; Mei�ner, D.; Kwasniewski, A.; Einfeldt, L. Polymer
2001, 42, 7049.(9) Einfeldt, J.; Mei�ner, D.; Kwasniewski, A. J. Non-Cryst. Solids
2003, 320, 40.(10) Einfeldt, J.; Mei�ner, D.; Kwasniewski, A. Prog. Polym. Sci. 2001,
26, 1419.(11) Kaminski, K.; Kaminska, E.; Wlodarczyk, P.; Pawlus, S.; Kimla,
D.; Kasprzycka, A.; Paluch, M.; Ziolo, J.; Szeja, W.; Ngai, K. L. J. Phys.Chem. B 2008, 112, 12816.
(12) Kaminski, K.; Kaminska, E.; Ngai, K. L.; Paluch, M.; Wlodarczyk,P.; Kasprzycka, A.; Szeja, W. J. Phys. Chem. B 2009, 113, 10088.
(13) Montes, H.; Mazeau, K.; Cavaille, J. Y. Macromolecules 1997, 30,6977.
(14) Nishinari, K.; Shibuya, N.; Kainuma, K. Makromol. Chem. 1985,186, 433.
(15) Bidault, O.; Assifaoui, A.; Champion, D.; Le Meste, M. J. Non-Cryst. Solids 2005, 351, 1167.
(16) McBrierty, V. J.; Keely, C. M.; Coyle, F. M.; Xu, H.; Vij, J. K.Faraday Discuss. 1996, 103, 255.
(17) Diogo, H. P.; Moura-Ramos, J. J. J. Polym. Sci., Part B: Polym.Phys. 2009, 47, 820.
(18) Hinterstoisser, B.; Åkerholm, M.; Salmen, L. Biomacromolecules2003, 4, 1232.
(19) Keely, C. M.; Zhang, X.; McBrierty, V. J. J. Mol. Struct. 1995,355, 33.
(20) Einfeldt, J.; Kwasniewski, A. Cellulose 2002, 9, 225.(21) Puleo, A. C.; Paul, D. R.; Kelley, S. S. J. Membr. Sci. 1989, 47,
301.(22) Loeb, S.; Sourirajan, S. Sea Water Demineralization by Means of
an Osmotic Membrane. Saline Water ConVersionsII; Advances in Chem-istry, vol. 38; American Chemical Society: Washington, DC, 1963; Chapter9, pp 117-132.
(23) Dias, C. R.; Rosa, M. J.; de Pinho, M. N. J. Membr. Sci. 1998,138, 259.
(24) Wydeven, T.; Leban, M. J. Appl. Polym. Sci. 1973, 17, 2277.(25) Murphy, D.; de Pinho, M. N. J. Membr. Sci. 1995, 106, 245.(26) Kesting, R. Synthetic Polymeric Membrane; McGraw-Hill: New
York, 1971.(27) Matsuura, T.; Sourirajan, S. Fundamentals of ReVerse Osmosis;
National Research Council of Canada: Ottawa, Canada, 1985.(28) de Pinho, M. N. Desalination 1988, 68, 211.(29) Rosa, M. J.; de Pinho, M. N. J. Membr. Sci. 1994, 89, 235.(30) Lui, A.; Talbot, F. D. F.; Fouda, A.; Matsuura, T.; Sourirajan, S.
J. Appl. Polym. Sci. 1988, 36, 1809.(31) Kulkarni, S.; Krause, S.; Wignall, G. D.; Hammouda, B. Macro-
molecules 1994, 27, 6777.(32) Havriliak, S.; Negami, S. Polymer 1967, 8, 161. Havriliak, S.;
Negami, S. J. Polym. Sci., Part C: Polym. Symp. 1966, 14, 99.
10952 J. Phys. Chem. B, Vol. 114, No. 34, 2010 Sousa et al.
(33) Schonhals, A.; Kremer, F. Analysis of Dielectric Spectra. InBroadband Dielectric Spectroscopy; Schonhals, A., Kremer, F., Eds.;Springer-Verlag: Berlin, 2003; Chapter 3.
(34) (a) Boersema, A.; van Turnhout, J.; Wubbenhorst, M. Macromol-ecules 1998, 31, 7453. (b) Schroter, K.; Unger, R.; Reissig, S.; Garwe, F.;Kahle, S.; Beiner, M.; Donth, E. Macromolecules 1998, 31, 8966.
(35) Kamide, K. Cellulose and cellulose deriVatiVes molecular char-acterization and its applications; Elsevier: The Netherlands, 2005.
(36) Scandola, M.; Ceccorulli, G. Polymer 1985, 26, 1953.(37) Barud, H. S.; de Araujo Junior, A. M.; Santos, D. B.; de Assuncao,
R. M. N.; Meireles, C. S.; Cerqueira, D. A.; Rodrigues Filho, G.; Ribeiro,C. A.; Messaddeq, Y.; Ribeiro, S. J. L. Thermochim. Acta 2008, 471, 61.
(38) Cerqueira, D. A.; Rodrigues Filho, G.; Assuncao, R. M. N. Polym.Bull. 2006, 56, 475.
(39) Filho, G. R.; Bueno, W. A. J. Membr. Sci. 1992, 74, 19.(40) Toprak, C.; Agar, J. N.; Falk, M. J. Chem. Soc., Faraday Trans. 1
1979, 75, 803.(41) Ilharco, L. M.; Brito de Barros, B. Langmuir 2000, 16, 9331.(42) Statton, W. O. J. Appl. Polym. Sci. 1963, 7, 803.(43) Kataoka, Y.; Kondo, T. Macromolecules 1998, 31, 760.(44) Dawy, M.; Nada, A.-A. M. A. Polym.-Plast. Technol. Eng. 2003,
42, 643.(45) Åkerholm, M.; Hinterstoisser, B.; Salmen, L. Carbohydr. Res. 2004,
339, 569.(46) Starkweather, H. W., Jr. Polymer 1991, 32, 2443.(47) Kaminski, K.; Kaminska, E.; Hensel-Bielowka, S.; Pawlus, S.;
Paluch, M.; Ziolo, J. J. Chem. Phys. 2008, 129, 084501.(48) van Dusschoten, D.; Tracht, U.; Heuer, A.; Spiess, H. W. J. Phys.
Chem. A 1999, 103, 8359.
(49) Kaminski, K.; Kaminska, E.; Grzybowska, K.; Wlodarczyk, P.;Pawlus, S.; Paluch, M.; Ziolo, J.; Rozska, S. J.; Pilch, J.; Kasprzycka, A.;Szeja, W. Transformation of the Strongly Hydrogen Bonded System intovan der Waals one Reflected. In Molecular Dynamics Metastable systemsunder pressure; Rzoska, S., Drozd-Rzoska, A., Mazur, V., Eds.; W. NATOScience for Peace and Security Series A: Chemistry and Biology; Springer:The Netherlands, 2010; p 359.
(50) Einfeldt, J.; Mei�ner, D.; Kwasniewski, A. Cellulose 2004, 11, 137.(51) Laredo, E.; Newman, D.; Bello, A.; Muller, A. J. Eur. Polym. J.
2009, 45, 1506.(52) Ngai, K. L. J. Phys.: Condens. Matter 2003, 15, S1107.(53) Eyring, H. J. Chem. Phys. 1936, 4, 283.(54) According to Figure 2 of ref 6.(55) Noel, T. R.; Parker, R.; Ring, S. G. Carbohydr. Res. 2000, 329,
839.(56) Kaminski, K.; Kaminska, E.; Paluch, M.; Ziolo, J.; Ngai, K. L. J.
Phys. Chem. B 2006, 110, 25045.(57) Diogo, H. P.; Moura-Ramos, J. J. Carbohydr. Res. 2008, 343, 2797.(58) Bras, A. R.; Viciosa, M. T.; Dionisio, M.; Mano, J. F. J. Therm.
Anal. Calorim. 2007, 88, 425.(59) Shinouda, H. G.; Abdel Moteleb, M. M. J. Appl. Polym. Sci. 2005,
98, 571.(60) Bras, A. R.; Malik, P.; Dionisio, M.; Mano, J. F. Macromolecules
2008, 41, 6419.(61) Cerveny, S.; Schwartz, G. A.; Bergman, R.; Swenson, J. Phys. ReV.
Lett. 2004, 93, 245702.(62) Schartel, B.; Wendling, J.; Wendorff, J. H. Macromolecules 1996,
29, 1521.
JP101665H
Dynamical Characterization of a CA Polysaccharide J. Phys. Chem. B, Vol. 114, No. 34, 2010 10953


![THE ACETATE NEGATIVE SURVEY · using cellulose acetate.[1] Cellulose acetate is manufactured by combining cotton linters or wood pulp (the sources of the cellulose fibers) with acetic](https://img.pdfslide.net/doc/110x75/5e448d99bd61564bfe5016d9/the-acetate-negative-survey-using-cellulose-acetate1-cellulose-acetate-is-manufactured.jpg)