Embed Size (px)
Citation preview

Dynamical Processes on Large Networks
B. Aditya Prakashhttp://www.cs.cmu.edu/~badityap
Carnegie Mellon University
UMD-College Park, April 26, 2012
Networks are everywhere!
Human Disease Network [Barabasi 2007]
Gene Regulatory Network [Decourty 2008]
Facebook Network [2010]
The Internet [2005]

3
Dynamical Processes over networks are also everywhere!
4
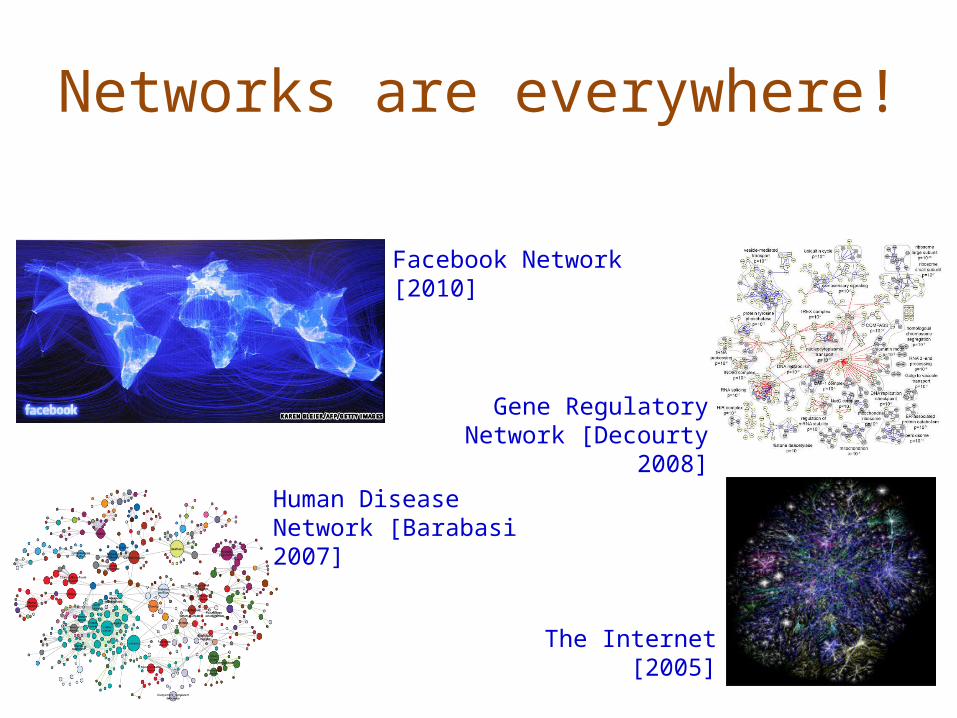
Why do we care?
• Online Information Diffusion• Viral Marketing• Epidemiology and Public Health• Cyber Security• Human mobility • Games and Virtual Worlds • Ecology........
5
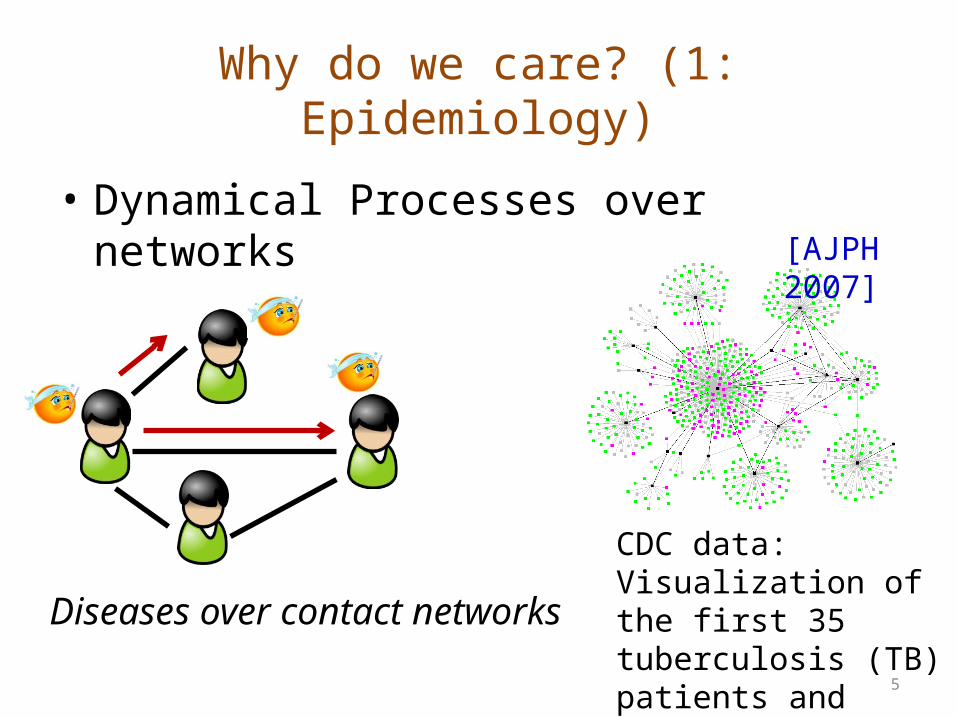
Why do we care? (1: Epidemiology)
• Dynamical Processes over networks[AJPH 2007]
CDC data: Visualization of the first 35 tuberculosis (TB) patients and their 1039 contacts
Diseases over contact networks

6
Why do we care? (1: Epidemiology)
• Dynamical Processes over networks
• Each circle is a hospital• ~3000 hospitals• More than 30,000 patients transferred
[US-MEDICARE NETWORK 2005]
Problem: Given k units of disinfectant, whom to immunize?
7
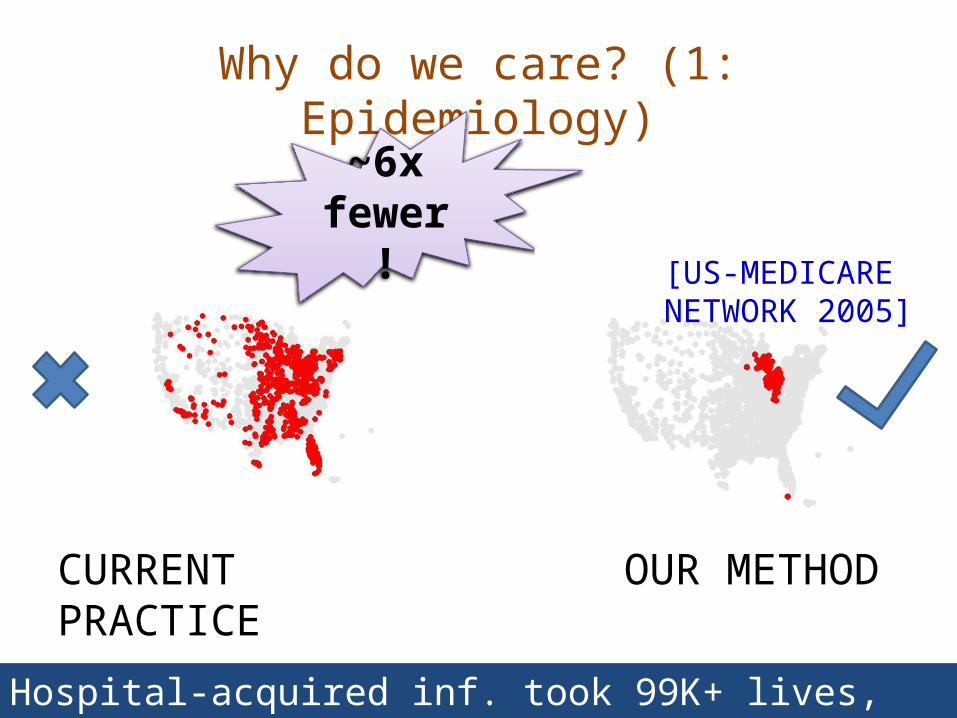
Why do we care? (1: Epidemiology)
CURRENT PRACTICE OUR METHOD
~6x fewer!
[US-MEDICARE NETWORK 2005]
Hospital-acquired inf. took 99K+ lives, cost $5B+ (all per year)

8
Why do we care? (2: Online Diffusion)
> 800m users, ~$1B revenue [WSJ 2010]
~100m active users
> 50m users

9
Why do we care? (2: Online Diffusion)
• Dynamical Processes over networks
Celebrity
Buy Versace™!
Followers
Social Media Marketing
10
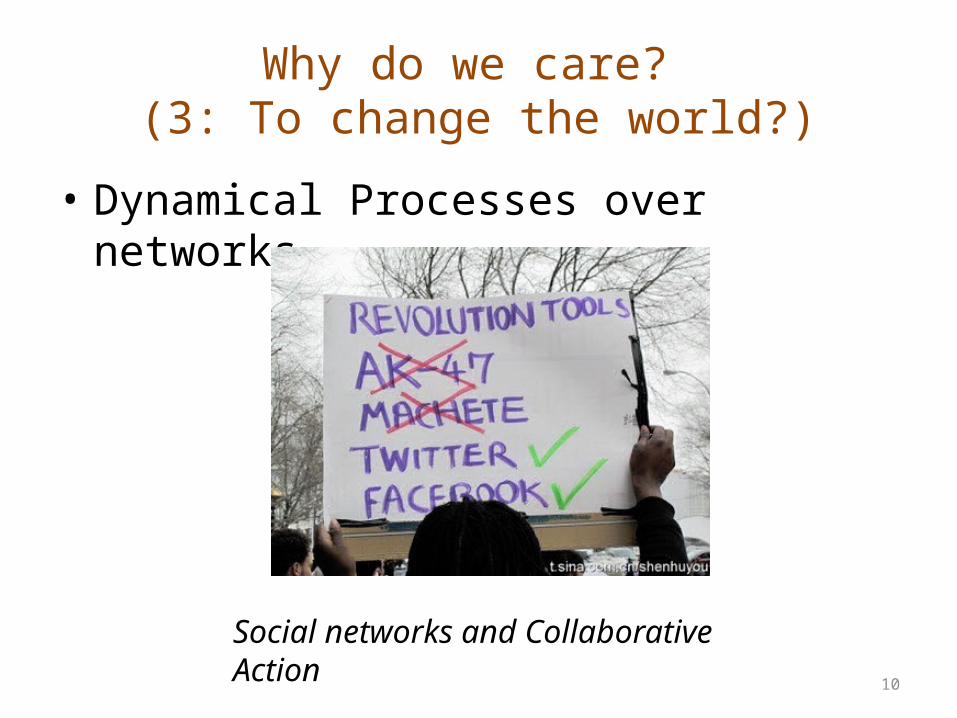
Why do we care? (3: To change the world?)
• Dynamical Processes over networks
Social networks and Collaborative Action

11
High Impact – Multiple Settings
Q. How to squash rumors faster?
Q. How do opinions spread?
Q. How to market better?
epidemic out-breaks
products/viruses
transmit s/w patches

12
Research Theme
DATALarge real-world
networks & processes
ANALYSISUnderstanding
POLICY/ ACTIONManaging
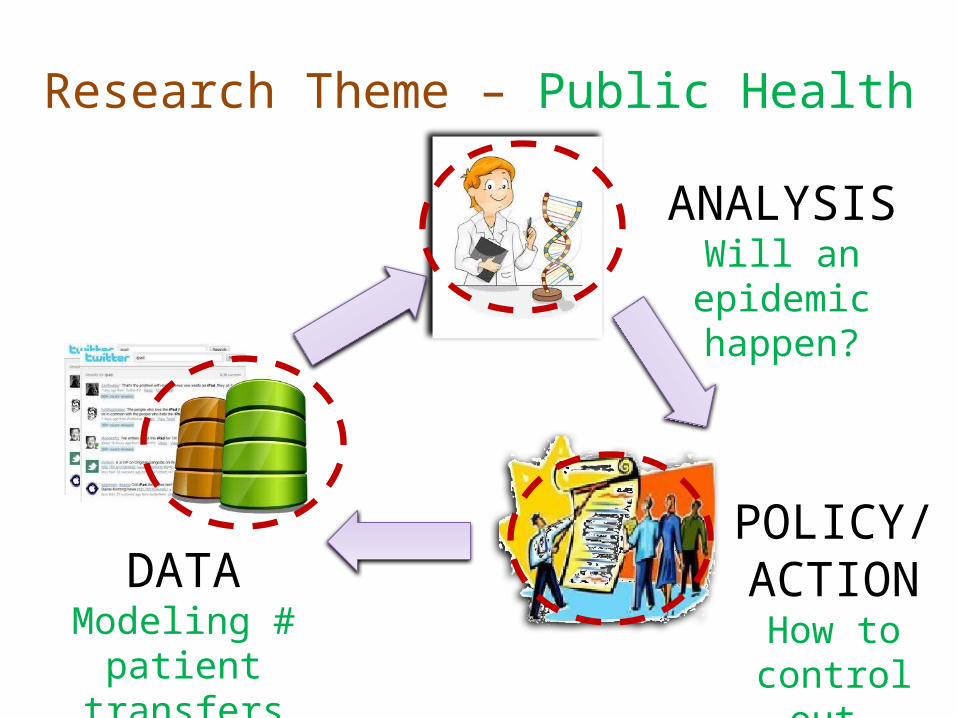
Research Theme – Public Health
DATAModeling # patient
transfers
ANALYSISWill an epidemic
happen?
POLICY/ ACTION
How to control out-breaks?

Research Theme – Social Media
DATAModeling Tweets
spreading
POLICY/ ACTION
How to market better?
ANALYSIS# cascades in
future?

15
In this talk
ANALYSISUnderstanding
Given propagation models:
Q1: Will an epidemic happen?

16
In this talk
Q2: How to immunize and control out-breaks better?
POLICY/ ACTIONManaging

17
In this talk
DATALarge real-world
networks & processes
Q3: How do #hashtags spread?

18
Outline
• Motivation• Epidemics: what happens? (Theory)• Action: Who to immunize? (Algorithms)• Learning Models: Twitter (Empirical Studies)• Other
19
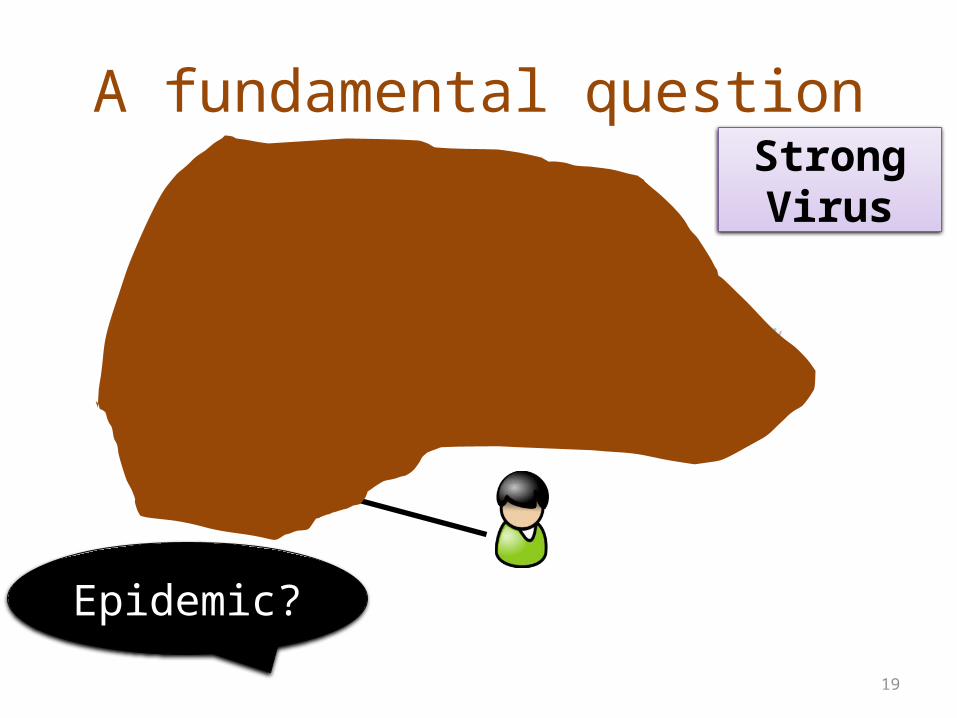
A fundamental questionStrong Virus
Epidemic?

20
example (static graph)Weak Virus
Epidemic?

21
Problem Statement
Find, a condition under which– virus will die out exponentially quickly– regardless of initial infection condition
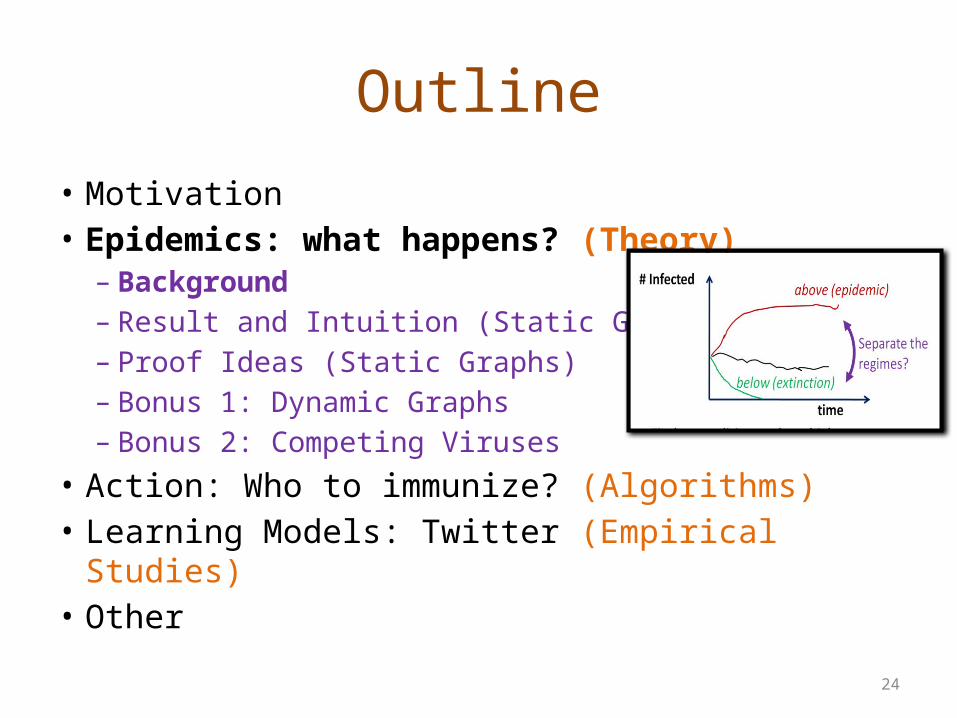
above (epidemic)
below (extinction)
# Infected
time
Separate the regimes?

22
Threshold (static version)
Problem Statement• Given: –Graph G, and –Virus specs (attack prob. etc.)
• Find: –A condition for virus extinction/invasion

23
Threshold: Why important?
• Accelerating simulations• Forecasting (‘What-if’ scenarios)• Design of contagion and/or topology• A great handle to manipulate the spreading– Immunization– Maximize collaboration…..
24
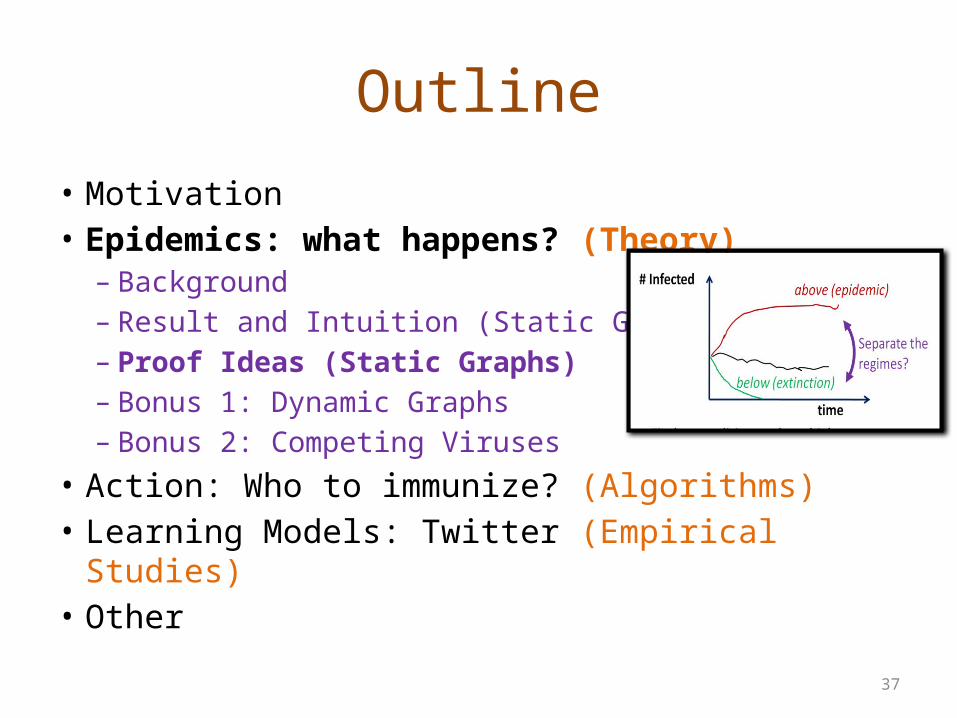
Outline
• Motivation• Epidemics: what happens? (Theory)– Background– Result and Intuition (Static Graphs)– Proof Ideas (Static Graphs)– Bonus 1: Dynamic Graphs– Bonus 2: Competing Viruses
• Action: Who to immunize? (Algorithms)• Learning Models: Twitter (Empirical Studies)• Other

25
“SIR” model: life immunity (mumps)
• Each node in the graph is in one of three states– Susceptible (i.e. healthy)– Infected– Removed (i.e. can’t get infected again)
Prob. β Prob. δ
t = 1 t = 2 t = 3
Background

26
Terminology: continued
• Other virus propagation models (“VPM”)– SIS : susceptible-infected-susceptible, flu-like– SIRS : temporary immunity, like pertussis– SEIR : mumps-like, with virus incubation (E = Exposed)….………….
• Underlying contact-network – ‘who-can-infect-whom’
Background
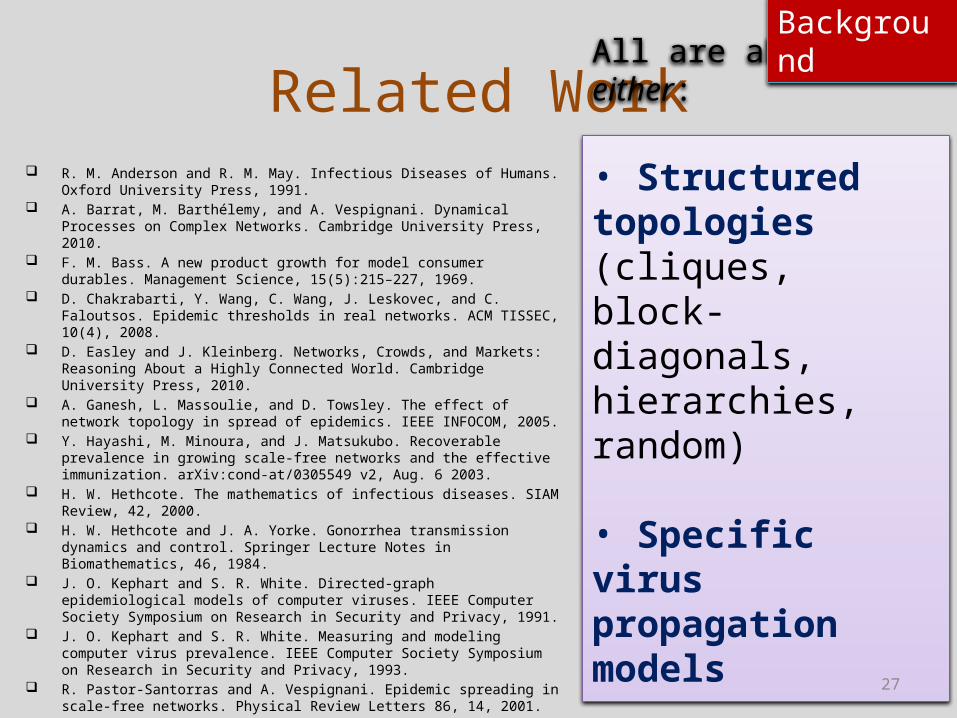
27
Related Work R. M. Anderson and R. M. May. Infectious Diseases of Humans. Oxford University Press,
1991. A. Barrat, M. Barthélemy, and A. Vespignani. Dynamical Processes on Complex Networks.
Cambridge University Press, 2010. F. M. Bass. A new product growth for model consumer durables. Management Science,
15(5):215–227, 1969. D. Chakrabarti, Y. Wang, C. Wang, J. Leskovec, and C. Faloutsos. Epidemic thresholds in
real networks. ACM TISSEC, 10(4), 2008. D. Easley and J. Kleinberg. Networks, Crowds, and Markets: Reasoning About a Highly
Connected World. Cambridge University Press, 2010. A. Ganesh, L. Massoulie, and D. Towsley. The effect of network topology in spread of
epidemics. IEEE INFOCOM, 2005. Y. Hayashi, M. Minoura, and J. Matsukubo. Recoverable prevalence in growing scale-free
networks and the effective immunization. arXiv:cond-at/0305549 v2, Aug. 6 2003. H. W. Hethcote. The mathematics of infectious diseases. SIAM Review, 42, 2000. H. W. Hethcote and J. A. Yorke. Gonorrhea transmission dynamics and control. Springer
Lecture Notes in Biomathematics, 46, 1984. J. O. Kephart and S. R. White. Directed-graph epidemiological models of computer
viruses. IEEE Computer Society Symposium on Research in Security and Privacy, 1991. J. O. Kephart and S. R. White. Measuring and modeling computer virus prevalence. IEEE
Computer Society Symposium on Research in Security and Privacy, 1993. R. Pastor-Santorras and A. Vespignani. Epidemic spreading in scale-free networks.
Physical Review Letters 86, 14, 2001.
……… ……… ………
All are about either:
• Structured topologies (cliques, block-diagonals, hierarchies, random)
• Specific virus propagation models
• Static graphs
Background

28
Outline
• Motivation• Epidemics: what happens? (Theory)– Background– Result and Intuition (Static Graphs)– Proof Ideas (Static Graphs)– Bonus 1: Dynamic Graphs– Bonus 2: Competing Viruses
• Action: Who to immunize? (Algorithms)• Learning Models: Twitter (Empirical Studies)• Other

29
How should the answer look like?
• Answer should depend on:– Graph– Virus Propagation Model (VPM)
• But how??– Graph – average degree? max. degree? diameter?– VPM – which parameters? – How to combine – linear? quadratic? exponential?
?diameterdavg ?/)( max22 ddd avgavg …..

30
Static Graphs: Our Main Result
• Informally,
•
For, any arbitrary topology (adjacency matrix A) any virus propagation model (VPM) in standard literature
the epidemic threshold depends only 1. on the λ, first eigenvalue of A, and 2. some constant , determined by
the virus propagation model
λVPMC
No epidemic if λ *
< 1
VPMCVPMC
In Prakash+ ICDM 2011 (Selected among best papers).
31
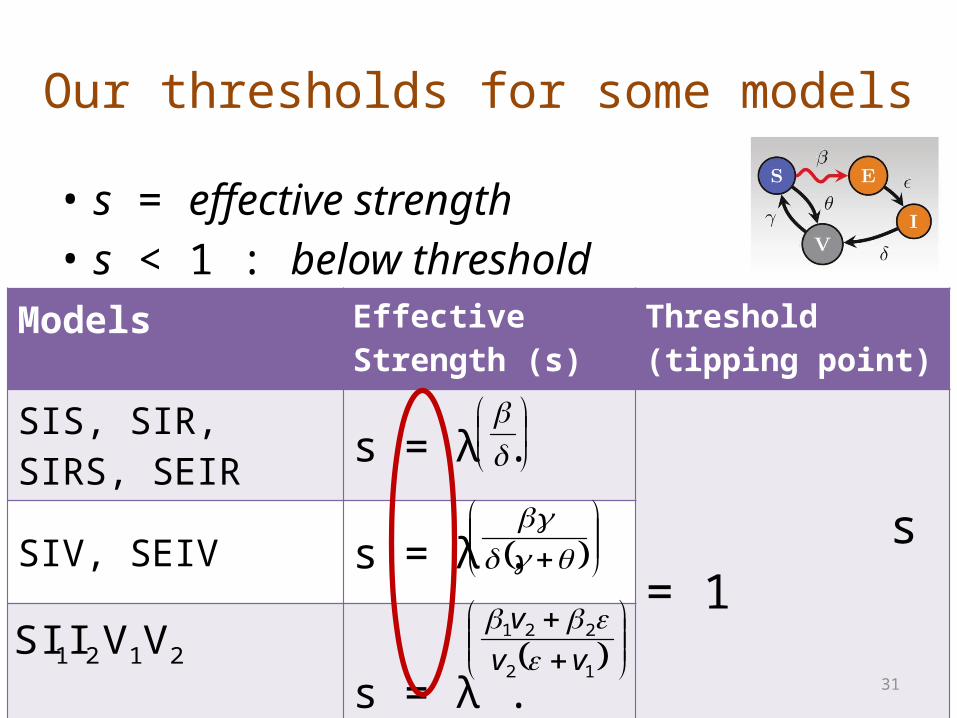
Our thresholds for some models
• s = effective strength• s < 1 : below threshold
Models Effective Strength (s) Threshold (tipping point)
SIS, SIR, SIRS, SEIRs = λ .
s = 1
SIV, SEIV s = λ .
(H.I.V.) s = λ .
12
221
vv
v
2121 VVISI
32
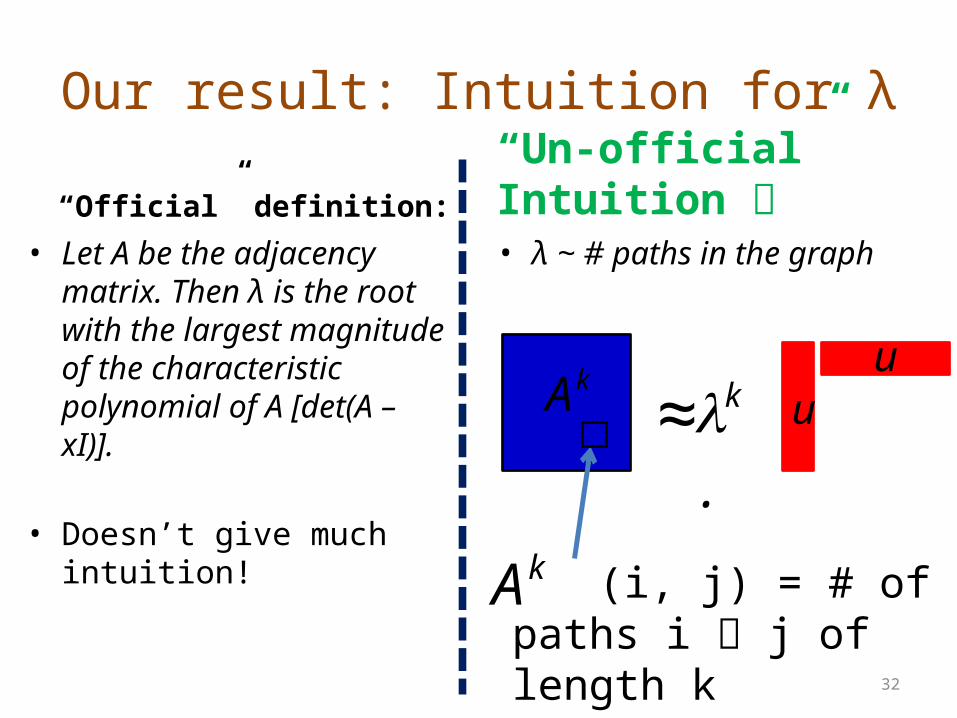
Our result: Intuition for λ
“Official” definition:• Let A be the adjacency
matrix. Then λ is the root with the largest magnitude of the characteristic polynomial of A [det(A – xI)].
• Doesn’t give much intuition!
“Un-official” Intuition • λ ~ # paths in the
graph
uu≈ .
kkA
(i, j) = # of paths i j of length k
kA

33
better connectivity higher λ
Largest Eigenvalue (λ)

34N nodes
Largest Eigenvalue (λ)
λ ≈ 2 λ = N λ = N-1
N = 1000λ ≈ 2 λ= 31.67 λ= 999
better connectivity higher λ
35
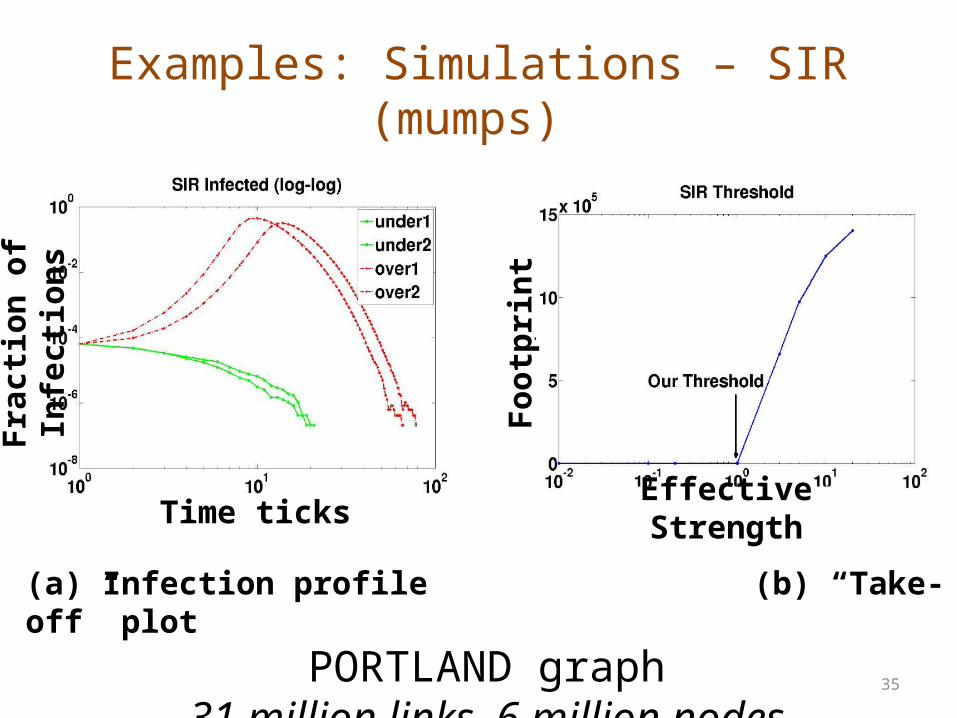
Examples: Simulations – SIR (mumps)
(a) Infection profile (b) “Take-off” plot
PORTLAND graph31 million links, 6 million nodes
Frac
tion
of In
fecti
ons
Foot
prin
tEffective StrengthTime ticks
36
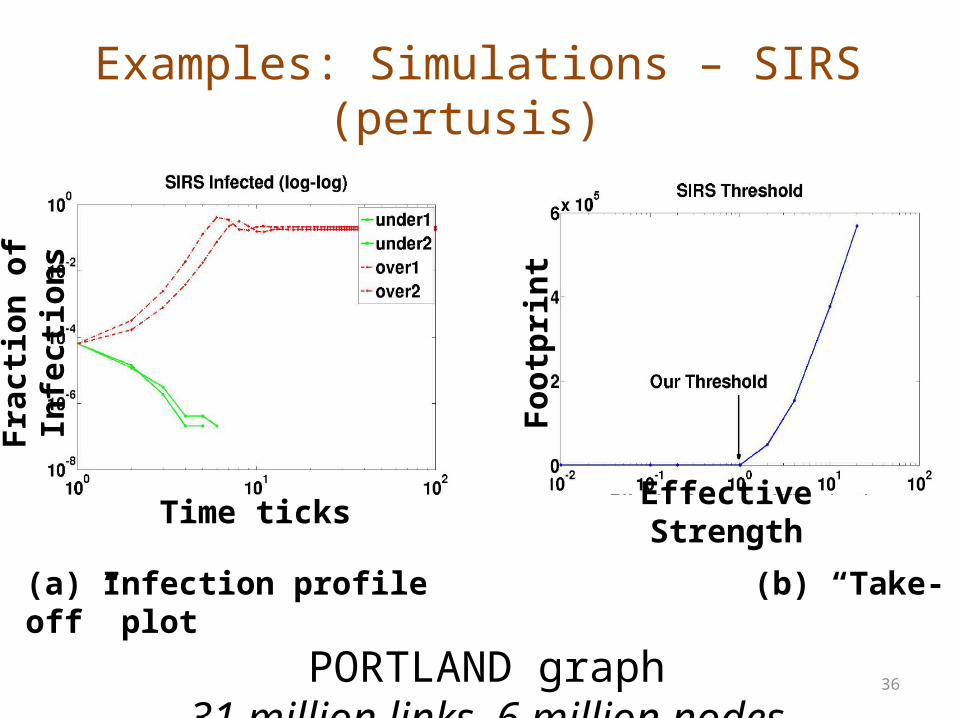
Examples: Simulations – SIRS (pertusis)
Frac
tion
of In
fecti
ons
Foot
prin
tEffective StrengthTime ticks
(a) Infection profile (b) “Take-off” plot
PORTLAND graph31 million links, 6 million nodes
37
Outline
• Motivation• Epidemics: what happens? (Theory)– Background– Result and Intuition (Static Graphs)– Proof Ideas (Static Graphs)– Bonus 1: Dynamic Graphs– Bonus 2: Competing Viruses
• Action: Who to immunize? (Algorithms)• Learning Models: Twitter (Empirical Studies)• Other
38
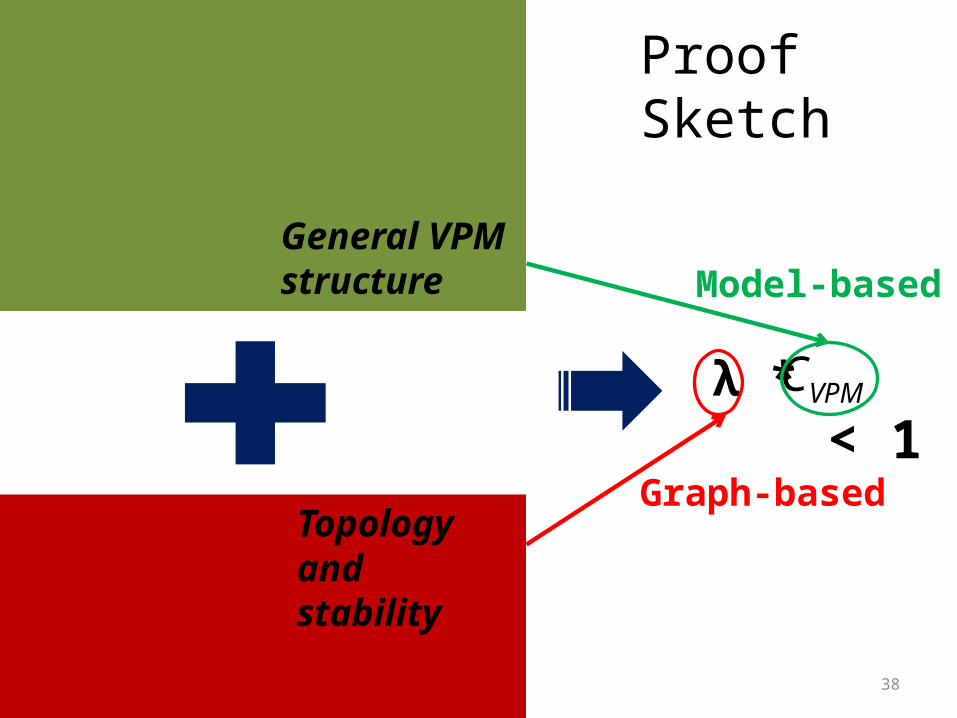
λ * < 1VPMC
Graph-based
Model-based
Proof Sketch
General VPM structure
Topology and stability
39
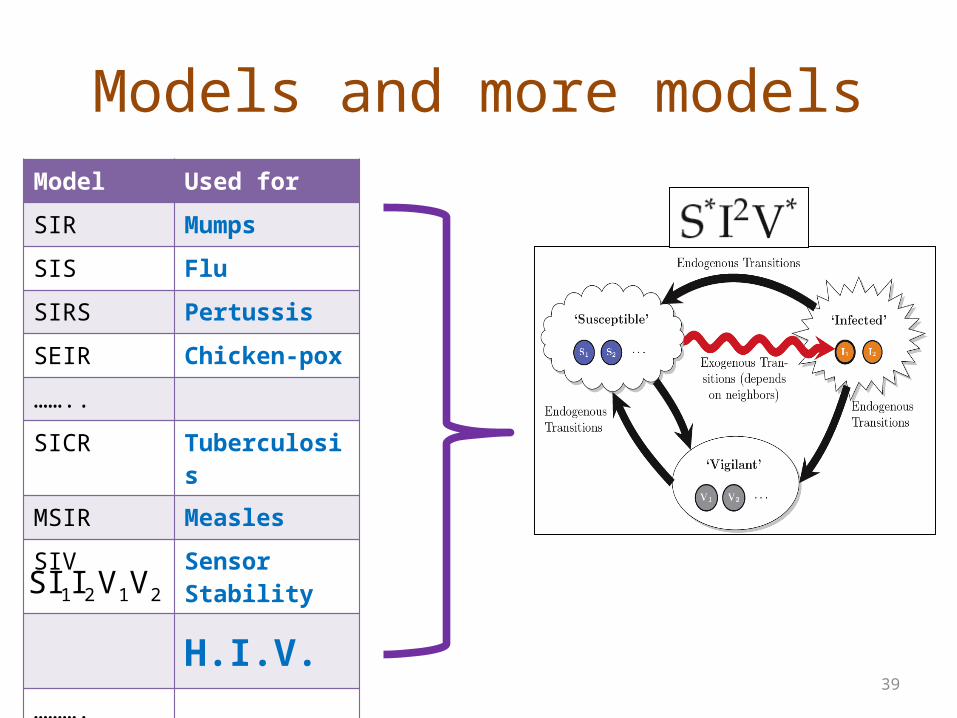
Models and more modelsModel Used for
SIR Mumps
SIS Flu
SIRS Pertussis
SEIR Chicken-pox
……..
SICR Tuberculosis
MSIR Measles
SIV Sensor Stability
H.I.V.……….
2121 VVISI

40
Ingredient 1: Our generalized model
Endogenous Transitions
Susceptible Infected
Vigilant
Exogenous Transitions
Endogenous Transitions
Endogenous Transitions
Susceptible Infected
Vigilant

41
Special case
Susceptible Infected
Vigilant

42
Special case: H.I.V.
2121 VVISI
Multiple Infectious, Vigilant states
“Terminal”
“Non-terminal”
43
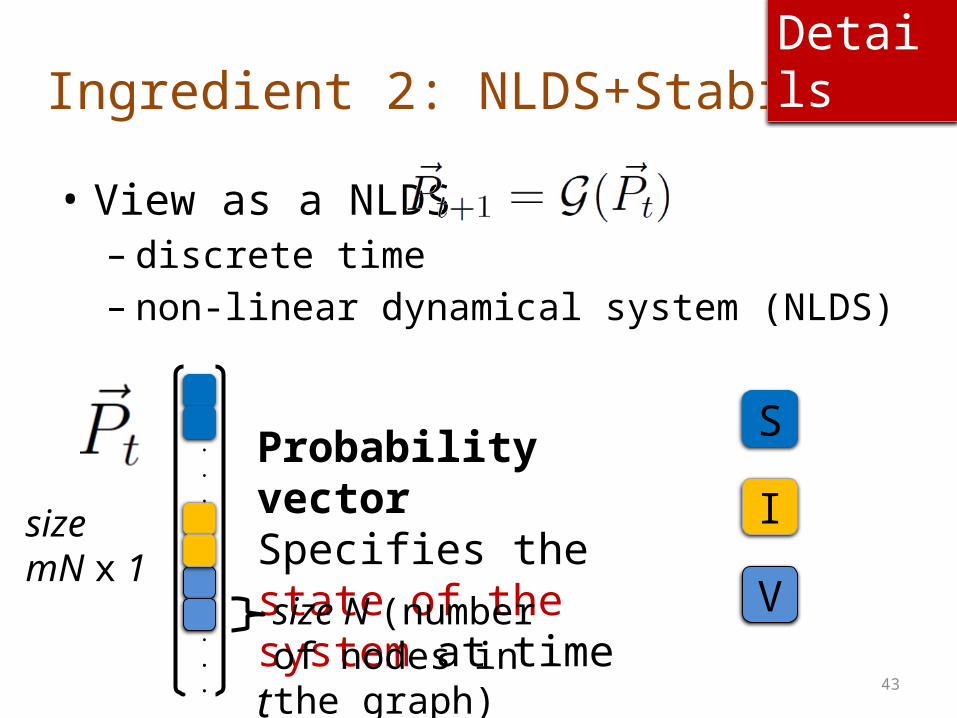
Ingredient 2: NLDS+Stability
• View as a NLDS– discrete time – non-linear dynamical system (NLDS)
Probability vector Specifies the state of the system at time t
Details
size mN x 1
.
.
.
.
.
size N (number of nodes in the graph)
.
.
.
S
I
V

44
Ingredient 2: NLDS + Stability
• View as a NLDS– discrete time – non-linear dynamical system (NLDS)
Non-linear functionExplicitly gives the evolution of system
Details
size mN x 1
.
.
.
.
.
.
.
.
45
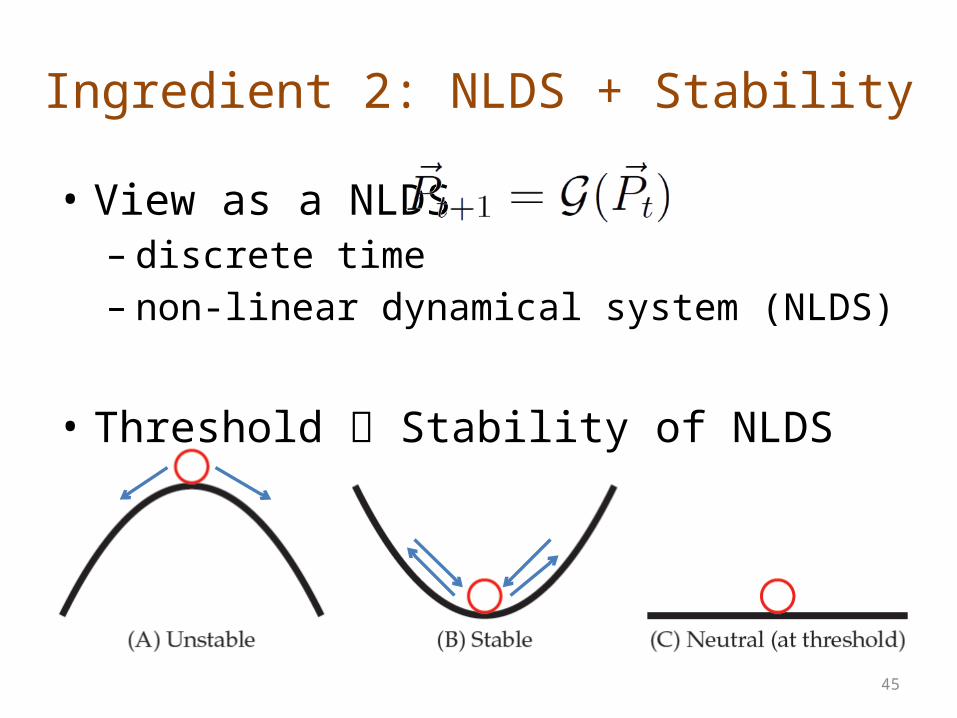
Ingredient 2: NLDS + Stability
• View as a NLDS– discrete time – non-linear dynamical system (NLDS)
• Threshold Stability of NLDS

46
= probability that node i is not attacked by any of its infectious neighbors
Special case: SIR
size 3N x 1 I
R
S
NLDS
I
R
S
Details

47
Fixed Point
11.
00.
00.
State when no node is infected
Q: Is it stable?
Details
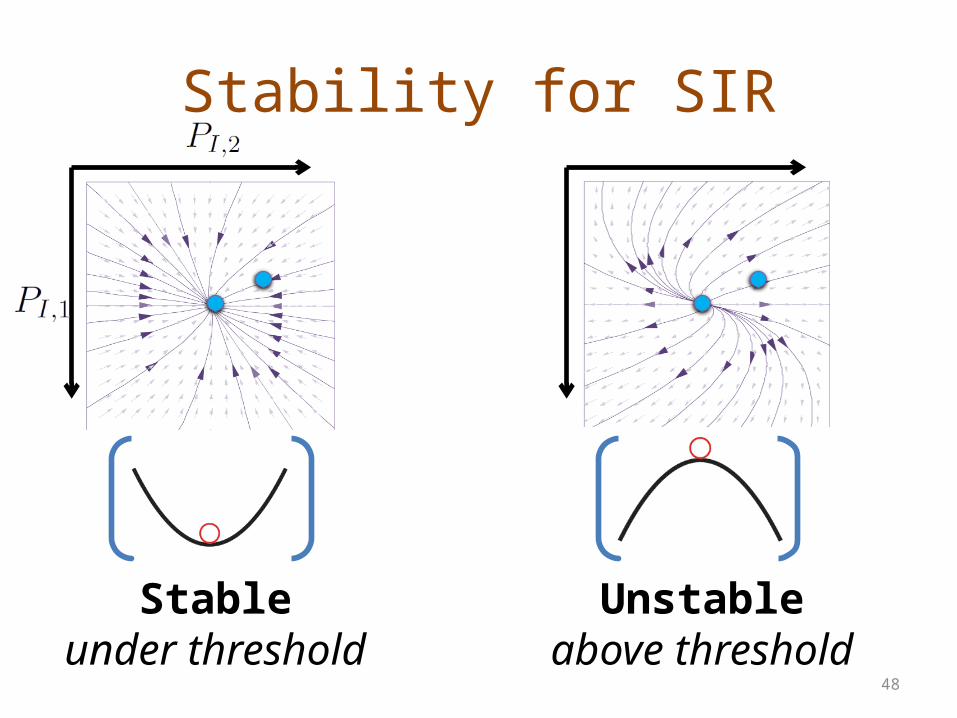
48
Stability for SIR
Stableunder threshold
Unstableabove threshold

49
λ * < 1VPMC
Graph-based
Model-basedGeneral VPM structure
Topology and stability
See paper for full proof
50
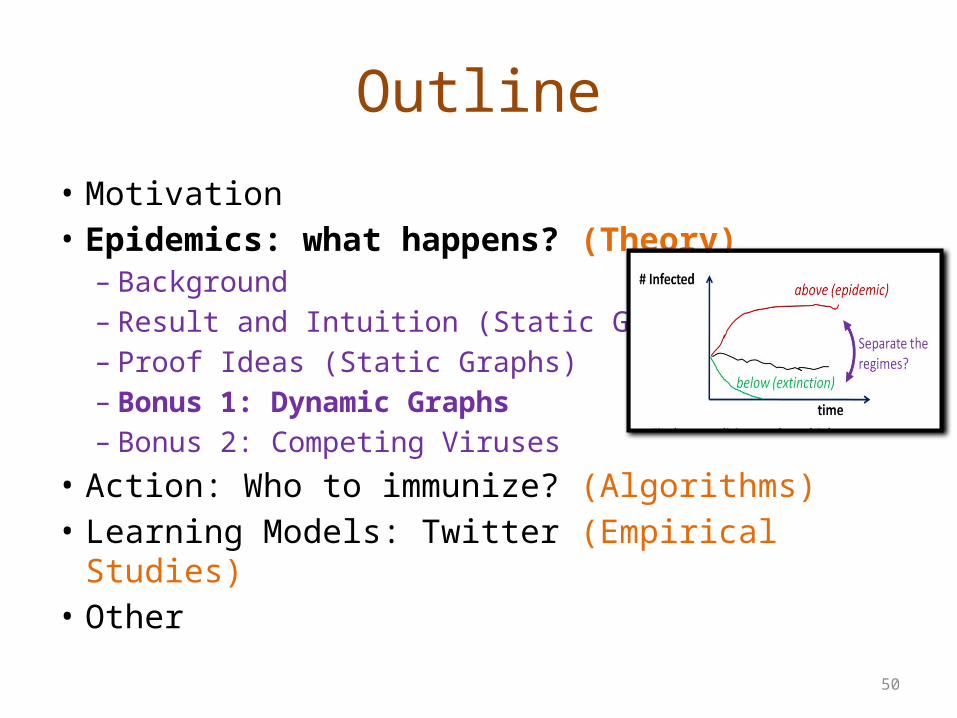
Outline
• Motivation• Epidemics: what happens? (Theory)– Background– Result and Intuition (Static Graphs)– Proof Ideas (Static Graphs)– Bonus 1: Dynamic Graphs– Bonus 2: Competing Viruses
• Action: Who to immunize? (Algorithms)• Learning Models: Twitter (Empirical Studies)• Other

51
Dynamic Graphs: Epidemic?
adjacency matrix
8
8
Alternating behaviorsDAY (e.g., work)
52
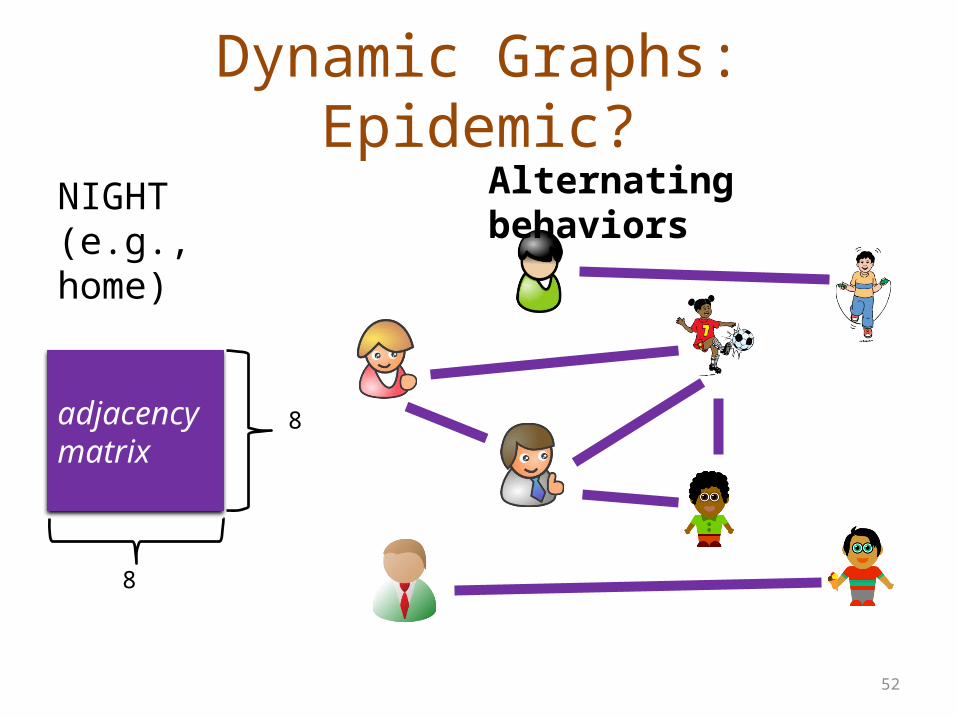
adjacency matrix
8
8
Dynamic Graphs: Epidemic?Alternating behaviorsNIGHT
(e.g., home)
53
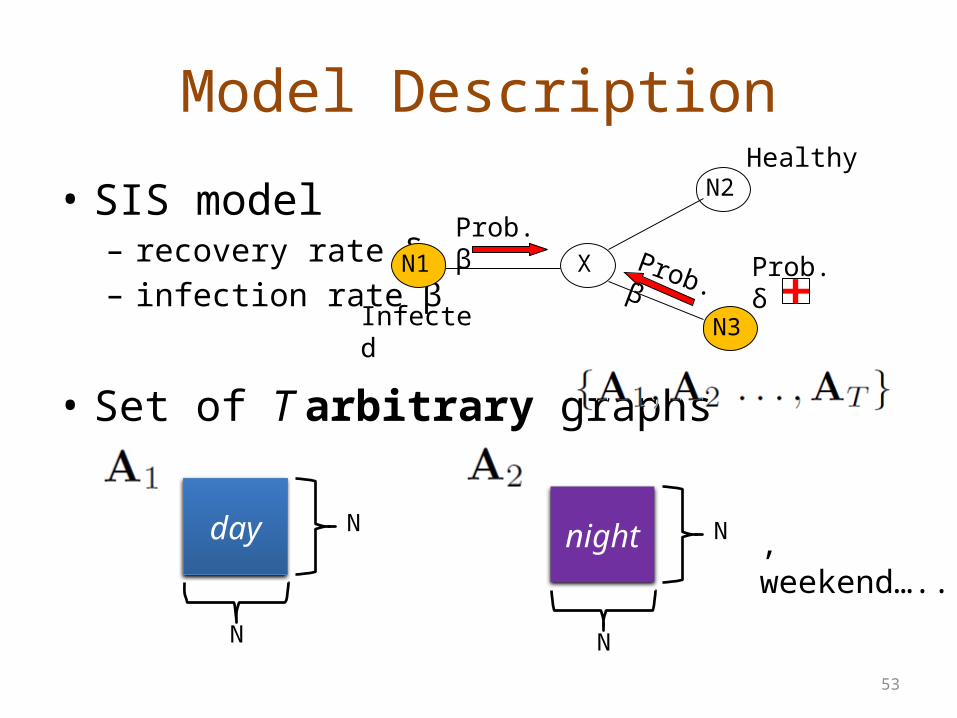
• SIS model– recovery rate δ– infection rate β
• Set of T arbitrary graphs
Model Description
day
N
N night
N
N , weekend…..
Infected
Healthy
XN1
N3
N2
Prob. βProb. β Prob. δ

54
• Informally, NO epidemic if
eig (S) = < 1
Our result: Dynamic Graphs Threshold
Single number! Largest eigenvalue of The system matrix S
In Prakash+, ECML-PKDD 2010
S =
Details

55
Synthetic MIT Reality Mining
log(fraction infected)
Time
BELOW
AT
ABOVE ABOVE
AT
BELOW
Infection-profile
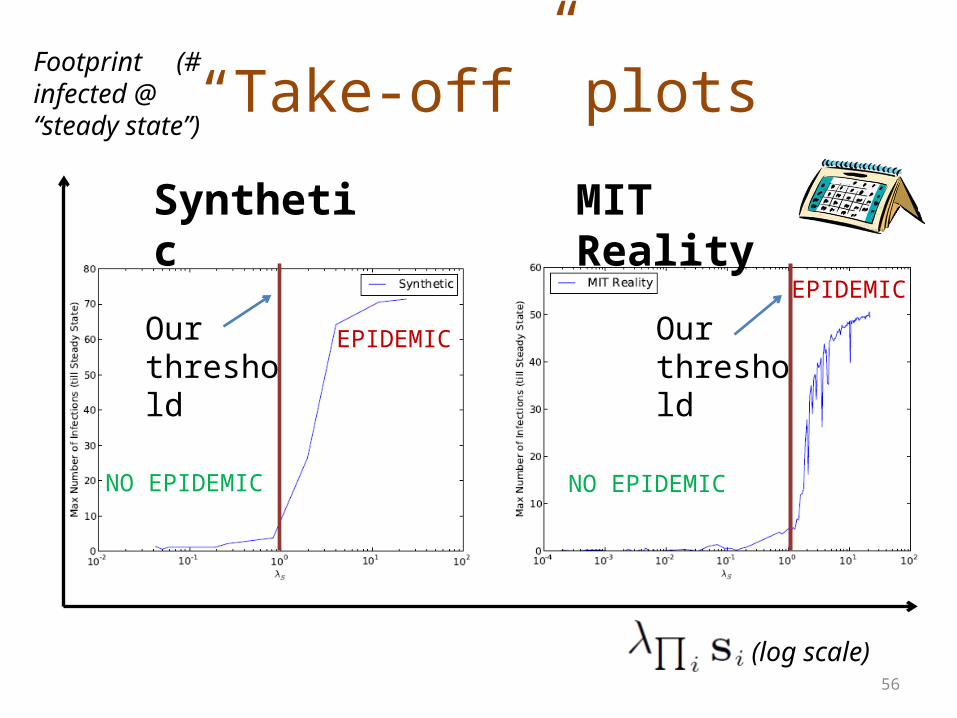
56
“Take-off” plotsFootprint (# infected @ “steady state”)
Our threshold
Our threshold
(log scale)
NO EPIDEMIC
EPIDEMIC
EPIDEMIC
NO EPIDEMIC
Synthetic MIT Reality
57
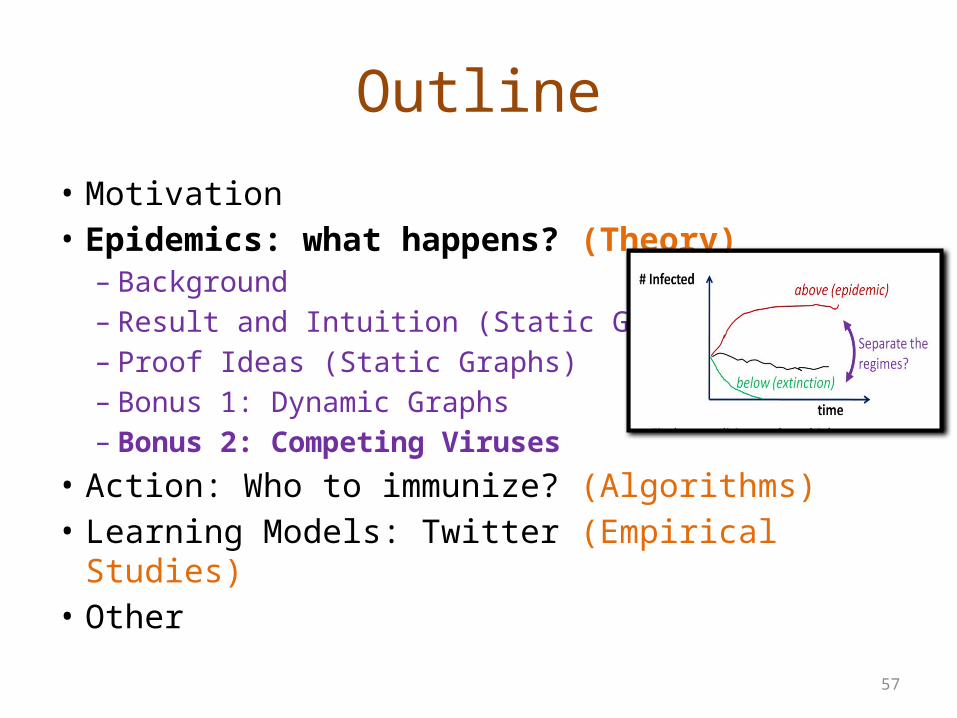
Outline
• Motivation• Epidemics: what happens? (Theory)– Background– Result and Intuition (Static Graphs)– Proof Ideas (Static Graphs)– Bonus 1: Dynamic Graphs– Bonus 2: Competing Viruses
• Action: Who to immunize? (Algorithms)• Learning Models: Twitter (Empirical Studies)• Other
58
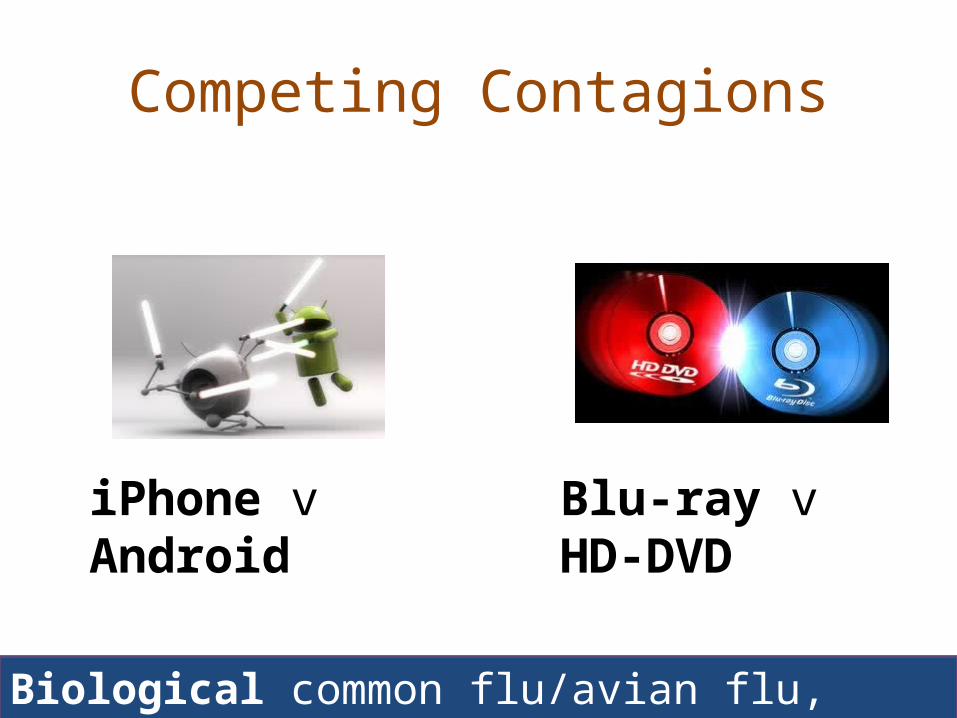
Competing Contagions
iPhone v Android Blu-ray v HD-DVD
Biological common flu/avian flu, pneumococcal inf etc

59
A simple model
• Modified flu-like • Mutual Immunity (“pick one of the two”)• Susceptible-Infected1-Infected2-Susceptible
Virus 1 Virus 2
Details

60
Question: What happens in the end?
green: virus 1red: virus 2
Footprint @ Steady State Footprint @ Steady State = ?
Number of Infections
ASSUME: Virus 1 is stronger than Virus 2

61
Question: What happens in the end?
green: virus 1red: virus 2
Number of Infections
ASSUME: Virus 1 is stronger than Virus 2
Strength Strength
??= Strength Strength
2
Footprint @ Steady State Footprint @ Steady State

62
Answer: Winner-Takes-All
green: virus 1red: virus 2
ASSUME: Virus 1 is stronger than Virus 2
Number of Infections
63
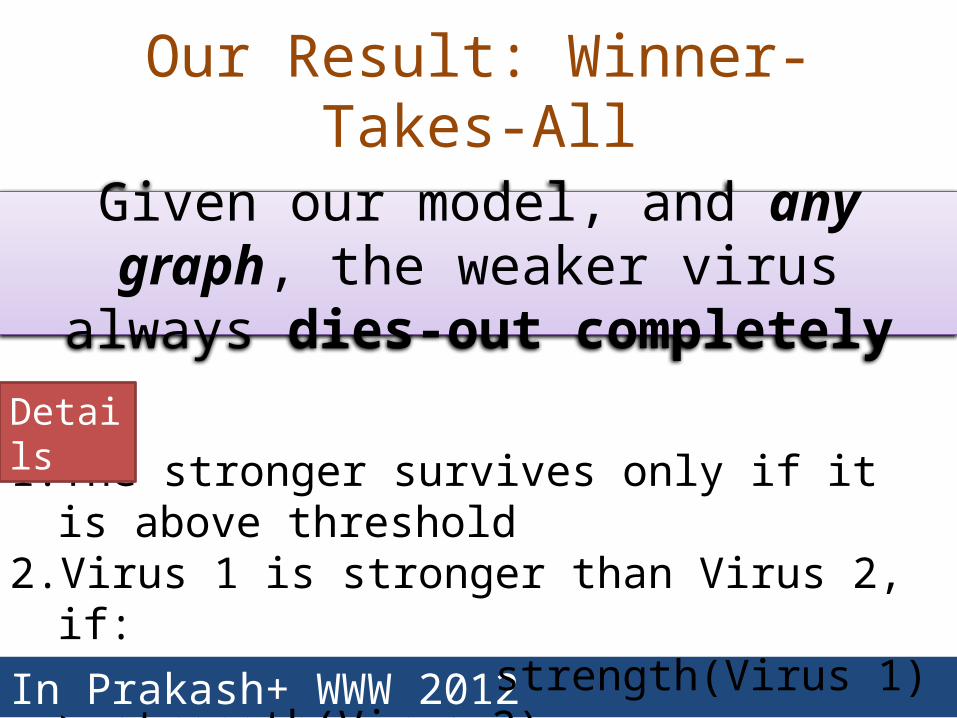
Our Result: Winner-Takes-All
In Prakash+ WWW 2012
Given our model, and any graph, the weaker virus always dies-out completely
1. The stronger survives only if it is above threshold 2. Virus 1 is stronger than Virus 2, if: strength(Virus 1) > strength(Virus 2)3. Strength(Virus) = λ β / δ same as before!
Details

64
Real Examples
Reddit v Digg Blu-Ray v HD-DVD
[Google Search Trends data]

65
Outline
• Motivation• Epidemics: what happens? (Theory)• Action: Who to immunize? (Algorithms)• Learning Models: Twitter (Empirical Studies)• Other

66
?
?
Given: a graph A, virus prop. model and budget k; Find: k ‘best’ nodes for immunization (removal).
k = 2
??
Full Static Immunization

67
Outline
• Motivation• Epidemics: what happens? (Theory)• Action: Who to immunize? (Algorithms)– Full Immunization (Static Graphs)– Fractional Immunization
• Learning Models: Twitter (Empirical Studies)• Other

68
Challenges
• Given a graph A, budget k, Q1 (Metric) How to measure the ‘shield-
value’ for a set of nodes (S)?
Q2 (Algorithm) How to find a set of k nodes with highest ‘shield-value’?
69
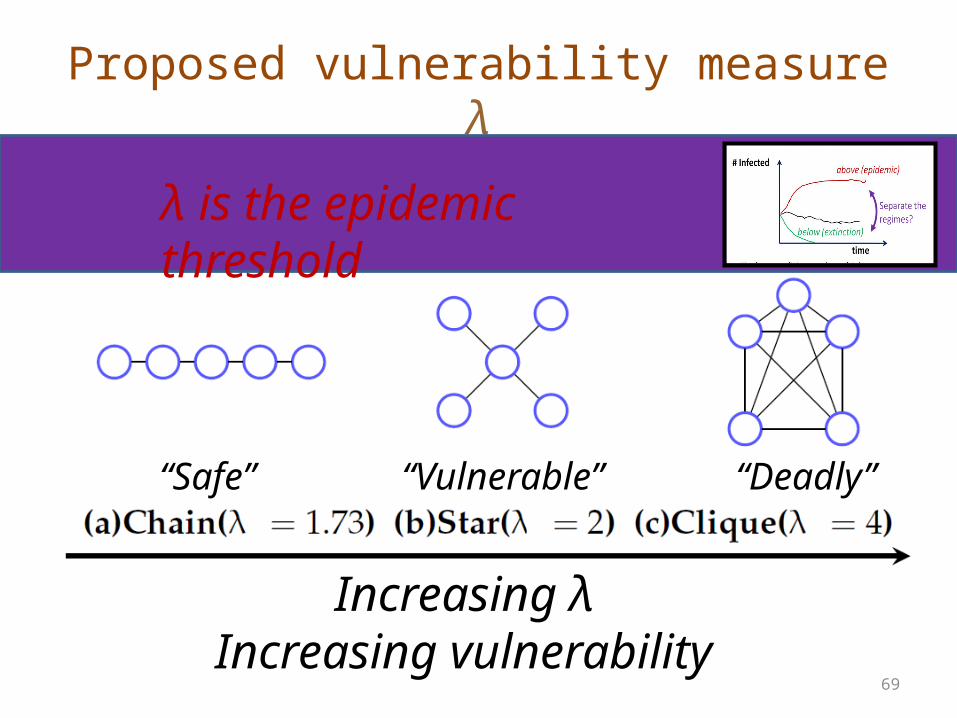
Proposed vulnerability measure λ
Increasing λ Increasing vulnerability
λ is the epidemic threshold
“Safe” “Vulnerable” “Deadly”
70
1
9
10
3
4
5
7
8
6
2
9
1
11
10
3
4
56
7
8
2
9
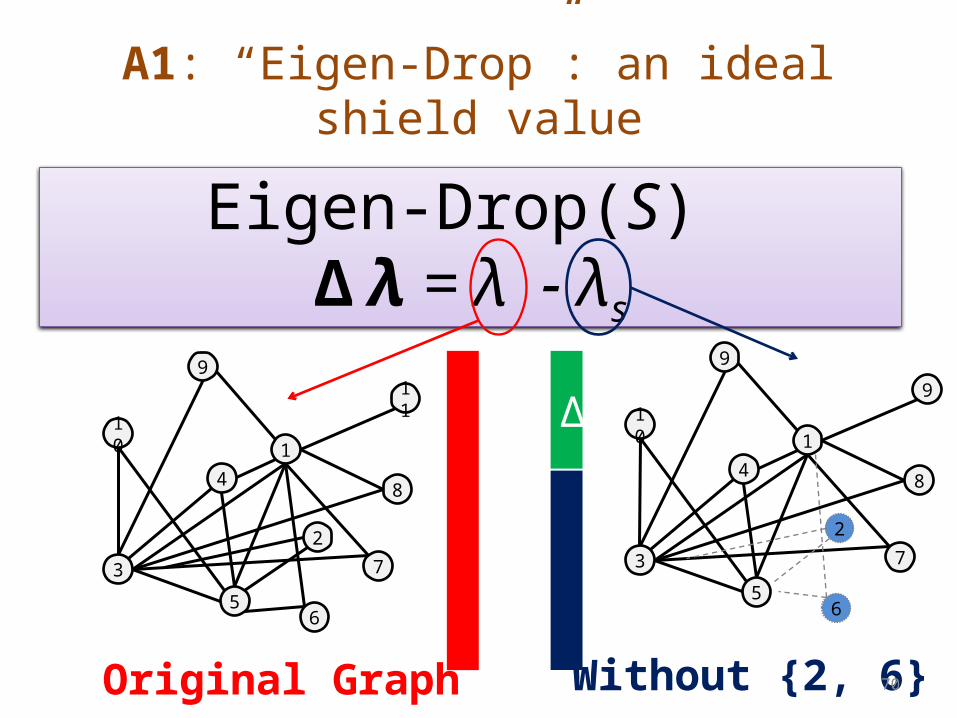
Original Graph Without {2, 6}
Eigen-Drop(S) Δ λ = λ - λs
Δ
A1: “Eigen-Drop”: an ideal shield value
71
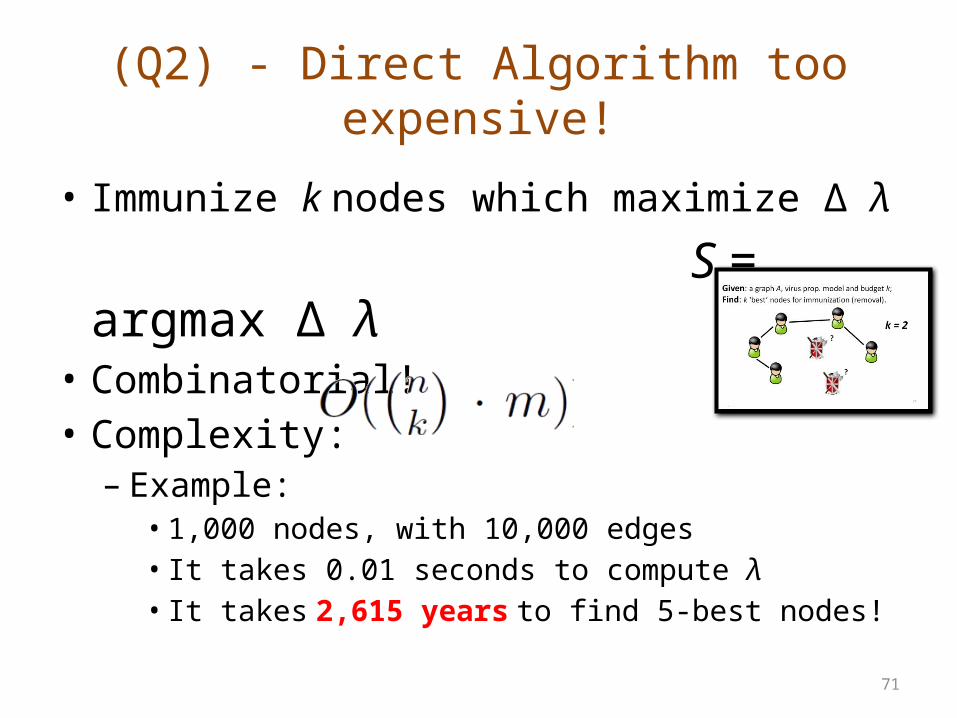
(Q2) - Direct Algorithm too expensive!
• Immunize k nodes which maximize Δ λ
S = argmax Δ λ• Combinatorial!• Complexity:– Example: • 1,000 nodes, with 10,000 edges • It takes 0.01 seconds to compute λ• It takes 2,615 years to find 5-best nodes!

72
A2: Our Solution
• Part 1: Shield Value–Carefully approximate Eigen-drop (Δ λ)–Matrix perturbation theory
• Part 2: Algorithm–Greedily pick best node at each step–Near-optimal due to submodularity
• NetShield (linear complexity)–O(nk2+m) n = # nodes; m = # edges
In Tong, Prakash+ ICDM 2010

73
Experiment: Immunization qualityLog(fraction of infected nodes)
NetShield
Degree
PageRank
Eigs (=HITS)Acquaintance
Betweeness (shortest path)
Lower is
better Time

74
Outline
• Motivation• Epidemics: what happens? (Theory)• Action: Who to immunize? (Algorithms)– Full Immunization (Static Graphs)– Fractional Immunization
• Learning Models: Twitter (Empirical Studies)• Other
75
Fractional Immunization of NetworksB. Aditya Prakash, Lada Adamic, Theodore Iwashyna (M.D.), Hanghang Tong, Christos Faloutsos
Submitted to PNAS

Fractional Asymmetric Immunization
Hospital Another Hospital
76
Drug-resistant Bacteria (like XDR-TB)
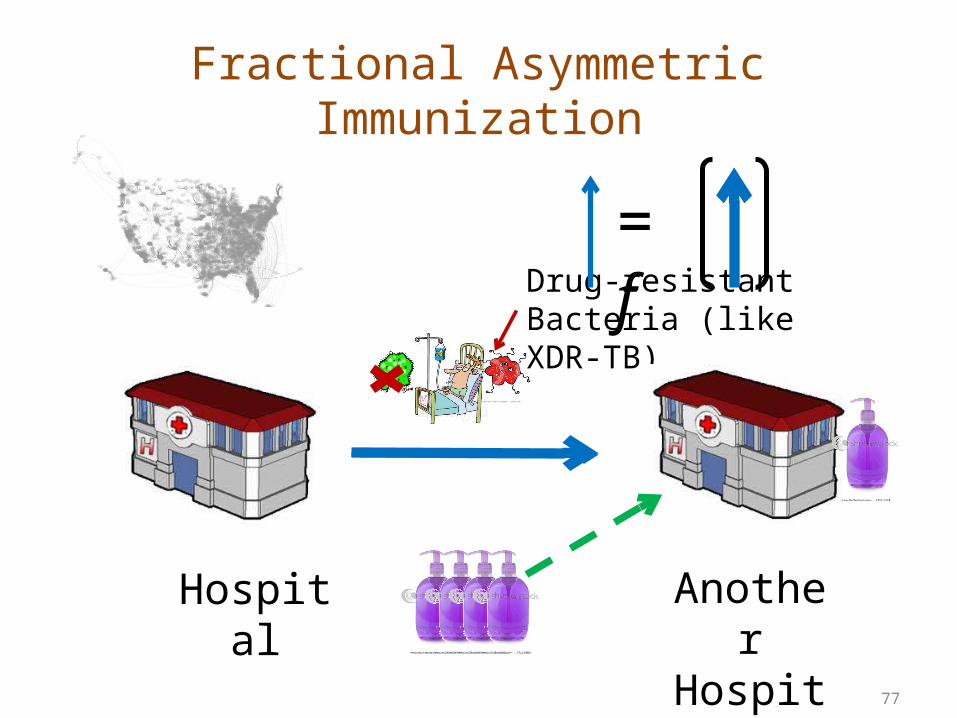
Fractional Asymmetric Immunization
Hospital Another Hospital
Drug-resistant Bacteria (like XDR-TB)
77
= f
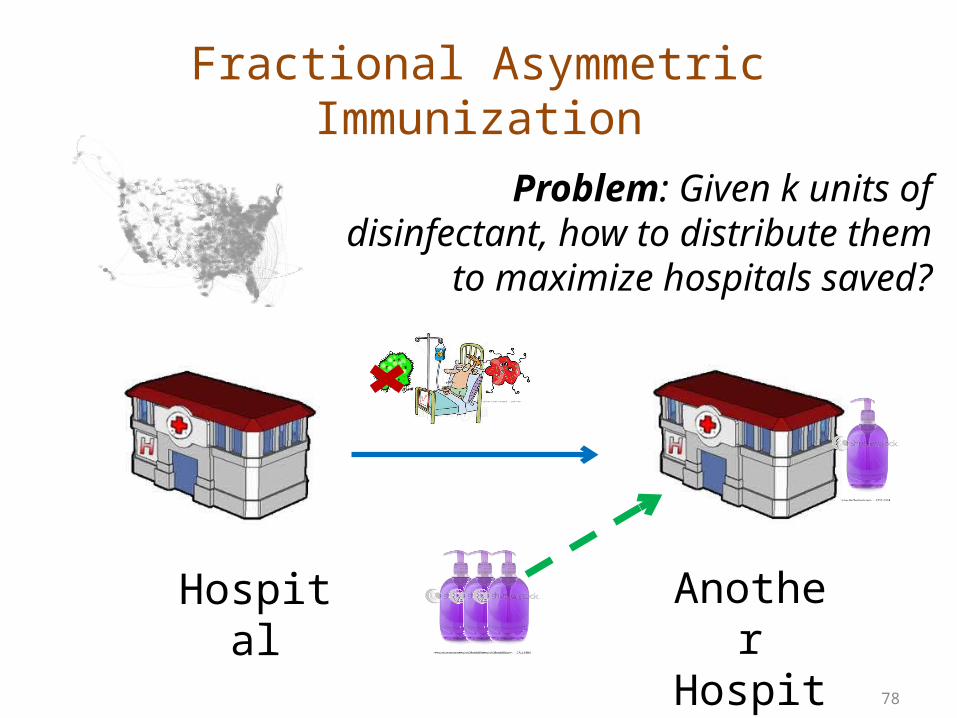
Fractional Asymmetric Immunization
Hospital Another Hospital
78
Problem: Given k units of disinfectant, how to distribute them to maximize
hospitals saved?
79
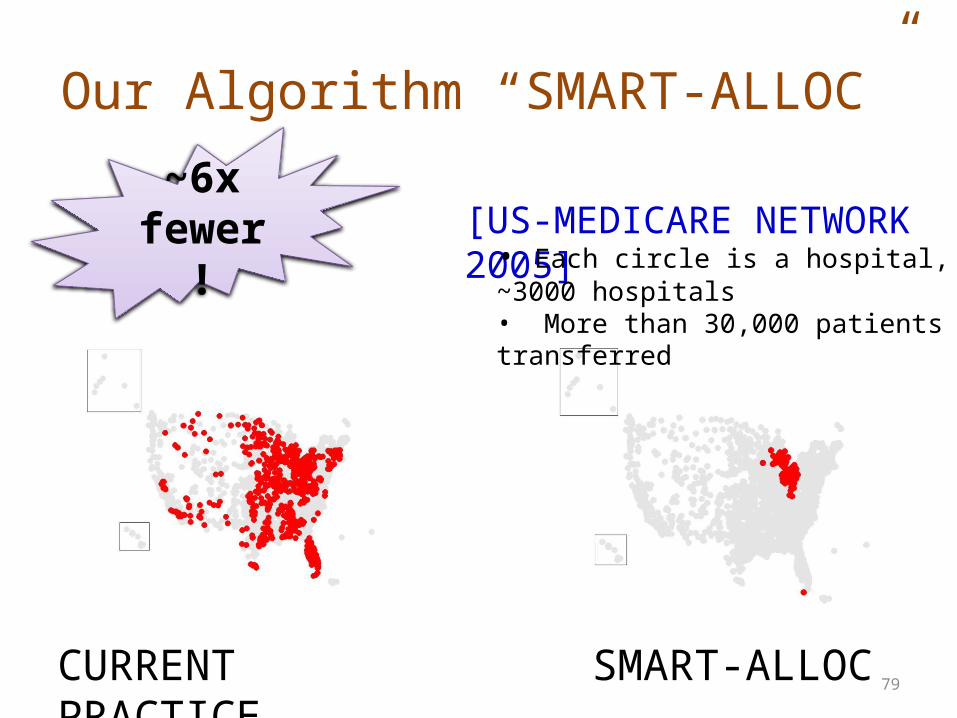
Our Algorithm “SMART-ALLOC”
CURRENT PRACTICE SMART-ALLOC
[US-MEDICARE NETWORK 2005]• Each circle is a hospital, ~3000 hospitals• More than 30,000 patients transferred
~6x fewer!

Running Time
80
≈
Simulations SMART-ALLOC
> 1 week
14 secs
> 30,000x speed-up!
Wall-Clock Time
Lower is better

81
Experiments
K = 200 K = 2000
PENN-NETWORK SECOND-LIFE
~5 x ~2.5 x
Lower is better

82
Outline
• Motivation• Epidemics: what happens? (Theory)• Action: Who to immunize? (Algorithms)• Learning Models: Twitter (Empirical Studies)• Other

83
Tweets Diffusion: Problem Definition
• Given: – Action log of people tweeting a #hashtag– A network of users
• Find:– How external influence varies with #hashtags?
? ??
?
?? ??
84
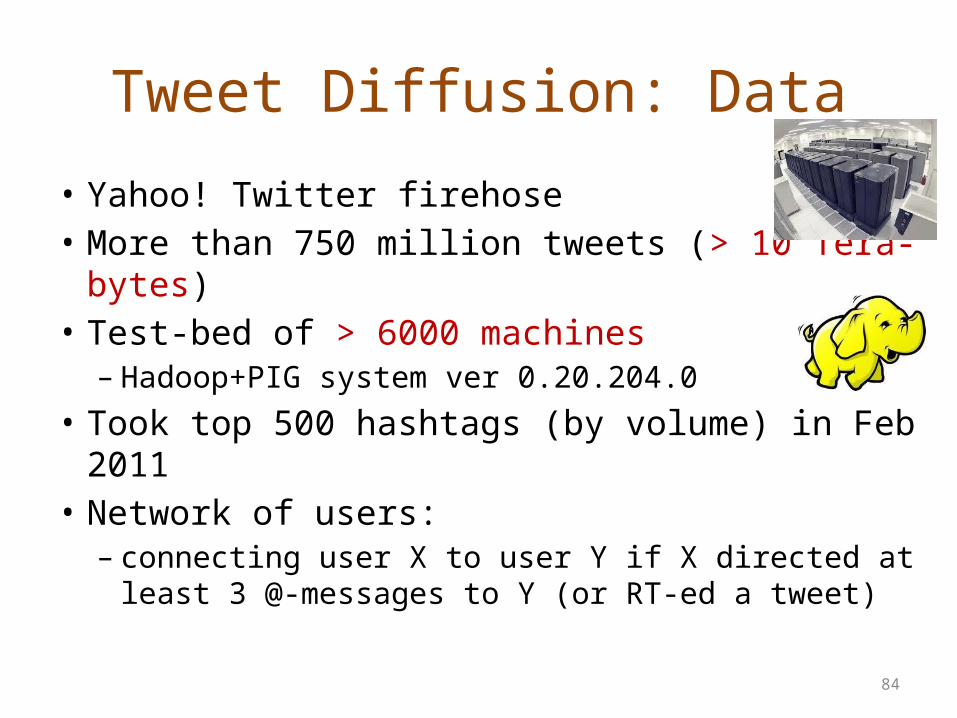
Tweet Diffusion: Data
• Yahoo! Twitter firehose• More than 750 million tweets (> 10 Tera-bytes)• Test-bed of > 6000 machines– Hadoop+PIG system ver 0.20.204.0
• Took top 500 hashtags (by volume) in Feb 2011• Network of users:– connecting user X to user Y if X directed at least 3 @-
messages to Y (or RT-ed a tweet)
85
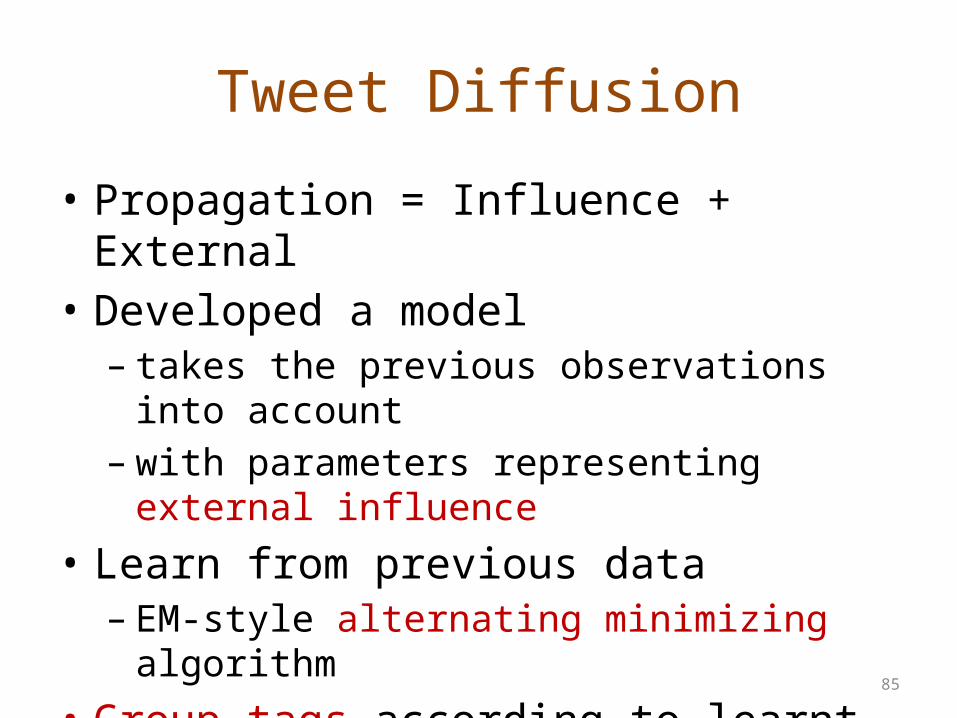
Tweet Diffusion
• Propagation = Influence + External• Developed a model– takes the previous observations into account– with parameters representing external influence
• Learn from previous data– EM-style alternating minimizing algorithm
• Group tags according to learnt params

86
Results: External Influence vs Time
time
“External Effects”
#nowwatching, #nowplaying, #epictweets
#purpleglasses, #brits, #famouslies
#oscar, #25jan
#openfollow, #ihatequotes, #tweetmyjobs
Can also use for Forecasting, Anomaly Detection!
Bursty, external events
“Word-of-mouth” Not trending
Long-running tags
“Word-of-mouth”

87
Outline
• Motivation• Epidemics: what happens? (Theory)• Action: Who to immunize? (Algorithms)• Learning Models: Twitter (Empirical Studies)• Other – Chipping communities– Time-series analysis

Mobile Call Graphs
88
200K usersMillions of calls
In Prakash+ PAKDD 2010
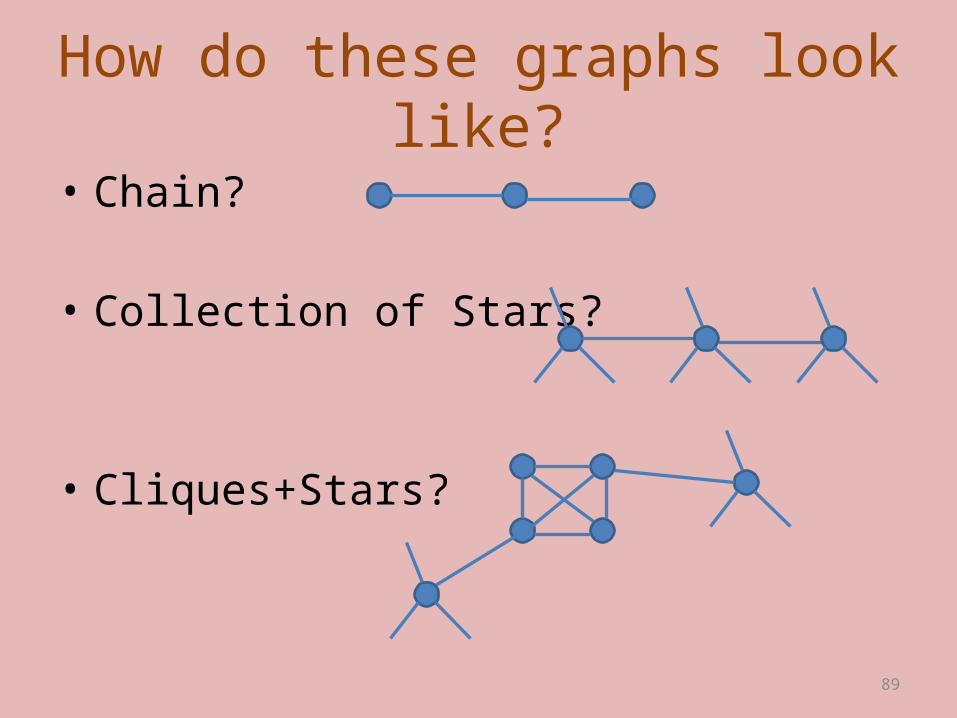
How do these graphs look like?
• Chain?
• Collection of Stars?
• Cliques+Stars?
89

How do these graphs look like?
• Use Singular(eigen)-vectors?– Intuition: Encode connectivity patterns
0 0 1 1 0 1 0 0 0 0 0 1 1 1 0 0 ……
≈ . 0 0 0 1 1 1 0 0 90
From
ToAdjacency
MatrixV
Σ V^T
Dimensionality Reduction

EigenPlots
• Plot Eigenvectors side-by-side (EE-plot)
91
V1First Principal Component (Score)
V2 Second Principal Component (Score)
V1 Score
Smith
Johnson
Smith
Johnson
V Matrix
V2 Score

Mock Quiz: EE-plots in our real graph?
• Plot Eigenvectors side-by-side (EE-plots)
92
Spokes!
? ?
??

93
EigenSpokes: they are everywhere
• Mobile call graphs–multiple regions and different months
• And in diverse graphs–Patents citation– Internet–Dictionary
94
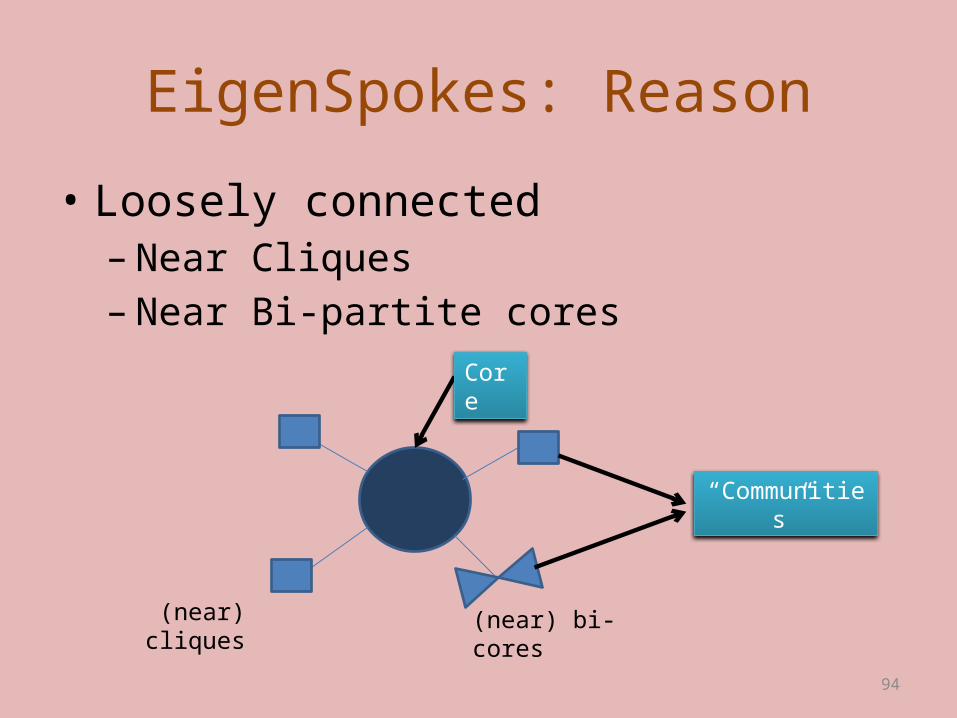
EigenSpokes: Reason
• Loosely connected– Near Cliques– Near Bi-partite cores
Core
“Communities”
(near) cliques
(near) bi-cores
95
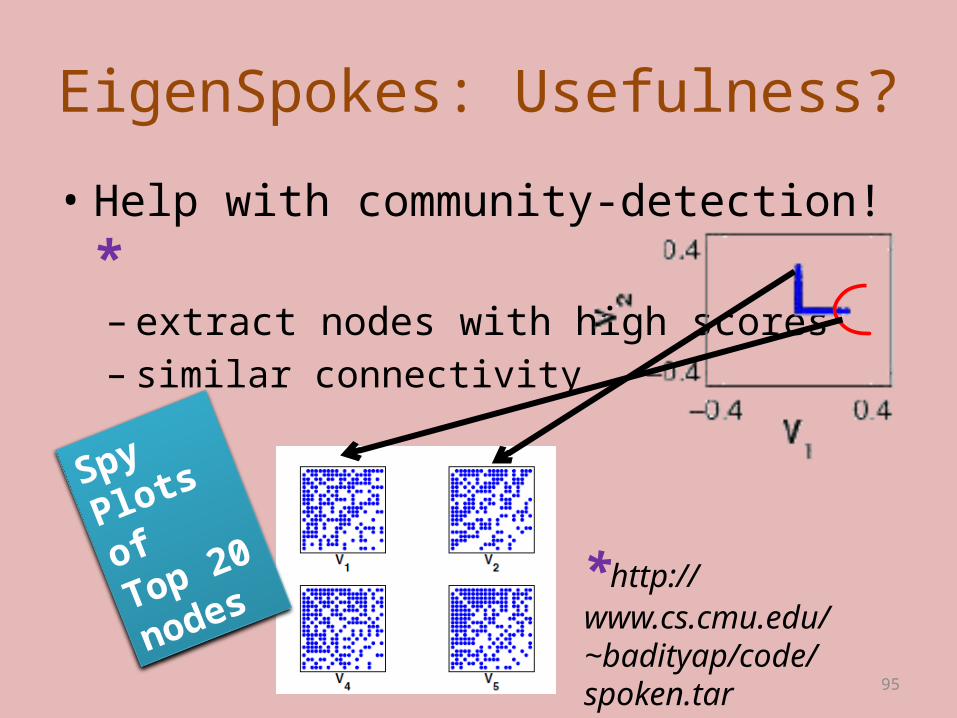
EigenSpokes: Usefulness?
• Help with community-detection!*– extract nodes with high scores– similar connectivity
Spy Plots
of Top
20 nodes
*http://www.cs.cmu.edu/~badityap/code/spoken.tar

“SpokEn” in action!
96
magnified bipartite community
patents fromsame inventor(s)
cut-and-pastebibliography!
Patent Graph
All patents on photosensitive pigments for color printers

Outline
• Motivation• Epidemics: what happens? (Theory)• Action: Who to immunize? (Algorithms)• Learning Models: Twitter (Empirical Studies)• Other – Chipping communities– Time-series analysis
97
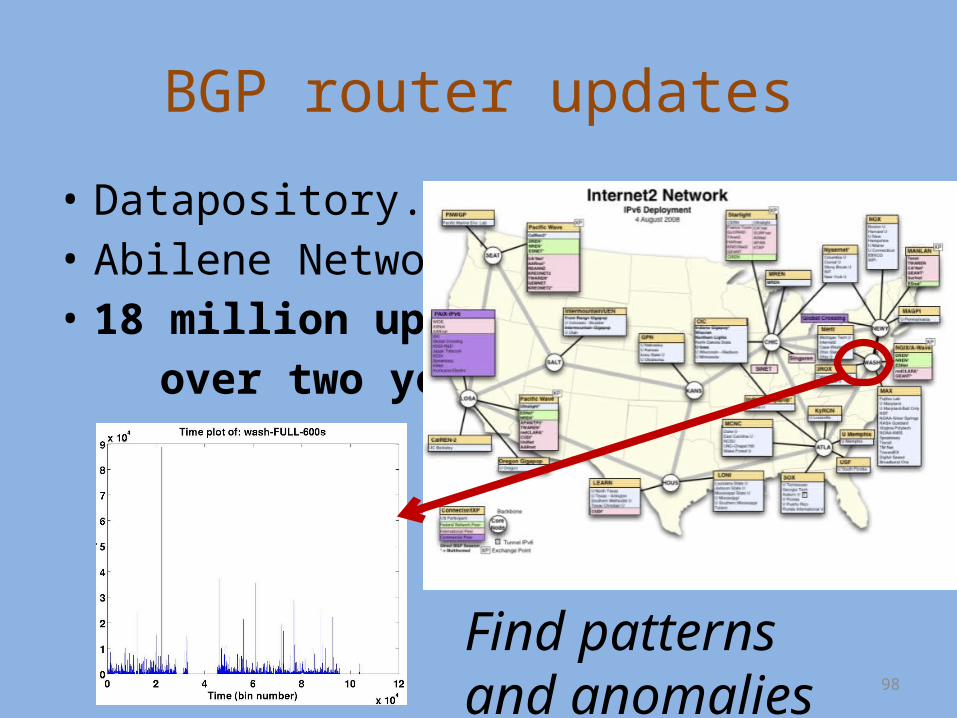
BGP router updates
• Datapository.net• Abilene Network• 18 million updates over two years!
98
Find patterns and anomalies

BGP-lens at Work
Event 1: – Prefix and Origin-AS pointed to Alabama Supercomputing Net.– Sysadmin :
“the route for 207.157.115.0/24 was appearing and disappearing in [the] IGP routing table ... [which] may have caused BGP to flap.”
– Anomaly went undetected and unresolved for 30 days!
99In Prakash+ SIGKDD 2009

100
Primary and middle Schools in Guangzhou, China.
May 12 – 8 hr spike
Results from real data – Prolonged Spikes
101
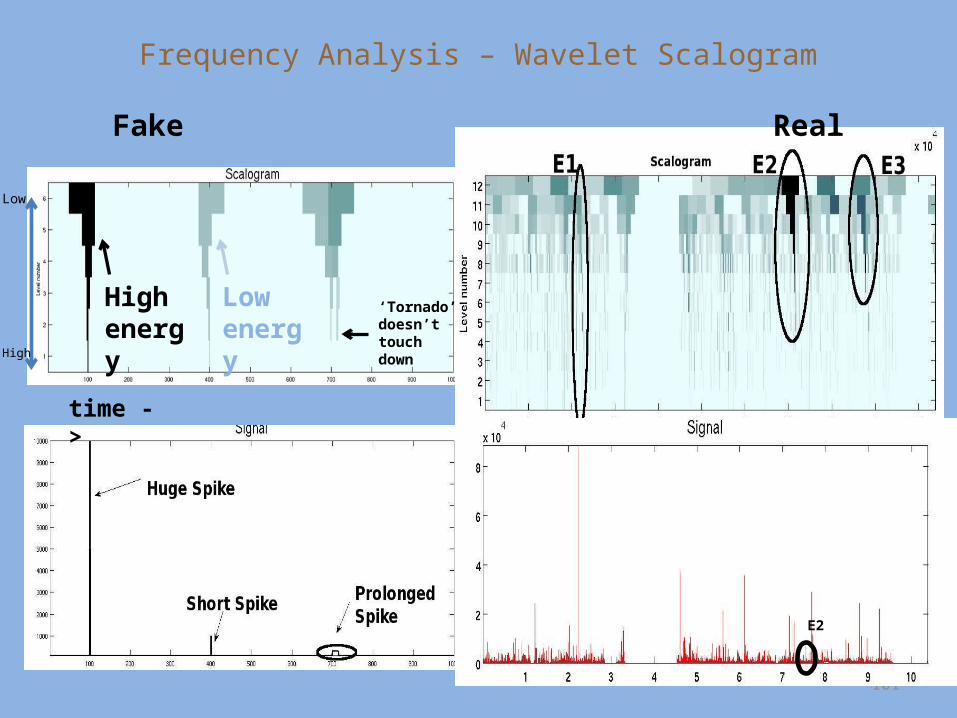
Low
High
High energy
Low energy
‘Tornado’doesn’ttouch down
time ->
E2
Frequency Analysis – Wavelet Scalogram
Fake Real
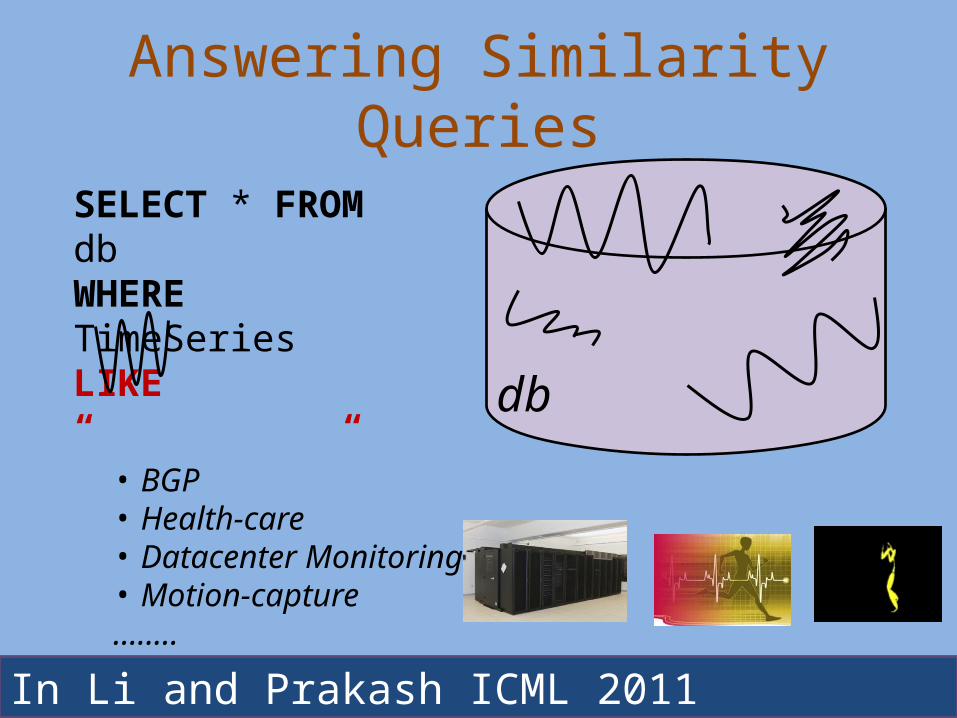
Answering Similarity Queries
102
SELECT * FROM dbWHERE TimeSeriesLIKE “ “
db
In Li and Prakash ICML 2011
• BGP • Health-care• Datacenter Monitoring• Motion-capture……..

Answering Similarity Queries
103
• Euclidean?• DTW? ……
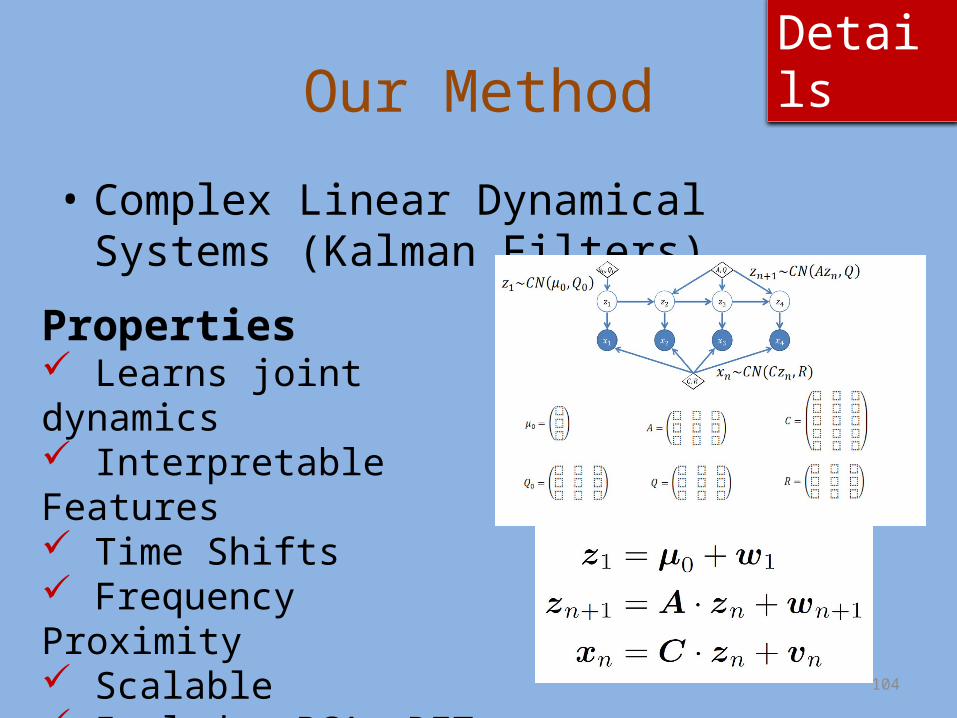
Our Method
• Complex Linear Dynamical Systems (Kalman Filters)
104
Properties Learns joint dynamics Interpretable Features Time Shifts Frequency Proximity Scalable Includes PCA, DFT, AR as special cases
Details

Times Series Analysis
105
BGP data: PLiF + hierarchical clustering

106
Outline
• Motivation• Epidemics: what happens? (Theory)• Action: Who to immunize? (Algorithms)• Learning Models: Twitter (Empirical Studies)• Other
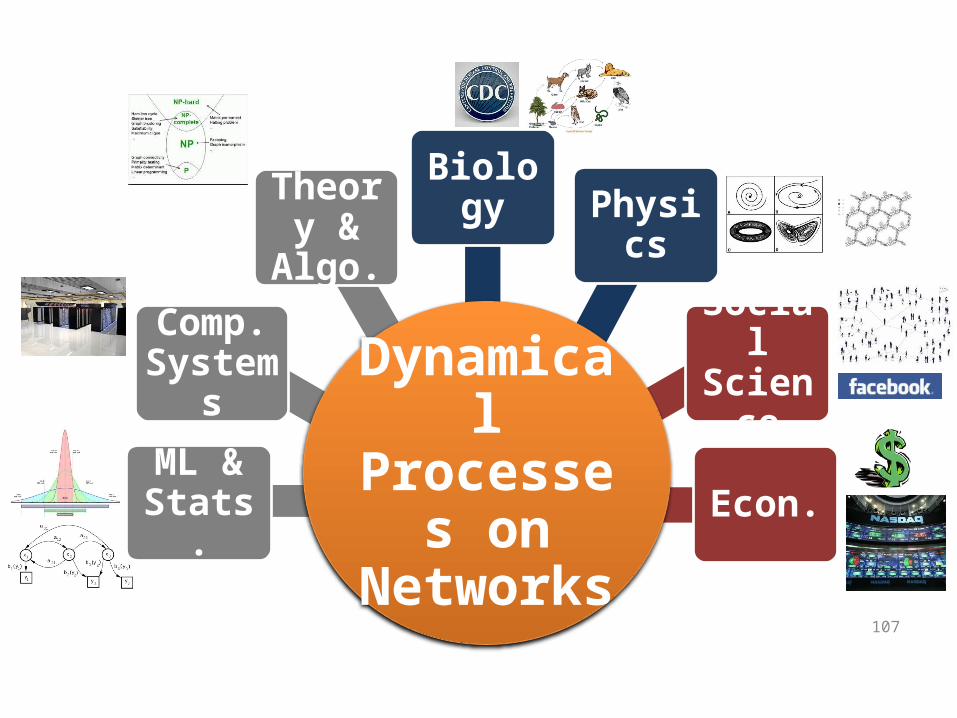
ML & Stats.
Comp. Systems
Theory & Algo.
Biology
Econ.
Social Science
Physics
107
Dynamical Processes
on Networks

Publications1. Winner-takes-all: Competing Viruses or Ideas on fair-play networks (B. Aditya Prakash, Alex Beutel, Roni
Rosenfeld, Christos Faloutsos) – In WWW 2012, Lyon2. Threshold Conditions for Arbitrary Cascade Models on Arbitrary Networks (B. Aditya Prakash, Deepayan
Chakrabarti, Michalis Faloutsos, Nicholas Valler, Christos Faloutsos) - In IEEE ICDM 2011, Vancouver (Invited to KAIS Journal Best Papers of ICDM.)
3. Times Series Clustering: Complex is Simpler! (Lei Li, B. Aditya Prakash) - In ICML 2011, Bellevue4. Epidemic Spreading on Mobile Ad Hoc Networks: Determining the Tipping Point (Nicholas Valler, B. Aditya
Prakash, Hanghang Tong, Michalis Faloutsos and Christos Faloutsos) – In IEEE NETWORKING 2011, Valencia, Spain
5. Formalizing the BGP stability problem: patterns and a chaotic model (B. Aditya Prakash, Michalis Faloutsos and Christos Faloutsos) – In IEEE INFOCOM NetSciCom Workshop, 2011.
6. On the Vulnerability of Large Graphs (Hanghang Tong, B. Aditya Prakash, Tina Eliassi-Rad and Christos Faloutsos) – In IEEE ICDM 2010, Sydney, Australia
7. Virus Propagation on Time-Varying Networks: Theory and Immunization Algorithms (B. Aditya Prakash, Hanghang Tong, Nicholas Valler, Michalis Faloutsos and Christos Faloutsos) – In ECML-PKDD 2010, Barcelona, Spain
8. MetricForensics: A Multi-Level Approach for Mining Volatile Graphs (Keith Henderson, Tina Eliassi-Rad, Christos Faloutsos, Leman Akoglu, Lei Li, Koji Maruhashi, B. Aditya Prakash and Hanghang Tong) - In SIGKDD 2010, Washington D.C.
9. Parsimonious Linear Fingerprinting for Time Series (Lei Li, B. Aditya Prakash and Christos Faloutsos) - In VLDB 2010, Singapore
10. EigenSpokes: Surprising Patterns and Scalable Community Chipping in Large Graphs (B. Aditya Prakash, Ashwin Sridharan, Mukund Seshadri, Sridhar Machiraju and Christos Faloutsos) – In PAKDD 2010, Hyderabad, India
11. BGP-lens: Patterns and Anomalies in Internet-Routing Updates (B. Aditya Prakash, Nicholas Valler, David Andersen, Michalis Faloutsos and Christos Faloutsos) – In ACM SIGKDD 2009, Paris, France.
12. Surprising Patterns and Scalable Community Detection in Large Graphs (B. Aditya Prakash, Ashwin Sridharan, Mukund Seshadri, Sridhar Machiraju and Christos Faloutsos) – In IEEE ICDM Large Data Workshop 2009, Miami
13. FRAPP: A Framework for high-Accuracy Privacy-Preserving Mining (Shipra Agarwal, Jayant R. Haritsa and B. Aditya Prakash) – In Intl. Journal on Data Mining and Knowledge Discovery (DKMD), Springer, vol. 18, no. 1, February 2009, Ed: Johannes Gehrke.
14. Complex Group-By Queries For XML (C. Gokhale, N. Gupta, P. Kumar, L. V. S. Lakshmanan, R. Ng and B. Aditya Prakash) – In IEEE ICDE 2007, Istanbul, Turkey.
****
**
**
109
Submitted1. Fractional Immunization of Networks (B. Aditya Prakash, Lada Adamic, Theodore Iwashyna,
Hanghang Tong, Christos Faloutsos)
2. How much of Twitter is Influence? (B. Aditya Prakash, Deepayan Chakrabarti, Kunal Punera)
3. Who is to blame? Finding Culprits in Epidemics (B. Aditya Prakash, Jilles Vreeken, Christos Faloutsos)
4. Competing Viruses on Composite Networks: Who wins? (Xuetao Wei, Nicholas Valler, B. Aditya Prakash, Iulian Neamtiu, Michalis Faloutsos and Christos Faloutsos)
5. Gelling, and Melting, Large Graphs through Edge Manipulation (Hanghang Tong, B. Aditya Prakash, Tina Eliassi-Rad, Michalis Faloutsos, Christos Faloutsos)
6. Worst-case Footprints in the SIS model (B. Aditya Prakash, Varun Gupta and Christos Faloutsos)
Patents7. Determining User Communities in Communication Networks (Ashwin Sridharan, Mukund
Seshadri, James Schneider, B. Aditya Prakash, Christos Faloutsos) Sprint Inc., filed March 2010
8. Analysis of Computer Network Activity by Successively Removing Accepted Types of Access Events (B. Aditya Prakash, Alice Zheng, Jack Stokes, Eric Fitzgerald, Theodore Hardy) Microsoft Research, filed April 2010
**
110
Acknowledgements
Collaborators Christos Faloutsos Roni Rosenfeld, Michalis Faloutsos, Lada Adamic, Theodore Iwashyna (M.D.), Dave Andersen, Tina Eliassi-Rad, Iulian Neamtiu,
Varun Gupta, Jilles Vreeken,
Deepayan Chakrabarti, Hanghang Tong, Kunal Punera, Ashwin Sridharan, Sridhar Machiraju, Mukund Seshadri, Alice Zheng, Lei Li, Polo Chau, Nicholas Valler, Alex Beutel, Xuetao Wei
111
Acknowledgements
Funding

112
Analysis Policy/Action Data
Dynamical Processes on Large Networks
B. Aditya Prakash http://www.cs.cmu.edu/~badityap