Embed Size (px)
Citation preview
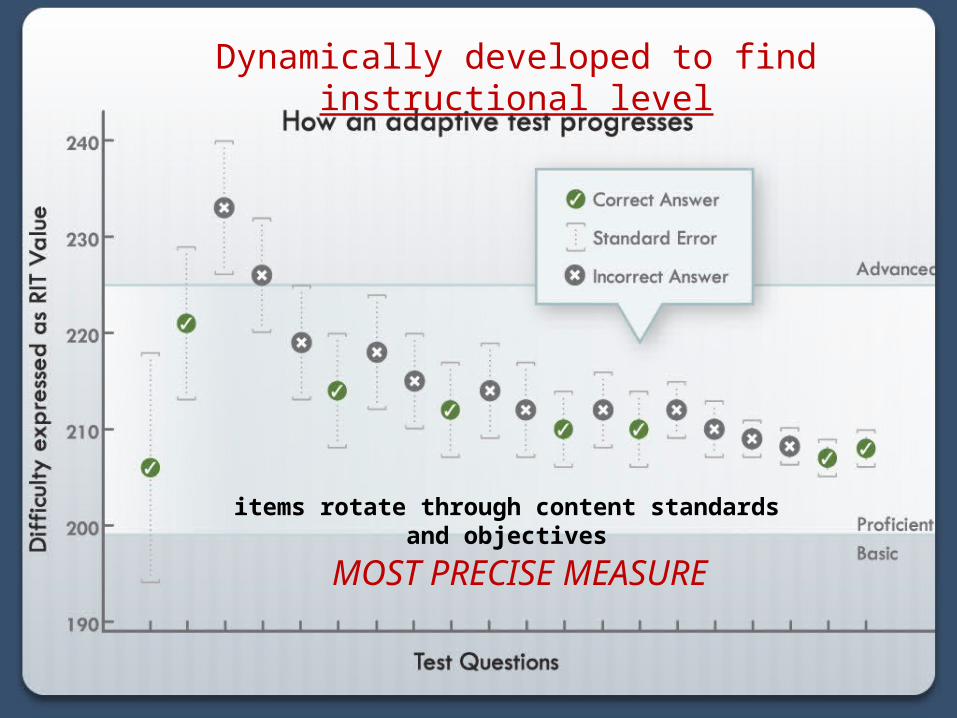
Dynamically developed to find instructional level
MOST PRECISE MEASURE
items rotate through content standards and objectives
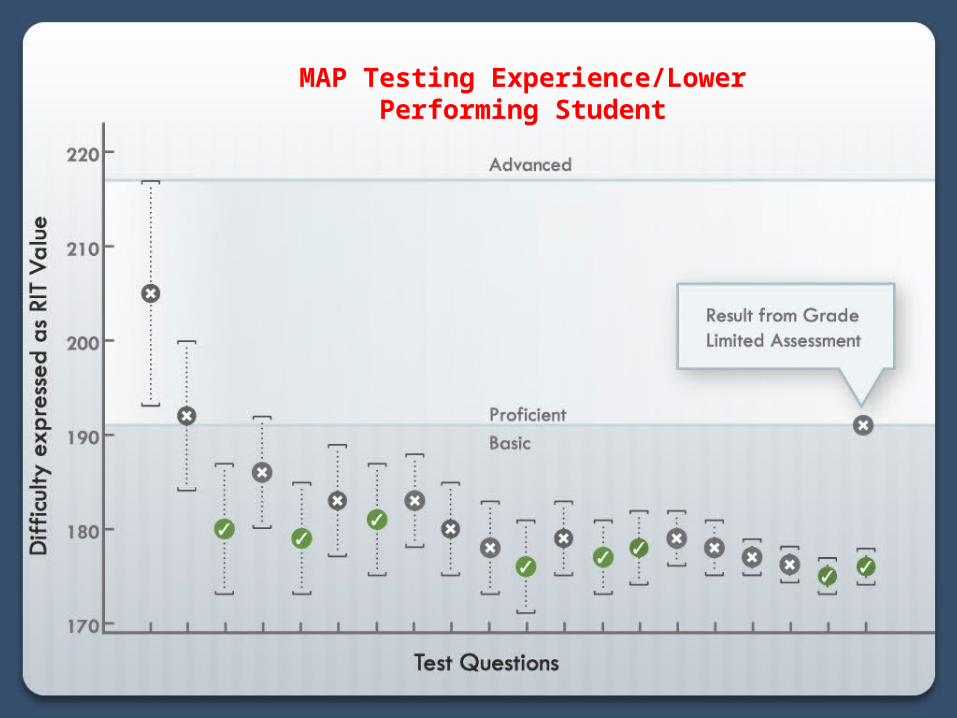
MAP Testing Experience/Lower Performing Student
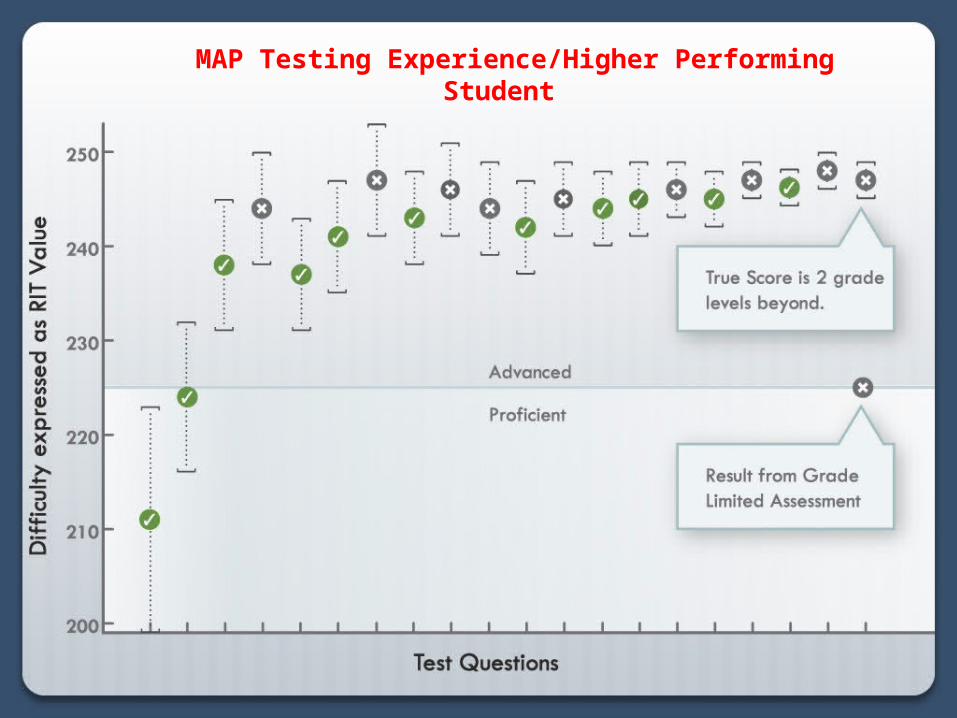
MAP Testing Experience/Higher Performing Student
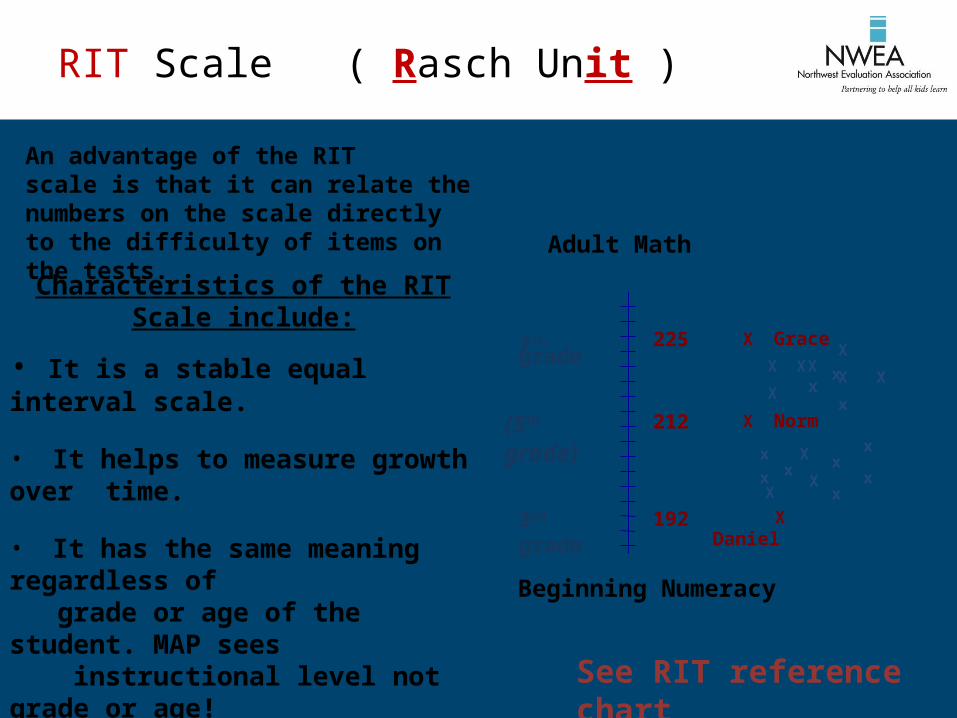
RIT Scale ( Rasch Unit )
Beginning Numeracy
Adult Math
X Normx
xx X
X
X GraceXx
x
X X
Daniel
x
X X
X
x
x
x
3rd grade
(5th grade)
7th grade
192
212
225
See RIT reference chart
X
X X
x
An advantage of the RIT scale is that it can relate the numbers on the scale directly to the difficulty of items on the tests.
Characteristics of the RIT Scale include:
• It is a stable equal interval scale.
• It helps to measure growth over time.
• It has the same meaning regardless of grade or age of the student. MAP sees instructional level not grade or age!
• It is an accurate scale.
• It is an achievement scale.
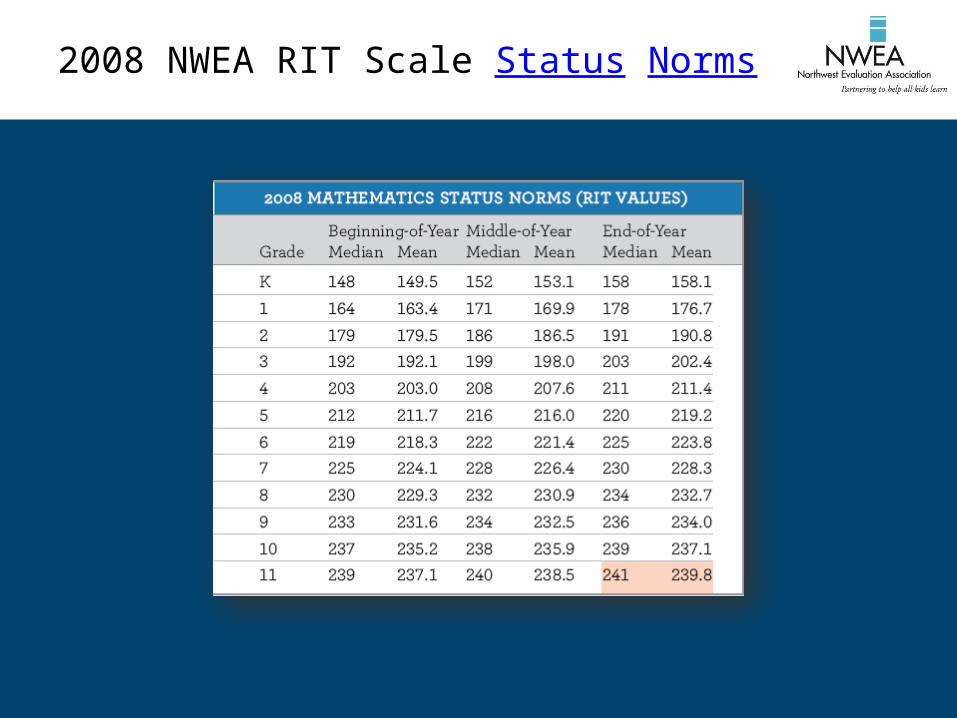
2008 NWEA RIT Scale Status Norms
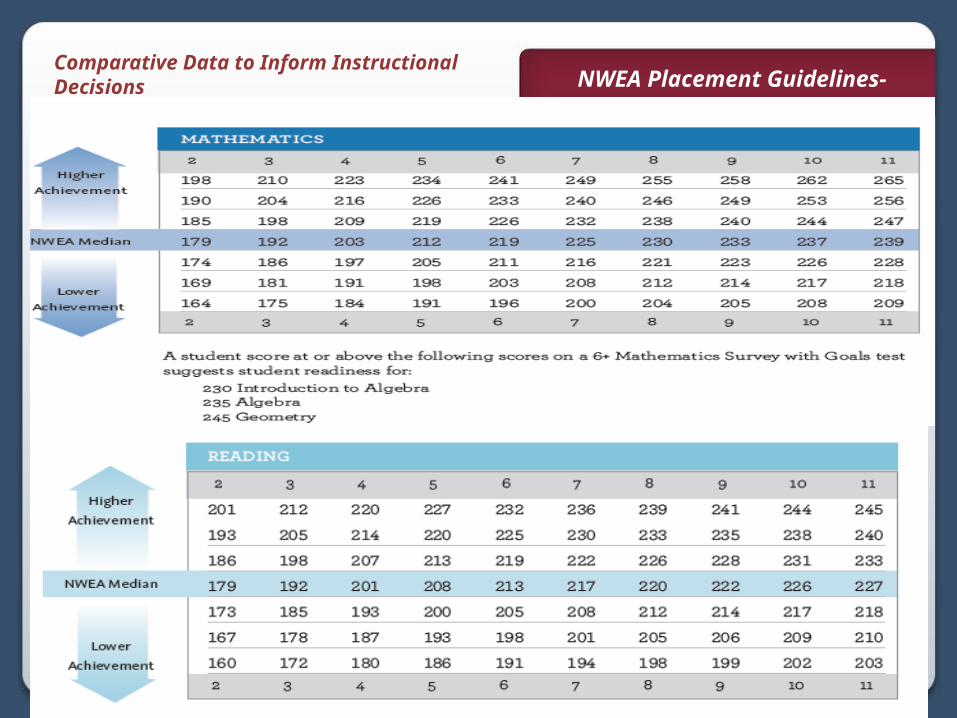
Comparative Data to Inform Instructional Decisions NWEA Placement Guidelines-UPDATED
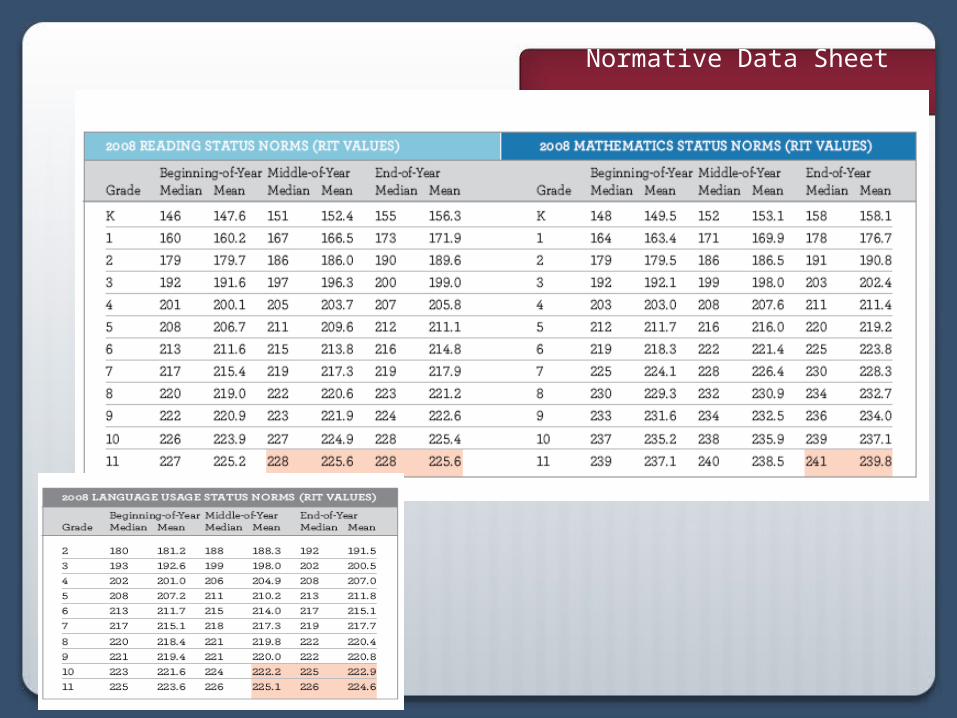
Normative Data Sheet
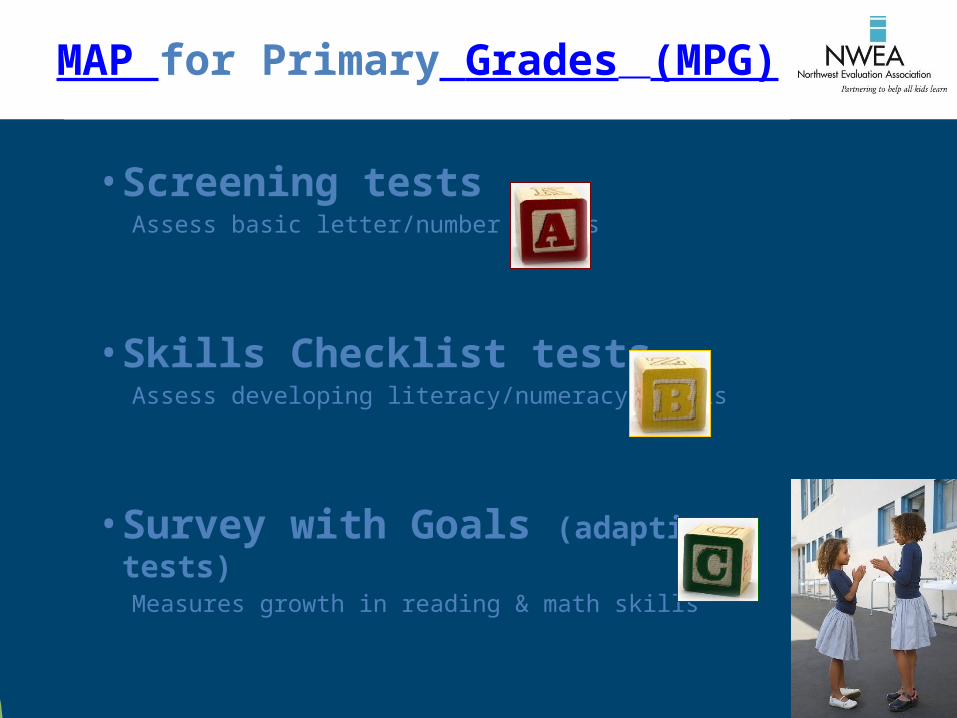
MAP for Primary Grades (MPG)
• Screening testsAssess basic letter/number skills
• Skills Checklist testsAssess developing literacy/numeracy skills
• Survey with Goals (adaptive tests)Measures growth in reading & math skills
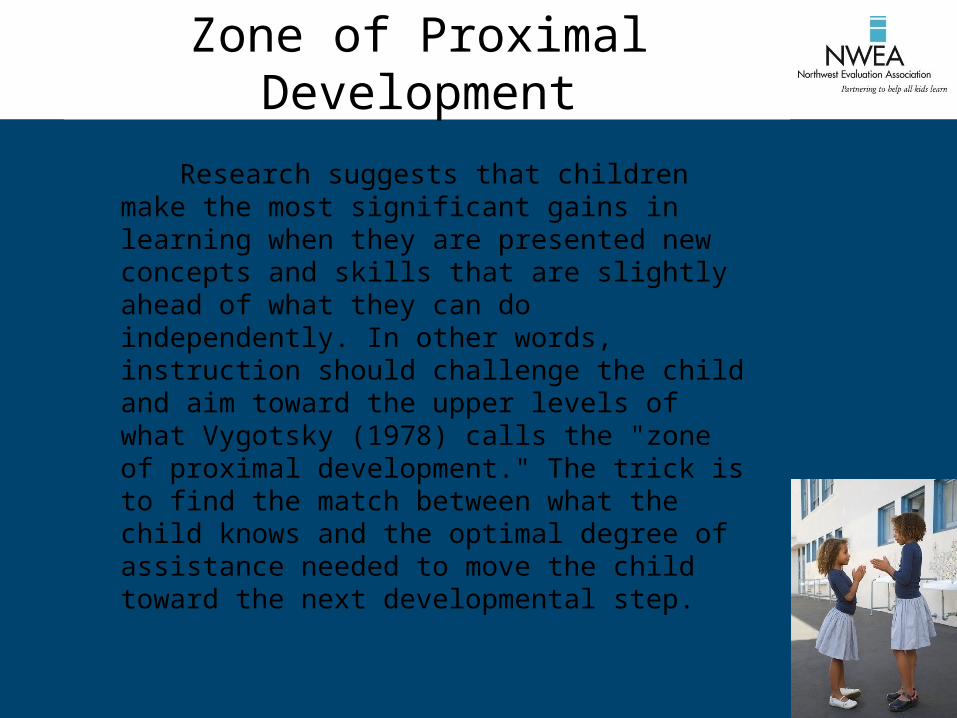
Zone of Proximal Development
Research suggests that children make the most significant gains in learning when they are presented new concepts and skills that are slightly ahead of what they can do independently. In other words, instruction should challenge the child and aim toward the upper levels of what Vygotsky (1978) calls the "zone of proximal development." The trick is to find the match between what the child knows and the optimal degree of assistance needed to move the child toward the next developmental step.
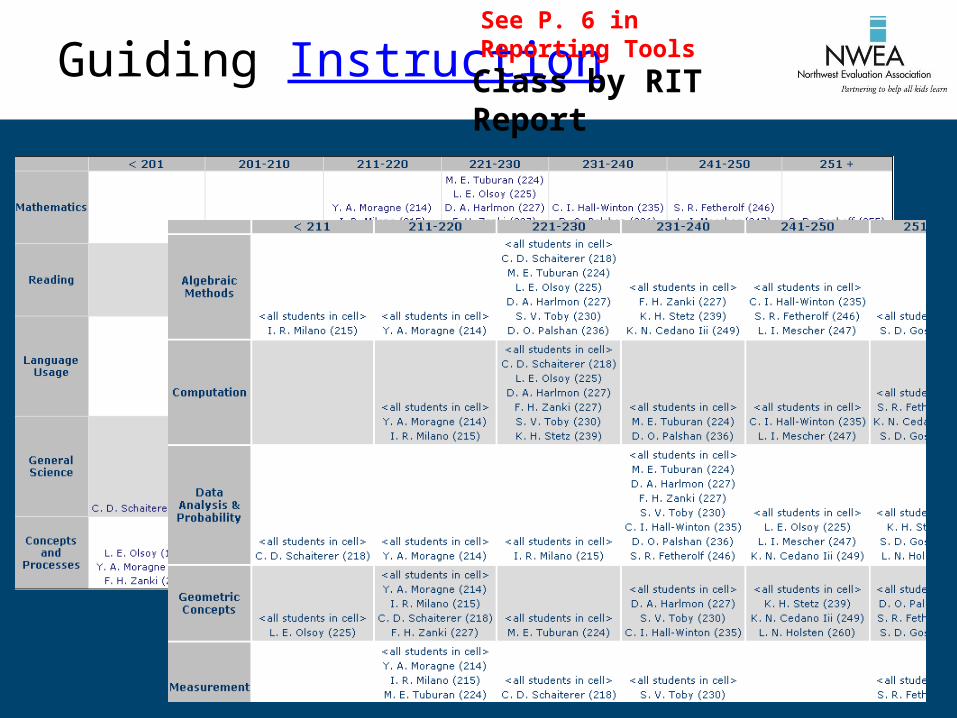
Guiding InstructionSee P. 6 in Reporting Tools
Class by RIT Report
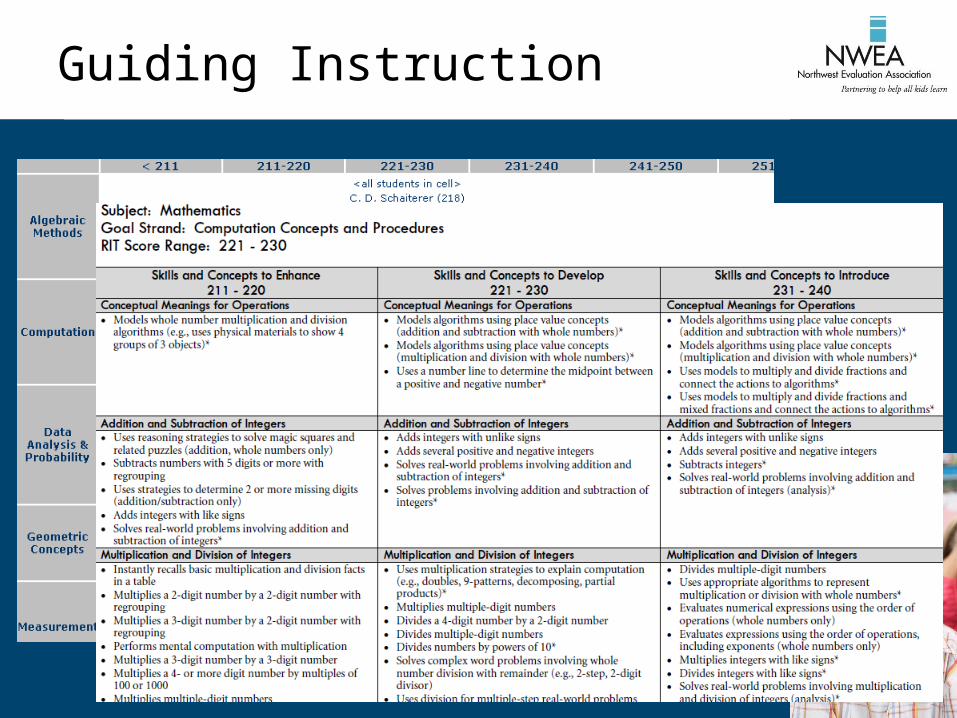
Guiding Instruction
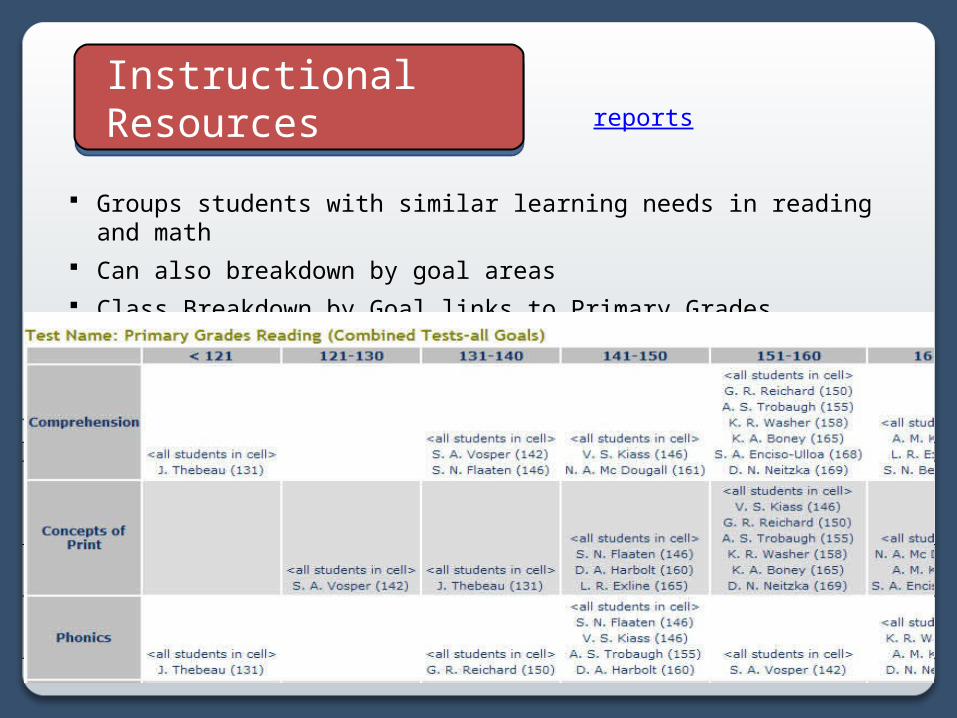
Groups students with similar learning needs in reading and math
Can also breakdown by goal areas Class Breakdown by Goal links to Primary Grades Instructional
Data
Instructional ResourcesInstructional Resources reports
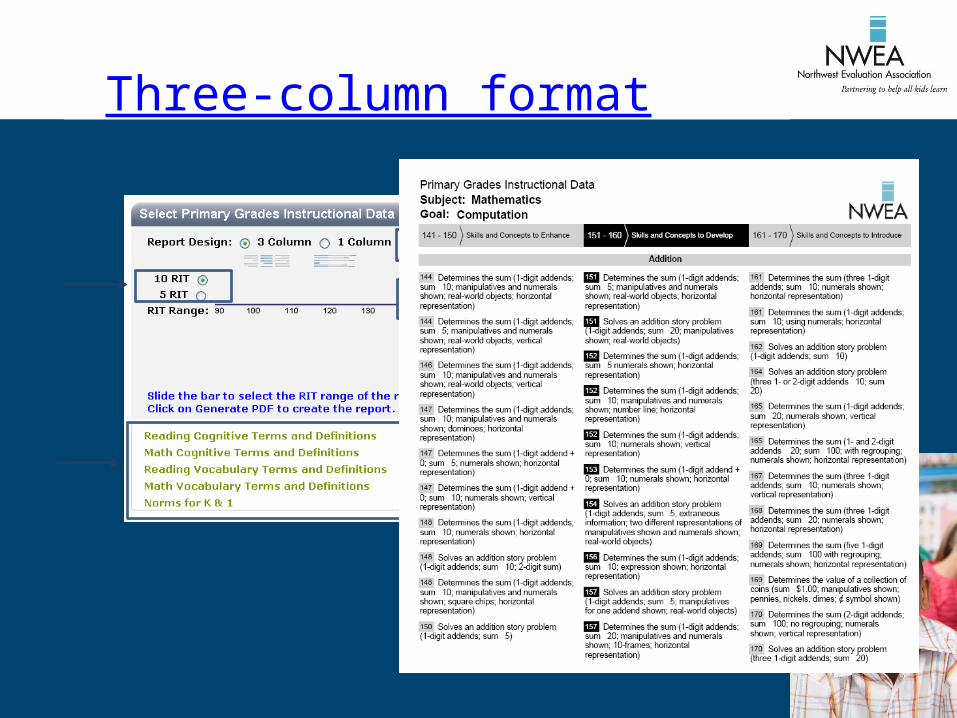
Three-column format
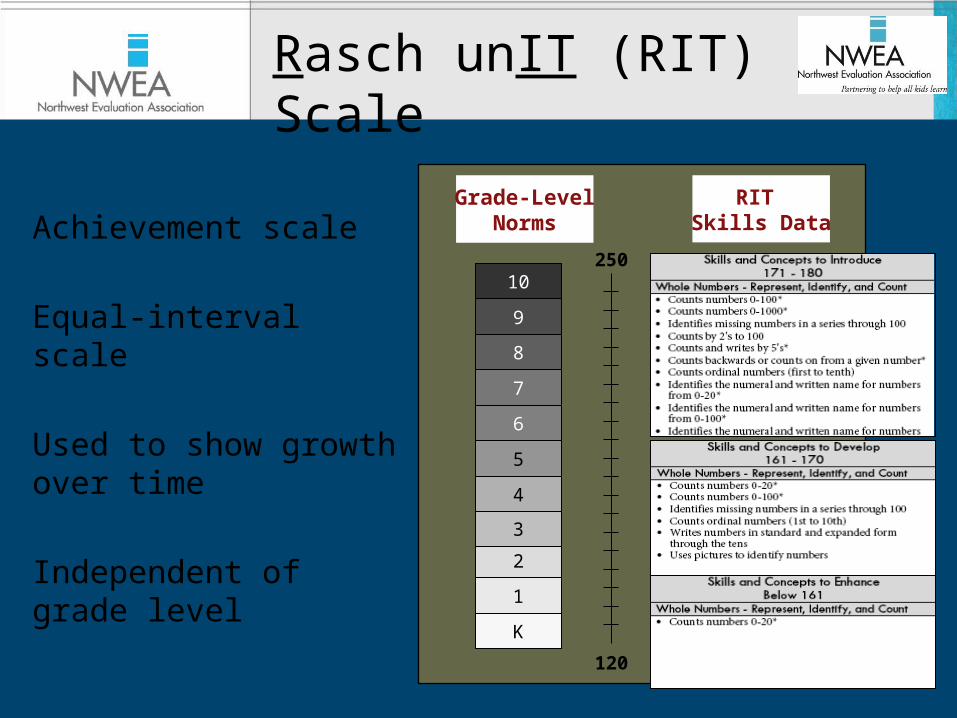
Achievement scale
Equal-interval scale
Used to show growth over time
Independent of grade level
Rasch unIT (RIT) Scale
120
250
2
3
4
5
6
7
6
7
8
9
10
Grade-LevelNorms
RIT Skills Data
Instructional Data or DesCartes
K
1
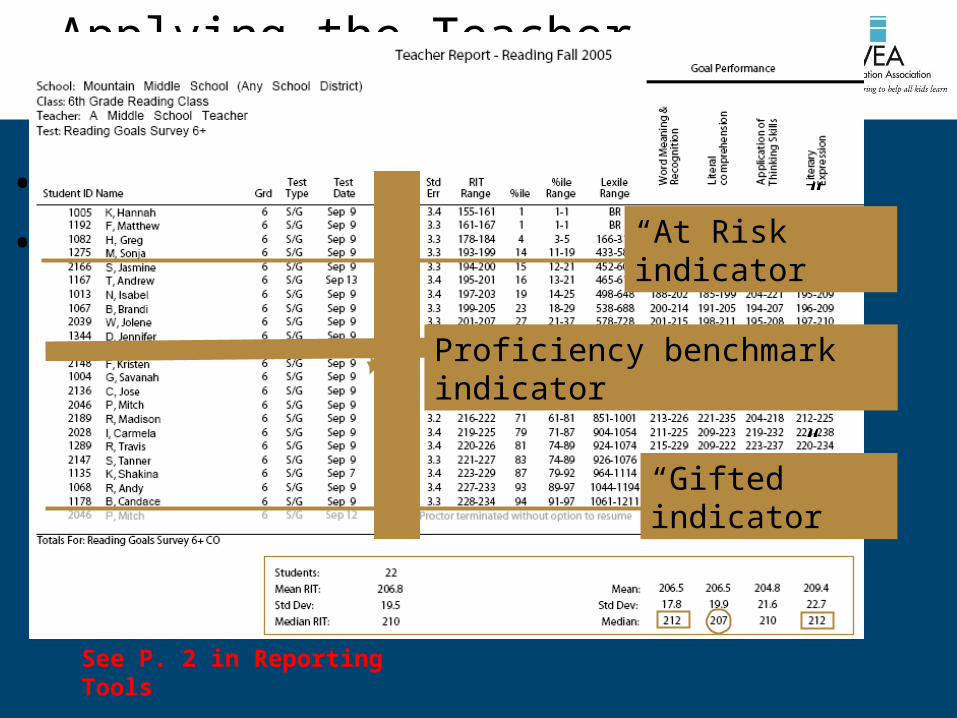
Applying the Teacher Report
• Placement Guidelines • State Scale Alignment Study
“Gifted” indicator
“At Risk” indicator
Proficiency benchmark indicator
See P. 2 in Reporting Tools
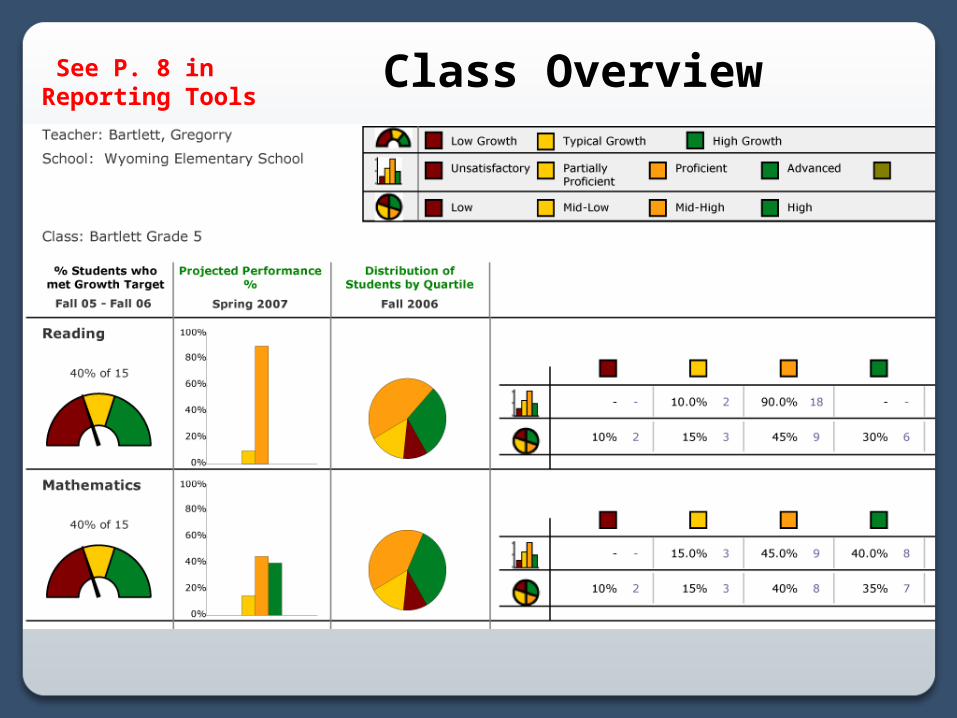
Class Overview See P. 8 in Reporting Tools
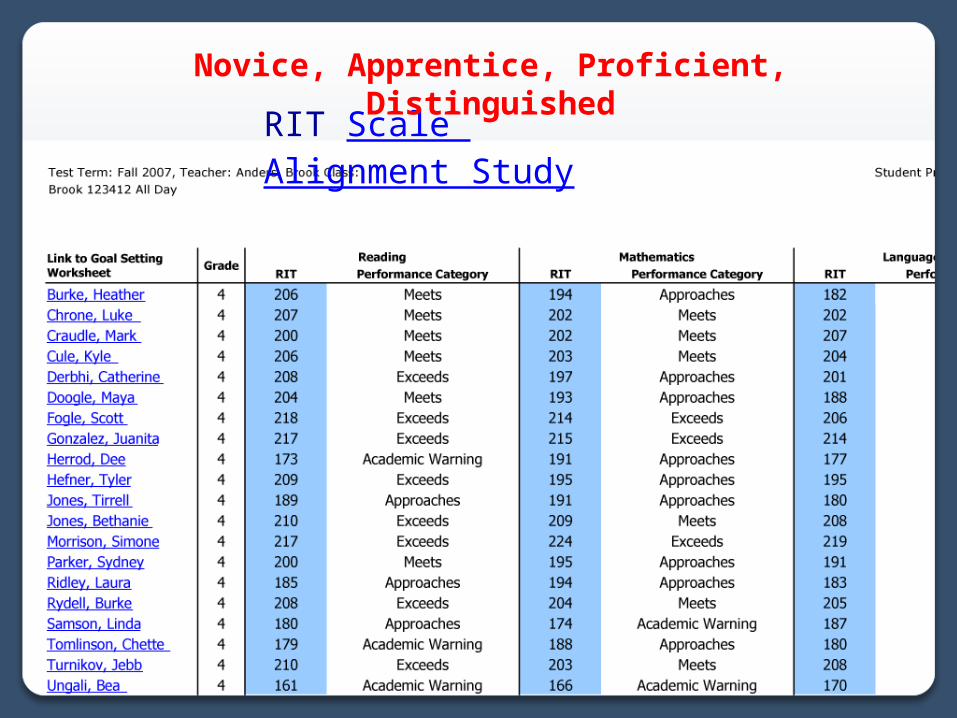
RIT Scale Alignment Study
Novice, Apprentice, Proficient, Distinguished
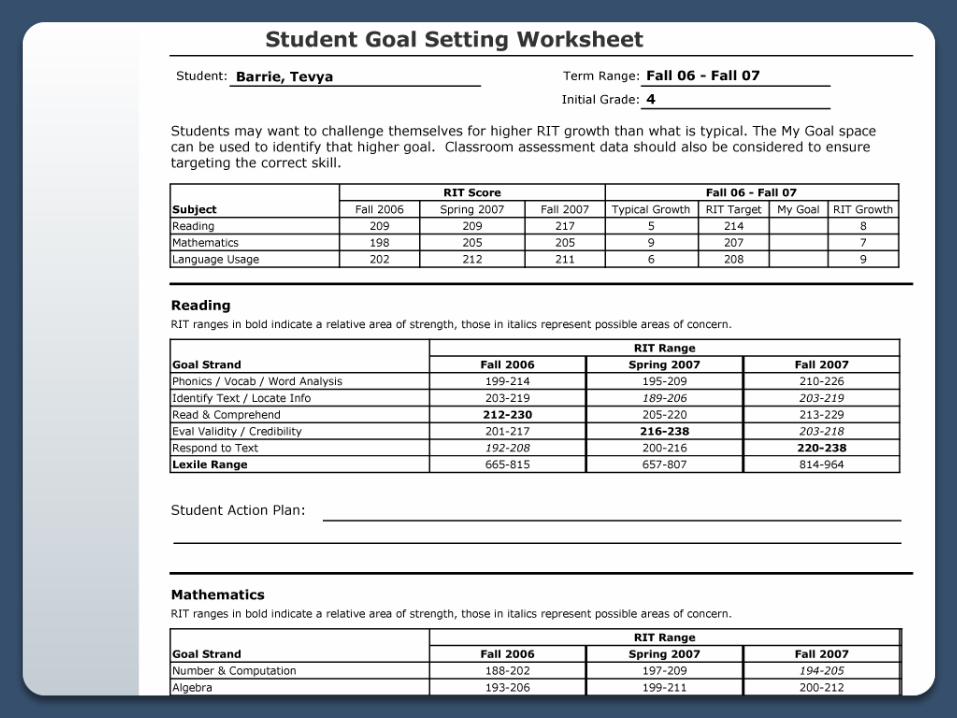
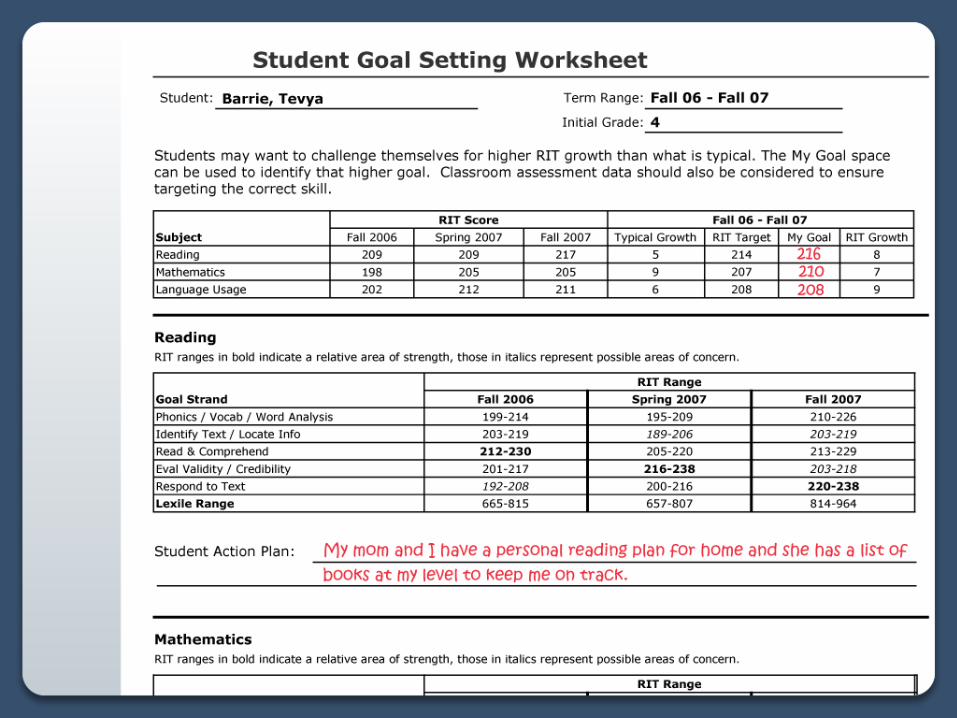
Goal Setting Worksheet
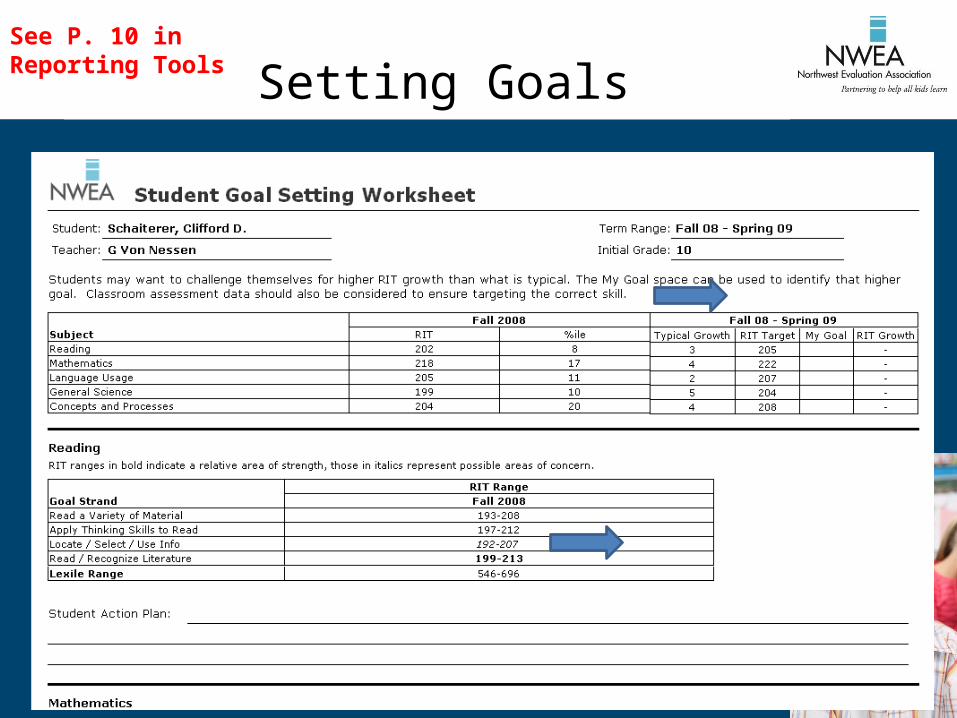
Setting GoalsSee P. 10 in Reporting Tools
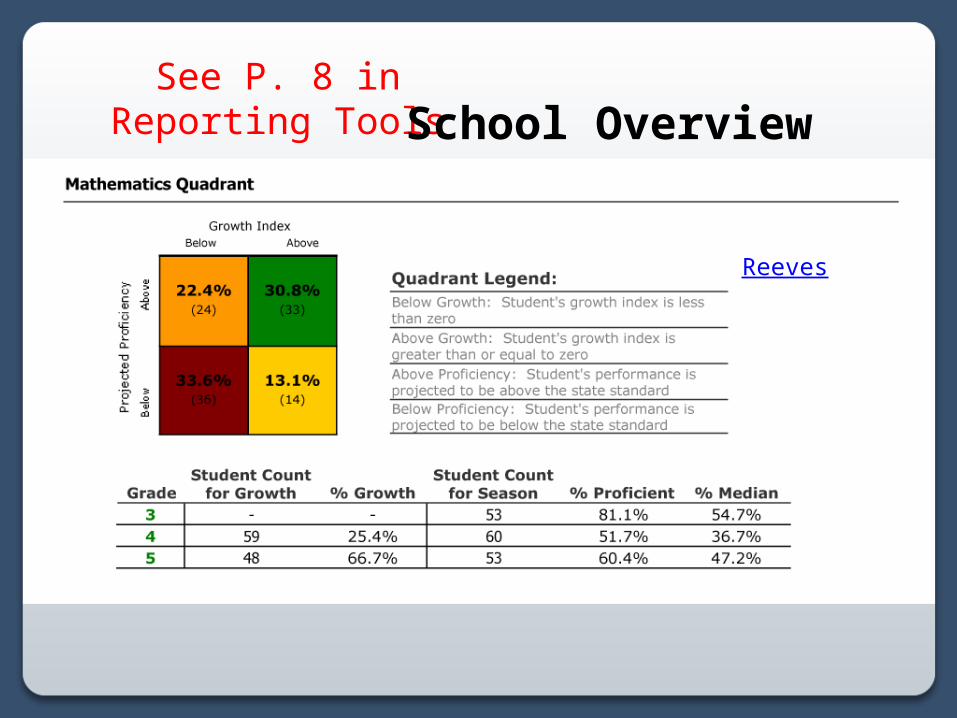
See P. 8 in Reporting ToolsSchool Overview
Reeves
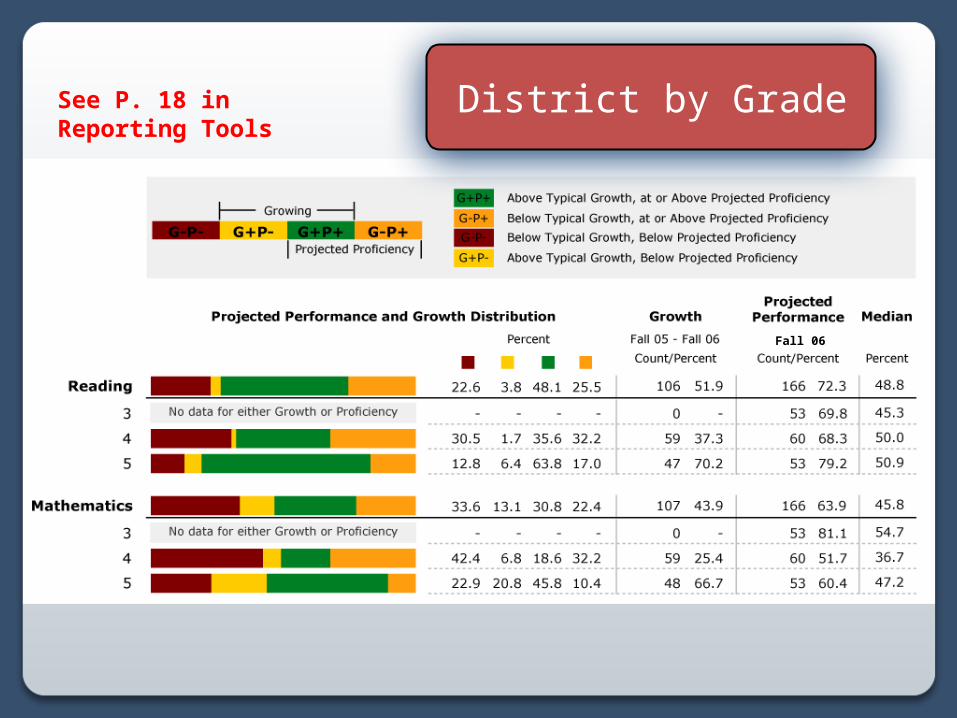
Fall 06
District by GradeSee P. 18 in Reporting Tools
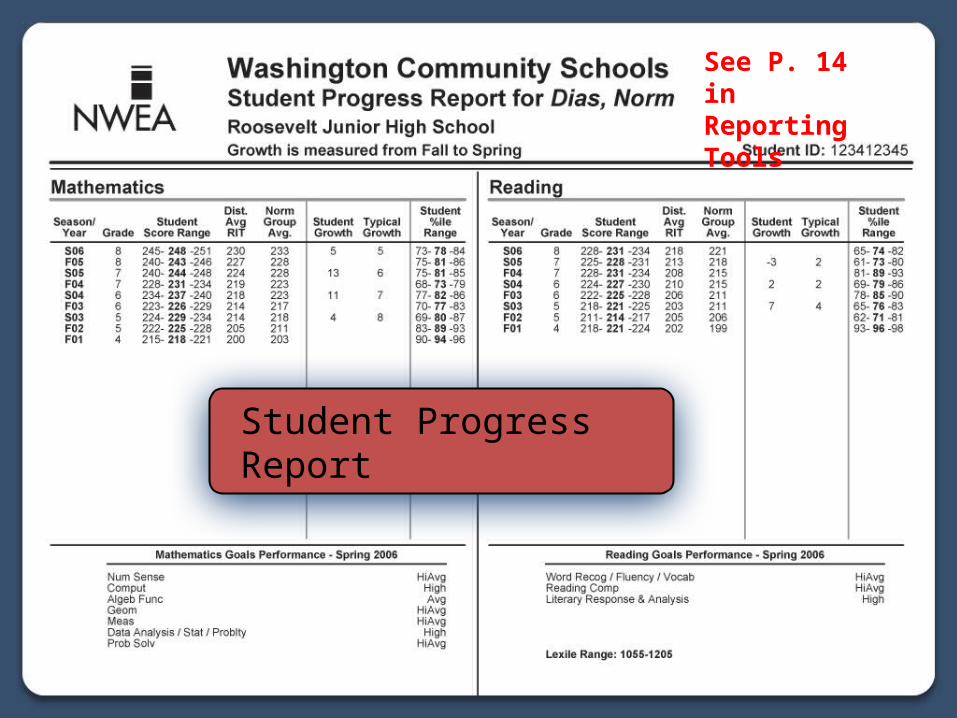
Student Progress Report
See P. 14 in Reporting Tools
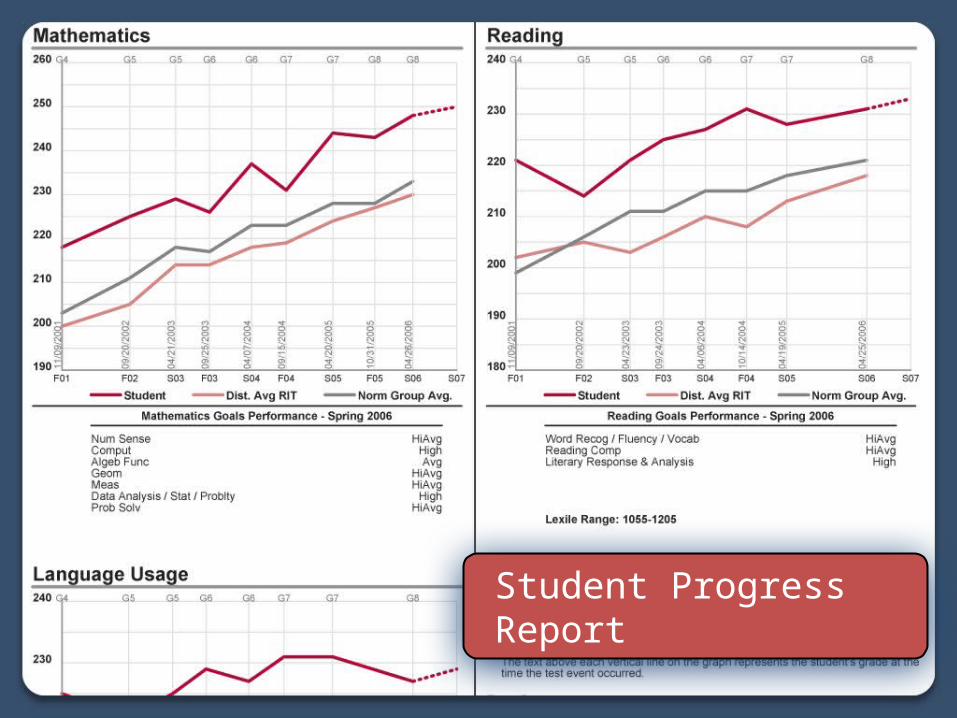
Student Progress Report
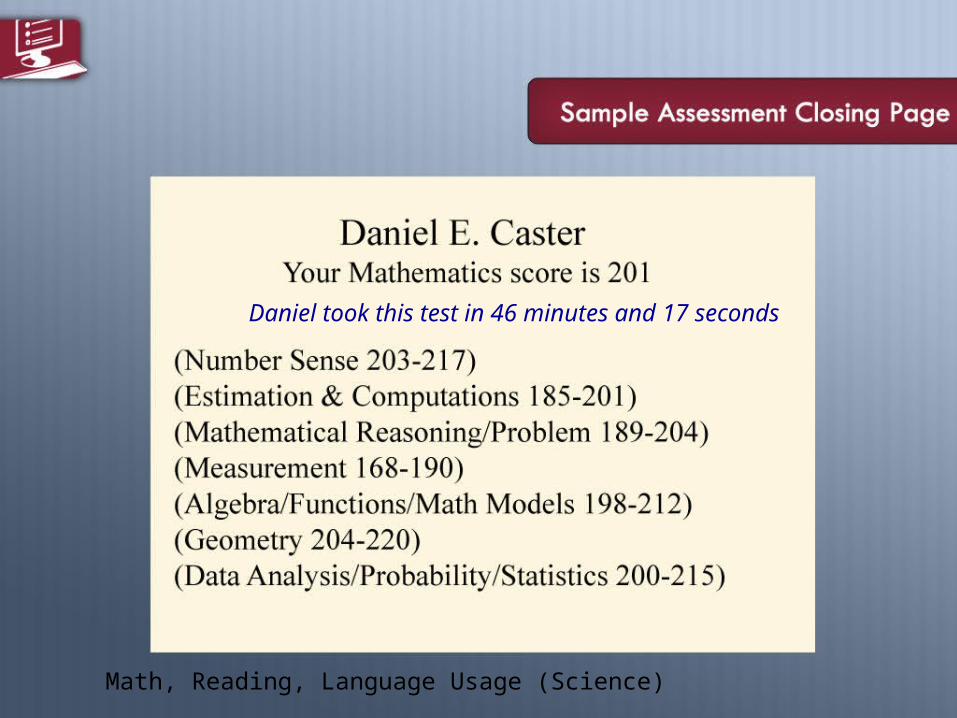
Math, Reading, Language Usage (Science)
Daniel took this test in 46 minutes and 17 seconds
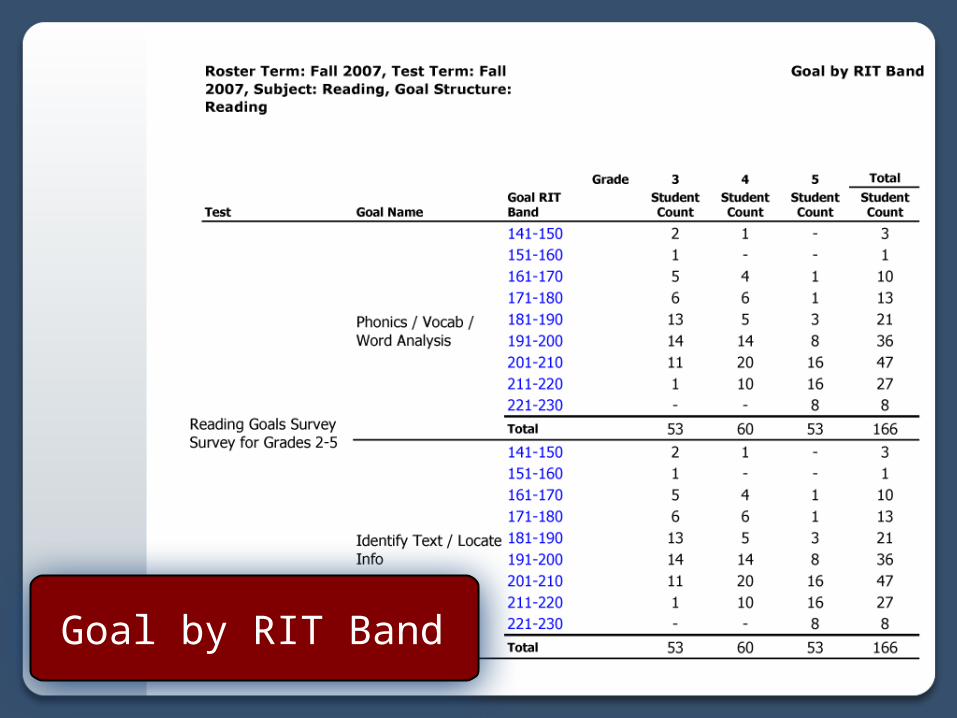
Goal by RIT
Goal by RIT Band
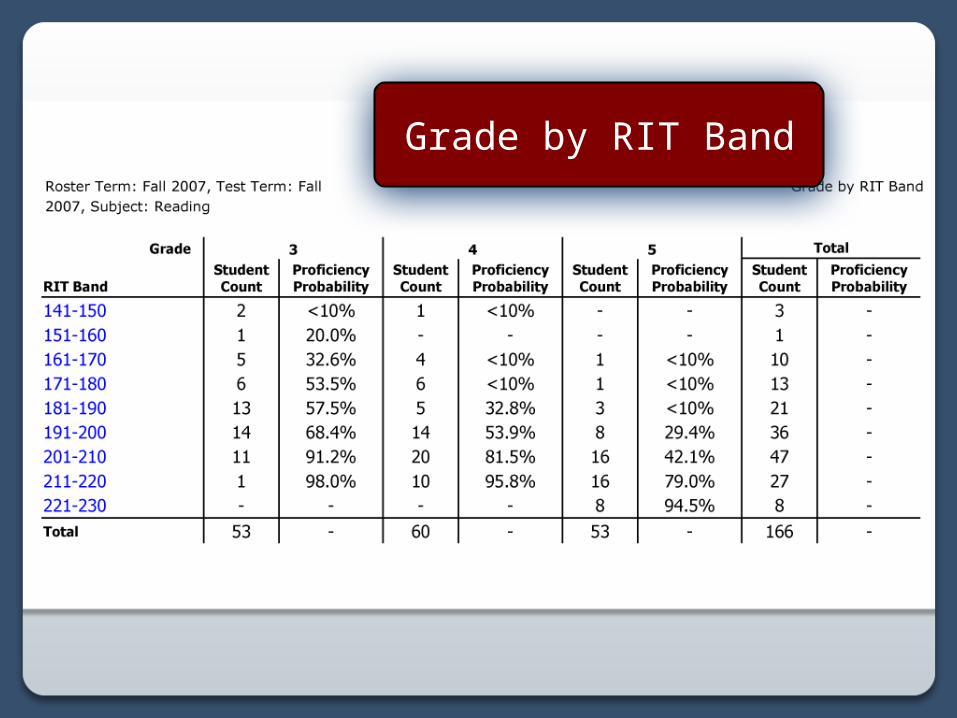
Grade by RIT Band
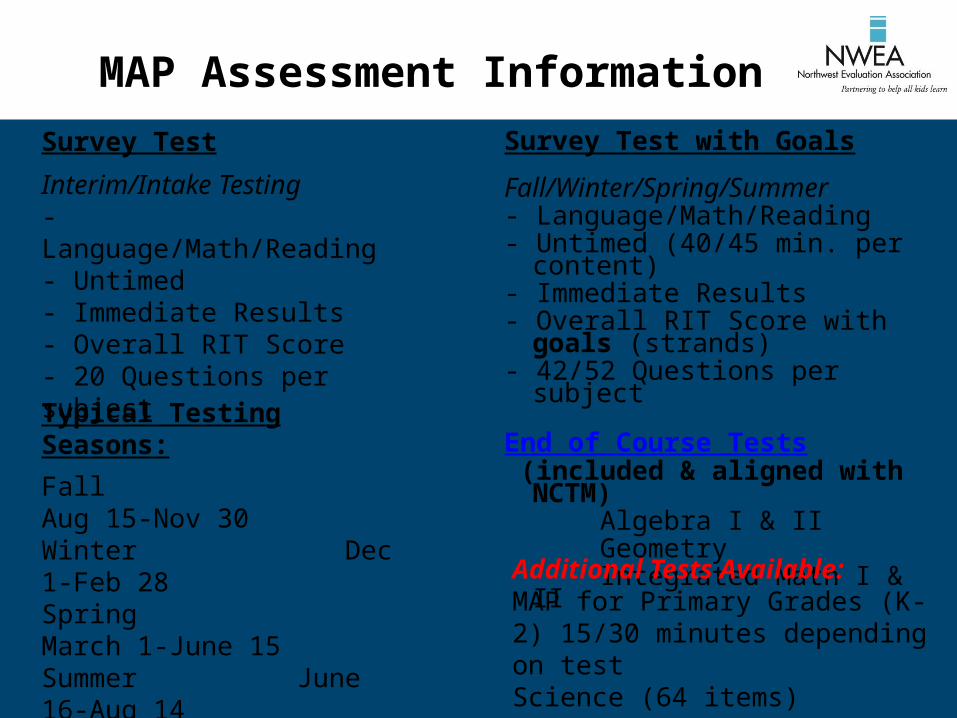
Survey Test
Interim/Intake Testing- Language/Math/Reading- Untimed- Immediate Results- Overall RIT Score- 20 Questions per subject
Survey Test with Goals
Fall/Winter/Spring/Summer- Language/Math/Reading- Untimed (40/45 min. per content) - Immediate Results- Overall RIT Score with goals (strands)- 42/52 Questions per subject
End of Course Tests (included & aligned with NCTM) Algebra I & II Geometry Integrated Math I & II
Additional Tests Available:MAP for Primary Grades (K-2) 15/30 minutes depending on testScience (64 items)
MAP Assessment Information
Typical Testing Seasons:
Fall Aug 15-Nov 30Winter Dec 1-Feb 28Spring March 1-June 15Summer June 16-Aug 14
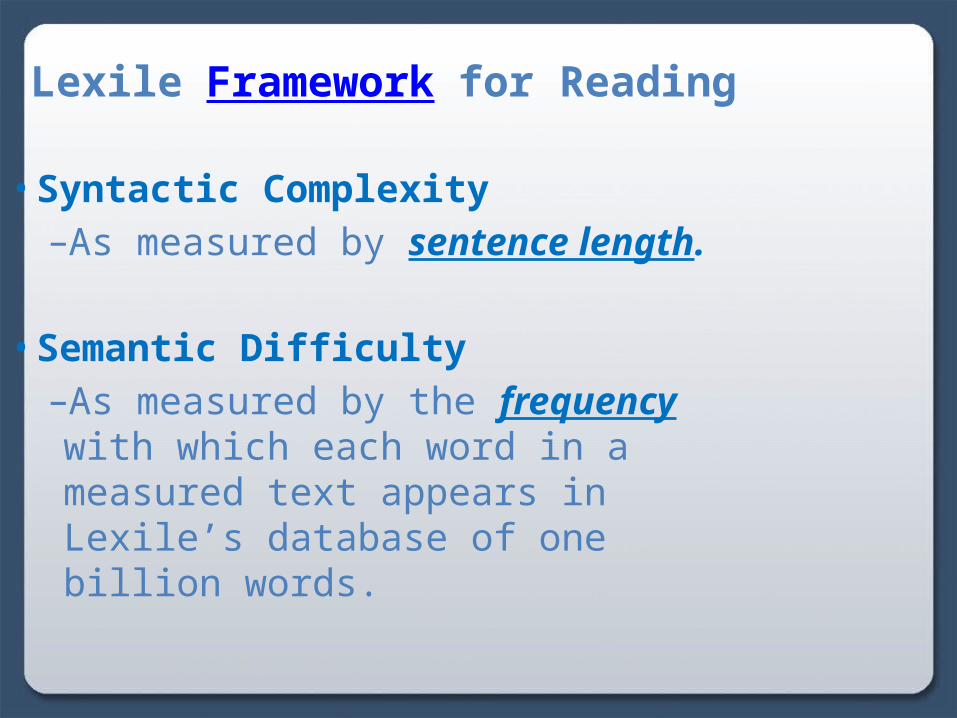
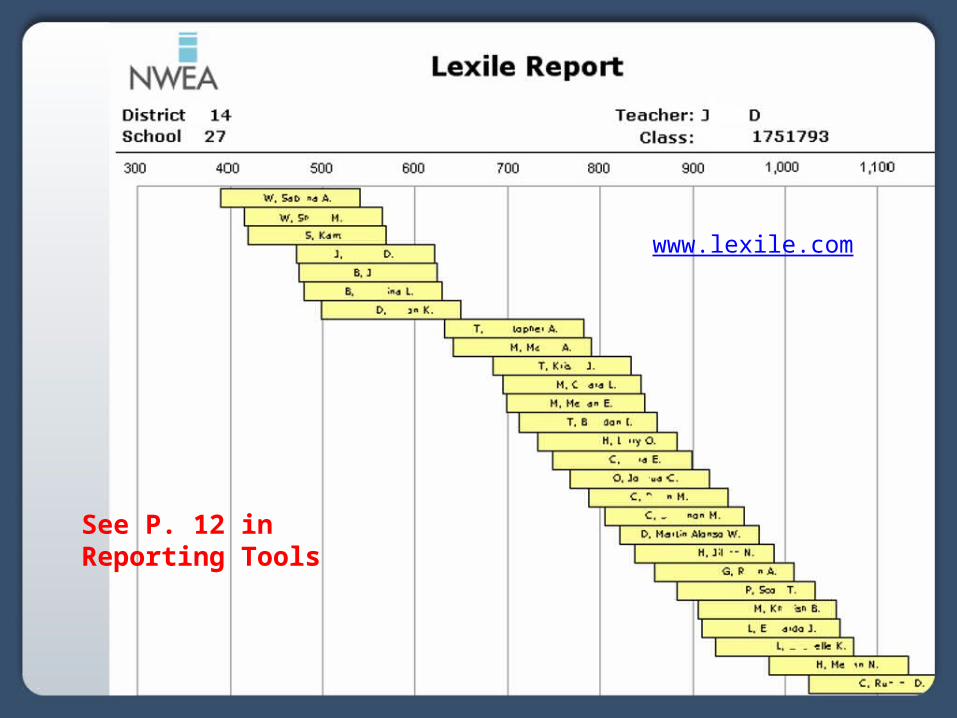
Lexile Framework for Reading
• Syntactic Complexity–As measured by sentence length.
• Semantic Difficulty–As measured by the frequency with which each word in a measured text appears in Lexile’s database of one billion words.
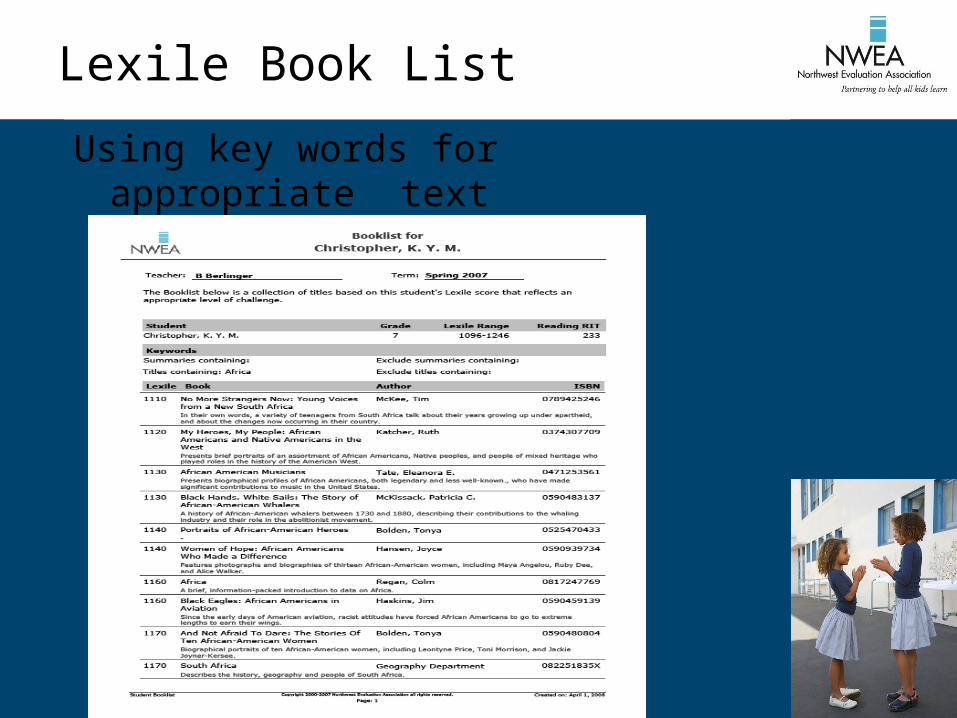
Lexile Book List
Using key words for appropriate text
35
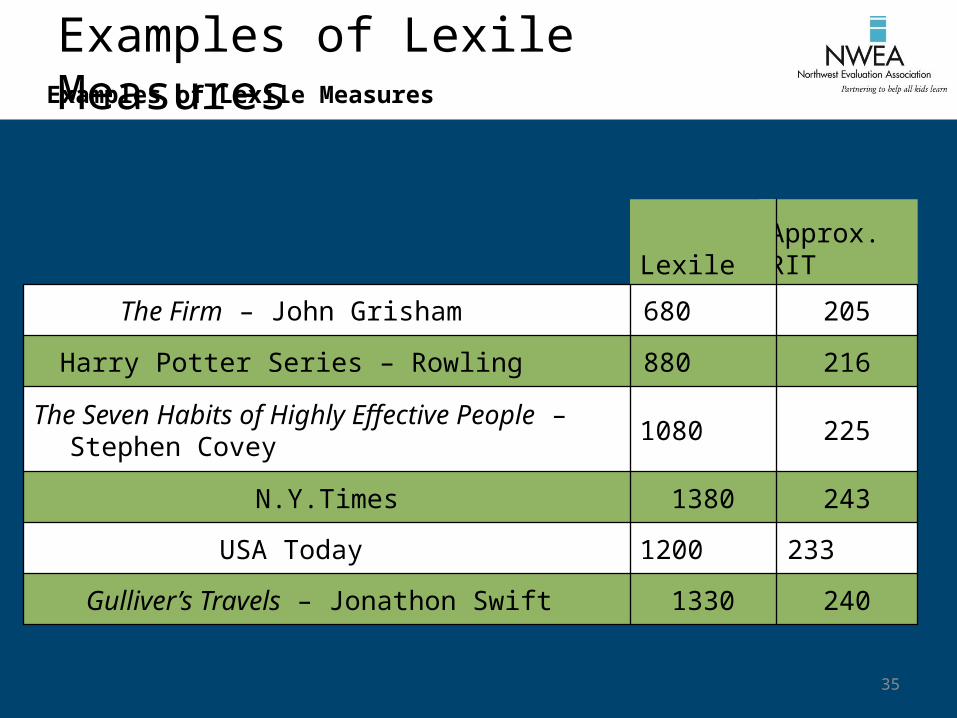
2401330Gulliver’s Travels – Jonathon Swift
2331200USA Today
2431380N.Y.Times
2251080The Seven Habits of Highly Effective People – Stephen Covey
216880Harry Potter Series – Rowling
205680The Firm – John Grisham
Approx.RITLexile
Examples of Lexile MeasuresExamples of Lexile Measures
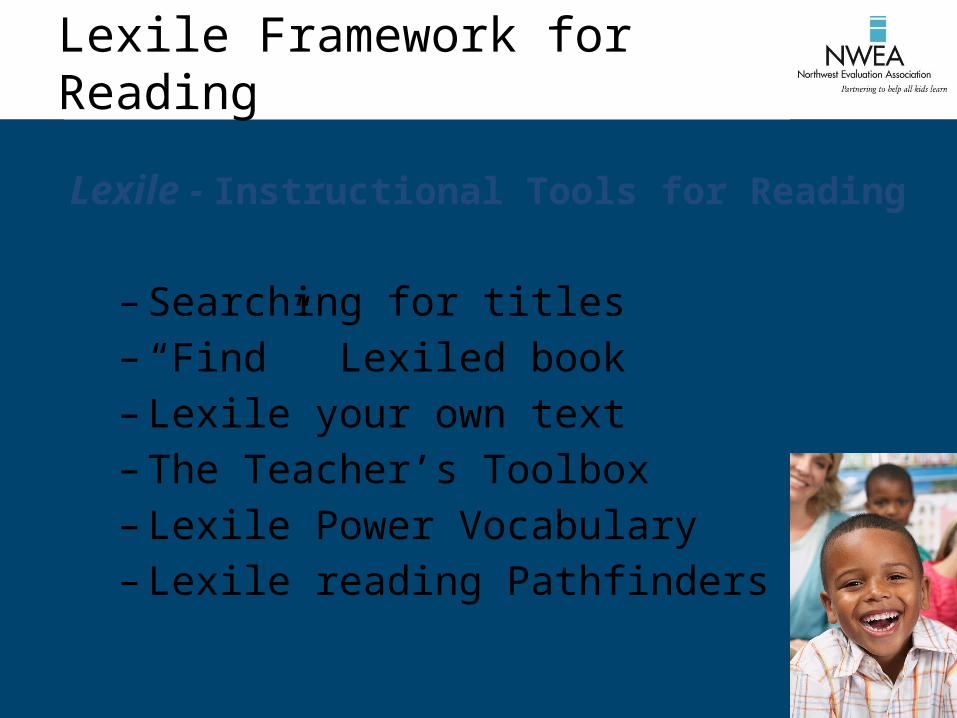
Lexile Framework for Reading
Lexile - Instructional Tools for Reading
– Searching for titles– “Find” Lexiled book– Lexile your own text– The Teacher’s Toolbox– Lexile Power Vocabulary– Lexile reading Pathfinders