Embed Size (px)
Citation preview
Dynamics in trade streams in international food supply networks.
The case of fresh produce, meat, and cereals
Jivka Deiters, Melanie Fritz
Department of Food and Resource Economics, University of Bonn, Germany
PAPER PREPARED FOR THE 116TH EAAE SEMINAR "Spatial Dynamics in Agri-food Systems: Implications for Sustainability and Consumer Welfare".
Parma (Italy)
October 27th -30th, 2010
Copyright 2010 Jivka Deiters, Melanie FritzAll rights reserved. Readers may make verbatim copies of this document for non-commercial purposes by any means, provided that
this copyright notice appears on all such copies.

2
International EAAE-SYAL Seminar – Spatial Dynamics in Agri-food Systems
Dynamics in trade streams in international food supply networks.
The case of fresh produce, meat, and cereals
Jivka Deiters, Melanie Fritz
Department of Food and Resource Economics, University of Bonn, Germany
Abstract— The identification of the most relevant agri-food trade streams serves as the foundation and shows the trading volume in selected countries on which the later research of project e-Trust is based, with particular consideration of the specific role of trust in these transactions and its transfer in e-commerce afterwards.
For the elaboration of the data collection, mainly the international statistical database of Food and Agriculture Organization of the United Nations (FAOSTAT) is used as a common basis of the comparison. The procedure has been applied to six European traders in agricultural products (Germany, Austria, Italy, Slovenia, Greece and Spain) and three non-European countries (USA, Brazil and Turkey). According to the statistical sources mentioned above, primary commodities are grouped into four categories: cereals, meat, fruit and vegetables, and olive oil.
The findings of the trade streams analysis shows that the trade structures in the selected countries are diverse, and there is a complex picture. Wheat and maize are major primary cereal commodities which are imported as well as exported. Most imports and exports of meat are of cattle, pigs or chickens. Overlapping trade streams could be identified between some countries, such as Germany, Austria, Italy and Spain.
The outcome of the trade streams analysis derives industry measures to enhance sustainable introduction of e-commerce.
The identification of the most relevant agri-food trade streams serves as the foundation and shows the trading volume in selected countries on which the later research of project e-Trust is based, with particular consideration of the specific role of trust in these transactions and its transfer in e-commerce afterwards. In this chapter, the
focus is on the size of trade streams regarding agri-food products in selected countries on a yearly basis and shows the potential for the introduction of e-commerce.
Keywords— trade streams, dynamics, e-commerce.
I. INTRODUCTION: DESCRIPTION OF DATA COLLECTION AND CRITERIA FOR TRADE
STREAM ANALYSIS
On the one hand, exports are an important source of income for most countries. On the other hand, imports are necessary to compensate for a lack of national resources, to benefit from other countries' comparative advantages, to satisfy consumer demand for foreign products, et cetera. Hence, the analysis of international trade streams is necessary in order to show and to understand whether the country is dependent on resource imports from other countries and to what extent the domestic consumption depends on resources extracted domestically and imported from abroad.
The objective of this chapter is to identify food chains with trans-European cross-border exchange of food products (e.g. fresh vegetables, fresh fruits, meat, and grain) and international food chains from Brazil and the US to Europe with the support of statistical database and in order to classify potential opportunities for enhancing market development and introduction of e-commerce.
For the elaboration of the data collection, mainly the international statistical database of Food and Agriculture Organization of the United Nations (FAOSTAT) is used as a common basis of the comparison. The data of trade from 2005-2006, which

3
International EAAE-SYAL Seminar – Spatial Dynamics in Agri-food Systems
is the last year that information has been provided, are grouped by the following countries:
- Within the European Union: Germany, Austria, Slovenia, Italy, Greece, Spain;
- Trans-European cross-border: USA, Brazil and Turkey.
According to the statistical sources mentioned above, primary commodities are grouped into four categories: cereals, meat, fruit and vegetables, and olive oil.
For each of the previously mentioned countries and for the agri-food chains of the four product groups regarding the following criteria, the trade streams are to be identified:
- the two most relevant products for export at every level of the agri-food chain with the two most relevant destination countries;
- the two most relevant products for import at every level of the agri-food chain with the two most relevant countries of origin.
It is important to analyse the trading volume with respect to the imported or exported agri-food products not only on one chain level but rather on all levels. This allows the development of a completed picture in the agri-food supply networks and the potential sources for the introduction of e-commerce.
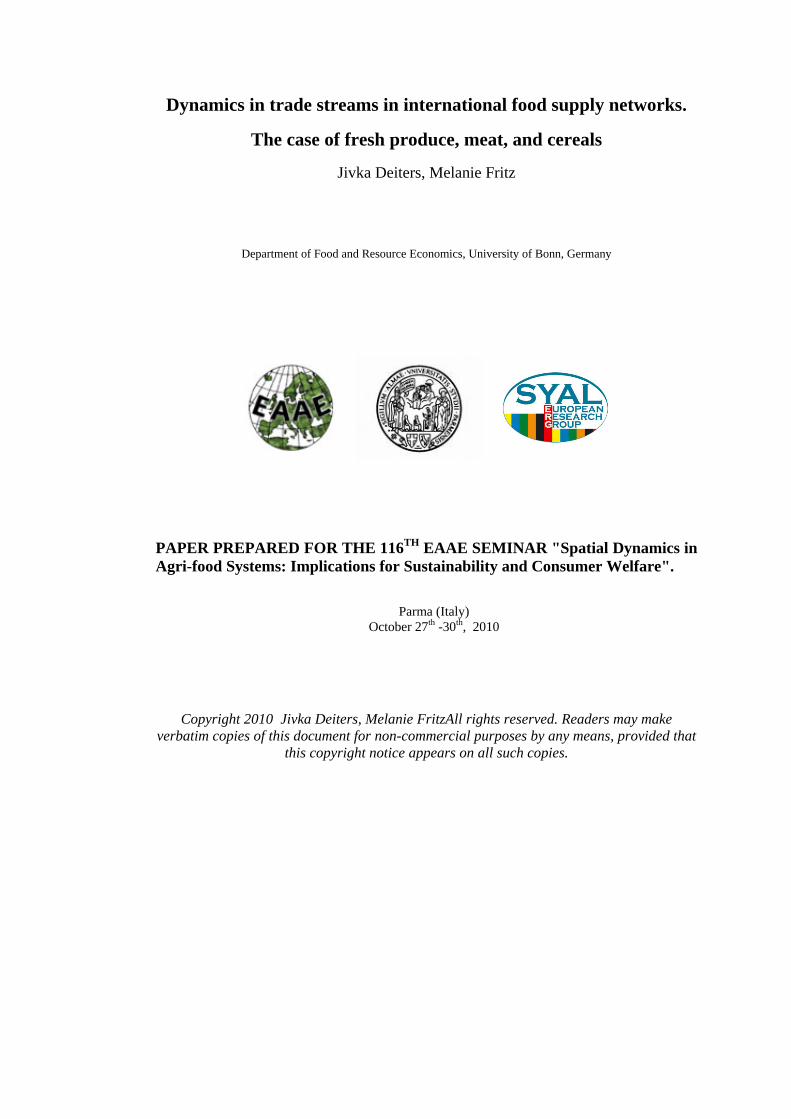
Figure 1 below presents an example of the international trade stream analysis. This schematic shows the procedure, which will be done for every selected country along the selected agri-food sectors. However, the international trade is determined by import and export volume. Thus, the depicted example is distinguished on the one hand by the import side and on the other by the export side of the respective country (the right side of Figure 1). The left side of the Figure 1 provides the issue that an information assymetry and missing trust can occur between the traders and especially on the buyer side. Hence, the trust in the seller is a crucial element in particular in the international trade where cultural differences govern.
Farm level
1. Processing Industry Level
2. Processing Industry Level
1. Product
2. Product
1. Country
2. Country
1. Country
2. Country
1. Product
2. Product
1. Country
2. Country
1. Country
2. Country
1. Product
2. Product
1. Country
2. Country
1. Country
2. Country
Farm level
1. Processing Industry Level
2. Processing Industry Level
1. Product
2. Product
1. Country
2. Country
1. Country
2. Country
1. Product
2. Product
1. Country
2. Country
1. Country
2. Country
1. Product
2. Product
1. Country
2. Country
1. Country
2. Country
1. Product
2. Product
1. Country
2. Country
1. Country
2. Country
1. Product
2. Product
1. Country
2. Country
1. Country
2. Country
1. Country
2. Country
1. Country
2. Country
1. Product
2. Product
1. Country
2. Country
1. Country
2. Country
1. Product
2. Product
1. Country
2. Country
1. Country
2. Country
1. Country
2. Country
1. Country
2. Country
1. Product
2. Product
1. Country
2. Country
1. Country
2. Country
1. Product
2. Product
1. Country
2. Country
1. Country
2. Country
1. Country
2. Country
1. Country
2. Country
FI
= Need for
trust
F = Farmers
FI = Food industry
R = Retail
R
Country X Country Y
F
R
F
FI
Cross-border transaction
Cross-border transaction
FI
= Need for
trust
F = Farmers
FI = Food industry
R = Retail
R
Country X Country Y
F
R
F
FI
= Need for
trust
= Need for
trust
F = Farmers
FI = Food industry
R = Retail
R
Country X Country Y
F
R
F
FI
R
Country X Country Y
F
R
F
R
F
FI
F
FI
Cross-border transaction
Cross-border transaction
Cross-border transaction
Cross-border transaction
Fig. 1 Methodological schema of trade stream analysis
The in-depth analysis of the international trade streams is provided in the following section. In order to go deeper into the food trade stream analysis, the focus is on the selected countries, highlighting the main streams for each level in each chain (cereals – meat – fruit and vegetables – olive oil).
II. IDENTIFICATIO OF TRADE STREAMS
A. Trade streams to and from Germany
Trade streams in the cereal sector in Germany The most relevant commodities of the cereal sector
and trade countries for Germany are listed below and shown in the Appendix Table 1.
Raw cereals: • Imports: maize and wheat. While maize comes mostly from France and
Hungary, wheat is mostly imported from the Czech Republic and France.
• Exports: wheat and barley. The main destinations for wheat are the Netherlands
and Belgium. The Netherlands and Saudi Arabia are the most relevant trade countries regarding barley.
Processed cereals: • Imports/Exports at 1st processing-industry level:
flour and malt All countries from the European Union are relevant
for the import and, except for the Netherlands, the exports’ trade partners are from third countries, e.g., Russia, Japan and Libya.
• Imports/Exports at the 2nd processing-industry level: beer/pastries

4
International EAAE-SYAL Seminar – Spatial Dynamics in Agri-food Systems
Denmark, Belgium/Luxemburg, the Netherlands and Italy are depicted as essential import countries considering the commodities. France, Great Britain and Italy are identified on the export site.
Trade streams in the meat sector in Germany
The meat sector is the second largest section in Germany’s agri-food imports and exports. The analysis of the meat sector consists of three parts: beef, pork and poultry subsectors. As in the cereal sector, the trade relationships within the meat segment are established on a long-term basis. The most relevant commodities of the meat sector and trade countries for Germany are listed below.
Livestock: Imports: cattle, pigs and chicken.
Main origins are: the Netherlands, Denmark and Belgium.
Exports: cattle, pigs and chicken. Mostly the exports go to the Netherlands, Italy,
Austria and Poland. Processed meat: Imports at the 1st processing-industry level:
fresh and frozen beef, pork and poultry. The Netherlands, France, Belgium, Denmark and
Poland are identified for this aspect. Exports at the 1st processing-industry level: :
fresh and frozen beef, pork and poultry. The main destinations of the exported processed
meat are: Italy, France, the Netherlands and Russia. Imports at the 2nd processing-industry level:
processed beef, pork and poultry. The most relevant origins are: Brazil, the
Netherlands, Austria and Italy Exports at the 2nd processing-industry level:
processed beef, pork and poultry. The exports of the processed meat go mainly to
France, the Netherlands, and Great Britain. The products with their origins and destinations are
supported by the appropriate percentage and shown in Appendix Table 2.
Trade streams in the fruit sector in Germany
According to foreign trade within the fruit sector, Germany is an importing country: The expert interviews with fruit and vegetable enterprises revealed that transactions are executed mostly with
well-known cross-border partners. In addition, they apply contracts which vary from short term to long term. The most relevant commodities of the fruit/vegetables sectors and trade countries for Germany are listed below (see Appendix Table 3).
Fresh fruit: • Imports: bananas and apples. Bananas come from Ecuador and Colombia and
apples from Italy and the Netherlands. • Exports: bananas and apples. The bananas are identified as the most exported
fresh fruit and in this case are concerned primarily with re-exports. The exported apples go to the Netherlands and Denmark.
Processed fruit/vegetables: • Imports: orange and apple concentrate. Brazil, Switzerland, Poland and China are identified
for the section. • Exports: orange and apple juice. The Netherlands, France and Great Britain are the
most relevant destinations of the above mentioned exported commodities. Trade streams in the vegetable sector in Germany
Concerning foreign trade within the vegetable sector, Germany is an importing country: The expert interviews with fruit and vegetable enterprises revealed that transactions are executed mostly with well-known cross-border partners. In addition, they employ contracts which vary from short term to long term. The most relevant commodities of the fruit/vegetable sectors and trade countries for Germany are listed below (see Appendix Table 4).
Fresh vegetables: • Imports: tomatoes and cucumbers. Together with Spain, the Netherlands delivers
tomatoes and cucumbers into Germany. • Exports: white and red cabbage, and onion. Sweden and the Czech Republic receive white and
red cabbage from Germany and the Netherlands and Austria as well as onions.
Processed vegetables: • Imports: tomato purée and tomatoes (prepared
without vinegar). Italy is the most essential trade partner for
processed vegetables and distributes more than 70
5
International EAAE-SYAL Seminar – Spatial Dynamics in Agri-food Systems
percent. The second important country for the imported processed vegetables into Germany is Spain.
• Exports: pasteurised cucumbers and dried peas. Both commodities go to the Netherlands, and
Denmark is in the second place regarding dried peas. France is the second destination of pasteurised cucumbers.
B. Trade streams to and from Austria
Trade streams in the cereal sector in Austria The production of cereals is of high importance in
Austria. The export and import trade streams of raw materials are influenced by geographical distances and historical roots. Therefore, Hungary, Germany and Italy are the most important trading partners in the supply chain of cereals. On the farm level and the level of the raw-products trade sector, Austria mainly imports maize and wheat from Hungary. It is noticeable that Austria imports these products more cheaply than it exports them. The main export partner on a farm level is Italy. The first level of processing imports and exports of commodities is only of marginal importance for the processing industry, only small quantities are traded. One reason may be the fact that the majority of bakeries in Austria are small companies – these bakeries still purchase on a regional level. Furthermore, products on the first level of processing are low-priced products. Longer transport distances are therefore avoided. In addition, purchase decisions are influenced by a trend towards regionalization, a trend primarily initiated by the market-dominating retail chains. Wheat flour and malt flour are mainly imported from Germany; the two most important exported products are malt flour and wheat flour, which are exported respective to Italy and Bulgaria, and also to Hungary and Germany (see Appendix Table 5).
Trade streams in the meat sector in Austria
Meat is the most important agricultural product in Austria, and especially cattle meat is exported mainly to Germany and Italy. Particularly trade with the new EU member states is developing very positively. Due to the fact that there are still a lot of slaughter houses in Austria, companies import a considerable quantity of livestock. A high number of pigs in particular is imported and slaughtered in Austria, and then
exported again. As for poultry meat, Austria imports these products on the second processing level. Italy and Germany are main trading partners on both sides – import and export as well. The details of the statistical data are provided in Appendix Table 6.
Trade streams in in the fruit sector in Austria
Compared to the meat and cereals sectors, fruit and vegetables are of lesser importance in Austria when compared with production. Within the fruit sector, imports from Germany, China, Italy and Belgium are of importance. The most essential export partner in the fruit sector aside from Germany (for apples and grapes) is Italy (orange juice). Table 7 in the Appendix shows the percentage spread of the trade streams and the appropriate trade partners. Trade streams in the vegetable sector in Austria
On the imported side, the main origins are Italy, Spain, the Netherlands and Germany. On the exported side, Germany, Hungary and the Czech Republic are of big importance.
C. Trade streams to and from Italy
Trade streams in the cereal sector Italy Considering the cereals supply chain, Italian
supplies for raw materials depend mainly on European countries (France and Hungary), but also on extra-EU partners (Canada is the most important country for the Italian import of durum wheat). As for first-level processed products in the cereal supply chain, wheat flour and maize flour are the most imported raw goods from respectively Spain and France, and Austria and France. Germany plays an important role in the second-level processed products with their imports of pastry and beer into Italy. On the export side rice, wheat, wheat flour and maize, pasta and pastry are the most essential products of all chain levels. Relevant destinations are France and Germany. More details are provided in Appendix Table 9.
Trade streams in the meat sector in Italy
Table 10 in the Appendix shows that import and export streams in the meat sector in Italy occur between European partners at each link in the chain. If France and Spain are the most important partners at the production level, Germany is the most relevant

6
International EAAE-SYAL Seminar – Spatial Dynamics in Agri-food Systems
business partner at the processing level, both for import and for export.
Trade streams in the fruit sector in Italy
For the Italian fruit supply chain, the analysis shows that exchanges take place with extra-EU partners in the case of fresh products (e.g., bananas and peaches). The processed-fruit products come mainly from EU countries like Germany, Austria, Spain and Greece. Italy exports mainly apples, grapes and processed fruit to EU countries like Spain, Great Britain, Germany and France. The appropriate percentage depiction is given in Appendix Table 11.
Trade streams in the vegetable sector in Italy
The Italian vegetable supply chain shows a similar scenario, with few EU countries as main trade partners: France, Spain and the Netherlands are the countries of origin of the most imported products (potatoes, tomatoes and processed vegetables), and the UK and Germany are the destinations of the most exported products at each level of the supply chain (lettuce, tomatoes and processed vegetables). Further trading export partners of Italy are the extra-EU countries like China and Australia (see Appendix Table 12).
Trade streams in the olive oil sector in Italy
The trade streams concerning the olive oil supply chain show that Italy is a net importer of olive oil. Olives and high-quality olive oil are imported mainly from mediterranean countries (Spain, Greece), while export (both at production and at processing level) involves not only EU countries like Germany and France but also extra-EU partners (the USA are an important destination for Italian olive oil supply chain products). The percentages and quantities of the Italian exports and imports are shown in Appendix Table 13.
D. Trade streams to and from Slovenia
Trade streams in the cereal sector Slovenia The largest proportion of imports to Slovenia goes to maize from Hungary and Macedonia and to wheat from Hungary and Austria. The geographic conditions play an essential role in the import of processed products, which means that the largest quantities are
from Italy and Austria. Italy is an important trading partner of Slovenia from the export side as well, and the largest quantities of maize and barley go there. Export products of the first and second processing level are not relevant on the quantity side; therefore, they are not considered in this analysis. The detailed statistical data is shown in Appendix Table 14. Trade streams in the meat sector in Slovenia Meat production is the most important branch of Slovenian agriculture. Imports are coming mainly from Austria, Italy and Hungary. Exports are mainly driven by big companies themselves or by agents. These countries are very essential trading partners on the export side as well. The in-depth analysis of the statistical data of the most relevant products and their origins and destinations is given in Appendix Table 15 Trade streams in the fruit sector in Slovenia Fruit is mainly imported to Slovenia from Ecuador and Colombia (bananas) and Italy and Egypt (oranges). Apples are one of the most important fruits in Slovenian production and trade. The most important trading partners are Croatia and Austria. Regarding the exports of bananas, these are mainly re-exported and go to Italy. The quantity of exported processed fruit is not relevant and therefore not under consideration (see Appendix Table 16). Trade streams in the vegetable sector in Slovenia In the vegetable sector the most important trading partners on the import side are Italy, Turkey, Austria and Netherlands. Most vegetables from Slovenia are exported to Germany. A detailed analysis of the quantity and the countries is given in Appendix Table 17. Trade streams in the olive oil sector in Slovenia Slovenia is a net importer of olive oil. More than half of all olive oil is imported, mainly from the EU (Italy, Greece and Spain). Slovenia exports mainly to Croatia and Bosnia-Herzegovina (see Appendix Table 18).
E. Trade streams to and from Greece
Trade streams in the cereal sector Greece Regarding the cereal sector, Greece is an import-dependent country. More specifically, in the cereal

7
International EAAE-SYAL Seminar – Spatial Dynamics in Agri-food Systems
sector Greece is importing mainly from Russia, France, Hungary, Italy and Germany. On the export side, Italy remains a very relevant trading partner. For more details see Appendix Table 19. Trade streams in the meat sector in Greece Concerning the meat sector, Greece is an import-dependent country. Table 20 in the Appendix shows that pork and beef and also pigs and cattle are primarily imported from the Netherlands, France, Germany, Hungary and Italy. A relevant product volume is distributed through a central meat market, while meat-processing companies are importing directly from suppliers abroad. Trade streams in the fruit sector in Greece Greece is export-oriented regarding fruit products. In particular, major Greek exports include grapes and oranges for destinations such as Germany, the UK and Romania. On the other hand, imports are mainly bananas and lemons from Ecuador, Argentina, Turkey and Italy. The results of the statistical database are presented in Appendix Table 21. Trade streams in the vegetable sector in Greece For vegetables, overall Greece is exporting more than importing. In particular, major Greek exports include asparagus and cucumbers to destinations such as Germany, Austria and the USA (see Appendix Table 22). Trade streams in the olive oil sector in Greece In the olive oil sector Greece is clearly an exporting country. Most exports are to Italy but also to Germany and Spain as EU countries, and outside the EU to the USA (see Appendix Table 23).
F. Trade streams to and from Spain
Trade streams in the cereal sector Spain Spain is a country dependent on cereal imports of wheat and maize. The major imports come from the Ukraine and France. The statistical data shows a dependency of Spain on France and Portugal on products of the first and second processing level regarding their imports. On the export side, France and Portugal are identified as very relevant destinations as well. An overview of the other imported and exported
products and their origins and destinations is presented in Appendix Table 24. Trade streams in the meat sector in Spain Pork sector in Spain is a relevant sub sector within the meat sector. The Netherlands is the most active partner in livestock trade with the 73% of the pork livestock sector. More than the imported quantity of pigs is delivered on the export side, and Portugal receives about 71%. Further statistical data of the Spanish trade streams is presented in Table 25. Trade streams in the fruit sector in Spain The fruit sector represents a major sector in Spain. The main fresh-fruit exports are oranges and apples that go to Germany, France and Portugal. The processed-fruit sector shows that mostly orange and grape juice are exported to France and Germany, and Italy and France. The Spanish results of the trade streams regarding the fruit sector are shown in Table 26. Trade streams in the vegetable sector in Spain Spain is an export-oriented country like Greece regarding vegetable products. The main Spanish fresh vegetables are exported to Germany and the UK (tomatoes and lettuce). In addition to the export side, the quantities of vegetables imported to Spain are shown in Appendix Table 27. Trade streams in the olive oil sector in Spain Olive trees and the olive oil sector in Spain are a part of Spanish culture. The most dominant import partners are also olive oil producers (Portugal and Italy), and the exports of canned or bottled olive oil go to France and Portugal. Table 28 in the Appendix highlights the results of the Spanish quantities and percentages in the olive oil sector.
G. Trade streams to and from USA
Trade streams in the cereal sector USA When evaluating US agricultural exports, the EU is no longer the number-one trading partner, but remains a primary market for several products produced in the US (FRITZ ET AL. 2008). Cereal exports to the EU represent 13 percent of total US exports to the EU. Note that cereals to the EU

8
International EAAE-SYAL Seminar – Spatial Dynamics in Agri-food Systems
are not as dominant as those found within the world market, but it is still a relevant export market for US cereals. The main cereals exported are wheat and grain sorghum, and Spain can be identified as the main destination (see Appendix Table 29). Trade streams in the meat sector in USA U.S. exports of meat to the EU are nearly non-existent. This is a direct result of the trade restrictions mentioned earlier due to disease outbreaks and production practices. This statement can be confirmed by the statistical data which is given in Appendix Table 29. Trade streams in the fruit sector in USA The top two fresh-fruit products being exported into the EU are grapefruit and apples. Within the processed-fruit sector the top products are prunes and raisins. The quantities of these exported fruit products are shown in Appendix Table 29. Trade streams in the vegetable sector in the USA Potatoes are identified as the most exported vegetable for Europe. In particular, Great Britain and the Netherlands are identified as the most essential destinations and the respective quantities are presented in Appendix Table 29.
H. Trade streams to and from Brazil
Trade streams in the cereal sector Brazil The estimated grain crop area in Brazil is about 47 million hectares. Regarding the statistical database, the exports to Europe’s countries are essential only with respect to maize and wheat, and Portugal and Spain are identified as destinations (see Appendix Table 30). Trade streams in the meat sector in Brazil The meat sector is the second largest complex in Brazilian agri-business exports, gaining more importance over the last few years. Brazil has the world’s largest commercial cattle herds, which are mainly raised in pastures. The main destinations of cattle exports to Europe are Great Britain and Italy. While cattle and chicken are essential as fresh-meat exports, pork and chicken are the most relevant products as processed meat and go to the Netherlands
and Great Britain, and to France and Germany, respectively (see Appendix Table 30). Trade streams in the fruit sector in Brazil Although Brazil is the third largest fruit producer in the world, its export volume is not as important as the grain or meat sector to the Brazilian export balance, with the exception of orange juice. Fresh-fruit exports represent only 1% of the total (FRITZ ET AL. 2008). Bananas and mangos are exported the most, to Great Britain and Italy, respectively, and also to the Netherlands and the USA. The exports of orange juice in concentrated and non-concentrated form are identified as processed-fruit products. The largest amounts go to Belgium and the Netherlands (see Appendix Table 30).
I. Trade streams to and from Turkey
Trade streams in the cereal sector Turkey Cereals are the most important part of Turkish plant production in terms of sown land and production volume. Wheat is the main product that is produced and exported the most. The wheat flour, macaroni and pastry industries are well developed in parallel with a wheat production advantage. Germany and Italy are very important destinations for Turkish cereal products. The identification of the appropriate destinations and quantity is provided in Appendix Table 31. Trade streams in the meat sector in Turkey The red-meat sector is not as developed in terms of foreign trade. In spite of a high number of livestock and slaughter quantities, high domestic consumption and an import-export ban restrain development of foreign trade. Unlike the red-meat sector, poultry is well developed in all stages of production. Export activities are generally limited by poultry. While chickens are exported to Romania and Bulgaria, chicken meat is exported to Bulgaria and Cyprus (see Appendix Table 31). Trade streams in the fruit sector in Turkey Fruit and vegetables are one of the most advantageous agricultural sub-sectors of Turkey in terms of production and foreign trade. Lemons and fruit juice are the most exported products. The main

9
International EAAE-SYAL Seminar – Spatial Dynamics in Agri-food Systems
importers of these two products are Greece and Romania as well as Germany and Cyprus, respectively. The identified quantities are provided in Appendix Table 31). Trade streams in the vegetable sector in Turkey As mentioned in the section on the fruit sector, Turkey has an important role in the production and foreign trade of fruit and vegetables. The most exported vegetables are shown as follows (see Appendix Table 31). Tomatoes are the most exported fresh vegetable. Their main importers are Romania and Germany. Frozen vegetables and peeled tomatoes are identified as processed vegetables in the statistical database. Frozen vegetables are mainly exported to Germany and Belgium. Peeled tomatoes are mainly exported to Germany as well as Ireland. Trade streams in the olive oil sector in Turkey Turkey is one of the most important olive-oil-producing countries in the world. However, export is generally limited to Italy and Spain in bulk packages mainly due to high import tax rates in European Countries.
III. FUTURE OPPORTUNITIES AND SUGGESTIONS
In this chapter, the international trade streams in different agri-food sectors are identified. These agri-food trade streams are identified, referring to the volume of exchanged goods, as an important potential on which to focus attention and study for the introduction of e-commerce. In this identification process the focus was mainly on four agri-food supply chains: cereals, meat, fruit and vegetables, and olive oil. Additionally, an investigation of all tiers of the supply chain – production, consumption and import/export – was carried out. The procedure has been applied to six European traders in agricultural products (Germany, Austria, Italy, Slovenia, Greece and Spain) and three non-European countries (USA, Brazil and Turkey).
Fig. 2 Overlapping of the trade streams between Italy and Germany in the cereal sector
The trade structures in the selected countries are diverse, and there is a complex picture. Wheat and maize are major primary cereal commodities which are imported as well as exported. Most imports and exports of meat are of cattle, pigs or chickens. Overlapping trade streams could be identified between some countries, such as Germany, Austria, Italy and Spain. An example of overlapping between two countries is shown in Figure 2 regarding the traded cereal products between Italy and Germany.
FI
R
F

10
International EAAE-SYAL Seminar – Spatial Dynamics in Agri-food Systems
Table 32: Most imported and exported agri-food products to and from the selected countries
Country Most imported
agrifood product
Most exported
agrifood product
Germany
Maize (from FR) Soft wheat (to NL)
Fresh pork (from (BE) Fresh pork (to IT)
Bananas (from EC) Orange juice (to FR)
Tomatoes (from NL) Dried peas (to NL)
Austria
Soft wheat (from HU) Soft wheat (to IT)
Pigs (from DE) Cattle (to IT)
Bananas (from DE) Apples (to DE)
Tomatoes (from IT) Not relevant
Italy
Wheat (from FR) Pasta (to DE)
Cattle (from FR) Pigs (to HU)
Bananas (from EC) Grapes (to DE)
Potatoes (from FR) Tomatoes preserves (to UK)
Virgin olive oil (from ES) Virgin olive oil (to USA)
Slovenia
Maize (from HU) Maize (to IT)
Pigs (from AT) Pigs (to HR)
Bananas (from EC) Bananas (to IT)
Potatoes (from IL) Potatoes (to DE)
Olive oil (from ES) Olive oil (to RS + ME)
Greece
Maize (from HU) Maize (to ES)
Cattle (from HU) Chicken (to IT)
Bananas (from EC) Oranges (to RO)
Potatoes (from EG) Vegetables in vinegar (to USA)
Olive oil (from IT) Olive oil (to IT)
Spain
Maize (from FR) Wheat flour (to LY)
Pigs (from NL) Pigs (to PT)
Apples (from FR) Oranges (to DE)
Potatoes (from FR) Tomatoes (to DE)
Olive oil (from IT) Olive oil (to FR)
USA Not relevant
Wheat (to ES)
Chicken (to RO)
Apples (to UK)
Brazil Not relevant
Maize (to ES)
Cattle (to UK)
Mango (to NL)
Turkey Not relevant
Wheat (to IT)
Chickens (to RO)
Olive oil (to IT)
Lemon (to GR)
Tomatoes (to RO)
The outcome of the trade streams analysis derives industry measures to enhance sustainable introduction of e-commerce. With the findings of the statistical databases the enterprises can obtain an assessment of the goodness of traded volume and products. The following table 32 shows the results that the business can expect to obtain when searching for a new potential for the introduction of e-commerce. They give a clear depiction of where the different countries stand with regard to most traded agri-food products relative to the cross-border exchanges.
REFERENCES
1. Schalenfrüchte, Kartoffeln sowie Mostobst". Available
at:
http://www.bmelvstatistik.de/fileadmin/sites/070_Gartenb/BerichtOG2006.pdf.
2. BMELV (2006a). Statistical database about Import of meat 2005. Available at: http://www.bmelvstatistik.de/fileadmin/sites/040_AHST/Fleisch_E_2006endg.pdf.
3. BMELV (2006b). Statistical database about Export of meat 2005. Available at: http://www.bmelvstatistik.de/fileadmin/sites/040_AHST/Fleisch_A_2006endg_01.pdf.
4. BMELV (2007). Statistical database about Import/Export of cereal 2005. Available at: http://www.bmelvstatistik.de/fileadmin/sites/040_AHST/t02_gesamt2007.pdf.
5. DBB (2007). Die deutsche Brauwirtschaft in Zahlen 2006. Berlin.
6. FAOSTAT (2005). Detailed World Agricultural Trade Flows. Available at: http://faostat.fao.org/site/535/default.aspx#ancor.
7. FAOSTAT (2007). Detailed World Agricultural Trade Flows. Available at: http://faostat.fao.org/DesktopModules/Faostat/WATFDetailed2/watf.aspx?PageID=536.
8. FAOSTAT (2008a). Detailed World Agricultural Trade Flows. Available at: http://faostat.fao.org/site/535/DesktopDefault.aspx?PageID=535.
9. FAOSTAT (2008b). Detailed World Agricultural Trade Flows. Available at: http://faostat.fao.org/site/537/DesktopDefault.aspx?PageID=537.
10. FAOSTAT (2008c). Detailed World Agricultural Trade Flows. Available at: http://faostat.fao.org/DesktopModules/Faostat/WATFDetailed2/watf.aspx?PageID=536.
11. Freitag, C. (2006). Annual report 2005/2006 Bundesverband der obst-, gemüse-und Kartoffelverarbeitenden Industrie e.V. Bonn, Juni 30.
12. Fritz, M., Deiters, J., Schiefer, G. (Eds). (2008). Report on food value chains with risks. Deliverable of EU FP6 project e-Trust.
13. Janorschke, B. (2007). Agrarmärkte 2006. Available at: http://www.lfl.bayern.de/publikationen/daten/schriftenreihe/p_24089.pdf.
14. SBA (2008). Statistical database. Available at: http://www.statistik-portal.de/Statistik-Portal/de_jb01_jahrtab1.asp.
15. VdF (2007). Daten und Fakten zur deutschen Fruchtsaftindustrie 2006. Available at: http://cms3.fruchtsaft.net/downloads/produkte/Daten_Fakten06_DE.pdf.
11
International EAAE-SYAL Seminar – Spatial Dynamics in Agri-food Systems
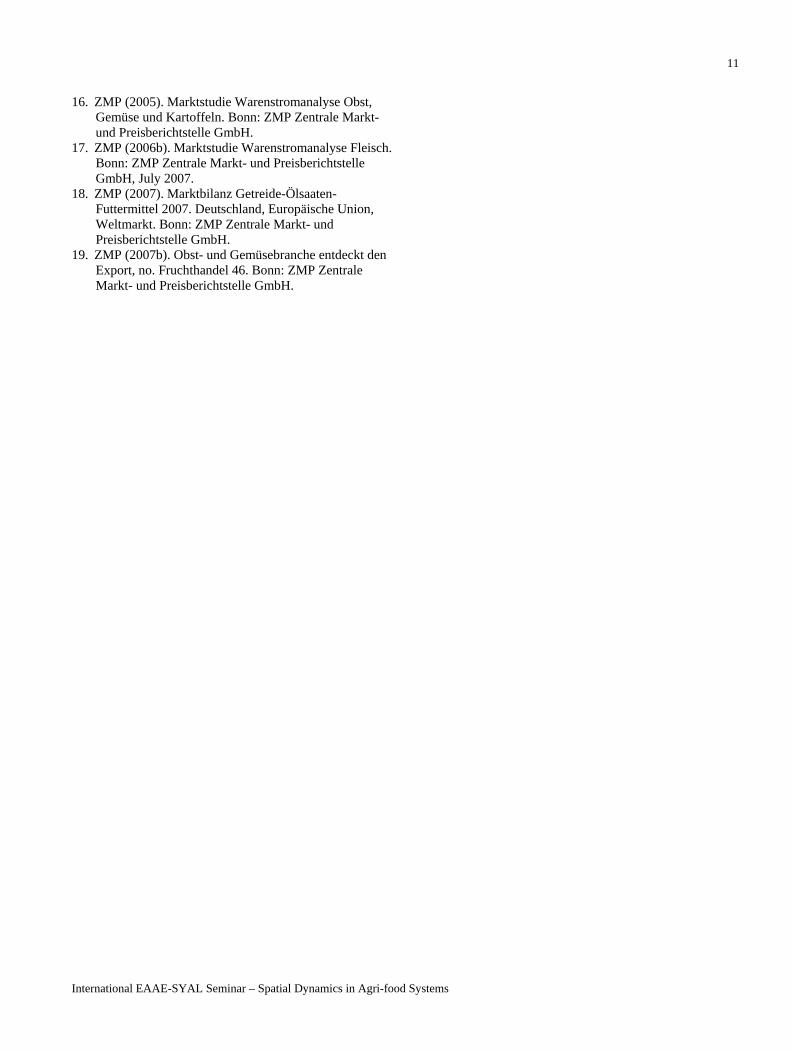
16. ZMP (2005). Marktstudie Warenstromanalyse Obst, Gemüse und Kartoffeln. Bonn: ZMP Zentrale Markt- und Preisberichtstelle GmbH.
17. ZMP (2006b). Marktstudie Warenstromanalyse Fleisch. Bonn: ZMP Zentrale Markt- und Preisberichtstelle GmbH, July 2007.
18. ZMP (2007). Marktbilanz Getreide-Ölsaaten-Futtermittel 2007. Deutschland, Europäische Union, Weltmarkt. Bonn: ZMP Zentrale Markt- und Preisberichtstelle GmbH.
19. ZMP (2007b). Obst- und Gemüsebranche entdeckt den Export, no. Fruchthandel 46. Bonn: ZMP Zentrale Markt- und Preisberichtstelle GmbH.
12
International EAAE-SYAL Seminar – Spatial Dynamics in Agri-food Systems
APPENDIX
Table 1: Trade streams in the cereal sector to and from Germany, 2005 (Source: SBA 2008, ZMP 2007, FAOSTAT
2008a/b/c, DBB 2007, BMELV 2007) IMPORT EXPORT
Two most relevant Products
Two most relevant Origins
Tons % of total
Two most relevant Products
Two most relevant Destinations
Tons % of total
1. FR 755.607 48 1. NL 1.465.718 25 1. Maize
2. HU 380.552 24 1. Soft wheat
2. BE 620.753 11 1. CZ 455.454 38 1. SA 687.967 26
Farm-level products
2. Soft wheat 2. FR 247.038 21
2. Barley 2. NL 429.970 16
1. FR 23.989 41 1. NL 122.772 25 1. Flour
2. BE 21.115 36 1. Flour
2. LY 120.225 24 1. FR 137.939 67 1. RU 46.410 12
1. Processing-Industry Level 2. Malt
2. NL 38.336 19 2. Malt
2. CH 41.186 11 1. NL 66.815 18 1. FR 113.138 18
1. Pastries 2. IT 59.546 16
1. Pastries 2. UK 75.307 12
2. DK 2.410 44 1. IT 3.205 24
2. Processing-Industry Level 2. Beer
(in hl) 3. BE/LU 1.105 20 2. Beer (in hl) 2. FR 1.842 13
Table 2: Trade streams in the meat sector to and from Germany, 2005 (Source: BMELV 2006a, BMELV 2006b and ZMP
2006b) IMPORT EXPORT
Two most relevant Origins
Tons % of total Two most relevant Destinations
Tons % of total
1. NL 3.269 23 1. NL 6.658 44 Livestock (beef and veal) 2. BE 2.614 19 2. IT 3.045 20
1. NL 231.852 75 1. AT 36.697 77 Livestock (pork) 2. DK 50.213 16 2. IT 2.707 6
1. NL 40.138 68 1. NL 181.593 97 Livestock (poultry) 2. DK 10.450 18 2. PL 3.742 2
1. NL 55.194 31 1. IT 95.176 29 Fresh (beef and veal) 2. FR 27.718 16 2. NL 62.193 19 1. NL 12.200 30 1. RU 17.436 32
Frozen (beef and veal) 2. BR 4.013 10 2. NL 13.254 24 1. BE 309.022 35 1. IT 259.776 37
Fresh (pork) 2. DK 269.363 31 2. NL 101.527 14 1. ES 13.362 20 1. RU 47.227 24
Frozen (pork) 2. DK 12.927 19 2. RO 25.213 13 1. NL 134.283 34 1. NL 63.887 22
Fresh and Frozen (poultry) 2. PL 68.297 17 2. RU 59.066 20 1. BR 5.262 27 1. FR 10.719 28 Processed (canned goods
from beef) 2. NL 2.590 13 2. NL 6.026 16
1. AT 13.735 28 1. FR 16.082 14 Processed (sausage products from pork) 2. IT 11.482 24 2. UK 15.936 14
1. BR 93.914 48 1. NL 28.924 23 Processed (offal, cans from poultry) 2. NL 25.279 13 2. FR 16.477 13

13
International EAAE-SYAL Seminar – Spatial Dynamics in Agri-food Systems
Table 3: Trade streams in the fruit sector to and from Germany, 2005 (Source: JANORSCHKE 2007, ZMP 2005, BLE 2006,
FAOSTAT 2007, VdF 2007)
IMPORT EXPORT
Two most relevant Origins
Tons % of total Two most relevant Products
Two most relevant Destinations
Tons % of total
1. EC 447.230 38 1. AT 50.895 19 1. Bananas
2. CO 302.369 25
1. Bananas (re-exports) 2. SE 44.097 17
1. IT 327.878 39 1. NL 14.954 16 Fresh Fruit
2. Apples 2. NL 117.761 14
2. Apples 2. DK 11.285 12
1. BR 305.539 65 1. FR 140.873 34 1. Orange concentrate 2. CH 63.226 13
1. Orange juice 2. NL 82.216 20
1. PL 113.443 38 1. UK 50.392 19
Processed Fruit 2. Apple
concentrate 2. CN 70.054 24 2. Apple juice
2. NL 42.094 17
Table 4: Trade streams in the vegetable sector to and from Germany, 2005 (Source: ZMP 2005, ZMP 2007b, BLE 2006,
FAOSTAT 2007, FREITAG 2006)
IMPORT EXPORT
Two most relevant Products
Two most relevant Origins
Tons % of total
Two most relevant Products
Two most relevant Destinations
Tons % of total
1. NL 319.341 47 1. SE 17.408 30 1. Tomatoes
2. ES 198.784 29
1. White and red cabbage 2. CZ 7.348 13
1. NL 248.644 56 1. NL 10.669 22
Fresh Vegetables 2.
Cucumbers 2. ES 145.104 33 2. Onions
2. AT 6.917 14 1. IT 150.960 70 1. NL 12.869 19 1. Tomato
purée 2. ES 45.763 21 1. Pasteurised cucumbers 2. FR 6.759 10
1. IT 177.144 92 1. NL 61.458 80 Processed Vegetables 2. Processed
tomatoes 2. ES 3.275 2 2. Dried peas
2. DK 3.890 5
Table 5: Trade streams in the cereal sector to and from Austria, 2005 (Source: FAO 2005) IMPORT EXPORT
Two most relevant Products
Two most relevant Origins
Tons % of total
Two most relevant Products
Two most relevant Destinations
Tons % of total
1. HU 133.624 53 1. IT 413.817 83 1. Soft wheat
2. DE 51.060 20 1. Soft wheat
2. DE 37.229 7 1. HU 329.940 84 1. IT 348.808 90
Farm-level products
2. Maize 2. DE 19.197 5
2. Maize 2. DE 27.840 7
1. DE 39.878 80 1. IT 13.414 23 1. Wheat flour
2. HU 6.468 13 1. Malt flour
2. BG 9.657 16 1. DE 21.378 43 1. HU 9.691 18
1. Processing-industry level
2. Malt flour 2. SK 19.530 39
2. Wheat flour 2. DE 7.438 15
1. DE 38.998 65 1. DE 12.111 15 1. Beer
2. IT 626 18 1. Beer
2. IT 10.215 12 1. DE 41.841 79 1. DE 19.897 58
2. Processing-industry level 2. Bakery
products 2. IT 2.875 5 2. Pasta
2. IT 5.406 16

14
International EAAE-SYAL Seminar – Spatial Dynamics in Agri-food Systems
Table 6: Trade streams in the meat sector to and from Austria, 2005 (Source: FAO 2005) IMPORT EXPORT
Two most relevant Products
Two most relevant Origins
Tons % of total
Two most relevant Products
Two most relevant Destinations
Tons % of total
1. DE 710.025 99 1. IT 81.261 63 1. Pigs
2. HU 4.160 0,5 1. Cattle
2. DE 24.235 19 1. CZ 21516 38 1. DE 52.210 51
Farm-level products
2. Cattle 2. DE 19613 35
2. Pigs 2. SI 22.457 22
1. DE 36.367 92 1. IT 23.825 43 1. Pigs (complete or half)
2. PO 1.160 3 1. Cattle parts 2. DE 9.490 17
1. DE 11.489 81 1. IT 17.083 67 1. Processing-industry level 2. Ham
(unpro-cessed) 2. IT 1.684 11
2. Ham (unpro-cessed) 2. CZ 3.895 15
1. DE 4.140 34 1. DE 9.271 81 1. Chicken meat products 2. SI 1.827 15
1. Chicken meat products
2. IT 174 1 1. DE 6.003 73 1. DE 20.742 70
2. Processing-industry level
2. Raw sausages 2. IT 1.622 20
2. Raw sausages 2. IT 886 3
Table 7: Trade streams in the fruit sector to and from Austria, 2005 (Source: FAO 2005)
IMPORT EXPORT
Two most relevant Products
Two most relevant Origins
Tons % of total
Two most relevant Products
Two most relevant Destinations
Tons % of total
1. DE 68.492 67 1. DE 37.222 52 1. Bananas
2. BE 19.541 19 1. Apples
2. HR 5.699 8 1. IT 40.616 40 1. DE 22.068 75 Fresh Fruit
2. Apples 2. HU 28.559 28
2. Grapes 2. NL 5.163 16
1. CH 26.477 21 1. IT 12.388 25 1. Apple juice, single strength 2. DE 25.896 20
1. Orange juice, single strength 2. DE 11.498 23
1. CH 25.738 36 1. DE 22.276 50
Processed Fruit 2. Orange juice,
single strength 2. DE 20.548 29
2. Apple juice, single strength 2. JP 6.768 15
Table 8: Trade streams in the vegetable sector to and from Austria, 2005 (Source: FAO 2005) IMPORT EXPORT Two most
relevant Products
Two most relevant Origins
Tons % of total
Two most relevant Products
Two most relevant Destinations
Tons % of total
1. IT 20.097 42 1. DE 6.352 16 1. Tomatoes
2. ES 16.850 36 1. Onions
2. HU 4.701 12
1. ES 8.669 42 1. DE 9.235 48
Fresh vegetables
2. Cucumbers 2. NL 2.862 14
2. Carrots 2. CZ 1.972 10
1. DE 10.163 60 1. Vegetables in Vinegar 2. TR 1.260 7
1. IT 7.405 55
Processed Vegetables 2. Paste of
Tomatoes 2. CN 2.159 16
not relevant

15
International EAAE-SYAL Seminar – Spatial Dynamics in Agri-food Systems
Table 9: Trade streams in the cereal sector to and from Italy, 2005 (Source: FAO 2005) IMPORT EXPORT
Two most relevant Products
Two most relevant Origins
Tons % of total
Two most relevant Products
Two most relevant Destinations
Tons % of total
1. FR 430.800 34 1. FR 119.604 19 1. Maize
2. HU 242.841 19
1. Rice milled 2. DE 84.985 13
1. FR 1.730.844 26 1. DZ 46.714 33
Farm-level products
2. Durum wheat 2. CA 815.185 12
2. Wheat 2. TN 19.834 14
1. ES 5.157 31 1. LY 241.207 46 1. Wheat Flour 2. FR 4.226 26
1. Wheat Flour 2. CU 147977 28
1. AT 909 46 1. IL 25.840 15
1. Processing levels
2. Maize Flour 2. FR 707 36
2. Maize Flour 2. EG 23.543 14
1. DE 51.264 40 1. DE 330.255 22 1. Pastry
2. FR 21.275 17 1. Pasta
2. FR 202.844 14
1. DE 295.493 56 1. DE 57.090 20
2. Processing levels
2. Beer of barley 2. DK 49.631 9
2. Pastry 2. FR 54.129 19
Table 10: Trade streams in the meat sector to and from Italy, 2005 (Source: FAO 2005) IMPORT EXPORT
Two most relevant Products
Two most relevant Origins
Tons % of total Two most relevant Products
Two most relevant Destinations
Tons % of total
1. FR 880.123 65 1. HU 48985 32 1. Cattle
2. PL 188608 14 1. Pigs
2. DE 13989 25 1. NL 235.453 41 1. ES 23.708 53
Farm-level products
2. Pigs 2. ES 141.662 25
2. Cattle 2. NL 18068 40
1. NL 60.771 22 1. GR 11926 19 1. Beef meat (fresh & frozen) 2. DE 58.022 21
1. Chicken meat (fresh & frozen) 2. DE 6629 11
1. DE 61.446 29 1. DE 8722 23 1. Processing level 2. Pork meat
(fresh & frozen) 2. FR 60.528 29
2. Pork meat 2. RO 6829 18
1. DE 9818 78 1. DE 9392 27 2. Processing level
1. Sausages of Pig Meat 2. ES 1520 12
1. Sausages of Pig Meat 2. ES 3067 9
Table 11: Trade streams in the fruit sector to and from Italy, 2005 (Source: FAO 2005) IMPORT EXPORT
Two most relevant Products
Two most relevant Origins
Tons % of total
Two most relevant Products
Two most relevant Destinations
Tons % of total
1. EC 276002 49 1. ES 52406 7 1. Bananas
2. CO 74855 13 1. Apples
2. UK 43098 6 1. ES 47639 80 1. DE 154978 31
Fresh Fruit 2. Peaches
2. FR 8050 14 2. Grapes
2. FR 80807 16 1. AT 13880 27 1. DE 22459 27
1. Fruit juice 2. DE 12296 24
1. Fruit juice 2. FR 12315 15
1. ES 851 35 1. DE 4353 26 Processed Fruit
2. Dried fruit 2. GR 415 17
2. Prepared fruit 2. FR 3904 24

16
International EAAE-SYAL Seminar – Spatial Dynamics in Agri-food Systems
Table 12: Trade streams in the vegetable sector to and from Italy, 2005 (Source: FAO 2005) IMPORT EXPORT
Two most relevant Products
Two most relevant Origins
Tons % of total
Two most relevant Products
Two most relevant Destinations
Tons % of total
1. FR 266.281 47 1. DE 43.897 45 1. Potatoes
2. NL 80.066 14 1. Lettuces, chicories 2. CH 8.200 8
1. NL 34.714 35 1. DE 43.871 48 Fresh Vegetables
2. Tomatoes 2. ES 34.213 34
2. Tomatoes 2. AT 11.306 12
1. BE 53.164 34 1. UK 193.659 23 1. Vegetable Frozen 2. FR 22.837 15
1. Tomatoes preserves and peeled 2. DE 135.643 16
1. FR 33.607 49 1. DE 34.049 38 Processed Vegetables 2.
Vegetables Preserved 2. ES 10.206 15
2. Veg. and legumes prepared or conserved
2. AU 9.144 10
Table 13: Trade streams in olive oil sector to and from Italy, 2005 (Source: FAO 2005)
IMPORT EXPORT Two most
relevant Origins
Tons % of total
Two most relevant Destinations
Tons % of total
1. GR 2.412 60 1. FR 228 29 Olives 2. ES 1.238 31 2. DE 152 20
1. ES 216.795 38 1. USA 190.795 44 Virgin olive oil 2. GR 92.013 16 2. DE 47.008 11
Table 14: Trade streams in the cereal sector to and from Slovenia, 2005 (Source: FAO 2005) IMPORT EXPORT
Two most relevant Products
Two most relevant Origins
Tons % of total
Two most relevant Products
Two most relevant Destinations
Tons % of total
1. HU 122.122 88 1. IT 26.712 99 1. Maize
2. MK 8.053 6 1. Maize
2. HR 443 2 1. HU 97.340 82 1. IT 1.710 99
Farm-level products
2. Wheat 2. AT 8.898 7
2. Barley 2. RS 13 0,75
1. RS 5.106 58 1. Maize Flour
2. IT 3.603 41
1. IT 8.268 40
1. Processing-industry level
2. Wheat Flour 2. AT 8.220 40 1. IT 2.966 18
1. Pastry 2. HR 2.848 17
1. DE 8.635 45
2. Processing-industry level
2. Beer of barley 2. AT 4.565 24
non-relevant export

17
International EAAE-SYAL Seminar – Spatial Dynamics in Agri-food Systems
Table 15: Trade streams in the meat sector to and from Slovenia, 2005 (Source: FAO 2005) IMPORT EXPORT
Two most relevant Products
Two most relevant Origins
Tons % of total
Two most relevant Products
Two most relevant Destinations
Tons % of total
1. HU 11.102 43 1. AT 4.275 54 1. Cattle
2. CZ 7.920 31 1. Cattle
2. IT 2.895 37 1. AT 17.357 74 1. HR 5.780 8
Farm-level products
2. Pigs 2. HU 2.977 13
Pigs 2. HU 1.278 18
1. AT 5.356 26 1. AT 2.288 31 1. Pig meat
2. NL 4.359 21 1. Chicken meat 2. HR 851 12
1. IT 3.123 73 1. IT 1.981 83 1. Processing-industry level 2. Chicken
meat 2. AT 602 14 2. Beef meat
2. NL 381 16 1. HU 336 8 1. BA 2.143 25 1. Meat of
Chicken Canned
2. AT 215 28 1. Sausages of Pig Meat 2. MK 2.036 24
1. IT 337 43 1. BA 1.802 22 2. Processing-industry level
2. Sausages of Pig Meat 2. AT 142 23
2. Meat of Chicken Canned
2. AT 1.625 2
Table 16: Trade streams in the fruit sector to and from Slovenia, 2005 (Source: FAO 2005) IMPORT EXPORT
Two most relevant Products
Two most relevant Origins
Tons % of total
Two most relevant Products
Two most relevant Destinations
Tons % of total
1. EC 22.894 45 1. HR 8.277 32 1. Bananas
2. CO 19.296 38 1. Apples
2. AT 7.078 27
1. IT 4.651 23 1. IT 15.243 83 Fresh Fruit
2. Oranges 2. EG 3.004 15
2. Bananas 2. HU 1.415 8
1. ES 1.891 16 1. Fruit Prp Nes
2. IT 1.745 15
1. BE 1.568 34
Processed Fruit
2. Orange juice, single strength 2. DE 1.004 22
not relevant export
Table 17: Trade streams in the vegetable sector to and from Slovenia, 2005 (Source: FAO 2005) IMPORT EXPORT
Two most relevant Products
Two most relevant Origins
Tons % of total
Two most relevant Products
Two most relevant Destinations
Tons % of total
1. IL 5.406 22 1. DE 11.787 84 1. Potatoes
2. NL 4.126 17 1. Potatoes
2. HR 858 6 1. IT 5.302 37 1. DE 241 35
Fresh Vegetables
2. Tomatoes 2. TR 4.931 35
2. Tomatoes 2. IT 141 20
1. AT 4.205 35 1. ES 1.171 68 1. Onions, dry
2. NL 3.378 28 1. Onions, dry
2. HU 206 12
1. IT 5.011 61 1. RS 432 31
Processed Vegetables
2. Vegetables preserved Nes 2. AT 619 7
2. Vegetables preserved Nes 2. DE 318 23

18
International EAAE-SYAL Seminar – Spatial Dynamics in Agri-food Systems
Table 18: Trade streams in the olive oil sector to and from Slovenia, 2005 (Source: FAO 2005) IMPORT EXPORT
Two most relevant Origins
Tons % of total Two most relevant Destinations
Tons % of total
1. IT 289 44 1. RS + ME 26 30 Olives preserved 2. GR 136 21 2. HR 24 28
1. ES 556 54 1. BA 4 33 Olive oil
2. IT 354 34 2. HR 3 25
Table 19: Trade streams in the cereal sector to and from Greece, 2005 (Source: FAO 2005) IMPORT EXPORT
Two most relevant Products
Two most relevant Origins
Tons % of total
Two most relevant Products
Two most relevant Destinations
Tons % of total
1. RU 295.861 33 1. IT 122.844 62 1. Soft wheat
2. FR 136.600 15 1. Hard wheat
2. DZ 18.241 1 1. HU 524.002 82 1.ES 211.094 50
Farm-level products
2. Maize 2. FR 31.715 0,05
2. Maize 2. CY 110.328 26
1. IT 7.112 44 1. LY 10.000 40 1. Wheat Flour
2. DE 4.464 27 1. Wheat Flour
2. BG 6.112 25 1. IT 215 42 1. MK 1.017 45
1. Processing-industry level
2. Maize Flour 2. USA 87 17
2. Maize Flour 2. RO 924 40
1. DE 21.846 45 1. IT 18.873 40 1. Beer
2. NL 14.119 29 1. Macaroni
2. AL 8.260 17 1. IT 9.442 29 1. IT 3.990 20
2. Processing-industry level
2. Pastry 2. DE 7.598 23
2. Pastry 2. UK 2.903 14
Table 20: Trade streams in the meat sector to and from Greece, 2005 (Source: FAO 2005) IMPORT EXPORT
Two most relevant Products
Two most relevant Origins
Tons % of total Two most relevant Products
Two most relevant Destinations
Tons % of total
1. HU 100.900 41 1. Cattle
2. FR 62.456 25
1. NL 71.047 84 Farm-level products
2. Pigs 2. FR 4.191 0,04
Despite the high production of goat meat in Greece, exports are not relevant due to very high local consumption.
1. NL 67.265 43 1. IT 2.571 35 1. Pork
2. FR 48.669 32 1. Chicken
2. MK 1.453 20
1. FR 56.140 72 1. FR 1.134 58
1. Processing-industry level
2. Beef meat 2. DE 7.765 1
2. Pork 2. BG 312 16
1. DE 4.839 64 1. CY 575 59 1. Sausages of pig meat 2. IT 1.075 14
1. Sausages of pig meat 2. AL 195 20
1. DE 1.888 36 1. AL 302 33
2. Processing-industry level 2. Meat of
Chicken Canned
2. IT 1.785 34
2. Meat of Chicken Canned
2. MK 257 28

19
International EAAE-SYAL Seminar – Spatial Dynamics in Agri-food Systems
Table 21: Trade streams in the fruit sector to and from Greece, 2005 (Source: FAO 2005) IMPORT EXPORT
Two most relevant Products
Two most relevant Origins
Tons % of total
Two most relevant Products
Two most relevant Destinations
Tons % of total
1. EC 40.747 49 1. DE 33.522 37 1. Bananas
2. IT 37.598 45 1. Grapes
2. UK 21.854 24 1. AR 27.351 44 1. RO 38.146 18 Fresh Fruit
2. Lemons & Limes 2. TR 25.807 41
2. Oranges 2. DE 31.521 15
1. DE 6.008 30 1. IT 12.027 98 1. Orange juice (single strength) 2. BE 4.621 23
1. Grape juice 2. TR 208 2
1. DE 7.467 93 1. UK 665 15
Processed Fruit
2. Apple juice (concentrated) 2. IT 556 7
2. Orange juice (single strength) 2. MK 590 14
Table 22: Trade streams in the vegetable sector to and from Greece, 2005 (Source: FAO 2005) IMPORT EXPORT
Two most relevant Products
Two most relevant Origins
Tons % of total Two most relevant Products
Two most relevant Destinations
Tons % of total
1. EG 49.527 43 1. DE 9.235 64 1. Potatoes
2. FR 20.949 18 1. Cucumbers and gherkins 2. AT 1.663 11
1. TR 5.267 33 1. DE 7.914 81 Fresh Vegetables
2. Tomatoes 2. MK 4.473 28
2. Asparagus 2. AT 976 10
1. BE 7.615 31 1. USA 10.611 73 1. Vegetables Frozen 2. BG 3.384 14
1. Vegetables in Vinegar 2. DE 1.201 8
1. TR 3.554 25 1. DE 4.294 36 Processed Vegetables 2. Vegetables
Preserved Nes 2. CY 2.127 15 2. Vegetables Preserved Nes 2. SE 1.012 8
Table 23: Trade streams in the olive oil sector to and from Greece, 2005 (Source: FAO 2005)
IMPORT EXPORT
Two most
relevant
Origins
Tons % of
total
Two most
relevant
Destinations
Tons % of total
1. IT 446 89 1. IT 3.683 59 Olives
2. BE 29 6
2. DE 618 10
1. EG 1.092 27 1. USA 17.277 24 Olives
(preserved) 2. DE 857 22
2. IT 13.143 18
1. IT 2.213 59 1. IT 79.012 80 Olive oil
2. ES 1.061 28
2. ES 3.999 4

20
International EAAE-SYAL Seminar – Spatial Dynamics in Agri-food Systems
Table 24: Trade streams in the cereal sector to and from Spain, 2005 (Source: FAO 2005)
IMPORT EXPORT Two most
relevant Products
Two most relevant Origins
Tons % of total
Two most relevant Products
Two most relevant Destinations
Tons % of total
1. FR 1.997.240 27 1. DZ 59.660 26 1. Wheat 2. UA 1.433.975 19 1. Wheat 2. PT 56.590 25
1. FR 2.144.470 50 1. UK 18.692 15 Farm-level products 2. Maize 2. UA 322.489 8 2. Rice milled 2. UAE 15.726 13
1. FR 90.113 92 1. LY 91.654 37 1. Maize Flour 2. PT 3.489 4
1. Wheat Flour 2. FR 43.233 18
1. FR 19.596 45 1. PT 64.279 39 1. Processing-industry level
2. Wheat Flour 2. PT 16.113 37
2. Forage products 2. FR 49.940 31
1. FR 37.273 25 1. PT 48.278 29
1. Pastry 2. IT 35.852 24 1. Pastry 2. FR 31.778 19
1. IT 13.360 64 1. FR 20.627 59 2. Processing-industry level
2. Macaroni 2. PT 3.279 16 2. Macaroni 2. PT 6.165 18
Table 25: Trade streams in the meat sector to and from Spain, 2005 (Source: FAO 2005)
IMPORT EXPORT
Two most relevant Products
Two most relevant Origins
Tons % of total
Two most relevant Products
Two most relevant Destinations
Tons % of total
1. NL 689.698 73 1. PT 1.036.350 71 1. Pigs
2. DE 129.094 14 1. Pigs
2. FR 135.749 9 1. FR 259.009 30 1. IT 59.884 46
Farm-level products
2. Cattle 2. PT 229.767 27
2. Cattle 2. FR 56.407 43
1. BR 34.920 43 1. FR 63.815 12 1. Chicken meat 2. UK 11.658 14
1. Pig meat 2. PT 55.589 19
1. FR 10.215 45 1. FR 35.206 32 1. Processing-industry level
2. Pig meat 2. DE 2.247 10
2. Cattle meat 2. PT 31.393 32
1. FR 5.565 31 1. FR 7.985 29 1. Meat of Chicken Canned
2. BR 5.174 29 1. Sausages of Pig Meat 2. PT 4.380 16
1. DE 6.043 46 1. PT 3.725 55 2. Processing-industry level
2. Sausages of Pig Meat 2. DK 1.919 15
2. Meat of Chicken Canned 2. FR 1.255 19
Table 26: Trade streams in the fruit sector to and from Spain, 2005 (Source: FAO 2005)
IMPORT EXPORT
Two most relevant Products
Two most relevant Origins
Tons % of total
Two most relevant Products
Two most relevant Destinations
Tons % of total
1. FR 73.817 33 1. DE 308.333 28 1. Apples
2. IT 37.395 17 1. Oranges
2. FR 290.419 26 1. BE 18.256 34 1. FR 26.185 29
Fresh Fruit 2. Pears
2. NL 8.644 16 2. Apples
2. PT 24.650 27 1. BE 22.247 21 1. FR 106.656 72 1. Orange
juice, single strength 2. NL 15.118 21
1. Orange juice, single strength 2. DE 22.825 15
1. NL 4.088 39 1. IT 31.623 27 Processed Fruit 2. Orange
juice, concentrated 2. FR 2.543 24
2. Grape juice 2. FR 13.440 12

21
International EAAE-SYAL Seminar – Spatial Dynamics in Agri-food Systems
Table 27: Trade streams in the vegetable sector to and from Spain, 2005 (Source: FAO 2005) IMPORT EXPORT
Two most relevant Products
Two most relevant Origins
Tons % of total
Two most relevant Products
Two most relevant Destinations
Tons % of total
1. FR 507.851 68 1. DE 198.893 22 1. Potatoes
2. UK 79.373 11 1. Tomatoes
2. UK 183.845 20 1. PT 41.287 57 1. DE 155.531 29
Fresh Vegetables
2. Tomatoes 2. MA 13.840 19
2. Lettuce and chicory 2. UK 131.074 24
1. CN 45.201 23 1. FR 51.744 27 1. Vegetables Preserved 2. PE 39.741 18
1. Vegetable Frozen 2. DE 33.599 18
1. BE 31.208 37 1. FR 40.420 30
Processed Vegetables 2. Vegetable
Frozen 2. FR 24.643 29 2. Vegetables Preserved 2. USA 38.503 29
Table 28: Trade streams in the olive oil sector to and from Spain, 2005 (Source: FAO 2005)
IMPORT EXPORT
Two most relevant Origins
Tons % of total Two most relevant Destinations
Tons % of total
1. PT 583 76 1. DE 3.386 60 Olives
2. FR 92 12 2. IT 582 10 1. IT 17.526 26 1. FR 53.712 17
Olive oil 2. MA 11.727 17 2. PT 34.599 11
Table 29: Trade streams in the cereal, meat, fruit and vegetable sector from the USA, 2005 (Source: Fritz et al. 2008)
CEREAL EXPORT MEAT EXPORT
Two most significant Products
Two most significant
Destinations Tons % of total
Two most significant Products
Two most significant
Destinations Tons % of total
1. ES 257 779 1.07 1. RO 90 193 3.87 Wheat (not durum)
2. BE 106 337 0.44 Chicken
2. LT 78 495 3.37
1. ES 152 524 3.36 1. RO 25 294 3.1 Grain Sorghum
2. FR 696 0.02 Pork
2. UK 2 872 0.35
FRUITS EXPORT VEGETABLES EXPORT
Two most significant Products
Two most significant
Destinations Tons % of total
Two most significant Products
Two most significant
Destinations Tons % of total
Apples 1. UK 34 274 5.08 1. UK 7 446 2.58
2. FI 1 968 0.29 Potatoes
2. NL 5 0
1. NL 15 399 7.02 Grapefruit
2. FR 20 266 9.24
1. DE 5 376 11.78 Plums, dried
2. IT 3 473 7.61
1. UK 1 743 7.52 Fruits, dried
2. DE 540 2.33
not relevant export

22
International EAAE-SYAL Seminar – Spatial Dynamics in Agri-food Systems
Table 30: Trade streams in the cereal, meat and fruit sector from Brazil, 2005 (Source: Fritz et al. 2008)
CEREAL EXPORT MEAT EXPORT FRUITS EXPORT Two most significant Products
Two most significant
Destinations Tons
% of total
Two most significant Products
Two most significant
Destinations
% of total
Two most significant Products
Two most significant
Destinations
% of total
1. ES 66.460 6.21 1. UK 4 1. UK 28Maize
2. PT 32.554 3.04 Cattle
2. IT 3Banana
2. IT 9
1. ES 56.950 37.21 1. NL 4 1. NL 50Wheat
2. IT 146 0.1 Chickens
2. DE 2Mango
2. USA 23
1. NL 0.3 1. BE 50Chicken meat 2. UK 0.3
Orange juice (concentrated) 2. NL 4
1. FR 1.5 1. NL 44not relevant export
Pork 2. DE 1.4
Orange juice (non-concentrated) 2. BE 31
Table 31: Trade streams in the cereal, meat, fruit, vegetable and olive oil sector from Turkey, 2005 (Source: Fritz et al. 2008)
CEREAL EXPORT MEAT EXPORT
Two most significant Products
Two most significant
Destinations Tons
% of total
Two most significant Products
Two most significant
Destinations Tons
% of total
1. IT 58 380 22.99 1. RO 3 378 65.3 Wheat
2. PT 25 750 10.14 Chickens
2. BG 568 10.98
1. CY 5 680 2.24 1. BG 1 473 28.47 Maize
2. IT 1 735 0.68 Chicken meat 2. CY 630 12.18
1. CY 6 814 2.68 OLIVE OIL EXPORT
Flour of wheat 2. DE 794 0.31
OLIVE OIL
Two most significant Destinations
Tons % of total
1. DE 9 495 3.74 1. IT 40 609 73.6 Pastry
2. BG 4 476 1.76 2. ES 20 039 36.31
1. DE 3 980 1.57 VEGETABLES EXPORT
Macaroni 2. NL 1 044 0.41
Two most significant Products
Two most significant
Destinations Tons
% of total
FRUITS EXPORT 1. RO 28 070 11.59
Two most significant Products
Two most significant
Destinations Tons
% of total
Tomatoes 2. DE 7 002 2.89
1. GR 25 503 8.64 1. DE 12 431 5.13 Lemon
2. RO 22 688 7.69
Frozen vegetables
2. BE 10 676 4.41
1. DE 5 463 1.85 1. DE 1 036 0.43 Fruit juice
2. CY 1 736 0.59 Tomato peeled 2. IE 830 0.34
![Temporal Dynamics of On-Line Information Streams Dynamics of On-Line Information Streams 3 Allan et al. [5] and Papka [30] describe some of the initial considerations that went into](https://img.pdfslide.net/doc/110x75/5adf7db27f8b9a6e5c8c313f/temporal-dynamics-of-on-line-information-dynamics-of-on-line-information-streams.jpg)