Embed Size (px)
Citation preview

MARINE ECOLOGY PROGRESS SERIESMar Ecol Prog Ser
Vol. 309: 143–157, 2006 Published March 15
INTRODUCTION
Autumnal leaf abscission has commonly been associ-ated with conservation of energy in deciduous treesthat synchronously shed their leaves in response toshortened winter photoperiods (Addicott 1982).Among deciduous trees, cold temperatures and/orlight (day-length) are the most influential cues forabscission (Addicott 1982). Although light is also a
common limiting factor for many marine ecosystems,including those dominated by the temperate to highlatitude kelps (Dean 1985, Schiel & Foster 1986), veryfew algae exhibit a deciduous life history. Canopycover of Macrocystis pyrifera can limit light availabilityto understory algae in temperate latitudes (Reed &Foster 1984, Watanabe et al. 1992), and episodicdisturbance by large storms can influence the growthand persistence of algae that would otherwise be
© Inter-Research 2006 · www.int-res.com*Email: [email protected]
Dynamics of carbon allocation in a deep-waterpopulation of the deciduous kelp Pleurophycus
gardneri (Laminariales)
Clare Margaret Dominik1,*, Richard C. Zimmerman1, 2
1The California State University, Moss Landing Marine Laboratories, 8272 Moss Landing Road, Moss Landing, California 95039, USA
2Present address: Department of Ocean, Earth and Atmospheric Sciences, 4600 Elkhorn Avenue, Old Dominion University, Norfolk, Virginia 23529, USA
ABSTRACT: Pleurophycus gardneri (Laminariales) is common in the low intertidal of the NortheastPacific, but dominates many deep (30 to 40 m) rocky reefs in central California. Seasonal dynamics ofproductivity and resource allocation of a deep-water population of this deciduous, stipitate kelp werestudied to understand how blade abscission affects the annual carbon budget. Patterns of growth,metabolism, and carbon storage and mobilization were measured monthly for 1 yr relative to in situlight and temperature, and used to model the annual carbon budget. The resulting carbon budgetwas used to determine if blade abscission effectively reduced respiratory demand during the winterperiod of low light availability. Metabolic properties (photosynthesis, photoacclimation, and respira-tion) were seasonally constant and showed evidence of photoacclimation to this deep, low-lightenvironment. Blades grew between February and July, followed by senescence and sloughing fromAugust to December. Concentrations of laminaran and mannitol increased in the blades from theonset of sloughing in August until just prior to blade abscission in mid-December, suggestingtranslocation of these carbohydrates may have occurred from the blade to the stipe and holdfast.Carbon budget estimates revealed that scalar irradiance measures overestimated the light availablefor photosynthesis of these paddle-shaped kelp blades by 50 to 75%. The calculations also revealedthat blade retention allowed for the maintenance of positive carbon balance throughout the year.Thus, conservation of the internal carbon reserve for metabolic survival during the low-light perioddoes not appear to be a viable explanation for the deciduous life history of P. gardneri. Abscissionmay reduce hydrodynamic drag, thus minimizing the probability of dislodgment of entire plantsduring winter storm events, or promote spore dispersal as abscised blades and sori drift away fromthe parent holdfast.
KEY WORDS: Carbon budget · Photosynthesis · Abscission · Light acclimation
Resale or republication not permitted without written consent of the publisher

Mar Ecol Prog Ser 309: 143–157, 2006
excluded by light limitation (Edwards 1998). However,there is no clear evidence that the newly settled algaeundergo a seasonally adjusted metabolic response tolight availability. In northern latitudes where lightlimitation is seasonally predictable, perennial kelpshave evolved a variety of physiological mechanismsthat allow them to survive through summer periods ofnutrient limitation and winter periods of light limita-tion (Gagne et al. 1982). Laminaria solidungula, forexample, uses stored carbohydrates accumulatedduring summer to complete 90% of its annual linearblade growth during the virtual darkness of the Arcticwinter (Mann 1973, Chapman & Craigie 1977, 1978,Dunton & Schell 1986). Another mechanism mayinvolve cellular photoacclimation to increased photo-synthetic efficiency in low-light environments, throughadjustments in total pigment content and/or the differ-ential production of accessory pigments (Ramus 1983).
Another potential mechanism for surviving the low-light conditions of winter is to reduce the total biomassand, thus, respiratory demand of the plant. Abscissionof reproductive tissues is common among brown algae,including Nereocystis sp., Fucus spp., and Ascophyl-lum sp., and also possibly among Alaria sp., Lessoniop-sis sp., and Pterogophora sp. (Addicott 1982). It isunclear whether blades of Laminaria sinclarii undergotrue abscission or whether the blades are removed byphysical abrasion (Markham 1972). Pleurophycusgardneri (Laminariales) is a deciduous perennial(Germann 1986) or pseudoperennial (Sears & Wilce1975) kelp, and the only one known to undergoprogrammed defoliation characterized by the synchro-nous abscission of the photosynthetic blade eachwinter. Germann (1989) suggested that abscission ofthe blade may be more advantageous than its reten-tion, because the high photosynthetic efficiency andlow respiration of the stipe and the holdfast maycompensate for loss of the greater photosyntheticsurface area of the blade, which has large respiratoryrequirements.
The distribution of Pleurophycus gardneri is com-monly reported to be from Montague Island, Alaska,to Fort Bragg, California, USA, in the low intertidalto upper subtidal (Abbott & Hollenberg 1976). Indi-viduals are common in the northern part of therange, but are thought to be comparatively rare inthe south. VanBlaricom et al. (1986), however, foundlow densities of P. gardneri (<1 individual m–2) atdepths above 15 m, and much higher densities (up to10 plants m–2) in deep water off the coast of Big Sur,California, USA. Stands with densities of 5 plants m–2
were recently observed at depths between 27 and34 m in Carmel Bay, California, USA (Spalding et al.2003). Their observations prompted our investigationinto the ability of this kelp, previously thought
restricted to intertidal regions, to flourish at 30 mdepth almost 500 km south of its originally reportedsouthern limit.
Many species of Laminariales have been rigorouslystudied to examine the relationships between lightavailability (Lüning 1979, Dunton 1985, Dunton &Schell 1986, Dunton & Jodwalis 1988), translocationand production of carbohydrates (Lüning et al. 1973,Chapman & Craigie 1978), nitrate concentrations, andgrowth (Chapman et al. 1978, Germann et al. 1987).The objective of the present study was to explore thedynamics of carbon assimilation and its utilization forgrowth by Pleurophycus gardneri in this deep-waterhabitat. Physiological rate measurements, in situgrowth studies, and chemical analysis were used toconstruct a numerical carbon budget that: (1) exploredwhether abscission was an effective mechanism forreducing whole plant respiratory demand and (2)determined the length of time that perennial tissuescould survive on storage carbohydrates alone duringthe winter.
MATERIALS AND METHODS
Study site. The East Pinnacles reef system(36°33’35’’N, 121°57’53’’W), located approximately1.5 km offshore of Stillwater Cove, Carmel Bay, Cali-fornia, USA is characterized by high-relief granite pin-nacles interspersed with large granitic boulders andsmall sand channels. Pinnacle tops above 20 m depthsupport a canopy of Macrocystis pyrifera, which isthinned annually by winter storms. The stipitate kelpsPterygophora californica, Eisenia arborea, and Pleuro-phycus gardneri were interspersed with giant kelp at20 m, but higher densities of P. gardneri were found indeeper water outside the giant kelp canopy. Fleshy redand geniculate coralline algae comprised a variablyabundant algal turf beneath the stipitate kelps. Stipi-tate kelps outside the giant kelp canopy periodicallylie flat and overlap one another when there is no surgeor current (typically during summer months), provid-ing the structure of a subsurface canopy. Nongenicu-late coralline algae, along with red and occasionallygreen encrusting algae, generally occupied theprimary substrate and were interspersed with encrust-ing invertebrates (see also Spalding et al. 2003).
Light availability. Photosynthetically active radia-tion (PAR, 400 to 700 nm) was measured using afactory-calibrated LiCor LI193SA scalar (spherical)irradiance sensor (LiCor) and a data logger moored at30 m depth at East Pinnacles throughout the study(June 2000 to May 2001). The sensor was mounted ontop of a cement block (40 cm off the bottom), andplaced on a flat rock (about 8 × 2 m) outside the kelp
144

Dominik & Zimmerman: Carbon allocation in kelp
canopy. The rock was cleared inOctober 1999 and maintained free ofall macroalgae within 1 m of the sen-sor throughout the study, to avoidshading the light sensor. In situ irra-diance was averaged over 1 min andrecorded at 15 min intervals duringdaylight hours. The irradiance sen-sor was cleaned of epiphytes, andthe data logger was retrieved everymonth. The sensor was removed forthorough cleaning, and checkedagainst another factory-calibratedscalar irradiance sensor (QSL 100,Biospherical Instruments) in the lab-oratory every 2 to 3 mo. Tempera-ture was also recorded every 15 minusing a factory-calibrated tempera-ture logger (Stowaway logger; OnsetComputer) that was checked against an alcohol ther-mometer in a constant temperature water bath(±0.5°C) each month. Brief interruptions of irradiance(June 2000) and temperature (July 2000) measure-ments resulted from equipment malfunction.
Growth phenology. A total of 9 to 10 adult (stipelength >40 cm) sporophytes were selected and taggedwithin a 20 m radius of the light meter each month, forgrowth measurements and subsequent analyses. Onlyintact individuals, mostly free of grazing marks andepiphytes, were selected, to reduce the variability inbiomass measurements resulting from processes otherthan photosynthetic carbon assimilation and utiliza-tion. Grazing was rare during the growing season, butcommon after sloughing began in late July. Plants withminor peripheral grazing marks were used (grazingwas not quantified) during the late summer and fallbecause of a lack of available non-grazed plants. Bladegrowth during spring (February to May 2001) occurredwithout sloughing, as indicated by the persistence ofthe abscission scar from the previous year. To calculategrowth during months without sloughing, the averagetotal blade area (cm2 collection interval–1) each monthwas subtracted from the total blade area of the previ-ous month (e.g. growth rate for March = average bladearea March – average blade area for February), anddivided by the time interval (1 mo, in this case). FromJune 2000 to November 2000, when sloughing was evi-dent (Fig. 1), growth rates (cm2 collection interval–1) ofblades lacking an abscission scar were measured usingthe hole punch method to quantify new growth and theloss from sloughing (Parke 1948). A 5 mm diameterhole was punched through the midrib of each plant10 cm above the base of the blade using a cork borer.Plants were collected approximately 4 wk after mark-ing, placed in black plastic bags, brought to the
surface, and stored in coolers during transport to thelaboratory to prevent light or temperature shock. Col-lected plants were maintained in aquaria with runningseawater at in situ temperatures for ≤24 h before initi-ating physiological measurements. Continuous shad-ing (about 50 to 75% reduction of ambient, similar to insitu values) was provided to prevent photodamage. Allmeasurements were completed within 5 d of collection.The wing (W), midrib (M), stipe (S), and holdfast (H) ofeach collected plant was weighed (fresh weight, FW).Subsamples of each tissue type were dried for 3 d at60°C and used to develop FW to dry weight (DW) con-version factors. Sorus persistence and condition werenoted qualitatively.
Absolute growth rate was calculated according to:
Growth (cm2 collection interval–1) = (D2 – D1) × (W2) (1)
where D1 was the initial distance from the hole punchto the base of the blade and W1 was the initial bladewidth; D2 and W2 were similar measurements per-formed at the end of the collection period. Sloughingwas calculated similarly according to:
Sloughing (cm2 collection interval–1) = (L1 – L2) × (W2) (2)
where L1 was the length of the blade from the distalend to the initial hole punch mark at Time 1, and L2
was the length of the blade from the distal end to thehole punch at Time 2. Although the actual shape of theblade resembles a truncated ellipse, frills on the edgesof the wing add area to the blade, but are difficult tomeasure precisely. Consequently, blade area was cal-culated assuming a rectangular shape to incorporatethe wing frills.
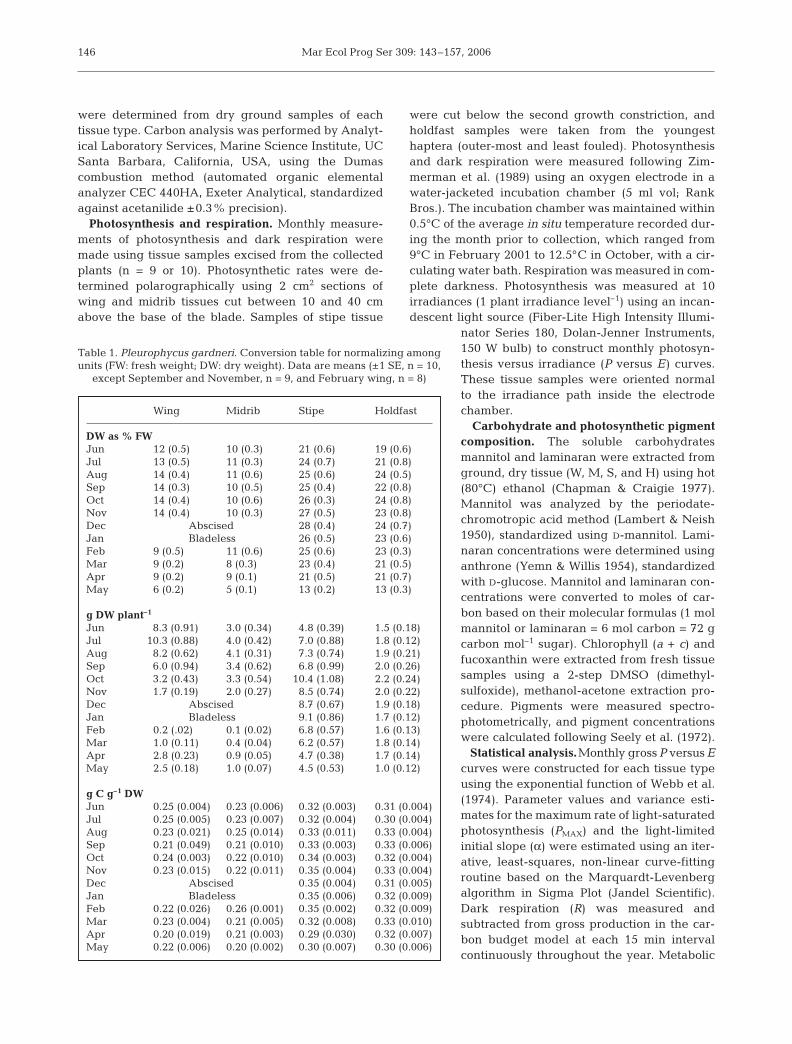
DW was calculated from conversion factors derivedfrom tissue samples weighed before and after drying(Table 1). Conversion factors for DW/carbon content
145
Fig. 1. Growth phenology of Pleurophycus gardneri
Jan Feb Mar Apr Jun Jul Aug Sep Oct Nov Dec
Abscissionscar
Abscissionscar lost from
sloughing
Abscission
Mar Ecol Prog Ser 309: 143–157, 2006
were determined from dry ground samples of eachtissue type. Carbon analysis was performed by Analyt-ical Laboratory Services, Marine Science Institute, UCSanta Barbara, California, USA, using the Dumascombustion method (automated organic elementalanalyzer CEC 440HA, Exeter Analytical, standardizedagainst acetanilide ±0.3% precision).
Photosynthesis and respiration. Monthly measure-ments of photosynthesis and dark respiration weremade using tissue samples excised from the collectedplants (n = 9 or 10). Photosynthetic rates were de-termined polarographically using 2 cm2 sections ofwing and midrib tissues cut between 10 and 40 cmabove the base of the blade. Samples of stipe tissue
were cut below the second growth constriction, andholdfast samples were taken from the youngesthaptera (outer-most and least fouled). Photosynthesisand dark respiration were measured following Zim-merman et al. (1989) using an oxygen electrode in awater-jacketed incubation chamber (5 ml vol; RankBros.). The incubation chamber was maintained within0.5°C of the average in situ temperature recorded dur-ing the month prior to collection, which ranged from9°C in February 2001 to 12.5°C in October, with a cir-culating water bath. Respiration was measured in com-plete darkness. Photosynthesis was measured at 10irradiances (1 plant irradiance level–1) using an incan-descent light source (Fiber-Lite High Intensity Illumi-
nator Series 180, Dolan-Jenner Instruments,150 W bulb) to construct monthly photosyn-thesis versus irradiance (P versus E) curves.These tissue samples were oriented normalto the irradiance path inside the electrodechamber.
Carbohydrate and photosynthetic pigmentcomposition. The soluble carbohydratesmannitol and laminaran were extracted fromground, dry tissue (W, M, S, and H) using hot(80°C) ethanol (Chapman & Craigie 1977).Mannitol was analyzed by the periodate-chromotropic acid method (Lambert & Neish1950), standardized using D-mannitol. Lami-naran concentrations were determined usinganthrone (Yemn & Willis 1954), standardizedwith D-glucose. Mannitol and laminaran con-centrations were converted to moles of car-bon based on their molecular formulas (1 molmannitol or laminaran = 6 mol carbon = 72 gcarbon mol–1 sugar). Chlorophyll (a + c) andfucoxanthin were extracted from fresh tissuesamples using a 2-step DMSO (dimethyl-sulfoxide), methanol-acetone extraction pro-cedure. Pigments were measured spectro-photometrically, and pigment concentrationswere calculated following Seely et al. (1972).
Statistical analysis.Monthly gross P versus Ecurves were constructed for each tissue typeusing the exponential function of Webb et al.(1974). Parameter values and variance esti-mates for the maximum rate of light-saturatedphotosynthesis (PMAX) and the light-limitedinitial slope (α) were estimated using an iter-ative, least-squares, non-linear curve-fittingroutine based on the Marquardt-Levenbergalgorithm in Sigma Plot (Jandel Scientific).Dark respiration (R) was measured andsubtracted from gross production in the car-bon budget model at each 15 min intervalcontinuously throughout the year. Metabolic
146
Table 1. Pleurophycus gardneri. Conversion table for normalizing amongunits (FW: fresh weight; DW: dry weight). Data are means (±1 SE, n = 10,
except September and November, n = 9, and February wing, n = 8)
Wing Midrib Stipe Holdfast
DW as % FWJun 12 (0.5) 10 (0.3) 21 (0.6) 19 (0.6)Jul 13 (0.5) 11 (0.3) 24 (0.7) 21 (0.8)Aug 14 (0.4) 11 (0.6) 25 (0.6) 24 (0.5)Sep 14 (0.3) 10 (0.5) 25 (0.4) 22 (0.8)Oct 14 (0.4) 10 (0.6) 26 (0.3) 24 (0.8)Nov 14 (0.4) 10 (0.3) 27 (0.5) 23 (0.8)Dec Abscised 28 (0.4) 24 (0.7)Jan Bladeless 26 (0.5) 23 (0.6)Feb 9 (0.5) 11 (0.6) 25 (0.6) 23 (0.3)Mar 9 (0.2) 8 (0.3) 23 (0.4) 21 (0.5)Apr 9 (0.2) 9 (0.1) 21 (0.5) 21 (0.7)May 6 (0.2) 5 (0.1) 13 (0.2) 13 (0.3)
g DW plant–1
Jun 8.3 (0.91) 3.0 (0.34) 4.8 (0.39) 1.5 (0.18)Jul 10.3 (0.88) 4.0 (0.42) 7.0 (0.88) 1.8 (0.12)Aug 8.2 (0.62) 4.1 (0.31) 7.3 (0.74) 1.9 (0.21)Sep 6.0 (0.94) 3.4 (0.62) 6.8 (0.99) 2.0 (0.26)Oct 3.2 (0.43) 3.3 (0.54) 10.4 (1.08) 2.2 (0.24)Nov 1.7 (0.19) 2.0 (0.27) 8.5 (0.74) 2.0 (0.22)Dec Abscised 8.7 (0.67) 1.9 (0.18)Jan Bladeless 9.1 (0.86) 1.7 (0.12)Feb 0.2 (.02) 0.1 (0.02) 6.8 (0.57) 1.6 (0.13)Mar 1.0 (0.11) 0.4 (0.04) 6.2 (0.57) 1.8 (0.14)Apr 2.8 (0.23) 0.9 (0.05) 4.7 (0.38) 1.7 (0.14)May 2.5 (0.18) 1.0 (0.07) 4.5 (0.53) 1.0 (0.12)
g C g–1 DWJun 0.25 (0.004) 0.23 (0.006) 0.32 (0.003) 0.31 (0.004)Jul 0.25 (0.005) 0.23 (0.007) 0.32 (0.004) 0.30 (0.004)Aug 0.23 (0.021) 0.25 (0.014) 0.33 (0.011) 0.33 (0.004)Sep 0.21 (0.049) 0.21 (0.010) 0.33 (0.003) 0.33 (0.006)Oct 0.24 (0.003) 0.22 (0.010) 0.34 (0.003) 0.32 (0.004)Nov 0.23 (0.015) 0.22 (0.011) 0.35 (0.004) 0.33 (0.004)Dec Abscised 0.35 (0.004) 0.31 (0.005)Jan Bladeless 0.35 (0.006) 0.32 (0.009)Feb 0.22 (0.026) 0.26 (0.001) 0.35 (0.002) 0.32 (0.009)Mar 0.23 (0.004) 0.21 (0.005) 0.32 (0.008) 0.33 (0.010)Apr 0.20 (0.019) 0.21 (0.003) 0.29 (0.030) 0.32 (0.007)May 0.22 (0.006) 0.20 (0.002) 0.30 (0.007) 0.30 (0.006)

Dominik & Zimmerman: Carbon allocation in kelp
measurements were converted from oxygen-based tocarbon-based units using photosynthetic and respira-tory quotients of 1.2 and 1.0 mol O2 mol–1 CO2, respec-tively. The analysis produced an aggregate estimate ofPMAX and α for each tissue each month because only asimple monthly P versus E curve was constructed from10 independent samples measured at 10 different irra-diances each month. The estimated variances associ-ated with the monthly, aggregate estimate of PMAX andα were calculated according to Zimmerman et al.(1987) and used to identify significant temporal varia-tion in monthly values of PMAX and α using multiplet-tests with probabilities adjusted using the Bonferroniprocedure.
Respiration, growth, sloughing, and chemical com-position measurements were analyzed for temporaldifferences using 1-way ANOVA (p ≤ 0.05) and LSD(least significant difference) planned multiple compar-ison tests (Sokal & Rohlf 1969). For most months n = 10,except for September and November, when n = 9, andFebruary, when n = 4 to 6, depending on the amount oftissue present for analysis. Some of the data requiredtransformation to meet the equal variance assumptionof ANOVA. Square-root transformations were appliedto the growth, sloughing, stipe chlorophyll, and hold-fast pigment data. Log-transformations were applied tothe mannitol, laminaran, and stipe fucoxanthin data.Data for plant size, wing pigment content, and midribchlorophyll content met all assumptions of ANOVAwithout transformation. Post-hoc differences were in-dicated on all graphs by different heights of horizontallines running through the data on each relevant figure.Monthly means that were significantly different fromsome, but not all, other months have a verticallysloping line running across them.
Carbon budget. Carbon budgets were calculatedusing rates of light-dependent photosynthesis, darkrespiration, and sloughing. Photosynthetic productionwas calculated for each tissue type (Pgross (W,M,S,H)) fromin situ irradiance recorded at 15 min intervals accord-ing to the exponential function in Webb et al. (1974):
(3)
Irradiance was assumed to be constant during each15 min interval. During non-winter phases of growth(all plant parts present), the carbon budget was calcu-lated as:
PNET(W,M,S,H) = Pgross(W,M,S,H) – Sloughing(W,M) – R(W,M,S,H) (4)
where R is dark respiration. The model was initiatedusing plant size estimated for May 2000, by subtract-ing growth and adding sloughing from plant sizemeasured in June 2000. The predictive ability of theback-calculation was assessed by performing it for all
P Pgross(W,M,S,H) MAX(W,M,S,H)
(W,M,S,H)
= −−
1 e
α EE
P MAX(W,M,S,H)
⎛
⎝⎜⎜
⎞
⎠⎟⎟
147
2000 2001J A OJ S N J MD F A M
0
1
2
3
4
8
9
10
11
12
13
14 a
b
Mea
n d
aily
tem
per
atur
e (°
C)
Dai
ly ir
rad
ianc
e(m
ol q
uant
a m
–2 d
–1)
J A O J M MJ S N D F A
g C
pla
nt–1
mon
th–1
0.0
0.5
1.0
1.5
2.0Blade SloughingBlade Growth
2000 2001
Fig. 2. Time series of (a) daily mean temperature and (b) totaldaily irradiance at the study site in Carmel Bay (depth = 30 m)
Fig. 3. Pleurophycus gardneri. Blade growth and sloughing(mean ± 1 SE). Horizontal lines running through the data atthe same height indicate statistically identical values amongmonthly means determined by least significant differencepost hoc analysis (dashed for growth and solid for sloughing)

Mar Ecol Prog Ser 309: 143–157, 2006
subsequent months, and regressing calculated plantsize against measured plant size. Net photosyntheticproduction (PNET) was added to the initial value (minuslosses from sloughing and respiration) to predictchange in plant size at each 15 min interval:
NewPlantSize = OldPlantSize + (PNET × Time) (5)
Plant size increased when PNET was positive (i.e.when production exceeded losses). All parameterswere converted to grams of carbon per plant per15 min using the conversion factors provided inTable 1. Plant size decreased when PNET was nega-tive. To estimate plant size, carbon budgets wereintegrated over the collection interval ranging from 3to 5 wk. The carbon budget calculations were vali-dated by linear regression of predicted plant sizeagainst measured plant size. Average daily PNET wasalso modeled assuming no blade sloughing or abscis-sion to test the potential impact of blade retention (noabscission) during winter on the whole-plant carbonbalance. Within a given month, average daily PNET
with abscission versus average daily PNET with noabscission was analyzed for significant differencesusing a 1-sample t-test.
RESULTS
Daily average temperatures at East Pinnacles (30 mdepth) were highest from August to February, rangingfrom almost 9.5 to 14°C. Temperatures were lowestfrom March to July, ranging from 8.5 to 12.5°C. Irradi-ances at 30 m were highly variable, ranging fromalmost 0 to almost 4 mol quanta m–2 d–1 in the summerwhen phytoplankton blooms and/or persistent coastalstratus are common to this region of central California.Average winter irradiances ranged from almost 0 toabout 1 mol quanta m–2 d–1 (Fig. 2).
Growth phenology
Pleurophycus gardneri blades grew for approxi-mately 5 mo from February to July (Fig. 3). Growth washighest in spring and slowed dramatically betweenJune and July. Sloughing began in August and Sep-tember, as indicated by the loss of the abscission scarfrom the distal end of the blade (Fig. 1). Sloughing con-tinued without growth until only the proximal onethird of the blade remained in November. MostP. gardneri produced a single variably sized (20 to75 cm2) sorus patch on the midrib of each bladebetween April and June. Sori persisted until Septem-ber, when the patches were sloughed along with vege-tative blade tissue. Secondary sori developed proximal
148
Table 2. Pleurophycus gardneri. ANOVA results for differencesin parameters by tissue type among months. Significancerepresented by *<0.05, **<0.01, ***<0.001, ns: not significant
Treatment df MS F p Signif.
RespirationWing 9 0.00706 1.94 0.0619 nsError 62 0.00363Midrib 9 0.00019 1.05 0.4112 nsError 60 0.00018Stipe 11 0.00010 3.29 <0.001 ***Error 98 0.00003Holdfast 11 0.00033 0.94 0.5100 nsError 81 0.00036
Carbon contentWing 9 7.0130 32.248 <0.001 ***Error 82 0.2170Midrib 9 1.0990 24.097 <0.001 ***Error 82 0.0460Stipe 11 5.1100 8.65 <0.001 ***Error 106 0.5910Holdfast 11 0.1200 4.294 <0.001 ***Error 106 0.0280
GrowthBlade 9 3.32800 233.527 <0.001 ***Error 89 0.01400
SloughingBlade 5 1.231 23.597 <0.001 ***Error 53 0.052
ChlWing 9 0.17200 20.93 <0.001 ***Error 84 0.00800Midrib 9 0.01200 7.10 <0.001 ***Error 84 0.00200Stipe 11 0.01800 8.24 <0.001 ***Error 106 0.00200Holdfast 11 0.00800 2.44 0.0089 **Error 106 0.00300
FucoxanthinWing 9 0.02500 10.46 <0.001 ***Error 84 0.00200Midrib 9 0.00600 7.22 <0.001 ***Error 84 0.00100Stipe 11 0.17600 2.49 0.0091 **Error 106 0.07100Holdfast 11 0.00500 3.52 <0.001 ***Error 106 0.00100
MannitolTotal plant 11 6.414 18.988 <0.001 ***Error 106 0.338
LaminaranTotal plant 11 4.038 15.844 <0.001 ***Error 106 0.255
Dominik & Zimmerman: Carbon allocation in kelp 149
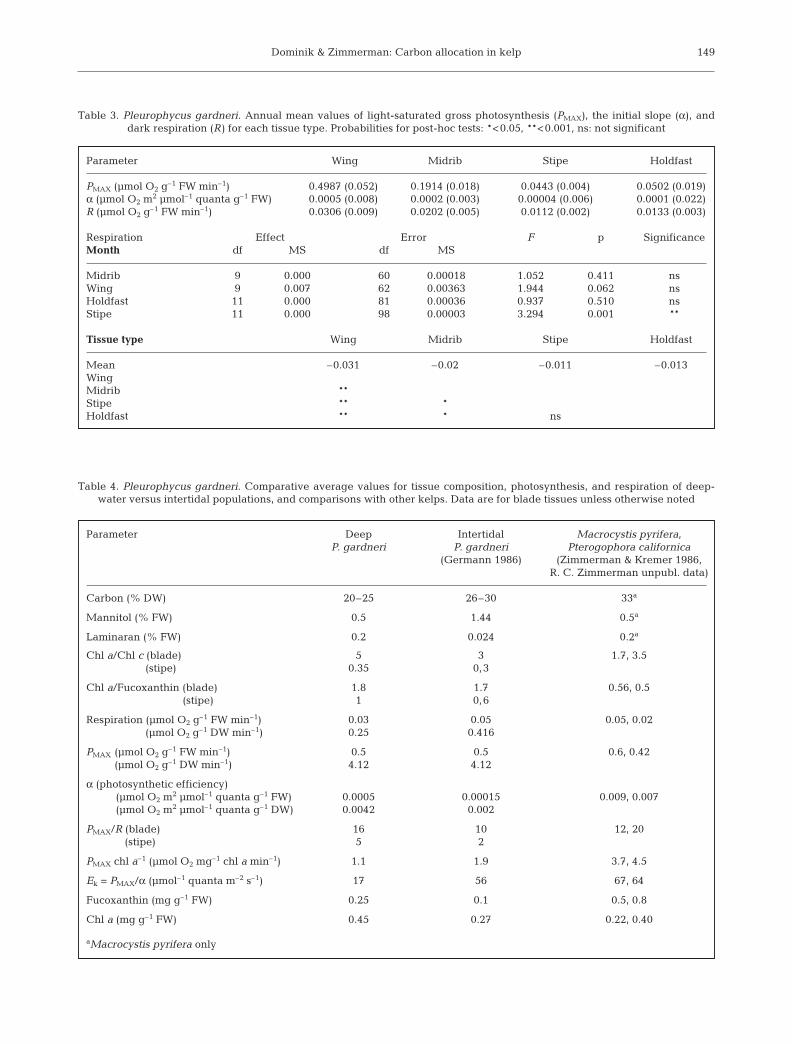
Table 3. Pleurophycus gardneri. Annual mean values of light-saturated gross photosynthesis (PMAX), the initial slope (α), and dark respiration (R) for each tissue type. Probabilities for post-hoc tests: *<0.05, **<0.001, ns: not significant
Parameter Wing Midrib Stipe Holdfast
PMAX (µmol O2 g–1 FW min–1) 0.4987 (0.052) 0.1914 (0.018) 0.0443 (0.004) 0.0502 (0.019)α (µmol O2 m2 µmol–1 quanta g–1 FW) 0.0005 (0.008) 0.0002 (0.003) 0.00004 (0.006) 0.0001 (0.022)R (µmol O2 g–1 FW min–1) 0.0306 (0.009) 0.0202 (0.005) 0.0112 (0.002) 0.0133 (0.003)
Respiration Effect Error F p SignificanceMonth df MS df MS
Midrib 9 0.000 60 0.00018 1.052 0.411 nsWing 9 0.007 62 0.00363 1.944 0.062 nsHoldfast 11 0.000 81 0.00036 0.937 0.510 nsStipe 11 0.000 98 0.00003 3.294 0.001 **
Tissue type Wing Midrib Stipe Holdfast
Mean –0.031 –0.02 –0.011 –0.013WingMidrib **Stipe ** *Holdfast ** * ns
Table 4. Pleurophycus gardneri. Comparative average values for tissue composition, photosynthesis, and respiration of deep-water versus intertidal populations, and comparisons with other kelps. Data are for blade tissues unless otherwise noted
Parameter Deep Intertidal Macrocystis pyrifera, P. gardneri P. gardneri Pterogophora californica
(Germann 1986) (Zimmerman & Kremer 1986, R. C. Zimmerman unpubl. data)
Carbon (% DW) 20–25 26–30 33a
Mannitol (% FW) 0.5 1.44 0.5a
Laminaran (% FW) 0.2 0.024 0.2a
Chl a/Chl c (blade) 5 3 1.7, 3.5(stipe) 0.35 0,3
Chl a/Fucoxanthin (blade) 1.8 1.7 0.56, 0.5 (stipe) 1 0,6
Respiration (µmol O2 g–1 FW min–1) 0.03 0.05 0.05, 0.02 (µmol O2 g–1 DW min–1) 0.25 0.416
PMAX (µmol O2 g–1 FW min–1) 0.5 0.5 0.6, 0.42 (µmol O2 g–1 DW min–1) 4.12 4.12
α (photosynthetic efficiency) (µmol O2 m2 µmol–1 quanta g–1 FW) 0.0005 0.00015 0.009, 0.007(µmol O2 m2 µmol–1 quanta g–1 DW) 0.0042 0.002
PMAX/R (blade) 16 10 12, 20(stipe) 5 2
PMAX chl a–1 (µmol O2 mg–1 chl a min–1) 1.1 1.9 3.7, 4.5
Ek = PMAX/α (µmol–1 quanta m–2 s–1) 17 56 67, 64
Fucoxanthin (mg g–1 FW) 0.25 0.1 0.5, 0.8
Chl a (mg g–1 FW) 0.45 0.27 0.22, 0.40
aMacrocystis pyrifera only

Mar Ecol Prog Ser 309: 143–157, 2006
to the spring patches on about half of the plants(authors’ pers. obs.) prior to abscission in mid-November. Prior to abscission, the upper portion of thestipe (between the meristem and where the stipenarrowed) began to darken. Abscission was completedby mid-December, and the bladeless period lasteduntil the beginning of February (Figs. 1 & 3).
Photosynthesis and respiration
The photosynthetic parameters PMAX and α were tem-porally constant throughout the study in all tissues, asno significant difference was detected by multiple t-tests using the Bonferroni correction. Respiration (R)was also constant over time in all tissues, except thestipe, where it was slightly, but significantly, lowerduring winter (Table 2). Metabolic rates (PMAX and R)and photosynthetic efficiency (α) were highest in wingtissue, followed by midrib, and then stipe and holdfast(Table 3). The average PMAX/R value for the wing tissueof the deep plants was 15; it was 9 for intertidal plantsstudied by Germann (1986); both fall in the range ofother kelps (Table 4). Generalized P versus E curves forwing tissue of the deep-water population examinedhere revealed a biomass-specific value of PMAX that wassimilar to the value reported by Germann (1986) for
intertidal plants (Table 4). Biomass-specific photosyn-thetic efficiency (α) was 2 to 3 times greater in the deepplants regardless of how the data were normalized (FW,DW) (Table 4). When normalized to chlorophyll, α wassimilar in the deep and intertidal populations. Chloro-phyll-normalized PMAX, in contrast, was lower in thedeep-water population. This pattern appears to rep-resent a classic photoacclimation response commonamong shade-adapted algae.
Chemical composition
Carbohydrate concentrations (mg C plant–1) de-creased while plants were growing, increased duringsloughing, and continually decreased after abscissionthrough blade initiation and growth in spring (Fig. 4).Mannitol represented up to 8% of the total DW andaveraged 5% DW. Laminaran accounted for only 1 to2% of DW. Summer and fall concentrations of lami-
150
2000 2001J J A S O N D J F M A M
Sol
uble
car
boh
ydra
tes
(mg
C p
lant
–1)
0
100
200
300
400
500
600
Mannitol
Laminaran
Fuco
xant
hin
(mg
g–1 F
W)
0.05
0.10
0.15
0.20
0.25
0.30
0.35
0.40
J J A S O D F AN J M M
Chl
orop
hyll
a +
c (m
g g–1
FW
)
0.1
0.2
0.3
0.4
0.5
0.6
0.7
0.8
Wing
Midrib
2000 2001
Wing
Midrib
a
b
Fig. 5. Pleurophycus gardneri. (a) Fucoxanthin and (b) chloro-phyll (a + c) concentrations for midrib and wing (mean± 1 SE). Horizontal lines running through the data at the sameheight indicate statistically identical values among monthlymeans determined by least significant difference post-hoc
analysis (dashed for midrib and solid for wing)
Fig. 4. Pleurophycus gardneri. Mannitol- and laminaran-soluble carbohydrate concentrations of entire plants (mean ±1 SE). Horizontal lines running through the data at the sameheight indicate statistically identical values among monthlymeans determined by least significant difference post-hoc
analysis (dashed for mannitol and solid for laminaran)

Dominik & Zimmerman: Carbon allocation in kelp
naran and mannitol were significantly greater thanthose in winter and spring (Table 2).
Wing tissues always had the highest pigment con-centrations, followed by the midrib, stipe, and holdfast.Concentrations of fucoxanthin and chlorophyll (a + c)in wing and midrib tissues increased throughout thespring, peaked in late summer, and decreased signifi-cantly by late fall (Fig. 5, Table 2). Chlorophyll (a + c)concentrations in the stipe began increasing in winterand were greatest in spring, while concentrations inthe holdfast were greatest in winter and dropped in thespring (Fig. 6, Table 2). Fucoxanthin concentrations inthe stipe and holdfast were significantly greater insome late summer and spring months than in somefall and winter months (Fig. 6, Table 2). However, posthoc results were ambiguous, and only the holdfastfucoxanthin concentrations in October were clearlydifferent from all the others (Fig. 6). The average ratioof chl a/chl c for the wing tissue was 5, and thechl a/fucoxanthin ratio was 1.8 (Table 4). The mass ofthe wing and midrib was significantly lower in spring(during blade initiation) than in the previous summer(Fig. 7a, Table 2). Carbon content of the stipe in-
creased during sloughing as day-length decreased andgrowth ceased, while carbon content of the holdfastremained relatively constant (Fig. 7b).
Carbon budget
The carbon budget calculations required an initialvalue for plant size. Although field studies began inMay 2000, plant size was not measured until June2000. In order to begin the carbon budget calculationswith the initiation of the light data, it was necessary toback-calculate plant size for May from the initial mor-phometric data collected in June by inverting Eq. (5) tosolve for old plant size. When this calculation was per-formed for each month, it was found that measuredplant size was a strong predictor of plant size the pre-vious month (Previous Size = 0.92 × New Size + 0.26,r2 = 0.87, regression ANOVA = 61.75, df = 1,11, p <0.0001). This relationship was used to estimate initialplant size in May 2000 for seeding the model.
When using the scalar irradiances measured in situ,the model overestimated plant size, and therefore
151
J J A S O N D J F M A M
Chl
orop
hyll
a +
c (m
g g–1
FW
)Fu
coxa
nthi
n (m
g g–1
FW
)
0.02
0.04
0.06
0.08
0.10
0.12
0.14
0.16
2000 2001
0.01
0.02
0.03
0.04
0.05
0.06
StipeHoldfast
StipeHoldfast
a
b
0
1
2
3
4
J J A S O N D J F M A M
Tiss
ue c
arb
on (g
pla
nt–1
)Ti
ssue
car
bon
(g p
lant
–1)
0
1
2
3
4
2000 2001
Wing
Midrib
StipeHoldfast
a
b
Fig. 6. Pleurophycus gardneri. (a) Fucoxanthin and (b) chloro-phyll (a + c) concentrations for stipe and holdfast (mean± 1 SE). Horizontal lines running through the data at the sameheight indicate statistically identical values among monthlymeans determined by least significant difference post-hoc
analysis (dashed for stipe and solid for holdfast)
Fig. 7. Pleurophycus gardneri. Total carbon content of (a)wing and midrib and (b) stipe and holdfast (mean ± 1 SE).Horizontal lines running through the data at the same heightindicate statistically identical values among monthly meansdetermined by least significant difference post-hoc analysis(solid for wing and stipe and dashed for midrib and holdfast)

Mar Ecol Prog Ser 309: 143–157, 2006
growth during summer, spring, and fall, and under-estimated plant size during winter. Consequently, theseasonal pattern in modeled plant size was exagger-ated relative to measured plant size (Fig. 8a). The slopeof modeled versus measured plant size at 100% irradi-ance, however, was not significantly different from 1.0(Fig. 8b, Table 5).
The discrepancy between modeled and measuredplant size could be explained by differences in irradi-ance measured by the scalar PAR sensor and theirradiance actually harvested by the kelp blades. Thescalar irradiance sensor is designed to collect PAR fromall directions. Light absorption by a planar blade, likethat of Pleurophycus gardneri, exhibits a cosineresponse to the incident light field, and is spectrallybiased against green light. According to the CosineLaw, downwelling irradiance experienced by theplanar blade is proportional to the cosine of the anglebetween the leaf normal and the incident beam (Kirk1994, Zimmerman 2003). Water motion alters the ori-entation of the blade surface relative to the submarinelight field. Further, variations in stipe length, bladedensity, and blade overlap (self-shading), as well asspectral biases in the efficiency of PAR absorption,combine to make the photosynthetically utilized radia-tion considerably less than that measured by thebroadband scalar irradiance sensor.
Model sensitivity to light collection efficiency wastested by reducing irradiance to 75, 50, 25, 15, and10% of ambient. Model predictions of plant sizethrough time using both 50 (Fig. 8) and 25% (Fig. 8)of the measured irradiance resulted in the highestagreement with measured plant size. The intercepts ofmodeled versus measured plant size were statisticallyequivalent to 0 using 50 and 25% irradiance, andthe seasonal pattern in modeled plant size was moreconsistent with measured plant size (Fig. 8, Table 5).Based on r2 values, 25% irradiance provided a margin-ally better fit of the model (Fig.9), accounting for 76%of the variation, while 50% irradiance explained 73%of the variation. Secondary regression analysis deter-mined that the regression of modeled versus measuredplant size for both 50 and 25% irradiance producedslopes that were statistically identical to 1 (Table 5).The annual PNET was 5.14 g C plant–1 for 50% of mea-sured irradiance and 0.16 g C plant–1 for 25% ofmeasured irradiance. Values of PNET for 15 and 10%irradiance were lower, and r2 values dropped to 0.74at 15% and 0.70 at 10%.
The 50 and 25% irradiance values (most accuratepredictors of plant size) were used to evaluate theeffect of blade retention on average daily whole-plantPNET (g C plant–1) throughout the fall and winter. Tosimulate the effects of blade retention, the calculationswere initialized with plant size from May 2000, but no
sloughing or abscission was allowed. Respiration andgrowth were the only possible fates for the photosyn-thetically fixed carbon driven by the irradiance timeseries. At 25% irradiance, hypothetical retention of theblade yielded higher mean PNET in late summer andspring, and lower PNET in winter, than the run allowingabscission (Fig. 10a). Without abscission, mean dailyPNET was positive in the spring and summer (Marchthrough August), but negative in the fall and winter(September through February). With abscission, meandaily PNET was only positive in the early summer, andwas negative from August to May. The blade retentionscenario simulated using 50% of the measured irradi-ance yielded consistently positive values of PNET thatwere significantly higher than the simulation allowingabscission for all months except May 2001 (Fig. 10b).Annual PNET for 25% irradiance with no abscission was1.22 g C plant–1, and annual PNET for 50% with no
152
Fig. 8. Pleurophycus gardneri. (a) Modeled plant size at100, 50, and 25% irradiance. (b) Measured plant size versus
modeled plant size at 100, 50, and 25% irradiance
100% irradiance50% irradiance25% irradiance
0 1 2 3 4 5 6 7
Measured plant size (g C plant–1)
a
b
J J A S O N D J F M A M
12
10
8
6
4
2
0
12
10
8
6
4
2
0
Mod
eled
pla
nt s
ize
(g C
pla
nt–1
)M
odel
ed p
lant
siz
e (g
C p
lant
–1)

Dominik & Zimmerman: Carbon allocation in kelp
abscission was 11.74 g C plant–1. Annual PNET at 25%irradiance with abscission of the blade was –0.159 g Cplant–1, and at 50% irradiance with abscission, 5.14 gC plant–1.
Stipe and holdfast survival for the bladeless periodwas calculated by converting the carbon content of thesoluble carbohydrate reserves into respiratory equiva-lents, assuming no photosynthetic production in theperennial tissues. The carbohydrate content of thestipe and holdfast in November would support thewinter-time respiration rate of the stipe and holdfastfor 2.8 mo. Photosynthesis production by the stipe andholdfast could only support 20 to 30% of the respira-tory load over the winter.
DISCUSSION
Pleurophycus gardneri is unique among theLaminariales in having a life history characterized byannually deciduous blades. Whether abscission isregulated by a response to temperature (Germann1986) or photoperiod (Lüning & Kadel 1993), the loss ofblade tissue was thought to provide an adaptationfor persistence during the winter period of low lightavailability. The carbon budgets calculated here,however, demonstrate that abscission does not providean effective metabolic strategy for this deep-waterpopulation, because blade retention permitted higherrates of daily PNET throughout the year, including thewinter. Thus, abscission may be related to other factors
153
Table 5. Pleurophycus gardneri. Regression analysis for modeled versus measured plant size for all irradiance correction factors and back-calculations
Irradiance correction (df, n) r2 Slope (±SE) Slope regression Slope p Intercept (±SE) Intercept pfactor (%) ANOVA F
100 (1, 11) 0.67 2.07 (±0.48) 18.41 0.0020 –3.06 (±2.00) 0.16575 (1, 11) 0.70 1.91 (±0.42) 20.75 0.0014 –2.93 (±1.76) 0.13150 (1, 11) 0.73 1.70 (±0.34) 24.80 0.0008 –2.72 (±1.42) 0.08925 (1, 11) 0.76 1.36 (±0.25) 29.23 0.0004 –2.36 (±1.05) 0.05215 (1, 11) 0.74 1.18 (±0.23) 25.87 0.0007 –2.18 (±0.97) 0.05210 (1, 11) 0.70 1.08 (±0.24) 20.68 0.0014 –2.08 (±0.99) 0.066Back-calculated (1, 11) 0.87 0.917 (±0.12)0 61.75 0.000026 0.25 (±0.53) 0.641
Summary of standard regression Ho: slope = 1, intercept = 0
Irradiance correction (df, n) Slope 95% CI p Different factor (%) (±SE) from 1
100 (1, 11) 2.070 1.09 >0.05 No75 (1, 11) 1.910 0.95 >0.05 No50 (1, 11) 1.700 0.77 >0.05 No25 (1, 11) 1.360 0.57 >0.05 No15 (1, 11) 1.180 0.52 >0.05 No10 (1, 11) 1.080 0.54 >0.05 NoBack-calculated (1, 11) 0.917 0.27 >0.05 No
% Measured irradiance
Slo
pe
of r
egre
ssio
n(re
lativ
e p
lant
siz
e)
0
1
2
3
Inte
rcep
t of
reg
ress
ion
(g C
pla
nt–1
)
–5
–4
–3
–2
–1
0
10075502515100
r2 of
reg
ress
ion
0.68
0.72
0.76
a
b
c
Fig. 9. Pleurophycus gardneri. Regression parameters formodeled versus measured plant size plotted as a function ofthe percentage of measured irradiance: (a) regression slopes(±SE), (b) regression intercepts (±SE), and (c) r2 of regression

Mar Ecol Prog Ser 309: 143–157, 2006
including spore dispersal (Addicott 1982) and/or in-creased survival of intense winter storms by reducingthe drag imposed by large swells on the bladelessstipes (Denny 1988).
The carbon budget calculations captured theseasonal pattern of plant growth, but overpredictedplant size by a factor of 2 when driven by the measuredscalar irradiances. This degree of overprediction isconsistent with other field–laboratory comparisons(Fourqurean & Zieman 1991, Herzka & Dunton 1997),and should be expected when scalar field irradiancesused to drive models based on laboratory P versus Ecurves are not corrected for the geometric orientationof photosynthetic blades, which act as cosine irradi-ance collectors (Zimmerman 2003). The laboratorymeasurements of photosynthesis performed in thisstudy used blade surfaces oriented normal to the light,which maximized interception of radiant flux. Bladesin the field, however, are rarely oriented normal to theincident flux. The 50 and 25% irradiance values,which generated the most reliable predictions of plantsize, corresponded to mean blade orientations of 60
and 75° from the horizontal. The resulting quasi-verti-cal orientation is fairly typical of these blades, particu-larly when they are moving in response to surge.Although canopy density effects were not simulatedhere, fronds can overlap and shade each other,especially in summer when total blade area is high andsurge is low.
In addition to blade orientation, light quality mayhave a significant effect on in situ photosynthesis ofthis deep-water kelp. Morel (1978) demonstrated thatthe radiation actually utilized for photosynthesis (PUR)by deep-dwelling phytoplankton in waters dominatedby poorly absorbed green/yellow light could be aslow as 1⁄3 of the measured PAR, depending on watertype. Considering the differences in light absorbed bythe spherical irradiance sensor versus the flat blades(cosine collectors) and the potential difference in PARversus PUR, it appears reasonable that only 25 to 50%of measured scalar irradiance was actually used forphotosynthesis. Further refinement of this carbonbudget model to include the optical properties of theblades themselves, the effects of water motion onblade angle and light absorption, PAR versus PUR,and density-dependent-shading effects would permitdetermination of the light-limited depth distribution ofthis species.
The irradiances ranging from 0 to 1 mol quanta m–2
d–1 measured here during winter were similar to thoseof the Arctic under seasonal ice cover in winter(Chapman & Lindley 1980, Dunton 1990). However, theArctic benthos receives higher irradiances during thesummer (up to 8 mol quanta m–2 d–1) and day-length istwice as long (PMAX would be integrated over 24 hrather than 12 h). During nutrient limitation in Arcticsummer, some kelps cease growth and divert all pro-duction to carbohydrate storage (Chapman & Lindley1980, Dunton 1990). These stored carbohydrates areused to fuel 90% of annual plant growth during thewinter period of darkness when nutrients are abundant.Laminariales can accumulate up to 15 to 20% DW incarbohydrates (German 1986, Watanabe et al. 1992).The deep-water population of Pleurophycus gardneriexamined here, however, only accumulated 5 to 9%DW as carbohydrates, with the stipe the main reservoirand the blade the main source. Unlike the Arctic,summer irradiances at our East Pinnacles study sitenear Monterey Bay were highly variable due to fre-quent dense coastal stratus and periodic, phytoplank-ton blooms driven by the temporal dynamics of coastalupwelling (Olivieri & Chavez 2000). Thus, the combina-tion of high ambient nutrient concentrations and lowlight availability probably limits the summertime accu-mulation of large internal carbon reserves by P. gard-neri in comparison to other kelps, including intertidalpopulations of this species growing at higher latitudes.
154
2000 2001
Mea
n d
aily
PN
ET
(g C
pla
nt–1
d–1
)
–0.04
–0.02
0.00
0.02
0.04
0.06 a
Blade abscised
Blade retained
J A O D F AJ A O D F A–0.02
0.00
0.02
0.04
0.06
0.08
0.10
0.12
b
**
*
*
*
Fig. 10. Pleurophycus gardneri. Effect of abscission on daily,whole-plant, net photosynthesis: (a) average daily PNET assum-ing 25% of measured irradiance and (b) average daily PNET
assuming 50% of measured irradiance. *: months when ‘bladeabscised’ was not significantly different from ‘blade retained’.
Break indicates missing data point in July 2000

Dominik & Zimmerman: Carbon allocation in kelp
Some of the carbohydrates accumulated in the bladeduring summer may have been translocated to thestipe and holdfast prior to blade abscission, a processwhich has been documented in Pleurophycus gardneri(Schmitz 1982). Carbon content of the stipe decreasedduring spring, perhaps due to remobilization andutilization of carbohydrates for growth of the blade.Germann’s (1989) suggestion, that translocation fromthe blade to the stipe was not possible due to the lackof blade growth in complete darkness, assumed thatblade growth only required the presence of carbo-hydrate reserves. It did not consider the presence of agrowth-initiating trigger, which may be controlled byphotoperiod (Lüning & Kadel 1993). Reserves accumu-lated prior to abscission were sufficient for winter res-piratory requirements, allowing for 2 mo of respirationduring winter and a buffer of about another month dur-ing blade initiation in spring. In addition, stipe andholdfast photosynthesis could only account for 20 to30% of the respiratory demand over the winter, whichwas augmented by slightly reduced respiration ratesand a higher fucoxanthin to chlorophyll a ratio duringwinter.
Although this study revealed no evidence of majorseasonal photoacclimation in Pleurophycus gardneri,differences in the magnitude of physiological parame-ters (α and chl) between the deep population studiedhere and the intertidal plants measured by Germann(1989) were evident. These deep-water plants exhib-ited higher light utilization efficiencies than intertidalplants on a biomass basis, but lower efficiencies on achlorophyll-specific basis. This pattern represents aclassic photoacclimation response common to shade-adapted algae. The P/R ratio was slightly higher inthis deep-water population than in the intertidalone studied by Germann (1989); however, it was nothigher than in other kelps such as Macrocystis pyrifera(Zimmerman & Kremer 1986, Table 4).
Size and morphology of these deep-water plantswere also different from those studied by Germann(1986). Average stipe lengths of those deep adultplants chosen for this study were generally twice aslong (40 to 50 cm) as the average stipe length of inter-tidal plants (20 cm) studied by Germann (1986), butblade area was similar to intertidal plants. Stipes ofdeep plants exhibited a ‘step-like’ pattern of growth(referred to as growth constrictions). The top of thestipe was flat and broad near the blade junction, thennarrowed and became elliptical with each constriction(with slight turning and rounding between constric-tions), and was round toward the holdfast. Althoughstipe growth was not quantitatively measured duringthe bladeless period, cell expansion or growth wasobserved just below the meristem, as indicated byseveral centimeters of new, lightly pigmented tissue.
Growth rings in the basal portion of the stipe of deep-water Pleurophycus gardneri were unexpected be-cause they are absent in intertidal plants (Germann1986). Validation of growth ring chronology allowedassessment of maximum observed age of 5 yr in thisdeep-water population (Dominik 2004). These plantsabscised 1 mo later than intertidal plants and remainedbladeless for 2 mo, instead of 2 wk like intertidal plants(Germann 1986). Because intertidal plants contain~10 times more sugar than the deep plants, they haveenough reserves to grow despite the short day-lengthsin winter, so that when spring arrives they alreadyhave a large blade for quick growth and re-accumula-tion of sugar for the next winter. Deep plants have solittle sugar that they must survive on reserves untilspring, when ample light is available for growth.
Some of these morphological and physiologicaldifferences may indicate adaptations to surviving in adeep-water environment. Higher water motion in theintertidal may cause plants with longer stipes to beremoved, effectively decreasing the average stipelength compared to deep plants. Longer stipes of thedeep-water plants may help prevent self-shading andreduce light competition by placing the blades higherin the water column, where they are exposed to higherrates of water motion. Production of additional sorijust prior to abscission may facilitate dispersal as thenegatively buoyant blade drifts away.
The deep-water population of Pleurophycus gard-neri did not accumulate large carbohydrate reservescompared to other kelps, and the annual carbonbudget appears to be tightly balanced. Despite thepotential benefit demonstrated by the model ofretaining the blade, classic photoacclimation and sea-sonally depressed respiration in the perennial partsapparently allow this deciduous kelp to persist indeeper water. Without the reserves located in theperennial stipe and holdfast the plant should diebefore blade initiation in spring. The photosyntheticefficiency of deep-water plants was twice that ofintertidal plants, which have very low compensationdepths (Germann 1986). This study also demonstratedthat models, which incorporate photosynthetic pro-duction, should account for canopy geometry andorientation relative to the submarine light field andpossibly the quality of in addition to the quantity ofin situ irradiance.
Acknowledgements. Many thanks to M. S. Foster for initiallyproposing this study, for extensive advice and guidance onexperimental design, and for data analysis throughout thecourse of this study. J. Schuytema produced the scientificillustration. J. Heine, L. Bradford, A. Bullard, and J. Feltonprovided logistical support and field assistance. Funding wasprovided by the Packard Foundation, the PADI AWARE
155

Mar Ecol Prog Ser 309: 143–157, 2006
Foundation, the Earl and Ethyl Meyers OceanographicTrust, and the NOAA National Undersea Research Program(NURP), Monterey Bay Initiative.
LITERATURE CITED
Abbott IA, Hollenberg GJ (1976) Marine algae of California.Stanford University Press, Stanford, CA
Addicott FT (1982) Abscission. University of California Press,Berkeley, CA
Chapman ARO, Craigie JS (1977) Seasonal growth in Lami-naria longicruris: relations with dissolved inorganic nutri-ents and internal reserves of nitrogen. Mar Biol 40:197–205
Chapman ARO, Craige JS (1978) Seasonal growth in Lami-naria longicruris: relations with reserve carbohydratestorage and production. Mar Biol 46:209–213
Chapman ARO, Lindley JE (1980) Seasonal growth of Lami-naria solidungula in the Canadian high Arctic in relationto irradiance and dissolved nutrient concentrations. MarBiol 57:1–5
Chapman ARO, Markham JW, Lüning K (1978) Effects ofnitrate concentrations on the growth and physiology ofLaminaria saccharina (Phaeophyta) in culture. J Phycol 14:195–198
Dean TA (1985) The temporal and spatial distribution ofunderwater quantum irradiance in a southern Californiakelp forest. Estuar Coast Shelf Sci 21:835–844
Denny MW (1988) Biology and the mechanics of the waveswept environment. Princeton University Press, Princeton,NJ
Dominik CM (2004) Dynamics of carbon allocation in a deepwater population of the deciduous kelp, Pleurophycusgardneri (Laminariales). MS thesis, California State Uni-versity Moss Landing Marine Laboratories, Moss Landing,CA
Dunton KH (1985) Growth of dark-exposed Laminaria sac-charina (L.) Lamour. and Laminaria solidungula J. Ag.(Laminariales: Phaeophyta) in the Alaskan Beaufort Sea.J Exp Mar Biol Ecol 94:181–189
Dunton KH (1990) Growth and production in Laminariasolidungula: relation to continuous underwater light levelsin the Alaskan high Arctic. Mar Biol 106:297–304
Dunton KH, Jodwalis CM (1988) Photosynthesis performanceof Laminaria solidungula measured in situ in the Alaskahigh Arctic. Mar Biol 98:277–285
Dunton KH, Schell DM (1986) Seasonal carbon budget andgrowth of Laminaria solidungula in the Alaskan highArctic. Mar Ecol Prog Ser 31:57–66
Edwards MS (1998) Effects of long-term kelp canopy exclu-sion on the abundance of the annual alga Desmerestialigulata (Light F). J Exp Mar Biol Ecol 228:309–326
Fourqurean JW, Zieman JC (1991) Photosynthesis, respirationand whole plant carbon budget of the seagrass Thalassiatestudinum. Mar Ecol Prog Ser 69:161–170
Gagne JA, Mann KH, Chapman ARO (1982) Seasonal pat-terns of growth and storage in Laminaria longicruris inrelation to differing patterns of available nitrogen inwater. Mar Biol 69:91–101
Germann I (1986) Growth phenology of Pleurophycus gard-neri (Phaeophyceae, Laminariales), a deciduous kelp ofthe northeast Pacific. Can J Bot 64:2538–2547
Germann I (1989) Aspects of carbon metabolism in relation toautumnal blade abscission in the kelp Pleurophycus gard-neri (Phaeophyceae, Laminariales). Mar Ecol Prog Ser 54:179–183
Germann I, Druehl LD, Hoeger U (1987) Seasonal variationof total soluble tissue nitrogen in Pleurophycus gardneri(Phaeophyceae, Laminariales) in relation to environ-mental nitrate. Mar Biol 96:413–423
Herzka S, Dunton K (1997) Seasonal photosynthetic patternsin the seagrass Thalassia testudinum in the western Gulfof Mexico. Mar Ecol Prog Ser 152:103–117
Kirk JTO (1994) Light and photosynthesis in aquatic ecosys-tems, 2nd edn. Cambridge University Press, Cambridge
Lambert M, Neish AC (1950) Rapid method for estimation ofglycerol in fermentation solutions. Can J Res 28B:83–89
Lüning K (1979) Growth strategies of three Laminaria species(Phaeophyceae) inhabiting different depth zones in thesublittoral region of Helgoland (North Sea). Mar Ecol ProgSer 1:195–207
Lüning K, Kadel P (1993) Daylength range for circannual rhyth-micity in Pterogophora californica (Alariaceae, Phaeophyta)and synchronization of seasonal growth by daylength cyclesin several other brown algae. Phycologia 32:379–387
Lüning K, Schmitz K, Willenbrink J (1973) CO2 fixation andtranslocation in benthic marine algae. III. Rates and eco-logical significance of translocation in Lamiaria hyper-borea and L. saccharina. Mar Biol 23:275–281
Mann KH (1973) Seaweeds: their productivity and strategy forgrowth. Science 182:975–981
Markham JW (1972) Distribution and taxonomy of Laminariasinclairii and L. longipes (Phaeophyceae, Laminariales).Phycologia 11:147–157
Morel A (1978) Available, usable, and stored radiant energy inrelation to marine photosynthesis. Deep-Sea Res 25:673–688
Olivieri RA, Chavez FP (2000) A model of plankton dynamicsfor the coastal upwelling system of Monterey Bay, Cali-fornia. Deep-Sea Res II 47:1077–1106
Parke MW (1948) Studies of the British Laminariaceae. I.Growth in Laminaria saccharina (L.) Lamour. J Mar BiolAssoc UK 27:651–709
Ramus J (1983) A physiological test of the theory of comple-mentary chromatic adaptation. II. Brown, green and redseaweeds. J Phycol 19:173–178
Reed DC, Foster MS (1984) The effect of canopy shading onalgal recruitment and growth in a kelp forest. Ecology 65:937–948
Schiel DR, Foster MS (1986) The structure of subtidal algalstands in temperate waters. Oceanogr Mar Biol AnnuRev 24:265–307
Schmitz K (1982) Translocation of organic compounds inLaminariales. In: Synthetic and degradative processes inmarine macrophytes. Walter de Gruyter, Berlin, p 167–180
Sears JR, Wilce RT (1975) Sublittoral, benthic marine algae ofsouthern Cape Cod and adjacent islands: seasonal period-icity, associations, diversity, and floristic composition. EcolMonogr 45:337–365
Seely GP, Duncan MJ, Vidaver WE (1972) Preparative andanalytical extraction of pigments from brown algae withdimethyl sulfoxide. Mar Biol 54:179–188
Sokal RR, Rohlf FJ (1969) Biometry: the principles andpractices of statistics in biological research, 2nd edn.WH Freeman, San Francisco, CA
Spalding H, Foster MS, Heine JH (2003) Composition, distrib-ution, and abundance of deep-water (>30 m) macroalgaein central California. J Phycol 39:273–284
VanBlaricom GR, Reed DC, Harrold C, Bodkin JL (1986) Asublittoral population of Pleurophycus gardneri (Setchelland Saunders, 1900) (Phaeophyceae: Laminariaceae) incentral California. Bull South Calif Acad Sci 85:120–122
Watanabe JM, Phillips RE, Allen NH, Anderson WA (1992)Physiological response of the stipitate understory kelp,
156

Dominik & Zimmerman: Carbon allocation in kelp
Pterygophora californica Ruprecht, to shading by thegiant kelp, Macrocystis pyrifera C. Agardh. J Exp Mar BiolEcol 159:237–252
Webb WL, Newton M, Starr D (1974) Carbon dioxide ex-change of Alnus rubra: a mathematical model. Oecologia17:281–291
Yemn EW, Willis AL (1954) The estimation of carbohydratesin plant extracts by anthrone. Biochem J 57:508–514
Zimmerman RC (2003) A biooptical model of irradiance distri-bution and photosynthesis in seagrass canopies. LimnolOceanogr 48:568–585
Zimmerman RC, Kremer NJ (1986) In situ growth and chemi-cal composition of the giant kelp, Macrocystis pyrifera:response to temporal changes in ambient nutrient avail-ability. Mar Ecol Prog Ser 27:277–285
Zimmerman RC, Beeler SooHoo JB, Kremer JN, Argenio DZD(1987) Evaluation of variance approximation techniquesfor non-linear photosynthesis–irradiance models. Mar Biol95:209–215
Zimmerman RC, Smith RD, Alberte RS (1989) Thermalacclimation and whole-plant carbon balance in Zosteramarina L. (eelgrass). J Exp Mar Biol Ecol 130:93–109
157
Editorial responsibility: Otto Kinne (Editor-in-Chief), Oldendorf/Luhe, Germany
Submitted: March 8, 2005; Accepted: September 19, 2005Proofs received from author(s): February 10, 2006