Embed Size (px)
Citation preview
Dynamics of political instability in theUnited States, 1780–2010
Peter Turchin
Department of Ecology and Evolutionary Biology, University of Connecticut
AbstractThis article describes and analyses a database on the dynamics of sociopolitical instability in the United Statesbetween 1780 and 2010. The database was constructed by digitizing data collected by previous researchers, supple-mented by systematic searches of electronic media archives. It includes 1,590 political violence events such as riots,lynchings, and terrorism. Incidence of political violence fluctuated dramatically over the 230 years covered by thedatabase, following a complex dynamical pattern. Spectral analysis detected two main oscillatory modes. The firstis a very long-term – secular – cycle, taking the form of an instability wave during the second half of the 19th century,bracketed by two peaceful periods (the first quarter of the 19th century and the middle decades of the 20th century,respectively). The second is a 50-year oscillation superimposed on the secular cycle, with peaks around 1870, 1920,and 1970. The pattern of two periodicities superimposed on each other is characteristic of the dynamics of politicalinstability in many historical societies, such as ancient Rome and medieval and early-modern England, France, andRussia. A possible explanation of this pattern, discussed in the article, is offered by the structural-demographic the-ory, which postulates that labor oversupply leads to falling living standards and elite overproduction, and those, inturn, cause a wave of prolonged and intense sociopolitical instability.
Keywords
complex dynamics, database, political instability, riot, secular cycles, structural-demographic theory
Introduction
Political instability within states is one of the chiefsources of human misery today, much more importanteven than warfare between states. Since the end of theCold War, intrastate warfare has accounted for over90% of battle deaths (Lacina & Gleditsch, 2005). Intra-state warfare is a primary cause of genocide and failed, orfailing, states are breeding grounds for international ter-rorism. However, our understanding of causes and, espe-cially, dynamics of political instability is still deficient.
Factors responsible for the onset of political instabilityare typically studied by correlating instability with vari-ous political, economic, and demographic variables incross-national comparisons (for example, Goldstone etal., 2010). These analyses have yielded a number of veryuseful insights. A drawback of such static approaches,however, is that they focus on immediate effects of
potential causal variables on instability (at best, they lookback 5–10 years), while ignoring long-term dynamics.Yet quantitative historical studies indicate that long-term dynamics of political instability are not trivial.State-level societies experience waves of political instabil-ity, roughly a century long (sometimes longer), inter-spersed with century-long periods of relative internalpeace and order. On top of these secular waves (with peri-ods of two to three centuries) are superimposed cycleswith periods of 50+10 years. These empirical patternswill be reviewed in greater detail in the next section.
Static analyses of systems characterized by complexdynamics may misidentify the mechanisms generatingchange (Turchin, 2005, 2006a). Therefore, analyses of
Corresponding author:[email protected]
Journal of Peace Research1–15ª The Author(s) 2012Reprints and permission:sagepub.co.uk/journalsPermissions.navDOI: 10.1177/0022343312442078jpr.sagepub.com
peaceR E S E A R C H
j o u r n a l o f
at UNIV OF CONNECTICUT on July 16, 2012jpr.sagepub.comDownloaded from
cross-national data need to be supplemented bydynamical analyses focusing on long-term time-seriesdata in a particular state or region. So far few empiricalefforts have attempted to quantify the dynamics of polit-ical instability in the long term (but see Kiser & Linton,2002; Turchin & Nefedov, 2009). The goal here is suchan empirical analysis for one particular country, theUnited States from the beginnings of the Republic(c.1780) to the present (2010).
This article is organized as follows. The first sectionprovides the empirical and theoretical background of thestudy with an overview of long-term patterns in politicalviolence in agrarian states and mechanisms that generateinstability waves. The second section addresses the ques-tion of how the theory, developed for agrarian states,should be reformulated to apply to industrializing societ-ies, such as the USA. Next, I describe how the US polit-ical violence (USPV) database was constructed andanalyzed. The article closes with a discussion of whetherthe observed empirical patterns are consistent with pre-dictions by the structural-demographic theory.
Complex dynamics of political instability inhistorical societies
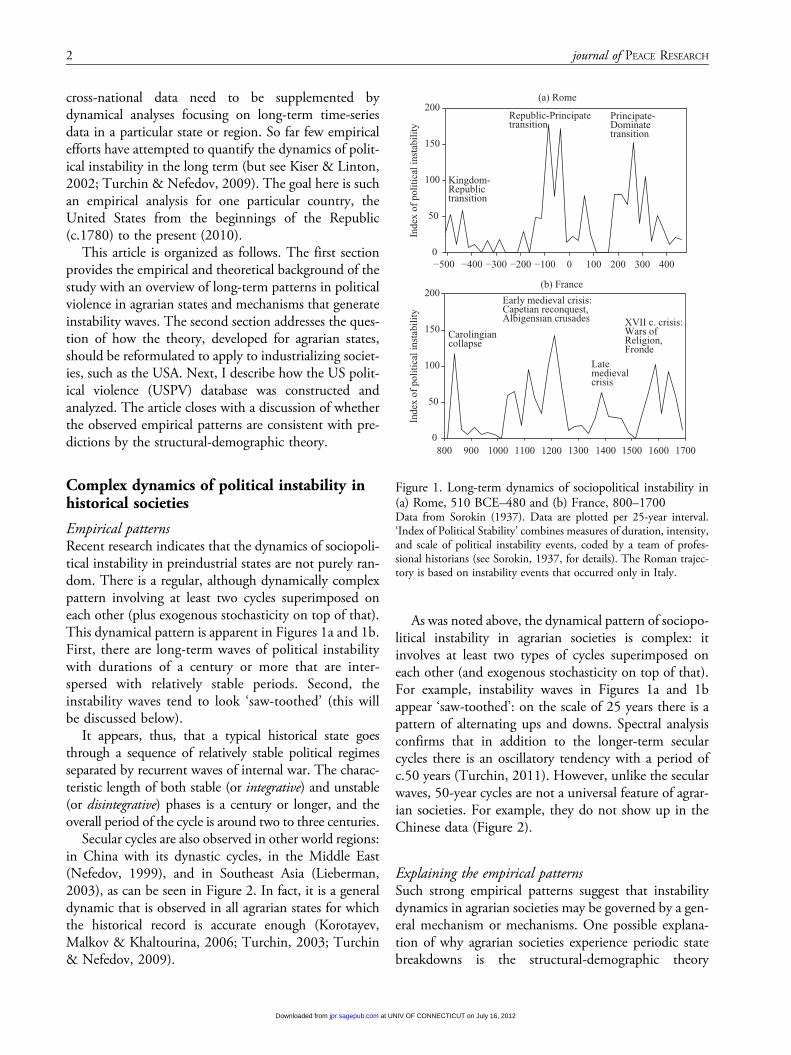
Empirical patternsRecent research indicates that the dynamics of sociopoli-tical instability in preindustrial states are not purely ran-dom. There is a regular, although dynamically complexpattern involving at least two cycles superimposed oneach other (plus exogenous stochasticity on top of that).This dynamical pattern is apparent in Figures 1a and 1b.First, there are long-term waves of political instabilitywith durations of a century or more that are inter-spersed with relatively stable periods. Second, theinstability waves tend to look ‘saw-toothed’ (this willbe discussed below).
It appears, thus, that a typical historical state goesthrough a sequence of relatively stable political regimesseparated by recurrent waves of internal war. The charac-teristic length of both stable (or integrative) and unstable(or disintegrative) phases is a century or longer, and theoverall period of the cycle is around two to three centuries.
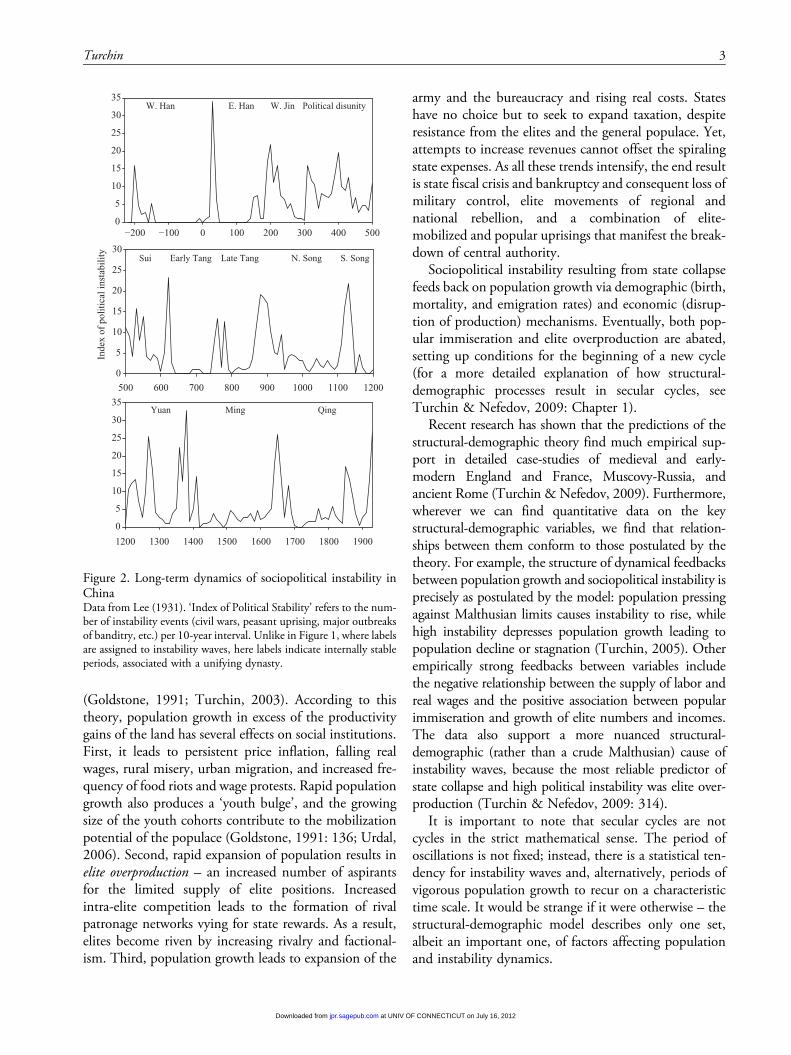
Secular cycles are also observed in other world regions:in China with its dynastic cycles, in the Middle East(Nefedov, 1999), and in Southeast Asia (Lieberman,2003), as can be seen in Figure 2. In fact, it is a generaldynamic that is observed in all agrarian states for whichthe historical record is accurate enough (Korotayev,Malkov & Khaltourina, 2006; Turchin, 2003; Turchin& Nefedov, 2009).
As was noted above, the dynamical pattern of sociopo-litical instability in agrarian societies is complex: itinvolves at least two types of cycles superimposed oneach other (and exogenous stochasticity on top of that).For example, instability waves in Figures 1a and 1bappear ‘saw-toothed’: on the scale of 25 years there is apattern of alternating ups and downs. Spectral analysisconfirms that in addition to the longer-term secularcycles there is an oscillatory tendency with a period ofc.50 years (Turchin, 2011). However, unlike the secularwaves, 50-year cycles are not a universal feature of agrar-ian societies. For example, they do not show up in theChinese data (Figure 2).
Explaining the empirical patternsSuch strong empirical patterns suggest that instabilitydynamics in agrarian societies may be governed by a gen-eral mechanism or mechanisms. One possible explana-tion of why agrarian societies experience periodic statebreakdowns is the structural-demographic theory
(a) Rome
400
Inde
x of
pol
itica
l ins
tabi
lity
0
50
100
150
200
(b) France
Inde
x of
pol
itica
l ins
tabi
lity
0
50
100
150
200
Kingdom-Republictransition
Republic-Principatetransition
Principate-Dominatetransition
Carolingiancollapse
Early medieval crisis:Capetian reconquest,Albigensian crusades
Late medievalcrisis
XVII c. crisis:Wars of Religion,Fronde
−500 −400 −300 −200 −100 0 100 200 300
800 900 1000 1100 1200 1300 1400 1500 1600 1700
Figure 1. Long-term dynamics of sociopolitical instability in(a) Rome, 510 BCE–480 and (b) France, 800–1700Data from Sorokin (1937). Data are plotted per 25-year interval.‘Index of Political Stability’ combines measures of duration, intensity,and scale of political instability events, coded by a team of profes-sional historians (see Sorokin, 1937, for details). The Roman trajec-tory is based on instability events that occurred only in Italy.
2 journal of PEACE RESEARCH
at UNIV OF CONNECTICUT on July 16, 2012jpr.sagepub.comDownloaded from
(Goldstone, 1991; Turchin, 2003). According to thistheory, population growth in excess of the productivitygains of the land has several effects on social institutions.First, it leads to persistent price inflation, falling realwages, rural misery, urban migration, and increased fre-quency of food riots and wage protests. Rapid populationgrowth also produces a ‘youth bulge’, and the growingsize of the youth cohorts contribute to the mobilizationpotential of the populace (Goldstone, 1991: 136; Urdal,2006). Second, rapid expansion of population results inelite overproduction – an increased number of aspirantsfor the limited supply of elite positions. Increasedintra-elite competition leads to the formation of rivalpatronage networks vying for state rewards. As a result,elites become riven by increasing rivalry and factional-ism. Third, population growth leads to expansion of the
army and the bureaucracy and rising real costs. Stateshave no choice but to seek to expand taxation, despiteresistance from the elites and the general populace. Yet,attempts to increase revenues cannot offset the spiralingstate expenses. As all these trends intensify, the end resultis state fiscal crisis and bankruptcy and consequent loss ofmilitary control, elite movements of regional andnational rebellion, and a combination of elite-mobilized and popular uprisings that manifest the break-down of central authority.
Sociopolitical instability resulting from state collapsefeeds back on population growth via demographic (birth,mortality, and emigration rates) and economic (disrup-tion of production) mechanisms. Eventually, both pop-ular immiseration and elite overproduction are abated,setting up conditions for the beginning of a new cycle(for a more detailed explanation of how structural-demographic processes result in secular cycles, seeTurchin & Nefedov, 2009: Chapter 1).
Recent research has shown that the predictions of thestructural-demographic theory find much empirical sup-port in detailed case-studies of medieval and early-modern England and France, Muscovy-Russia, andancient Rome (Turchin & Nefedov, 2009). Furthermore,wherever we can find quantitative data on the keystructural-demographic variables, we find that relation-ships between them conform to those postulated by thetheory. For example, the structure of dynamical feedbacksbetween population growth and sociopolitical instability isprecisely as postulated by the model: population pressingagainst Malthusian limits causes instability to rise, whilehigh instability depresses population growth leading topopulation decline or stagnation (Turchin, 2005). Otherempirically strong feedbacks between variables includethe negative relationship between the supply of labor andreal wages and the positive association between popularimmiseration and growth of elite numbers and incomes.The data also support a more nuanced structural-demographic (rather than a crude Malthusian) cause ofinstability waves, because the most reliable predictor ofstate collapse and high political instability was elite over-production (Turchin & Nefedov, 2009: 314).
It is important to note that secular cycles are notcycles in the strict mathematical sense. The period ofoscillations is not fixed; instead, there is a statistical ten-dency for instability waves and, alternatively, periods ofvigorous population growth to recur on a characteristictime scale. It would be strange if it were otherwise – thestructural-demographic model describes only one set,albeit an important one, of factors affecting populationand instability dynamics.
0
5
10
15
20
25
30
35In
dex
of p
oliti
cal i
nsta
bilit
y
0
5
10
15
20
25
30
0
5
10
15
20
25
30
35
W. Han E. Han W. Jin Political disunity
Sui Early Tang Late Tang N. Song S. Song
Yuan Ming Qing
400 500−200 −100 0 100 200 300
500 600 700 800 900 1000 1100 1200
1200 1300 1400 1500 1600 1700 1800 1900
Figure 2. Long-term dynamics of sociopolitical instability inChinaData from Lee (1931). ‘Index of Political Stability’ refers to the num-ber of instability events (civil wars, peasant uprising, major outbreaksof banditry, etc.) per 10-year interval. Unlike in Figure 1, where labelsare assigned to instability waves, here labels indicate internally stableperiods, associated with a unifying dynasty.
Turchin 3
at UNIV OF CONNECTICUT on July 16, 2012jpr.sagepub.comDownloaded from
An additional process (which is not part of thestructural-demographic theory) that needs to be taken intoaccount when studying secular cycles is the ‘fathers-and-sons’ dynamic (Turchin, 2003, 2006b). This mechanismoperates during the prolonged disintegrative secular trendsthat are characteristic of secular cycles in Europe. Theempirical observation is that disintegrative trends are notperiods of continuous civil war; instead, they have internalstructure with decades when sociopolitical instability isparticularly high, interspersed with decades of relative paci-fication (Turchin & Nefedov, 2009: 310–11). A possibleexplanation is swings in the collective social mood.
Episodes of internal warfare often develop in ways sim-ilar to epidemics or forest fires (Turchin, 2006b: Chapter9). In the beginning of the conflict, each act of violencetriggers chains of revenge and counter-revenge. With timeparticipants lose all restraint, atrocities become common,and conflict escalates in an accelerating, explosive fashion.After the initial explosion, however, violence drags on andon, for years and sometimes even for decades. Sooner orlater most people begin to yearn for the return of stabilityand an end to fighting. The most psychopathic and vio-lent leaders get killed off, or lose their supporters. Vio-lence, like a disease epidemic, ‘burns out’. Even thoughthe fundamental causes that brought the conflict on in thefirst place may still be operating, the prevailing socialmood swings in favor of cessation of conflict at all costs,and an uneasy truce gradually takes hold. Those peoplewho directly experienced civil war become ‘immunized’against it, and while they are in charge, they keep thingsstable. The peaceful period lasts for a human genera-tion—between 20 and 30 years. Eventually, however, theconflict-scarred generation dies off or retires, and a newcohort arises, people who did not experience the horrorsof civil war and are not immunized against it. If thelong-term social forces that brought about the first out-break of internal hostilities are still operating, then thesociety will slide into the second civil war. As a result, peri-ods of intense conflict tend to recur with a period ofroughly two generations (40–60 years).
These swings in the social mood may be termed‘bi-generation cycles’ because they involve alternatinggenerations that are either prone to conflict or not.Another example of such social mood swings, also witha period of roughly 50 years, has been noted, for exam-ple, by Schlesinger (1986).
From agrarian to industrial societies
The Industrial Revolution had a dramatic effect on thestructure and dynamics of human societies. As a result,
at least some of the relationships postulated bystructural-demographic theory have been made obsolete.In particular, we could hardly expect that populationincrease in Western industrialized states would resultin starvation. Other aspects of the theory, however, aremore robust with respect to changes brought about bythe Industrial Revolution. Can the theory be reformu-lated in a way that would make it useful for describingthe dynamics of industrialized societies?
The starting point for a reformulation of thestructural-demographic theory is provided by the threetheory-motivated and empirically supported generaliza-tions discussed at the end of Secular Cycles (Turchin &Nefedov, 2009: 313–14): (1) the neo-Malthusian princi-ple, (2) the principle of elite overproduction, and (3) thestructural-demographic causes of political instability.The neo-Malthusian principle – that sustained popula-tion growth inevitably leads to falling living standardsand popular immiseration – has been, clearly, mostimpacted by the agrarian–industrial transition. However,it can be restated in more general terms of supply-demand relations (e.g. Borjas, 2009): when the supplyof labor exceeds its demand, the price of labor shoulddecrease (depressing living standards for the majority ofpopulation). In agrarian economies demand for labor islimited by the availability of cultivable land, andunchecked population growth inevitably leads to fallingliving standards. In modern economies, in contrast, thedemand for labor is much more dynamic and can changeas a result of technological advances and investments inphysical and human capital. Additionally, modern soci-eties are much more interconnected, and the balance ofsupply and demand for labor can be affected by interna-tional flows of people and jobs. Thus, the set of factorsaffecting living standards in modern societies is muchmore complex than for agrarian societies. Nevertheless,shifting balance between the demand and the supply oflabor should have important consequences for popularwell-being.
The principle of elite overproduction also canbe thought of as a consequence of the law of supplyand demand. The elites (in both agrarian and capitalistsocieties) are consumers of commoner labor. Lowprice of labor leads not only to declining living stan-dards for a large segment of population (employees,especially unskilled ones), but also to a favorable eco-nomic conjuncture for the elites (more specifically, forthe economic elites – employers). There are severalimportant consequences of this development. First, theelites become accustomed to ever greater levels of con-sumption. In addition, competition for social status
4 journal of PEACE RESEARCH
at UNIV OF CONNECTICUT on July 16, 2012jpr.sagepub.comDownloaded from
drives increased conspicuous consumption. Thus, theminimum level of resources necessary for maintainingelite status exhibits a runaway growth. Second, thenumber of elites, in relation to the rest of the popula-tion, increases. Favorable economic conjuncture for theemployers enables large numbers of intelligent, hard-working, or simply lucky individuals to accumulatewealth and then attempt to translate it into social status.As a result, upward mobility into the ranks of the eliteswill greatly overmatch downward mobility. The thirdconsequence is that the twin processes of decliningliving standards for the commoners and increasingconsumption levels for the elites will drive up socio-economic inequality.
As a result of the growth in elite appetites and num-bers, the proportion of the total economic pie consumedby them will increase, leading to the condition that hasbeen termed elite overproduction (Turchin, 2003, 2006b).Intra-elite competition for limited elite positions in theeconomy and government becomes fierce. Competitionwill be particularly intense for government positions whosesupply is relatively inelastic, especially at the top.A democratic system of government may allow for nonvio-lent rotation of political elites, but ultimately this dependson the willingness of established elites to relinquish accessto power positions to ever growing numbers of eliteaspirants. As a result, elite overproduction increases theprobability of violent intra-elite conflict.
The wave of uprising and regime changes that sweptthe Arab countries in 2011 appears to be an excellentillustration of structural-demographic mechanisms inaction (with a caveat that I am writing as these events arestill unfolding and before they have been carefully ana-lyzed). All main ingredients postulated by the theoryappear to be present: rapid population growth resultingin youth bulges; growing economic inequality withpoorer population strata increasingly immiserated, whilethe incomes at the top exhibit runaway growth; and eliteoverproduction as evidenced by a remarkable expansionof the numbers of university-educated youths withoutjob prospects. Structural-demographic processes aredirectly referred to in such articles in the popular pressas ‘Jobs and age reign as risk factors for Mideast upris-ings’ (Hamdan, 2011) and ‘Arab world built colleges,but not jobs: Unemployment, broad among region’sangry youth, is high among educated’ (Wessel, 2011).This is not to say that other frequently mentioned fac-tors, for example democratization pressures in despoticregimes or the spread of social media, are unimportant.As I have stressed earlier, human societies are complexsystems and such epochal events as revolutions and
civil wars have many causes. Here I am concernedwith ‘universal’ factors, processes resulting in waves ofpolitical violence in such greatly different societies aslate-Republican Rome, former Han Dynasty, earlymodern France, and perhaps even today. It would beinteresting to assess the relative importance of such gen-eric, structural-demographic processes with respect toother factors in causing the ‘Arab Spring’ by a formalstatistical analysis.
In summary, the theory suggests the following gener-alization: labor oversupply should lead to falling livingstandards and elite overproduction, which, in turn,should result in a wave of prolonged and intense socio-political instability. Although rapid population growthis one of the most important precursors of instabilitywaves, it is important to stress that the structural-demographic theory is not a crude Malthusian model.Population growth causes political violence indirectly; itseffect is mediated through social structures – mostimportantly, power relations between the elites and gen-eral population, and within the elites (the theory actuallyintegrates insights of Malthus, Marx, and Weber). Thus,we should not expect direct correlations between rapidpopulation growth and political instability. Indeed,cross-national analyses do not find consistent support forsuch effects (e.g. Urdal, 2005).
Furthermore, population growth is not the onlymechanism that can lead to labor oversupply. Astructural-demographic analysis of US history indicatesthat during the 19th century, immigration fluxes had amuch greater effect than natural population growth onthe dynamics of popular well-being and elite overpro-duction (Turchin, forthcoming). However, a detailedanalysis of structural-demographic dynamics in the USA,including the effects of the massive immigration waveduring the 19th century, has to be deferred to a forth-coming publication (Turchin, forthcoming). In this arti-cle my primary objective is the construction of anempirical database on US political violence and analysisof these data to determine whether long-term dynamicsof instability conform to the previously observed patternof secular waves with superimposed 50-year oscillations.
A database of political violence in the UnitedStates, 1780–2010
Defining a political instability eventPolitical instability is defined here as a violent group-levelconflict within a state. Because it occupies the middleground between interstate warfare and individual vio-lence/crime, its boundaries are, of necessity, somewhat
Turchin 5
at UNIV OF CONNECTICUT on July 16, 2012jpr.sagepub.comDownloaded from
imprecise. In the following I detail the definitions Iemployed when constructing the database. It is impor-tant to keep in mind that the purpose of the databaseis not to generate absolute measures of instability (e.g.the number of people killed in instability events per yearper 100,000 people). When studying dynamics the pri-mary goal is to quantify relative change with time, andany measure that is proportional to the variable of inter-est will do, as long as the coefficient of proportionality is(approximately) constant. This approach simplifies thetask in several ways. First, the end result will not beunduly affected by specifics of where we draw theboundary of an ‘instability event’, as long as boundarycases are relatively infrequent. Second, we do not needto attempt to capture all the events in the database(which in many cases is an impossible task anyway). Afair sample will do as well. Finally, publishing the data-base makes it possible for other researchers to investigatehow changing definitions may affect the end result.
Instability events vary in scale from intense and pro-longed civil wars claiming thousands (and sometimeseven millions) of human lives to a one-day urban riotin which several people are killed, or even a violentdemonstration in which no lives are lost. In constructingthe database I chose to include only lethal events. Sucha conservative approach excludes a number of legiti-mate instability events, but it has two advantages. First,it clearly demarcates political violence from peacefuldemonstrations and nonviolent labor strikes that arepart of the normal functioning of a democratic societyand, therefore, are not instances of political instability.Second, and even more important, events that involveloss of life are much more likely to be reported in themedia. Thus, focusing on such events reduces the effectof various reporting biases.
Accordingly, in order for an event to be included inthe database, there had to be at least a single fatality asso-ciated with it. At the opposite end of the scale from suchsingle-fatality events we have the American Civil War(1861–65) that resulted in 620,000 battle deaths, whichis orders of magnitude greater than the next largestinstability event in US history, the New York City DraftRiots of 1863 (c.1,000 deaths). Because of this disconti-nuity, I chose not to include the Civil War in the data-base, but treat it as a sui generis event. For similar reasons,and because it largely falls before my period, the Amer-ican Revolution (1776–83) is not part of the database.
Apart from lethality, instability events also need to bedistinguished from external warfare, on one hand, andinterpersonal violence, on the other. For the UnitedStates the boundary between internal and external
warfare is usually non-controversial, except possibly inthe case of the Indian Wars. I chose to treat conflictsbetween the Native Americans and the settlers ofEuropean origin as external warfare prior to 1890, theofficial date of the closing of the US frontier (Turner,1921) and as political instability thereafter. I also did notinclude in the database the 9/11 attacks on the WorldTrade Center and the Pentagon. The boundary betweenpolitical instability and individual-level violence is lessdistinct. Because my focus is not on crime, I excludedsuch borderline activities (in the sense that they shadeinto collective violence) as lethal conflicts between crim-inal societies (e.g. Mafia groups) or street gangs.
Classes of political instability eventsAs stated above, the database focuses on social (group-level) violence, rather than violence among individuals(crime). This general definition, however, includes manydifferent kinds of collective violence. Incidents of politi-cal violence can be roughly classified by whether bothopposing sides are substantial groups of people (e.g.more than 12 individuals), or whether one side is agroup, and the other is one or few (less than 12) individ-uals. The boundary of 12 between ‘few’ and ‘many’ thatI use is arbitrary, and in this I follow the precedent estab-lished by Gilje (1996). However, the proportion of bor-derline cases, in which it is difficult to decide whether weare dealing with a group or not, is in any case tiny.
The generic term for group-on-group violence usedboth in scientific literature (Gilje, 1996; Grimstead,1998) and in US newspaper reports is riot. The histor-ian of US riots, Paul Gilje, defines a riot as ‘any group oftwelve or more people attempting to assert their willimmediately through the use of force outside the nor-mal bounds of law’ (Gilje, 1996: 4). I accept this basicdefinition, but with two changes. First, I distinguishbetween group-on-group violence (proper riots) andgroup-on-individual violence (termed lynchings, seebelow). Second, for reasons stated earlier I includedin the database only riots that actually led to at leastone death.
There are many different kinds of riots (for reviews,see Gilje, 1996; Goldstone & Useem, 1999; Grimstead,1998; Rucker & Upton, 2006; Wilkinson, 2009). Oneuseful way to distinguish between different types is bythe motivations/issues that led to the riot. The mostcommon issues in the USPV database are (1) race or eth-nicity, (2) labor-management conflicts, and (3) politics,including election disputes and sectional conflicts beforethe Civil War. Some riots have mixed motivations (forexample, race and politics in the South during the
6 journal of PEACE RESEARCH
at UNIV OF CONNECTICUT on July 16, 2012jpr.sagepub.comDownloaded from
Reconstruction Era, or labor and ethnicity/race inmany violent strikes), in which case I entered all codesthat applied. In situations when the sources did notprovide enough information to assign an issue, I left theentry blank.
While a conflict between groups of people is referredto in the database as a riot, lethal violence perpetrated bymany on one/few individuals is designated as a ‘lynch-ing’. This usage differs somewhat from that in the volu-minous literature on lynching (Blee, 2005; Brundage,1993; Gonzales-Day, 2006; Pfeifer, 2011; Waldrep,2002), although it should be noted that there is no uni-versally agreed upon definition of lynching. The mostcommon issue leading to a lynching in the USPV data-base was race or ethnicity. The next common class oflynchings can be termed as ‘extralegal’, when a groupof citizens executes a person (or persons) accused of seri-ous crimes such as murder or rape. In many cases raceand extralegal motives are intermixed, and my codingreflected this fact. Finally, there are also some examplesof lynchings following labor or political disputes, butthese are relatively rare.
Violence perpetrated by one/few on many is more dif-ficult to categorize. This class of events includes, first andmost obviously, terrorism (Sandler, 2011; Smith, 1994).Terrorism is generally directed against some social orpolitical institution, or the society as a whole. An impor-tant class of political violence – assassination – is the onein which an individual is targeted not as a private person,but as a representative or an embodiment of some socialgroup or political institution. In other words, my deci-sions on whether a particular event should be includedin the database or not were governed by the principleof ‘social substitutability’ (Kelly, 2000: 5), or ‘fungibilityof the victim’ (Blee, 2005: 607). The most commonissue motivating assassinations is politics, in which thevictim is a government official or an elected representa-tive. Other subtypes include assassinations motivatedby religious, ethnic, or racial hatred.
Finally, there are rampages – a relatively new type ofviolence that has become common in the USA only inthe last three or four decades. Whether rampages shouldbe included in the database may be controversial. Newsreports tend to dismiss them as incidents of senselessmass murder resulting from mentally disturbed individ-uals who, for no apparent reason, ‘snap’ (Ames, 2005;this tendency is sometimes referred to as ‘medicalizingmass murder’, see Krauthammer, 2009). The appearanceof senseless, random violence arises because the greatmajority of shooting rampages do not target specific indi-viduals. Social science research, however, suggests that
such attacks are not ‘random’ – school shootings areaimed at the entire school as an institution (Newman,2004: 261), whereas workplace rampages attack thecompany or the corporate culture (Ames, 2005: 19).As Mark Ames (2005: 19) noted, ‘there are no ‘‘random’’victims – everyone in the targeted company is guilty byassociation, or they are collateral damage. The goal is todestroy the company itself . . . .’ After 2000 an increasingnumber of rampages have been directed against stateinstitutions – most frequently, the police and the courts,but sometimes such prominent symbols of the govern-ment as the Pentagon and the Capitol.
Thus, the ‘random’ appearance of this type of violencearises from the application of the principle of social sub-stitutability/fungibility of the victim referred to abovein the context of assassination. These considerationssuggest that shooting rampages are a form of terrorism.In fact, it is a kind of suicide terrorism (Atran, 2003;Gambetta, 2005; Pape, 2005) because in a large pro-portion of mass shootings the perpetrators are killedby the police or shoot themselves. The survivors areinvariably apprehended (or turn themselves in) and areimprisoned for life. As a result, killing rampages resultin either physical or social death of the shooter. Theonly difference between a rampage shooter and a sui-cide bomber is in the weapon used to kill. Both aim notat individual people but at groups, social or politicalinstitutions, or entire societies.
The major rampage subtypes in the database include(1) workplace rampages, (2) school (including universi-ties) rampages, and (3) attacks on government agents orinstitutions (coded as political rampages). Less frequentsubtypes include rampages directed against a racial orethnic group, and those attacking religious institutions.On the other hand, I did not include in the databaseincidences of multiple murder directed against familymembers, killing sprees perpetrated by current or for-mer inmates of mental institutions, and mass murderresulting from crime, such as bank robberies, organg disputes.
Constructing the databaseDatabase construction relied primarily on two methods:(1) digitizing and merging data collected by previousresearchers, and (2) systematic searches of electronicmedia archives. The first source that I used was the data-base of political violence events in the United Statesbetween 1819 and 1968, compiled by the Inter-University Consortium for Political and Social Research(ICPSR) (Levy, 1991). To extend the temporal periodof the ICPSR database I used Lexis/Nexis to search the
Turchin 7
at UNIV OF CONNECTICUT on July 16, 2012jpr.sagepub.comDownloaded from
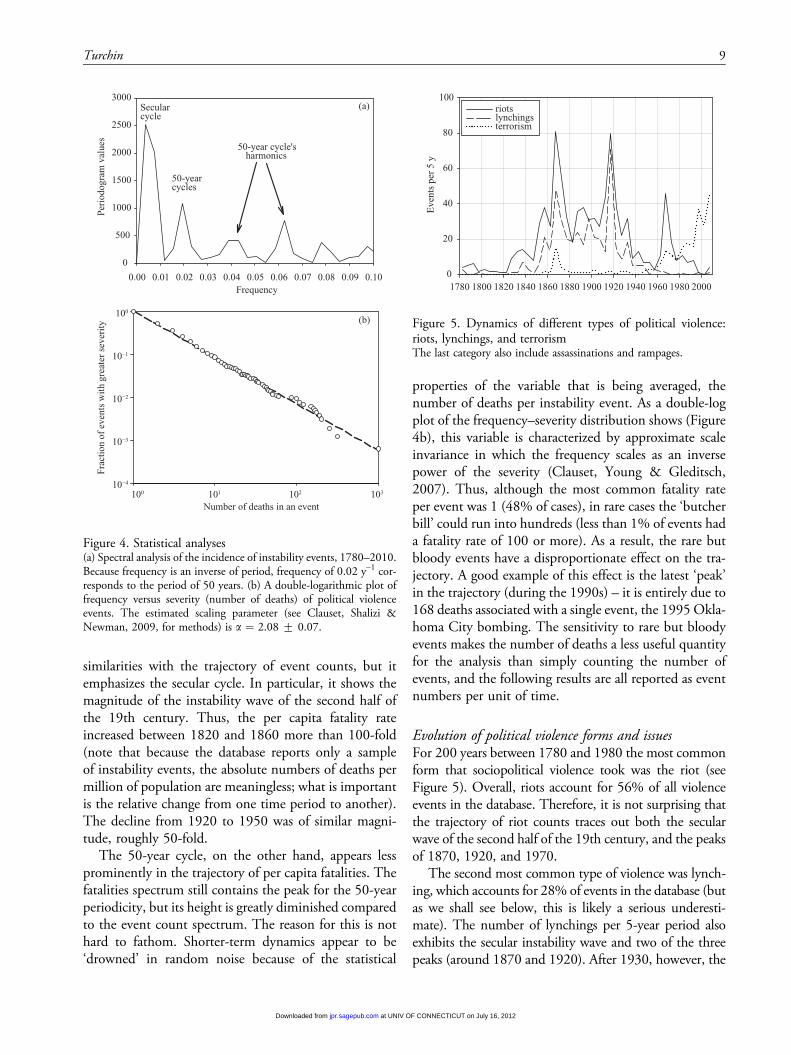
New York Times for the period of 1969 to 2010 foroccurrence of the keyword riot in the headline. The sec-ond database was compiled by the historian Paul Giljefor his book on American riots (Gilje, 1996). A detaileddescription of the methods I used in compiling the datais given in Appendix I, which also lists the secondarysources I checked on specific types of political violence.
These sources did not search for political violenceevents in a systematic or randomized manner over thewhole period of interest. As a result, we should expectseveral biases that would affect the probability of aninstability event being identified by one of the sourcesand therefore becoming an entry in the USPV database.As a check on the American Riots database (Gilje, 1996),which provided the bulk of data for the USPV database, Iran a computerized search of the electronic database Pro-Quest Historical Newspapers using Hartford Courantbecause it was the only newspaper that was digitizedby ProQuest to the beginning of my period, 1780 (fordetails, see Appendix I).
Dynamical patterns of political instability
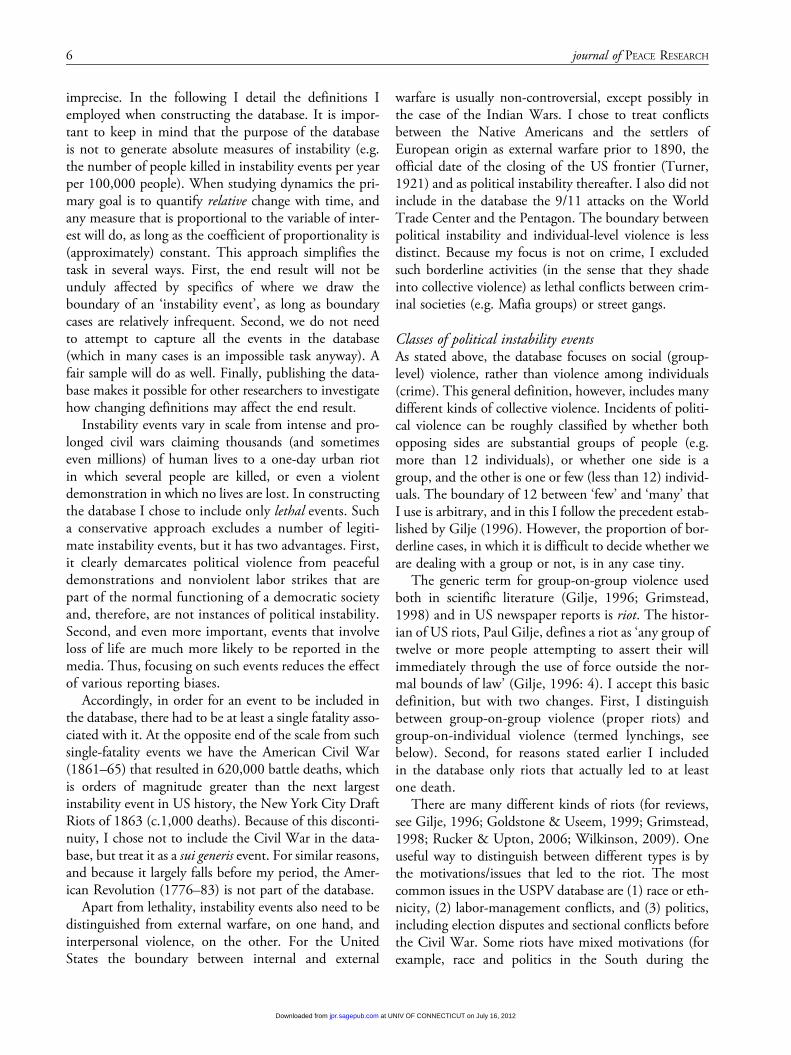
Overall dynamicsThe USPV database includes 1,590 unique instabilityevents. On average there are 35 events per 5-year inter-val, but these events are distributed highly unevenlythrough time (see Figure 3a). The period between1780 and 1825 was characterized by a declining trendin political violence. While the post-revolutionary erasaw several significant incidents (Pennamite-YankeeWar, Shays’ and Whiskey rebellions), these aftershocksof the Revolutionary War died out by 1800, and thefirst quarter of the 19th century was a remarkablypeaceful period in US history. The second quarter ofthe century, on the other hand, was a period of risingpolitical turbulence. The first spurt occurred during the1830s, but the highest level of political violence wasachieved during the 1860s.
From 1860 to 1920, the level of violence fluctuatedaround a very high level, with another spurt during the1910s. The period between 1920 and 1960, however, sawa declining trend in instability. The 1940s and 1950s werethe second peaceful period in US history. After 1960 thelevel of political violence began rising again.
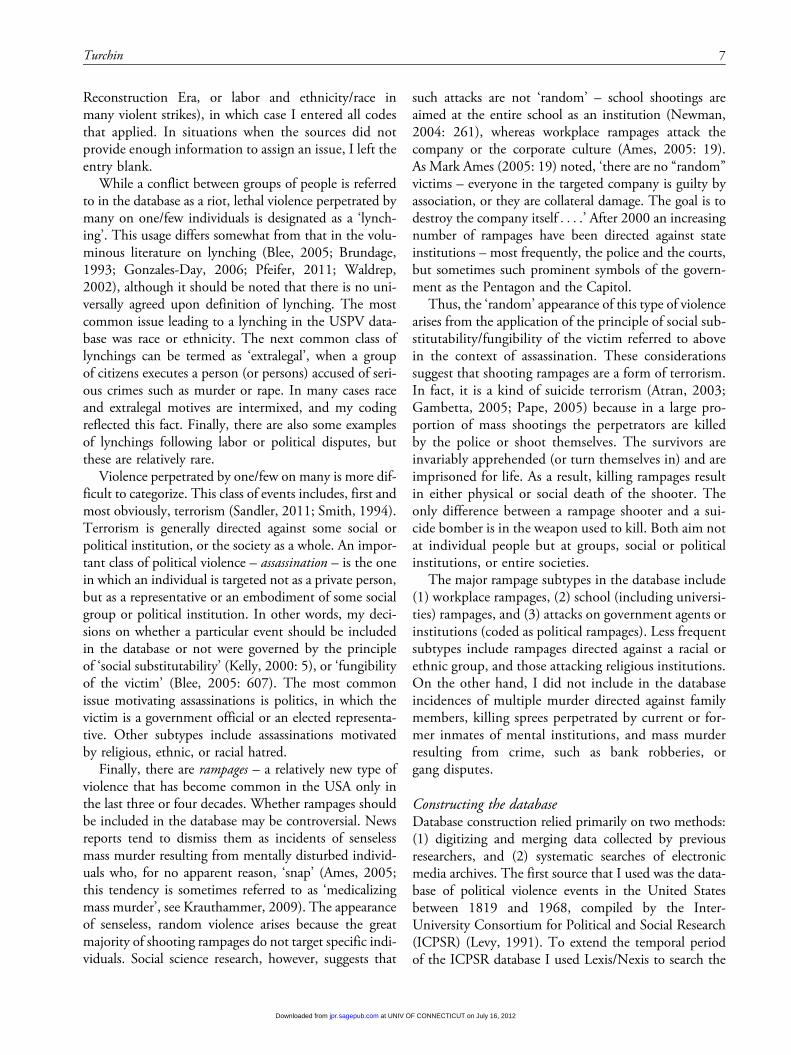
Spectral analysis suggests that there are two majorrhythms underlying the dynamics shown in Figure 3a.The first peak in the spectrum (with a period of roughly150 years) indicates a long-term, or secular cycle (seeFigure 4a). One complete oscillation was observedbetween roughly 1800 and 1950, and the rising trend
after 1960 may indicate the beginning of the next secularcycle. The second peak in the spectrum is associated witha period of c.50 years (Figure 4a). Other, smaller peaks atfrequencies of 0.04, 0.06, etc. are probably the harmo-nics of the 50-year cycle (because they are multiples ofthe frequency 0.02 y–1). If so, these frequencies capturethe deviations of the shape of the sharply peaked 50-yearoscillation from a smooth sinusoid wave. The 50-yearcycle is observed in the prominent outbreaks of politicalviolence around 1870, 1920, and 1970. The smallerspurt during the 1830s may or may not be part ofthis pattern. Interestingly, the American Revolution(1775–83) also appears to fit this sequence.
An alternative method for visualizing the dynamics ofinstability is to focus not on the number of political vio-lence events, but on the number of people killed in suchevents, scaled by the total population of the UnitedStates (see Figure 3b). This view of the data shares many
(a) Instability events per 5 y
Eve
nts
per
5 y
0
20
40
60
80
100
120
140
160
(b) Fatalities per 1 million population per 5 y
Fata
litie
s pe
r 1
mill
ion
0.1
1
10
100
1780 1800 1820 1840 1860 1880 1900 1920 1940 1960 1980 2000
1780 1800 1820 1840 1860 1880 1900 1920 1940 1960 1980 2000
Figure 3. Temporal dynamics of sociopolitical instability inthe United States, 1780–2010: (a) Fluctuations in the numberof instability events per 5-year intervals, (b) Number of peoplekilled in instability events per 1 million population per 5 years
8 journal of PEACE RESEARCH
at UNIV OF CONNECTICUT on July 16, 2012jpr.sagepub.comDownloaded from
similarities with the trajectory of event counts, but itemphasizes the secular cycle. In particular, it shows themagnitude of the instability wave of the second half ofthe 19th century. Thus, the per capita fatality rateincreased between 1820 and 1860 more than 100-fold(note that because the database reports only a sampleof instability events, the absolute numbers of deaths permillion of population are meaningless; what is importantis the relative change from one time period to another).The decline from 1920 to 1950 was of similar magni-tude, roughly 50-fold.
The 50-year cycle, on the other hand, appears lessprominently in the trajectory of per capita fatalities. Thefatalities spectrum still contains the peak for the 50-yearperiodicity, but its height is greatly diminished comparedto the event count spectrum. The reason for this is nothard to fathom. Shorter-term dynamics appear to be‘drowned’ in random noise because of the statistical
properties of the variable that is being averaged, thenumber of deaths per instability event. As a double-logplot of the frequency–severity distribution shows (Figure4b), this variable is characterized by approximate scaleinvariance in which the frequency scales as an inversepower of the severity (Clauset, Young & Gleditsch,2007). Thus, although the most common fatality rateper event was 1 (48% of cases), in rare cases the ‘butcherbill’ could run into hundreds (less than 1% of events hada fatality rate of 100 or more). As a result, the rare butbloody events have a disproportionate effect on the tra-jectory. A good example of this effect is the latest ‘peak’in the trajectory (during the 1990s) – it is entirely due to168 deaths associated with a single event, the 1995 Okla-homa City bombing. The sensitivity to rare but bloodyevents makes the number of deaths a less useful quantityfor the analysis than simply counting the number ofevents, and the following results are all reported as eventnumbers per unit of time.
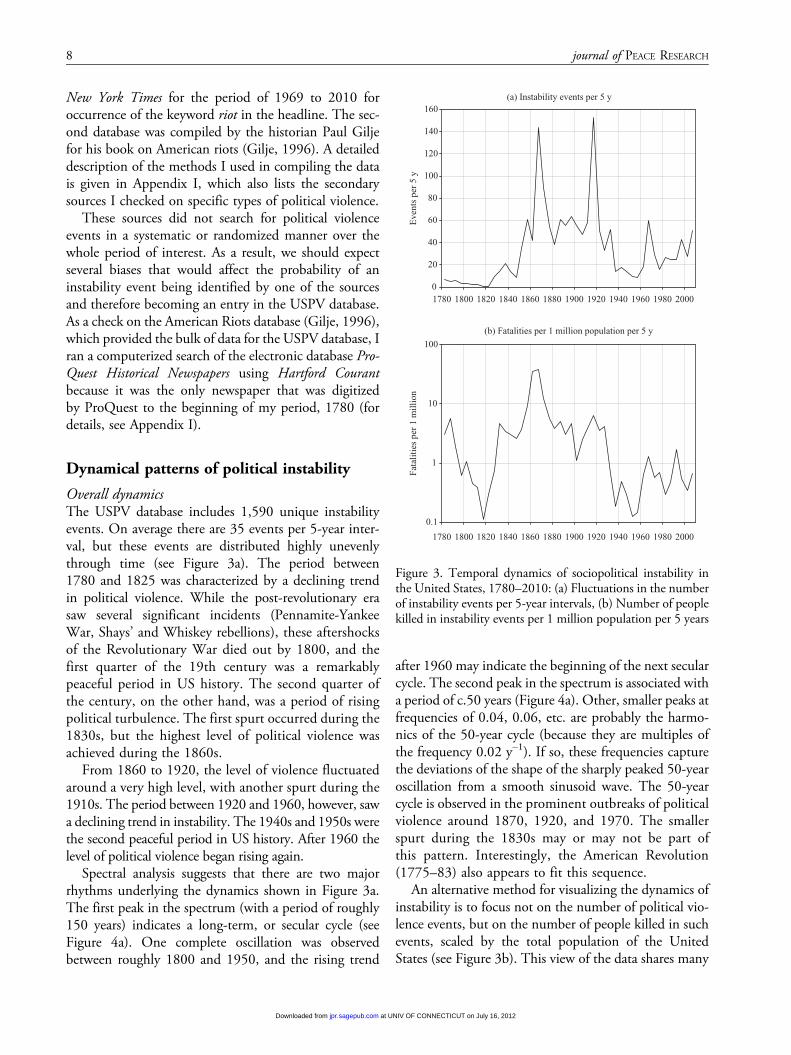
Evolution of political violence forms and issuesFor 200 years between 1780 and 1980 the most commonform that sociopolitical violence took was the riot (seeFigure 5). Overall, riots account for 56% of all violenceevents in the database. Therefore, it is not surprising thatthe trajectory of riot counts traces out both the secularwave of the second half of the 19th century, and the peaksof 1870, 1920, and 1970.
The second most common type of violence was lynch-ing, which accounts for 28% of events in the database (butas we shall see below, this is likely a serious underesti-mate). The number of lynchings per 5-year period alsoexhibits the secular instability wave and two of the threepeaks (around 1870 and 1920). After 1930, however, the
Eve
nts
per
5 y
0
20
40
60
80
100riotslynchingsterrorism
1780 1800 1820 1840 1860 1880 1900 1920 1940 1960 1980 2000
Figure 5. Dynamics of different types of political violence:riots, lynchings, and terrorismThe last category also include assassinations and rampages.
(b)
Number of deaths in an event100 101 102 103
Frac
tion
of e
vent
s w
ith g
reat
er s
ever
ity
10−4
10−3
10−2
10−1
100
(a)
Frequency0.10
Peri
odog
ram
val
ues
0
500
1000
1500
2000
2500
3000Secularcycle
50-yearcycles
50-year cycle'sharmonics
0.00 0.01 0.02 0.03 0.04 0.05 0.06 0.07 0.08 0.09
Figure 4. Statistical analyses(a) Spectral analysis of the incidence of instability events, 1780–2010.Because frequency is an inverse of period, frequency of 0.02 y–1 cor-responds to the period of 50 years. (b) A double-logarithmic plot offrequency versus severity (number of deaths) of political violenceevents. The estimated scaling parameter (see Clauset, Shalizi &Newman, 2009, for methods) is a ¼ 2.08 + 0.07.
Turchin 9
at UNIV OF CONNECTICUT on July 16, 2012jpr.sagepub.comDownloaded from
incidence of lynchings rapidly declined. In more recenttimes this form of political violence has become rare.
The third form of political violence, terrorism in thebroad sense (which also includes assassinations andshooting rampages), shows a somewhat different pattern.There is a peak around 1870, primarily associated withthe wave of assassinations targeting both black and whiteRepublican politicians during the Reconstruction Era(post-Civil War period). The next peak around 1970 isassociated with assassinations of political leaders and thefirst mass appearance of the shooting rampage. The post-1980 rise is partly due to the increase in traditional formsof terrorism, but mainly is a result of the current wave ofshooting rampages.
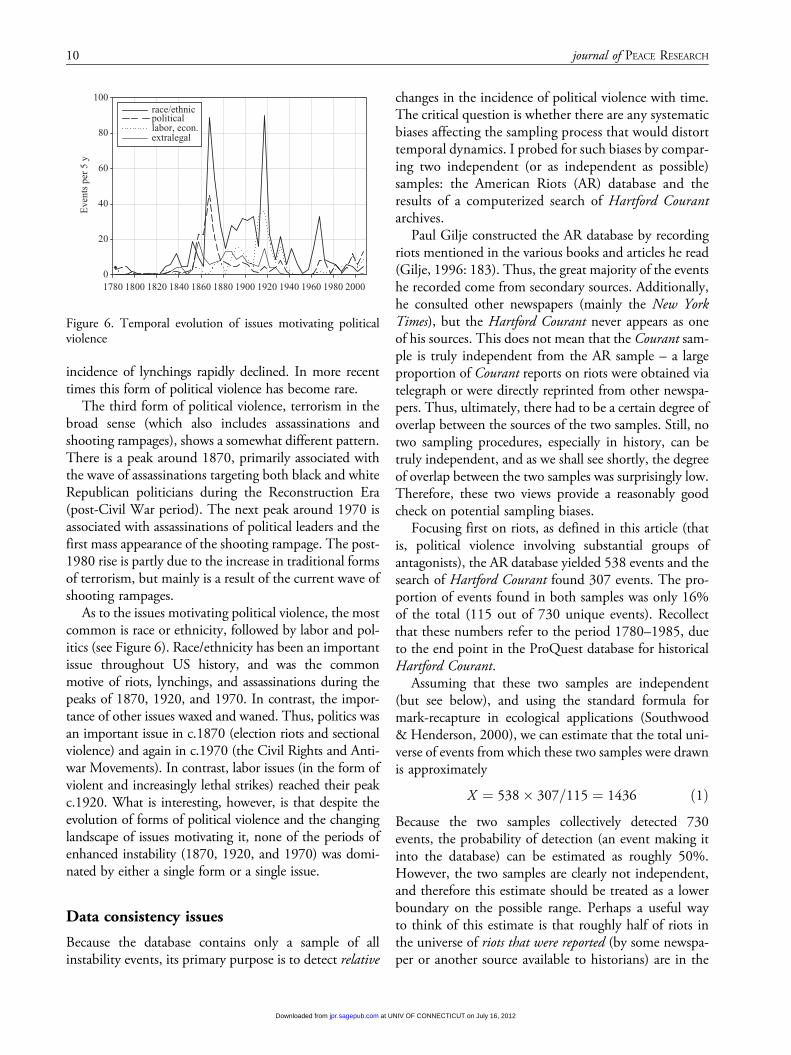
As to the issues motivating political violence, the mostcommon is race or ethnicity, followed by labor and pol-itics (see Figure 6). Race/ethnicity has been an importantissue throughout US history, and was the commonmotive of riots, lynchings, and assassinations during thepeaks of 1870, 1920, and 1970. In contrast, the impor-tance of other issues waxed and waned. Thus, politics wasan important issue in c.1870 (election riots and sectionalviolence) and again in c.1970 (the Civil Rights and Anti-war Movements). In contrast, labor issues (in the form ofviolent and increasingly lethal strikes) reached their peakc.1920. What is interesting, however, is that despite theevolution of forms of political violence and the changinglandscape of issues motivating it, none of the periods ofenhanced instability (1870, 1920, and 1970) was domi-nated by either a single form or a single issue.
Data consistency issues
Because the database contains only a sample of allinstability events, its primary purpose is to detect relative
changes in the incidence of political violence with time.The critical question is whether there are any systematicbiases affecting the sampling process that would distorttemporal dynamics. I probed for such biases by compar-ing two independent (or as independent as possible)samples: the American Riots (AR) database and theresults of a computerized search of Hartford Courantarchives.
Paul Gilje constructed the AR database by recordingriots mentioned in the various books and articles he read(Gilje, 1996: 183). Thus, the great majority of the eventshe recorded come from secondary sources. Additionally,he consulted other newspapers (mainly the New YorkTimes), but the Hartford Courant never appears as oneof his sources. This does not mean that the Courant sam-ple is truly independent from the AR sample – a largeproportion of Courant reports on riots were obtained viatelegraph or were directly reprinted from other newspa-pers. Thus, ultimately, there had to be a certain degree ofoverlap between the sources of the two samples. Still, notwo sampling procedures, especially in history, can betruly independent, and as we shall see shortly, the degreeof overlap between the two samples was surprisingly low.Therefore, these two views provide a reasonably goodcheck on potential sampling biases.
Focusing first on riots, as defined in this article (thatis, political violence involving substantial groups ofantagonists), the AR database yielded 538 events and thesearch of Hartford Courant found 307 events. The pro-portion of events found in both samples was only 16%of the total (115 out of 730 unique events). Recollectthat these numbers refer to the period 1780–1985, dueto the end point in the ProQuest database for historicalHartford Courant.
Assuming that these two samples are independent(but see below), and using the standard formula formark-recapture in ecological applications (Southwood& Henderson, 2000), we can estimate that the total uni-verse of events from which these two samples were drawnis approximately
X ¼ 538� 307=115 ¼ 1436 ð1ÞBecause the two samples collectively detected 730events, the probability of detection (an event making itinto the database) can be estimated as roughly 50%.However, the two samples are clearly not independent,and therefore this estimate should be treated as a lowerboundary on the possible range. Perhaps a useful wayto think of this estimate is that roughly half of riots inthe universe of riots that were reported (by some newspa-per or another source available to historians) are in the
Eve
nts
per
5 y
0
20
40
60
80
100race/ethnicpoliticallabor, econ.extralegal
1780 1800 1820 1840 1860 1880 1900 1920 1940 1960 1980 2000
Figure 6. Temporal evolution of issues motivating politicalviolence
10 journal of PEACE RESEARCH
at UNIV OF CONNECTICUT on July 16, 2012jpr.sagepub.comDownloaded from
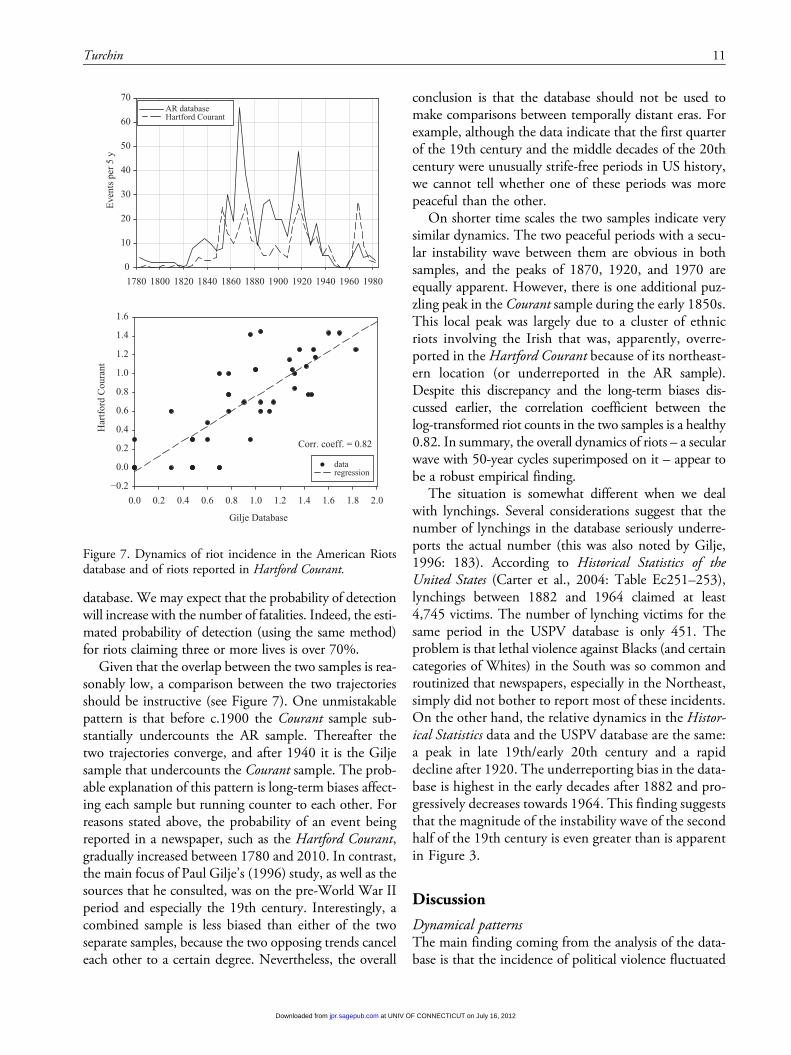
database. We may expect that the probability of detectionwill increase with the number of fatalities. Indeed, the esti-mated probability of detection (using the same method)for riots claiming three or more lives is over 70%.
Given that the overlap between the two samples is rea-sonably low, a comparison between the two trajectoriesshould be instructive (see Figure 7). One unmistakablepattern is that before c.1900 the Courant sample sub-stantially undercounts the AR sample. Thereafter thetwo trajectories converge, and after 1940 it is the Giljesample that undercounts the Courant sample. The prob-able explanation of this pattern is long-term biases affect-ing each sample but running counter to each other. Forreasons stated above, the probability of an event beingreported in a newspaper, such as the Hartford Courant,gradually increased between 1780 and 2010. In contrast,the main focus of Paul Gilje’s (1996) study, as well as thesources that he consulted, was on the pre-World War IIperiod and especially the 19th century. Interestingly, acombined sample is less biased than either of the twoseparate samples, because the two opposing trends canceleach other to a certain degree. Nevertheless, the overall
conclusion is that the database should not be used tomake comparisons between temporally distant eras. Forexample, although the data indicate that the first quarterof the 19th century and the middle decades of the 20thcentury were unusually strife-free periods in US history,we cannot tell whether one of these periods was morepeaceful than the other.
On shorter time scales the two samples indicate verysimilar dynamics. The two peaceful periods with a secu-lar instability wave between them are obvious in bothsamples, and the peaks of 1870, 1920, and 1970 areequally apparent. However, there is one additional puz-zling peak in the Courant sample during the early 1850s.This local peak was largely due to a cluster of ethnicriots involving the Irish that was, apparently, overre-ported in the Hartford Courant because of its northeast-ern location (or underreported in the AR sample).Despite this discrepancy and the long-term biases dis-cussed earlier, the correlation coefficient between thelog-transformed riot counts in the two samples is a healthy0.82. In summary, the overall dynamics of riots – a secularwave with 50-year cycles superimposed on it – appear tobe a robust empirical finding.
The situation is somewhat different when we dealwith lynchings. Several considerations suggest that thenumber of lynchings in the database seriously underre-ports the actual number (this was also noted by Gilje,1996: 183). According to Historical Statistics of theUnited States (Carter et al., 2004: Table Ec251–253),lynchings between 1882 and 1964 claimed at least4,745 victims. The number of lynching victims for thesame period in the USPV database is only 451. Theproblem is that lethal violence against Blacks (and certaincategories of Whites) in the South was so common androutinized that newspapers, especially in the Northeast,simply did not bother to report most of these incidents.On the other hand, the relative dynamics in the Histor-ical Statistics data and the USPV database are the same:a peak in late 19th/early 20th century and a rapiddecline after 1920. The underreporting bias in the data-base is highest in the early decades after 1882 and pro-gressively decreases towards 1964. This finding suggeststhat the magnitude of the instability wave of the secondhalf of the 19th century is even greater than is apparentin Figure 3.
Discussion
Dynamical patternsThe main finding coming from the analysis of the data-base is that the incidence of political violence fluctuated
Eve
nts
per
5 y
0
10
20
30
40
50
60
70AR databaseHartford Courant
Gilje Database
2.0
Har
tfor
d C
oura
nt
−0.2
0.0
0.2
0.4
0.6
0.8
1.0
1.2
1.4
1.6
dataregression
Corr. coeff. = 0.82
1780 1800 1820 1840 1860 1880 1900 1920 1940 1960 1980
0.0 0.2 0.4 0.6 0.8 1.0 1.2 1.4 1.6 1.8
Figure 7. Dynamics of riot incidence in the American Riotsdatabase and of riots reported in Hartford Courant.
Turchin 11
at UNIV OF CONNECTICUT on July 16, 2012jpr.sagepub.comDownloaded from
dramatically in the USA between 1780 and 2010.Furthermore, the dynamical pattern revealed by thedata, a secular wave with 50-year (bigenerational) cyclessuperimposed on it, was similar to that observed forhistorical societies.
During the second half of the 19th century theUnited States experienced a massive wave of sociopoliti-cal instability. From 1820 to 1860 the estimated numberof deaths due to political violence, scaled by the totalpopulation, increased c.100-fold. From 1860 to 1920instability remained at high levels. However, during thethree decades after 1920 it declined c.50-fold.
In addition to this secular wave, the dynamics ofinstability exhibited shorter-term peaks, recurring witha period of approximately 50 years. These instabilitypeaks were not dominated by a single issue, and the vio-lence took multiple forms, suggesting that they werecaused by fundamental social forces affecting the USpolity. For example, political violence in the antebellumUSA included a slave rebellion, a massive wave of urbanriots, a prelude to the Civil War in Kansas (‘BleedingKansas’), and even a religious war (against the Mormons).This explosion of political violence crested with the Amer-ican Civil War, the bloodiest war in the history of theUSA, which was followed by racial and political conflictsin the South and vigilante violence in the West.
Political violence in the years around 1920 similarlytook multiple forms and was motivated by diverse issues.During the Red Summer of 1919 there were no fewerthan 26 major race riots that collectively caused morethan 1,000 fatalities. This was also a period of intenseclass warfare, with labor strikes becoming increasinglymore violent. To give just one example, the Battle ofBlair Mountain in West Virginia in 1921 was the largestorganized armed uprising in US labor history (it was alsothe only time in US history when the government usedmilitary aircraft against its own people). Elite insecuritywas further aroused by the terror campaign conductedby Italian anarchists and by electoral challenges from thepopulists and socialists. The widespread belief among theelites during the Red Scare of 1917–21 that the countrywas on the brink of revolution was not just paranoia. Theincidence of political violence events more than doubledduring this period even above the already elevated levelcharacterizing the secular instability wave (see Figure 3a).
The last clearly defined peak around 1970 was alsodue to a variety of incidents: urban riots and violentcampus demonstrations, political assassinations, andterrorism. However, the level of violence achieved dur-ing this peak was much milder than that during the pre-vious peaks.
Extending the sequence of 1870, 1920, and 1970forward suggests that the next instability peak shouldoccur in the United States around 2020. This is a simpleprojection, rather than a scientific prediction (whichrequires an understanding of mechanisms bringing aboutoutbreaks of political violence; see Turchin, 2006a). Theanalysis of structural causes of instability waves is beyondthe scope of this article and will be pursued elsewhere(Turchin, forthcoming). However, an examination ofthe empirical trends in the data suggests that the periodsince the 1950s has been characterized by a generalupward tendency, albeit with significant up-and-downfluctuations (see Figure 3).
The dominant component of the rising trend duringthe last three decades was terrorism (Figure 5), both in itsclassical form and especially in a novel form of suicideterrorism, the killing rampage. As I discussed earlier, thebroad significance of the ongoing explosion in the inci-dence of shooting rampages is still in question. If theseviolent incidents are a surface reflection of deeper socialshifts taking place in the United States, then they consti-tute a truly worrying sign of troubles to come. Accordingto this interpretation, the trajectory is on track towardsanother instability peak. In that case, rampages shouldeventually be joined by other forms of political violence,since multiple forms of instability was the pattern in allprevious peaks. An alternative hypothesis is that the out-break of shooting rampages will eventually fizzle out.Although they will, obviously, have a huge impact on thelives of thousands of individuals directly involved as per-petrators or victims, there will be no comparable impacton society as a whole. The next decade will show whichof these alternatives is correct.
A preliminary test of the structural-demographicpredictionsThe observation that the dynamics of sociopoliticalinstability in the United States are governed by broadlythe same rhythms that affected historical agrarian soci-eties (secular waves and bigenerational cycles) suggeststhat similar mechanisms generated these dynamics inboth cases. In the section ‘From agrarian to industrialsocieties’, I sketched an outline of how the structural-demographic theory can be adapted to changes result-ing from the industrial revolution. This theory makesquantitative predictions that can be empirically testedwith the US data.
A proper test of the theory would require much morespace than is available in a journal publication, and Idefer the full description of the results to a future publi-cation (Turchin, forthcoming). Here, however, it is
12 journal of PEACE RESEARCH
at UNIV OF CONNECTICUT on July 16, 2012jpr.sagepub.comDownloaded from
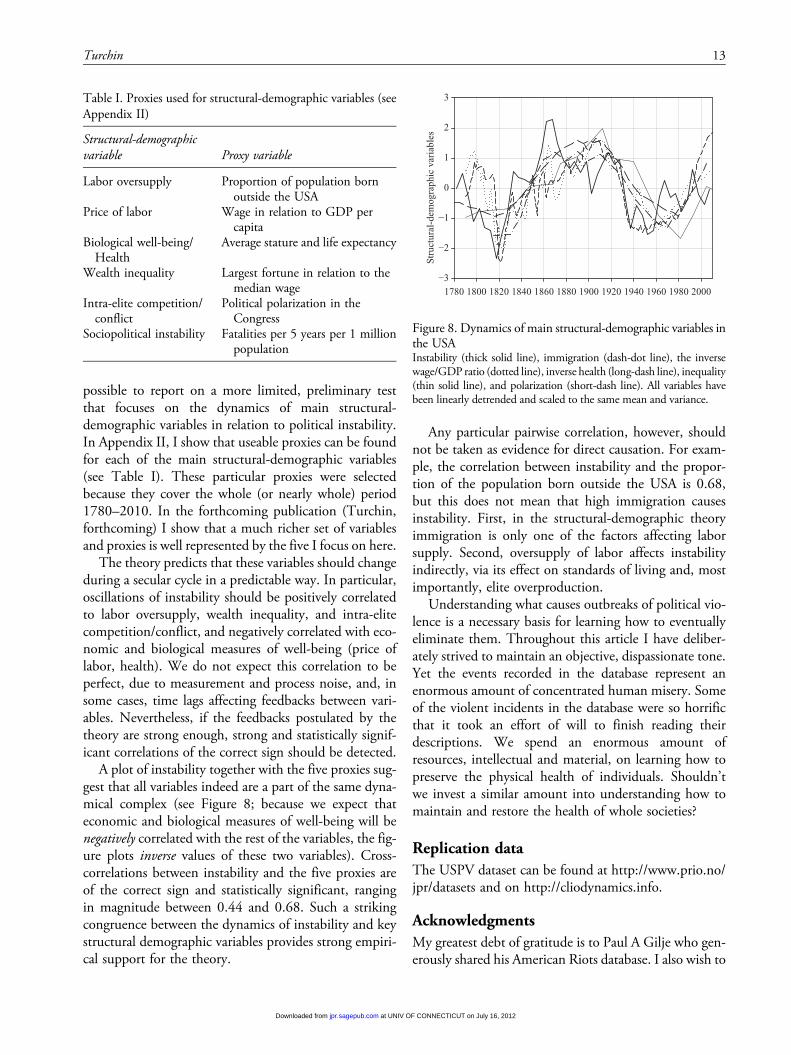
possible to report on a more limited, preliminary testthat focuses on the dynamics of main structural-demographic variables in relation to political instability.In Appendix II, I show that useable proxies can be foundfor each of the main structural-demographic variables(see Table I). These particular proxies were selectedbecause they cover the whole (or nearly whole) period1780–2010. In the forthcoming publication (Turchin,forthcoming) I show that a much richer set of variablesand proxies is well represented by the five I focus on here.
The theory predicts that these variables should changeduring a secular cycle in a predictable way. In particular,oscillations of instability should be positively correlatedto labor oversupply, wealth inequality, and intra-elitecompetition/conflict, and negatively correlated with eco-nomic and biological measures of well-being (price oflabor, health). We do not expect this correlation to beperfect, due to measurement and process noise, and, insome cases, time lags affecting feedbacks between vari-ables. Nevertheless, if the feedbacks postulated by thetheory are strong enough, strong and statistically signif-icant correlations of the correct sign should be detected.
A plot of instability together with the five proxies sug-gest that all variables indeed are a part of the same dyna-mical complex (see Figure 8; because we expect thateconomic and biological measures of well-being will benegatively correlated with the rest of the variables, the fig-ure plots inverse values of these two variables). Cross-correlations between instability and the five proxies areof the correct sign and statistically significant, rangingin magnitude between 0.44 and 0.68. Such a strikingcongruence between the dynamics of instability and keystructural demographic variables provides strong empiri-cal support for the theory.
Any particular pairwise correlation, however, shouldnot be taken as evidence for direct causation. For exam-ple, the correlation between instability and the propor-tion of the population born outside the USA is 0.68,but this does not mean that high immigration causesinstability. First, in the structural-demographic theoryimmigration is only one of the factors affecting laborsupply. Second, oversupply of labor affects instabilityindirectly, via its effect on standards of living and, mostimportantly, elite overproduction.
Understanding what causes outbreaks of political vio-lence is a necessary basis for learning how to eventuallyeliminate them. Throughout this article I have deliber-ately strived to maintain an objective, dispassionate tone.Yet the events recorded in the database represent anenormous amount of concentrated human misery. Someof the violent incidents in the database were so horrificthat it took an effort of will to finish reading theirdescriptions. We spend an enormous amount ofresources, intellectual and material, on learning how topreserve the physical health of individuals. Shouldn’twe invest a similar amount into understanding how tomaintain and restore the health of whole societies?
Replication dataThe USPV dataset can be found at http://www.prio.no/jpr/datasets and on http://cliodynamics.info.
AcknowledgmentsMy greatest debt of gratitude is to Paul A Gilje who gen-erously shared his American Riots database. I also wish to
Table I. Proxies used for structural-demographic variables (seeAppendix II)
Structural-demographicvariable Proxy variable
Labor oversupply Proportion of population bornoutside the USA
Price of labor Wage in relation to GDP percapita
Biological well-being/Health
Average stature and life expectancy
Wealth inequality Largest fortune in relation to themedian wage
Intra-elite competition/conflict
Political polarization in theCongress
Sociopolitical instability Fatalities per 5 years per 1 millionpopulation
Stru
ctur
al-d
emog
raph
ic v
aria
bles
−3
−2
−1
0
1
2
3
1780 1800 1820 1840 1860 1880 1900 1920 1940 1960 1980 2000
Figure 8. Dynamics of main structural-demographic variables inthe USAInstability (thick solid line), immigration (dash-dot line), the inversewage/GDP ratio (dotted line), inverse health (long-dash line), inequality(thin solid line), and polarization (short-dash line). All variables havebeen linearly detrended and scaled to the same mean and variance.
Turchin 13
at UNIV OF CONNECTICUT on July 16, 2012jpr.sagepub.comDownloaded from
thank my research assistant Ryan Jones, who put ininnumerable hours entering data. I thank Paul A Giljeand Kristian Skrede Gleditsch for valuable feedback ona previous version of the manuscript, and Aaron Clausetfor his help in estimating the scaling parameter for thepower law distribution in Figure 4b.
FundingThe construction of the database was made possible byfunds provided by the Santa Fe Institute and the Univer-sity of Connecticut.
ReferencesAmes, Mark (2005) Going Postal: Rage, Murder, and Rebellion
from Reagan’s Workplaces to Clinton’s Columbine andBeyond. Brooklyn, NY: Soft Skull.
Atran, Scott (2003) Genesis of suicide terrorism. Science299(5612): 1534–1539.
Blee, Kathleen M (2005) Racial violence in the United States.Ethnic and Racial Studies 28(4): 599–619.
Borjas, George J (2009) The analytics of the wage effect ofimmigration (March 2009). NBER Working Paper Seriesno. w14796.
Brundage, W Fitzhugh (1993) Lynching in the New South:Georgia and Virginia, 1880–1930. Champaign, IL: Univer-sity of Illinois Press.
Carter, Susan B; Scott Sigmund Gartner, Michael R Haines,Alan L Olmstead, Richard Sutch & Gavin Wright, eds(2004) Historical Statistics of the United States: MillennialEdition. New York: Cambridge University Press.
Clauset, Aaron; Maxwell Young & Kristian Skrede Gleditsch(2007) On the frequency of severe terrorist events. Journalof Conflict Resolution 51(1): 58–87.
Clauset, Aaron; Cosma R Shalizi & MEJ Newman (2009)Power-law distributions in empirical data. SIAM Review51(4): 661–703.
Gambetta, Diego, ed. (2005) Making Sense of Suicide Missions.New York: Oxford University Press.
Gilje, Paul A (1996) Rioting in America. Bloomington, IN:Indiana University Press.
Goldstone, Jack A (1991) Revolution and Rebellion in the EarlyModern World. Berkeley, CA: University of California Press.
Goldstone, Jack A & Bert Useem (1999) Prison riots as micro-revolutions: An extension of state-centered theories of rev-olution. American Journal of Sociology 104(4): 985–1029.
Goldstone, Jack A; Robert H Bates, David L Epstein, TedRobert Gurr, Michael B Lustick, Monty G Marshal, JayUlfelder & Mark Woodward (2010) A global model forforecasting political instability. American Journal of PoliticalScience 54(1): 190–208.
Gonzales-Day, Ken (2006) Lynching in the West: 1850–1935.Durham, NC: Duke University Press.
Grimstead, David (1998) American Mobbing, 1828–1861:Towards Civil War. New York: Oxford University Press.
Hamdan, Sara (2011) Jobs and age reign as risk factors formideast uprisings. New York Times, 2 February.
Kelly, Raymond C (2000) Warless Societies and the Origin ofWar. Ann Arbor, MI: University of Michigan Press.
Kiser, Edgar & April Linton (2002) The hinges of history:State-making and revolt in early modern France. AmericanSociological Review 67(6): 889–910.
Korotayev, Andrey; Artemy Malkov & Daria Khaltourina(2006) Introduction to Social Macrodynamics: Secular Cyclesand Millennial Trends. Moscow: URSS.
Krauthammer, Charles (2009) Medicalizing mass murder.Washington Post, 13 November.
Lacina, Bethany & Nils Petter Gleditsch (2005) Monitoringtrends in global conflict: A new dataset of battle deaths.European Journal of Population 21(2): 145–166.
Lee, JS (1931) The periodic recurrence of internecine wars inChina. China Journal (March–April): 111–163.
Levy, Sheldon G (1991) Political violence in the United States,1819–1968. Computer file. Ann Arbor, MI: Inter-UniversityConsortium for Political and Social Research.
Lieberman, Victor (2003) Strange Parallels: Southeast Asiain Global Context, c.800–1830. Volume I: Integrationon the Mainland. Cambridge: Cambridge UniversityPress.
Nefedov, Sergey (1999) The method of demographic cycles ina study of socioeconomic history of preindustrial society.PhD dissertaion, Ekaterinburg University (in Russian).Ekaterinburg, Russia.
Newman, Katherine S (2004) Rampage: The Social Roots ofSchool Shootings. New York: Basic Books.
Pape, Robert A (2005) Dying to Win: The Strategic Logic of Sui-cide Terrorism. New York: Random House.
Pfeifer, Michael J (2011) The Roots of Rough Justice: Origins ofAmerican Lynching. Champaign, IL: University of IllinoisPress.
Rucker, Walter & James Nathaniel Upton, eds (2006)Encyclopedia of American Race Riots. Westport, CT:Greenwood.
Sandler, Todd (2011) New frontiers of terrorism research:An introduction. Journal of Peace Research 48(3):279–286.
Schlesinger, Arthur M, Jr (1986) The Cycles of American His-tory. Boston, MA: Houghton Mifflin.
Smith, Brent L (1994) Terrorism in America: Pipe Bombs andPipe Dreams. Albany, NY: SUNY Press.
Sorokin, Pitirim A (1937) Social and Cultural Dynamics. Vol.III. Fluctuations of Social Relationships, War, and Revolution.New York: American Book Company.
Southwood, T. Richard E & Peter A Henderson (2000) Eco-logical Methods, 3rd edn. New York: Wiley.
Turchin, Peter (2003) Historical Dynamics: Why States Riseand Fall. Princeton, NJ: Princeton University Press.
Turchin, Peter (2005) Dynamical feedbacks between popula-tion growth and sociopolitical instability in agrarian states.Structure and Dynamics 1(1): article 3.
14 journal of PEACE RESEARCH
at UNIV OF CONNECTICUT on July 16, 2012jpr.sagepub.comDownloaded from
Turchin, Peter (2006a) Scientific prediction in historicalsociology: Ibn Khaldun meets Al Saud. In: Peter Turchin,Leonid Grinin, Andrey Korotayev & Victor C de Munck(eds) History and Mathematics: Historical Dynamics andDevelopment of Complex Societies. Moscow: URSS, 9–38.
Turchin, Peter (2006b) War and Peace and War: The LifeCycles of Imperial Nations. New York: Pi.
Turchin, Peter (2011) Wheels within wheels: Complexdynamics of political instability. Manuscript.
Turchin, Peter (forthcoming) A Demographic-StructuralAnalysis of American History, 1780–2010. Book inpreparation.
Turchin, Peter & Sergey Nefedov (2009) Secular Cycles. Prin-ceton, NJ: Princeton University Press.
Turner, FJ (1921) The Frontier in American History. NewYork: Holt.
Urdal, Henrik (2005) People vs. Malthus: Population pres-sure, environmental degradation, and armed conflict revis-ited. Journal of Peace Research 42(4): 417–434.
Urdal, Henrik (2006) A clash of generations? Youth bulgesand political violence. International Studies Quarterly50(3): 607–630.
Waldrep, Christopher (2002) The Many Faces of Judge Lynch:Extralegal Violence and Punishment in America. New York:Palgrave-Macmillan.
Wessel, David (2011) Arab world built colleges, but not jobs:Unemployment, broad among region’s angry youth, is highamong educated. New York Times, 4 February.
Wilkinson, Steven I (2009) Riots. Annual Review of PoliticalScience 12: 329–343.
PETER TURCHIN, b. 1957, PhD in Biology (DukeUniversity, 1985); Professor of Ecology and EvolutionaryBiology, University of Connecticut (1994– ); most recentbooks: War and Peace and War (Plume, 2005) and SecularCycles (Princeton University Press, 2009, coauthored withSergey Nefedov).
Turchin 15
at UNIV OF CONNECTICUT on July 16, 2012jpr.sagepub.comDownloaded from