Embed Size (px)
Citation preview
Dysplastic Nodules with Glypican-3 PositiveImmunostaining: A Risk for Early HepatocellularCarcinomaLi Gong1., Long-Xiao Wei2., Pin Ren1, Wen-Dong Zhang1, Xiao-Yan Liu1, Xiu-Juan Han1, Li Yao1, Shao-
Jun Zhu1, Miao Lan1, Yan-Hong Li1,3*, Wei Zhang1*
1 The Helmholtz Sino-German Laboratory for Cancer Research, Department of Pathology, Tangdu Hospital, The Fourth Military Medical University, Xi’an, P.R China,
2 Department of Nuclear Medicine, Tangdu Hospital, The Fourth Military Medical University, Xi’an, P.R China, 3 Department of Gynaecology and Obstetrics, Tangdu
Hospital, The Fourth Military Medical University, Xi’an, P.R China
Abstract
Glypican-3 (GPC3) has been reported to be a novel serum and histochemical marker for HCC. The positivity or negativity forGPC3 in hepatic precancerous lesions, such as dysplastic nodules (DN), has also been described. Moreover, our previousstudies have demonstrated that some DN in liver cirrhosis represent monoclonal hyperplasia, and confirmed their neoplasticnature. However, additional studies must be performed to investigate further the relationship between DN with GPC3positivity and HCC. Thus, we first investigated the expression of GPC3 in 136 HCC and 103 small DN (less than 1 cm indiameter) by immunohistochemical staining and determined the clonality of 81 DN from female patients using X-chromosome inactivation mosaicism and polymorphism of androgen receptor (AR) gene. Then we examined these samplesfor chromosomal loss of heterozygosity (LOH) at 11 microsatellite polymorphism sites. The results demonstrated that GPC3immunoreactivity was detected in 103 of 136 HCC (75.7%) and 19 of 103 DN (18.4%), and the positive ratio correlated withHBsAg positivity. Clonality assays showed that 15 GPC3-positive DN from female patients, including 12 high-grade DN(HGDN), and 28 (42.4%) of 66 GPC3-negative DN, were monoclonal. In addition, among 19 GPC3-positive DN, chromosomalLOH was found at loci D6S1008 (100%, 19/19), D8S262 (52.6%, 10/19) and D11S1301 (57.9%, 11/19). However, the LOHfrequency in GPC3-negative DN was 5.95% (5/84), 23.8% (20/84), and 4.76% (4/84) in three loci, respectively. Thus, weconcluded that GPC3-positive DN, especially GPC3-positive HGDN, was really a late premalignant lesion of HCC.
Citation: Gong L, Wei L-X, Ren P, Zhang W-D, Liu X-Y, et al. (2014) Dysplastic Nodules with Glypican-3 Positive Immunostaining: A Risk for Early HepatocellularCarcinoma. PLoS ONE 9(1): e87120. doi:10.1371/journal.pone.0087120
Editor: Ferruccio Bonino, University of Pisa, Italy
Received July 29, 2013; Accepted December 18, 2013; Published January 31, 2014
Copyright: � 2014 Gong et al. This is an open-access article distributed under the terms of the Creative Commons Attribution License, which permitsunrestricted use, distribution, and reproduction in any medium, provided the original author and source are credited.
Funding: The study was supported by the National Natural Science Foundation of China (No. 30800417; 30672013; 81372226), the National Basic ResearchProgram (973 Program) of China (No. 2009CB521705), and Shaanxi Province Innovation Project Co-ordinator (No. 2011KTCL03-11). The funders had no role instudy design, data collection and analysis, decision to publish, or preparation of the manuscript.
Competing Interests: The authors have declared that no competing interests exist.
* E-mail: [email protected] (WZ); [email protected] (Y-HL)
. These authors contributed equally to this work.
Introduction
Hepatocellular carcinoma (HCC) is the fifth most common
cancer and the third most common cause of cancer-related deaths
worldwide [1]. Up to 80% of HCCs develop in the setting of liver
cirrhosis related to hepatitis B and C virus infections. Different
lesions have been suggested to represent preneoplastic conditions
in human liver. They include dysplastic nodules (DNs) and
dysplastic foci (DF), which are further classified into large cell
change (LCC) and small cell change (SCC) [2], [3]. Whether both
of these types of lesions represent true precursor lesions and which
of these precursors is more closely related to HCC are intensely
debated. Mounting evidence suggests that SCC represents
precursor lesions that are more advanced than LCC in the course
of human hepatocarcinogenesis [4]. Both lesions contain shorter
telomeres compared with surrounding non-dysplastic hepatocytes
of cirrhosis, but only SCC shows a high prevalence of checkpoint
abrogation. The above data support the preneoplastic status of
SCC in human hepatocarcinogenesis.
DNs, including low grade dysplastic nodular (LGDN) and high
grade dysplastic nodular (HGDN), are distinctly nodular lesion
that differ from the surrounding liver parenchyma regarding size,
color, and texture. They are usually detected in cirrhotic livers,
and most of them measure about 1 cm in diameter. Histologically,
LGDN shows mild cytologic atypia and increase in cell density
with a monotonous pattern compared with that of cirrhotic
nodules. LCC may be found, but SCC is not present. HGDN
always shows a certain degree of cytological and architectural
atypia but insufficient for a diagnosis of malignancy. SCC is
frequently seen inside the nodule but LCC can also be detected.
The premalignant nature of DNs has been supported by some
evidences [5].
Regarding the occurrence of preneoplastic and neoplastic
nodules during hepatocarcinogenesis as described by Park [5],
these precancerous lesions develop gradually into early HCC
which corresponds to in situ or microinvasive carcinoma; and then
develop into progressive HCC through the stage of ‘‘nodule-in-
nodule’’-type HCC. In this line, we propose that surveillance of at-
PLOS ONE | www.plosone.org 1 January 2014 | Volume 9 | Issue 1 | e87120
risk cirrhotic population with special focus to their genetic changes
could aid in the earlier detection of HCC and may decrease its
morbidity and mortality rates.
Glypican-3 (GPC3) has been reported as a novel serum and
histochemical marker for HCC by several groups [6], [7], [8]. It is
an oncofetal protein and expressed abundantly in the fetal liver. It
is also inactive in the normal adult liver, and shows great promise
as an adjunct in the diagnosis of HCC. Positive immunostaining
for GPC3 has been reported in 52.5% to 85% of HCCs [9], [10],
[11], [12], [13], [14], [15], [16], [17], [18]. Simultaneously, the
positivity for GPC3 of DN has been reported [19], [20]. However,
it is not clear whether a few GPC3-positive nodules are indicative
of HCC and their molecular genetic changes.
Monoclonality is a major characteristic of most tumors. By
contrast, normal tissue and reactive hyperplasia are polyclonal. A
lesion, which is neoplasm or reactive hyperplasia, may be
determined by clonality assay based on X-chromosome inactiva-
tion mosaicism and polymorphism at the phosphoglycerate kinase
(PGK) and androgen receptor (AR) loci in female somatic cells. In
the previous studies, we ever examined the clonality of some small
DN (less than 1 cm in diameter) in liver cirrhosis, and the results
demonstrated that part of LGDN and all HGDN in liver cirrhosis
tissue represented monoclonal hyperplasia. The occurrence of
HGDN with SCC is a late event during DN progression and
considered to be a premalignant morphologic phenotype [21].
These observations further support the contention that DN is a
premalignant lesion of HCC.
In order to assess further the relationship between DN with
GPC3 immunostaining and HCC, we investigated the expression
of GPC3 in 136 cases of HCCs and 103 DN (including 30 HGDN
and 73 LGDN), and examined the clonality of DN from female
patients using X chromosome inactivation mosaicism and
polymorphism of androgen receptor (AR) genes in female somatic
cells, and observed the chromosomal loss of heterozygosity (LOH)
of all DN at 11 microsatellite loci.
Materials and Methods
2.1. Ethics StatementThe study protocol was approved by the Medical Ethics
Commission of the Fourth Military Medical University in Xi’an,
China. Written informed consent from all participants involved in
our study was obtained.
2.2. SamplesLiver tissue samples from 136 surgically resected HCC,
consisting of 128 cases with and 8 cases without clinical data,
were collected between January 2007 and December 2011 from
Tangdu Hospital, the Fourth Military Medical University (Xi’an,
China). Each case was examined by three pathologists and
diagnosed according to the World Health Organization Interna-
tional Histological Classification of Tumors. HCC samples were
graded according to Edmondson’s criteria. All samples were
surgically resected, fixed in 10 g/L neutral formalin, and
embedded in paraffin. Serial sections were stained with hematox-
ylin and eosin (H/E). 103 small DN (less than 1 cm in diameter),
including 81 from females and 22 from males, was classified
according to the criteria of the International Working Party.
Specifically, the morphological characteristics of LGDN are same
as that of so-called regenerative nodules. They usually show mild
increase in cell density with a monotonous pattern and/or clonal
changes composed of glycogen-storing clear cells and glycogen-
depleted amphophilic cells. LGDN may show bland cytologic but
not frank architectural atypia. LCC is frequently seen inside and
outside the nodules as microscopic dysplastic foci. HGDN is
composed of glycogen-storing clear cells and basophilic cells, and
shows an increased cell density, a certain degree of cytological and
architectural atypia, but insufficient for a diagnosis of malignancy.
SCC is frequently seen inside the nodule.
2.3. ImmunohistochemistrySections (4-mm thick) from a representative block from each case
were deparaffinized, rehydrated in graded alcohols, incubated
with H2O2 to block the activity of endogenous peroxidases; and
then subjected to heat-induced epitope retrieval in 0.1 mol/L
citrate buffer at pH 6.0 in a microwave for 20 minutes. The slides
were then incubated with a primary monoclonal antibody specific
for GPC3 (dilution, 1:200, Maixin Ltd Company, Fuzhou, China)
for 2 hours at room temperature. After incubation with a rabbit
anti-mouse secondary antibody, a subsequent reaction was
performed using a biotin-free horse-radish peroxidase enzyme-
labeled polymer and visualized using the EnVision plus detection
system. The chromogen 3,39-diaminobenzidine (Dako) was used
and sections were counterstained with hematoxylin. Placental
tissues were used as positive controls. Nonspecific IgG was used as
a negative control.
The GPC3 staining was considered positive when the granular
brown reaction was found in the cytoplasm and/or the
membranes. Therefore, each case was observed by three
pathologists. In detail, immunoreactivity was determined semi-
quantitatively by examining fields (magnification, 6200). Using a
(0–3+) scale, the staining was described as 0 staining (negative), 1+staining (,10% of cells), 2+staining (10%–25% of cells), or
3+staining (.25% of cells). Statistical analysis was performed using
the 2-tailed Fisher exact test or the x2 test with the Yates
continuity correction. A P value of ,0.05 was considered
statistically significant.
2.4. Laser Microdissection and DNA ExtractionWe selected the corresponding paraffin block with DN, specially
GPC3-positive DN, according to the results of immunohistochem-
ical staining, and then prepared eight serial 10-mm tissue sections
which were then placed on a UV-absorbing membrane for laser
microdissection by LMD6000 (Leica Microsystems Ltd, Wetzlar,
Germany). After HE staining, the slides were mounted on a
microstat, and the selected nodules were dissected by a UV laser
through motorized optical beam scanning. The dissected tissues
(with the attached specimen ) were pooled into the cap of a 0.5-ml
microcentrifuge tube that was filled with 40 mL lysate buffer and
10 mL protease K. Along with each dissected nodule, the
surrounding normal liver tissue of the same size was isolated and
analyzed as a control. The microcentrifuge tubes were placed in a
waterbath (48uC) to digest the tissue specimens. After digestion for
12–20 h, genomic DNA was extracted using Qiagen blood &
tissue Kit (Germany) and confirmed by gel electrophoresis (20 g/L
agarose ), and then stored at 220uC until use.
2.5. Polymerase Chain Reaction (PCR) Amplification forClonality
Nested polymerase chain reaction (PCR) was used to amplify
the length polymorphism of CAG short-tandem repeat (STR) in
exon 1 of the AR gene loci as described previously [22]. The
genomic DNA extracted from DN and the surrounding normal
liver tissues for the AR gene 10 mL each, was incubated with 5 U
of Hha I (Promega, Madison, WI, USA) at 37uC for 3 h in a
volume of 20 mL containing 2 mL of 106 reaction buffer. The
digested DNA samples, 1 mL each, were then subjected to nested
GPC3-Positive DN Indicates Risk for HCC
PLOS ONE | www.plosone.org 2 January 2014 | Volume 9 | Issue 1 | e87120
PCR. The reaction mixture was 50mL in volume, containing 4 mL
of 10 mM dNTP (Gibco BRL, Life Technologies, Inc., Gaithers-
burg, MD, USA), primers AR1A and AR1B (20 mM each), and
5 mL of 106 buffer, 1.5 mL of 50 mM MgCl2 and 2.5U of Taq
DNA polymerase (Gibco BRL). The amplification was conducted
using a PT-200 thermocycler (MJ Research, Inc., Watertown,
MA, USA) for 25 cycles (94uC for 40 sec, 56uC for 50 sec, and
72uC for 1 min) for the first round. PCR products (1 mL) were
used as templates for a second PCR reaction using primers AR2A
and AR2B. The amplification procedure was the same as that in
the first round. Finally, the amplification efficiency was checked by
resolving PCR reaction aliquots on 2% agarose gels. The PCR
products, 4 uL for each, were also mixed with the same volume of
loading buffer (1 g/L xylene cyanole, 1 g/L bromophenol blue, in
formamide), and resolved on an 8% polyacrylamide gel containing
8 mol/L urea using the Mini-VE system (Amersham Biosciences,
San Francisco, CA, USA) at 120 V for 4 h. Bands were visualized
using silver staining.
2.6. Analysis and Assessment of PCR ProductsImages of PCR gels were recorded and the intensities of the
PCR bands for both alleles were quantified using an image-
analyzing system (LabWorks 3.0, UVP, Cambridge, UK). A
reduction in fluorescence intensity of at least 50% for either band,
as compared to the intensity of the bands obtained in the absence
of Hha I digestion, was used as an indicator of a loss of X
chromosome inactivation mosaicism [22]. A corrected ratio (CR)
was calculated by dividing the ratio of the upper-band intensity to
the lower-band intensity, or vice-versa, of the same sample before
and after digestion to give a CR value .1. In the present study, a
CR value $2 was used to define a loss of X chromosome
inactivation mosaicism.
2.7. LOH AnalysisThe DN and the surrounding normal liver tissues were analyzed
for LOH by PCR amplification of polymorphic microsatellite
markers. Eleven microsatellite markers (Table 1) were selected
according to our previous data of LOH loci that occur at high
frequency in HCC. For PCR amplification, 1 mL DNA samples
were subjected to PCR. The reaction mixture was 50mL in volume
and contained 1.25 mL of 10 mM dNTP (Gibco BRL, Life
Technologies, Inc., Gaithersburg, MD, USA), primers 1A and 1B
(20 mM each), and 5 mL of 106 buffer, and 2.5U of Taq DNA
polymerase (Gibco BRL). The amplification was conducted using
a PT-200 thermocycler (MJ Research, Inc., Watertown, MA,
USA) for 35 cycles or 25 cycles (95uC for 40 sec, 60uC for 50 sec,
and 72uC for 1 min).
Images of PCR gels were recorded and the intensities of the
PCR bands for both alleles were quantified using an image-
analyzing system (LabWorks 3.0, UVP, Cambridge, UK).
A reduction in fluorescence intensity by 50% or greater in 1 or
more allele in the DN as compared to an identical allele in a
normal tissue was considered an indicator of LOH. Statistical
analysis was performed using the 2-tailed Fisher exact test with the
Yates continuity correction. A P value of ,0.05 was considered
statistically significant.
Results
3.1. Clinicopathologic Features of HCCOf the 128 patients with clinical data, there were 108 males and
20 females, with a male-to-female ratio of 5.4:1. There were 82
(75.9%) males and 17 (85%) females with liver cirrhosis. The ages
of patients with HCC ranged from 27 to 84 years (mean: 52 years).
Unfortunately, no other information was obtained in 26 out of 128
patients except for age, sex, and HCC grade. Hepatitis B surface
antigen (HBsAg) and hepatitis C virus (HCV) were detected in the
sera of 61.76% (63/102) and 5.88% (6/102) patients, respectively.
56.86% (58/102) of patients had elevated serum alpha-fetoprotein
(AFP) levels with values of 21.51–35350 ng/mL. Histopatholog-
ically, 10.94% (14/128) of HCC were well-differentiated, 60.93%
(78/128) were moderately differentiated, and 28.13% (36/128)
were poorly differentiated (Table 2).
3.2. GPC3 Expression in HCC and DNWe assayed for GPC3 expression in 136 cases of HCC, and
found that 103 cases (75.7%) stained positive for GPC3. The
amount of reactivity was graded as 1+ (,10% of cells) in 13 cases
(12.62%), 2+ (10%–25% of cells) in 22 cases (21.36%), and 3+(.25% of cells) in 68 cases (66.02%). Next, we evaluated the
expression of GPC3 in relation to the clinicopathological features,
such as age, sex, AFP level and HBsAg or HCV in serum, HCC
differentiation, tumor size, and metastasis. GPC3 expression
closely correlated with HBsAg positivity (P,0.05). Although
GPC3 expression was higher in moderately and poorly differen-
tiated HCC than in well differentiated HCC, this difference in
expression was not statistically significant (P = 0.295). Similarly,
the difference in GPC3 expression in HCCs with or without
extrahepatic metastasis did not reach statistical significance
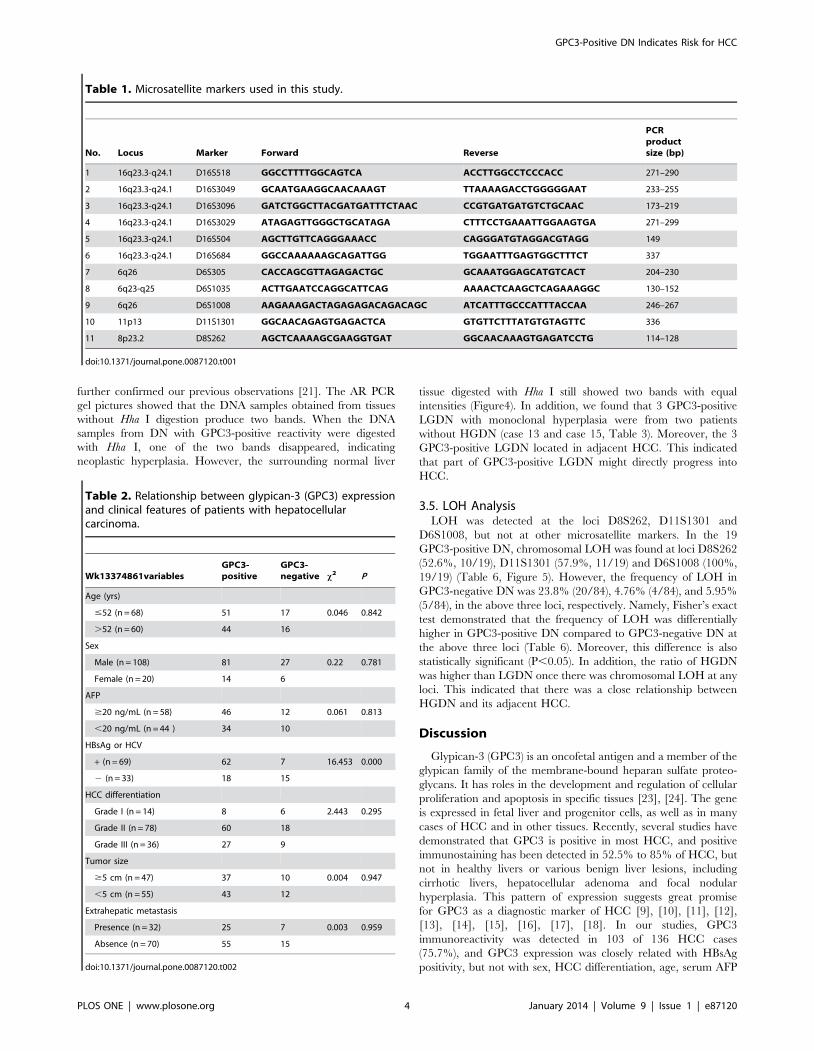
(P = 0.959) (Table 2). Moreover, we found 3 different immuno-
staining patterns in GPC3 positivity for HCC: predominantly
cytoplasm (Figure1A), predominantly membrane (Figure1C, D),
and both membrane and cytoplasm (Figure1B). However, these 3
different staining patterns did not appear to correlate with the
differentiation status of HCC, ages, and gender.
GPC3 staining was performed in 103 DN, including 30 HGDN
and 73 LGDN. The results demonstrated that 19 DN (18.4%),
including 15 HGDN and 4 LGDN, were positive (Table 3). The
ratio of HGDN (15/30, 50%) was obviously higher than that of
LGDN (4/73, 5.48%), and this difference is statistically significant
(P,0.05) (Table 4, 5). The amount of reactivity was graded as 1+(,10% of cells) in 4 cases (21.05%), 2+ (10%–25% of cells) in 10
cases (52.63%), and 3+ (.25% of cells) in 5 cases (26.32%).
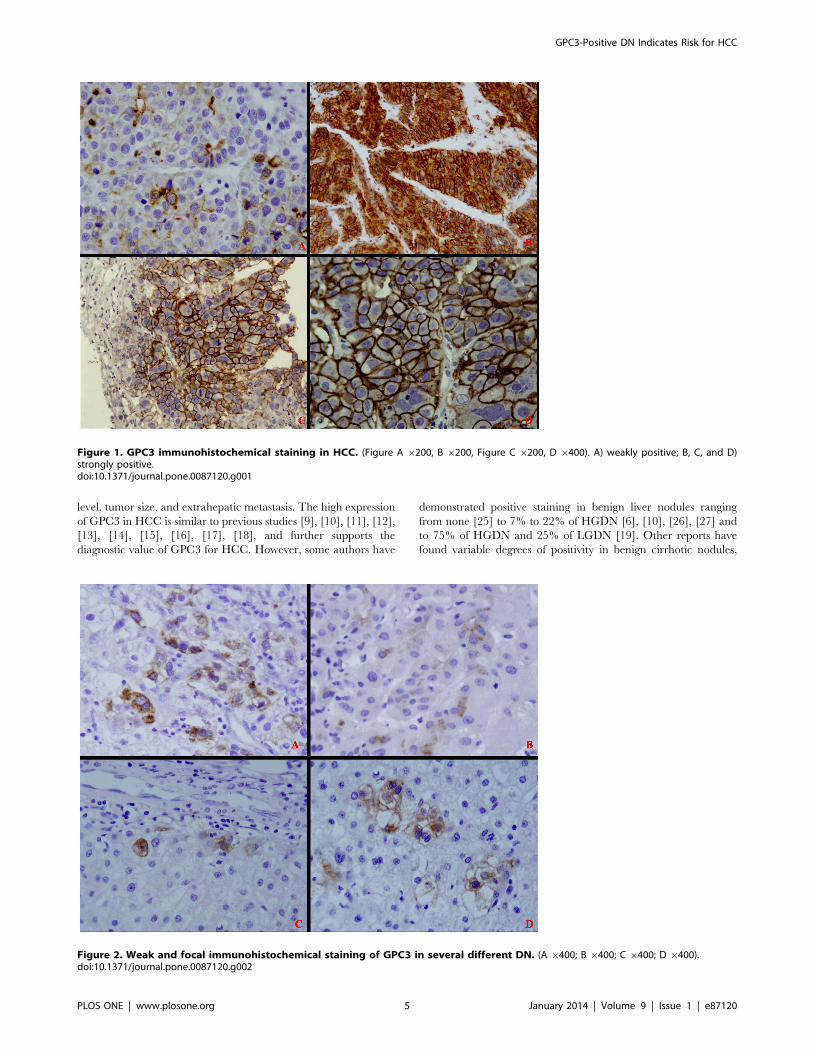
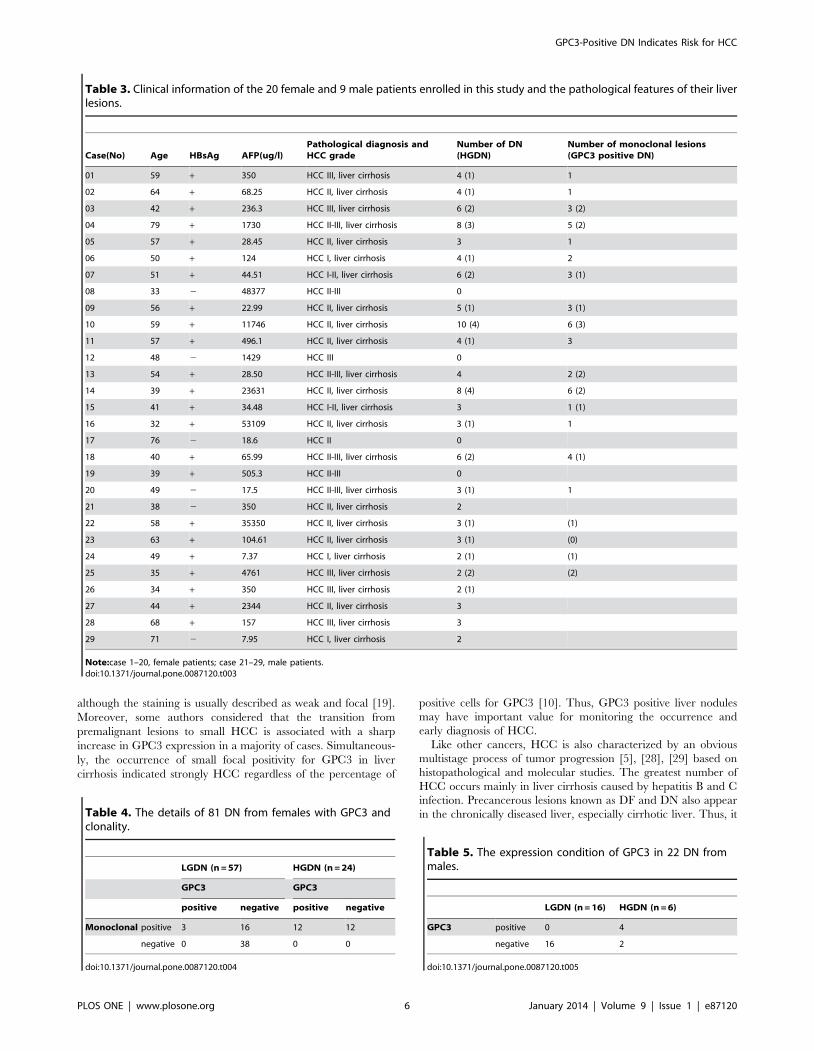
Moreover, we noticed that there were two types of GPC3
expression in DN. Only several hepatocytes were positive for
GPC3 in some DN (Figure2), but the whole nodule was positive
for GPC3 in the other DN (Figure3). The positive immunostaining
pattern of GPC3 for DN was similar to that in HCC. Namely, the
positive reactivity for GPC3 was predominantly in membrane
(Figure3A, 3B, 3C, and 3F) or cytoplasm (Figure3D, and 3E).
3.3. GPC3 Expression in HCC and its Adjacent DNIn the same patient, we found that GPC3 expression in HCC to
be congruent with the adjacent DN. In other words, GPC3 was
detected in the adjacent HCC if it was also detected in the DN
(Figure2, and Figure3). On the contrary, it was not necessary to
express GPC3 in the adjacent DN if it was positive for HCC.
Thus, we concluded that GPC3-positive DN was closely related to
HCC.
3.4. Clonality Determination of DNThe clonality assay was used to detect the nature of 81 DN from
females at the AR loci. In these samples, 15 GPC3-positive DN
(including 12 HGDN and 3 LGDN) and 28 (12 HGDN and 16
LGDN) out of 66 GPC3-negative DN showed loss of X-
chromosomal inactivation mosaicism upon digestion with Hha I
(Table 3 and Table 4). In other words, all of HGDN (100%, 24/
24) and 33.3% (19/57) LGDN were monoclonal. The results
GPC3-Positive DN Indicates Risk for HCC
PLOS ONE | www.plosone.org 3 January 2014 | Volume 9 | Issue 1 | e87120
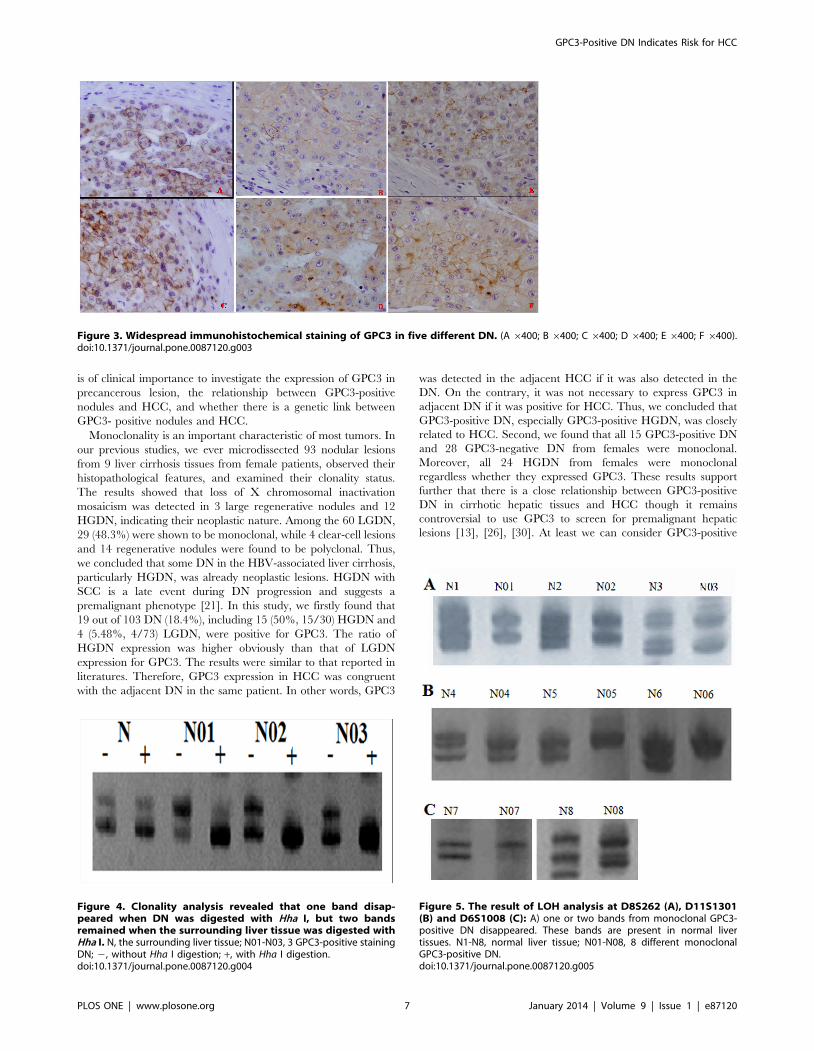
further confirmed our previous observations [21]. The AR PCR
gel pictures showed that the DNA samples obtained from tissues
without Hha I digestion produce two bands. When the DNA
samples from DN with GPC3-positive reactivity were digested
with Hha I, one of the two bands disappeared, indicating
neoplastic hyperplasia. However, the surrounding normal liver
tissue digested with Hha I still showed two bands with equal
intensities (Figure4). In addition, we found that 3 GPC3-positive
LGDN with monoclonal hyperplasia were from two patients
without HGDN (case 13 and case 15, Table 3). Moreover, the 3
GPC3-positive LGDN located in adjacent HCC. This indicated
that part of GPC3-positive LGDN might directly progress into
HCC.
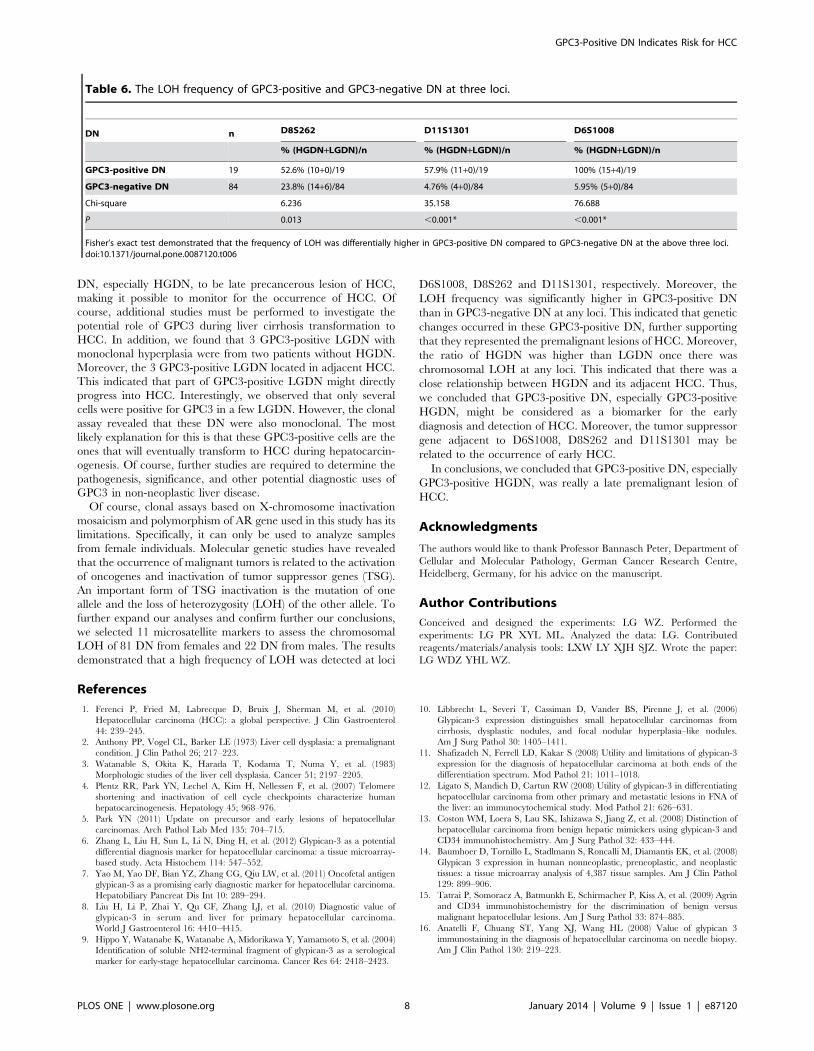
3.5. LOH AnalysisLOH was detected at the loci D8S262, D11S1301 and
D6S1008, but not at other microsatellite markers. In the 19
GPC3-positive DN, chromosomal LOH was found at loci D8S262
(52.6%, 10/19), D11S1301 (57.9%, 11/19) and D6S1008 (100%,
19/19) (Table 6, Figure 5). However, the frequency of LOH in
GPC3-negative DN was 23.8% (20/84), 4.76% (4/84), and 5.95%
(5/84), in the above three loci, respectively. Namely, Fisher’s exact
test demonstrated that the frequency of LOH was differentially
higher in GPC3-positive DN compared to GPC3-negative DN at
the above three loci (Table 6). Moreover, this difference is also
statistically significant (P,0.05). In addition, the ratio of HGDN
was higher than LGDN once there was chromosomal LOH at any
loci. This indicated that there was a close relationship between
HGDN and its adjacent HCC.
Discussion
Glypican-3 (GPC3) is an oncofetal antigen and a member of the
glypican family of the membrane-bound heparan sulfate proteo-
glycans. It has roles in the development and regulation of cellular
proliferation and apoptosis in specific tissues [23], [24]. The gene
is expressed in fetal liver and progenitor cells, as well as in many
cases of HCC and in other tissues. Recently, several studies have
demonstrated that GPC3 is positive in most HCC, and positive
immunostaining has been detected in 52.5% to 85% of HCC, but
not in healthy livers or various benign liver lesions, including
cirrhotic livers, hepatocellular adenoma and focal nodular
hyperplasia. This pattern of expression suggests great promise
for GPC3 as a diagnostic marker of HCC [9], [10], [11], [12],
[13], [14], [15], [16], [17], [18]. In our studies, GPC3
immunoreactivity was detected in 103 of 136 HCC cases
(75.7%), and GPC3 expression was closely related with HBsAg
positivity, but not with sex, HCC differentiation, age, serum AFP
Table 1. Microsatellite markers used in this study.
No. Locus Marker Forward Reverse
PCRproductsize (bp)
1 16q23.3-q24.1 D16S518 GGCCTTTTGGCAGTCA ACCTTGGCCTCCCACC 271–290
2 16q23.3-q24.1 D16S3049 GCAATGAAGGCAACAAAGT TTAAAAGACCTGGGGGAAT 233–255
3 16q23.3-q24.1 D16S3096 GATCTGGCTTACGATGATTTCTAAC CCGTGATGATGTCTGCAAC 173–219
4 16q23.3-q24.1 D16S3029 ATAGAGTTGGGCTGCATAGA CTTTCCTGAAATTGGAAGTGA 271–299
5 16q23.3-q24.1 D16S504 AGCTTGTTCAGGGAAACC CAGGGATGTAGGACGTAGG 149
6 16q23.3-q24.1 D16S684 GGCCAAAAAAGCAGATTGG TGGAATTTGAGTGGCTTTCT 337
7 6q26 D6S305 CACCAGCGTTAGAGACTGC GCAAATGGAGCATGTCACT 204–230
8 6q23-q25 D6S1035 ACTTGAATCCAGGCATTCAG AAAACTCAAGCTCAGAAAGGC 130–152
9 6q26 D6S1008 AAGAAAGACTAGAGAGACAGACAGC ATCATTTGCCCATTTACCAA 246–267
10 11p13 D11S1301 GGCAACAGAGTGAGACTCA GTGTTCTTTATGTGTAGTTC 336
11 8p23.2 D8S262 AGCTCAAAAGCGAAGGTGAT GGCAACAAAGTGAGATCCTG 114–128
doi:10.1371/journal.pone.0087120.t001
Table 2. Relationship between glypican-3 (GPC3) expressionand clinical features of patients with hepatocellularcarcinoma.
Wk13374861variablesGPC3-positive
GPC3-negative x2 P
Age (yrs)
#52 (n = 68) 51 17 0.046 0.842
.52 (n = 60) 44 16
Sex
Male (n = 108) 81 27 0.22 0.781
Female (n = 20) 14 6
AFP
$20 ng/mL (n = 58) 46 12 0.061 0.813
,20 ng/mL (n = 44 ) 34 10
HBsAg or HCV
+ (n = 69) 62 7 16.453 0.000
2 (n = 33) 18 15
HCC differentiation
Grade I (n = 14) 8 6 2.443 0.295
Grade II (n = 78) 60 18
Grade III (n = 36) 27 9
Tumor size
$5 cm (n = 47) 37 10 0.004 0.947
,5 cm (n = 55) 43 12
Extrahepatic metastasis
Presence (n = 32) 25 7 0.003 0.959
Absence (n = 70) 55 15
doi:10.1371/journal.pone.0087120.t002
GPC3-Positive DN Indicates Risk for HCC
PLOS ONE | www.plosone.org 4 January 2014 | Volume 9 | Issue 1 | e87120
level, tumor size, and extrahepatic metastasis. The high expression
of GPC3 in HCC is similar to previous studies [9], [10], [11], [12],
[13], [14], [15], [16], [17], [18], and further supports the
diagnostic value of GPC3 for HCC. However, some authors have
demonstrated positive staining in benign liver nodules ranging
from none [25] to 7% to 22% of HGDN [6], [10], [26], [27] and
to 75% of HGDN and 25% of LGDN [19]. Other reports have
found variable degrees of positivity in benign cirrhotic nodules,
Figure 1. GPC3 immunohistochemical staining in HCC. (Figure A 6200, B 6200, Figure C 6200, D 6400). A) weakly positive; B, C, and D)strongly positive.doi:10.1371/journal.pone.0087120.g001
Figure 2. Weak and focal immunohistochemical staining of GPC3 in several different DN. (A 6400; B 6400; C 6400; D 6400).doi:10.1371/journal.pone.0087120.g002
GPC3-Positive DN Indicates Risk for HCC
PLOS ONE | www.plosone.org 5 January 2014 | Volume 9 | Issue 1 | e87120
although the staining is usually described as weak and focal [19].
Moreover, some authors considered that the transition from
premalignant lesions to small HCC is associated with a sharp
increase in GPC3 expression in a majority of cases. Simultaneous-
ly, the occurrence of small focal positivity for GPC3 in liver
cirrhosis indicated strongly HCC regardless of the percentage of
positive cells for GPC3 [10]. Thus, GPC3 positive liver nodules
may have important value for monitoring the occurrence and
early diagnosis of HCC.
Like other cancers, HCC is also characterized by an obvious
multistage process of tumor progression [5], [28], [29] based on
histopathological and molecular studies. The greatest number of
HCC occurs mainly in liver cirrhosis caused by hepatitis B and C
infection. Precancerous lesions known as DF and DN also appear
in the chronically diseased liver, especially cirrhotic liver. Thus, it
Table 3. Clinical information of the 20 female and 9 male patients enrolled in this study and the pathological features of their liverlesions.
Case(No) Age HBsAg AFP(ug/l)Pathological diagnosis andHCC grade
Number of DN(HGDN)
Number of monoclonal lesions(GPC3 positive DN)
01 59 + 350 HCC III, liver cirrhosis 4 (1) 1
02 64 + 68.25 HCC II, liver cirrhosis 4 (1) 1
03 42 + 236.3 HCC III, liver cirrhosis 6 (2) 3 (2)
04 79 + 1730 HCC II-III, liver cirrhosis 8 (3) 5 (2)
05 57 + 28.45 HCC II, liver cirrhosis 3 1
06 50 + 124 HCC I, liver cirrhosis 4 (1) 2
07 51 + 44.51 HCC I-II, liver cirrhosis 6 (2) 3 (1)
08 33 2 48377 HCC II-III 0
09 56 + 22.99 HCC II, liver cirrhosis 5 (1) 3 (1)
10 59 + 11746 HCC II, liver cirrhosis 10 (4) 6 (3)
11 57 + 496.1 HCC II, liver cirrhosis 4 (1) 3
12 48 2 1429 HCC III 0
13 54 + 28.50 HCC II-III, liver cirrhosis 4 2 (2)
14 39 + 23631 HCC II, liver cirrhosis 8 (4) 6 (2)
15 41 + 34.48 HCC I-II, liver cirrhosis 3 1 (1)
16 32 + 53109 HCC II, liver cirrhosis 3 (1) 1
17 76 2 18.6 HCC II 0
18 40 + 65.99 HCC II-III, liver cirrhosis 6 (2) 4 (1)
19 39 + 505.3 HCC II-III 0
20 49 2 17.5 HCC II-III, liver cirrhosis 3 (1) 1
21 38 2 350 HCC II, liver cirrhosis 2
22 58 + 35350 HCC II, liver cirrhosis 3 (1) (1)
23 63 + 104.61 HCC II, liver cirrhosis 3 (1) (0)
24 49 + 7.37 HCC I, liver cirrhosis 2 (1) (1)
25 35 + 4761 HCC III, liver cirrhosis 2 (2) (2)
26 34 + 350 HCC III, liver cirrhosis 2 (1)
27 44 + 2344 HCC II, liver cirrhosis 3
28 68 + 157 HCC III, liver cirrhosis 3
29 71 2 7.95 HCC I, liver cirrhosis 2
Note:case 1–20, female patients; case 21–29, male patients.doi:10.1371/journal.pone.0087120.t003
Table 4. The details of 81 DN from females with GPC3 andclonality.
LGDN (n = 57) HGDN (n = 24)
GPC3 GPC3
positive negative positive negative
Monoclonal positive 3 16 12 12
negative 0 38 0 0
doi:10.1371/journal.pone.0087120.t004
Table 5. The expression condition of GPC3 in 22 DN frommales.
LGDN (n = 16) HGDN (n = 6)
GPC3 positive 0 4
negative 16 2
doi:10.1371/journal.pone.0087120.t005
GPC3-Positive DN Indicates Risk for HCC
PLOS ONE | www.plosone.org 6 January 2014 | Volume 9 | Issue 1 | e87120
is of clinical importance to investigate the expression of GPC3 in
precancerous lesion, the relationship between GPC3-positive
nodules and HCC, and whether there is a genetic link between
GPC3- positive nodules and HCC.
Monoclonality is an important characteristic of most tumors. In
our previous studies, we ever microdissected 93 nodular lesions
from 9 liver cirrhosis tissues from female patients, observed their
histopathological features, and examined their clonality status.
The results showed that loss of X chromosomal inactivation
mosaicism was detected in 3 large regenerative nodules and 12
HGDN, indicating their neoplastic nature. Among the 60 LGDN,
29 (48.3%) were shown to be monoclonal, while 4 clear-cell lesions
and 14 regenerative nodules were found to be polyclonal. Thus,
we concluded that some DN in the HBV-associated liver cirrhosis,
particularly HGDN, was already neoplastic lesions. HGDN with
SCC is a late event during DN progression and suggests a
premalignant phenotype [21]. In this study, we firstly found that
19 out of 103 DN (18.4%), including 15 (50%, 15/30) HGDN and
4 (5.48%, 4/73) LGDN, were positive for GPC3. The ratio of
HGDN expression was higher obviously than that of LGDN
expression for GPC3. The results were similar to that reported in
literatures. Therefore, GPC3 expression in HCC was congruent
with the adjacent DN in the same patient. In other words, GPC3
was detected in the adjacent HCC if it was also detected in the
DN. On the contrary, it was not necessary to express GPC3 in
adjacent DN if it was positive for HCC. Thus, we concluded that
GPC3-positive DN, especially GPC3-positive HGDN, was closely
related to HCC. Second, we found that all 15 GPC3-positive DN
and 28 GPC3-negative DN from females were monoclonal.
Moreover, all 24 HGDN from females were monoclonal
regardless whether they expressed GPC3. These results support
further that there is a close relationship between GPC3-positive
DN in cirrhotic hepatic tissues and HCC though it remains
controversial to use GPC3 to screen for premalignant hepatic
lesions [13], [26], [30]. At least we can consider GPC3-positive
Figure 3. Widespread immunohistochemical staining of GPC3 in five different DN. (A 6400; B 6400; C 6400; D 6400; E 6400; F 6400).doi:10.1371/journal.pone.0087120.g003
Figure 4. Clonality analysis revealed that one band disap-peared when DN was digested with Hha I, but two bandsremained when the surrounding liver tissue was digested withHha I. N, the surrounding liver tissue; N01-N03, 3 GPC3-positive stainingDN; 2, without Hha I digestion; +, with Hha I digestion.doi:10.1371/journal.pone.0087120.g004
Figure 5. The result of LOH analysis at D8S262 (A), D11S1301(B) and D6S1008 (C): A) one or two bands from monoclonal GPC3-positive DN disappeared. These bands are present in normal livertissues. N1-N8, normal liver tissue; N01-N08, 8 different monoclonalGPC3-positive DN.doi:10.1371/journal.pone.0087120.g005
GPC3-Positive DN Indicates Risk for HCC
PLOS ONE | www.plosone.org 7 January 2014 | Volume 9 | Issue 1 | e87120
DN, especially HGDN, to be late precancerous lesion of HCC,
making it possible to monitor for the occurrence of HCC. Of
course, additional studies must be performed to investigate the
potential role of GPC3 during liver cirrhosis transformation to
HCC. In addition, we found that 3 GPC3-positive LGDN with
monoclonal hyperplasia were from two patients without HGDN.
Moreover, the 3 GPC3-positive LGDN located in adjacent HCC.
This indicated that part of GPC3-positive LGDN might directly
progress into HCC. Interestingly, we observed that only several
cells were positive for GPC3 in a few LGDN. However, the clonal
assay revealed that these DN were also monoclonal. The most
likely explanation for this is that these GPC3-positive cells are the
ones that will eventually transform to HCC during hepatocarcin-
ogenesis. Of course, further studies are required to determine the
pathogenesis, significance, and other potential diagnostic uses of
GPC3 in non-neoplastic liver disease.
Of course, clonal assays based on X-chromosome inactivation
mosaicism and polymorphism of AR gene used in this study has its
limitations. Specifically, it can only be used to analyze samples
from female individuals. Molecular genetic studies have revealed
that the occurrence of malignant tumors is related to the activation
of oncogenes and inactivation of tumor suppressor genes (TSG).
An important form of TSG inactivation is the mutation of one
allele and the loss of heterozygosity (LOH) of the other allele. To
further expand our analyses and confirm further our conclusions,
we selected 11 microsatellite markers to assess the chromosomal
LOH of 81 DN from females and 22 DN from males. The results
demonstrated that a high frequency of LOH was detected at loci
D6S1008, D8S262 and D11S1301, respectively. Moreover, the
LOH frequency was significantly higher in GPC3-positive DN
than in GPC3-negative DN at any loci. This indicated that genetic
changes occurred in these GPC3-positive DN, further supporting
that they represented the premalignant lesions of HCC. Moreover,
the ratio of HGDN was higher than LGDN once there was
chromosomal LOH at any loci. This indicated that there was a
close relationship between HGDN and its adjacent HCC. Thus,
we concluded that GPC3-positive DN, especially GPC3-positive
HGDN, might be considered as a biomarker for the early
diagnosis and detection of HCC. Moreover, the tumor suppressor
gene adjacent to D6S1008, D8S262 and D11S1301 may be
related to the occurrence of early HCC.
In conclusions, we concluded that GPC3-positive DN, especially
GPC3-positive HGDN, was really a late premalignant lesion of
HCC.
Acknowledgments
The authors would like to thank Professor Bannasch Peter, Department of
Cellular and Molecular Pathology, German Cancer Research Centre,
Heidelberg, Germany, for his advice on the manuscript.
Author Contributions
Conceived and designed the experiments: LG WZ. Performed the
experiments: LG PR XYL ML. Analyzed the data: LG. Contributed
reagents/materials/analysis tools: LXW LY XJH SJZ. Wrote the paper:
LG WDZ YHL WZ.
References
1. Ferenci P, Fried M, Labrecque D, Bruix J, Sherman M, et al. (2010)
Hepatocellular carcinoma (HCC): a global perspective. J Clin Gastroenterol
44: 239–245.
2. Anthony PP, Vogel CL, Barker LE (1973) Liver cell dysplasia: a premalignant
condition. J Clin Pathol 26; 217–223.
3. Watanable S, Okita K, Harada T, Kodama T, Numa Y, et al. (1983)
Morphologic studies of the liver cell dysplasia. Cancer 51; 2197–2205.
4. Plentz RR, Park YN, Lechel A, Kim H, Nellessen F, et al. (2007) Telomere
shortening and inactivation of cell cycle checkpoints characterize human
hepatocarcinogenesis. Hepatology 45; 968–976.
5. Park YN (2011) Update on precursor and early lesions of hepatocellular
carcinomas. Arch Pathol Lab Med 135: 704–715.
6. Zhang L, Liu H, Sun L, Li N, Ding H, et al. (2012) Glypican-3 as a potential
differential diagnosis marker for hepatocellular carcinoma: a tissue microarray-
based study. Acta Histochem 114: 547–552.
7. Yao M, Yao DF, Bian YZ, Zhang CG, Qiu LW, et al. (2011) Oncofetal antigen
glypican-3 as a promising early diagnostic marker for hepatocellular carcinoma.
Hepatobiliary Pancreat Dis Int 10: 289–294.
8. Liu H, Li P, Zhai Y, Qu CF, Zhang LJ, et al. (2010) Diagnostic value of
glypican-3 in serum and liver for primary hepatocellular carcinoma.
World J Gastroenterol 16: 4410–4415.
9. Hippo Y, Watanabe K, Watanabe A, Midorikawa Y, Yamamoto S, et al. (2004)
Identification of soluble NH2-terminal fragment of glypican-3 as a serological
marker for early-stage hepatocellular carcinoma. Cancer Res 64: 2418–2423.
10. Libbrecht L, Severi T, Cassiman D, Vander BS, Pirenne J, et al. (2006)
Glypican-3 expression distinguishes small hepatocellular carcinomas from
cirrhosis, dysplastic nodules, and focal nodular hyperplasia–like nodules.
Am J Surg Pathol 30: 1405–1411.
11. Shafizadeh N, Ferrell LD, Kakar S (2008) Utility and limitations of glypican-3
expression for the diagnosis of hepatocellular carcinoma at both ends of the
differentiation spectrum. Mod Pathol 21: 1011–1018.
12. Ligato S, Mandich D, Cartun RW (2008) Utility of glypican-3 in differentiating
hepatocellular carcinoma from other primary and metastatic lesions in FNA of
the liver: an immunocytochemical study. Mod Pathol 21: 626–631.
13. Coston WM, Loera S, Lau SK, Ishizawa S, Jiang Z, et al. (2008) Distinction of
hepatocellular carcinoma from benign hepatic mimickers using glypican-3 and
CD34 immunohistochemistry. Am J Surg Pathol 32: 433–444.
14. Baumhoer D, Tornillo L, Stadlmann S, Roncalli M, Diamantis EK, et al. (2008)
Glypican 3 expression in human nonneoplastic, preneoplastic, and neoplastic
tissues: a tissue microarray analysis of 4,387 tissue samples. Am J Clin Pathol
129: 899–906.
15. Tatrai P, Somoracz A, Batmunkh E, Schirmacher P, Kiss A, et al. (2009) Agrin
and CD34 immunohistochemistry for the discrimination of benign versus
malignant hepatocellular lesions. Am J Surg Pathol 33: 874–885.
16. Anatelli F, Chuang ST, Yang XJ, Wang HL (2008) Value of glypican 3
immunostaining in the diagnosis of hepatocellular carcinoma on needle biopsy.
Am J Clin Pathol 130: 219–223.
Table 6. The LOH frequency of GPC3-positive and GPC3-negative DN at three loci.
DN n D8S262 D11S1301 D6S1008
% (HGDN+LGDN)/n % (HGDN+LGDN)/n % (HGDN+LGDN)/n
GPC3-positive DN 19 52.6% (10+0)/19 57.9% (11+0)/19 100% (15+4)/19
GPC3-negative DN 84 23.8% (14+6)/84 4.76% (4+0)/84 5.95% (5+0)/84
Chi-square 6.236 35.158 76.688
P 0.013 ,0.001* ,0.001*
Fisher’s exact test demonstrated that the frequency of LOH was differentially higher in GPC3-positive DN compared to GPC3-negative DN at the above three loci.doi:10.1371/journal.pone.0087120.t006
GPC3-Positive DN Indicates Risk for HCC
PLOS ONE | www.plosone.org 8 January 2014 | Volume 9 | Issue 1 | e87120
17. Yan B, Wei JJ, Qian YM, Zhao XL, Zhang WW, et al. (2011) Expression and
clinicopathologic significance of glypican 3 in hepatocellular carcinoma. AnnDiagn Pathol 15: 162–169.
18. Su N, Chen B, Huang N, Shen P, Ding Y, et al. (2011) Glypican-3, a novel
prognostic marker of hepatocellular cancer, is related with postoperativemetastasis and recurrence in hepatocellular cancer patients. Mol Biol Rep 15:
162–169.19. Yamauchi N, Watanabe A, Hishinuma M, Ohashi K, Midorikawa Y, et al.
(2005) The glypican 3 oncofetal protein is a promising diagnostic marker for
hepatocellular carcinoma. Mod Pathol 18: 1591–1598.20. Du JL, Wei LX, Wang YL (2011) Expression and clinicopathologic significance
of GPC3 and other antibodies in well-differentiated hepatocellular carcinoma.Zhonghua Bing Li Xue Za Zhi 40: 11–16.
21. Gong L, Li YH, Su Q, Chu X, Zhang W (2010) Clonality of nodular lesions inliver cirrhosis and chromosomal abnormalities in monoclonal nodules of altered
hepatocytes. Histopathology 56: 589–599.
22. Gong L, Zhang W, Su Q (2008) Clonal status of fibrous dysplasia. Pathology 40:392–395.
23. Filmus J, Selleck SB (2001) Glypicans: proteoglycans with a surprise. J ClinInvest 108: 497–501.
24. Grozdanov PN, Yovchev MI, Dabeva MD (2006) The oncofetal protein
glypican-3 is a novel marker of hepatic progenitor/oval cells. Lab Invest 86:1272–1284.
25. Llovet JM, Chen Y, Wurmbach E, Roayaie S, Fiel MI, et al. (2006) A molecular
signature to discriminate dysplastic nodules from early hepatocellular carcinomain HCV cirrhosis. Gastroenterology 131: 1758–1767.
26. Wang XY, Degos F, Dubois S, Tessiore S, Allegretta M, et al. (2006) Glypican-3expression in hepatocellular tumors: diagnostic value for preneoplastic lesions
and hepatocellular carcinomas. Hum Pathol 37: 1435–1441.
27. Di Tommaso L, Franchi G, Park YN, Fiamengo B, Destro A, et al. (2007)Diagnostic value of HSP70, glypican 3, and glutamine synthetase in
hepatocellular nodules in cirrhosis. Hepatology 45: 725–734.28. Hirohashi S, Ishak KG, Kojiro M (2000) Hepatocellular carcinoma. In
Pathology and Genetics of Tumours of the Digestive System. 3rd edition.Edited by Hamilton SR, Aaltonen LA. Lyon: IARC Press : 159–172.
29. Kojiro M (2006) Pathology of hepatocellular carcinoma. Oxford: Blackwell.
30. Tangkijvanich P, Chanmee T, Komtong S, Mahachai V, Wisedopas N, et al.(2010) Diagnostic role of serum glypican-3 in differentiating hepatocellular
carcinoma from nonmalignant chronic liver disease and other liver cancers.J Gastroenterol Hepatol 25: 129–137.
GPC3-Positive DN Indicates Risk for HCC
PLOS ONE | www.plosone.org 9 January 2014 | Volume 9 | Issue 1 | e87120