Embed Size (px)
Citation preview

Table of Contents
UNITED STATESSECURITIES AND EXCHANGE COMMISSION
Washington, D.C. 20549
Form 10-K(Mark One)
x
ANNUAL REPORT PURSUANT TO SECTION 13 OR 15(d) OF THE SECURITIESEXCHANGE ACT OF 1934
For the fiscal year ended February 1, 2013or
o
TRANSITION REPORT PURSUANT TO SECTION 13 OR 15(d) OF THE SECURITIESEXCHANGE ACT OF 1934
For the transition period from to Commission file number: 0-17017
Dell Inc.(Exact name of registrant as specified in its charter)
Delaware 74-2487834(State or other jurisdiction ofincorporation or organization)
(I.R.S. EmployerIdentification No.)
One Dell Way, Round Rock, Texas 78682(Address of principal executive offices) (Zip Code)
Registrant’s telephone number, including area code: 1-800-289-3355
Securities registered pursuant to Section 12(b) of the Act:
Title of each class Name of each exchange on which registeredCommon Stock, par value $.01 per share
The NASDAQ Stock Market LLC(NASDAQ Global Select Market)
Securities registered pursuant to Section 12(g) of the Act: None Indicate by check mark if the registrant is a well-known seasoned issuer, as defined in Rule 405 of the Securities Act. Yes o No R Indicate by check mark if the registrant is not required to file reports pursuant to Section 13 or Section 15(d) of the Act. Yes o No R Indicate by check mark whether the registrant (1) has filed all reports required to be filed by Section 13 or 15(d) of the Securities Exchange Act of 1934 during the preceding12 months (or for such shorter period that the registrant was required to file such reports), and (2) has been subject to such filing requirements for the past 90 days.Yes R No oIndicate by check mark whether the registrant has submitted electronically and posted on its corporate Web site, if any, every Interactive Data File required to be submitted andposted pursuant to Rule 405 of Regulation S-T during the preceding 12 months (or for such shorter period that the registrant was required to submit and post such files).Yes R No oIndicate by check mark if disclosure of delinquent filers pursuant to Item 405 of Regulation S-K is not contained herein, and will not be contained, to the best of registrant’sknowledge, in definitive proxy or information statements incorporated by reference in Part III of this Form 10-K or any amendment to this Form 10-K. RIndicate by check mark whether the registrant is a large accelerated filer, an accelerated filer, a non-accelerated filer, or a smaller reporting company. See the definitions of “largeaccelerated filer,” “accelerated filer,” and “smaller reporting company” in Rule 12b-2 of the Exchange Act.
Large accelerated filer R Accelerated filer oNon-accelerated filer o (Do not check if a smaller reporting company) Smaller reporting company o
Indicate by check mark whether the registrant is a shell company (as defined in Rule 12b-2 of the Act). Yes o No R
Approximate aggregate market value of the registrant’s common stock held by non-affiliates as of August 3, 2012, based upon the last saleprice reported for such date on the NASDAQ Global Select Market $17.1 billionNumber of shares of common stock outstanding as of March 6, 2013 1,747,220,324

Table of Contents
DOCUMENTS INCORPORATED BY REFERENCE The information required by Part III of this report, to the extent not set forth herein, is incorporated by reference from the registrant's proxy statement relating tothe annual meeting of stockholders in 2013. Such proxy statement will be filed with the Securities and Exchange Commission within 120 days after the end ofthe fiscal year to which this report relates.
PART I Table of Contents PageItem 1. Business 4Item 1A. Risk Factors 15Item 1B. Unresolved Staff Comments 22Item 2. Properties 23Item 3. Legal Proceedings 23Item 4. Mine Safety Disclosures 23PART II Item 5. Market for Registrant’s Common Equity, Related Stockholder Matters and Issuer Purchases of Equity Securities 24Item 6. Selected Financial Data 26Item 7. Management’s Discussion and Analysis of Financial Condition and Results of Operations 27Item 7A. Quantitative and Qualitative Disclosures About Market Risk 5 9Item 8. Financial Statements and Supplementary Data 60Item 9. Changes in and Disagreements with Accountants on Accounting and Financial Disclosure 116Item 9A. Controls and Procedures 116Item 9B. Other Information 117PART III Item 10 Directors, Executive Officers and Corporate Governance 118Item 11 Executive Compensation 118Item 12 Security Ownership of Certain Beneficial Owners and Management and Related Stockholder Matters 118Item 13 Certain Relationships and Related Transactions, and Director Independence 118Item 14 Principal Accounting Fees and Services 118PART IV Item 15. Exhibits, Financial Statement Schedules 119Signatures 121Exhibit Index 123Exhibits EX-12.1 EX-21 EX-23 EX-31.1 EX-31.2 EX-32.1 EX-101 INSTANCE DOCUMENT EX-101 SCHEMA DOCUMENT EX-101 CALCULATION LINKBASE DOCUMENT EX-101 DEFINITION LINKBASE DOCUMENT EX-101 LABELS LINKBASE DOCUMENT EX-101 PRESENTATION LINKBASE DOCUMENT

Table of Contents
CAUTIONARY NOTE REGARDING FORWARD-LOOKING STATEMENTS
This report includes “forward-looking statements.” The words “may,” “will,” “anticipate,” “estimate,” “expect,” “intend,” “plan,” “aim,” “seek” and similarexpressions as they relate to us or our management are intended to identify these forward-looking statements. All statements by us regarding our expectedfinancial position, revenues, cash flows and other operating results, business strategy, legal proceedings and similar matters are forward-looking statements.Our expectations expressed or implied in these forward-looking statements may not turn out to be correct. Our results could be materially different from ourexpectations because of various risks, including the risks discussed in this report under “Part I - Item 1A - Risk Factors.” Any forward-looking statementspeaks only as of the date as of which such statement is made, and, except as required by law, we undertake no obligation to update any forward-lookingstatement to reflect events or circumstances, including unanticipated events, after the date as of which such statement was made.

Table of Contents
PART I
All percentage amounts and ratios were calculated using the underlying data in thousands. Unless otherwise noted, all references to time periodsrefer to our fiscal years. Our fiscal year is the 52 or 53 week period ending on the Friday nearest January 31. The fiscal years ended February 1,2013 ("Fiscal 2013") and January 28, 2011 ("Fiscal 2011") were 52 week periods, while the fiscal year ended February 3, 2012 ("Fiscal 2012")was a 53 week period.
Unless the context indicates otherwise, references in this report to “we,” “us,” “our” and “Dell” mean Dell Inc. and our consolidatedsubsidiaries.
ITEM 1 — BUSINESS
General
Dell is a global information technology company that offers its customers a broad range of products and services. We are focused on providing end-to-endtechnology solutions to our customers.
Dell Inc. is a holding company that conducts its business worldwide through its subsidiaries. We were incorporated in the state of Delaware in 1984. Ourglobal corporate headquarters is located in Round Rock, Texas. When we refer to our company and its business in this report, we are referring to the businessand activities of our consolidated subsidiaries.
Merger Agreement
On February 5, 2013, Dell announced that it had signed a definitive agreement and plan of merger (the “merger agreement”) pursuant to which it will beacquired by Denali Holding Inc. (“Parent”), a Delaware corporation owned by Michael S. Dell, the Chairman, Chief Executive Officer and founder of Dell,and investment funds affiliated with Silver Lake Partners, a global private equity firm (“Silver Lake”). Following completion of the transaction, Mr. Dell willcontinue to lead Dell as Chairman and Chief Executive Officer and will maintain a significant equity investment in Dell by contributing his Dell shares toParent and making a cash investment in Parent. Subject to the satisfaction or permitted waiver of closing conditions set forth in the merger agreement, themerger is expected to be consummated before the end of the second quarter of the fiscal year ending January 31, 2014.
At the effective time of the merger, each share of Dell's common stock issued and outstanding immediately before the effective time, other than certain excludedshares, will be converted into the right to receive $13.65 in cash, without interest (the “merger consideration”). Shares of common stock held by the Parentand its subsidiaries, shares held by Mr. Dell and certain of Mr. Dell's related parties (together with Mr. Dell, the “MD Investors”), and by Dell or any wholly-owned subsidiary of Dell will not be entitled to receive the merger consideration.
Dell's stockholders will be asked to vote on the adoption of the merger agreement and the merger at a special stockholders meeting that will be held on a date tobe announced. The closing of the merger is subject to a non-waivable condition that the merger agreement be adopted by the affirmative vote of the holders of(1) at least a majority of all outstanding shares of common stock and (2) at least a majority of all outstanding shares of common stock held by stockholdersother than Parent and its subsidiaries, the MD Investors, any other officers and directors of Dell or any other person having any equity interest in, or any rightto acquire any equity interest in, Parent's merger subsidiary or any person of which the merger subsidiary is a direct or indirect subsidiary. Consummation ofthe merger is also subject to certain customary conditions. The merger agreement does not contain a financing condition.
The merger agreement places limitations on Dell's ability to engage in certain types of transactions without Parent's consent during the period between thesigning of the merger agreement and the effective time of the merger. During this period, Dell may not repurchase shares of its common stock or declaredividends in excess of the quarterly rate of $0.08 per share authorized under its current dividend policy. In addition, with limited exceptions, Dell may notincur additional debt other than up to $1.8 billion under its existing commercial paper program, $2.0 billion under its revolving credit facilities, $1.5 billionunder its structured financing debt facilities, and up to $25 million of additional indebtedness. Further, other than in transactions in the ordinary course ofbusiness or within specified dollar limits and certain other limited exceptions, Dell generally may not acquire other businesses, make investments in otherpersons, or sell, lease, or encumber its material assets.
Parent has obtained equity and debt financing commitments for the transactions contemplated by the merger agreement, the aggregate proceeds of which,together with the proceeds of a rollover investment of Dell shares in Parent by the MD Investors, an investment in subordinated securities and the availablecash of Dell, will be sufficient for Parent to pay the
4

Table of Contents
aggregate merger consideration and all related fees and expenses. The commitment of financial institutions to provide debt financing for the transaction issubject to a number of customary conditions, including the execution and delivery by the borrowers and the guarantors of definitive documentation consistentwith the debt commitment letter.
Pursuant to the terms of a “go-shop” provision in the merger agreement, during the period beginning on the date of the merger agreement and expiring afterMarch 22, 2013, Dell and its subsidiaries and their respective representatives may initiate, solicit and encourage any alternative acquisition proposals fromthird parties, provide nonpublic information to such third parties and participate in discussions and negotiations with such third parties regarding alternativeacquisition proposals. Under the terms and conditions set forth in the merger agreement, before the company stockholder approvals adopting the mergeragreement, the Board of Directors may change its recommendation, including in order to approve, and may authorize Dell to enter into, an alternativeacquisition proposal if the special committee of the Board of Directors that recommended approval of the merger has determined in good faith, afterconsultation with outside counsel and its financial advisors, that such alternative acquisition proposal would be more favorable to Dell's stockholders, takinginto account all of the terms and conditions of such proposal (including, among other things, the financing, likelihood and timing of its consummation andany adjustments to the merger agreement).
The merger agreement contains certain termination rights for Dell and Parent. Among such rights, and subject to certain limitations, either Dell or Parent mayterminate the merger agreement if the merger is not completed by November 5, 2013.
Additional information about the merger agreement is set forth in our current report on Form 8 ‑K filed with the SEC on February 6, 2013.
Business Strategy
Dell built its reputation as a leading technology provider through listening to customers and developing solutions that meet customer needs. A few years ago,we initiated a broad transformation of the company to become an end-to-end technology solutions provider, and we remain committed to this transformation.We believe that changing our corporate structure to align with our product and services business units will allow us to better serve and demonstrate oursolutions capabilities to our customers and execute our strategy. This change will correspond with how we intend to manage the performance of our productand services offerings. Accordingly, on January 10, 2013, we announced our intention to replace our current segment reporting structure described in theOperating Business Segments section below with the following product and services business units in the first quarter of Fiscal 2014:
• End-User Computing Group (“EUC”)• Enterprise Solutions Group (“ESG”)• Dell Services• Dell Software Group
EUC will include notebooks, desktop PCs, thin client products, tablets, third-party software, and client-related peripherals. ESG will include servers,networking, storage, converged infrastructure offerings, and ESG-related peripherals. Dell Services will include a broad range of IT and business services,including support and deployment services, infrastructure, cloud, and security services, and applications and business process services. The Dell SoftwareGroup will include systems management, security, and information management. See the Product and Services section below for a more detailed discussion ofour offerings.
Products and Services
We design, develop, manufacture, market, sell, and support a wide range of products and services.
• Client - We offer a wide variety of client computing devices, including desktop PCs, notebooks, and tablets, designed with customer needs in mind. Ourofferings balance performance, manageability, design, and security. In Fiscal 2013, we expanded our thin client offerings through the acquisition of WyseTechnologies, which has enabled us to develop features such as our cloud-based mobile computing offerings. In addition, we introduced a portfolio ofWindows-8 touch-enabled tablets and convertibles. Our tablet and convertible solutions are designed to optimize efficiency, while reducing the total cost ofownership for commercial customers, including the use of such solutions in the workplace as part of the "Bring Your Own Device" trend. In addition,our client solutions provide uncompromised performance for the entertainment needs of our consumer customers.
• Servers - Our servers are designed to offer customers affordable performance, reliability, and scalability. Our portfolio includes high performance rack,blade, tower, and hyperscale servers for enterprise customers and value tower servers
5

Table of Contents
for small organizations, networks, and remote offices. Our hyperscale servers are designed to maximize performance and operating efficiency in the mostintense data environments. During Fiscal 2013, we enhanced our servers with features that deliver high performance and flexibility while maximizingenergy efficiency. In addition, during the first quarter of Fiscal 2013, we introduced our 12 th generation line of PowerEdge servers, which are designed foroptimal performance.
• Networking - Our networking solutions are designed to help companies simplify their IT environments. These products employ scalable technologies thathelp companies of all sizes build for the future. Our networking solutions are designed to lower data center operating costs and improve manageability inhigh performance computing environments.
• Storage - We offer a comprehensive portfolio of advanced storage solutions, including storage area networks, network-attached storage, direct-attached
storage, and various backup systems. Our storage offerings allow customers to grow capacity, add performance, and protect their data in a moreeconomical manner. The flexibility and scalability offered by our storage systems help organizations optimize storage for diverse environments with variedrequirements. During Fiscal 2013, we enhanced our storage offerings with a number of new options, including new hardware platforms for greaterperformance and capacity, new network-attached storage gateways, which provide unified storage solutions, synchronous replication, which offers realtime data protection, and enterprise-class storage blade arrays for converged infrastructure offerings.
• Third-party software and peripherals - In connection with the sale of our product offerings, we sell a wide range of peripherals, including monitors,printers, projectors, other client and enterprise peripherals, as well as third-party software products.
• Services - Our services include a broad range of configurable IT and business services, including infrastructure technology, consulting and applications,and product-related support services. We manage our services based on a customer engagement model, which groups our services with similar demand,economic, and delivery profiles into three categories of services: support and deployment services; infrastructure, cloud, and security services; andapplications and business process services. Within those categories, we offer a variety of services to our customers as part of an overall solution.
• Support and Deployment Services - Support and deployment services are closely tied to the sale of our hardware offerings, as well asmultivendor support services. These services include support and extended warranty services, enterprise installation, and configurationservices.
• Infrastructure, Cloud, and Security Services - Infrastructure, cloud, and security services may be performed under multi-year outsourcingarrangements, subscription services, or short-term consulting contracts. These services include infrastructure and security managed services,cloud computing, infrastructure consulting, and security consulting and threat intelligence. We are often responsible for defining theinfrastructure technology strategies for our customers through the identification and delivery of new technology offerings and innovations thatdeliver value to our customers.
• Applications and Business Process Services - Applications services include such services as application development and maintenance,application migration and management services, package implementation, testing and quality assurance functions, business intelligence anddata warehouse solutions, and application consulting services. Business process services involve assuming responsibility for certain customerbusiness functions, including back office administration, call center management, and other technical and administration services.
• Software - Software is a critical component of enterprise solutions and end-user computing. Accordingly, in early Fiscal 2013, we announced theformation of our software group to expand our ability to execute in this strategic area. Our software offerings consist of system management, securitysoftware offerings, and information management. We believe our investments in this area will help support our ongoing strategic transformation to an end-to-end technology solutions provider.
For additional information about the above products and services, see “Part II - Item 7 - Management's Discussion and Analysis of Financial Condition andResults of Operations - Results of Operations - Revenue by Product and Services Categories.”
6

Table of Contents
Operating Business Segments
Through Fiscal 2013, we managed our business in four global customer-centric operating segments: Large Enterprise, Public, Small and Medium Business,and Consumer. These operating segments consist of the following types of customers:
• Large Enterprise - Our Large Enterprise customers include large global and national corporate businesses. We are focused on delivering innovativesolutions and services to these customers through data center and cloud computing solutions. We believe that continuing our transformation to anend-to-end technology solutions provider will position us for long-term success in this market.
• Public - Our Public customers include educational institutions, government, health care, and law enforcement agencies. These customers have abroad range of unique IT needs, and we strive to expand our leadership and address their urgent IT challenges through the delivery of technologysolutions that help them achieve their mission.
• Small and Medium Business ("SMB") - Our SMB segment is focused on helping small and medium-sized businesses get the most out of theirtechnology by offering scalable products, services, and solutions. As cloud computing and workforce mobility become a routine part of a growingbusiness's operations, server and storage virtualization facilitate achievement of the organization's IT goals. Through our mid-market design pointfocus, we continue to create and deliver SMB-specific solutions so customers worldwide can take advantage of these emerging technologies and growtheir businesses.
• Consumer - Our Consumer segment is focused on delivering what customers want from the total technology experience of entertainment, mobility,gaming, and design. We are designing new, innovative products and experiences with fast development cycles and competitive features and willcontinue our efforts to deliver high quality products and services to Consumer customers around the world.
We refer to our Large Enterprise, Public, and SMB segments as "Commercial." For financial information about the results of our reportable operatingsegments for each of the last three fiscal years, see “Part II - Item 7 - Management's Discussion and Analysis of Financial Condition and Results ofOperations - Results of Operations - Segment Discussion” and Note 15 of the Notes to the Consolidated Financial Statements included in “Part II - Item 8 -Financial Statements and Supplementary Data.”
Financial Services
We offer or arrange various financing options and services for our Commercial and Consumer customers in the U.S. and Canada through Dell FinancialServices ("DFS"). DFS offers a wide range of financial services, including originating, collecting, and servicing customer receivables primarily related to thepurchase of Dell products. DFS offers private label credit financing programs to qualified Consumer and Commercial customers and offers leases and fixed-term financing primarily to Commercial customers. Financing through DFS is one of many sources of funding that our customers may select. For additionalinformation about our financing arrangements, see “Part II - Item 7 - Management's Discussion and Analysis of Financial Condition and Results ofOperations - Dell Financial Services and Financing Receivables” and Note 4 of the Notes to the Consolidated Financial Statements included in “Part II -Item 8 -Financial Statements and Supplementary Data.”
During Fiscal 2012, we entered into a definitive agreement to acquire CIT Vendor Finance's Dell-related financing assets portfolio and sales and servicingfunctions in Europe for approximately $500 million. Subject to customary closing, regulatory, and other conditions, we expect to complete this transaction inFiscal 2014. In connection with this transaction, we have filed an application for a bank license with The Central Bank of Ireland to facilitate ongoingfinancing offerings in Europe. CIT Vendor Finance is currently a Dell financing preferred vendor operating in more than 25 countries and will continue tosupport Dell for the transition period in Europe. CIT Vendor Finance will also continue to provide financing programs with Dell in select countries around theworld after completion of this transaction.
Product Development
We focus on developing scalable technologies that incorporate highly desirable features and capabilities at competitive prices. We employ a collaborativeapproach to product design and development in which our engineers, with direct customer input, design innovative solutions and work with a global networkof technology companies to architect new
7

Table of Contents
system designs, influence the direction of future development, and integrate new technologies into our products. We manage our research, development, andengineering ("RD&E") spending by targeting those innovations and products that we believe are most valuable to our customers and by relying on thecapabilities of our strategic relationships. Through this collaborative, customer-focused approach, we strive to deliver new and relevant products to the marketquickly and efficiently.
To further our transformation to an end-to-end technology solutions provider, we have been increasing our investment in research and development activitiesthat support our initiatives to grow our enterprise solutions, services, and software capabilities. We currently operate 17 global research and developmentcenters, including the Dell Silicon Valley Research and Development Center. Our total research, development, and engineering expenses were $1.1 billion,$0.9 billion, and $0.7 billion for Fiscal 2013, Fiscal 2012, and Fiscal 2011, respectively. These increases reflect our focus in shifting our investments toresearch and development activities that support our initiatives to grow our enterprise solutions, services, and software offerings.
Manufacturing and Materials
Third parties manufacture the majority of the client products we sell under the Dell brand. We use contract manufacturers and manufacturing outsourcingrelationships as part of our strategy to enhance our variable cost structure and to achieve our goals of generating cost efficiencies, delivering products faster,better serving our customers, and building a world-class supply chain. Our manufacturing facilities are located in Austin, Texas; Penang, Malaysia;Chengdu, China; Xiamen, China; Hortolândia, Brazil; Chennai, India; and Lodz, Poland. See “Part I - Item 2 - Properties” for information about ourmanufacturing and distribution locations.
Our manufacturing process consists of assembly, software installation, functional testing, and quality control. Testing and quality control processes are alsoapplied to components, parts, sub-assemblies, and systems obtained from third-party suppliers. Quality control is maintained through the testing ofcomponents, sub-assemblies, and systems at various stages in the manufacturing process. Quality control also includes a burn-in period for completed unitsafter assembly, ongoing production reliability audits, failure tracking for early identification of production and component problems, and information fromcustomers obtained through services and support programs. We are certified to the ISO (International Organization for Standardization) 9001: 2008 Qualitymanagement systems standard. This certification includes most of our global sites that design, manufacture, and service our products.
We purchase materials, supplies, product components, and products from a large number of vendors. In some cases, where multiple sources of supply are notavailable, we rely on single-source vendors. In other cases, we may establish a working relationship with a single source or a limited number of sources ofsupply if we believe it is advantageous to do so due to performance, quality, support, delivery, capacity, or price considerations. We believe that anydisruption that may occur because of our dependence on single- or limited-source vendors would not disproportionately disadvantage us relative to ourcompetitors. See “Part I - Item 1A - Risk Factors” for information about the risks associated with our use of single- or limited-source suppliers.
Geographic Operations
Our global corporate headquarters is located in Round Rock, Texas. We have operations and conduct business in many countries located in the Americas,Europe, the Middle East, Asia and other geographic regions. To increase our global presence, we continue to focus on markets outside of the U.S., WesternEurope, Canada, and Japan. Our continued expansion outside of the U.S. creates additional complexity in coordinating the design, development, procurement,manufacturing, distribution, and support of our increasingly complex product and service offerings. For additional information on our product and serviceofferings, see “Products and Services - Manufacturing and Materials” and “Part I - Item 2 - Properties.” For information about percentages of revenue wegenerated from our operations outside of the U.S. and other financial information for each of the last three fiscal years, see “Part II - Item 7 - Management'sDiscussion and Analysis of Financial Condition and Results of Operations - Results of Operations” and Note 15 of the Notes to the Consolidated FinancialStatements included in “Part II - Item 8 - Financial Statements and Supplementary Data."
Competition
We operate in an industry in which there are rapid technological advances in hardware, software, and service offerings and we face ongoing product and pricecompetition in all areas of our business, including from both branded and generic competitors. We compete based on our ability to offer our customerscompetitive, scalable, and integrated solutions that provide the most current and desired product and services features. We believe that our strong relationshipswith our
8

Table of Contents
customers and our distribution channels, described below, allow us to respond to changing customer needs faster than many of our competitors.
Sales and Marketing
We sell our products and services directly to customers and through various other sales distribution channels, such as retailers, third-party solutionproviders, system integrators, and third-party resellers. Our customers include large global and national corporate businesses, public institutions that includegovernment, education, and healthcare organizations, law enforcement agencies, small and medium-sized businesses, and consumers. No single customeraccounted for more than 10% of our consolidated net revenue during any of the last three fiscal years.
Our sales efforts are organized around the evolving needs of our customers, and our marketing initiatives reflect this focus. We believe that our unified globalsales and marketing team creates a sales organization that is more customer-focused, collaborative, and innovative. Our direct business model emphasizesdirect communication with our customers, thereby allowing us to refine our products and marketing programs for specific customer groups. As part of ourtransformation to an end-to-end technology solutions provider, we have increased the number of sales specialists focused on enterprise solutions. We marketour products and services to small and medium-sized businesses and consumers through various advertising media. Customers may offer suggestions forcurrent and future Dell products, services, and operations on an interactive portion of our Internet website called Dell IdeaStorm. In order to react quickly toour customers' needs, we track our Net Promoter Score, a customer loyalty metric that is widely used across various industries. Increasingly, we also engagewith customers through our social media communities on www.dell.com and in external social media channels.
For large business and institutional customers, we maintain a field sales force throughout the world. Dedicated account teams, which include field-basedenterprise solution specialists, form long-term relationships to provide our largest customers with a single source of assistance, develop tailored solutions forthese customers, and provide us with customer feedback. For these customers, we offer several programs designed to provide single points of contact andaccountability with global account specialists, special global pricing, and consistent global service and support programs. We also maintain specific sales andmarketing programs targeted at federal, state, and local governmental agencies, as well as healthcare and educational customers.
Patents, Trademarks, and Licenses
At February 1, 2013, we held a worldwide portfolio of 4,120 patents and had an additional 2,291 patent applications pending. We also hold licenses to usenumerous third-party patents. To replace expiring patents, we obtain new patents through our ongoing research and development activities. The inventionsclaimed in our patents and patent applications cover aspects of our current and possible future computer system products, manufacturing processes, andrelated technologies. Our product, business method, and manufacturing process patents may establish barriers to entry in many product lines. While we useour patented inventions and also license them to others, we are not substantially dependent on any single patent or group of related patents. We have enteredinto a variety of intellectual property licensing and cross-licensing agreements. We have also entered into various software licensing agreements with othercompanies. We anticipate that our worldwide patent portfolio will be of value in negotiating intellectual property rights with others in the industry.
We have obtained U.S. federal trademark registration for the DELL word mark and the Dell logo mark. We ownregistrations for 158 of our other trademarks in the U.S. At February 1, 2013, we had pending applications for registration of 39 other trademarks. We believethat establishment of the DELL word mark and logo mark in the U.S. is material to our operations. We have also applied for or obtained registration of theDELL word mark and several other marks in approximately 182 other countries.
From time to time, other companies and individuals assert exclusive patent, copyright, trademark, or other intellectual property rights to technologies or marksthat are important to the technology industry or our business. We evaluate each claim relating to our products and, if appropriate, seek a license to use theprotected technology. The licensing agreements generally do not require the licensor to assist us in duplicating its patented technology, nor do these agreementsprotect us from trade secret, copyright, or other violations by us or our suppliers in developing or selling these products.
Government Regulation and Sustainability
• Government Regulation
Our business is subject to regulation by various U.S. federal and state governmental agencies and other governmental agencies. Such regulationincludes the radio frequency emission regulatory activities of the U.S.
9

Table of Contents
Federal Communications Commission; the anti-trust regulatory activities of the U.S. Federal Trade Commission, the U.S. Department of Justice,and the European Union; the consumer protection laws and financial services regulations of the U.S. Federal Trade Commission and various stategovernmental agencies; the export regulatory activities of the U.S. Department of Commerce and the U.S. Department of Treasury; the importregulatory activities of U.S. Customs and Border Protection; the product safety regulatory activities of the U.S. Consumer Product SafetyCommission and the U.S. Department of Transportation; the investor protection and capital markets regulatory activities of the U.S. Securities andExchange Commission; the health information privacy and security requirements of the U.S. Department of Health and Human Services; and theenvironmental, employment and labor, and other regulatory activities of a variety of governmental authorities in each of the countries in which weconduct business. We were not assessed any material environmental fines, nor did we have any material environmental remediation or otherenvironmental costs, during Fiscal 2013.
• Sustainability
Environmental stewardship and social responsibility are both integral parts of how we manage our business, and complement our focus on businessefficiencies and customer satisfaction. We use open dialogue with our stockholders, customers, vendors, and other stakeholders as part of oursustainability governance process in which we solicit candid feedback and offer honest discussions on the challenges we face globally. Ourenvironmental initiatives take many forms, including maximizing product energy efficiency, reducing and eliminating sensitive materials from ourproducts, and providing responsible, convenient computer recycling options for customers.We were the first company in our industry to offer a free worldwide recycling program for our consumers. We also provide consumers with no-chargerecycling of any brand of computer or printer with the purchase of a new Dell computer or printer. We have streamlined our transportation network toreduce transit times, minimize air freight, and reduce emissions. Our packaging is designed to minimize box size and to increase recycled content ofmaterials along with recyclability. When developing and designing products, we select materials guided by a precautionary approach in which weseek to eliminate environmentally sensitive substances (where reasonable alternatives exist) from our products and work towards developing reliable,environmentally sound, and commercially scalable solutions. We also have created a series of tools that help customers assess their current IToperations and uncover ways to reduce both the costs of those operations and their impact on the environment.
Iran Sanctions
Section 219 of the Iran Threat Reduction and Syria Human Rights Act of 2012 added Section 13(r) to the Securities Exchange Act of 1934. Section 13(r)requires an issuer to disclose in its annual or quarterly reports filed with the SEC whether the issuer or any of its affiliates has knowingly engaged in certainactivities, transactions or dealings relating to Iran or with designated natural persons or entities involved in terrorism or the proliferation of weapons of massdestruction.
We are disclosing the following information pursuant to Section 13(r) concerning activity by a UK affiliate of Quest Software, Inc. (“Quest Software”), whichDell acquired on September 27, 2012. The disclosure is regarding a maintenance services software renewal transaction with Melli Bank PLC valued at 106.13British pounds (approximately $169.90 at the exchange rate for U.S. dollars on the renewal date) and marketing activity.
Quest Software specializes in business software. On September 10, 2012, prior to our acquisition of Quest Software, Quest Software (UK) Ltd., then a UKsubsidiary of Quest Software, renewed two software maintenance licenses with Melli Bank PLC. The first license, for Quest Recovery Manager for Exchangesoftware, had been in effect for seven years before the renewal, while the second license, for Spotlight on Messaging software, had been in effect for four yearsbefore the renewal. Recovery Manager for Exchange software enables users to search and retrieve message-level data and compare contents between differentmailboxes. Spotlight on Messaging is a business software program that helps manage messaging and real-time communications and provides troubleshootingsolutions. Marketing activity also occurred prior to and after the acquisition with respect to Quest customers generally, including Melli Bank PLC, but notransactions were concluded other than the license renewal transaction.
Melli Bank PLC is a wholly-owned subsidiary of Bank Melli in Iran. Melli Bank PLC is headquartered in London and is listed by the TreasuryDepartment's Office of Foreign Assets Control as a Specially Designated National.
The profit on the license renewal transaction was no more than the annual renewal transaction value indicated above. Following our acquisition of QuestSoftware and our discovery of the renewal transaction, we terminated all software maintenance activity under the licenses. We will not engage in future activityunder the licenses.
10
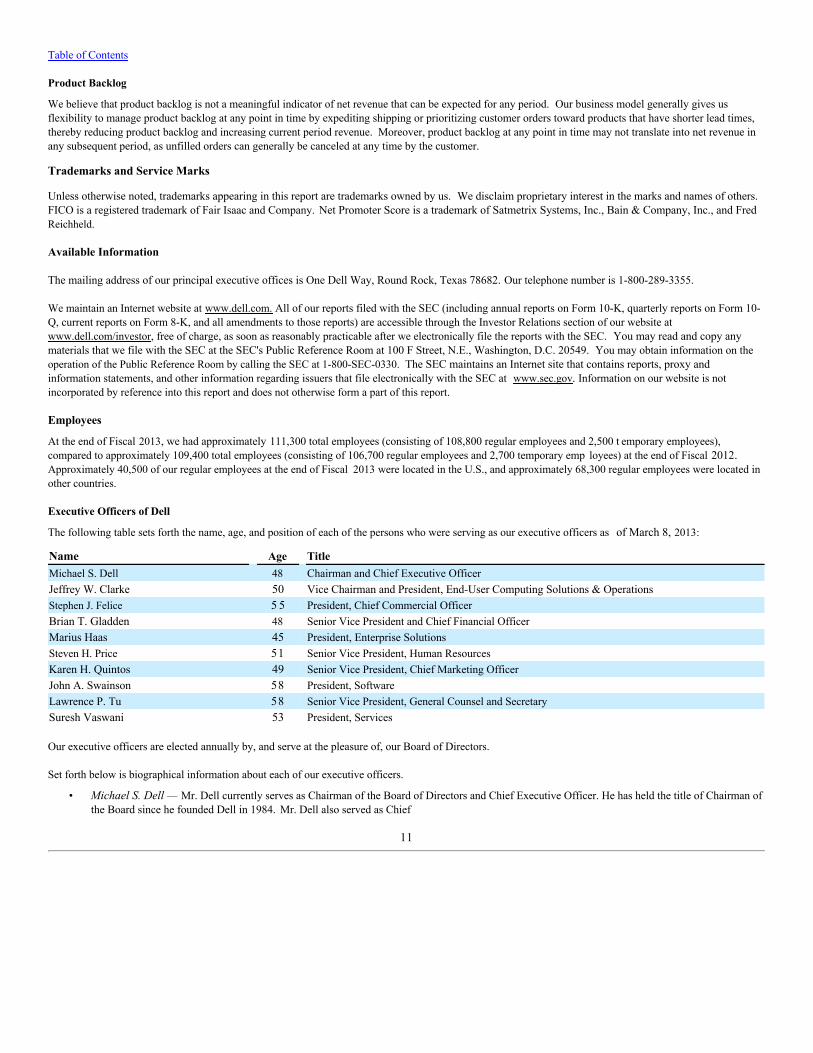
Table of Contents
Product Backlog
We believe that product backlog is not a meaningful indicator of net revenue that can be expected for any period. Our business model generally gives usflexibility to manage product backlog at any point in time by expediting shipping or prioritizing customer orders toward products that have shorter lead times,thereby reducing product backlog and increasing current period revenue. Moreover, product backlog at any point in time may not translate into net revenue inany subsequent period, as unfilled orders can generally be canceled at any time by the customer.
Trademarks and Service Marks
Unless otherwise noted, trademarks appearing in this report are trademarks owned by us. We disclaim proprietary interest in the marks and names of others.FICO is a registered trademark of Fair Isaac and Company. Net Promoter Score is a trademark of Satmetrix Systems, Inc., Bain & Company, Inc., and FredReichheld.
Available Information
The mailing address of our principal executive offices is One Dell Way, Round Rock, Texas 78682. Our telephone number is 1-800-289-3355.
We maintain an Internet website at www.dell.com. All of our reports filed with the SEC (including annual reports on Form 10-K, quarterly reports on Form 10-Q, current reports on Form 8-K, and all amendments to those reports) are accessible through the Investor Relations section of our website atwww.dell.com/investor, free of charge, as soon as reasonably practicable after we electronically file the reports with the SEC. You may read and copy anymaterials that we file with the SEC at the SEC's Public Reference Room at 100 F Street, N.E., Washington, D.C. 20549. You may obtain information on theoperation of the Public Reference Room by calling the SEC at 1-800-SEC-0330. The SEC maintains an Internet site that contains reports, proxy andinformation statements, and other information regarding issuers that file electronically with the SEC at www.sec.gov. Information on our website is notincorporated by reference into this report and does not otherwise form a part of this report. Employees
At the end of Fiscal 2013, we had approximately 111,300 total employees (consisting of 108,800 regular employees and 2,500 t emporary employees),compared to approximately 109,400 total employees (consisting of 106,700 regular employees and 2,700 temporary emp loyees) at the end of Fiscal 2012.Approximately 40,500 of our regular employees at the end of Fiscal 2013 were located in the U.S., and approximately 68,300 regular employees were located inother countries.
Executive Officers of Dell
The following table sets forth the name, age, and position of each of the persons who were serving as our executive officers as of March 8, 2013:
Name Age TitleMichael S. Dell 48 Chairman and Chief Executive OfficerJeffrey W. Clarke 50 Vice Chairman and President, End-User Computing Solutions & OperationsStephen J. Felice 5 5 President, Chief Commercial OfficerBrian T. Gladden 48 Senior Vice President and Chief Financial OfficerMarius Haas 45 President, Enterprise SolutionsSteven H. Price 51 Senior Vice President, Human ResourcesKaren H. Quintos 49 Senior Vice President, Chief Marketing OfficerJohn A. Swainson 58 President, SoftwareLawrence P. Tu 58 Senior Vice President, General Counsel and SecretarySuresh Vaswani 53 President, Services
Our executive officers are elected annually by, and serve at the pleasure of, our Board of Directors.
Set forth below is biographical information about each of our executive officers.
• Michael S. Dell — Mr. Dell currently serves as Chairman of the Board of Directors and Chief Executive Officer. He has held the title of Chairman ofthe Board since he founded Dell in 1984. Mr. Dell also served as Chief
11

Table of Contents
Executive Officer of Dell from 1984 until July 2004 and resumed that role in January 2007. He is an honorary member of the Foundation Board ofthe World Economic Forum and is an executive committee member of the International Business Council. In addition, he serves as the chairman ofthe Technology CEO Council and is a member of the U.S. Business Council and the Business Roundtable. He also serves on the governing board ofthe Indian School of Business in Hyderabad, India, and is a board member of Catalyst, Inc.
• Jeffrey W. Clarke — Mr. Clarke serves as Vice Chairman and President, End User Computing Solutions & Operations. In this role, in which hehas served since January 2009, he is responsible for global manufacturing, procurement, and supply chain activities worldwide, as well as theengineering, design and development of desktop PCs, notebooks, and workstations for customers ranging from consumers and small and medium-sized businesses to large corporate enterprises. From January 2003 until January 2009, Mr. Clarke served as Senior Vice President, Business ProductGroup. From November 2001 to January 2003, Mr. Clarke served as Vice President and General Manager, Relationship Product Group. In 1995,Mr. Clarke became the director of desktop development. Mr. Clarke joined Dell in 1987 as a quality engineer and has served in a variety ofengineering and management roles. Mr. Clarke received a Bachelor's degree in Electrical Engineering from the University of Texas at San Antonio.
• Stephen J. Felice — Mr. Felice was named President, Chief Commercial Officer in January 2012. From November 2009 until January 2012, heserved as President, Consumer, Small and Medium Business. Mr. Felice leads the Dell organization that creates and delivers specific solutions andtechnology to Commercial customers globally and is responsible for Dell's portfolio of products, including desktop PCs, laptops, software andperipherals, as well as product design and sales. From January 2009 until November 2009, Mr. Felice served as President, Small and MediumBusiness, and from March 2007 until January 2009, as Senior Vice President and President, Asia Pacific-Japan, after having served as VicePresident, Asia Pacific-Japan since August 2005. In those positions, Mr. Felice was responsible for Dell's operations throughout the APJ region,including sales and customer service centers in Penang, Malaysia, and Xiamen, China. From February 2002 until July 2005, Mr. Felice was VicePresident, Corporate Business Group, Dell Americas. Mr. Felice joined Dell in February 1999 and has held various executive roles in our sales andconsulting services organizations. Prior to joining Dell, Mr. Felice served as Chief Executive Officer and President of DecisionOne Corp. Mr. Felicealso served as Vice President, Planning and Development, with Bell Atlantic Customer Services, and spent five years with Shell Oil in Houston.Mr. Felice holds a Bachelor's degree in Business Administration from the University of Iowa and a Master of Business Administration degree fromthe University of Houston.
• Brian T. Gladden — Mr. Gladden serves as Senior Vice President and Chief Financial Officer (“CFO”). In this role, in which he has served sinceJune of 2008, he is responsible for all aspects of Dell's finance functions, including accounting, financial planning and analysis, tax, treasury,corporate development and strategy, and investor relations. He is also responsible for Dell's information technology and global security and facilitiesfunctions. Prior to joining Dell, Mr. Gladden was President and CEO of SABIC Innovative Plastics Holding BV from August 2007 throughMay 2008. Prior to this role, Mr. Gladden spent nearly 20 years with General Electric Company (“GE”) in a variety of financial and managementleadership roles. He is a member of the University of Texas McCombs School of Business Advisory Council. Mr. Gladden earned a Bachelor ofScience degree in Business Administration and Finance from Millersville University in Millersville, Pennsylvania.
• Marius Haas — Marius Haas joined Dell in August 2012 and serves as President, Enterprise Solutions. In this role, he is responsible forworldwide engineering, design, development, and marketing of Dell enterprise solutions, which include servers, networking, and storage systems.From 2011 until August 2012, Mr. Haas served with Kohlberg Kravis Roberts & Co. L.P. (“KKR”), a global private equity firm, where he wasresponsible for identifying and pursuing new investments, particularly in the technology sector, while also supporting existing portfolio companieswith operational expertise. Prior to 2011, Mr. Haas was Senior Vice President and Worldwide General Manager of the Hewlett-Packard (“HP”)Networking Division from 2008 to 2011, and also served as Senior Vice President of Strategy and Corporate Development from 2003 to 2008. Duringhis tenure at HP, Mr. Haas led initiatives to improve efficiency and drive growth, including the execution and integration of all acquisitions, and alsomanaged the company's strategic planning process, new business incubation and strategic alliances. Earlier in his career, Mr. Haas held a wide rangeof senior operations roles at Compaq and Intel Corporation. He also served as a member of the McKinsey & Company CSO Council, the Ernst &Young Corporate Development Leadership Network, and as a board member of the Association of Strategic Alliance Professionals. Mr. Haas holds aBachelor's degree from Georgetown University and a Master's degree in International Management from the American Graduate School of IntegrationManagement (Thunderbird) in Glendale, Arizona.
12

Table of Contents
• Steven H. Price — Mr. Price serves as Senior Vice President, Human Resources. In this role, he is responsible for overall human resources ("HR")strategy in support of the purpose, values and business initiatives of Dell. He is also responsible for developing and driving people strategy andfostering an environment where the global Dell team thrives. Mr. Price joined Dell in February 1997 and has played leadership roles throughout theHR organization, including Vice President of HR for the global Consumer business, Global Talent Management and Americas Human Resources.From November 2006 until June 2010, he served as Vice President, Human Resources Dell Global Consumer Group. From January 2003 untilNovember 2006, he served as Vice President, Human Resources Dell Americas Business Group. From July 2001 until January 2003, he served asVice President, Human Resources Global HR Operations. From May 1999 to July 2001, he served as Vice President, Human Resources DellEMEA. Prior to joining Dell in 1997, Mr. Price spent 13 years with SC Johnson Wax, based in Racine, Wisconsin. Having started his career therein sales, he later moved into HR, where he held a variety of senior positions. Mr. Price is a member of the Executive Advisory Board for the RawlsCollege of Business at Texas Tech University and also serves on the Executive Advisory Board for The Wharton School at the University ofPennsylvania. He holds a Bachelor's degree in Business from Southwestern Oklahoma State University and a Master's degree in BusinessAdministration from the University of Central Oklahoma.
• Karen H. Quintos — Karen Quintos is Senior Vice President and Chief Marketing Officer (“CMO”) for Dell, where she leads marketing for Dell'sglobal commercial business. She is also responsible for Dell's brand strategy, global communications, social media, corporate responsibility,customer insights, marketing talent development, and agency management. Ms. Quintos is also the executive sponsor of the largest employee resourcegroup at Dell, Women in Search of Excellence. Before becoming CMO in September 2010, Ms. Quintos served as Vice President of Dell's globalPublic business, from January 2008 to September 2010, and was responsible for driving global marketing strategies, product and pricing programs,communications, and channel plans. She has also held various executive roles in SMB marketing and Dell's Services and Supply ChainManagement teams since joining Dell in 2000. She came to Dell from Citigroup, where she served as Vice President of Global Operations andTechnology. She also spent 12 years with Merck & Co., where she held a variety of roles in marketing, planning, operations, and supply chainmanagement. Ms. Quintos holds a Master's degree in Marketing and International Business from New York University and a Bachelor of Sciencedegree in Supply Chain Management from The Pennsylvania State University State College. She has served on multiple boards of directors andcurrently serves on the Ad Council, the Susan G. Komen for the Cure, and the Penn State's Smeal Business School.
• John A. Swainson — Mr. Swainson joined Dell in February 2012. He currently serves as President of Dell's newly formed Software Group.Immediately prior to joining Dell, Mr. Swainson was a Senior Advisor to Silver Lake Partners, a global private equity firm, from May 2010 toFebruary 2012. From February 2005 until December 2009, Mr. Swainson served as Chief Executive Officer and Director of CA, Inc., an enterprisesoftware company. Prior to joining CA, Inc. Mr. Swainson worked for IBM for over 26 years, where he held various management positions in theU.S. and Canada, including seven years in the role of General Manager of the Application Integration Middleware Division. Mr. Swainson holds aBachelor's degree in Engineering from the University of British Colombia, Canada. He currently serves on the board of directors of Visa Inc. Mr.Swainson also served on the boards of directors of Cadence Design Systems, Inc., from February 2006 to May 2012, Assurant Inc., from May2010 to May 2012, and Broadcom Corporation, from August 2010 to May 2012.
• Lawrence P. Tu — Mr. Tu joined Dell as Senior Vice President, General Counsel and Secretary in July 2004, and is responsible for overseeing Dell'sglobal legal, governmental affairs, and ethics and compliance departments. Before joining Dell, Mr. Tu served as Executive Vice President andGeneral Counsel at NBC Universal for three years. Prior to his position at NBC, he was a partner with the law firm of O'Melveny & Myers LLP,where he focused on energy, technology, internet, and media-related transactions. He also served five years as managing partner of the firm's HongKong office. Mr. Tu's prior experience also includes serving as General Counsel Asia-Pacific for Goldman Sachs, attorney for the U.S. StateDepartment, and law clerk for U.S. Supreme Court Justice Thurgood Marshall. Mr. Tu holds Juris Doctor and Bachelor of Arts degrees fromHarvard University, as well as a Master's degree from Oxford University, where he was a Rhodes Scholar.
• Suresh C. Vaswani — Suresh Vaswani joined Dell in April 2011, and was named President of Services, the global IT services and businesssolutions unit of Dell, in December 2012. In this role, he is responsible for developing and delivering end-to-end IT services and business solutionsfor various customers. From April 2011 to December 2012, Mr. Vaswani led the global Applications & Business Process Outsourcing servicesbusiness for Dell Services. He also served as chairman for Dell India. In this role, Mr. Vaswani was responsible for building
13

Table of Contents
next-generation solutions, providing strategic leadership to grow and expand Dell's presence and position in the region, and enhancing Dell'scapabilities in India with regard to IT services, delivery, manufacturing, and operations. Prior to joining Dell, Mr. Vaswani was joint-CEO of WiproLimited's IT business and a member of the board of directors of that company. Mr. Vaswani holds an Engineering degree from the Indian Institute ofTechnology, Kharagpur and a degree in Business Administration from the Indian Institute of Management, Ahmedabad.
14

Table of Contents
ITEM 1A — RISK FACTORS
Our business, operating results, financial condition, and prospects are subject to a variety of significant risks, many of which are beyond our control. Thefollowing is a description of some of the important risk factors that may cause our actual results in future periods to differ substantially from those wecurrently expect or seek. The risks described below are not the only risks facing us. There are additional risks and uncertainties not currently known to us orthat we currently deem to be immaterial that also may materially adversely affect our business, operating results, financial condition, or prospects.
• If our proposed merger does not close, our operations after any termination of the merger agreement may suffer from the effects of businessuncertainties resulting from announcement of the transaction, contractual restrictions on our activities during the period in which we aresubject to the merger agreement, and costs associated with the proposed transaction.
Uncertainty about the effect of the proposed merger on our employees, customers, and other parties may have an adverse effect on our business.Such uncertainty may impair our ability to attract, retain, and motivate key personnel, including our executive leadership, and could causecustomers, suppliers, financial counterparties, and others to seek to change existing business relationships with us.
The merger agreement restricts us, without the consent of the other merger parties, from making certain acquisitions and investments, from accessingthe debt and capital markets, and from taking other specified actions until the proposed merger occurs or the merger agreement terminates. Therestrictions may prevent us from pursuing otherwise attractive business opportunities and taking other actions with respect to our business that wemay consider advantageous.
Our costs of accessing funds in the debt and capital markets may continue for some period to be higher than before execution of the merger agreementas a result of the downgrading of our credit rating that occurred after announcement of the transaction.
We have incurred, and will continue to incur, significant costs, expenses, and fees for professional services and other transaction costs in connectionwith the proposed merger. Many of the fees and costs will be payable by us even if the merger is not completed.
• We face intense competition, which may adversely affect our industry unit share position, revenue, and profitability.
We operate in an industry in which there are rapid technological advances in hardware, software, and service offerings, and we face aggressiveproduct and price competition from both branded and generic competitors. We compete based on our ability to offer to our customers competitiveintegrated solutions that provide the most current and desired product and services features. We expect that competition will continue to be intense,and there is a risk that our competitors' products may be less costly, provide better performance or include additional features when compared to ourproducts. Additionally, there is a risk that our product portfolios may quickly become outdated or our market share may quickly erode. Moreover,our efforts to balance our mix of products and services to optimize profitability, liquidity, and growth may put pressure on our industry position.
In addition to competitive factors we face as a result of the current state of our business and our industry, we confront other competitive challenges asour business and industry continue to grow and evolve. As the industry continues to expand globally, we may see new and increased competition indifferent geographic regions. Moreover, the generally low barriers to entry in our business increase the potential for challenges from new industrycompetitors. We may also see increased competition from new types of products as the options for mobile and cloud computing solutions increase.Further, as our industry evolves and our company grows, companies with which we have strategic alliances may become competitors in otherproduct areas or our current competitors may enter into new strategic relationships with new or existing competitors, all of which may furtherincrease the competitive pressures we face.
• Our reliance on vendors for products and components, many of whom are single-source or limited-source suppliers, could harm our
business by adversely affecting product availability, delivery, reliability, and cost.
We maintain several single-source or limited-source supplier relationships, including our relationships with third-party software providers, eitherbecause multiple sources are not readily available or because the relationships are advantageous to us due to performance, quality, support, delivery,capacity, or price considerations. If the supply of a
15

Table of Contents
critical single- or limited-source product or component is delayed or curtailed, we may not be able to ship the related product in desired quantities orconfigurations, or in a timely manner. In addition, we may not be able to replace the functionality provided by the third-party software currentlyoffered with our products if that software becomes obsolete, defective, or incompatible with future versions of our products or is not adequatelymaintained or updated. Even where multiple sources of supply are available, qualification of the alternative suppliers and establishment of reliablesupplies could result in delays and a possible loss of sales, which could harm our operating results.
We obtain many of our products and all of our components from third-party vendors, many of which are located outside of the U.S. In addition,significant portions of the products we sell are now assembled by contract manufacturers, primarily in various locations in Asia. A significantconcentration of this outsourced manufacturing is currently performed by only a few of our contract manufacturers, often in single locations. We sellcomponents to these contract manufacturers and generate large non-trade accounts receivables, an arrangement that would present a risk ofuncollectibility if the financial condition of a contract manufacturer should deteriorate.
While these relationships generate cost efficiencies, they reduce our direct control over production. Our increasing reliance on these vendors subjectsus to a greater risk of shortages and reduced control over delivery schedules of components and products, as well as a greater risk of increases inproduct and component costs. Because we maintain minimal levels of component and product inventories, a disruption in component or productavailability could harm our financial performance and our ability to satisfy customer needs. In addition, defective parts and products from thesevendors could reduce product reliability and harm our reputation.
• If we fail to achieve favorable pricing from our vendors, our profitability could be adversely affected.
Our profitability is affected by our ability to achieve favorable pricing from our vendors and contract manufacturers, including through negotiationsfor vendor rebates, marketing funds, and other vendor funding received in the normal course of business. Because these supplier negotiations arecontinuous and reflect the ongoing competitive environment, the variability in timing and amount of incremental vendor discounts and rebates canaffect our profitability. These vendor programs may change periodically, potentially resulting in adverse profitability trends if we cannot adjustpricing or variable costs. Our inability to establish a cost and product advantage, or determine alternative means to deliver value to our customers,may adversely affect our revenue and profitability.
• Adverse global economic conditions and instability in financial markets may harm our business and result in reduced net revenue andprofitability.
As a global company with customers in virtually every business and industry, our performance depends significantly on global economicconditions. Adverse economic conditions, including in many countries in Europe, where we derived a significant portion of our consolidated netrevenue for Fiscal 2013, may negatively affect customer demand for our products and services. Such economic conditions could result in postponedor decreased spending amid customer concerns over unemployment, reduced asset values, volatile energy costs, geopolitical issues, the availabilityand cost of credit, and the stability and solvency of financial institutions, financial markets, businesses, local and state governments, and sovereignnations. Weak global economic conditions also could harm our business by contributing to potential product shortages or delays, insolvency of keysuppliers, potential customer and counterparty insolvencies, and increased challenges in conducting our treasury operations. All of these possibleeffects of weak global economic conditions could negatively impact our net revenue and profitability.
• We may not successfully execute our growth strategy if we fail to manage effectively the change involved in implementing our strategicinitiatives.
Our growth strategy involves reaching more customers through new distribution channels, expanding our relationships with resellers, andaugmenting select areas of our business through targeted acquisitions and other commercial arrangements. As we reach more customers through newdistribution channels and expanded reseller relationships, we may fail to manage in an effective manner the increasingly difficult tasks of inventorymanagement and demand forecasting. Our ability to accomplish the goals of our growth strategy depends on our success in transitioning our salescapabilities in accordance with our strategy, adding to the breadth of our solutions capabilities through selective acquisitions of other businesses, andmanaging the effects of these strategic initiatives. If we are unable to meet these challenges, our results of operations could be unfavorably affected.
16

Table of Contents
• We may not successfully implement our acquisition strategy.
We acquire companies as a part of our growth strategy. These acquisitions may involve significant new risks and uncertainties that could adverselyaffect our profitability or operations, including distraction of management attention from a focus on our current business operations, increased debt,insufficient new revenue to offset expenses, inadequate return of capital, integration challenges, inability to retain employees of acquired businesses,new regulatory requirements, and liabilities and other exposures not discovered in our due diligence process. Further, our acquisitions may negativelyimpact our relationships with strategic partners if these acquisitions are seen as bringing us into competition with such partners. In addition, if wemake changes in our business strategy or if external conditions adversely affect our business operations, we may be required to record an impairmentcharge to goodwill or intangible assets. Our business could also be adversely impacted if recently or future acquired businesses perform worse thanexpected or if we do not realize expected operating efficiencies or integration benefits in a timely manner or at all.
• If our cost efficiency measures are not successful, we may become less competitive.
We continue to focus on minimizing our operating expenses through cost improvements and simplifying our structure. However, certain factors mayprevent the achievement of these goals, which may in turn negatively affect our competitive position. For example, we may experience delays orunanticipated costs in implementing our cost efficiency plans. As a result, we may not achieve our expected cost efficiencies in the time or to theextent anticipated.
• Our inability to manage solutions, product, and services transitions in an effective manner could reduce the demand for our solutions,products, and services and the profitability of our operations.
Continuing improvements in technology result in frequent new solutions, product, and services introductions, short product life cycles, andimprovements in product performance characteristics. If we cannot manage in an effective manner the transition to new solutions offerings and theseofferings' new products and services, customer demand for our solutions, products, and services could diminish and our profitability could suffer.We are increasingly sourcing new products and transitioning existing products through our contract manufacturers and manufacturing outsourcingrelationships in order to generate cost efficiencies, deliver products faster, and better serve our customers. The success of product transitions dependson a number of factors that include the availability of sufficient quantities of components at attractive costs. In addition, product transitions presentexecution challenges and risks, including the risk that new or upgraded products may have quality issues or other defects.
• We may lose customers and experience diminished profitability if we fail to deliver products and services of consistent quality.
In selling our extensive line of products and services, many of which include third-party components, we must identify and address any qualityissues associated with our offerings. Although quality testing is performed regularly to detect any quality problems and implement requiredsolutions, our failure to identify and correct significant product quality issues before sale could result in lower sales, increased warranty orreplacement expenses, and reduced customer confidence that could harm our operating results.
• Our ability to generate substantial non-U.S. net revenue is subject to additional risks and uncertainties.
Sales outside the U.S. accounted for approximately 50% of our consolidated net revenue for Fiscal 2013. Our future growth rates and success aresubstantially dependent on the continued growth of our business outside the U.S. Our international operations face many risks and uncertainties,including varied local economic and labor conditions, political instability, changes in the U.S. and international regulatory environments, tradeprotection measures, tax laws (including U.S. taxes on foreign operations), copyright levies, and foreign currency exchange rates. Any of thesefactors could adversely affect our operations and profitability.
• Our profitability may be adversely affected by our product, customer, and geographic sales mix and by seasonal sales trends.
Our overall profitability for any particular period may be adversely affected by changes in the mix of products, customers, and geographic marketsreflected in our sales for that period, as well as by seasonal trends. Our profit margins vary among products, services, customers, and geographicmarkets. For instance, our services offerings generally have a higher profit margin than our consumer products. In addition, parts of our businessare subject to
17

Table of Contents
seasonal sales trends. Among the trends with the most significant impact on our operating results, sales to government customers (particularly theU.S. federal government) are typically stronger in our third fiscal quarter, sales in Europe, the Middle East, and Africa ("EMEA") are often weakerin our third fiscal quarter, and consumer sales are typically strongest during our fourth fiscal quarter.
• We may lose revenue opportunities and experience gross margin pressure if our sales channel participants fail to perform as we expect.
In recent years, we have added third-party distributors, retailers, systems integrators, value-added resellers, and other sales channels to complementour direct sales organization so that we can reach even more end-users around the world. Our future operating results increasingly will depend on theperformance of our sales channel participants and on our success in maintaining and developing our relationships with those sales channels. Ourrevenue and gross margins could be negatively affected if the financial condition or operations of our channel participants weaken as a result ofadverse economic conditions or other business challenges, or if uncertainty regarding the demand for our products causes our channel participants toreduce their orders for our products. Further, some channel participants may consider the expansion of our direct sales initiatives to conflict withtheir business interests as distributors or resellers of our products, which could lead them to reduce their investment in the distribution and sale ofour products, or to cease all sales of our products.
• Our financial performance could suffer from any reduced access to the capital markets by us or some of our customers.
In recent years, we have been increasingly dependent on access to debt and capital sources to provide financing for our customers and to obtainfunds in the U.S. for general corporate purposes, including working capital, acquisitions, capital expenditures, funding of customer receivables,and share repurchases. In addition, we have customer financing relationships with some companies that rely on access to the debt and capitalmarkets to meet significant funding needs. Any inability of these companies to access such markets could compel us to self-fund transactions withthem or forgo customer financing opportunities, potentially harming our financial performance. The debt and capital markets may experience extremevolatility and disruption from time to time in the future, which could result in higher credit spreads in such markets and higher funding costs for us.Deterioration in our business performance, a credit rating downgrade, volatility in the securitization markets, changes in financial servicesregulation, or adverse changes in the economy could lead to reductions in debt availability. In addition, these events could also limit our ability tocontinue asset securitizations or other forms of financing from debt or capital sources, reduce the amount of financing receivables that we originate,or negatively affect the costs or terms on which we may be able to obtain capital, either in transactions permitted under the merger agreement orotherwise if our proposed merger does not close. Any of these developments could unfavorably affect our net revenue, profitability, and cash flows.
• Weak economic conditions and additional regulation could harm our financial services activities.
Our financial services activities are negatively affected by an adverse economic environment through related loan delinquencies and defaults.Although loan delinquencies and defaults have improved from higher levels in recent periods, an increase in defaults would result in greater net creditlosses, which may require us to increase our reserves for customer receivables in the future. In addition, the implementation of new financial servicesregulation, or the application of existing financial services regulation in new countries where we expand our financial services activities and relatedsupporting activities, including those related to the banking entity we are establishing in Ireland, could unfavorably impact the profitability and cashflows of our consumer financing activities.
• We are subject to counterparty default risks.
We have numerous arrangements with financial institutions that include cash and investment deposits, interest rate swap contracts, foreign currencyoption contracts, and forward contracts. As a result, we are subject to the risk that the counterparty to one or more of these arrangements will default,either voluntarily or involuntarily, on its performance under the terms of the arrangement. In times of market distress, a counterparty may defaultrapidly and without notice to us, and we may be unable to take action to cover our exposure, either because we lack the contractual ability or becausemarket conditions make it difficult to take effective action. If one of our counterparties becomes insolvent or files for bankruptcy, our abilityeventually to recover any losses suffered as a result of that counterparty's default may be limited by the liquidity of the counterparty or the applicablelegal regime governing the bankruptcy proceeding. In the event of such default, we could incur significant losses, which could harm our businessand negatively impact our results of operations and financial condition.
18

Table of Contents
• The exercise by customers of certain rights under our services contracts, or our failure to perform as we anticipate at the time we enterservices contracts, could adversely affect our revenue and profitability.
Many of our services contracts allow customers to take actions that may adversely affect our revenue and profitability. These actions includeterminating a contract if our performance does not meet specified service levels, looking to a benchmarker's opinion of market rates in order torequest a rate reduction or contract termination from us, reducing their use of our services, or terminating a contract early upon payment of agreedfees. In addition, we estimate our costs to deliver the services at the outset of the contract. If we fail to estimate accurately, our actual costs maysignificantly exceed our estimates, even for a time and materials contract, and we may incur losses on the services contracts.
• Loss of government contracts could harm our business.
Contracts with the U.S. federal, state, and local governments and foreign governments are subject to future funding that may affect the extension ortermination of programs and are subject to the right of governments to terminate for convenience or non-appropriation. There is pressure forgovernments, both domestically and internationally, to reduce spending. Funding reductions or delays could adversely impact public sector demandfor our products and services. In addition, if we violate legal or regulatory requirements, the applicable government could suspend or disbar us as acontractor, which would unfavorably affect our net revenue and profitability.
• Our business could suffer if we do not develop and protect our own intellectual property or do not obtain or protect licenses to intellectual
property developed by others on commercially reasonable and competitive terms.
If we or our suppliers are unable to develop or protect desirable technology or technology licenses, we may be prevented from marketing products,could be forced to market products without desirable features, or could incur substantial costs to redesign products, defend or enforce legal actions,or pay damages if we are found to have violated others' intellectual property. Although our suppliers might be contractually obligated to obtain orprotect such licenses and indemnify us against related expenses, those suppliers could be unable to meet their obligations. Similarly, we invest inresearch and development and obtain additional intellectual property through acquisitions, but these activities do not guarantee that we will develop orobtain intellectual property necessary for profitable operations. Costs involved in developing and protecting rights in intellectual property may have anegative impact on our business. In addition, our operating costs could increase because of copyright levies or similar fees by rights holders andcollection agencies in European and other countries.
• Infrastructure disruptions could harm our business.
We depend on our information technology and manufacturing infrastructure to achieve our business objectives. A disruption of our infrastructurecould be caused by a natural disaster, manufacturing failure, telecommunications system failure, or defective or improperly installed new orupgraded business management systems. Portions of our IT infrastructure also may experience interruptions, delays, or cessations of service orproduce errors in connection with systems integration or migration work that takes place from time to time. In the event of any such disruption, wemay be unable to receive or process orders, manufacture and ship products in a timely manner, or otherwise conduct our business in the normalcourse. Moreover, portions of our services business involve the processing, storage, and transmission of data, which would also be negativelyaffected by such an event. A disruption of our infrastructure could cause us to lose customers and revenue, particularly during a period of heavydemand for our products and services. We also could incur significant expense in repairing system damage and taking other remedial measures.
• We could suffer a loss of revenue and increased costs, exposure to significant liability, reputational harm, and other serious negative
consequences if we sustain cyber attacks or other data security breaches that disrupt our operations or result in the dissemination ofproprietary or confidential information about us or our customers or other third parties.
We manage and store various proprietary information and sensitive or confidential data relating to our operations. In addition, our outsourcingservices and cloud computing businesses routinely process, store, and transmit large amounts of data for our customers, including sensitive andpersonally identifiable information. We may be subject to breaches of the information technology systems we use for these purposes. Experiencedcomputer programmers and hackers may be able to penetrate our network security and misappropriate or compromise our confidential information orthat of third parties, create system disruptions, or cause shutdowns. Computer programmers and hackers also may
19

Table of Contents
be able to develop and deploy viruses, worms, and other malicious software programs that attack our products or otherwise exploit any securityvulnerabilities of our products. In addition, sophisticated hardware and operating system software and applications that we produce or procure fromthird parties may contain defects in design or manufacture, including "bugs" and other problems that could unexpectedly interfere with the operationof the system.
The costs to us to eliminate or address the foregoing security problems and security vulnerabilities before or after a cyber incident could besignificant. Our remediation efforts may not be successful and could result in interruptions, delays, or cessation of service, and loss of existing orpotential customers that may impede our sales, manufacturing, distribution, or other critical functions. We could lose existing or potential customersfor outsourcing services or other information technology solutions in connection with any actual or perceived security vulnerabilities in our products.In addition, breaches of our security measures and the unapproved dissemination of proprietary information or sensitive or confidential data aboutus or our customers or other third parties, could expose us, our customers, or other third parties affected to a risk of loss or misuse of thisinformation, result in litigation and potential liability for us, damage our brand and reputation, or otherwise harm our business. Further, we rely incertain limited capacities on third-party data management providers whose possible security problems and security vulnerabilities may have similareffects on us.
We are subject to laws, rules, and regulations in the U.S. and other countries relating to the collection, use, and security of user data. Our ability toexecute transactions and to possess and use personal information and data in conducting our business subjects us to legislative and regulatoryburdens that may require us to notify customers or employees of a data security breach. We have incurred, and will continue to incur, significantexpenses to comply with mandatory privacy and security standards and protocols imposed by law, regulation, industry standards, or contractualobligations.
• Our performance could be adversely affected by our failure to hedge effectively our exposure to fluctuations in foreign currency exchange
rates and interest rates.
We utilize derivative instruments to hedge our exposure to fluctuations in foreign currency exchange rates and interest rates. Some of theseinstruments and contracts may involve elements of market and credit risk in excess of the amounts recognized in our financial statements. If we arenot successful in monitoring our foreign exchange exposures and conducting an effective hedging program, our foreign currency hedging activitiesmay not offset the impact of fluctuations in currency exchange rates on our future results of operations and financial position.
• The expiration of tax holidays or favorable tax rate structures, unfavorable outcomes in tax audits and other tax compliance matters, or
adverse legislative or regulatory tax changes could result in an increase in our future current tax expense or our effective income tax rate.
Portions of our operations are subject to a reduced tax rate or are free of tax under various tax holidays that expire in whole or in part from time totime. Many of these holidays may be extended when certain conditions are met, or terminated if certain conditions are not met. If the tax holidays arenot extended, or if we fail to satisfy the conditions of the reduced tax rate, then our effective tax rate would increase in the future. Our effective tax ratecould also increase if our geographic sales mix changes. In addition, any actions by us to repatriate non-U.S. earnings for which we have notpreviously provided for U.S. taxes may impact our effective tax rate.
The application of tax laws to our operations and past transactions involves some inherent uncertainty. We are continually under audit in various taxjurisdictions. Although we believe our tax positions are appropriate, we may not be successful in resolving potential tax claims that arise from theseaudits. An unfavorable outcome in certain of these matters could result in a substantial increase to our tax expense. In addition, our provision forincome taxes could be impacted by changes in the valuation of deferred tax assets.
In addition, changes in tax laws (including laws relating to U.S. taxes on foreign operations) could adversely affect our operations and profitability.In recent years, numerous legislative, judicial, and administrative changes have been made in the provisions of tax laws applicable to us andcompanies similar to us. Additional changes to the tax laws are likely to continue to occur, and such changes may adversely affect our tax liability.
• Our profitability could suffer from any impairment of our portfolio investments.
We invest a significant portion of our available funds in a portfolio consisting primarily of debt securities of various types and maturities pendingthe deployment of these funds in our business. Our earnings performance could suffer
20

Table of Contents
from any impairment of our investments. Our portfolio securities generally are classified as available-for-sale and are recorded on our ConsolidatedStatements of Financial Position at fair value. If any such investments experience market price declines, we may recognize in earnings the decline inthe fair market value of such investments below their cost or carrying value when the decline is determined to be other than temporary.
• Unfavorable results of legal proceedings could harm our business and result in substantial costs.
We are involved in various claims, suits, investigations, and legal proceedings that arise from time to time in the ordinary course of our business,and in connection with our proposed merger, including those described elsewhere in this report. Additional legal claims or regulatory matters mayarise in the future and could involve stockholder, consumer, government regulatory and compliance, intellectual property, antitrust, tax, and otherissues on a global basis. Litigation is inherently unpredictable. Regardless of the merits of the claims, litigation may be both time-consuming anddisruptive to our business. We could incur judgments or enter into settlements of claims that could adversely affect our operating results or cashflows in a particular period. In addition, our business, operating results, and financial condition could be adversely affected if any infringement orother intellectual property claim made against us by any third party is successful, or if we fail to develop non-infringing technology or license theproprietary rights on commercially reasonable terms and conditions.
• Our success depends on our ability to attract, retain, and motivate our key employees.
We rely on key personnel, including our CEO and executive leadership team, to support anticipated continued rapid international growth andincreasingly complex product and services offerings. We may not be able to attract, retain, and motivate the key professional, technical, marketing,and staff resources we need.
• We face risks relating to any inability to maintain strong internal controls.
If management is not successful in maintaining a strong internal control environment, investors could lose confidence in our reported financialinformation. This could lead to a decline in our stock price, limit our ability to access the capital markets in the future, and require us to incuradditional costs to improve our internal control systems and procedures.
• Compliance requirements of current or future environmental and safety laws, or other regulatory laws, may increase our costs, expose us to
potential liability, and otherwise harm our business.
Our operations are subject to environmental and safety regulation in all of the areas in which we conduct business. Our product design andprocurement operations must comply with new and future requirements relating to climate change laws and regulations, materials composition,sourcing, energy efficiency and collection, recycling, treatment, transportation, and disposal of our electronics products, including restrictions onmercury, lead, cadmium, lithium metal, lithium ion, and other substances. If we fail to comply with applicable rules and regulations regarding thetransportation, source, use, and sale of such regulated substances, we could be subject to liability. The costs and timing of costs underenvironmental and safety laws are difficult to predict, but could have an unfavorable impact on our business.
In addition, we are subject to provisions of the Dodd-Frank Wall Street Reform and Consumer Protection Act intended to improve transparency andaccountability concerning the supply of minerals originating from the conflict zones of the Democratic Republic of Congo or adjoining countries. Weare incurring costs to comply with the new disclosure requirements of this law and may realize other costs relating to the sourcing and availability ofminerals used in our products. Further, since our supply chain is complex, we may face reputational harm if our customers or other stakeholdersconclude that we are unable to verify sufficiently the origins of the minerals used in the products we sell.
• Armed hostilities, terrorism, natural disasters, or public health issues could harm our business.
Armed hostilities, terrorism, natural disasters, or public health issues, whether in the U.S. or abroad, could cause damage or disruption to us, oursuppliers, or our customers, or could create political or economic instability, any of which could harm our business. For example, the earthquakeand tsunami in Japan and severe flooding in Thailand which occurred during Fiscal 2012 caused damage to infrastructure and factories thatdisrupted the supply chain for a variety of components used in our products. Any such future events could cause a decrease in demand for ourproducts, could make it difficult or impossible for us to deliver products or for our suppliers to deliver components, and could create delays andinefficiencies in our supply chain.
21

Table of Contents
ITEM 1B — UNRESOLVED STAFF COMMENTS
None.
22

Table of Contents
ITEM 2 — PROPERTIES
At February 1, 2013, we owned or leased a total of approximately 20.0 million square feet of office, manufacturing, and warehouse space worldwide,approximately 8.5 million square feet of which is located in the U.S. We owned approximately 49% of this space and leased the remaining 51%. Included inthese amounts are approximately 0.8 million square feet that is either vacant or sublet.
Our principal executive offices, including global headquarters, are located at One Dell Way, Round Rock, Texas. Our business centers, which includefacilities that contain operations for sales, technical support, administrative, and support functions, occupy 13.9 million square feet of space, of which weown 45%. Our manufacturing operations occupy 2.8 million square feet of manufacturing space, of which we own 79%. In addition, our research anddevelopment centers are housed in 2.5 million square feet of space, of which we own 38%.
During Fiscal 2013, we continued construction of a business center in Coimbatore, India. We expect to open this facility in early Fiscal 2014. We believe thatour existing properties are suitable and adequate for our current needs and that we can readily meet our requirements for additional space at competitive ratesby extending expiring leases or by finding alternative space.
As discussed in “Part I — Item 1 — Business,” t hrough Fiscal 2013, we managed our business in four global customer-centric operating segments: LargeEnterprise, Public, Small and Medium Business, and Consumer. Because of the interrelation of the products and services offered in each of these segments,we do not designate our properties to any segment. All four segments use substantially all of the properties at least in part, and we retain the flexibility to makefuture use of each of the properties available to each of the segments.
ITEM 3 — LEGAL PROCEEDINGS
The information required by this Item 3 is incorporated herein by reference to the information set forth under the caption “Legal Matters” in Note 10 of theNotes to the Consolidated Financial Statements included in “Part II — Item 8 — Financial Statements and Supplementary Data.”
ITEM 4 — MINE SAFETY DISCLOSURES
Not applicable.
23

Table of Contents
PART II
ITEM 5 — MARKET FOR REGISTRANT’S COMMON EQUITY, RELATED STOCKHOLDER MATTERS AND ISSUER PURCHASES OFEQUITY SECURITIES
Market for Common Stock
Our common stock is listed on the NASDAQ Global Select Market of The NASDAQ Stock Market LLC under the symbol DELL. Information regarding thehigh and low sales prices per share of our common stock for Fiscal 2013 and Fiscal 2012, as reported by the NASDAQ Global Select Market, is set forthbelow:
First Second Third Fourth Quarter Quarter Quarter Quarter
Fiscal year ended February 1, 2013: High $ 18.36 $ 15.92 $ 12.77 $ 14.17Low $ 15.77 $ 11.39 $ 9.11 $ 8.69
Fiscal year ended February 3, 2012: High $ 15.98 $ 17.60 $ 16.65 $ 17.88Low $ 12.99 $ 15.34 $ 13.29 $ 14.15
Dividends
On June 12, 2012, we announced that our Board of Directors adopted a dividend policy under which we paid quarterly cash dividends of $0.08 per share inthe third and fourth quarters of Fiscal 2013. We intend to continue to pay quarterly dividends subject to the Board's continuing determination that the policyand the declaration of dividends thereunder are in the best interest of our stockholders and are in compliance with applicable law. The Board of Directorsretains the power to modify, suspend, or cancel our dividend policy in any manner and at any time that it may deem necessary or appropriate in the future.Under the merger agreement described in “Part I - Business - Merger Agreement,” we may not pay dividends with a quarterly rate greater than the rate of $0.08per share authorized under our current dividend policy. HoldersAt March 6, 2013, there were 26,526 holders of record of Dell common stock.
24

Table of Contents
Stock Performance Graph
The following graph compares the cumulative total return on Dell's common stock during the last five fiscal years with the S&P 500 Index and the S&PInformation Technology Index during the same period. The graph shows the value, at the end of each of the last five fiscal years, of $100 invested in Dellcommon stock or the indices on February 1, 2008, and assumes the reinvestment of all dividends. The graph depicts the change in the value of our commonstock relative to the indices at the end of each fiscal year and not for any interim period. Historical stock price performance is not necessarily indicative offuture stock price performance.
2008 2009 2010 2011 2012 2013Dell Inc. $ 100.00 $ 46.68 $ 63.39 $ 64.62 $ 86.78 $ 68.05S&P 500 $ 100.00 $ 61.37 $ 81.71 $ 99.84 $ 104.05 $ 121.51S&P Information Technology $ 100.00 $ 63.00 $ 96.23 $ 120.69 $ 127.63 $ 138.01
25

Table of Contents
ITEM 6 — SELECTED FINANCIAL DATA
The following selected consolidated financial data for our company should be read in conjunction with “Part II — Item 7 — Management’s Discussion andAnalysis of Financial Condition and Results of Operations” and “Part II — Item 8 — Financial Statements and Supplementary Data” and are derived fromour audited consolidated financial statements included in “Part II — Item 8 — Financial Statements and Supplementary Data” or in our previously filedAnnual Reports on Form 10-K.
Fiscal Year Ended
February 1,
2013 February 3,
2012 (a) January 28,
2011 January 29,
2010 January 30,
2009 (in millions, except per share data)
Results of Operations: Net revenue $ 56,940 $ 62,071 $ 61,494 $ 52,902 $ 61,101Gross margin $ 12,186 $ 13,811 $ 11,396 $ 9,261 $ 10,957Operating income $ 3,012 $ 4,431 $ 3,433 $ 2,172 $ 3,190Income before income taxes $ 2,841 $ 4,240 $ 3,350 $ 2,024 $ 3,324Net income $ 2,372 $ 3,492 $ 2,635 $ 1,433 $ 2,478Earnings per share:
Basic $ 1.36 $ 1.90 $ 1.36 $ 0.73 $ 1.25Diluted $ 1.35 $ 1.88 $ 1.35 $ 0.73 $ 1.25
Cash dividends declared per common share $ 0.16 $ — $ — $ — $ —Number of weighted-average shares outstanding:
Basic 1,745 1,838 1,944 1,954 1,980Diluted 1,755 1,853 1,955 1,962 1,986
Cash Flow & Balance Sheet Data: Net cash provided by operating activities $ 3,283 $ 5,527 $ 3,969 $ 3,906 $ 1,894Cash, cash equivalents and investments $ 15,342 $ 18,222 $ 15,069 $ 11,789 $ 9,546Total assets $ 47,540 $ 44,533 $ 38,599 $ 33,652 $ 26,500Short-term borrowings $ 3,843 $ 2,867 $ 851 $ 663 $ 113Long-term debt $ 5,242 $ 6,387 $ 5,146 $ 3,417 $ 1,898Total stockholders’ equity $ 10,701 $ 8,917 $ 7,766 $ 5,641 $ 4,271____________________
(a) The fiscal year ended February 3, 2012 included 53 weeks.
26

Table of Contents
ITEM 7 — MANAGEMENT’S DISCUSSION AND ANALYSIS OF FINANCIAL CONDITION AND RESULTS OF OPERATIONS
All percentage amounts and ratios presented in this management's discussion and analysis were calculated using the underlying data inthousands. Unless otherwise indicated, all changes identified for the current-period results represent comparisons to results for the priorcorresponding fiscal periods. Our fiscal year is the 52 or 53 week period ending on the Friday nearest January 31. The fiscal years endedFebruary 1, 2013 ("Fiscal 2013") and January 28, 2011 ("Fiscal 2011") were 52 week periods, while the fiscal year ended February 3, 2012("Fiscal 2012") was a 53 week period. Unless the context indicates otherwise, references in this management’s discussion and analysis to “we,”“us,” “our” and “Dell” mean Dell Inc. and our consolidated subsidiaries. This section should be read in conjunction with “Part II — Item 8 —Financial Statements and Supplementary Data.”
INTRODUCTION
We are a leading global information technology company that offers our customers a broad range of products and services. We built our reputation throughlistening to customers and developing solutions that meet their needs. A few years ago, we initiated a broad transformation of the company to become an end-to-end technology solutions provider, and we continue to remain focused on this strategy. A key component of this transformation is to continue shifting ourportfolio to products and services that provide higher-value and recurring revenue streams over time. As part of this strategy, we emphasize expansion of ourenterprise solutions, which include servers, networking, and storage, as well as our services and software capabilities. We believe the most attractive areas forprofitable growth in this business include data center and information management, cloud computing, and software. Our client offerings also continue to be animportant element of our strategic transformation to an end-to-end technology solutions provider. We believe the strategic and profitable expansion of our clientofferings is critical to our long-term success.
To complement this strategy, since the beginning of Fiscal 2012, we have acquired more than twelve businesses whose offerings we can leverage with ourglobal customer base and distribution. These acquisitions have extended our core capabilities in a variety of enterprise offerings, including storage,networking, virtualized server, data center, and desktop solutions, and software-as-a-service application integration, as well as enabled expansion of ourcustomer financing activities. We completed nine of these acquisitions in Fiscal 2013, including our acquisitions of SonicWALL, Wyse Technology, andQuest Software. For further discussion regarding our acquisitions, see Note 7 of the Notes to the Consolidated Financial Statements included in “Part II - Item8 - Financial Statements and Supplementary Data.”
We believe that changing our corporate structure to align with our product and services business units will allow us to better serve and demonstrate oursolutions capabilities to our customers and execute our strategy. This change will correspond with how we intend to manage the performance of our productand services offerings. Accordingly, on January 10, 2013, we announced our intention to replace our current segment reporting structure with the followingproduct and services business units in the first quarter of Fiscal 2014:
• End-User Computing Group (“EUC”)• Enterprise Solutions Group (“ESG”)• Dell Services• Dell Software Group
Through Fiscal 2013, we continued to manage our business in four global customer-centric operating segments: Large Enterprise, Public, Small and MediumBusiness ("SMB"), and Consumer. We also refer to our Large Enterprise, Public, and SMB segments as “Commercial.” For further discussion regarding oursegments, see Note 15 of the Notes to the Consolidated Financial Statements included in “Part II - Item 8 - Financial Statements and Supplementary Data.”
Merger Agreement
On February 5, 2013, Dell announced that it had signed a definitive agreement and plan of merger (the “merger agreement”) pursuant to which it will beacquired by Denali Holding Inc. (“Parent”), a Delaware corporation owned by Michael S. Dell, the Chairman, Chief Executive Officer and founder of Dell,and investment funds affiliated with Silver Lake Partners, a global private equity firm (“Silver Lake”). Following completion of the transaction, Mr. Dell willcontinue to lead Dell as Chairman and Chief Executive Officer and will maintain a significant equity investment in Dell by contributing his Dell shares toParent and making a cash investment in Parent. Subject to the satisfaction or permitted waiver of closing conditions set forth in the
27

Table of Contents
merger agreement, the merger is expected to be consummated before the end of the second quarter of the fiscal year ending January 31, 2014.
At the effective time of the merger, each share of Dell's common stock issued and outstanding immediately before the effective time, other than certain excludedshares, will be converted into the right to receive $13.65 in cash, without interest (the “merger consideration”). Shares of common stock held by the Parentand its subsidiaries, shares held by Mr. Dell and certain of Mr. Dell's related parties (together with Mr. Dell, the “MD Investors”), and by Dell or any wholly-owned subsidiary of Dell will not be entitled to receive the merger consideration.
Dell's stockholders will be asked to vote on the adoption of the merger agreement and the merger at a special stockholders meeting that will be held on a date tobe announced. The closing of the merger is subject to a non-waivable condition that the merger agreement be adopted by the affirmative vote of the holders of(1) at least a majority of all outstanding shares of common stock and (2) at least a majority of all outstanding shares of common stock held by stockholdersother than Parent and its subsidiaries, the MD Investors, any other officers and directors of Dell or any other person having any equity interest in, or any rightto acquire any equity interest in, Parent's merger subsidiary or any person of which the merger subsidiary is a direct or indirect subsidiary. Consummation ofthe merger is also subject to certain customary conditions. The merger agreement does not contain a financing condition.
The merger agreement places limitations on Dell's ability to engage in certain types of transactions without Parent's consent during the period between thesigning of the merger agreement and the effective time of the merger. During this period, Dell may not repurchase shares of its common stock or declaredividends in excess of the quarterly rate of $0.08 per share authorized under its current dividend policy. In addition, with limited exceptions, Dell may notincur additional debt other than up to $1.8 billion under its existing commercial paper program, $2.0 billion under its revolving credit facilities, $1.5 billionunder its structured financing debt facilities, and up to $25 million of additional indebtedness. Further, other than in transactions in the ordinary course ofbusiness or within specified dollar limits and certain other limited exceptions, Dell generally may not acquire other businesses, make investments in otherpersons, or sell, lease, or encumber its material assets.
Parent has obtained equity and debt financing commitments for the transactions contemplated by the merger agreement, the aggregate proceeds of which,together with the proceeds of a rollover investment of Dell shares in Parent by the MD Investors, an investment in subordinated securities and the availablecash of Dell, will be sufficient for Parent to pay the aggregate merger consideration and all related fees and expenses. The commitment of financial institutionsto provide debt financing for the transaction is subject to a number of customary conditions, including the execution and delivery by the borrowers and theguarantors of definitive documentation consistent with the debt commitment letter.
Pursuant to the terms of a “go-shop” provision in the merger agreement, during the period beginning on the date of the merger agreement and expiring afterMarch 22, 2013, Dell and its subsidiaries and their respective representatives may initiate, solicit and encourage any alternative acquisition proposals fromthird parties, provide nonpublic information to such third parties and participate in discussions and negotiations with such third parties regarding alternativeacquisition proposals. Under the terms and conditions set forth in the merger agreement, before the company stockholder approvals adopting the mergeragreement, the Board of Directors may change its recommendation, including in order to approve, and may authorize Dell to enter into, an alternativeacquisition proposal if the special committee of the Board of Directors that recommended approval of the merger has determined in good faith, afterconsultation with outside counsel and its financial advisors, that such alternative acquisition proposal would be more favorable to Dell's stockholders, takinginto account all of the terms and conditions of such proposal (including, among other things, the financing, likelihood and timing of its consummation andany adjustments to the merger agreement).
The merger agreement contains certain termination rights for Dell and Parent. Among such rights, and subject to certain limitations, either Dell or Parent mayterminate the merger agreement if the merger is not completed by November 5, 2013.
28

Table of Contents
Presentation of Supplemental Non-GAAP Financial Measures
In this management's discussion and analysis, we use supplemental measures of our performance, which are derived from our consolidated financialinformation, but which are not presented in our consolidated financial statements prepared in accordance with accounting principles generally accepted in theUnited States of America (“GAAP”). These financial measures, which are considered “non-GAAP financial measures” under SEC rules, include our non-GAAP gross margin, non-GAAP operating expenses, non-GAAP operating income, non-GAAP net income and non-GAAP earnings per share. See “Results ofOperations — Non-GAAP Financial Measures” below for information about our use of these non-GAAP financial measures, including our reasons forincluding the measures, material limitations with respect to the usefulness of the measures, and a reconciliation of each non-GAAP financial measure to themost directly comparable GAAP financial measure.
29

Table of Contents
RESULTS OF OPERATIONS
Consolidated Operations
The following table summarizes our consolidated results of operations for each of the past three fiscal years:
Fiscal Year Ended
February 1, 2013 February 3, 2012 January 28, 2011
Dollars % of
Revenue %
Change Dollars % of
Revenue %
Change Dollars % of
Revenue
(in millions, except per share amounts and percentages)
Net revenue: Product $ 44,744 78.6% (10)% $ 49,906 80.4% —% $ 50,002 81.3%Services, including software related 12,196 21.4% — % 12,165 19.6% 6% 11,492 18.7%
Total net revenue $ 56,940 100.0% (8)% $ 62,071 100.0% 1% $ 61,494 100.0%Gross margin:
Product $ 8,061 18.0% (21)% $ 10,217 20.5% 29% $ 7,934 15.9%Services, including software related 4,125 33.8% 15 % 3,594 29.5% 4% 3,462 30.1%
Total gross margin $ 12,186 21.4% (12)% $ 13,811 22.3% 21% $ 11,396 18.5%Operating expenses $ 9,174 16.1% (2)% $ 9,380 15.2% 18% $ 7,963 12.9%Operating income $ 3,012 5.3% (32)% $ 4,431 7.1% 29% $ 3,433 5.6%Net income $ 2,372 4.2% (32)% $ 3,492 5.6% 33% $ 2,635 4.3%Earnings per share — diluted $ 1.35 N/A (28)% $ 1.88 N/A 39% $ 1.35 N/A
Other Financial Information (a) Non-GAAP gross margin $ 12,708 22.3% (10)% $ 14,165 22.8% 21% $ 11,731 19.1%Non-GAAP operating expenses $ 8,735 15.3% (3)% $ 9,030 14.5% 19% $ 7,582 12.3%Non-GAAP operating income $ 3,973 7.0% (23)% $ 5,135 8.3% 24% $ 4,149 6.7%Non-GAAP net income $ 3,017 5.3% (24)% $ 3,952 6.4% 27% $ 3,106 5.1%Non-GAAP earnings per share - diluted $ 1.72 N/A (19)% $ 2.13 N/A 34% $ 1.59 N/A_____________________
(a) Non-GAAP gross margin, non-GAAP operating expenses, non-GAAP operating income, non-GAAP net income, and non-GAAP earnings per share are not measurements of financialperformance prepared in accordance with GAAP. See “Non-GAAP Financial Measures” below for information about these non-GAAP financial measures, including our reasons forincluding the measures, material limitations with respect to the usefulness of the measures, and a reconciliation of each non-GAAP financial measure to the most directly comparableGAAP financial measure.
Overview
During 2013, our total revenue decreased 8% from the prior fiscal year. This decrease was primarily driven by a decrease in revenue from our Consumersegment, though all of our segments experienced declines in revenue during Fiscal 2013. These declines were due to weak global macro-economic conditions,competitive pricing dynamics, and increased competition from alternative mobile devices. These dynamics particularly impacted demand for our clientproducts.
The Company is currently undergoing a strategic transformation to an end-to-end technology solutions provider, and we recognize that this transformation willtake more time and investment. We expect the challenging environment we experienced in Fiscal 2013 to continue into Fiscal 2014. In the long-run, we believethat we will profitably grow revenue and operating income through the expansion of our enterprise solutions, services, and software businesses, thestabilization and strategic extension of our client offerings, and the continued execution of various cost savings initiatives. We are committed to our strategy toprovide end-to-end technology solutions to our customers, and we are continuing to make investments that improve our solutions capabilities. We will continueto balance liquidity, profitability, and growth to position the company for long-term success.
30

Table of Contents
During Fiscal 2013, net revenue from our Consumer customers decreased 20%, and represented approximately 19% of our total net revenue, while net revenuefrom our Commercial segments decreased 5%, driven by an 8% decline in net revenue from our Public customers, who continue to experience budgetaryconstraints, and a 5% decrease in net revenue from our Large Enterprise customers. Net revenue from our SMB segment decreased 1% during Fiscal 2013. Allof our Commercial segments experienced declines in revenue from client products, though for our Large Enterprise and SMB segments, these declines werepartially offset by increases in revenue from our enterprise solutions and services offerings. Overall, revenue from our client products decreased 15% duringFiscal 2013. The challenges in our client business were partially offset by increases in revenue from enterprise solutions and services. During Fiscal 2013,revenue from our enterprise solutions and services increased 4% and represented 34% of total net revenue, compared to 30% of total net revenue in Fiscal 2012.In addition, gross margin from this area grew to more than 50% of total gross margin during Fiscal 2013. Our Fiscal 2013 software acquisitions, whichprimarily consist of Quest Software and SonicWALL, are included in the results reported for enterprise solutions and services.
During Fiscal 2013, our consolidated operating income as a percentage of net revenue decreased 180 basis points to 5.3%. For our Commercial segments,operating income as a percentage of net revenue decreased 110 basis points to 9.3% during Fiscal 2013. For our Consumer segment, operating income as apercentage of net revenue decreased 330 basis points to an operating loss percentage of 0.1% during Fiscal 2013. These declines in operating income percentagewere primarily attributable to reduced gross margins for our products, due to the competitive pricing dynamics we experienced throughout Fiscal 2013,particularly for our client products. During Fiscal 2013, we observed an industry-wide migration to lower-value client offerings, where we are less competitive.We continue to manage our pricing position within our industry and pursue the development of technology solutions tailored to specific regional needs. Ourgross margins include benefits, relating primarily to vendor settlements, of approximately $320 million and $70 million for Fiscal 2013 and Fiscal 2012,respectively.
As of February 1, 2013, we had $15.3 billion of total cash, cash equivalents, and investments and $9.1 billion in total debt. In comparison, as ofFebruary 3, 2012, we had $18.2 billion of total cash, cash equivalents, and investments and $9.3 billion in total debt. We generated $3.3 billion in operatingcash flows in Fiscal 2013, compared to $5.5 billion during Fiscal 2012. The decrease in operating cash flows for Fiscal 2013 was primarily driven byunfavorable changes in working capital as well as a decrease in net income. During Fiscal 2013, we continued to maintain an efficient cash conversion cycleas well as strong cash and investment positions. We believe that we can generate cash flow from operations in excess of net income over the long term.
Revenue
Fiscal 2013 compared to Fiscal 2012
• Product Revenue — Product revenue decreased 10% during Fiscal 2013, due to declines in revenue from our client products. See "Revenue by Productand Services Categories" for further information regarding product revenue.
• Services Revenue, including software related — During Fiscal 2013, services revenue, including software related, was essentially unchanged. Revenuefrom all software related support services as well as third-party licenses are included herein. Software related support services for all of our softwareofferings as well as third party software licenses represented 31% and 32% of services revenue, including software related, for Fiscal 2013 and Fiscal2012, respectively.
During Fiscal 2013, we experienced a 4% decrease in revenue from third-party software sales, which was offset by a 1% increase in services revenue,excluding software related, as well as software support services revenue from Fiscal 2013 acquisitions. The decline in revenue from third-party softwaresales was driven by a decrease in unit sales for our client products during Fiscal 2013, compared to Fiscal 2012, which limited the sales volume of ourthird-party software products. In addition, revenue growth in this area has been impacted by our decision to reduce our participation in lower-value third-party software offerings.
During Fiscal 2013, revenue from outside the U.S. decreased 9% to $28.7 billion and represented 50% of total net revenue, while revenue from the U.S.decreased 7% to $28.2 billion. Revenue from most emerging countries declined during Fiscal 2013, due to the competitive pricing dynamics we experienced.We continue to view these geographical markets, which include the vast majority of the world's population, as a long-term growth opportunity. Accordingly,we continue to pursue development of technology solutions that meet the needs of these markets.
We manage our business on a U.S. dollar basis and factor foreign currency exchange rate movements into our pricing decisions. In addition, we utilize acomprehensive hedging strategy intended to mitigate the impact of foreign currency volatility over time. As a result of our hedging programs, the impact offoreign currency movements was not material to our total net revenue for Fiscal 2013.
31

Table of Contents
Fiscal 2012 compared to Fiscal 2011
• Product Revenue — Product revenue for Fiscal 2012 was essentially unchanged from the prior year. Product revenue increases in our Large Enterpriseand SMB segments were offset by decreases from our Public and Consumer segments. The decline in product revenue from our Public segment wasdriven by weakened demand, while the decrease in our Consumer segment revenue was largely attributable to lower average selling prices, partially offsetby an increase in sales of higher-value products.
• Services Revenue, including software related — Services revenue, including software related, increased 6% during Fiscal 2012. Revenue from allsoftware related support services as well as third-party licenses are included herein. These software related services represented 32% and 33% of servicesrevenue, including software related, for Fiscal 2012 and Fiscal 2011, respectively. Our services revenue performance during Fiscal 2012 was attributableto an 8% increase in services revenue, excluding software related, and an increase of 1% in software related revenue. All of our Commercial segmentsexperienced increases in services revenue, while Consumer services revenue decreased.
At a regional level, revenue from outside the U.S. increased 7% to $31.7 billion and represented 51% of total net revenue, while revenue from the U.S.decreased 5% to $30.4 billion. Revenue from most emerging countries increased during Fiscal 2012, compared to Fiscal 2011.
Gross Margin
Fiscal 2013 compared to Fiscal 2012
• Products — During Fiscal 2013, product gross margins decreased in absolute dollars and in gross margin percentage. Product gross margin percentagedecreased from 20.5% for Fiscal 2012 to 18.0% for Fiscal 2013. The decline in product gross margins was primarily driven by the competitive pricingdynamics we experienced in Fiscal 2013, particularly for our client products. Our gross margins include benefits, relating primarily to settlements fromcertain vendors regarding their past pricing practices, of approximately $320 million and $70 million for Fiscal 2013 and Fiscal 2012, respectively.Vendor settlements are allocated to our segments based on the relative amount of affected vendor products sold by each segment.
• Services, including software related — During Fiscal 2013, our services gross margin increased in absolute dollars and in gross margin percentage. Ourgross margin percentage for services, including software related, increased from 29.5% for Fiscal 2012 to 33.8% for Fiscal 2013. Gross marginpercentages improved for all of our services and software-related offerings, which include support and deployment services, infrastructure, cloud, andsecurity services, applications and business process services, as well as certain software-related services.
During Fiscal 2013, our total gross margin in dollars decreased 12% to $12.2 billion on a GAAP basis and 10% to $12.7 billion on a non-GAAP basis. Grossmargin on a GAAP basis for Fiscal 2013 and Fiscal 2012 includes the effects of amortization of intangible assets and of severance and facility action costsand acquisition-related charges. As set forth in the reconciliation under "Non-GAAP Financial Measures" below, these items are excluded from the calculationof non-GAAP gross margin for Fiscal 2013 and Fiscal 2012. In aggregate, these charges increased 47% to $522 million during Fiscal 2013, compared toFiscal 2012. Amortization of intangible assets included in GAAP gross margin increased 49% to $455 million during Fiscal 2013. This increase wasprimarily attributable to an increase in purchased intangible assets over the period. In addition, severance and facility action costs and acquisition-relatedcharges included in gross margin increased 37% to $67 million during Fiscal 2013, driven by an increase in severance and facility action costs.
Fiscal 2012 compared to Fiscal 2011
• Products — During Fiscal 2012, product gross margins increased in absolute dollars and in gross margin percentage. Product gross margin percentageincreased to 20.5% for Fiscal 2012 from 15.9% for Fiscal 2011. A shift away from lower-value business, better supply chain execution, a disciplinedpricing strategy in a competitive environment, and favorable component cost conditions contributed to the increase in product gross margin percentage forall of our segments.
• Services, including software related — During Fiscal 2012, our services gross margin increased in absolute dollars compared to the prior fiscal year,although our gross margin percentage decreased. The decrease in gross margin percentage for services, including software related, was primarily drivenby declines in gross margin percentages from our support and deployment and infrastructure, cloud, and security services.
Total gross margin in dollars for Fiscal 2012 increased 21% on both a GAAP and non-GAAP basis. Total gross margin on a GAAP basis for Fiscal 2012 was$13.8 billion, compared to $14.2 billion on a non-GAAP basis. Gross margin on a GAAP
32

Table of Contents
basis for Fiscal 2012 and Fiscal 2011 includes the effects of amortization of intangible assets and of severance and facility action costs and acquisition-relatedcharges. As set forth in the reconciliation under "Non-GAAP Financial Measures" below, these items are excluded from the calculation of non-GAAP grossmargin for Fiscal 2012 and Fiscal 2011. Amortization of intangible assets included in gross margin increased 10% to $305 million for Fiscal 2012. Severanceand facility action costs and acquisition-related charges included in gross margin decreased 14% to $49 million during Fiscal 2012. The overall decrease inseverance and facility action costs and acquisition-related charges was primarily due to a decrease in charges related to facility closures in Fiscal 2011, whichwas slightly offset by an increase in acquisition-related charges during Fiscal 2012.
Vendor Rebate Programs
Our gross margin is affected by our ability to achieve competitive pricing with our vendors and contract manufacturers, including through our negotiation of avariety of vendor rebate programs to achieve lower net costs for the various components we include in our products. Under these programs, vendors provideus with rebates or other discounts from the list prices for the components, which are generally elements of their pricing strategy. Vendor rebate programs areonly one element of the costs we negotiate for our product components. We account for vendor rebates and other discounts as a reduction in cost of net revenue.Our total net cost includes supplier list prices reduced by vendor rebates and other discounts. We manage our costs on a total net cost basis.
The terms and conditions of our vendor rebate programs are largely based on product volumes and are generally not long-term in nature, but instead aretypically negotiated either at the beginning of the annual or quarterly period, depending on the program. Because of the fluid nature of these ongoingnegotiations, which reflect changes in the competitive environment, the timing and amount of vendor rebates and other discounts we receive under theprograms may vary from period to period. We monitor our component costs and seek to address the effects of any changes to terms that might arise under ourvendor rebate programs. Our gross margins for Fiscal 2013 and Fiscal 2012 were not materially affected by any changes to the terms of our vendor rebateprograms, as the amounts we received under these programs were generally stable relative to our total net cost. We are not aware of any significantprogrammatic changes to vendor pricing or rebate programs that may impact our results in the near term.
In addition, we have pursued legal action against certain vendors and are currently involved in negotiations with other vendors regarding their past pricingpractices. We have negotiated settlements with some of these vendors and may have additional settlements in future quarters.
33

Table of Contents
Operating Expenses
The following table presents information regarding our operating expenses during each of the past three fiscal years:
Fiscal Year Ended
February 1, 2013 February 3, 2012 January 28, 2011
Dollars % of
Revenue %
Change Dollars % of
Revenue %
Change Dollars % of
Revenue
(in millions, except percentages)
Operating expenses: Selling, general, and administrative $ 8,102 14.2% (5)% $ 8,524 13.7% 17% $ 7,302 11.9%Research, development, andengineering 1,072 1.9% 25 % 856 1.5% 30% 661 1.0%
Total operating expenses $ 9,174 16.1% (2)% $ 9,380 15.2% 18% $ 7,963 12.9%Other Financial Information Non-GAAP operating expenses (a) $ 8,735 15.3% (3)% $ 9,030 14.5% 19% $ 7,582 12.3%
(a) For a reconciliation of non-GAAP operating expenses to operating expenses prepared in accordance with GAAP, see “Non-GAAP Financial Measures” below.
Fiscal 2013 compared to Fiscal 2012
• Selling, General, and Administrative — During Fiscal 2013, selling, general, and administrative ("SG&A") expenses decreased 5%, while SG&Aexpenses as a percentage of revenue increased. During Fiscal 2013, compensation-related expenses, excluding severance and facility action costs, decreased6%, driven by a decline in performance-based compensation, which was partially offset by an increase in sales compensation during Fiscal 2013 as weincreased the number of enterprise solutions sales specialists. Additionally, other SG&A expenses, excluding amortization of intangible assets andacquisition-related costs, decreased 6% during Fiscal 2013, primarily as a result of a decline in discretionary spending. This decline in discretionaryspending was partially offset by higher operating expenses associated with our Fiscal 2013 acquisitions, which generally have higher operating expensestructures. We are actively managing our expenses in certain areas to focus spending on strategic investments.
• Research, Development, and Engineering — During Fiscal 2013, research, development, and engineering expenses were 1.9% of net revenue, comparedto 1.5% during the prior fiscal year. This increase reflects our focus on shifting our investments to research and development activities that supportour initiatives to grow our enterprise solutions, services, and software offerings.
Total operating expenses for Fiscal 2013 decreased 2% to $9.2 billion on a GAAP basis and 3% to $8.7 billion on a non-GAAP basis. Operating expenses on aGAAP basis for Fiscal 2013 and Fiscal 2012 include the effects of amortization of intangible assets and of severance and facility action costs and acquisition-related charges. In aggregate, these charges increased 25% to $439 million during Fiscal 2013, compared to Fiscal 2012. Amortization of intangibles increased84% to $158 million during Fiscal 2013, due to our Fiscal 2012 and Fiscal 2013 acquisitions. In addition, severance and facility action costs and acquisition-related charges included in GAAP operating expenses increased 6% to $281 million during Fiscal 2013, driven by an increase in severance-related expenses.As set forth in the reconciliation under “Non-GAAP Financial Measures” below, amortization of intangibles and severance and facility action costs andacquisition-related costs are excluded from the calculation of non-GAAP operating expenses for Fiscal 2013 and Fiscal 2012.
Fiscal 2012 compared to Fiscal 2011
• Selling, General, and Administrative — During Fiscal 2012, SG&A expenses increased $1.2 billion. The overall higher level of SG&A expenses waslargely attributable to the continued execution of our strategic transformation. Our strategic initiatives have entailed organic investments in enterprisesolution selling capabilities and other infrastructure spending as well as investments in enterprise and services-focused acquisitions, which generally havehigher expense structures. During Fiscal 2012, compensation-related expenses, excluding severance-related expenses, increased approximately $967million due to a 6% increase in headcount, which was driven by our organic and inorganic investments. We also experienced an increase of $175 millionin advertising, promotional, and other selling-related expenses. In addition, higher
34

Table of Contents
SG&A expenses for Fiscal 2012 reflected increases in acquisition-related charges, which were offset in part by decreases in severance and facility actioncosts, discussed below.
• Research, Development, and Engineering — During Fiscal 2012, research, development, and engineering expenses were 1.5% of net revenue, comparedto 1.0% during the prior fiscal year. This increase reflects our focus on shifting our investments to research and development activities that supportour initiatives to grow our enterprise solutions and services offerings.
Total operating expenses for Fiscal 2012 increased 18% to $9.4 billion on a GAAP basis and 19% to $9.0 billion on a non-GAAP basis over Fiscal 2011.Operating expenses on a GAAP basis for Fiscal 2012 and Fiscal 2011 includes the effects of severance and facility action costs and acquisition-related chargesand amortization of intangible assets. These charges increased 45% to $350 million during Fiscal 2012 compared to Fiscal 2011, primarily due to an increasein acquisition-related charges as a result of the larger acquisitions that were completed in Fiscal 2012 compared to Fiscal 2011. For Fiscal 2011, operatingexpenses on a GAAP basis also included $140 million in settlements we incurred related to an SEC investigation and a securities litigation matter. As set forthin the reconciliation under “Non-GAAP Financial Measures” below, non-GAAP operating expenses for Fiscal 2012 and for Fiscal 2011 exclude the effects ofseverance and facility action costs and acquisition related charges, amortization of intangible assets, and, for Fiscal 2011, the settlements referred to above.
Operating and Net Income
Fiscal 2013 compared to Fiscal 2012
• Operating Income — During Fiscal 2013, operating income decreased in dollars and as a percentage of revenue. During Fiscal 2013, operating incomedollars and percentage declined 32% and 180 basis points, respectively, on a GAAP basis, and 23% and 130 basis points, respectively, on a non-GAAPbasis. The decreases in non-GAAP operating income percentage were driven by declines in product gross margin percentage, the effects of which werepartially offset by improved gross margin percentages for services, including software related. In addition, operating expenses as a percentage of revenueincreased during Fiscal 2013, largely due to an increase in research, development, and engineering expenses. Operating income on a GAAP basis alsoincludes increases in amortization of intangible assets, severance and facility action costs, and acquisition-related costs.
• Net Income — During Fiscal 2013, net income decreased 32% to $2.4 billion on a GAAP basis and 24% to $3.0 billion on a non-GAAP basis. Netincome on a GAAP and non-GAAP basis was impacted by decreases in operating income, though the effects on net income on a GAAP basis werepartially offset by a lower effective tax rate. See “Income and Other Taxes” below for a discussion of our effective tax rates.
Fiscal 2012 compared to Fiscal 2011
• Operating Income — During Fiscal 2012, operating income increased 29% to $4.4 billion on a GAAP basis and 24% to $5.1 billion on a non-GAAPbasis over Fiscal 2011. The increases were primarily attributable to improved gross margins, the effect of which was partially offset by an increase inselling and marketing costs.
• Net Income — During Fiscal 2012, net income increased 33% to $3.5 billion on a GAAP basis and 27% to $4.0 billion on a non-GAAP basis over Fiscal2011. Net income was positively impacted by increases in operating income and a lower effective tax rate, offset in part by unfavorable changes in interestand other, net. Interest and other, net for Fiscal 2011 was favorably impacted by our receipt of a $72 million merger termination fee. This fee is excludedfrom net income on a non-GAAP basis. See “Income and Other Taxes” and “Interest and Other, net” below for a discussion of our effective tax rates andinterest and other, net.
35

Table of Contents
Non-GAAP Financial Measures
We use non-GAAP financial measures to supplement the financial information presented on a GAAP basis. We believe that excluding certain items from ourGAAP results allows our management to better understand our consolidated financial performance from period to period and in relationship to the operatingresults of our segments, as management does not believe that the excluded items are reflective of our underlying operating performance. We also believe thatexcluding certain items from our GAAP results allows our management to better project our future consolidated financial performance because our forecasts aredeveloped at a level of detail different from that used to prepare GAAP-based financial measures. Moreover, we believe these non-GAAP financial measureswill provide investors with useful information to help them evaluate our operating results by facilitating an enhanced understanding of our operatingperformance, and enabling them to make more meaningful period to period comparisons.
The non-GAAP financial measures presented in this report include non-GAAP gross margin, non-GAAP operating expenses, non-GAAP operating income,non-GAAP net income, and non-GAAP earnings per share. These non-GAAP financial measures, as defined by us, represent the comparable GAAP measuresadjusted to exclude severance and facility action costs and acquisition-related charges, amortization of purchased intangible assets related to acquisitions, thesettlements related to an SEC investigation and a securities litigation matter, which were both incurred during the first quarter of Fiscal 2011, and a mergertermination fee, which we received during the third quarter of Fiscal 2011, and for non-GAAP net income and non-GAAP earnings per share, the aggregateadjustment for income taxes related to the exclusion of such items. We provide more detail below regarding each of these items and our reasons for excludingthem. In future fiscal periods, we may exclude such items and may incur income and expenses similar to these excluded items. Accordingly, the exclusion ofthese items and other similar items in our non-GAAP presentation should not be interpreted as implying that these items are non-recurring, infrequent, orunusual.
There are limitations to the use of the non-GAAP financial measures presented in this report. Our non-GAAP financial measures may not be comparable tosimilarly titled measures of other companies. Other companies, including companies in our industry, may calculate the non-GAAP financial measuresdifferently than we do, limiting the usefulness of those measures for comparative purposes. In addition, items such as amortization of purchased intangibleassets represent the loss in value of intangible assets over time. The expense associated with this loss in value is not included in the non-GAAP financialmeasures and such measures, therefore, do not reflect the full economic effect of such loss. Further, items such as severance and facility action costs andacquisition-related charges that are excluded from the non-GAAP financial measures can have a material impact on earnings. Our management compensates forthe foregoing limitations by relying primarily on our GAAP results and using non-GAAP financial measures supplementally or for projections whencomparable GAAP financial measures are not available. The non-GAAP financial measures are not meant to be considered as indicators of performance inisolation from or as a substitute for gross margin, operating expenses, operating income, net income, and earnings per share prepared in accordance withGAAP, and should be read only in conjunction with financial information presented on a GAAP basis. We provide below reconciliations of each non-GAAPfinancial measure to its most directly comparable GAAP financial measure, and encourage you to review the reconciliations in conjunction with thepresentation of the non-GAAP financial measures for each of the past three fiscal years.
The following is a summary of the costs and other items excluded from the most comparable GAAP financial measures to calculate the non-GAAP financialmeasures presented in this management's discussion and analysis:
• Severance and Facility Actions and Acquisition-related Costs — Severance and facility action costs are primarily related to facilities charges, includingaccelerated depreciation and severance and benefits for employees terminated pursuant to cost synergies related to strategic acquisitions and actions takenas part of a comprehensive review of costs. Acquisition-related charges are expensed as incurred and consist primarily of retention payments, integrationcosts, and other costs. Retention payments include stock-based compensation and cash incentives awarded to employees, which are recognized over thevesting period. Integration costs primarily include IT costs related to the integration of IT systems and processes, costs related to the integration ofemployees, consulting expenses, and for acquisitions made prior to Fiscal 2013, costs related to full-time employees who are working on the integration. Severance and facility actions and acquisition-related charges are inconsistent in amount and are significantly impacted by the timing and nature of theseevents. Therefore, although we may incur these types of expenses in the future, we believe that eliminating these charges for purposes of calculating thenon-GAAP financial measures facilitates a more meaningful evaluation of our current operating performance and comparisons to our past operatingperformance.
• Amortization of Intangible Assets — Amortization of purchased intangible assets consists primarily of amortization of customer relationships, acquiredtechnology, non-compete covenants, and trade names purchased in connection with business acquisitions. We incur charges relating to the amortization ofthese intangibles, and those charges are included in
36

Table of Contents
our Consolidated Financial Statements. Amortization charges for our purchased intangible assets are significantly impacted by the timing and magnitudeof our acquisitions. Accordingly, these charges may vary in amount from period to period. We exclude these charges for purposes of calculating the non-GAAP financial measures to facilitate a more meaningful evaluation of our current operating performance and comparisons to our past operatingperformance.
• Other Fees and Settlements — We also adjust our GAAP results for certain fees and settlements. During the third quarter of Fiscal 2011, we received a$72 million fee for termination of a merger agreement with us. During the first quarter of Fiscal 2011, we recorded a $100 million settlement amount forthe SEC investigation into certain of our accounting and financial matters, which was initiated in 2005, and incurred $40 million for a securities litigationclass action lawsuit that was filed against us during Fiscal 2007. We are excluding these fees and settlements for the purpose of calculating the non-GAAPfinancial measures because we believe these fees and settlements, while not unusual, are outside our ordinary course of business and do not contribute to ameaningful evaluation of our current operating performance or comparisons to our past operating performance.
• Aggregate Adjustment for Income Taxes —The aggregate adjustment for income taxes is the estimated combined income tax effect for the items describedabove. The tax effects are determined based on the jurisdictions where the items were incurred.
37
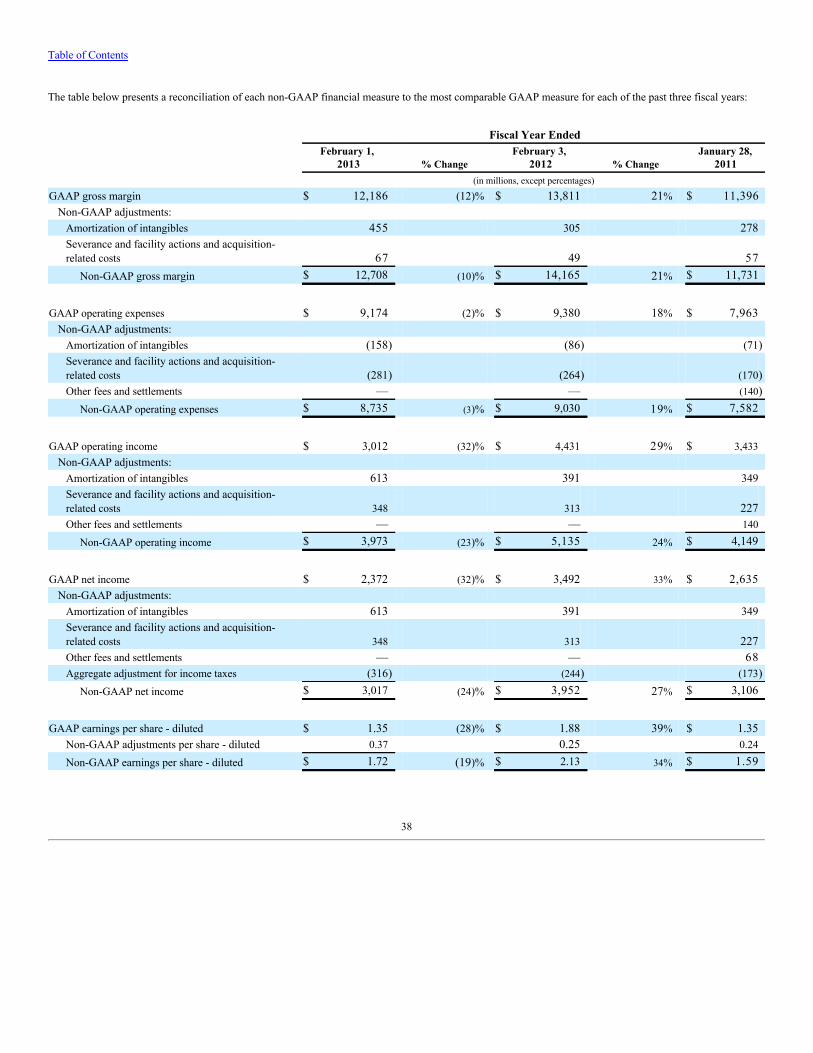
Table of Contents
The table below presents a reconciliation of each non-GAAP financial measure to the most comparable GAAP measure for each of the past three fiscal years:
Fiscal Year Ended
February 1,
2013 % Change February 3,
2012 % Change January 28,
2011 (in millions, except percentages)
GAAP gross margin $ 12,186 (12)% $ 13,811 21% $ 11,396Non-GAAP adjustments:
Amortization of intangibles 455 305 278Severance and facility actions and acquisition-related costs 67 49 57
Non-GAAP gross margin $ 12,708 (10)% $ 14,165 21% $ 11,731
GAAP operating expenses $ 9,174 (2)% $ 9,380 18% $ 7,963Non-GAAP adjustments:
Amortization of intangibles (158) (86) (71)Severance and facility actions and acquisition-related costs (281) (264) (170)Other fees and settlements — — (140)
Non-GAAP operating expenses $ 8,735 (3)% $ 9,030 19% $ 7,582
GAAP operating income $ 3,012 (32)% $ 4,431 29% $ 3,433Non-GAAP adjustments:
Amortization of intangibles 613 391 349Severance and facility actions and acquisition-related costs 348 313 227Other fees and settlements — — 140
Non-GAAP operating income $ 3,973 (23)% $ 5,135 24% $ 4,149
GAAP net income $ 2,372 (32)% $ 3,492 33% $ 2,635Non-GAAP adjustments:
Amortization of intangibles 613 391 349Severance and facility actions and acquisition-related costs 348 313 227Other fees and settlements — — 68Aggregate adjustment for income taxes (316) (244) (173)
Non-GAAP net income $ 3,017 (24)% $ 3,952 27% $ 3,106
GAAP earnings per share - diluted $ 1.35 (28)% $ 1.88 39% $ 1.35Non-GAAP adjustments per share - diluted 0.37 0.25 0.24
Non-GAAP earnings per share - diluted $ 1.72 (19)% $ 2.13 34% $ 1.59
38

Table of Contents
Fiscal Year Ended
February 1,
2013 February 3, 2012 January 28,
2011Percentage of Total Net Revenue GAAP gross margin 21.4 % 22.3 % 18.5 %
Non-GAAP adjustments 0.9 % 0.5 % 0.6 %Non-GAAP gross margin 22.3 % 22.8 % 19.1 %
GAAP operating expenses 16.1 % 15.2 % 12.9 %Non-GAAP adjustments (0.8)% (0.7)% (0.6)%
Non-GAAP operating expenses 15.3 % 14.5 % 12.3 %
GAAP operating income 5.3 % 7.1 % 5.6 %Non-GAAP adjustments 1.7 % 1.2 % 1.1 %
Non-GAAP operating income 7.0 % 8.3 % 6.7 %
GAAP net income 4.2 % 5.6 % 4.3 %Non-GAAP adjustments 1.1 % 0.8 % 0.8 %Non-GAAP net income 5.3 % 6.4 % 5.1 %
39
Table of Contents
Segment Discussion
Through Fiscal 2013, we managed our business in four global customer-centric operating segments: Large Enterprise, Public, Small and Medium Business,and Consumer. Large Enterprise includes sales of IT infrastructure and service solutions to large global and national corporate customers. Public includessales to educational institutions, governments, health care organizations, and law enforcement agencies, among others. SMB includes sales of complete ITsolutions to small and medium-sized businesses. Consumer includes sales to individual consumers, home office customers, and retailers around the world.
In the first quarter of Fiscal 2013, we made certain segment realignments in order to conform to the way we managed segment performance through Fiscal2013. These realignments affected all of our operating segments, but primarily consisted of the transfer of small office business customers from our SMBoperating segment to our Consumer segment. We have recast prior period amounts to provide visibility and comparability. None of these changes impacts ourpreviously reported consolidated net revenue, gross margin, operating income, net income, or earnings per share.
On January 10, 2013, we announced our intention to replace our current segment reporting structure with the following four product and services businessunits in the first quarter of Fiscal 2014:
• End-User Computing Group (“EUC”)• Enterprise Solutions Group (“ESG”)• Dell Services• Dell Software Group
EUC will include notebooks, desktop PCs, thin client products, tablets, third-party software, and client-related peripherals. ESG will include servers,networking, storage, converged infrastructure offerings, and ESG-related peripherals. Dell Services will include a broad range of IT and business services,including support and deployment services, infrastructure, cloud, and security services, and applications and business process services. The Dell SoftwareGroup will include systems management, security, and information management. See Note 15 of the Notes to the Consolidated Financial Statements includedin “Part II — Item 8— Financial Statements and Supplementary Data” for additional information and a reconciliation of segment revenue and operatingincome to consolidated revenue and operating income.
Broad based, long-term incentive expenses, amortization of purchased intangible assets costs, severance and facility actions and acquisition-related charges,and charges related to our settlement of an SEC investigation as well as a securities litigation class action lawsuit that were incurred during Fiscal 2011, are notallocated to the reporting segments as management does not believe that these items are reflective of the underlying operating performance of the reportingsegments. These costs totaled $1.3 billion for Fiscal 2013 and $1.1 billion for each of Fiscal 2012 and Fiscal 2011.
40

Table of Contents
The following table presents our net revenue and operating income by our reportable global segments:
Fiscal Year Ended
February 1, 2013 February 3, 2012 January 28, 2011
Dollars % of
Revenue(a) %
Change Dollars % of
Revenue(a) %
Change Dollars % of
Revenue(a)
(in millions, except percentages)
Large Enterprise Net revenue $ 17,781 31 % (5)% $ 18,786 30% 4 % $ 18,111 29%Operating income $ 1,553 8.7 % (18)% $ 1,889 10.1% 27 % $ 1,490 8.2%
Public Net revenue $ 14,828 26 % (8)% $ 16,070 26% (2)% $ 16,377 27%Operating income $ 1,238 8.3 % (22)% $ 1,584 9.9% 10 % $ 1,446 8.8%
Small and Medium Business Net revenue $ 13,413 24 % (1)% $ 13,547 22% 7 % $ 12,608 21%Operating income $ 1,505 11.2 % (5)% $ 1,581 11.7% 14 % $ 1,383 11.0%
Consumer Net revenue $ 10,918 19 % (20)% $ 13,668 22% (5)% $ 14,398 23%Operating income $ (11) (0.1)% (103)% $ 433 3.2% 141 % $ 180 1.3%
_______________________(a) Operating income percentage of revenue is stated in relation to the respective segment.
Fiscal 2013 compared to Fiscal 2012
All of our segments experienced declines in revenue during Fiscal 2013, led by a decline in revenue from our Consumer segment. These declines were due toweak global macro-economic conditions, competitive pricing dynamics, and increased competition from alternative mobile devices. These dynamicsparticularly impacted demand for our client products.
• Large Enterprise — During Fiscal 2013, Large Enterprise experienced a 5% decrease in net revenue. Servers and networking revenue and revenue fromservices increased 13% and 3%, respectively, while storage revenue declined 19%. Revenue from mobility products, desktop PCs, and third-partysoftware and peripherals decreased 16%, 11%, and 14%, respectively. Large Enterprise revenue decreased across all regions during Fiscal 2013.
During Fiscal 2013, Large Enterprise's operating income as a percentage of revenue decreased 140 basis points to 8.7%. This decrease was primarilyattributable to declines in gross margin percentages for our products, which were partially offset by improvements in our services gross marginpercentages. In addition, operating expenses as a percentage of revenue increased during Fiscal 2013, compared to Fiscal 2012, driven by an increase insales and marketing expenses as a well as an increase in research, development, and engineering expenses as a percentage of revenue.
• Public — During Fiscal 2013, Public experienced an 8% decrease in revenue, which was partially attributable to continued budgetary constraints onpublic spending. During Fiscal 2013, revenue from all product lines decreased, except for revenue from servers and networking, which increased 4%.Storage revenue and revenue from services decreased 12% and 5%, respectively, while revenue from mobility products, desktop PCs, and third-partysoftware and peripherals decreased 14%, 10%, and 8%, respectively. Public revenue decreased across all regions during Fiscal 2013, compared to Fiscal2012, led by a decline in revenue from the U.S.
During Fiscal 2013, Public's operating income as a percentage of net revenue decreased 160 basis points to 8.3%. This decrease was primarily attributableto declines in gross margin percentages for our products, which were partially offset by improvements in our services gross margin percentages. Inaddition, operating expenses as a percentage of revenue increased during Fiscal 2013, compared to Fiscal 2012, driven by an increase in sales andmarketing expenses as a well as an increase in research, development, and engineering expenses as a percentage of revenue.
• Small and Medium Business — During Fiscal 2013, SMB experienced a slight decrease in revenue, which was primarily attributable to a decrease inrevenue from our client offerings and revenue from third-party software and peripherals. The effect of the decrease in these offerings and products waslargely offset by an increase in revenue from our enterprise
41

Table of Contents
solutions and services. Servers and networking revenue and revenue from services increased 15% and 22%, respectively, while storage revenue decreased7%. Revenue from mobility products, desktop PCs, and third-party software and peripherals decreased 16%, 4%, and 3%, respectively. At a regionallevel, during Fiscal 2013, SMB experienced an increase in revenue from the Asia-Pacific and Japan region ("APJ"), while revenue from EMEA and theAmericas decreased.
During Fiscal 2013, SMB's operating income as a percentage of net revenue decreased 50 basis points to 11.2%. This decline was attributable to declinesin gross margin percentage for our products and an increase in operating expenses as a percentage of revenue, which was driven by an increase inresearch, development, and engineering expenses. The effects of these factors were largely offset by an increase in gross margin percentage attributable toour services, including software related.
• Consumer — During Fiscal 2013, Consumer experienced a 20% decrease in revenue. Revenue from all product and services categories decreased duringFiscal 2013. The overall decrease in Consumer revenue was primarily attributable to a 25% decline in mobility product revenue, driven by a 22%decrease in units sold and a 4% decrease in average selling prices. Desktop PC revenue decreased 8% due to a 4% decline in units sold and a 3% decline inaverage selling prices. During Fiscal 2013, revenue from third-party software and peripherals and Consumer services revenue decreased 13% and 14%,respectively, due to a decrease in client units sold. Consumer experienced declines in revenue across all regions during Fiscal 2013, compared to Fiscal2012, led by a decline in revenue from the U.S. During Fiscal 2013, compared to Fiscal 2012, Consumer revenue from most emerging countriesdecreased.
During Fiscal 2013, Consumer's operating income as a percentage of net revenue decreased 330 basis points to an operating loss percentage of 0.1%.These declines in operating income percentage were primarily attributable to declines in gross margin percentage for our products.
Fiscal 2012 compared to Fiscal 2011
• Large Enterprise — During Fiscal 2012, Large Enterprise experienced a 4% increase in revenue that was driven by increases in revenue across allproduct lines, except for storage revenue, which declined 30%. The decline in storage revenue was primarily due to a decrease in the sale of third-partystorage products as we shifted to sales of Dell-owned storage solutions. Revenue from services and servers and networking increased 13% and 9%,respectively, while mobility revenue increased 6% and revenue from desktop PCs and revenue from third-party software and peripherals each increased1%. During Fiscal 2012, Large Enterprise's revenue from outside the U.S increased, while revenue from the U.S. decreased slightly.
During Fiscal 2012, Large Enterprise's operating income as a percentage of revenue increased 190 basis points to 10.1%. The increase was primarilyattributable to improvements in gross margin for our products, partially offset by an increase in operating expenses as a percentage of net revenue,resulting primarily from increased selling and marketing costs.
• Public — During Fiscal 2012, Public experienced a 2% decrease in revenue which was primarily driven by a weakened demand environment. Revenuefrom desktop PCs, storage products, and mobility products decreased 7%, 16%, and 3%, respectively. Revenue from services, servers and networking,and third-party software and peripherals increased 4%, 3%, and 1%, respectively. The decline in Public's revenue was primarily attributable to revenuedecreases in the U.S. and Western Europe, largely because of budgetary constraints on public spending, the effects of which were partially offset byrevenue growth in APJ.
During Fiscal 2012, Public's operating income as a percentage of net revenue increased 110 basis points to 9.9%. The increase was primarily attributableto improvements in gross margin for our products, partially offset by an increase in operating expenses as a percentage of net revenue, which wasprimarily due to increased selling and marketing costs.
• Small and Medium Business — During Fiscal 2012, SMB experienced a 7% increase in revenue that was attributable to an increase in revenue from
enterprise solutions and services. Revenue from servers and networking, storage, and services increased 17%, 11%, and 24%, respectively. Revenue fromthird-party software and peripherals, mobility products, and desktop PCs increased 7%, 3%, and 1%, respectively. SMB experienced revenue growthacross all regions.
During Fiscal 2012, SMB's operating income as a percentage of net revenue increased 70 basis points to 11.7%. The increase was primarily attributableto improvements in gross margin for our products, partially offset by an increase in operating expenses as a percentage of net revenue, resultingprincipally from increased selling and marketing costs.
42
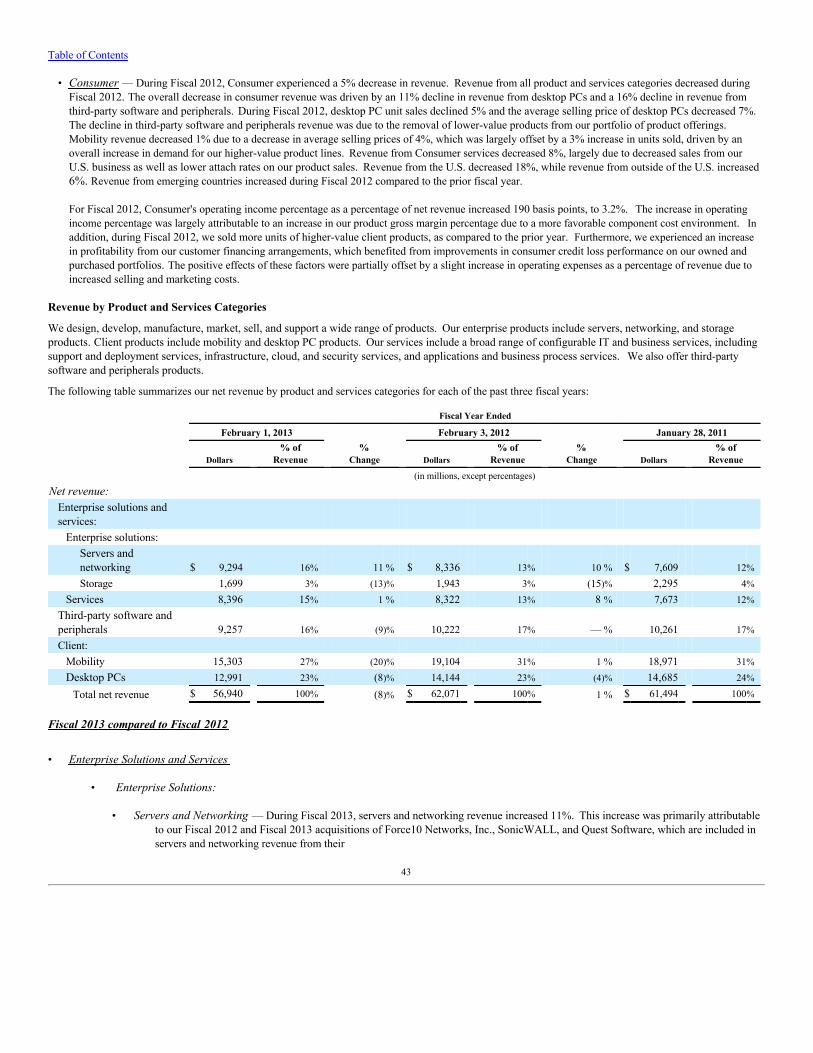
Table of Contents
• Consumer — During Fiscal 2012, Consumer experienced a 5% decrease in revenue. Revenue from all product and services categories decreased duringFiscal 2012. The overall decrease in consumer revenue was driven by an 11% decline in revenue from desktop PCs and a 16% decline in revenue fromthird-party software and peripherals. During Fiscal 2012, desktop PC unit sales declined 5% and the average selling price of desktop PCs decreased 7%.The decline in third-party software and peripherals revenue was due to the removal of lower-value products from our portfolio of product offerings.Mobility revenue decreased 1% due to a decrease in average selling prices of 4%, which was largely offset by a 3% increase in units sold, driven by anoverall increase in demand for our higher-value product lines. Revenue from Consumer services decreased 8%, largely due to decreased sales from ourU.S. business as well as lower attach rates on our product sales. Revenue from the U.S. decreased 18%, while revenue from outside of the U.S. increased6%. Revenue from emerging countries increased during Fiscal 2012 compared to the prior fiscal year.
For Fiscal 2012, Consumer's operating income percentage as a percentage of net revenue increased 190 basis points, to 3.2%. The increase in operatingincome percentage was largely attributable to an increase in our product gross margin percentage due to a more favorable component cost environment. Inaddition, during Fiscal 2012, we sold more units of higher-value client products, as compared to the prior year. Furthermore, we experienced an increasein profitability from our customer financing arrangements, which benefited from improvements in consumer credit loss performance on our owned andpurchased portfolios. The positive effects of these factors were partially offset by a slight increase in operating expenses as a percentage of revenue due toincreased selling and marketing costs.
Revenue by Product and Services Categories
We design, develop, manufacture, market, sell, and support a wide range of products. Our enterprise products include servers, networking, and storageproducts. Client products include mobility and desktop PC products. Our services include a broad range of configurable IT and business services, includingsupport and deployment services, infrastructure, cloud, and security services, and applications and business process services. We also offer third-partysoftware and peripherals products.
The following table summarizes our net revenue by product and services categories for each of the past three fiscal years:
Fiscal Year Ended
February 1, 2013 February 3, 2012 January 28, 2011
Dollars % of
Revenue %
Change Dollars % of
Revenue %
Change Dollars % of
Revenue
(in millions, except percentages)
Net revenue: Enterprise solutions andservices:
Enterprise solutions: Servers andnetworking $ 9,294 16% 11 % $ 8,336 13% 10 % $ 7,609 12%
Storage 1,699 3% (13)% 1,943 3% (15)% 2,295 4%
Services 8,396 15% 1 % 8,322 13% 8 % 7,673 12%
Third-party software andperipherals 9,257 16% (9)% 10,222 17% — % 10,261 17%
Client: Mobility 15,303 27% (20)% 19,104 31% 1 % 18,971 31%
Desktop PCs 12,991 23% (8)% 14,144 23% (4)% 14,685 24%
Total net revenue $ 56,940 100% (8)% $ 62,071 100% 1 % $ 61,494 100%
Fiscal 2013 compared to Fiscal 2012
• Enterprise Solutions and Services
• Enterprise Solutions:
• Servers and Networking — During Fiscal 2013, servers and networking revenue increased 11%. This increase was primarily attributableto our Fiscal 2012 and Fiscal 2013 acquisitions of Force10 Networks, Inc., SonicWALL, and Quest Software, which are included inservers and networking revenue from their
43
Table of Contents
respective acquisition dates. In addition, revenue from our servers increased, as we experienced an increase in demand for our data centersolutions during Fiscal 2013.
• Storage — During Fiscal 2013, storage revenue decreased 13%. These declines were primarily attributable to an anticipated decline in salesof third-party storage products, which were partially offset by revenue from the sale of Dell-branded storage products. Revenue fromDell-branded storage products increased 4% during Fiscal 2013.
• Services — Services revenue increased 1% during Fiscal 2013. This slight increase in services revenue for Fiscal 2013 was driven by a 5%increase in support and deployment services, which consist of support and extended warranty services, enterprise installation, andconfiguration services. Revenue from support and deployment services continues to benefit from the increased unit sales we experienced in Fiscal2011 and Fiscal 2012. Although we experienced declines in unit sales from our client products during Fiscal 2013, we are enhancing our focuson value-added attached services. The increase in revenue from support and deployment services was largely offset by an 11% decrease inapplications and business process services, which was driven by select contract expirations, as we continue to migrate to contracts that providehigher-value opportunities.
During Fiscal 2013, deferred services revenue increased 3%. In addition, during the same period, services backlog increased 3% to $8.7 billionas of February 1, 2013, compared to $8.4 billion as of February 3, 2012. We provide information regarding services backlog because we believeit provides useful trend information regarding changes in the size of our services business over time. Estimated services backlog, which isprimarily related to our outsourcing services business, represents signed contracts that are initially $2 million or more in total expected revenuewith an initial contract term of at least 18 months. The terms of the signed services contracts included in our calculation of services backlog aresubject to change and are affected by terminations, changes in the scope of services, and changes to other factors that could impact the value ofthe contract. For these and other reasons, it is not reasonably practicable to estimate the portions for these backlog amounts that will ultimatelybe recognized as revenue when performance on the contracts is completed.
We continue to view services as a strategic growth opportunity and will continue to invest in our offerings and resources to focus on increasingour solutions sales.
• Third-party software and peripherals — In connection with the sale of our product offerings, we sell a multitude of peripherals, including monitors,printers, projectors, other client and enterprise peripherals, as well as third-party software products. During Fiscal 2013, revenue from third-partysoftware and peripherals decreased 9% when compared to Fiscal 2012. This business was impacted in Fiscal 2013 by a decrease in unit sales of ourclient products, which limits the sales volume of third-party software and peripherals. In addition, this business has been impacted as we have continuedto reduce our participation in non-strategic areas, such as certain third-party software offerings.
• Client
▪ Mobility — Revenue from mobility products (which include notebooks, mobile workstations, and tablets) decreased 20% during Fiscal 2013. Thisdecline was driven by an 18% decrease in mobility unit sales during the period. In addition, average selling prices decreased 2% during Fiscal 2013.During Fiscal 2013, Commercial mobility revenue decreased 15%, while Consumer mobility revenue decreased 25%. During Fiscal 2013, weexperienced a difficult pricing environment for our client products. In particular, demand for our client products in emerging countries was impactedas we saw a migration to lower-value offerings, where we are less competitive. Our results were also impacted as customers shifted some of theirdemand to alternative computing devices, particularly in our Consumer segment.
▪ Desktop PCs — During Fiscal 2013, revenue from desktop PCs (which include desktop computer systems and fixed workstations) decreased 8%.This decline was driven by a 6% decrease in average selling prices during Fiscal 2013 and a 2% decrease in unit sales over the same period.
44

Table of Contents
Fiscal 2012 compared to Fiscal 2011
• Enterprise Solutions and Services
• Enterprise Solutions:
• Servers and Networking — The increase in our servers and networking revenue for Fiscal 2012 as compared to Fiscal 2011 wasprimarily driven by increases in revenue from our PowerEdge lines of servers as well as our virtualized servers and data centersolutions. During Fiscal 2012, we saw an overall increase in demand and selling prices.
• Storage — During Fiscal 2012, storage revenue decreased 15%. The decrease in storage revenue was primarily attributable to ananticipated decline in sales of third-party storage products, which was partially offset by revenue from sales of Dell-owned storageproducts, such as our Compellent products. During Fiscal 2012, sales of Dell-owned storage products increased 21% to 82% of ourtotal storage revenue compared to 57% in the prior year. We believe that Dell-owned storage offerings, which can be sold with servicesolutions, will generate higher margins in the long-term. Our acquisition of Compellent during the first quarter of Fiscal 2012 expandedour enterprise and data center storage offerings.
• Services — During Fiscal 2012, services revenue increased 8% to $8.3 billion. The increase was driven by an increase in support anddeployment services revenue as well as increases in infrastructure, cloud, and security services as well as applications and business processservices. The increase in infrastructure, cloud, and security services as well as applications and business process services was partially drivenby our acquisitions. During Fiscal 2012, deferred services revenue and services backlog each increased 11%.
• Third-party software and peripherals — In connection with the sale of our product offerings, we sell a multitude of peripherals, including monitors,printers, projectors, other client and enterprise peripherals, as well as third-party software products. During Fiscal 2012, revenue from third-partysoftware and peripherals was essentially unchanged when compared to the prior year. Revenue growth in this business has been impacted as we continueto reduce our participation in non-strategic areas.
• Client
▪ Mobility — Revenue from mobility products increased 1% during Fiscal 2012. This increase was primarily attributable to a 3% increase in notebookunits sold, largely offset by a 3% decline in average selling price. In Fiscal 2012, we experienced declines in revenue from our lower priced consumernotebooks, which were largely offset by increases in revenue from our higher-value lines of notebooks. During Fiscal 2012, Commercial mobilityrevenue increased 2%, when compared to Fiscal 2011, while Consumer mobility revenue decreased 1%.
▪ Desktop PCs — During Fiscal 2012, revenue from desktop PCs decreased 4% as the average selling price as well as unit sales for our desktop PCseach decreased 2%, when compared to Fiscal 2011.
Stock-Based Compensation
Dell is currently issuing stock grants under the Dell Inc. 2012 Long-Term Incentive Plan (the "2012 Incentive Plan"), which was approved by shareholders atthe annual meeting on July 13, 2012. Previous plans, including the Amended and Restated 2002 Long-Term Incentive Plan, have been terminated, except foradministration of awards previously granted under those plans that remain outstanding. The 2012 Incentive Plan and all previous plans are collectivelyreferred to as "Dell's Incentive Plans."
Equity awards issued under the 2012 Incentive Plan can include stock options, stock appreciation rights, restricted stock units, unrestricted stock,performance based restricted stock units, or other equity awards. Stock-based compensation expense totaled $347 million for Fiscal 2013, compared to $362million and $332 million for Fiscal 2012 and Fiscal 2011, respectively. For further discussion on stock-based compensation, see Note 14 of the Notes to theConsolidated Financial Statements included in “Part II — Item 8 — Financial Statements and Supplementary Data.”
45

Table of Contents
Interest and Other, net
The following table provides a detailed presentation of interest and other, net for each of the past three fiscal years:
Fiscal Year Ended
February 1,
2013 February 3,
2012 January 28,
2011 (in millions)
Interest and other, net: Investment income, primarily interest $ 100 $ 81 $ 47Gains on investments, net 35 8 6Interest expense (270) (279) (199)Foreign exchange (18) 5 4Other (18) (6) 5 9
Interest and other, net $ (171) $ (191) $ (83)
Fiscal 2013 compared to Fiscal 2012
During Fiscal 2013, changes in interest and other, net were favorable by $20 million, when compared to Fiscal 2012. These changes were primarily due to anincrease in investment income and net gains from the sale of investments, partially offset by foreign exchange fluctuations during Fiscal 2013. The changes inforeign exchange for Fiscal 2013 were primarily due to higher costs associated with our hedging program and revaluations of certain un-hedged foreigncurrencies.
Fiscal 2012 compared to Fiscal 2011
Our investment income increased in Fiscal 2012 over the prior fiscal year primarily due to higher average cash and investment balances as well as a shift tolonger-duration investments, which have higher investment yields. The increase in interest expense for Fiscal 2012 compared to Fiscal 2011 was due to higherdebt levels, which increased to $9.3 billion as of February 3, 2012, from $6.0 billion as of January 28, 2011. The decrease in other income for Fiscal 2012was primarily due to a $72 million merger termination fee that we received during Fiscal 2011.
46

Table of Contents
Income and Other Taxes
Our effective tax rate was 16.5%, 17.6%, and 21.3% for Fiscal 2013, Fiscal 2012, and Fiscal 2011, respectively. The decrease in our effective income tax ratefor Fiscal 2013 as compared to Fiscal 2012, was primarily due to vendor settlements we received in Fiscal 2013, which are taxed at lower rates than the U.S.tax rate, partially offset by an increase in the proportion of taxable income attributable to higher tax jurisdictions. The decrease in our effective income tax ratefor Fiscal 2012 as compared to Fiscal 2011, was primarily due to an increase in the proportion of taxable income attributable to lower rate jurisdictions.
Our effective tax rate can fluctuate depending on the geographic distribution of our world-wide earnings, as our foreign earnings are generally taxed at lowerrates than in the U.S. In certain jurisdictions, our tax rate is significantly less than the applicable statutory rate as a result of tax holidays. The majority of ourforeign income that is subject to these tax holidays and lower tax rates is attributable to Singapore, China, and Malaysia. Our significant tax holidays expire inwhole or in part during Fiscal 2016 through Fiscal 2022. The differences between our effective tax rate and the U.S. federal statutory rate of 35% principallyresulted from the geographical distribution of taxable income discussed above and permanent differences between the book and tax treatment of certain items. We continue to assess our business model and its impact in various taxing jurisdictions.
For a further discussion regarding tax matters, including the status of income tax audits, see Note 11 of the Notes to the Consolidated Financial Statementsincluded in “Part II — Item 8 — Financial Statements and Supplementary Data.”
ACCOUNTS RECEIVABLE
We sell products and services directly to customers and through a variety of sales channels, including retail distribution. As of February 1, 2013, ouraccounts receivable, net was $6.6 billion, which represented a 2% increase from our balance as of February 3, 2012. This increase in accounts receivable, netwas primarily due to a shift in the mix of receivables to customers with longer payment terms. We maintain an allowance for doubtful accounts to coverreceivables that may be deemed uncollectible. The allowance for losses is based on a provision for accounts that are collectively evaluated based on historicalbad debt experience as well as specific identifiable customer accounts that are deemed at risk. As of February 1, 2013 and February 3, 2012, the allowance fordoubtful accounts was $72 million and $63 million, respectively. Based on our assessment, we believe we are adequately reserved for expected credit losses.We monitor the aging of our accounts receivable and continue to take actions to reduce our exposure to credit losses.
DELL FINANCIAL SERVICES AND FINANCING RECEIVABLES
Dell Financial Services ("DFS") offers a wide range of financial services, including originating, collecting, and servicing customer receivables primarilyrelated to the purchase of Dell products. In some cases, we originate financing activities for our commercial customers related to the purchase of third-partytechnology products that complement our portfolio of products and services. New financing originations, which represent the amounts of financing providedby DFS to customers for equipment and related software and services, including third-party originations, were approximately $3.5 billion, $3.8 billion, and$4.0 billion for Fiscal 2013, Fiscal 2012, and Fiscal 2011, respectively. The decline in originations during the period was driven by a decrease in unit salesfor our client products, particularly in our Consumer segment. At February 1, 2013 and February 3, 2012, our net financing receivables balances were $4.6billion and $4.7 billion, respectively.
To support the financing needs of our customers internationally, we have aligned with a select number of third-party financial services companies. DuringFiscal 2012, we entered into a definitive agreement to acquire CIT Vendor Finance's Dell-related financing assets portfolio and sales and servicing functions inEurope for approximately $500 million. Subject to customary closing, regulatory, and other conditions, we expect to complete this transaction in Fiscal 2014.In connection with this transaction, we have filed an application for a bank license with The Central Bank of Ireland to facilitate ongoing financing offerings.
We have securitization programs to fund revolving loans and fixed-term leases and loans through consolidated special purpose entities ("SPEs"), which weaccount for as secured borrowings. We transfer certain U.S. customer financing receivables to these SPEs, whose purpose is to facilitate the funding ofcustomer receivables through financing arrangements with multi-seller conduits that issue asset-backed debt securities in the capital markets. We transferred$2.0 billion, $2.3 billion, and $1.9 billion to these SPEs during Fiscal 2013, Fiscal 2012, and Fiscal 2011, respectively. Our risk of loss related to thesesecuritized receivables is limited to the amount of our over-collateralization in the transferred pool of receivables. The structured financing debt related to all ofour secured borrowing securitization programs was $1.3 billion as of both February 1, 2013 and
47

Table of Contents
February 3, 2012. In addition, the carrying amount of the corresponding financing receivables was $1.5 billion as of both February 1, 2013 and February 3,2012.
We maintain an allowance to cover expected financing receivable credit losses and evaluate credit loss expectations based on our total portfolio. For Fiscal 2013,Fiscal 2012, and Fiscal 2011, the principal charge-off rate for our total portfolio was 4.1%, 4.6%, and 7.5%, respectively. The charge-off rate for Fiscal 2011is annualized for a portfolio of receivables that consisted of revolving Dell U.S. customer account balances that was purchased during the third quarter ofFiscal 2011. The credit quality mix of our financing receivables has improved in recent years due to our underwriting actions and as the mix of high qualitycommercial accounts in our portfolio has increased. The allowance for losses is determined based on various factors, including historical and anticipatedexperience, past due receivables, receivable type, and customer risk profile. At February 1, 2013 and February 3, 2012, the allowance for financing receivablelosses was $192 million and $202 million, respectively. In general, the loss rates on our financing receivables for Fiscal 2013 improved over the prior year. We expect the loss rates in future periods to stabilize, with movements in these rates being primarily driven by seasonality and a continued shift in portfoliocomposition to lower risk commercial assets. We continue to monitor broader economic indicators and their potential impact on future loss performance. Wehave an extensive process to manage our exposure to customer credit risk, including active management of credit lines and our collection activities. We also sellselected fixed-term financing receivables to unrelated third parties on a periodic basis, primarily to manage certain concentrations of customer credit exposure. Based on our assessment of the customer financing receivables, we believe that we are adequately reserved.
See Note 4 of the Notes to the Consolidated Financial Statements included in “Part II — Item 8 — Financial Statements and Supplementary Data” foradditional information about our financing receivables and the associated allowance.
OFF-BALANCE SHEET ARRANGEMENTS
With the consolidation of our previously nonconsolidated special purpose entities, we no longer have off-balance sheet financing arrangements.
48

Table of Contents
LIQUIDITY, CAPITAL COMMITMENTS, AND CONTRACTUAL CASH OBLIGATIONS
Current Market Conditions
We regularly monitor economic conditions and associated impacts on the financial markets and our business. We consistently evaluate the financial health ofour supplier base, carefully manage customer credit, diversify counterparty risk, and monitor the concentration risk of our cash and cash equivalentsbalances globally. We routinely monitor our financial exposure to both sovereign and non-sovereign borrowers and counterparties.
We monitor credit risk associated with our financial counterparties using various market credit risk indicators such as credit ratings issued by nationallyrecognized rating agencies and changes in market credit default swap levels. We perform periodic evaluations of our positions with these counterparties andmay limit exposure to any one counterparty in accordance with our policies. We monitor and manage these activities depending on current and expected marketdevelopments.
We use derivative instruments to hedge certain foreign currency exposures. We use forward contracts and purchased options designated as cash flow hedges toprotect against the foreign currency exchange rate risks inherent in our forecasted transactions denominated in currencies other than the U.S. dollar. Inaddition, we primarily use forward contracts and may use purchased options to hedge monetary assets and liabilities denominated in a foreign currency. SeeNote 6 of the Notes to the Consolidated Financial Statements under “Part II — Item 8 — Financial Statements and Supplementary Data” for more informationabout our use of derivative instruments.
See “Part I — Item 1A — Risk Factors” for further discussion of risks associated with our use of counterparties. The impact on our Consolidated FinancialStatements of any credit adjustments related to these counterparties has been immaterial.
Liquidity
Cash generated from operations is our primary source of operating liquidity. In general, we seek to deploy our capital in a systematically prioritized manner,focusing first on requirements for operations, then on growth investments, and finally on returns of cash to stockholders. The merger agreement for ourproposed merger transaction, described in the introduction to this management's discussion and analysis, places certain limitations on our use of cash,including our application of cash to repurchase shares, declare quarterly dividends in excess of $0.08 per share, and pursue significant business acquisitions.
Our strategy is to deploy capital, whether internally generated cash or debt, depending on the adequacy and availability of that source of capital and whether itcan be accessed in a cost effective manner. While cash generated from operations is our primary source of operating liquidity, we use a variety of capitalsources to fund the growth in our financing receivables, fund our needs for less predictable strategic initiatives, and return capital to stockholders. The mergeragreement for our proposed merger transaction places certain limitations on the amount of debt we can assume. In addition, subsequent to the announcement ofthe proposed merger, our credit rating was downgraded to below investment grade by one of the major credit rating agencies, which significantly limits ourability to access the commercial paper market. If the proposed merger is not consummated, our credit rating may continue to be impacted, which will prolongour more limited access to the capital markets. We believe that internally generated cash flows, which consist of operating cash flows, are sufficient to supportour day-to-day business operations, both domestically and internationally, for at least the next 12 months.
At February 1, 2013, we had $15.3 billion of total cash, cash equivalents, and investments, substantially all of which was held outside of the U.S. Weaccess our foreign cash balances in a tax efficient manner when appropriate. The following table summarizes our cash and cash equivalents, investments, andavailable borrowings as of February 1, 2013, and February 3, 2012:
February 1,
2013 February 3,
2012 (in millions)
Cash, cash equivalents, and investments: Cash and cash equivalents $ 12,569 $ 13,852Investments 2,773 4,370
Cash, cash equivalents, and investments 15,342 18,222Unsecured revolving credit facilities (a) 3,000 3,000
Total cash, cash equivalents, investments, and available borrowings $ 18,342 $ 21,222_____________________(a) Under the merger agreement, we may access up to $2.0 billion outstanding at any time under our unsecured revolving credit facilities.
49

Table of Contents
We have senior unsecured revolving credit facilities primarily to support our commercial paper program. No amounts were outstanding under our revolvingcredit facilities as of February 1, 2013 or February 3, 2012.
Of our $15.3 billion of cash, cash equivalents, and investments as of February 1, 2013, $12.6 billion is classified as cash and cash equivalents. Our cashequivalents primarily consist of money market funds and certificates of deposit. The remaining $2.8 billion of investments is primarily invested in fixedincome securities of varying maturities at the date of acquisition. The fair value of our portfolio can be affected by interest rate movements, credit risk, andliquidity risks. The objective of our investment policy and strategy is to manage our total cash and investments balances to preserve principal and maintainliquidity while maximizing the return on the investment portfolio through the full investment of available funds. We diversify our investment portfolio byinvesting in multiple types of investment-grade securities and through the use of third-party investment managers.
A significant portion of our income is earned in non-U.S. jurisdictions. Under current law, earnings available to be repatriated to the U.S. would be subject toU.S. federal income tax, less applicable foreign tax credits. We have provided for the U.S. federal tax liability on these amounts for financial statementpurposes, except for foreign earnings that are considered permanently reinvested outside of the U.S. We utilize a variety of tax planning and financingstrategies with the objective of having our worldwide cash available in the locations where it is needed.
The following table summarizes our outstanding debt as of February 1, 2013, and February 3, 2012:
February 1,
2013 February 3,
2012 (in millions)Outstanding Debt
Senior notes and debentures $ 5,988 $ 6,391Structured financing debt 1,288 1,360Commercial paper 1,807 1,500Other 2 3
Total debt $ 9,085 $ 9,254
During Fiscal 2013, total debt decreased $169 million due to a repayment of $400 million in maturing senior notes, as well as a decrease in structuredfinancing debt, partially offset by a net issuance of commercial paper. In connection with the announcement of our proposed merger transaction, our creditrating was downgraded to below investment grade by one of the major credit rating agencies. This credit downgrade significantly limits our ability to access thecommercial paper market. As of February 3, 2013, we had $1.8 billion in outstanding commercial paper as well as $1.1 billion in senior notes that willmature during the next twelve months. We have sufficient cash balances and access to our revolving credit facilities to repay our outstanding commercial paperas well as these maturing senior notes.
We also issue structured financing-related debt to fund our financing receivables as discussed under “Financing Receivables” above. As of February 1, 2013,we had $1.3 billion in outstanding structured financing securitization debt. Our securitization programs are structured to operate near their debt capacity andare generally effective for 12 months. Our programs will be subject to renewal during the first half of Fiscal 2014, and we expect to renew these programs ontheir current terms. We balance the use of our securitization programs with working capital and other sources of liquidity to fund growth in our financingreceivables. See Note 4 of the Notes to the Consolidated Financial Statements under “Part II — Item 8 — Financial Statements and Supplementary Data” forfurther discussion of our structured financing debt. Under the merger agreement, we may not incur debt under these programs of more than $1.5 billionoutstanding at any time.
We intend to maintain appropriate debt levels, subject to the limitations under the merger agreement, based upon cash flow expectations, the overall cost ofcapital, cash requirements for operations, and discretionary spending, including spending for permitted business acquisitions and permitted dividendpayments. See Note 5 of the Notes to the Consolidated Financial Statements under “Part II — Item 8 — Financial Statements and Supplementary Data” forfurther discussion of our debt.
Our management actively monitors the efficiency of our balance sheet under various macro-economic and competitive scenarios. These scenarios quantifyrisks to the financial statements and provide a basis for actions necessary to ensure adequate liquidity, both domestically and internationally, to support ourstrategic initiatives, return capital to stockholders, and fund other corporate needs.
50

Table of Contents
The following table contains a summary of our Consolidated Statements of Cash Flows for the past three fiscal years:
Fiscal Year Ended
February 1,
2013 February 3,
2012 January 28,
2011 (in millions)
Net change in cash from: Operating activities $ 3,283 $ 5,527 $ 3,969Investing activities (3,316) (6,166) (1,165)Financing activities (1,210) 577 477Effect of exchange rate changes on cash and cash equivalents (40) 1 (3)
Change in cash and cash equivalents $ (1,283) $ (61) $ 3,278
Operating Activities — Operating cash flows for Fiscal 2013 decreased $2.2 billion compared to Fiscal 2012. This decrease in operating cash flows wasprimarily driven by unfavorable changes in working capital as well as a decrease in net income. For Fiscal 2012 compared to Fiscal 2011, operating cashflows increased $1.6 billion. This increase in operating cash flows was primarily attributable to an increase in net income as well as favorable changes inworking capital.
Investing Activities — Investing activities primarily consist of the sales and purchases of investments, net of maturities, capital expenditures for property,plant, and equipment, and cash used to fund strategic acquisitions. Cash used in investing activities during Fiscal 2013 was $3.3 billion, compared to $6.2billion and $1.2 billion during Fiscal 2012 and Fiscal 2011, respectively. The overall decrease in cash used in investing activities during Fiscal 2013compared to Fiscal 2012 was driven by an increase in cash from the sale and maturity of investments as well as a decrease in investment purchases during theperiod, the effects of which were largely offset by higher spending on business acquisitions. For Fiscal 2012 compared to Fiscal 2011, the increase in cashused in investing activities was primarily attributable to the net increase in cash used to purchase investments as we shifted funds to investments with originalmaturities of greater than 90 days and higher spending on business acquisitions.
Financing Activities — Financing activities primarily consist of proceeds and repayments from borrowings, the repurchase of our common stock, and cashused to fund dividend payments. Cash used in financing activities for Fiscal 2013 was $1.2 billion, compared to cash provided by financing activities of$0.6 billion and $0.5 billion for Fiscal 2012 and Fiscal 2011, respectively. The decrease in cash provided by financing activities for Fiscal 2013 wasattributable to a decrease in net proceeds from debt, which was largely offset by a decrease in share repurchases during the Fiscal 2013, compared to Fiscal2012. During Fiscal 2012, net proceeds from the issuance of long-term debt were $1.5 billion. In comparison, during Fiscal 2013, we repaid $400 million inmaturing senior notes. During Fiscal 2012, we repurchased approximately 178 million shares of common stock for $2.7 billion, compared to 46 millionshares of common stock for $0.7 billion during Fiscal 2013. In addition, during Fiscal 2013, we announced a dividend program, under which we paid $278million in cash dividends to our stockholders.
For Fiscal 2012 compared to Fiscal 2011, the slight year-over-year increase in cash provided by financing activities was primarily due to the issuance of $1.5billion in commercial paper, compared to a net repayment of $0.5 billion of commercial paper in Fiscal 2011. This increase was offset by an additional $1.9billion in share repurchases during Fiscal 2012 compared to Fiscal 2011.
Key Performance Metrics —
The following table presents the components of our cash conversion cycle for the fourth quarter of each of the past three fiscal years:
Fiscal Quarter Ended
February 1,
2013 February 3,
2012 January 28,
2011Days of sales outstanding (a) 46 42 40Days of supply in inventory (b) 11 11 9Days in accounts payable (c) (93) (89) (82)
Cash conversion cycle (36) (36) (33) _____________________
(a) Days of sales outstanding (“DSO”) calculates the average collection period of our receivables. DSO is based on the ending net trade receivables and the most recent quarterlyrevenue for each period. DSO also includes the effect of product costs related to customer shipments not yet recognized as revenue
51

Table of Contents
that are classified in other current assets. DSO is calculated by adding accounts receivable, net of allowance for doubtful accounts, and customer shipments in transit and dividingthat sum by average net revenue per day for the current quarter (90 days for Fiscal 2013 and Fiscal 2011; 97 days for Fiscal 2012). At February 1, 2013, February 3, 2012 andJanuary 28, 2011, DSO and days of customer shipments not yet recognized were 42 and 4 days, 39 and 3 days, and 37 and 3 days, respectively.
(b) Days of supply in inventory (“DSI”) measures the average number of days from procurement to sale of our products. DSI is based on ending inventory and most recent quarterlycost of sales for each period. DSI is calculated by dividing inventory by average cost of goods sold per day for the current quarter (90 days for Fiscal 2013 and Fiscal 2011; 97 daysfor Fiscal 2012).
(c) Days in accounts payable (“DPO”) calculates the average number of days our payables remain outstanding before payment. DPO is based on ending accounts payable and mostrecent quarterly cost of sales for each period. DPO is calculated by dividing accounts payable by average cost of goods sold per day for the current quarter (90 days for Fiscal 2013and Fiscal 2011; 97 days for Fiscal 2012).
Our cash conversion cycle for the fiscal quarter ended February 1, 2013 was essentially unchanged compared to the fiscal quarter ended February 2, 2012.The four day improvement in DPO was driven by the timing of payments as well as the conversion of payment terms for certain suppliers in the fourthquarter of Fiscal 2013. This improvement in DPO was offset by a four day increase in DSO, which was attributable to a shift in the mix of receivablestowards customers with longer payment terms. DSI for the fiscal quarter ended February 1, 2013 was essentially unchanged compared to the fiscal quarterended February 2, 2012. As we execute our strategic initiatives, certain components of our cash conversion cycle may be impacted. However, we expect ourbusiness model will continue to allow us to maintain an efficient cash conversion cycle, which compares favorably with that of others in our industry.
Our cash conversion cycle improved three days for the fiscal quarter ended February 3, 2012, from the fiscal quarter ended January 28, 2011, driven by aseven day improvement in DPO, which was largely attributable to the timing of payments to vendors at the end of the period as compared to the prior year dueto an additional week of operations in Fiscal 2012. This improvement in DPO was partially offset by a two day increase in DSO and a two day increase inDSI. The increase in DSO from January 28, 2011 was due to a shift in the mix of receivables towards customers with longer payment terms. The increase inDSI from January 28, 2011 was primarily driven by strategic purchases of inventory.
We defer the cost of revenue associated with customer shipments not yet recognized as revenue until these shipments are delivered. These deferred costs areincluded in our reported DSO because we believe this reporting results in a more accurate presentation of our DSO and cash conversion cycle. These deferredcosts are recorded in other current assets in our Consolidated Statements of Financial Position and totaled $665 million at February 1, 2013, $482 million atFebruary 3, 2012, and $541 million at January 28, 2011.
Capital Commitments
Share Repurchase Program — We have a share repurchase program that authorizes us to purchase shares of our common stock through a systematicprogram of open market purchases in order to increase shareholder value and manage dilution resulting from shares issued under our equity compensationplans. However, we do not currently have a policy that requires the repurchase of common stock to offset share-based compensation arrangements. We did notrepurchase any shares of our common stock during the second half of Fiscal 2013. As of February 1, 2013, $5.3 billion remained authorized for future sharerepurchases. The merger agreement prohibits us from engaging in additional share repurchases.
Dividend Program — On June 12, 2012, we announced that our Board of Directors adopted a dividend policy under which we paid quarterly dividends of$0.08 per share during the third and fourth quarters of Fiscal 2013. The cash dividend policy and the declaration and payment of each quarterly cashdividend will be subject to the Board's continuing determination that the policy and the declaration of dividends thereunder are in the best interest of ourstockholders and are in compliance with applicable law. The Board of Directors retains the power to modify, suspend, or cancel our dividend policy in anymanner and at any time that it may deem necessary or appropriate in the future. Under the merger agreement, we may not pay dividends with a quarterly rategreater than the rate of $0.08 per share authorized under our current dividend policy.
Capital Expenditures — During Fiscal 2013 and Fiscal 2012, we spent $513 million and $675 million, respectively, on property, plant, and equipmentprimarily in connection with our global expansion efforts and infrastructure investments made to support future growth. Product demand, product mix, andthe increased use of contract manufacturers, as well as ongoing investments in operating and information technology infrastructure, influence the level andprioritization of our capital expenditures. Aggregate capital expenditures for Fiscal 2014, which will be primarily related to infrastructure investments andstrategic initiatives, are currently expected to total approximately $500 million. These expenditures will be primarily funded from our cash flows fromoperating activities.
Purchase Obligations — We utilize several suppliers to manufacture sub-assemblies for our products. Our efficient supply chain management allows us toenter into flexible and mutually beneficial purchase arrangements with our suppliers in order to minimize inventory risk. Consistent with industry practice, weacquire raw materials or other goods and services, including product components, by issuing to suppliers authorizations to purchase based on our projecteddemand and manufacturing
52

Table of Contents
needs. See "Liquidity, Capital Commitments, and Contractual Cash Obligations — Contractual Cash Obligations" for more information about our purchasecommitments.
53

Table of Contents
Contractual Cash Obligations
The following table summarizes our contractual cash obligations at February 1, 2013:
Payments Due by Period Fiscal Fiscal Fiscal Total 2014 2015-2016 2017-2018 Thereafter (in millions)
Contractual cash obligations: Principal payments on long-term debt $ 6,772 $ 1,617 $ 2,255 $ 400 $ 2,500Operating leases 613 137 238 139 9 9Purchase obligations 515 399 115 1 —Interest 2,172 242 372 297 1,261Uncertain tax positions (a) — — — — —
Contractual cash obligations $ 10,072 $ 2,395 $ 2,980 $ 837 $ 3,860
_____________________(a) We have approximately $2.9 billion in additional liabilities associated with uncertain tax positions that are not expected to be liquidated in Fiscal 2014. We are unable to reliably
estimate the expected payment dates for these additional non-current liabilities.
Principal Payments on Long-Term Debt — Our expected principal cash payments related to long term debt are exclusive of hedge accounting adjustments ordiscounts and premiums. We have outstanding long-term unsecured notes with varying maturities. For additional information, see Note 5 of the Notes to theConsolidated Financial Statements under “Part II — Item 8 — Financial Statements and Supplementary Data."
Operating Leases — We lease property and equipment, manufacturing facilities, and office space under non-cancellable leases. Certain of these leasesobligate us to pay taxes, maintenance, and repair costs.
Purchase Obligations — Purchase obligations are defined as contractual obligations to purchase goods or services that are enforceable and legally binding onus. These obligations specify all significant terms, including fixed or minimum quantities to be purchased; fixed, minimum, or variable price provisions; andthe approximate timing of the transaction. Purchase obligations do not include contracts that may be canceled without penalty.
We utilize several suppliers to manufacture sub-assemblies for our products. Our efficient supply chain management allows us to enter into flexible andmutually beneficial purchase arrangements with our suppliers in order to minimize inventory risk. Consistent with industry practice, we acquire rawmaterials or other goods and services, including product components, by issuing to suppliers authorizations to purchase based on our projected demand andmanufacturing needs. These purchase orders are typically fulfilled within 30 days and are entered into during the ordinary course of business in order toestablish best pricing and continuity of supply for our production. Purchase orders are not included in the table above as they typically represent ourauthorization to purchase rather than binding purchase obligations.
Our purchase obligations decreased from $2.9 billion at February 3, 2012 to $515 million at February 1, 2013. This decrease was primarily attributable tothe fulfillment of commitments to purchase hard disk drives following disruption of the supply chain as a result of severe flooding in Thailand during thethird quarter of Fiscal 2012.
Interest — See Note 5 of the Notes to the Consolidated Financial Statements included in “Part II — Item 8 — Financial Statements and Supplementary Data”for further discussion of our debt and related interest expense.
54

Table of Contents
Risk Factors Affecting Our Business and Prospects
There are numerous significant risks that affect our business, operating results, financial condition, and prospects. Many of these risks are beyond ourcontrol. These risks include those relating to:
• potential effects of any failure of our proposed merger to close;• intense competition;• our reliance on vendors for products and components, including reliance on several single-source or limited-source suppliers;• our ability to achieve favorable pricing from our vendors;• adverse global economic conditions and instability in financial markets;• our ability to manage effectively the change involved in implementing our strategic initiatives;• successful implementation of our acquisition strategy;• our cost efficiency measures;• our ability to manage solutions, product, and services transitions in an effective manner;• our ability to deliver products and services of consistent quality;• our ability to generate substantial non-U.S. net revenue;• our product, customer, and geographic sales mix, or seasonal sales trends;• the performance of our sales channel participants;• access to the capital markets by us and some of our customers;• weak economic conditions and additional regulation affecting our financial services activities;• counterparty default;• customer terminations of, or pricing changes in, services contracts, or our failure to perform as we anticipate at the time we enter into services contracts;• loss of government contracts;• our ability to develop, obtain or protect licenses to intellectual property developed by us or by others on commercially reasonable and competitive terms;• infrastructure disruptions;• cyber attacks or other data security breaches;• our ability to hedge effectively our exposure to fluctuations in foreign currency exchange rates and interest rates;• expiration of tax holidays or favorable tax rate structures, or unfavorable outcomes in tax audits and other tax compliance matters;• impairment of our portfolio investments;• unfavorable results of legal proceedings;• our ability to attract, retain, and motivate key personnel;• our ability to maintain strong and effective internal controls;• our compliance with current and changing environmental and safety laws or other regulatory laws; and• the effect of armed hostilities, terrorism, natural disasters, and public health issues.
For a discussion of these risk factors affecting our business, operating results, financial conditions, and prospects, see “Part I — Item 1A — Risk Factors.”
5 5
Table of Contents
Critical Accounting Policies
We prepare our financial statements in conformity with GAAP. The preparation of financial statements in accordance with GAAP requires certain estimates,assumptions, and judgments to be made that may affect our Consolidated Statements of Financial Position and Consolidated Statements of Income.Accounting policies that have a significant impact on our Consolidated Financial Statements are described in Note 1 of the Notes to the Consolidated FinancialStatements included in “Part II — Item 8 — Financial Statements and Supplementary Data.” The accounting estimates and assumptions discussed in thissection are those that we consider to be the most critical. We consider an accounting policy to be critical if the nature of the estimate or assumption is subject toa material level of judgment and if changes in those estimates or assumptions are reasonably likely to materially impact our Consolidated FinancialStatements. We have discussed the development, selection, and disclosure of our critical accounting policies with the Audit Committee of our Board ofDirectors.
Revenue Recognition and Related Allowances — We enter into contracts to sell our products and services, and frequently enter into sales arrangements withcustomers that contain multiple elements or deliverables, such as hardware, services, software, and peripherals. We use general revenue recognition accountingguidance for hardware, software bundled with hardware that is essential to the functionality of the hardware, peripherals, and certain services. We recognizerevenue for these products when it is realized or realizable and earned. Revenue is considered realized and earned when persuasive evidence of an arrangementexists; delivery has occurred or services have been rendered; our fee is fixed and determinable; and collection of the resulting receivable is reasonably assured.Judgments and estimates are necessary to ensure compliance with GAAP. These judgments include the allocation of the proceeds received from an arrangementto the multiple elements, and the appropriate timing of revenue recognition.
Revenue from sales of third-party software and extended warranties for third-party products, for which we do not meet the criteria for gross revenuerecognition, is recognized on a net basis. All other revenue is recognized on a gross basis.
Services revenue and cost of services revenue captions on the Consolidated Statements of Income include services revenue, third-party software revenue, andsupport services related to Dell-owned software offerings.
Most of our products and services qualify as separate units of accounting. We allocate revenue to all deliverables based on their relative selling prices. GAAPrequires the following hierarchy to be used to determine the selling price for allocating revenue to deliverables; (1) vendor-specific objective evidence (“VSOE”);(2) third-party evidence of selling price (“TPE”); or (3) best estimate of the selling price (“ESP”). In instances where we cannot establish VSOE, we establishTPE by evaluating largely similar and interchangeable competitor products or services in standalone sales to similarly situated customers.
We record reductions to revenue for estimated customer sales returns, rebates, and certain other customer incentive programs. These reductions to revenue aremade based upon reasonable and reliable estimates that are determined by historical experience, contractual terms, and current conditions. The primary factorsaffecting our accrual for estimated customer returns include estimated return rates as well as the number of units shipped that have a right of return that hasnot expired as of the balance sheet date. If returns cannot be reliably estimated, revenue is not recognized until a reliable estimate can be made or the return rightlapses. Each quarter, we reevaluate our estimates to assess the adequacy of our recorded accruals and allowance for doubtful accounts, and adjust theamounts as necessary.
We sell our products directly to customers as well as through other distribution channels, including retailers, distributors, and resellers. Sales through ourdistribution channels are primarily made under agreements allowing for limited rights of return, price protection, rebates, and marketing development funds.We have generally limited return rights through contractual caps or we have an established selling history for these arrangements. Therefore, there is sufficientdata to establish reasonable and reliable estimates of returns for the majority of these sales. To the extent price protection or return rights are not limited and areliable estimate cannot be made, all of the revenue and related cost are deferred until the product has been sold to the end-user or the rights expire. We recordestimated reductions to revenue or an expense for distribution channel programs at the later of the offer or the time revenue is recognized.
We recognize revenue in accordance with industry-specific software accounting guidance for all software and post-contract support ("PCS") that are notessential to the functionality of the hardware. Accounting for software that is essential to the functionality of the hardware is accounted for as specified above.We have not established VSOE for third-party software offerings. For the majority of Dell-owned software offerings, we have established VSOE to support aseparation of the software license and PCS elements. VSOE of the PCS element is determined by reference to the prices customers pay for support when it issold separately. In instances where VSOE is established, we recognize revenue from the sale of software licenses at the time of initial sale, assuming all of theabove criteria have been met, and revenue from the PCS element over the maintenance period. When we have not established VSOE to support a separation ofthe software license and PCS elements, the revenue and related costs are generally recognized over the term of the agreement.
5 6

Table of Contents
We offer extended warranty and service contracts to customers that extend and/or enhance the technical support, parts, and labor coverage offered as part of thebase warranty included with the product. Revenue from extended warranty and service contracts, for which we are obligated to perform, is recorded as deferredrevenue and subsequently recognized on a straight-line basis over the term of the contract or ratably as services are completed.
Business Combinations and Intangible Assets Including Goodwill — We account for business combinations using the acquisition method of accounting,and accordingly, the assets and liabilities of the acquired business are recorded at their fair values at the date of acquisition. The excess of the purchase priceover the estimated fair value is recorded as goodwill. Any changes in the estimated fair values of the net assets recorded for acquisitions prior to the finalizationof more detailed analysis, but not to exceed one year from the date of acquisition, will change the amount of the purchase price allocable to goodwill. Anysubsequent changes to any purchase price allocations that are material to our consolidated financial results will be adjusted retroactively. All acquisition costsare expensed as incurred and in-process research and development costs are recorded at fair value as an indefinite-lived intangible asset and assessed forimpairment thereafter until completion, at which point the asset is amortized over its expected useful life. Separately recognized transactions associated withbusiness combinations are generally expensed subsequent to the acquisition date. The application of business combination and impairment accountingrequires the use of significant estimates and assumptions.
The results of operations of acquired businesses are included in our Consolidated Financial Statements from the acquisition date.
Goodwill and indefinite-lived intangible assets are tested for impairment on an annual basis in the second fiscal quarter, or sooner if an indicator ofimpairment occurs. To determine whether goodwill is impaired, we first assess certain qualitative factors. Based on this assessment, if it is determined morelikely than not that the fair value of a reporting unit is less than its carrying amount, we perform the quantitative analysis of the goodwill impairment test. Wedetermine the fair values of each of our reportable business units using a discounted cash flow methodology and then compare the fair values to the carryingvalues of each reportable business unit. We concluded that there was no impairment to goodwill or any triggering events during Fiscal 2013. On January 10,2013, we announced our intention to replace our current segment reporting structure with the following product and services business units in the first quarterof Fiscal 2014: End User Computing, the Enterprise Solutions Group, Dell Services, and the Dell Software Group. Accordingly, in the first quarter of Fiscal2014, we will reassign goodwill to reporting units based on the new reporting structure using a relative fair value approach. We do not expect to incur anyimpairment charges related to goodwill as a result of this process.
Standard Warranty Liabilities — We record warranty liabilities at the time of sale for the estimated costs that may be incurred under the terms of the limitedwarranty. The liability for standard warranties is included in accrued and other current and other non-current liabilities on the Consolidated Statements ofFinancial Position. The specific warranty terms and conditions vary depending upon the product sold and the country in which we do business, but generallyinclude technical support, parts, and labor over a period ranging from one to three years. Factors that affect our warranty liability include the number ofinstalled units currently under warranty, historical and anticipated rates of warranty claims on those units, and cost per claim to satisfy our warrantyobligation. The anticipated rate of warranty claims is the primary factor impacting our estimated warranty obligation. The other factors are less significant dueto the fact that the average remaining aggregate warranty period of the covered installed base is approximately 16 months, repair parts are generally already instock or available at pre-determined prices, and labor rates are generally arranged at pre-established amounts with service providers. Warranty claims arereasonably predictable based on historical experience of failure rates. If actual results differ from our estimates, we revise our estimated warranty liability toreflect such changes. Each quarter, we reevaluate our estimates to assess the adequacy of the recorded warranty liabilities and adjust the amounts as necessary.
Income Taxes — We are subject to income tax in the U.S. and numerous foreign jurisdictions. Significant judgments are required in determining theconsolidated provision for income taxes. We calculate a provision for income taxes using the asset and liability method, under which deferred tax assets andliabilities are recognized by identifying the temporary differences arising from the different treatment of items for tax and accounting purposes. We providerelated valuation allowances for deferred tax assets, where appropriate. Significant judgment is required in determining any valuation allowance againstdeferred tax assets. In assessing the need for a valuation allowance, we consider all available evidence for each jurisdiction, including past operating results,estimates of future taxable income, and the feasibility of ongoing tax planning strategies. In the event we determine all or part of the net deferred tax assets arenot realizable in the future, we will make an adjustment to the valuation allowance that would be charged to earnings in the period such determination is made.
Significant judgment is also required in evaluating our uncertain tax positions. While we believe our tax return positions are sustainable, we recognize taxbenefits from uncertain tax positions in the financial statements only when it is more likely than not that the positions will be sustained upon examination,including resolution of any related appeals or litigation processes, based on the technical merits and a consideration of the relevant taxing authority'sadministrative practices and precedents. To
57

Table of Contents
the extent that the final tax outcome of these matters is different than the amounts recorded, such differences will impact the provision for income taxes in theperiod in which such determination is made. The provision for income taxes includes the impact of reserve provisions and changes to reserves that areconsidered appropriate, as well as the related net interest and penalties. We believe we have provided adequate reserves for all uncertain tax positions.
Loss Contingencies — We are subject to the possibility of various losses arising in the ordinary course of business. We consider the likelihood of loss orimpairment of an asset or the incurrence of a liability, as well as our ability to reasonably estimate the amount of loss, in determining loss contingencies. Anestimated loss contingency is accrued when it is probable that an asset has been impaired or a liability has been incurred and the amount of loss can bereasonably estimated. We regularly evaluate current information available to us to determine whether such accruals should be adjusted and whether newaccruals are required. Third parties have in the past asserted, and may in the future assert, claims or initiate litigation related to exclusive patent, copyright,and other intellectual property rights to technologies and related standards that are relevant to us. If any infringement or other intellectual property claim madeagainst us by any third party is successful, or if we fail to develop non-infringing technology or license the proprietary rights on commercially reasonableterms and conditions, our business, operating results, and financial condition could be materially and adversely affected.
Inventories — We state our inventory at the lower of cost or market. We record a write-down for inventories of components and products, including third-party products held for resale, which have become obsolete or are in excess of anticipated demand or net realizable value. We perform a detailed review ofinventory each fiscal quarter that considers multiple factors, including demand forecasts, product life cycle status, product development plans, current saleslevels, and component cost trends. The industries in which we compete are subject to demand changes. If future demand or market conditions for ourproducts are less favorable than forecasted or if unforeseen technological changes negatively impact the utility of component inventory, we may be required torecord additional write-downs, which would adversely affect our gross margin .
New Accounting Pronouncements
Intangibles- Goodwill and Other — In September 2011, the FASB issued new guidance that simplified how entities test goodwill for impairment. Afterassessment of certain qualitative factors, if it is determined to be more likely than not that the fair value of a reporting unit is less than its carrying amount,entities must perform the quantitative analysis of the goodwill impairment test. Otherwise, the quantitative test becomes optional. Dell adopted this newguidance in the first quarter of Fiscal 2013. Goodwill is tested for impairment on an annual basis in the second fiscal quarter, or sooner if an indicator ofimpairment occurs. The adoption of this guidance did not impact Dell's Consolidated Financial Statements. See Note 8 of the Notes to the ConsolidatedFinancial Statements included in “Part II - Item 8 - Financial Statements and Supplementary Data” for more information.
In July 2012, the FASB issued amended guidance that simplifies how entities test indefinite-lived intangible assets other than goodwill for impairment. Afterassessment of certain qualitative factors, if it is determined to be more likely than not that an indefinite-lived asset is impaired, entities must perform thequantitative impairment test. Otherwise, the quantitative test becomes optional. The amended guidance is effective for annual and interim impairment testsperformed for fiscal years beginning after September 15, 2012, with early adoption permitted. Dell adopted this new guidance in the third quarter of the Fiscal2013, and the adoption did not impact Dell's Consolidated Financial Statements.
58

Table of Contents
ITEM 7A — QUANTITATIVE AND QUALITATIVE DISCLOSURES ABOUT MARKET RISK
We are exposed to a variety of risks, including foreign currency exchange rate fluctuations and changes in the market value of our investments. In the normalcourse of business, we employ established policies and procedures to manage these risks.
Foreign Currency Risk
During Fiscal 2013, the principal foreign currencies in which we transacted business were the Euro, Chinese Renminbi, Japanese Yen, British Pound,Canadian Dollar, and Australian Dollar. Our objective in managing our exposures to foreign currency exchange rate fluctuations is to reduce the impact ofadverse fluctuations associated with foreign currency exchange rate changes on our earnings and cash flows. Accordingly, we utilize foreign currency optioncontracts and forward contracts to hedge our exposure on forecasted transactions and firm commitments for certain currencies. During Fiscal 2013, we hedgedour exposures on more than 20 currencies. We monitor our foreign currency exchange exposures to ensure the overall effectiveness of our foreign currencyhedge positions. However, there can be no assurance that our foreign currency hedging activities will continue to substantially offset the impact of fluctuationsin currency exchange rates on our results of operations and financial position in the future.
Based on our foreign currency hedge instruments outstanding, which include designated and non-designated instruments, as of February 1, 2013 andFebruary 3, 2012, we estimate a maximum potential one-day loss in fair value of approximately $39 million and $34 million, respectively, using a Value-at-Risk (“VAR”) model. By using market implied rates and incorporating volatility and correlation among the currencies of a portfolio, the VAR model simulates3,000 randomly generated market prices and calculates the difference between the fifth percentile and the average as the Value-at-Risk. The VAR model is a riskestimation tool and is not intended to represent actual losses in fair value that will be incurred. Additionally, as we utilize foreign currency instruments forhedging forecasted and firmly committed transactions, a loss in fair value for those instruments is generally offset by increases in the value of the underlyingexposure.
Interest Rate Risk
We also are exposed to interest rate risk related to our debt and investment portfolios and financing receivables. We mitigate the risk related to our structuredfinancing debt through the use of interest rate swaps to hedge the variability in cash flows related to the interest rate payments on such debt. See Note 6 of theNotes to the Consolidated Financial Statements included in “Part II — Item 8 — Financial Statements and Supplementary Data” for more information on ourinterest rate swaps.
We mitigate the risks related to our investment portfolio by investing primarily in high credit quality securities, limiting the amount that can be invested in anysingle issuer, and investing in short -to- intermediate-term investments. Based on our investment portfolio and interest rates as of February 1, 2013, a 100basis point increase in interest rates would have resulted in a decrease of approximately $42 million in the fair value of our investment portfolio, while a 100basis point decrease in interest rates would have resulted in an increase of approximately $31 million in the fair value of our investments. As of February 3,2012, a 100 basis point increase in interest rates would have resulted in a decrease of approximately $61 million in the fair value of our investment portfolio,while a 100 basis point decrease in interest rates would have resulted in an increase of approximately $48 million in the fair value of our investment portfolio.The slight decrease in our interest rate sensitivity from February 3, 2012 to February 1, 2013 was due to a shift in the duration of our portfolio to shorter-duration investments.
5 9

Table of Contents
ITEM 8 — FINANCIAL STATEMENTS AND SUPPLEMENTARY DATA
INDEX TO CONSOLIDATED FINANCIAL STATEMENTS Page
Financial Statements:
Report of Independent Registered Public Accounting Firm 61
Consolidated Statements of Financial Position at February 1, 2013, and February 3, 2012 62
Consolidated Statements of Income for the fiscal years ended February 1, 2013, February 3, 2012, and January 28, 2011 63
Consolidated Statements of Comprehensive Income for the fiscal years ended February 1, 2013, February 3, 2012, andJanuary 28, 2011 64
Consolidated Statements of Cash Flows for the fiscal years ended February 1, 2013, February 3, 2012, and January 28, 2011 6 5
Consolidated Statements of Stockholders’ Equity for the fiscal years ended February 1, 2013, February 3, 2012, and January28, 2011 6 6
Notes to Consolidated Financial Statements 67
60

Table of Contents
Report of Independent Registered Public Accounting Firm
To the Board of Directors andShareholders of Dell Inc.:
In our opinion, the consolidated financial statements listed in the accompanying index present fairly, in all material respects, the financial position of Dell Inc.and its subsidiaries (the "Company") at February 1, 2013 and February 3, 2012, and the results of their operations and their cash flows for each of the threeyears in the period ended February 1, 2013 in conformity with accounting principles generally accepted in the United States of America. Also, in our opinion,the Company maintained, in all material respects, effective internal control over financial reporting as of February 1, 2013, based on criteria established inInternal Control - Integrated Framework issued by the Committee of Sponsoring Organizations of the Treadway Commission (COSO). The Company'smanagement is responsible for these financial statements, for maintaining effective internal control over financial reporting and for its assessment of theeffectiveness of internal control over financial reporting, included in Management's Report on Internal Control Over Financial Reporting appearing under Item9A. Our responsibility is to express opinions on these financial statements, and on the Company's internal control over financial reporting based on ourintegrated audits. We conducted our audits in accordance with the standards of the Public Company Accounting Oversight Board (United States). Thosestandards require that we plan and perform the audits to obtain reasonable assurance about whether the financial statements are free of material misstatementand whether effective internal control over financial reporting was maintained in all material respects. Our audits of the financial statements includedexamining, on a test basis, evidence supporting the amounts and disclosures in the financial statements, assessing the accounting principles used andsignificant estimates made by management, and evaluating the overall financial statement presentation. Our audit of internal control over financial reportingincluded obtaining an understanding of internal control over financial reporting, assessing the risk that a material weakness exists, and testing and evaluatingthe design and operating effectiveness of internal control based on the assessed risk. Our audits also included performing such other procedures as weconsidered necessary in the circumstances. We believe that our audits provide a reasonable basis for our opinions.
A company's internal control over financial reporting is a process designed to provide reasonable assurance regarding the reliability of financial reporting andthe preparation of financial statements for external purposes in accordance with generally accepted accounting principles. A company's internal control overfinancial reporting includes those policies and procedures that (i) pertain to the maintenance of records that, in reasonable detail, accurately and fairly reflectthe transactions and dispositions of the assets of the company; (ii) provide reasonable assurance that transactions are recorded as necessary to permitpreparation of financial statements in accordance with generally accepted accounting principles, and that receipts and expenditures of the company are beingmade only in accordance with authorizations of management and directors of the company; and (iii) provide reasonable assurance regarding prevention ortimely detection of unauthorized acquisition, use, or disposition of the company's assets that could have a material effect on the financial statements.
Because of its inherent limitations, internal control over financial reporting may not prevent or detect misstatements. Also, projections of any evaluation ofeffectiveness to future periods are subject to the risk that controls may become inadequate because of changes in conditions, or that the degree of compliancewith the policies or procedures may deteriorate.
/s/ PRICEWATERHOUSECOOPERS LLP
Austin, TexasMarch 12, 2013
61

Table of Contents
DELL INC.
CONSOLIDATED STATEMENTS OF FINANCIAL POSITION(in millions)
February 1,
2013 February 3,
2012ASSETS
Current assets: Cash and cash equivalents $ 12,569 $ 13,852Short-term investments 208 9 6 6Accounts receivable, net 6,629 6,476Short-term financing receivables, net 3,213 3,327Inventories, net 1,382 1,404Other current assets 3,967 3,423
Total current assets 27,968 29,448Property, plant, and equipment, net 2,126 2,124Long-term investments 2,565 3,404Long-term financing receivables, net 1,349 1,372Goodwill 9,304 5,838Purchased intangible assets, net 3,374 1,857Other non-current assets 854 490
Total assets $ 47,540 $ 44,533
LIABILITIES AND STOCKHOLDERS’ EQUITYCurrent liabilities:
Short-term debt $ 3,843 $ 2,867Accounts payable 11,579 11,656Accrued and other 3,644 3,740Short-term deferred revenue 4,373 3,738
Total current liabilities 23,439 22,001Long-term debt 5,242 6,387Long-term deferred revenue 3,971 3,855Other non-current liabilities 4,187 3,373
Total liabilities 36,839 35,616Commitments and contingencies (Note 10) Stockholders’ equity:
Common stock and capital in excess of $.01 par value; shares authorized: 7,000; shares issued: 3,413 and3,390, respectively; shares outstanding: 1,738 and 1,761, respectively 12,554 12,187
Treasury stock at cost: 1,200 and 1,154 shares, respectively (32,145) (31,445)Retained earnings 30,330 28,236Accumulated other comprehensive loss (59) (61)Total Dell stockholders’ equity 10,680 8,917Noncontrolling interest 21 —
Total stockholders’ equity 10,701 8,917Total liabilities and stockholders’ equity $ 47,540 $ 44,533
The accompanying notes are an integral part of these consolidated financial statements.
62

Table of Contents
DELL INC.
CONSOLIDATED STATEMENTS OF INCOME(in millions, except per share amounts)
Fiscal Year Ended
February 1,
2013 February 3,
2012 January 28,
2011Net revenue:
Products $ 44,744 $ 49,906 $ 50,002Services, including software related 12,196 12,165 11,492
Total net revenue 56,940 62,071 61,494Cost of net revenue:
Products 36,683 39,689 42,068Services, including software related 8,071 8,571 8,030
Total cost of net revenue 44,754 48,260 50,098Gross margin 12,186 13,811 11,396
Operating expenses: Selling, general, and administrative 8,102 8,524 7,302Research, development, and engineering 1,072 856 661
Total operating expenses 9,174 9,380 7,963Operating income 3,012 4,431 3,433
Interest and other, net (171) (191) (83)Income before income taxes 2,841 4,240 3,350
Income tax provision 469 748 715Net income $ 2,372 $ 3,492 $ 2,635
Earnings per share: Basic $ 1.36 $ 1.90 $ 1.36Diluted $ 1.35 $ 1.88 $ 1.35
Cash dividends declared per common share $ 0.16 $ — $ —Weighted-average shares outstanding:
Basic 1,745 1,838 1,944Diluted 1,755 1,853 1,955
The accompanying notes are an integral part of these consolidated financial statements.
63

Table of Contents
DELL INC.
CONSOLIDATED STATEMENTS OF COMPREHENSIVE INCOME(in millions)
Fiscal Year Ended February 1, 2013 February 3, 2012 January 28, 2011Net income $ 2,372 $ 3,492 $ 2,635Adjustment to consolidate variable interest entities — — (1)
Other comprehensive income, net of tax Foreign currency translation adjustments (33) (74) 79
Available-for-sale investments Change in unrealized gains (losses) 7 42 —Reclassification adjustment for net (gains) losses included in net income (13) (29) (1)
Net change (6) 13 (1)
Cash Flow Hedges Change in unrealized gains (losses) (18) (119) (254)Reclassification adjustment for net (gains) losses included in net income 5 9 190 142
Net change 41 71 (112)
Total other comprehensive income (loss), net of tax benefit (expense) of $(8), $(1) and $2,respectively 2 10 (34)Comprehensive income, net of tax $ 2,374 $ 3,502 $ 2,600
The accompanying notes are an integral part of these consolidated financial statements.
64

Table of Contents
DELL INC.CONSOLIDATED STATEMENTS OF CASH FLOWS
(in millions)
Fiscal Year Ended
February 1,
2013 February 3,
2012 January 28,
2011Cash flows from operating activities:
Net income $ 2,372 $ 3,492 $ 2,635Adjustments to reconcile net income to net cash provided by operating activities:
Depreciation and amortization 1,144 936 970Stock-based compensation expense 347 362 332Effects of exchange rate changes on monetary assets and liabilities denominated in foreigncurrencies 18 (5) (4)Deferred income taxes (428) 19 (45)Provision for doubtful accounts — including financing receivables 258 234 382Other 19 21 26
Changes in assets and liabilities, net of effects from acquisitions: Accounts receivable (150) (53) (707)Financing receivables (193) (372) (709)Inventories 48 (52) (248)Other assets (334) (28) 516Accounts payable (74) 327 (151)Deferred revenue 382 701 307Accrued and other liabilities (126) (55) 6 6 5
Change in cash from operating activities 3,283 5,527 3,969Cash flows from investing activities:
Investments: Purchases (2,615) (4,656) (1,360)Maturities and sales 4,354 1,435 1,358
Capital expenditures (513) (675) (444)Proceeds from sale of facilities, land, and other assets 135 14 18Purchase of financing receivables — — (430)Collections on purchased financing receivables 167 278 6 9Acquisitions, net of cash received (4,844) (2,562) (376)
Change in cash from investing activities (3,316) (6,166) (1,165)Cash flows from financing activities:
Repurchases of common stock (724) (2,717) (800)Cash dividends paid (278) — —Issuance of common stock under employee plans 52 40 12Issuance (repayment) of commercial paper (maturity 90 days or less), net (331) 635 (176)Proceeds from debt 3,311 4,050 3,069Repayments of debt (3,248) (1,435) (1,630)Other 8 4 2
Change in cash from financing activities (1,210) 577 477Effect of exchange rate changes on cash and cash equivalents (40) 1 (3)Change in cash and cash equivalents (1,283) (61) 3,278Cash and cash equivalents at beginning of the period 13,852 13,913 10,635Cash and cash equivalents at end of the period $ 12,569 $ 13,852 $ 13,913Income tax paid $ 283 $ 408 $ 435Interest paid $ 279 $ 267 $ 188
The accompanying notes are an integral part of these consolidated financial statements.
6 5

Table of Contents
DELL INC.
CONSOLIDATED STATEMENTS OF STOCKHOLDERS’ EQUITY(in millions)
Common Stock and Capital in Excess
of Par Value
Treasury Stock
Issued Shares
(a) Amount Shares Amount RetainedEarnings
Accumulated OtherComprehensiveIncome/(Loss)
Total DellShareholder's
Equity Non-ControllingInterest Total Equity
Balances at January 29, 2010 3,351 $ 11,472 919 $ (27,904) $ 22,110 $ (37) $ 5,641 $ — $ 5,641
Net income — — — — 2,635 — 2,635 — 2,635Adjustment to consolidate variable interest entities — — — — (1) — (1) — (1)Change in net unrealized gain or loss oninvestments, net of taxes — — — — — (1) (1) — (1)
Foreign currency translation adjustments — — — — — 79 79 — 79Change in net unrealized gain or loss on derivativeinstruments, net of taxes — — — — — (112) (112) — (112)
Total comprehensive income — — — — — — 2,600 — 2,600Stock issuances under employee plans and other (b) 18 7 — — — — 7 — 7Repurchases of common stock — — 57 (800) — — (800) — (800)
Stock-based compensation related — 332 — — — — 332 — 332Net tax shortfall from employee stock plans — (14) — — — — (14) — (14)
Balances at January 28, 2011 3,369 11,797 976 (28,704) 24,744 (71) 7,766 — 7,766
Net income — — — — 3,492 — 3,492 — 3,492Change in net unrealized gain or loss oninvestments, net of taxes — — — — — 13 13 — 13
Foreign currency translation adjustments — — — — — (74) (74) — (74)Change in net unrealized gain or loss on derivativeinstruments, net of taxes — — — — — 71 71 — 71
Total comprehensive income — — — — — — 3,502 — 3,502Stock issuances under employee plans and other (b) 21 33 — — — — 33 — 33Repurchases of common stock — — 178 (2,741) — — (2,741) — (2,741)
Stock-based compensation related — 365 — — — — 365 — 365Net tax shortfall from employee stock plans — (8) — — — — (8) — (8)
Balances at February 3, 2012 3,390 12,187 1,154 (31,445) 28,236 (61) 8,917 — 8,917
Net income — — — — 2,372 — 2,372 — 2,372Change in net unrealized gain or loss oninvestments, net of taxes — — — — — (6) (6) — (6)
Foreign currency translation adjustments — — — — — (33) (33) — (33)Change in net unrealized gain or loss on derivativeinstruments, net of taxes — — — — — 41 41 — 41
Total comprehensive income — — — — — — 2,374 — 2,374Stock issuances under employee plans and other (b) 23 36 — — — — 36 — 36Repurchases of common stock — — 46 (700) — — (700) — (700)
Cash dividends declared — — — — (278) — (278) — (278)
Stock-based compensation related — 358 — — — — 358 — 358Net tax shortfall from employee stock plans — (27) — — — — (27) — (27)Noncontrolling interest assumed throughacquisitions — — — — — — — 21 21
Balances at February 1, 2013 3,413 $ 12,554 1,200 $ (32,145) $ 30,330 $ (59) $ 10,680 $ 21 $ 10,701
(a) Issued shares include 475 million shares of common stock that were issued to a wholly-owned subsidiary during Fiscal 2007. As these shares are held by a wholly-owned subsidiary,they are not included in outstanding shares in our Consolidated Financial Statements.(b) Stock issuance under employee plans is net of shares withheld for employee taxes.
The accompanying notes are an integral part of these consolidated financial statements.
6 6

Table of Contents
DELL INC.
NOTES TO CONSOLIDATED FINANCIAL STATEMENTS
NOTE 1 — DESCRIPTION OF BUSINESS AND SUMMARY OF SIGNIFICANT ACCOUNTING POLICIES
Description of Business — Dell Inc., a Delaware corporation (both individually and together with its consolidated subsidiaries, “Dell”), offers a broad rangeof technology solutions, including servers and networking products, storage products, services, software and peripherals, mobility products, and desktopPCs. Dell's business segments are Large Enterprise, Public, Small and Medium Business ("SMB"), and Consumer. References to the Commercial businessrefer to Large Enterprise, Public, and SMB.
Fiscal Year — Dell's fiscal year is the 52 or 53 week period ending on the Friday nearest January 31. The fiscal year ended February 1, 2013 ("Fiscal 2013")included 52 weeks, while the fiscal years ended February 3, 2012 ("Fiscal 2012") and January 28, 2011 ("Fiscal 2011") included 53 weeks and 52 weeks,respectively.
Principles of Consolidation — The accompanying consolidated financial statements include the accounts of Dell Inc. and its wholly-owned subsidiaries andhave been prepared in accordance with accounting principles generally accepted in the United States of America (“GAAP”). All significant intercompanytransactions and balances have been eliminated.
Segment Realignment — In the first quarter of Fiscal 2013, Dell made certain segment realignments in order to conform to the way Dell managed segmentperformance through Fiscal 2013. These realignments affected all of Dell's operating segments, but primarily consisted of the transfer of small office businesscustomers from its SMB operating segment to its Consumer segment. Dell has recast prior period amounts to provide visibility and comparability. None ofthese changes impact Dell's previously reported consolidated net revenue, gross margin, operating income, net income, or earnings per share. See Note 15 ofthe Notes to the Consolidated Financial Statements for additional information on Dell's operating segments.
Reclassifications — Certain prior year amounts have been reclassified from accrued and other liabilities and other non-current liabilities on the ConsolidatedStatements of Financial Position to short-term deferred revenue and long-term deferred revenue, respectively, to conform to the current year presentation. Priorperiod amounts on the Consolidated Statements of Cash Flows have also been reclassified to conform to the current period presentation.
Use of Estimates — The preparation of financial statements in accordance with GAAP requires the use of management's estimates. These estimates aresubjective in nature and involve judgments that affect the reported amounts of assets and liabilities, the disclosure of contingent assets and liabilities at fiscalyear-end, and the reported amounts of revenues and expenses during the fiscal year. Actual results could differ from those estimates.
Cash and Cash Equivalents — All highly liquid investments, including credit card receivables due from banks, with original maturities o f 90 days or lessat date of purchase, are reported at fair value and are considered to be cash equivalents. All other investments not considered to be cash equivalents areseparately categorized as investments.
Investments — Dell's investments are primarily in debt securities, which are classified as available-for-sale and are reported at fair value (based primarily onquoted prices and market observable inputs) using the specific identification method. Unrealized gains and losses, net of taxes, are reported as a component ofstockholders’ equity. Realized gains and losses on investments are included in interest and other, net. An impairment loss will be recognized and will reducean investment's carrying amount to its fair value when a decline in the fair value of an individual security below its cost or carrying value is determined to beother than temporary.
Dell reviews its investment portfolio quarterly to determine if any investment is other than temporarily impaired. Dell determines an impairment is other thantemporary when there is intent to sell the security, it is more likely than not that the security will be required to be sold before recovery in value or it is notexpected to recover its entire amortized cost basis (“credit-related loss”). However, if Dell does not expect to sell a debt security, it still evaluates expected cashflows to be received and determines if a credit-related loss exists. In the event of a credit-related loss, only the amount of impairment associated with the credit-related loss is recognized in earnings. Amounts relating to factors other than credit-related losses are recorded as a component of stockholders' equity. SeeNote 3 of the Notes to the Consolidated Financial Statements for additional information.
Allowance for Doubtful Accounts — Dell recognizes an allowance for losses on accounts receivable in an amount equal to the estimated probable losses net ofrecoveries. The allowance is based on an analysis of historical bad debt experience, current receivables aging, and expected future write-offs, as well as anassessment of specific identifiable customer accounts considered at risk or uncollectible. The expense associated with the allowance for doubtful accounts isrecognized in selling, general, and administrative expenses.
67
Table of ContentsDELL INC.
NOTES TO CONSOLIDATED FINANCIAL STATEMENTS (Continued)
Financing Receivables —
Financing receivables are presented net of allowance for losses and consist of customer receivables and residual interest. Customer receivables includerevolving loans and fixed-term leases and loans resulting primarily from the sale of Dell products and services. Based on how Dell assesses risk anddetermines the appropriate allowance levels, Dell has two portfolio segments: (1) fixed-term leases and loans and (2) revolving loans. The portfoliosegments are further segregated into classes based on products, customer type, and credit risk evaluation: (1) Revolving - Dell Preferred Account(“DPA”); (2) Revolving - Dell Business Credit (“DBC”); (3) Fixed-term - consumer and small commercial; and (4) Fixed-term - medium and largecommercial. Fixed-term leases and loans are offered to qualified small and medium-sized businesses, large commercial accounts, governmentalorganizations, and educational entities. Additionally, fixed-term loans are also offered to certain individual consumer customers. Revolving loans areoffered under private label credit financing programs. The DPA revolving loans programs are offered to individual consumers and the DBCrevolving loan programs are offered to small and medium-sized business customers.
Dell retains a residual interest in equipment leased under its fixed-term lease programs. The amount of the residual interest is established at theinception of the lease based upon estimates of the value of the equipment at the end of the lease term using historical studies, industry data, andfuture value-at-risk demand valuation methods. On a quarterly basis, Dell assesses the carrying amount of its recorded residual values forimpairment. Anticipated declines in specific future residual values that are considered to be other-than-temporary are recorded currently in earnings.
Allowance for Financing Receivables Losses
Dell recognizes an allowance for losses on financing receivables in an amount equal to the probable losses net of recoveries. The allowance for lossesis generally determined at the aggregate portfolio level based on a variety of factors, including historical and anticipated experience, past duereceivables, receivable type, and customer risk profile. Customer account principal and interest are charged to the allowance for losses when anaccount is deemed to be uncollectible or generally when the account is 180 days delinquent. While Dell does not generally place financing receivableson non-accrual status during the delinquency period, accrued interest is included in the allowance for loss calculation, and therefore, Dell isadequately reserved in the event of charge off. Recoveries on receivables previously charged off as uncollectible are recorded to the allowance forfinancing receivables losses. The expense associated with the allowance for financing receivables losses is recognized as cost of net revenue. Bothfixed and revolving receivable loss rates are affected by macro-economic conditions, including the level of GDP growth, unemployment rates, thelevel of commercial capital equipment investment, and the credit quality of the borrower.
Asset Securitization
Dell enters into securitization transactions to transfer certain financing receivables to Special Purpose Entities ("SPEs") that meet the definition of aVariable Interest Entity ("VIE"). During Fiscal 2011, Dell adopted accounting guidance that requires an entity to perform an ongoing analysis todetermine whether it has a controlling financial interest in these entities. As a result of this analysis, Dell determined that it has a controlling financialinterest in its SPEs, and therefore, consolidated them into Dell's Consolidated Statements of Financial Position as of January 28, 2011. The assetsecuritizations in these SPEs are being accounted for as secured borrowings. See Note 4 of the Notes to the Consolidated Financial Statements foradditional information on the impact of the consolidation.
Inventories — Inventories are stated at the lower of cost or market with cost being determined on a first-in, first-out basis. Adjustments to reduce the cost ofinventory to its net realizable value are made, if required, for estimated excess, obsolescence, or impaired balances.
Property, Plant, and Equipment — Property, plant, and equipment are carried at depreciated cost. Depreciation is provided using the straight-line methodover the estimated economic lives of the assets, which range from ten to thirty years for buildings and two to five years for all other assets. Leaseholdimprovements are amortized over the shorter of five years or the lease term. Gains or losses related to retirements or disposition of fixed assets are recognized inthe period incurred.
Software Development Costs — Costs incurred in the research and development of new software products and enhancements to existing software productsare expensed as incurred until technological feasibility has been established. After technological feasibility is established, any additional costs are capitalized inaccordance with authoritative guidance until the product is available for general release. Software development costs incurred subsequent to a productestablishing technological feasibility are usually not significant, and accordingly, no significant software development costs have been capitalized as ofFebruary 1, 2013 or February 3, 2012.
68

Table of ContentsDELL INC.
NOTES TO CONSOLIDATED FINANCIAL STATEMENTS (Continued)
Dell capitalizes eligible internal-use software development costs incurred subsequent to the completion of the preliminary project stage. Development costs areamortized over the shorter of the expected useful life of the software or five years. Costs associated with maintenance and minor enhancements to the featuresand functionality of Dell's website are expensed as incurred.
Impairment of Long-Lived Assets — Dell reviews long-lived assets for impairment when circumstances indicate the carrying amount of an asset may not berecoverable based on the undiscounted future cash flows of the asset. If the carrying amount of the asset is determined not to be recoverable, a write-down tofair value is recorded. Fair values are determined based on quoted market values, discounted cash flows, or external appraisals, as applicable. Dell reviewslong-lived assets for impairment at the individual asset or the asset group level for which the lowest level of independent cash flows can be identified.
Business Combinations — Dell accounts for business combinations using the acquisition method of accounting, and accordingly, the assets and liabilitiesof the acquired business are recorded at their fair values at the date of acquisition. The excess of the purchase price over the estimated fair values is recorded asgoodwill. Any changes in the estimated fair values of the net assets recorded for acquisitions prior to the finalization of more detailed analysis, but not toexceed one year from the date of acquisition, will change the amount of the purchase prices allocable to goodwill. Any subsequent changes to any purchaseprice allocations that are material to Dell's consolidated financial results will be adjusted retroactively. All acquisition costs are expensed as incurred. In-processresearch and development costs are recorded at fair value as an indefinite-lived intangible asset and assessed for impairment thereafter until completion, atwhich point the asset is amortized over its expected useful life. Separately recognized transactions associated with business combinations are generallyexpensed subsequent to the acquisition date. The results of operations of acquired businesses are included in the Consolidated Financial Statements from theacquisition date.
Intangible Assets Including Goodwill — Identifiable intangible assets with finite lives are amortized over their estimated useful lives. They are generallyamortized on a non-straight-line approach based on the associated projected cash flows in order to match the amortization pattern to the pattern in which theeconomic benefits of the assets are expected to be consumed. Intangible assets are reviewed for impairment if indicators of potential impairment exist. Goodwilland indefinite-lived intangible assets are tested for impairment on an annual basis in the second fiscal quarter, or sooner if an indicator of impairment occurs.
Foreign Currency Translation — The majority of Dell's international sales are made by international subsidiaries, most of which have the U.S. dollar astheir functional currency. Dell's subsidiaries that do not have the U.S. dollar as their functional currency translate assets and liabilities at current rates ofexchange in effect at the balance sheet date. Revenue and expenses from these international subsidiaries are translated using the monthly average exchange ratesin effect for the period in which the items occur. These translations resulted in cumulative foreign currency translation gains (losses) of $(68) million, $(35)million, and $39 million as of February 1, 2013, February 3, 2012, and January 28, 2011, respectively, and are included as a component of accumulatedother comprehensive income (loss) in stockholders’ equity.
Local currency transactions of international subsidiaries that have the U.S. dollar as the functional currency are remeasured into U.S. dollars using currentrates of exchange for monetary assets and liabilities and historical rates of exchange for non-monetary assets and liabilities. Gains and losses fromremeasurement of monetary assets and liabilities are included in interest and other, net. See Note 6 of the Notes to the Consolidated Financial Statements foradditional information.
Hedging Instruments — Dell uses derivative financial instruments, primarily forwards, options, and swaps, to hedge certain foreign currency and interestrate exposures. The relationships between hedging instruments and hedged items, as well as the risk management objectives and strategies for undertakinghedge transactions, are formally documented. Dell does not use derivatives for speculative purposes.
All derivative instruments are recognized as either assets or liabilities in the Consolidated Statements of Financial Position and are measured at fair value.Hedge accounting is applied based upon the criteria established by accounting guidance for derivative instruments and hedging activities. Derivatives areassessed for hedge effectiveness both at the onset of the hedge and at regular intervals throughout the life of the derivative. Any hedge ineffectiveness isrecognized currently in earnings as a component of interest and other, net. Dell's hedge portfolio includes derivatives designated as both cash flow and fairvalue hedges.
For derivative instruments that are designated as cash flow hedges, hedge ineffectiveness is measured by comparing the cumulative change in the fair value ofthe hedge contract with the cumulative change in the fair value of the hedged item, both of which are based on forward rates. Dell records the effective portionof the gain or loss on the derivative instrument in
6 9

Table of ContentsDELL INC.
NOTES TO CONSOLIDATED FINANCIAL STATEMENTS (Continued)
accumulated other comprehensive income (loss) (“OCI”), as a separate component of stockholders' equity and reclassifies the gain or loss into earnings in theperiod during which the hedged transaction is recognized in earnings.
For derivatives that are designated as fair value hedges, hedge ineffectiveness is measured by calculating the periodic change in the fair value of the hedgecontract and the periodic change in the fair value of the hedged item. To the extent that these fair value changes do not fully offset each other, the difference isrecorded as ineffectiveness in earnings as a component of interest and other, net.
For derivatives that are not designated as hedges or do not qualify for hedge accounting treatment, Dell recognizes the change in the instrument's fair valuecurrently in earnings as a component of interest and other, net.
Cash flows from derivative instruments are presented in the same category on the Consolidated Statements of Cash Flows as the cash flows from theunderlying hedged items. See Note 6 of the Notes to the Consolidated Financial Statements for a description of Dell's derivative financial instrument activities.
Revenue Recognition — Net revenues include sales of hardware, services, software, and peripherals. Dell recognizes revenue for these products and serviceswhen it is realized or realizable and earned. Revenue is considered realized and earned when persuasive evidence of an arrangement exists; delivery hasoccurred or services have been rendered; Dell's fee to its customer is fixed and determinable; and collection of the resulting receivable is reasonably assured.
Revenue from third-party software sales and extended warranties for third-party products, for which Dell does not meet the criteria for gross revenuerecognition, is recognized on a net basis. All other revenue is recognized on a gross basis.
Services revenue and cost of services revenue captions on the Consolidated Statements of Income include Dell's services, third-party software revenue, andsupport services related to Dell-owned software offerings.
Multiple DeliverablesDell's multiple deliverable arrangements include hardware products that are sold with essential software or services such as extended warranty,installation, maintenance, and other services contracts. Dell's service contracts may include a combination of services arrangements, includingsupport and deployment services, infrastructure, cloud and security services, and applications and business process services. The nature and termsof these multiple deliverable arrangements will vary based on the customized needs of Dell's customers.
The deliverables included in Dell's multiple deliverable arrangements typically represent a separate unit of accounting. Accordingly, consideration isallocated to these deliverables based on each unit's relative selling price. The hierarchy used to determine the selling price of a deliverable is: (1)vendor specific objective evidence (“VSOE”), (2) third-party evidence of selling price (“TPE”), and (3) best estimate of the selling price (“ESP”). Ininstances where Dell cannot establish VSOE, Dell establishes TPE by evaluating largely similar and interchangeable competitor products or servicesin standalone sales to similarly situated customers.
ProductsRevenue from the sale of products is recognized when title and risk of loss passes to the customer. Delivery is considered complete when productshave been shipped to Dell's customer, title and risk of loss has transferred to the customer, and customer acceptance has been satisfied. Customeracceptance is satisfied if acceptance is obtained from the customer, if all acceptance provisions lapse, or if Dell has evidence that all acceptanceprovisions have been satisfied.
Dell records reductions to revenue for estimated customer sales returns, rebates, and certain other customer incentive programs. These reductions torevenue are made based upon reasonable and reliable estimates that are determined by historical experience, contractual terms, and current conditions.The primary factors affecting Dell's accrual for estimated customer returns include estimated return rates as well as the number of units shipped thathave a right of return that has not expired as of the balance sheet date. If returns cannot be reliably estimated, revenue is not recognized until a reliableestimate can be made or the return right lapses.
Dell sells its products directly to customers as well as through other distribution channels, such as retailers, distributors, and resellers. Dellrecognizes revenue on these sales when the reseller has economic substance apart from Dell; any credit risk has been identified and quantified; titleand risk of loss has passed to the sales channel; the
70

Table of ContentsDELL INC.
NOTES TO CONSOLIDATED FINANCIAL STATEMENTS (Continued)
fee paid to Dell is not contingent upon resale or payment by the end user; and Dell has no further obligations related to bringing about resale ordelivery.
Sales through Dell's distribution channels are primarily made under agreements allowing for limited rights of return, price protection, rebates, andmarketing development funds. Dell has generally limited return rights through contractual caps or has an established selling history for thesearrangements. Therefore, there is sufficient data to establish reasonable and reliable estimates of returns for the majority of these sales. To the extentprice protection or return rights are not limited and a reliable estimate cannot be made, all of the revenue and related costs are deferred until theproduct has been sold to the end-user or the rights expire. Dell records estimated reductions to revenue or an expense for distribution channelprograms at the later of the offer or the time revenue is recognized.
Dell defers the cost of shipped products awaiting revenue recognition until revenue is recognized.
ServicesServices include a broad range of configurable IT and business services, including support and deployment services, infrastructure, cloud, andsecurity services, and applications and business process services. Revenue is recognized for services contracts as earned, which is generally on astraight-line basis over the term of the contract or on a proportional performance basis as the services are rendered and Dell's obligations are fulfilled.Revenue from time and materials or cost-plus contracts is recognized as the services are performed. Revenue from fixed price contracts is recognizedon a straight-line basis, unless revenue is earned and obligations are fulfilled in a different pattern. These service contracts may include provisionsfor cancellation, termination, refunds, or service level adjustments. These contract provisions would not have a significant impact on recognizedrevenue as Dell generally recognizes revenue for these contracts as the services are performed.
For sales of extended warranties with a separate contract price, Dell defers revenue equal to the separately stated price. Revenue associated withundelivered elements is deferred and recorded when delivery occurs or services are provided. Revenue from extended warranty and service contracts,for which Dell is obligated to perform, is recorded as deferred revenue and subsequently recognized over the term of the contract on a straight-linebasis or when the service is completed, and the costs associated with these contracts are recognized as incurred.
SoftwareDell recognizes revenue in accordance with industry specific software accounting guidance for all software and PCS that are not essential to thefunctionality of the hardware. Accounting for software that is essential to the functionality of the hardware is accounted for as specified above under“Multiple Deliverables.” Dell has not established vendor specific objective evidence ("VSOE") of fair value for the undelivered elements of third-partysoftware offerings. For the majority of Dell-owned software offerings, Dell has established VSOE to support a separation of the software license andPCS elements. VSOE of the PCS element is determined by reference to the prices customers pay for support when it is sold separately. In instanceswhere VSOE is established, Dell recognizes revenue from the sale of software licenses at the time of initial sale, assuming all of the above criteriahave been met, and revenue from the PCS element over the maintenance period. When Dell has not established VSOE to support a separation of thesoftware license and PCS elements, the revenue and related costs are generally recognized over the term of the agreement.
OtherDell records revenue from the sale of equipment under sales-type leases as product revenue in an amount equal to the present value of minimum leasepayments at the inception of the lease. Sales-type leases also produce financing income, which is included in net revenue in the ConsolidatedStatements of Income and is recognized at consistent rates of return over the lease term. Dell also offers qualified customers revolving credit lines forthe purchase of products and services offered by Dell. Financing income attributable to these revolving loans is recognized in net revenue on anaccrual basis.
Dell reports revenue net of any revenue-based taxes assessed by governmental authorities that are imposed on and concurrent with specific revenue-producingtransactions.
Standard Warranty Liabilities — Dell records warranty liabilities for its standard limited warranty at the time of sale for the estimated costs that may beincurred under its limited warranty. The liability for standard warranties is included in accrued and other current and other non-current liabilities on theConsolidated Statements of Financial Position. The specific warranty
71

Table of ContentsDELL INC.
NOTES TO CONSOLIDATED FINANCIAL STATEMENTS (Continued)
terms and conditions vary depending upon the product sold and the country in which Dell does business, but generally includes technical support, parts, andlabor over a period ranging from one to three years. Factors that affect Dell's warranty liability include the number of installed units currently under warranty,historical and anticipated rates of warranty claims on those units, and cost per claim to satisfy Dell's warranty obligation. The anticipated rate of warrantyclaims is the primary factor impacting the estimated warranty obligation. The other factors are less significant due to the fact that the average remainingaggregate warranty period of the covered installed base is approximately 16 months, repair parts are generally already in stock or available at pre-determinedprices, and labor rates are generally arranged at pre-established amounts with service providers. Warranty claims are relatively predictable based on historicalexperience of failure rates. If actual results differ from the estimates, Dell revises its estimated warranty liability. Each quarter, Dell reevaluates its estimates toassess the adequacy of its recorded warranty liabilities and adjusts the amounts as necessary.
Deferred Revenue — Deferred revenue represents amounts received in advance for extended warranty services, amounts due or received from customersunder a legally binding commitment prior to services being rendered, deferred revenue related to Dell-owned software offerings, as well as other deferredrevenue. Other deferred revenue primarily consists of deferred profit on third-party software offerings. See Note 16 of the Notes to the Consolidated FinancialStatements for further information on deferred revenue.
Vendor Rebates and Settlements — Dell may receive consideration from vendors in the normal course of business. Certain of these funds are rebates ofpurchase price paid and others are related to reimbursement of costs incurred by Dell to sell the vendor's products. Dell recognizes a reduction of cost of goodssold and inventory if the funds are a reduction of the price of the vendor's products. If the consideration is a reimbursement of costs incurred by Dell to sell ordevelop the vendor's products, then the consideration is classified as a reduction of that cost in the Consolidated Statements of Income, most often operatingexpenses. In order to be recognized as a reduction of operating expenses, the reimbursement must be for a specific, incremental, identifiable cost incurred byDell in selling the vendor's products or services.
In addition, Dell may settle commercial disputes with vendors from time to time. Claims for loss recoveries are recognized when a loss event has occurred,recovery is considered probable, the agreement is finalized, and collectability is assured. Amounts received by Dell from vendors for loss recoveries aregenerally recorded as a reduction of cost of goods sold.
Loss Contingencies — Dell is subject to the possibility of various losses arising in the ordinary course of business. Dell considers the likelihood of loss orimpairment of an asset or the incurrence of a liability, as well as Dell's ability to reasonably estimate the amount of loss, in determining loss contingencies. Anestimated loss contingency is accrued when it is probable that an asset has been impaired or a liability has been incurred and the amount of loss can bereasonably estimated. Dell regularly evaluates current information available to determine whether such accruals should be adjusted and whether new accrualsare required.
Shipping Costs — Dell's shipping and handling costs are included in cost of sales in the Consolidated Statements of Income.
Selling, General, and Administrative — Selling expenses include items such as sales salaries and commissions, marketing and advertising costs, andcontractor services. Advertising costs are expensed as incurred and were $833 million, $860 million, and $730 million, during Fiscal 2013, Fiscal 2012, andFiscal 2011, respectively. Advertising costs are included in selling, general, and administrative expenses in the Consolidated Statements of Income. Generaland administrative expenses include items for Dell's administrative functions, such as finance, legal, human resources, and information technology support.These functions include costs for items such as salaries, maintenance and supplies, insurance, depreciation expense, and allowance for doubtful accounts.
Research, Development, and Engineering Costs — Research, development, and engineering costs are expensed as incurred. Research, development, andengineering expenses primarily include payroll and headcount-related costs, contractor fees, infrastructure costs, and administrative expenses directly related toresearch and development support.
Income Taxes — Deferred tax assets and liabilities are recorded based on the difference between the financial statement and tax basis of assets and liabilitiesusing enacted tax rates in effect for the year in which the differences are expected to reverse. Dell calculates a provision for income taxes using the asset andliability method, under which deferred tax assets and liabilities are recognized by identifying the temporary differences arising from the different treatment ofitems for tax and accounting purposes. Dell provides valuation allowances for deferred tax assets, where appropriate. In assessing the need for a valuationallowance, Dell considers all available evidence for each jurisdiction, including past operating results, estimates of future taxable income, and the feasibility ofongoing tax planning strategies. In the event Dell determines all or part of the net deferred tax assets are not realizable in the future, Dell will make anadjustment to the valuation allowance that would be charged to earnings in the period such determination is made.
72

Table of ContentsDELL INC.
NOTES TO CONSOLIDATED FINANCIAL STATEMENTS (Continued)
The accounting guidance for uncertainties in income tax prescribes a comprehensive model for the financial statement recognition, measurement, presentation,and disclosure of uncertain tax positions taken or expected to be taken in income tax returns. Dell recognizes a tax benefit from an uncertain tax position in thefinancial statements only when it is more likely than not that the position will be sustained upon examination, including resolution of any related appeals orlitigation processes, based on the technical merits and a consideration of the relevant taxing authority's administrative practices and precedents.
Earnings Per Share — Basic earnings per share is based on the weighted-average effect of all common shares issued and outstanding, and is calculated bydividing net income by the weighted-average shares outstanding during the period. Diluted earnings per share is calculated by dividing net income by theweighted-average number of common shares used in the basic earnings per share calculation plus the number of common shares that would be issuedassuming exercise or conversion of all potentially dilutive common shares outstanding. Dell excludes equity instruments from the calculation of dilutedearnings per share if the effect of including such instruments is anti-dilutive. See Note 12 of the Notes to the Consolidated Financial Statements for furtherinformation on earnings per share.
Stock-Based Compensation — Dell measures stock-based compensation expense for all share-based awards granted based on the estimated fair value of thoseawards at grant date. The cost of restricted stock units and performance-based restricted stock units is determined using the fair market value of Dell'scommon stock on the date of grant. For stock options granted under Dell's Incentive Plans, Dell typically estimates the fair value of the awards using theBlack-Scholes valuation model. For stock options assumed through business acquisitions, Dell uses the lattice binomial valuation model to estimate the fairvalue of the assumed award. The compensation costs of stock options, restricted stock units, and awards with a cliff vesting feature are recognized net of anyestimated forfeitures on a straight-line basis over the employee requisite service period. Compensation cost for performance-based awards is recognized on agraded accelerated basis net of estimated forfeitures over the requisite service period when achievement of the performance conditions is considered probable. Forfeiture rates are estimated at grant date based on historical experience and adjusted in subsequent periods for differences in actual forfeitures from thoseestimates. See Note 14 of the Notes to the Consolidated Financial Statements for further discussion of stock-based compensation.
Recently Issued Accounting Pronouncements
Comprehensive Income — In June 2011, the Financial Accounting Standards Board (the "FASB") issued new guidance on the presentation of comprehensiveincome. The new guidance eliminates the option to present components of other comprehensive income as part of the statement of changes in stockholders'equity and requires an entity to present either one continuous statement of net income and other comprehensive income or two separate, but consecutivestatements. This new guidance relates only to presentation. Dell began presenting a separate Condensed Consolidated Statement of Comprehensive Income inthe first quarter of Fiscal 2013. In February 2013, the FASB issued new guidance on reporting reclassifications out of accumulated other comprehensiveincome. This new guidance will be effective for Dell for the first quarter of the fiscal year ending January 31, 2014. Other than requiring additionaldisclosures, Dell does not expect this new guidance to impact Dell's Consolidated Financial Statements.
Intangibles- Goodwill and Other — In September 2011, the FASB issued new guidance that simplified how entities test goodwill for impairment. Afterassessment of certain qualitative factors, if it is determined to be more likely than not that the fair value of a reporting unit is less than its carrying amount,entities must perform the quantitative analysis of the goodwill impairment test. Otherwise, the quantitative test becomes optional. Dell adopted this newguidance in the first quarter of Fiscal 2013. Goodwill is tested for impairment on an annual basis in the second fiscal quarter, or sooner if an indicator ofimpairment occurs. The adoption of this guidance did not impact Dell's Consolidated Financial Statements. See Note 8 of the Notes to the ConsolidatedFinancial Statements for more information.
In July 2012, the FASB issued amended guidance that simplifies how entities test indefinite-lived intangible assets other than goodwill for impairment. Afterassessment of certain qualitative factors, if it is determined to be more likely than not that an indefinite-lived asset is impaired, entities must perform thequantitative impairment test. Otherwise, the quantitative test becomes optional. The amended guidance is effective for annual and interim impairment testsperformed for fiscal years beginning after September 15, 2012, with early adoption permitted. Dell adopted this new guidance in the third quarter of the Fiscal2013, and the adoption did not impact Dell's Consolidated Financial Statements.
Disclosures about Offsetting Assets and Liabilities — In January 2013, the FASB issued amended guidance that will enhance disclosure requirements aboutthe nature of an entity’s right to offset and related arrangements associated with its derivative instruments, repurchase agreements, and securities lendingtransactions. This new guidance requires the disclosure of the gross amounts subject to rights of offset, amounts offset in accordance with the accountingstandards followed, and the related net exposure. This new guidance will be effective for Dell for the first quarter of the fiscal year ending January 31, 2014.Early
73

Table of ContentsDELL INC.
NOTES TO CONSOLIDATED FINANCIAL STATEMENTS (Continued)
adoption is not permitted. Other than requiring additional disclosures, Dell does not expect this new guidance to impact Dell's Consolidated FinancialStatements.
74

Table of ContentsDELL INC.
NOTES TO CONSOLIDATED FINANCIAL STATEMENTS (Continued)
NOTE 2 — FAIR VALUE MEASUREMENTS
The following table presents Dell's hierarchy for its assets and liabilities measured at fair value on a recurring basis as of February 1, 2013, and February 3,2012:
February 1, 2013 February 3, 2012
Level 1(a) Level 2 (a) Level 3 Total Level 1 Level 2 Level 3 Total
QuotedPrices
in ActiveMarkets for
IdenticalAssets
SignificantOther
ObservableInputs
SignificantUnobservable
Inputs
QuotedPrices
in ActiveMarkets for
IdenticalAssets
SignificantOther
ObservableInputs
SignificantUnobservable
Inputs
(in millions) Assets:
Cash equivalents: Money market funds $ 8,869 $ — $ — $ 8,869 $ 8,370 $ — $ — $ 8,370Commercial paper — — — — — 2,011 — 2,011U.S. corporate — — — — — 5 — 5
Debt securities: Non- U.S. government andagencies — 96 — 96 — 94 — 94Commercial paper — 6 — 6 — 434 — 434U.S. corporate — 1,701 — 1,701 — 2,668 — 2,668International corporate — 700 — 700 — 1,055 — 1,055
Equity and other securities 1 112 — 113 2 105 — 107Derivative instruments — 68 — 68 — 140 — 140
Total assets $ 8,870 $ 2,683 $ — $ 11,553 $ 8,372 $ 6,512 $ — $ 14,884Liabilities:
Derivative instruments $ — $ 16 $ — $ 16 $ — $ 17 $ — $ 17
Total liabilities $ — $ 16 $ — $ 16 $ — $ 17 $ — $ 17____________________(a) Dell did not transfer any securities between levels during the fiscal year ended February 1, 2013 or during the fiscal year ended February 3, 2012.
The following section describes the valuation methodologies Dell uses to measure financial instruments at fair value:
Cash Equivalents — The majority of Dell's cash equivalents in the above table consist of money market funds and corporate commercial paper, all withoriginal maturities of 90 days or less and valued at fair value. The valuations of these securities are based on quoted prices in active markets for identicalassets, when available, or pricing models whereby all significant inputs are observable or can be derived from or corroborated by observable market data. Dellreviews security pricing and assesses liquidity on a quarterly basis.
Debt Securities — The majority of Dell's debt securities consist of various fixed income securities such as U.S. corporate, international corporate, and non-U.S. government and agencies. Valuation is based on pricing models whereby all significant inputs, including benchmark yields, reported trades, broker-dealer quotes, issue spreads, benchmark securities, bids, offers, and other market related data, are observable or can be derived from or corroborated byobservable market data for substantially the full term of the asset. Inputs are documented in accordance with the fair value measurements hierarchy. Dellreviews security pricing and assesses liquidity on a quarterly basis. See Note 3 of the Notes to the Consolidated Financial Statements for additionalinformation about investments.
Equity and Other Securities — The majority of Dell's investments in equity and other securities that are measured at fair value on a recurring basis consist ofvarious mutual funds held in Dell's Deferred Compensation Plan. See Note 14 of the Notes to the Consolidated Financial Statements for additional informationabout Dell's Deferred Compensation Plan. The valuation of these securities is based on pricing models whereby all significant inputs are observable or can bederived from or corroborated by observable market data. The valuation for the Level 1 position is based on quoted prices in active markets.
Derivative Instruments — Dell's derivative financial instruments consist primarily of foreign currency forward and purchased option contracts and interestrate swaps. The fair value of the portfolio is determined using valuation models based on market observable inputs, including interest rate curves, forwardand spot prices for currencies, and implied volatilities. Credit risk is
75

Table of ContentsDELL INC.
NOTES TO CONSOLIDATED FINANCIAL STATEMENTS (Continued)
factored into the fair value calculation of Dell's derivative instrument portfolio. For interest rate derivative instruments, credit risk is determined at the contractlevel with the use of credit default spreads of either Dell, when in a net liability position, or the relevant counterparty, when in a net asset position. For foreignexchange derivative instruments, credit risk is determined in a similar manner, except that the credit default spread is applied based on the net position of eachcounterparty with the use of the appropriate credit default spreads. See Note 6 of the Notes to the Consolidated Financial Statements for a description of Dell'sderivative financial instrument activities.
Assets and Liabilities Measured at Fair Value on a Nonrecurring Basis — Certain assets are measured at fair value on a nonrecurring basis and thereforeare not included in the recurring fair value table above. These assets consist primarily of investments accounted for under the cost method and non-financialassets such as goodwill and intangible assets. Investments accounted for under the cost method included in equity and other securities approximated $157million and $12 million as of February 1, 2013, and February 3, 2012, respectively. Dell acquired privately held investments in conjunction with itsacquisition of Quest Software, Inc. during the third quarter of Fiscal 2013 that are accounted for under the cost method. The fair value of these investmentswas $111 million as of the date of acquisition. See Note 7 of the Notes to the Consolidated Financial Statements for additional information about thisacquisition. Goodwill, intangible assets, and investments accounted for under the cost method are measured at fair value initially and subsequently when thereis an indicator of impairment and the impairment is recognized. See Note 8 of the Notes to the Consolidated Financial Statements for additional informationabout goodwill and intangible assets.
76

Table of ContentsDELL INC.
NOTES TO CONSOLIDATED FINANCIAL STATEMENTS (Continued)
NOTE 3 — INVESTMENTS
The following table summarizes, by major security type, the carrying value and amortized cost of Dell's investments. All debt security investments withremaining maturities in excess of one year and substantially all equity and other securities are recorded as long-term investments in the ConsolidatedStatements of Financial Position.
February 1, 2013 February 3, 2012
Carrying
Value Cost Unrealized Gain Unrealized
(Loss) Carrying
Value Cost Unrealized Gain Unrealized
(Loss) (in millions) Investments:
Non- U.S. government andagencies $ 13 $ 13 $ — $ — $ 24 $ 24 $ — $ —Commercial paper 6 6 — — 434 434 — —U.S. corporate 113 112 1 — 336 335 1 —International corporate 76 76 — — 172 172 — —
Total short-term investments 208 207 1 — 9 6 6 9 6 5 1 —
Non- U.S. government andagencies 83 83 — — 70 70 — —U.S. corporate 1,588 1,580 9 (1) 2,332 2,322 12 (2)International corporate 624 620 4 — 883 880 4 (1)Equity and other securities 270 270 — — 119 119 — —
Total long-term investments 2,565 2,553 13 (1) 3,404 3,391 16 (3)Total investments $ 2,773 $ 2,760 $ 14 $ (1) $ 4,370 $ 4,356 $ 17 $ (3)
Dell's investments in debt securities are classified as available-for-sale securities, which are carried at fair value. Equity and other securities primarily relate toinvestments held in Dell's Deferred Compensation Plan, which are classified as trading securities and carried at fair value, and investments accounted forunder the cost method. The fair value of Dell's portfolio can be affected by interest rate movements, credit, and liquidity risks. Dell's investments in debtsecurities have contractual maturities of three years or less.
During Fiscal 2013, Fiscal 2012, and Fiscal 2011, gross realized gains recognized in interest and other, net were $36 million, $49 million, and $7 million,respectively. Dell recognized gross realized losses of $1 million, $41 million, and $1 million, respectively, during the same periods.
77

Table of ContentsDELL INC.
NOTES TO CONSOLIDATED FINANCIAL STATEMENTS (Continued)
NOTE 4 — FINANCIAL SERVICES
Dell Financial Services
Dell offers or arranges various financing options and services for its business and consumer customers in the U.S. and Canada through Dell FinancialServices (“DFS”). DFS's key activities include the origination, collection, and servicing of customer receivables primarily related to the purchase of Dellproducts and services. The results of DFS are included in the business segment where the customer receivable was originated.
Dell's financing receivables are aggregated into the following categories:
• Revolving loans — Revolving loans offered under private label credit financing programs provide qualified customers with a revolving credit line forthe purchase of products and services offered by Dell. These private label credit financing programs are referred to as Dell Preferred Account (“DPA”)and Dell Business Credit (“DBC”). The DPA product is primarily offered to individual customers, and the DBC product is primarily offered tosmall and medium-sized commercial customers. Revolving loans in the U.S. bear interest at a variable annual percentage rate that is tied to the primerate. Based on historical payment patterns, revolving loan transactions are typically repaid within 12 months on average. Revolving loans areincluded in short-term financing receivables.
• Fixed-term sales-type leases and loans — Dell enters into sales-type lease arrangements with customers who desire lease financing. Leases withbusiness customers have fixed terms of generally two to four years. Future maturities of minimum lease payments at February 1, 2013, were asfollows: Fiscal 2014 - $1,191 million; Fiscal 2015 - $750 million; Fiscal 2016 - $322 million; Fiscal 2017 - $40 million; Fiscal 2018 and beyond -$5 million. Dell also offers fixed-term loans to qualified small businesses, large commercial accounts, governmental organizations, educationalentities, and certain individual consumer customers. These loans are repaid in equal payments including interest and have defined terms of generallythree to four years.
The following table summarizes the components of Dell's customer financing receivables segregated by portfolio segment as of February 1, 2013, andFebruary 3, 2012:
February 1, 2013 February 3, 2012 Revolving Fixed-term Total Revolving Fixed-term Total
(in millions)Financing Receivables, net: Customer receivables, gross $ 1,834 $ 2,535 $ 4,369 $ 2,096 $ 2,443 $ 4,539
Allowances for losses (169) (23) (192) (179) (23) (202)Customer receivables, net 1,665 2,512 4,177 1,917 2,420 4,337
Residual interest — 385 385 — 362 362Financing receivables, net $ 1,665 $ 2,897 $ 4,562 $ 1,917 $ 2,782 $ 4,699
Short-term $ 1,665 $ 1,548 $ 3,213 $ 1,917 $ 1,410 $ 3,327Long-term — 1,349 1,349 — 1,372 1,372
Financing receivables, net $ 1,665 $ 2,897 $ 4,562 $ 1,917 $ 2,782 $ 4,699
78

Table of ContentsDELL INC.
NOTES TO CONSOLIDATED FINANCIAL STATEMENTS (Continued)
The following table summarizes the changes in the allowance for financing receivable losses for the respective periods:
Fiscal Year Ended
February 1,
2013 February 3,
2012 January 28,
2011
Revolving Fixed- term Total Revolving Fixed- term Total Revolving Fixed- term Total
(in millions)
Allowance for financing receivable losses: Balance at beginning of period $ 179 $ 23 $ 202 $ 214 $ 27 $ 241 $ 224 $ 13 $ 237Incremental allowance due to VIEconsolidation — — — — — — — 16 16
Principal charge-offs (179) (18) (197) (204) (9) (213) (233) (18) (251)
Interest charge-offs (34) — (34) (38) — (38) (46) — (46)
Recoveries 59 4 63 64 4 68 27 — 27Provision charged to income statement 144 14 158 143 1 144 242 16 258
Balance at end of period $ 169 $ 23 $ 192 $ 179 $ 23 $ 202 $ 214 $ 27 $ 241
The following table summarizes the aging of Dell's customer financing receivables, gross, including accrued interest, as of February 1, 2013, and February 3,2012, segregated by class:
February 1, 2013 February 3, 2012
Current Past Due 1— 90 Days
Past Due >90 Days Total Current
Past Due 1— 90 Days
Past Due >90 Days Total
(in millions)Revolving — DPA $ 1,322 $ 163 $ 54 $ 1,539 $ 1,521 $ 195 $ 67 $ 1,783Revolving — DBC 264 25 6 295 272 33 8 313Fixed term — Consumerand Small Commercial 310 16 1 327 324 18 5 347Fixed-term — Medium andLarge Commercial 2,015 172 21 2,208 1,946 136 14 2,096
Total customerreceivables, gross $ 3,911 $ 376 $ 82 $ 4,369 $ 4,063 $ 382 $ 94 $ 4,539
DFS Acquisitions
In Fiscal 2011, Dell purchased a portfolio of revolving loan receivables for $430 million from CIT Group Inc. (“CIT”) that consisted of revolving Dellcustomer account balances. In Fiscal 2012, Dell entered into a definitive agreement to acquire CIT Vendor Finance's Dell-related financing assets portfolio andsales and servicing functions in Europe. The acquisition of these assets will enable global expansion of Dell's direct finance model. Subject to customaryclosing, regulatory, and other conditions, Dell expects to complete this transaction in Fiscal 2014.
Credit Quality
The following tables summarize customer receivables, gross, including accrued interest by credit quality indicator segregated by class, as of February 1,2013, and February 3, 2012. The categories shown in the tables below segregate customer receivables based on the relative degrees of credit risk. The creditquality categories cannot be compared between the different classes as loss experience in each class varies substantially. The credit quality indicators for DPArevolving accounts are primarily as of each quarter-end date, and all others are generally updated on a periodic basis.
For the DPA revolving receivables shown in the table below, Dell makes credit decisions based on propriety scorecards, which include the customer's credithistory, payment history, credit usage, and other credit agency-related elements. The higher
79
Table of ContentsDELL INC.
NOTES TO CONSOLIDATED FINANCIAL STATEMENTS (Continued)
quality category includes prime accounts generally of a higher credit quality that are comparable to U.S. customer FICO scores of 720 or above. The mid-category represents the mid-tier accounts that are comparable to U.S. FICO scores from 660 to 719. The lower category is generally sub-prime and representslower credit quality accounts that are comparable to FICO scores below 660.
February 1, 2013 February 3, 2012 Higher Mid Lower Total Higher Mid Lower Total
(in millions)Revolving — DPA $ 201 $ 435 $ 903 $ 1,539 $ 248 $ 492 $ 1,043 $ 1,783
For the receivables shown in the table below, an internal grading system is utilized that assigns a credit level score based on a number of considerations,including liquidity, operating performance, and industry outlook. The higher category includes receivables that are generally within Dell's top credit qualitylevels, which typically have the lowest loss experience. The middle category generally falls within the mid-tier credit levels, and the lower category generallyfalls within Dell's bottom credit levels, which experience higher loss rates. The grading criteria and classifications are different between the fixed-term andrevolving products as the loss performance varies between these product and customer sets. Therefore, the credit levels are not comparable between theconsumer and small commercial fixed-term class and the DBC revolving class.
February 1, 2013 February 3, 2012 Higher Mid Lower Total Higher Mid Lower Total
(in millions)Revolving — DBC $ 9 9 $ 88 $ 108 $ 295 $ 111 $ 98 $ 104 $ 313Fixed-term — Consumer andSmall Commercial (a) $ 90 $ 117 $ 120 $ 327 $ 97 $ 120 $ 130 $ 347____________________ (a) During the first quarter of Fiscal 2013, Dell re-defined its internal scoring categorization for its small commercial fixed-term customers. In connection with this change, Dell has re-categorized existing customers and has recast prior period credit quality categories for these customers to conform to the current year's classification. This change had no impact on Dell'sallowance for loss rates.
For the receivables in the table below, an internal grading system is also utilized that assigns a credit level score based on liquidity, operating performance, andindustry outlook. Dell's internal credit level scoring has been aggregated to their most comparable external commercial rating agency equivalents. Investmentgrade generally represents the highest credit quality accounts, non-investment grade represents middle quality accounts, and sub-standard represents the lowestquality accounts.
February 1, 2013 February 3, 2012 Investment Non-Investment Sub-Standard Total Investment Non-Investment Sub-Standard Total (in millions)Fixed-term — Medium andLarge Commercial $ 1,355 $ 582 $ 271 $ 2,208 $ 1,504 $ 363 $ 229 $ 2,096
Asset Securitizations and Sales
Dell transfers certain U.S. customer financing receivables to SPEs which meet the definition of a VIE and are consolidated into Dell's Consolidated FinancialStatements. These SPEs are bankruptcy remote legal entities with separate assets and liabilities. The purpose of the SPEs is to facilitate the funding ofcustomer receivables in the capital markets. These SPEs have entered into financing arrangements with multi-seller conduits that, in turn, issue asset-backeddebt securities in the capital markets. Dell's risk of loss related to securitized receivables is limited to the amount of Dell's right to receive collections for assetssecuritized exceeding the amount required to pay interest, principal, and other fees and expenses related to the asset-backed securities. Dell provides creditenhancement to the securitization in the form of over-collateralization. Customer receivables
80

Table of ContentsDELL INC.
NOTES TO CONSOLIDATED FINANCIAL STATEMENTS (Continued)
funded via securitization through SPEs were $2.0 billion, $2.3 billion, and $1.9 billion, during Fiscal 2013, Fiscal 2012, and Fiscal 2011, respectively.
The following table shows financing receivables held by the consolidated VIEs:
February 1,
2013 February 3,
2012 (in millions)
Financing receivables held by consolidated VIEs, net: Short-term, net $ 1,089 $ 1,096Long-term, net 386 429
Financing receivables held by consolidated VIEs, net $ 1,475 $ 1,525
Dell's securitization programs are generally effective for 12 months and are subject to an annual renewal process. These programs contain standard structuralfeatures related to the performance of the securitized receivables. The structural features include defined credit losses, delinquencies, average credit scores, andexcess collections above or below specified levels. In the event one or more of these criteria are not met and Dell is unable to restructure the program, no furtherfunding of receivables will be permitted and the timing of Dell's expected cash flows from over-collateralization will be delayed. At February 1, 2013, thesecriteria were met.
Dell sells selected fixed-term financing receivables to unrelated third parties on a periodic basis, primarily to manage certain concentrations of customer creditexposure. For the fiscal years ended February 1, 2013, February 3, 2012, and January 28, 2011, the amount of the receivables sold was $375 million, $221million, and $153 million, respectively.
Structured Financing Debt
The structured financing debt related to the fixed-term lease and loan, and revolving loan securitization programs was $1.3 billion as of both February 1, 2013and February 3, 2012. The debt is collateralized solely by the financing receivables in the programs. The debt has a variable interest rate and an averageduration of 12 to 36 months based on the terms of the underlying financing receivables. As of February 1, 2013, the total debt capacity related to thesecuritization programs was $1.5 billion. Dell's securitization programs are structured to operate near their debt capacity. See Note 5 of the Notes to theConsolidated Financial Statements for additional information regarding the structured financing debt.
Dell enters into interest rate swap agreements to effectively convert a portion of the structured financing debt from a floating rate to a fixed rate. The interest rateswaps qualify for hedge accounting treatment as cash flow hedges. See Note 6 of the Notes to the Consolidated Financial Statements for additionalinformation about interest rate swaps.
81

Table of ContentsDELL INC.
NOTES TO CONSOLIDATED FINANCIAL STATEMENTS (Continued)
NOTE 5 — BORROWINGS
The following table summarizes Dell's outstanding debt as of the dates indicated:
February 1,
2013 February 3,
2012 (in millions)
Long-Term Debt Senior Notes
$400 million issued on June 10, 2009, at 3.375% due June 2012 (“2012 Notes”) (a) $ — $ 400$600 million issued on April 17, 2008, at 4.70% due April 2013 (“2013A Notes”) (a)(b) 601 605$500 million issued on September 7, 2010, at 1.40% due September 2013 500 499$500 million issued on April 1, 2009, at 5.625% due April 2014 (b) 500 500$300 million issued on March 28, 2011, with a floating rate due April 2014 (“2014B Notes”) 300 300$400 million issued on March 28, 2011, at 2.10% due April 2014 400 400$700 million issued on September 7, 2010, at 2.30% due September 2015 (b) 702 701$400 million issued on March 28, 2011, at 3.10% due April 2016 (b) 402 401$500 million issued on April 17, 2008, at 5.65% due April 2018 (b) 502 501$600 million issued on June 10, 2009, at 5.875% due June 2019 (b) 604 602$400 million issued on March 28, 2011, at 4.625% due April 2021 398 398$400 million issued on April 17, 2008, at 6.50% due April 2038 400 400$300 million issued on September 7, 2010, at 5.40% due September 2040 300 300
Senior Debentures $300 million issued on April 3, 1998, at 7.10% due April 2028 ("Senior Debentures") (a) 379 384
Other Long-term structured financing debt 872 920Less: current portion of long-term debt (1,618) (924)
Total long-term debt 5,242 6,387Short-Term Debt
Commercial paper 1,807 1,500Short-term structured financing debt 416 440Current portion of long-term debt 1,618 924Other 2 3
Total short-term debt 3,843 2,867Total debt $ 9,085 $ 9,254
____________________ (a) Includes the impact of interest rate swap terminations.(b) Includes hedge accounting adjustments.
As of February 1, 2013, the total carrying value and estimated fair value of outstanding senior notes and debentures, including the current portion, wasapproximately $6.0 billion and $5.9 billion, respectively. This is compared to a carrying value and estimated fair value of $6.4 billion and $6.9 billion,respectively, as of February 3, 2012. The fair value of outstanding senior notes and debentures was determined based on observable market prices in a lessactive market and was categorized as Level 2 in the fair value hierarchy. The fair values of the structured financing debt, commercial paper, and other short-term debt approximate their carrying values. Interest on the senior notes and debentures is payable semiannually, except for the floating rate 2014B Noteswhich accrue interest that is payable quarterly. The carrying value of the Senior Debentures, the 2012 Notes and the 2013A Notes, includes an unamortizedamount related to the termination of interest rate swap agreements, which were previously designated as hedges of the debt. See Note 6 of the Notes to theConsolidated Financial Statements for additional information about interest rate swaps. The weighted average interest rate for the short-term structuredfinancing debt and other as of February 1, 2013, and February 3, 2012, was 1.00% and 0.98%, respectively.
82

Table of ContentsDELL INC.
NOTES TO CONSOLIDATED FINANCIAL STATEMENTS (Continued)
Structured Financing Debt — As of February 1, 2013, Dell had $1.3 billion outstanding in structured financing related debt, which was primarily related tothe fixed-term lease and loan, and revolving loan securitization programs. Of the $872 million outstanding in long-term structured financing debt, which isprimarily related to the fixed-term lease and loan programs, $517 million was classified as current as of February 1, 2013. See Note 4 and Note 6 of the Notesto the Consolidated Financial Statements for further discussion of the structured financing debt and the interest rate swap agreements that hedge a portion ofthat debt. Aggregate future maturities of long-term debt at face value were as follows as of February 1, 2013:
Maturities by Fiscal Year
2014 2015 2016 2017 2018 Thereafter Total
(in millions) Aggregate future maturities of long-term debtoutstanding $ 1,617 $ 1,465 $ 790 $ 400 $ — $ 2,500 $ 6,772
Commercial Paper — As of February 1, 2013, and February 3, 2012, there was $1.8 billion and $1.5 billion, respectively, outstanding under thecommercial paper program. The weighted average interest rate on outstanding commercial paper as of February 1, 2013, and February 3, 2012, was 0.38%and 0.23%, respectively. Dell has $3.0 billion in senior unsecured revolving credit facilities, primarily to support its $2.5 billion commercial paper program.Of these credit facilities, $1.0 billion will expire on April 2, 2013, and $2.0 billion will expire on April 15, 2015. There were no outstanding advances underthe revolving credit facilities as of February 1, 2013.
The indentures governing the Notes, the Senior Debentures, and the structured financing debt contain customary events of default, including failure to makerequired payments, failure to comply with certain agreements or covenants, and certain events of bankruptcy and insolvency. The indentures also containcovenants limiting Dell's ability to create certain liens; enter into sale-and-lease back transactions; and consolidate or merge with, or convey, transfer or leaseall or substantially all of its assets to, another person. The senior unsecured revolving credit facilities require compliance with conditions that must be satisfiedprior to any borrowing, as well as ongoing compliance with specified affirmative and negative covenants, including maintenance of a minimum interestcoverage ratio. Dell was in compliance with all financial covenants as of February 1, 2013.
83

Table of Contents
NOTE 6 — DERIVATIVE INSTRUMENTS AND HEDGING ACTIVITIES
Derivative Instruments
As part of its risk management strategy, Dell uses derivative instruments, primarily forward contracts and purchased options, to hedge certain foreigncurrency exposures and interest rate swaps to manage the exposure of its debt portfolio to interest rate risk. Dell's objective is to offset gains and losses resultingfrom these exposures with gains and losses on the derivative contracts used to hedge the exposures, thereby reducing volatility of earnings and protecting thefair values of assets and liabilities. Dell assesses hedge effectiveness both at the onset of the hedge and at regular intervals throughout the life of the derivativeand recognizes any ineffective portion of the hedge, as well as amounts not included in the assessment of effectiveness, in earnings as a component of interestand other, net. Hedge ineffectiveness and amounts not included in the assessment of effectiveness were not material for fair value or cash flow hedges duringFiscal 2013, Fiscal 2012, or Fiscal 2011.
Foreign Exchange Risk
Dell uses a combination of forward contracts and purchased options designated as cash flow hedges to protect against the foreign currency exchange rate risksinherent in its forecasted transactions denominated in currencies other than the U.S. dollar. The risk of loss associated with purchased options is limited topremium amounts paid for the option contracts. The risk of loss associated with forward contracts is equal to the exchange rate differential from the time thecontract is entered into until the time it is settled. The majority of these contracts typically expire in 12 months or less.
During the fiscal year ended February 1, 2013, Dell did not discontinue any cash flow hedges related to foreign exchange contracts that had a material impacton Dell's results of operations, as substantially all forecasted foreign currency transactions were realized in Dell's actual results.
In addition, Dell uses forward contracts and purchased options to hedge monetary assets and liabilities denominated in a foreign currency. These contractsgenerally expire in three months or less, are considered economic hedges and are not designated. The change in the fair value of these instruments represents anatural hedge as their gains and losses offset the changes in the underlying fair value of the monetary assets and liabilities due to movements in currencyexchange rates. Dell recognized gains for the change in fair value of these foreign currency forward contracts of $1 million, $17 million, and $59 millionduring Fiscal 2013, Fiscal 2012, and Fiscal 2011, respectively.
Interest Rate Risk
Dell uses interest rate swaps to hedge the variability in cash flows related to the interest rate payments on structured financing debt. The interest rate swapseconomically convert the variable rate on the structured financing debt to a fixed interest rate to match the underlying fixed rate being received on fixed termcustomer leases and loans. The duration of these contracts typically ranges from 30 to 42 months. Certain of these swaps are designated as cash flow hedges.
In addition, Dell may use forward-starting interest rate swaps and interest rate lock agreements to lock in fixed interest rates on its forecasted issuances of debt.The objective of these hedges is to offset the variability of future payments associated with the interest rate on debt instruments. As of February 1, 2013, Dellhad $600 million in aggregate notional amounts of forward-starting interest rate swaps outstanding. These hedges are designated as cash flow hedges. Dell didnot have any forward-starting interest rate swaps designated as cash flow hedges at February 3, 2012.Periodically, Dell also uses interest rate swaps designated as fair value hedges to modify the market risk exposures in connection with long-term debt to achieveprimarily LIBOR-based floating interest expense. As of February 1, 2013, and February 3, 2012, Dell had outstanding interest rate swaps that economicallyhedge a portion of its interest rate exposure on certain tranches of its long-term debt.
84
Table of Contents
Notional Amounts of Outstanding Derivative Instruments
The notional amounts of Dell's outstanding derivative instruments are as follows as of the dates indicated:
February 1, 2013 February 3, 2012 (in millions)
Foreign Exchange Contracts Designated as cash flow hedging instruments $ 2,847 $ 4,549Non-designated as hedging instruments 512 168
Total $ 3,359 $ 4,717
Interest Rate Contracts Designated as fair value hedging instruments $ 800 $ 650Designated as cash flow hedging instruments 1,320 751Non-designated as hedging instruments 127 132
Total $ 2,247 $ 1,533
Derivative Instruments Additional Information
The unrealized net gain or loss for interest rate swaps and foreign currency exchange contracts, recorded as a component of accumulated other comprehensiveloss in the Consolidated Statements of Financial Position, was a gain of $1 million and a loss of $40 million as of February 1, 2013 and February 3, 2012,respectively.
Dell has reviewed the existence and nature of credit-risk-related contingent features in derivative trading agreements with its counterparties. Certain agreementscontain clauses under which, if Dell's credit ratings were to fall below investment grade upon a change of control of Dell, counterparties would have the right toterminate those derivative contracts where Dell is in a net liability positi on. As of February 1, 2013, there had been no such triggering events.
Effect of Derivative Instruments on the Consolidated Statements of Financial Position and the Consolidated Statements of Income
Derivatives inCash Flow
Hedging Relationships
Gain (Loss)Recognized
in AccumulatedOCI, Netof Tax, on
Derivatives(Effective Portion)
Location of Gain (Loss)Reclassified
from AccumulatedOCI into Income(Effective Portion)
Gain (Loss)Reclassified
from AccumulatedOCI into Income(Effective Portion)
Location of Gain (Loss)Recognized in Income on
Derivative (Ineffective Portion) Gain (Loss) Recognized in
Income on Derivative(Ineffective Portion)
(in millions)
For the fiscal year ended February 1, 2013 Total net revenue $ (42)
Foreign exchange contracts $ (16) Total cost of net revenue (15) Interest rate contracts (2) Interest and other, net — Interest and other, net $ (2)
Total $ (18) $ (57) $ (2) For the fiscal year ended February 3, 2012 Total net revenue $ (188)
Foreign exchange contracts $ (122) Total cost of net revenue (3) Interest rate contracts 3 Interest and other, net — Interest and other, net $ 1
Total $ (119) $ (191) $ 1
85

Table of Contents
Fair Value of Derivative Instruments in the Consolidated Statements of Financial Position
Dell presents its foreign exchange derivative instruments on a net basis in the Consolidated Statements of Financial Position due to the right of offset by itsindividual counterparties under master netting arrangements. The fair value of those derivative instruments presented on a gross basis as of each date indicatedbelow is as follows:
February 1, 2013
Other Current
Assets Other Non-
Current Assets Other Current
Liabilities
Other Non-CurrentLiabilities
TotalFair Value
(in millions) Derivatives Designated as Hedging InstrumentsForeign exchange contracts in an asset position $ 86 $ — $ 9 $ — $ 9 5Foreign exchange contracts in a liability position (40) — (3) — (43)Interest rate contracts in an asset position — 12 — — 12Interest rate contracts in a liability position — — — (6) (6)
Net asset (liability) 46 12 6 (6) 58Derivatives not Designated as Hedging InstrumentsForeign exchange contracts in an asset position 118 — 16 — 134Foreign exchange contracts in a liability position (108) — (32) — (140)
Net asset (liability) 10 — (16) — (6)Total derivatives at fair value $ 5 6 $ 12 $ (10) $ (6) $ 52
February 3, 2012
Other Current
Assets (a) Other Non-
Current Assets Other Current
Liabilities
Other Non-CurrentLiabilities
TotalFair Value
(in millions) Derivatives Designated as Hedging InstrumentsForeign exchange contracts in an asset position $ 134 $ — $ 2 $ — $ 136Foreign exchange contracts in a liability position (69) — (7) — (76)Interest rate contracts in an asset position — 8 — — 8Interest rate contracts in a liability position — — — (3) (3)
Net asset (liability) 6 5 8 (5) (3) 6 5Derivatives not Designated as Hedging InstrumentsForeign exchange contracts in an asset position 199 — 2 — 201Foreign exchange contracts in a liability position (132) — (11) — (143)
Net asset (liability) 67 — (9) — 58Total derivatives at fair value $ 132 $ 8 $ (14) $ (3) $ 123
_____________________(a) Amounts as of February 3, 2012 have been revised to reflect adjustments between designated and not designated foreign exchange contracts.
86

Table of ContentsDELL INC.
NOTES TO CONSOLIDATED FINANCIAL STATEMENTS (Continued)
NOTE 7 — ACQUISITIONS
Fiscal 2013 Acquisitions
During Fiscal 2013, Dell acquired Quest Software Inc. ("Quest Software"), SonicWALL Inc. (“SonicWALL”), Wyse Technology, Inc. ("Wyse Technology"),AppAssure Software, Inc., Clerity Solutions, Inc., Make Technologies Inc., Gale Technologies, and Credant Technologies. The total purchase considerationfor all of these acquisitions was approximately $5.0 billion in cash for all of their outstanding shares. Dell completed its acquisition of Quest Software Inc.("Quest Software") on September 27, 2012 for a purchase price of approximately $2.5 billion, paid in cash. Quest Software is a global provider of ITmanagement software. Dell recorded approximately $1.7 billion in goodwill and $1.1 billion in intangible assets related to its acquisition of Quest Software.Of the other Fiscal 2013 acquisitions, SonicWALL and Wyse Technology, which were purchased during the second quarter of Fiscal 2013, were the largeracquisitions. SonicWALL is a global technology company that offers advanced network security and data protection software solutions, and WyseTechnology is a global provider of client computing solutions designed to extend desktop virtualization offerings.
All of the above acquisitions are being integrated into Dell's Commercial segments. See Note 15 of the Notes to the Consolidated Financial Statements foradditional information on Dell's operating segments.
The following table summarizes the fair value of the assets acquired and liabilities assumed by major class for all the acquisitions completed during Fiscal2013:
Estimated
Cost Weighted-Average
Useful Life (in millions) (in years)
Intangible Assets: Amortizable intangible assets:
Customer relationships $ 687 6.9Technology 1,293 5.6Non-compete agreements 5 4.4Trade names 77 6.6
Total amortizable intangible assets 2,062 6.1In-process research and development 108
Total intangible assets 2,170 Cash and investments 407 Accounts receivable 176 Goodwill 3,487 Deferred revenue (417) Deferred tax liability, net (571) Other liabilities and noncontrolling interest assumed, net of assets acquired (a) (213) Total $ 5,039 ____________________(a) In conjunction with Dell's acquisition of Quest Software, Dell acquired a controlling ownership interest in a privately-held company. The fair value of the noncontrolling interest
related to this investment was $21 million at the date of acquisition.
Dell's preliminary estimate for goodwill acquired during the fiscal year ended February 1, 2013, was $3.5 billion. This amount primarily represents synergiesassociated with combining the acquired companies with Dell to provide Dell's customers with a broader range of IT solutions. This goodwill is not deductiblefor tax purposes.
In conjunction with these acquisitions, Dell expects to incur approximately $290 million in compensation-related retention expenses that will be expensed over aperiod of up to five years. There was no contingent consideration related to these acquisitions.
87

Table of ContentsDELL INC.
NOTES TO CONSOLIDATED FINANCIAL STATEMENTS (Continued)
The results of operations for acquisitions completed during the fiscal year ended February 1, 2013, which primarily consisted of SonicWALL, WyseTechnology, and Quest Software, are included in Dell's results of operations from each respective acquisition date. For the fiscal year ended February 1, 2013,the results of all businesses acquired during Fiscal 2013 contributed $763 million to Dell's net revenue and reduced net income by $168 million. These resultsinclude the impacts of amortization of purchased intangible assets and acquisition-related expenses.
The following table provides unaudited pro forma results of operations for the fiscal year ended February 1, 2013, and February 3, 2012, as if Dell's Fiscal2013 acquisitions had been acquired at the beginning of the fiscal year ended February 3, 2012. The pro forma amounts presented below exclude $85 millionin merger-related fees that were reported in Quest Software's historical financial results. The pro forma results are adjusted for amortization of intangibleassets, fair value adjustments for deferred revenue, acquisition-related expenses, the elimination of sales between Dell and its acquirees, and the related taxeffects for these items, but do not include any anticipated cost synergies or other effects of the planned integration of the acquisitions. Accordingly, such proforma results are not necessarily indicative of the results that actually would have occurred had the acquisitions been completed on the dates indicated, nor arethey indicative of the future operating results of the combined company.
Fiscal Year Ended February 1, 2013 February 3, 2012 (in millions, except per share data, unaudited)Pro forma net sales $ 57,685 $ 63,387Pro forma net income $ 2,287 $ 3,195Pro forma earnings per share - basic $ 1.31 $ 1.74Pro forma earnings per share - diluted $ 1.30 $ 1.72
Fiscal 2012 Acquisitions
During Fiscal 2012, Dell completed several acquisitions, including acquisitions of Compellent Technologies, Inc. ("Compellent"), SecureWorks Inc.("SecureWorks"), DFS Canada, and Force10 Networks, Inc. ("Force10"). The total purchase consideration was approximately $2.7 billion in cash for all ofthe outstanding shares for all acquisitions completed during the period. Compellent is a provider of virtual storage solutions for enterprise and cloudcomputing environments, and SecureWorks is a global provider of information security services. Force10 is a global technology company that providesdatacenter networking solutions. Compellent, SecureWorks, and Force10 will be integrated into Dell's Commercial segments. DFS Canada enables expansionof Dell's direct finance model into Canada for all of Dell's segments. See Note 4 of the Notes to the Consolidated Financial Statements for further discussion onDell Financial Services.
Dell recorded $1.5 billion in goodwill related to acquisitions during the fiscal year ended February 3, 2012. This amount primarily represents synergiesassociated with combining these companies with Dell to provide Dell's customers with a broader range of IT solutions or, in the case of DFS Canada, to extendDell's financial services capabilities. This goodwill is not deductible for tax purposes. Dell also recorded $753 million in intangible assets related to theseacquisitions, which consist primarily of purchased technology and customer relationships. The intangible assets have weighted-average useful lives rangingfrom 3 to 11 years . In conjunction with these acquisitions, Dell will incur approximately $150 million in compensation-related expenses that will be expensedover a period of up to four years. There was no contingent consideration related to these acquisitions.
Dell has not presented pro forma results of operations for Fiscal 2012 acquisitions because these acquisitions are not material to Dell's consolidated results ofoperations, financial position, or cash flows on either an individual or an aggregate basis.
Fiscal 2011 Acquisitions
Dell completed five acquisitions during Fiscal 2011, consisting of Kace Networks, Inc. (“KACE”), Ocarina Networks Inc. (“Ocarina”), Scalent Systems Inc.(“Scalent”), Boomi, Inc. (“Boomi”), and InSite One, Inc. (“InSite”), for a total purchase consideration of approximately $413 million in cash. KACE is asystems management appliance company with solutions
88

Table of ContentsDELL INC.
NOTES TO CONSOLIDATED FINANCIAL STATEMENTS (Continued)
tailored to the requirements of mid-sized businesses. KACE was integrated primarily into Dell's SMB and Public segments. Ocarina is a provider of de-duplication solutions and content-aware compression across storage product lines. Scalent is a provider of scalable and efficient data center infrastructuresoftware. Boomi is a provider of on-demand integration technology. Ocarina, Scalent, and Boomi were integrated into Dell's Commercial segments. InSiteprovides cloud-based medical data archiving, storage, and disaster-recovery solutions to the health care industry. InSite was integrated into Dell's Publicsegment.
Dell recorded approximately $284 million in goodwill and $141 million in intangible assets related to these acquisitions. The goodwill related to theseacquisitions is not deductible for tax purposes. In conjunction with these acquisitions, Dell incurred $56 million in compensation-related expenses that wereexpensed over a period of one to three years. There was no contingent consideration related to these acquisitions.
Dell has not presented pro forma results of operations for the Fiscal 2011 acquisitions because these acquisitions are not material to Dell's consolidated resultsof operations, financial position, or cash flows on either an individual or an aggregate basis.
89

Table of ContentsDELL INC.
NOTES TO CONSOLIDATED FINANCIAL STATEMENTS (Continued)
NOTE 8 — GOODWILL AND INTANGIBLE ASSETS
Goodwill
Goodwill allocated to Dell's business segments as of February 1, 2013, and February 3, 2012, and changes in the carrying amount of goodwill for therespective periods, were as follows:
Fiscal Year Ended February 1, 2013
Large
Enterprise Public
Small andMediumBusiness Consumer Total
(in millions)Balance at beginning of period $ 2,222 $ 2,547 $ 759 $ 310 $ 5,838Goodwill acquired during the period 1,510 981 9 9 6 — 3,487Adjustments (9) (8) (4) — (21)
Balance at end of period $ 3,723 $ 3,520 $ 1,751 $ 310 $ 9,304
February 3, 2012
Large
Enterprise Public
Small andMediumBusiness Consumer Total
(in millions)Balance at beginning of period $ 1,424 $ 2,164 $ 476 $ 301 $ 4,365Goodwill acquired during the period 800 386 287 6 1,479Adjustments (2) (3) (4) 3 (6)
Balance at end of period $ 2,222 $ 2,547 $ 759 $ 310 $ 5,838
Goodwill is tested annually during the second fiscal quarter and whenever events or circumstances indicate an impairment may have occurred. Based on theresults of the annual impairment tests, performed during the second quarter of Fiscal 2013, no impairment of goodwill existed at August 3, 2012. Further, notriggering events have transpired since August 3, 2012, that would indicate a potential impairment of goodwill as of February 1, 2013. Dell did not have anyaccumulated goodwill impairment charges as of February 1, 2013.
Intangible Assets
Dell's intangible assets associated with completed acquisitions at February 1, 2013, and February 3, 2012, were as follows:
February 1, 2013 February 3, 2012
Gross AccumulatedAmortization Net Gross
AccumulatedAmortization Net
(in millions)Customer relationships $ 2,184 $ (721) $ 1,463 $ 1,569 $ (506) $ 1,063Technology 2,513 (827) 1,686 1,156 (490) 6 6 6Non-compete agreements 75 (54) 21 70 (42) 28Trade names 159 (59) 100 81 (41) 40
Amortizable intangible assets 4,931 (1,661) 3,270 2,876 (1,079) 1,797In-process research and development 78 — 78 34 — 34Indefinite lived intangible assets 26 — 26 26 — 26
Total intangible assets $ 5,035 $ (1,661) $ 3,374 $ 2,936 $ (1,079) $ 1,857
90

Table of ContentsDELL INC.
NOTES TO CONSOLIDATED FINANCIAL STATEMENTS (Continued)
Amortization expense related to finite-lived intangible assets was $613 million, $391 million, and $349 million in Fiscal 2013, Fiscal 2012, and Fiscal 2011,respectively. There were no material impairment charges related to intangible assets for the fiscal years ended February 1, 2013, and February 3, 2012.
Estimated future annual pre-tax amortization expense of finite-lived intangible assets as of February 1, 2013, over the next five fiscal years and thereafter is asfollows:
Fiscal Years (in millions)2014 $ 7702015 6822016 6132017 5152018 370Thereafter 320
Total $ 3,270
91

Table of ContentsDELL INC.
NOTES TO CONSOLIDATED FINANCIAL STATEMENTS (Continued)
NOTE 9 — WARRANTY AND DEFERRED EXTENDED WARRANTY REVENUE
Dell records liabilities for its standard limited warranties at the time of sale for the estimated costs that may be incurred. The liability for standard warrantiesis included in accrued and other current liabilities and other non-current liabilities on the Consolidated Statements of Financial Position. Revenue from the saleof extended warranties is recognized over the term of the contract or when the service is completed, and the costs associated with these contracts are recognizedas incurred. Deferred extended warranty revenue is included in deferred revenue on the Consolidated Statements of Financial Position. Changes in Dell'sliabilities for standard limited warranties and deferred services revenue related to extended warranties are presented in the following tables for the periodsindicated:
Fiscal Year Ended
February 1,
2013 February 3,
2012 January 28,
2011 (in millions)
Warranty liability: Warranty liability at beginning of period $ 888 $ 895 $ 912
Costs accrued for new warranty contracts and changes in estimates for pre-existingwarranties(a)(b) 992 1,025 1,046Service obligations honored (1,118) (1,032) (1,063)
Warranty liability at end of period $ 762 $ 888 $ 895Current portion $ 492 $ 572 $ 575Non-current portion 270 316 320
Warranty liability at end of period $ 762 $ 888 $ 895
Fiscal Year Ended
February 1,
2013 February 3,
2012 January 28,
2011 (in millions)
Deferred extended warranty revenue: Deferred extended warranty revenue at beginning of period $ 7,002 $ 6,416 $ 5,910
Revenue deferred for new extended warranties (b) 4,130 4,301 3,877Revenue recognized (4,029) (3,715) (3,371)
Deferred extended warranty revenue at end of period $ 7,103 $ 7,002 $ 6,416Current portion $ 3,400 $ 3,265 $ 2,959Non-current portion 3,703 3,737 3,457
Deferred extended warranty revenue at end of period $ 7,103 $ 7,002 $ 6,416____________________(a) Changes in cost estimates related to pre-existing warranties are aggregated with accruals for new standard warranty contracts. Dell's warranty liability process does not differentiate
between estimates made for pre-existing warranties and new warranty obligations.(b) Includes the impact of foreign currency exchange rate fluctuations.
92

Table of ContentsDELL INC.
NOTES TO CONSOLIDATED FINANCIAL STATEMENTS (Continued)
NOTE 10 — COMMITMENTS AND CONTINGENCIES
Lease Commitments — Dell leases property and equipment, manufacturing facilities, and office space under non-cancelable leases. Certain of these leasesobligate Dell to pay taxes, maintenance, and repair costs. At February 1, 2013, future minimum lease payments under these non-cancelable leases are asfollows: $137 million in Fiscal 2014; $132 million in Fiscal 2015; $106 million in Fiscal 2016; $86 million in Fiscal 2017; $53 million in Fiscal 2018;and $99 million thereafter.
Rent expense under all leases totaled $137 million, $107 million, and $87 million for Fiscal 2013, Fiscal 2012, and Fiscal 2011, respectively.
Purchase Obligations — Dell has contractual obligations to purchase goods or services, which specify significant terms, including fixed or minimumquantities to be purchased; fixed, minimum, or variable price provisions; and the approximate timing of the transaction. As of February 1, 2013, Dell had$399 million, $100 million, and $16 million in purchase obligations for Fiscal 2014, Fiscal 2015, and Fiscal 2016 and thereafter, respectively.
Legal Matters — Dell is involved in various claims, suits, assessments, investigations, and legal proceedings that arise from time to time in the ordinarycourse of its business, including those identified below, consisting of matters involving consumer, antitrust, tax, intellectual property, and other issues on aglobal basis. Dell accrues a liability when it believes that it is both probable that a liability has been incurred and that it can reasonably estimate the amount ofthe loss. Dell reviews these accruals at least quarterly and adjusts them to reflect ongoing negotiations, settlements, rulings, advice of legal counsel, and otherrelevant information. To the extent new information is obtained and Dell's views on the probable outcomes of claims, suits, assessments, investigations, orlegal proceedings change, changes in Dell's accrued liabilities would be recorded in the period in which such determination is made. For some matters, theamount of liability is not probable or the amount cannot be reasonably estimated and therefore accruals have not been made. The following is a discussion ofDell's significant legal matters and other proceedings:
Copyright Levies - Dell's obligation to collect and remit copyright levies in certain European Union (“EU”) countries may be affected by theresolution of legal proceedings pending in Germany against various companies, including Dell's German subsidiary, and elsewhere in the EU againstother companies in Dell's industry. The plaintiffs in those proceedings, some of which are described below, generally seek to impose or modify thelevies with respect to sales of such equipment as multifunction devices, phones, personal computers, and printers, alleging that such productsenable the copying of copyrighted materials. Some of the proceedings also challenge whether the levy schemes in those countries comply with EU law.Certain EU member countries that do not yet impose levies on digital devices are expected to implement legislation to enable them to extend existinglevy schemes, while some other EU member countries are expected to limit the scope of levy schemes and their applicability in the digital hardwareenvironment. Dell, other companies, and various industry associations have opposed the extension of levies to the digital environment and haveadvocated alternative models of compensation to rights holders. Dell continues to collect levies in certain EU countries where it has determined thatbased on local laws it is probable that Dell has a payment obligation. The amount of levies is generally based on the number of products sold and theper-product amounts of the levies, which vary. In all other matters, Dell does not believe there is a probable and estimable claim. Accordingly, Dellhas not accrued any liability nor collected any levies.
On December 29, 2005, Zentralstelle Für private Überspielungrechte (“ZPÜ”), a joint association of various German collecting societies, institutedarbitration proceedings against Dell's German subsidiary before the Board of Arbitration at the German Patent and Trademark Office in Munich,and subsequently filed a lawsuit in the German Regional Court in Munich on February 21, 2008, seeking levies to be paid on each personalcomputer sold by Dell in Germany through the end of calendar year 2007. On December 23, 2009, ZPÜ and the German industry association,BCH, reached a settlement regarding audio-video copyright levy litigation (with levies ranging from €3.15 to €13.65 per unit). Dell joined thissettlement on February 23, 2010, and has paid the amounts due under the settlement. However, because the settlement agreement expired on December31, 2010, the amount of levies payable after calendar year 2010, as well as Dell's ability to recover such amounts through increased prices, remainsuncertain. German courts are also considering a lawsuit originally filed in July 2004 by VG Wort, a German collecting society representing certaincopyright holders, against Hewlett-Packard Company in the Stuttgart Civil Court seeking levies on printers, and a lawsuit originally filed inSeptember 2003 by the same plaintiff against Fujitsu Siemens Computer GmbH in Munich Civil Court in Munich, Germany seeking levies onpersonal computers. In each case, the civil and appellate courts held that the subject classes of equipment were subject to levies. In July 2011, theGerman Federal Supreme Court, to which the lower court holdings have been appealed, referred each case to the Court of Justice of the EuropeanUnion,
93

Table of ContentsDELL INC.
NOTES TO CONSOLIDATED FINANCIAL STATEMENTS (Continued)
submitting a number of legal questions on the interpretation of the European Copyright Directive which the German Federal Supreme Court deemsnecessary for its decision. Dell has not accrued any liability in either matter, as Dell does not believe there is a probable and estimable claim.
Proceedings seeking to impose or modify copyright levies for sales of digital devices also have been instituted in courts in Spain and in other EUmember states. Even in countries where Dell is not a party to such proceedings, decisions in those cases could impact Dell's business and the amountof copyright levies Dell may be required to collect.
The ultimate resolution of these proceedings and the associated financial impact to Dell, if any, including the number of units potentially affected, theamount of levies imposed, and the ability of Dell to recover such amounts, remain uncertain at this time. Should the courts determine there is liabilityfor previous units shipped beyond the amount of levies Dell has collected or accrued, Dell would be liable for such incremental amounts. Recovery ofany such amounts from others by Dell would be possible only on future collections related to future shipments.
Convolve Inc. v Dell Inc. - Convolve, Inc. sued Dell, Western Digital Corporation (“Western Digital”), Hitachi Global Storage Technologies, Inc.,and Hitachi Ltd. (collectively “Hitachi”) on June 18, 2008 in the U.S. District Court for the Eastern District of Texas, Marshall Division, allegingthat the defendants infringed United States Patent No. 4,916,635 (entitled “Shaping Command Inputs to Minimize Unwanted Dynamics”) andUnited States Patent No. 6,314,473 (entitled “System for Removing Selected Unwanted Frequencies in Accordance with Altered Settings in a UserInterface of a Data Storage Device”). Western Digital and Hitachi are hard drive suppliers of Dell. The plaintiff sought damages for each product withan allegedly infringing hard drive sold by Dell, plus exemplary damages for allegedly willful infringement. On July 26, 2011, a jury found that thepatents had been infringed and awarded the plaintiff an amount of damages that is not material to Dell. The jury decision is subject to final approvaland entry by the judge.
Other Litigation - The various legal proceedings in which Dell is involved include commercial litigation and a variety of patent suits. In some ofthese cases, Dell is the sole defendant. More often, particularly in the patent suits, Dell is one of a number of defendants in the electronics andtechnology industries. Dell is actively defending a number of patent infringement suits, and several pending claims are in various stages ofevaluation. While the number of patent cases has grown over time, Dell does not currently anticipate that any of these matters will have a materialadverse effect on Dell's business, financial condition, results of operations, or cash flows.
As of February 1, 2013, Dell does not believe there is a reasonable possibility that a material loss exceeding the amounts already accrued for these or otherproceedings or matters has been incurred. However, since the ultimate resolution of any such proceedings and matters is inherently unpredictable, Dell'sbusiness, financial condition, results of operations, or cash flows could be materially affected in any particular period by unfavorable outcomes in one ormore of these proceedings or matters. Whether the outcome of any claim, suit, assessment, investigation, or legal proceeding, individually or collectively,could have a material adverse effect on Dell's business, financial condition, results of operations, or cash flows will depend on a number of variables,including the nature, timing, and amount of any associated expenses, amounts paid in settlement, damages, or other remedies or consequences.
Indemnifications — In the ordinary course of business, Dell enters into contractual arrangements under which Dell may agree to indemnify the third party tosuch arrangements from any losses incurred relating to the services they perform on behalf of Dell or for losses arising from certain events as defined withinthe particular contract, for example, litigation or claims relating to past performance. Such indemnification obligations may not be subject to maximum lossclauses. Historically, payments related to these indemnifications have been immaterial.
Certain Concentrations — Dell's counterparties to its financial instruments consist of a number of major financial institutions with credit ratings of AA andA by major credit rating agencies. In addition to limiting the amount of agreements and contracts it enters into with any one party, Dell monitors its positionswith, and the credit quality of the counterparties to, these financial instruments. Dell does not anticipate nonperformance by any of the counterparties.
Dell's investments in debt securities are in high quality financial institutions and companies. As part of its cash and risk management processes, Dellperforms periodic evaluations of the credit standing of the institutions in accordance with its investment policy. Dell's investments in debt securities havestated maturities of up to three years. Management believes that no significant concentration of credit risk for investments exists for Dell.
94

Table of ContentsDELL INC.
NOTES TO CONSOLIDATED FINANCIAL STATEMENTS (Continued)
As of February 1, 2013, Dell did not have significant concentrations of cash and cash equivalent deposits with its financial institutions.
Dell markets and sells its products and services to large corporate clients, governments, and health care and education accounts, as well as to small andmedium-sized businesses and individuals. No single customer accounted for more than 10% of Dell's consolidated net revenue during Fiscal 2013, Fiscal2012, or Fiscal 2011.
Dell purchases a number of components from single or limited sources. In some cases, alternative sources of supply are not available. In other cases, Dell mayestablish a working relationship with a single source or a limited number of sources if Dell believes it is advantageous to do so based on performance, quality,support, delivery, capacity, or price considerations.
Dell also sells components to certain contract manufacturers who assemble final products for Dell. Dell does not recognize the sale of these components in netsales and does not recognize the related profits until the final products are sold by Dell to end users. Profits from the sale of these parts are recognized as areduction of cost of sales at the time of sale. Dell's gross non-trade receivables as of February 1, 2013, and February 3, 2012, were $2.9 billion and $3.0billion, respectively, and four contract manufacturers account for the majority of these receivables. Dell has net settlement agreements with the majority ofthese contract manufacturers that allow Dell to offset the accounts payable to the contract manufacturers from the amounts receivable from them. As ofFebruary 1, 2013, and February 3, 2012, $2.5 billion and $2.9 billion, respectively, of these receivables met the criteria for net recognition and were offsetagainst the corresponding accounts payable balances for these contract manufacturers in the accompanying Consolidated Statements of Financial Position.
9 5
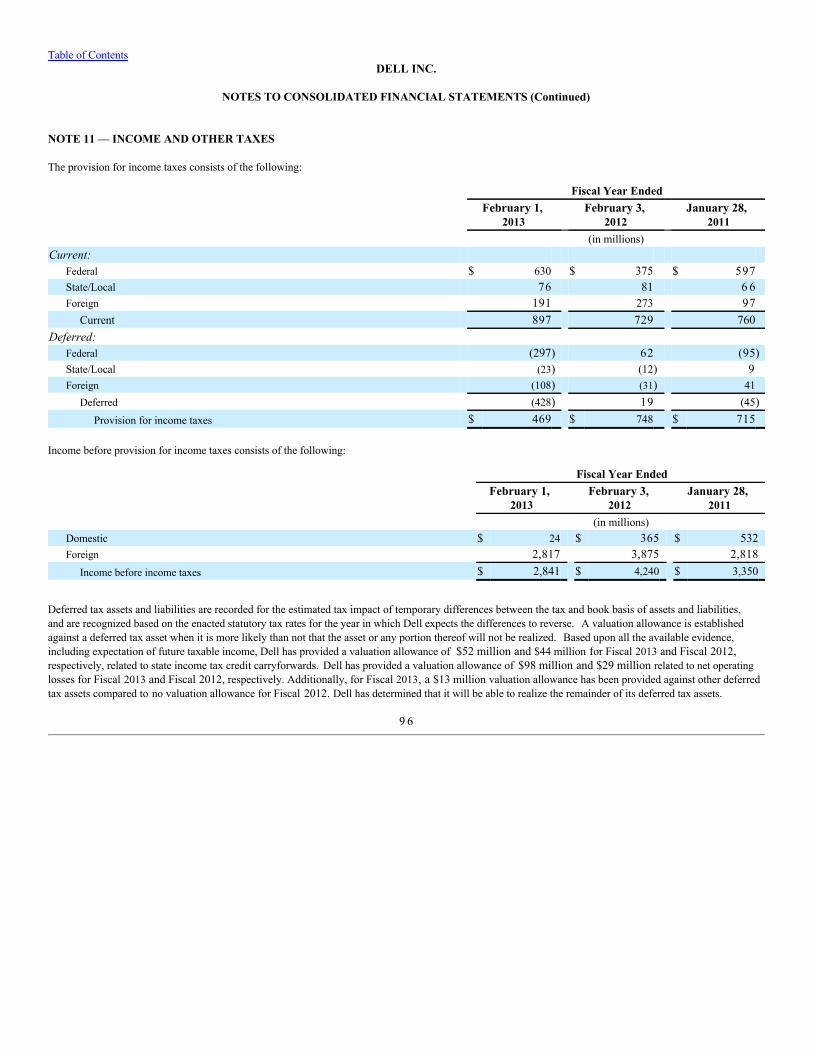
Table of ContentsDELL INC.
NOTES TO CONSOLIDATED FINANCIAL STATEMENTS (Continued)
NOTE 11 — INCOME AND OTHER TAXES
The provision for income taxes consists of the following:
Fiscal Year Ended
February 1,
2013 February 3,
2012 January 28,
2011 (in millions)
Current: Federal $ 630 $ 375 $ 597State/Local 76 81 6 6Foreign 191 273 97
Current 897 729 760Deferred:
Federal (297) 62 (95)State/Local (23) (12) 9Foreign (108) (31) 41
Deferred (428) 19 (45)Provision for income taxes $ 469 $ 748 $ 715
Income before provision for income taxes consists of the following:
Fiscal Year Ended
February 1,
2013 February 3,
2012 January 28,
2011 (in millions)
Domestic $ 24 $ 365 $ 532Foreign 2,817 3,875 2,818
Income before income taxes $ 2,841 $ 4,240 $ 3,350
Deferred tax assets and liabilities are recorded for the estimated tax impact of temporary differences between the tax and book basis of assets and liabilities,and are recognized based on the enacted statutory tax rates for the year in which Dell expects the differences to reverse. A valuation allowance is establishedagainst a deferred tax asset when it is more likely than not that the asset or any portion thereof will not be realized. Based upon all the available evidence,including expectation of future taxable income, Dell has provided a valuation allowance of $52 million and $44 million for Fiscal 2013 and Fiscal 2012,respectively, related to state income tax credit carryforwards. Dell has provided a valuation allowance of $98 million and $29 million related to net operatinglosses for Fiscal 2013 and Fiscal 2012, respectively. Additionally, for Fiscal 2013, a $13 million valuation allowance has been provided against other deferredtax assets compared to no valuation allowance for Fiscal 2012. Dell has determined that it will be able to realize the remainder of its deferred tax assets.
9 6

Table of ContentsDELL INC.
NOTES TO CONSOLIDATED FINANCIAL STATEMENTS (Continued)
The components of Dell's net deferred tax assets are as follows:
February 1,
2013 February 3,
2012 (in millions)
Deferred tax assets: Deferred revenue $ 716 $ 486Warranty provisions 414 226Provisions for product returns and doubtful accounts 94 85Credit carryforwards 9 5 61Loss carryforwards 339 271Stock-based and deferred compensation 189 183Operating and compensation related accruals 9 9 140Capitalized intangible assets 52 51Other 6 5 97
Deferred tax assets 2,063 1,600Valuation allowance (163) (73)
Deferred tax assets, net of valuation allowance 1,900 1,527Deferred tax liabilities:
Leasing and financing (258) (220)Property and equipment (215) (136)Acquired intangibles (1,091) (667)Other (23) (59)
Deferred tax liabilities (1,587) (1,082)Net deferred tax assets $ 313 $ 445
Current portion $ 850 $ 682Non-current portion (537) (237)
Net deferred tax assets $ 313 $ 445
The current portion of net deferred tax assets is included in other current assets and other current liabilities in the Consolidated Statements of FinancialPosition as of February 1, 2013, and February 3, 2012. The non-current portion of net deferred tax assets is included in other non-current assets and othernon-current liabilities in the Consolidated Statements of Financial Position as of February 1, 2013, and February 3, 2012, respectively.
During Fiscal 2013 and Fiscal 2012, Dell recorded $86 million and $124 million, respectively, of deferred tax assets related to net operating loss and creditcarryforwards acquired during the year, all of which was offset against goodwill. During Fiscal 2013 and Fiscal 2012, Dell recorded $5 million and $10million, respectively, to additional paid in capital related to the utilization of acquired net operating losses as a result of employee stock option activity. Theseamounts are reflected in the net tax shortfall from employee stock plans on the Consolidated Statements of Stockholders' Equity. Utilization of the acquiredcarryforwards is subject to limitations due to ownership changes that may delay the utilization of a portion of the acquired carryforwards. No additionalvaluation allowances have been placed on the acquired net operating loss and credit carryforwards. The carryforwards expire beginning in Fiscal 2014.
Deferred taxes have not been recorded on the excess book basis in the shares of certain foreign subsidiaries because these basis differences are not expected toreverse in the foreseeable future and are expected to be permanent in duration. The basis differences in the amount of approximately $19.0 billion aroseprimarily from undistributed book earnings, which Dell intends to reinvest indefinitely. The basis differences could be reversed through a sale of thesubsidiaries or the receipt of dividends from the subsidiaries, as well as various other events. Net of available foreign tax credits, residual income tax ofapproximately $6.2 billion would be due upon reversal of this excess book basis as of February 1, 2013.
A portion of Dell's operations is subject to a reduced tax rate or is free of tax under various tax holidays. Dell's significant tax holidays expire in whole or inpart during Fiscal 2016 through Fiscal 2022. Many of these tax holidays and reduced tax rates may be extended when certain conditions are met or may beterminated early if certain conditions are not met. The income tax
97

Table of ContentsDELL INC.
NOTES TO CONSOLIDATED FINANCIAL STATEMENTS (Continued)
benefits attributable to the tax status of these subsidiaries were estimated to be approximately $410 million ($.23 per share) in Fiscal 2013, $474 million ($.26per share) in Fiscal 2012, and $321 million ($.17 per share) in Fiscal 2011.
The effective tax rate differed from the statutory U.S. federal income tax rate as follows:
Fiscal Year Ended
February 1,
2013 February 3,
2012 January 28,
2011U.S. federal statutory rate 35.0 % 35.0 % 35.0 %Foreign income taxed at different rates (16.1) (18.7) (14.7)State income taxes, net of federal tax benefit 0.9 0.8 1.4Vendor and other settlements (4.3) (0.5) 1.0Other 1.0 1.0 (1.4)
Total 16.5 % 17.6 % 21.3 %
A reconciliation of the beginning and ending amount of unrecognized tax benefits is as follows:
Total (in millions)
Balance at January 29, 2010 $ 1,793Increases related to tax positions of the current year 262Increases related to tax positions of prior years 22Reductions for tax positions of prior years (41)Lapse of statute of limitations (32)Audit settlements (21)
Balance at January 28, 2011 1,983Increases related to tax positions of the current year 260Increases related to tax positions of prior years 30Reductions for tax positions of prior years (43)Lapse of statute of limitations (32)Audit settlements (4)
Balance at February 3, 2012 2,194Increases related to tax positions of the current year 219Increases related to tax positions of prior years 107Reductions for tax positions of prior years (44)Lapse of statute of limitations (19)Audit settlements (11)
Balance at February 1, 2013 $ 2,446
Dell recorded net unrecognized tax benefits of $2.9 billion and $2.6 billion, which are included in other non-current liabilities in its Consolidated Statementsof Financial Position, as of February 1, 2013, and February 3, 2012, respectively. The unrecognized tax benefits in the table above do not include accruedinterest and penalties. Dell had accrued interest and penalties of $767 million, $664 million, and $552 million as of February 1, 2013, February 3, 2012,and January 28, 2011, respectively. These interest and penalties are offset by tax benefits from transfer pricing, interest deductions, and state income tax,which are also not included in the table above. These benefits were $305 million, $295 million, and $242 million as of February 1, 2013, February 3, 2012,and January 28, 2011, respectively. Net unrecognized tax benefits, if recognized, would favorably affect Dell's effective tax rate. Dell does not anticipate asignificant change to the total amount of unrecognized income tax benefits within the next 12 months.
Interest and penalties related to income tax liabilities are included in income tax expense. Dell recorded $104 million, $112 million, and $45 million related tointerest and penalties, which were included in income tax expense for Fiscal 2013, Fiscal 2012, and Fiscal 2011, respectively.
98

Table of ContentsDELL INC.
NOTES TO CONSOLIDATED FINANCIAL STATEMENTS (Continued)
Dell is currently under income tax audits in various jurisdictions, including the United States. The tax periods open to examination by the major taxingjurisdictions to which Dell is subject include Fiscal Years 1999 through 2011. As a result of these audits, Dell maintains ongoing discussions andnegotiations relating to tax matters with the taxing authorities in these various jurisdictions. Dell believes that it has provided adequate reserves related to allmatters contained in tax periods open to examination.
Dell's U.S. federal income tax returns for Fiscal Years 2007 through 2009 are currently under examination by the Internal Revenue Service (“IRS”). The IRSissued a Revenue Agent's Report for Fiscal Years 2004 through 2006 proposing certain assessments prim arily related to transfer pricing matters. Dell disagreeswith certain of the proposed assessments and has contested them through the IRS administrative appeals procedures. The IRS has remanded the audit for taxyears 2004 through 2006 back to examination for further review. Should Dell experience an unfavorable outcome in the IRS matter, such an outcome couldhave a material impact on its results of operations, financial position, and cash flows.
Dell takes certain non-income tax positions in the jurisdictions in which it operates and has received certain non-income tax assessments from variousjurisdictions. Dell believes that a material loss in these matters is not probable and it is not reasonably possible that a material loss exceeding amounts alreadyaccrued has been incurred. Dell believes its positions in these non-income tax litigation matters are supportable, that a liability is not probable, and that it willultimately prevail. In the normal course of business, Dell's positions and conclusions related to its non-income taxes could be challenged and assessments maybe made. To the extent new information is obtained and Dell's views on its positions, probable outcomes of assessments, or litigation change, changes inestimates to Dell's accrued liabilities would be recorded in the period in which such determination is made.
9 9

Table of ContentsDELL INC.
NOTES TO CONSOLIDATED FINANCIAL STATEMENTS (Continued)
NOTE 12 — EARNINGS PER SHARE
Basic earnings per share is based on the weighted-average effect of all common shares issued and outstanding and is calculated by dividing net income by theweighted-average shares outstanding during the period. Diluted earnings per share is calculated by dividing net income by the weighted-average number ofcommon shares used in the basic earnings per share calculation plus the number of common shares that would be issued assuming exercise or conversion ofall potentially dilutive common shares outstanding. Dell excludes equity instruments from the calculation of diluted earnings per share if the effect of includingsuch instruments is anti-dilutive. Accordingly, certain stock-based incentive awards have been excluded from the calculation of diluted earnings per sharetotaling 121 million, 142 million, and 179 million shares for Fiscal 2013, Fiscal 2012, and Fiscal 2011, respectively.
The following table sets forth the computation of basic and diluted earnings per share for each of the past three fiscal years:
Fiscal Year Ended
February 1,
2013 February 3,
2012 January 28,
2011 (in millions, except per share amounts)
Numerator: Net income $ 2,372 $ 3,492 $ 2,635
Denominator: Weighted-average shares outstanding:
Basic 1,745 1,838 1,944Effect of dilutive options, restricted stock units, restricted stock, and other 10 15 11Diluted 1,755 1,853 1,955
Earnings per share: Basic $ 1.36 $ 1.90 $ 1.36Diluted $ 1.35 $ 1.88 $ 1.35
NOTE 13 — CAPITALIZATION
Preferred Stock
Authorized Shares — Dell has the authority to issue 5 million shares of preferred stock, par value $.01 per share. At February 1, 2013, and February 3,2012, no shares of preferred stock were issued or outstanding.
Common Stock
Authorized Shares — At February 1, 2013, Dell was authorized to issue 7 billion shares of common stock, par value $.01 per share.
Share Repurchase Program — Dell has a share repurchase program that authorizes it to purchase shares of common stock in order to increase shareholdervalue and manage dilution resulting from shares issued under Dell's equity compensation plans. However, Dell does not currently have a policy that requiresthe repurchase of common stock in conjunction with stock-based payment arrangements. During Fiscal 2013, Dell repurchased 46 million shares of commonstock for $700 million. At February 1, 2013, Dell's remaining authorized amount for share repurchases was $5.3 billion.
100

Table of ContentsDELL INC.
NOTES TO CONSOLIDATED FINANCIAL STATEMENTS (Continued)
NOTE 14 — STOCK-BASED COMPENSATION AND BENEFIT PLANS
Stock-based Compensation
Description of the Plans
Employee Stock Plans — Dell is currently issuing stock awards under the Dell Inc. 2012 Long-Term Incentive Plan (the “2012 Incentive Plan”), which wasapproved by stockholders at the annual meeting on July 13, 2012. Previous plans, including the Amended and Restated 2002 Long-Term Incentive Plan, havebeen terminated, except for administration of awards previously granted under those plans that remain outstanding. In Fiscal 2013 and Fiscal 2012, inconnection with Dell's business acquisitions, Dell assumed some stock incentive plans of its acquired companies. No future grants will be made under theassumed plans. The 2012 Incentive Plan, all previous plans, and the assumed plans are all collectively referred to as the “Stock Plans.” The 2012 IncentivePlan and all previous plans are collectively referred to as "Dell's Incentive Plans."
The 2012 Incentive Plan provides for the grant of stock-based incentive awards to Dell's employees and non-employee directors. Equity awards issued underthe 2012 Incentive Plan can include stock options, stock appreciation rights, restricted stock units, unrestricted stock, performance based restricted stockunits, or other equity awards. In connection with Dell's dividend policy, which was adopted in Fiscal 2013, all restricted stock units and performance basedrestricted stock units granted under Dell's Incentive Plans are entitled to dividend equivalent rights ("DERs"). DERs have the same dividend value per share asholders of common stock and are subject to the same terms and conditions as the corresponding unvested award. DERs are accumulated and paid when theunderlying shares vest.
There were approximately 98 million, 342 million, and 344 million shares of Dell's common stock available for future grants under the Stock Plans as ofFebruary 1, 2013, February 3, 2012, and January 28, 2011, respectively. The above decrease is due to approval of the 2012 Incentive Plan, under whichfewer shares of common stock are available for issuance. No future grants will be made under previous plans that have been terminated. To satisfy stockoption exercises and vested restricted stock awards, Dell has a policy of issuing new shares rather than repurchasing shares on the open market.
Stock Option Agreements — Stock options granted under Dell's Incentive Plans typically vest pro-rata at each option anniversary date ove r a three to five yearperiod. These options, which are granted with option exercise prices equal to the fair market value of Dell's common stock on the date of grant, generally expireup to ten years from the date of grant. In connection with business acquisitions, during Fiscal 2013 and Fiscal 2012, Dell converted or assumed stock optionsgranted under the stock incentive plans of acquired companies, which are collectively referred to as the "assumed options." These assumed options vest over aperiod of up to six years and generally expire within ten years from the date of grant. Compensation expense for all stock options is recognized on a straight-linebasis over the requisite service period.
Restricted Stock Awards — Awards of restricted stock may be either grants of restricted stock, restricted stock units, or performance-based restricted stockunits that are issued at no cost to the recipient. For restricted stock units, legal ownership of the shares is not transferred to the employee until the units vest,which is generally over a three year period. The cost of these awards is determined using the fair market value of Dell's common stock on the date of the grant.Dell also grants performance-based restricted stock units as a long-term incentive in which an award recipient receives shares contingent upon Dell achievingperformance objectives and the employee's continuing employment through the vesting period, which is generally over a three year period. Compensation costsrecorded in connection with these performance-based restricted stock units are based on Dell's best estimate of the number of shares that will eventually beissued upon achievement of the specified performance objectives and when it becomes probable that such performance objectives will be achieved.
Compensation costs for restricted stock awards with a service condition is recognized on a straight-line basis over the requisite service period. Compensationcosts for performance-based restricted stock units is recognized on an accelerated multiple-award approach based on the most probable outcome of theperformance condition.
101

Table of ContentsDELL INC.
NOTES TO CONSOLIDATED FINANCIAL STATEMENTS (Continued)
Stock Option Activity
The following table summarizes stock option activity for the Stock Plans during Fiscal 2013, Fiscal 2012, and Fiscal 2011:
Numberof
Options
Weighted-AverageExercise
Price
Weighted-Average
RemainingContractual
Term
AggregateIntrinsicValue
(in millions) (per share) (in years) (in millions)Options outstanding — January 29, 2010 205 $ 30.00
Granted (a) 17 14.82 Exercised (1) 9.18 Forfeited (2) 13.85 Cancelled/expired (58) 36.44
Options outstanding — January 28, 2011 161 26.49 Granted and assumed through acquisitions 28 13.79 Exercised (4) 9.38 Forfeited (5) 13.35 Cancelled/expired (37) 24.85
Options outstanding — February 3, 2012 143 25.37 Granted and assumed through acquisitions 23 7.18 Exercised (6) 9.40 Forfeited (5) 13.63 Cancelled/expired (37) 26.96
Options outstanding — February 1, 2013 (b) 118 22.51 4.7 $ 175Vested and expected to vest (net of estimated forfeitures) — February 1,2013 (b) 113 $ 23.12 4.5 $ 146Exercisable — February 1, 2013 (b) 80 $ 28.16 3.1 $ 25____________________(a) In Fiscal 2011, Dell did not convert or assume any options in connection with business acquisitions.(b) For options vested and expected to vest, options exercisable, and options outstanding, the aggregate intrinsic value in the table above represents the total pre-tax intrinsic value (the
difference between Dell's closing stock price on February 1, 2013 and the exercise price multiplied by the number of in-the-money options) that would have been received by theoption holders had the holders exercised their options on February 1, 2013. The intrinsic value changes based on changes in the fair value of Dell's common stock.
In connection with Fiscal 2013 and Fiscal 2012 acquisitions, Dell assumed approximately 21 million and 6 million stock options, respectively, with aweighted-average exercise price per share of $6.47 and $7.38, respectively.
102

Table of ContentsDELL INC.
NOTES TO CONSOLIDATED FINANCIAL STATEMENTS (Continued)
Information about options outstanding and exercisable at February 1, 2013 is as follows:
Options Outstanding Options Exercisable
Range of Exercise Prices Number
Outstanding
Weighted-AverageExercise Price per
Share
Weighted-AverageRemaining
Contractual Life Number
Exercisable
Weighted-AverageExercise Price Per
Share (in millions) (in years) (in millions) $ 0 - $9.99 24 $ 6.59 9.6 3 $ 6.78$10.00 - $19.99 35 15.52 7.5 18 15.80$20.00 - $29.99 17 25.22 2.4 17 25.22$30.00 - $39.99 27 34.29 1.2 27 34.29$40 and over 15 40.22 2.1 15 40.22
Total 118 $ 22.51 4.7 80 $ 28.16
Other information pertaining to stock options for the Stock Plans is as follows:
Fiscal Year Ended
February 1,
2013 February 3,
2012 January 28,
2011 (in millions, except per option data)
Total fair value of options vested $ 83 $ 5 6 $ 13Total intrinsic value of options exercised(a) $ 33 $ 27 $ 7____________________(a) The total intrinsic value of options exercised represents the total pre-tax intrinsic value (the difference between the stock price at exercise and the exercise price multiplied by the
number of options exercised) that was received by the option holders who exercised their options during the fiscal year. At February 1, 2013, February 3, 2012, and January 28, 2011, there was $83 million, $114 million, and $65 million of total unrecognized stock-basedcompensation expense, net of estimated forfeitures, related to unvested stock options expected to be recognized over a weighted-average period of 1.6 years, 1.9years, and 2.0 years, respectively.
Valuation of Awards
For stock options granted under Dell's Incentive Plans, Dell typically uses the Black-Scholes option pricing model to estimate the fair value of stock options atgrant date. The Black-Scholes option pricing model incorporates various assumptions, including volatility, expected term risk-free interest rates, and dividendyields. The assumptions utilized in this model as well as the weighted-average grant date fair value of stock options granted during F iscal 2013, Fiscal 2012,and Fiscal 2011 are presented below.
Fiscal Year Ended
February 1,
2013 February 3,
2012 January 28,
2011Weighted-average grant date fair value of stock options granted per option $ 4.88 $ 5.13 $ 5.01Expected term (in years) 4.8 4.6 4.5Risk-free interest rate (U.S. Government Treasury Note) 1.0% 1.9% 2.2%Volatility 37% 36% 37%Dividend Yield 2.7% —% —%
Expected volatility is based on a blend of implied and historical volatility of Dell's common stock over the most recent period commensurate with the estimatedexpected term of Dell's stock options. Dell uses this blend of implied and historical volatility, as well as other economic data, because management believessuch volatility is more representative of prospective trends. The expected term of an award is based on historical experience and on the terms and conditions ofthe stock awards granted to employees. During Fiscal 2013, Dell's Board of Directors adopted a dividend policy under which Dell paid quarterly cash
103

Table of ContentsDELL INC.
NOTES TO CONSOLIDATED FINANCIAL STATEMENTS (Continued)
dividends of $0.08 per share in the third and fourth quarters of Fiscal 2013. For options granted on or subsequent to Dell's initial declaration of a dividend, theCompany used the above dividend yield assumptions. The expected dividend yield is based on an annualized dividend rate and uses a historical three-monthaverage stock price.
For stock options assumed through business acquisitions, Dell uses the lattice binomial valuation model to estimate the fair value of the award. The use of thelattice binomial model requires extensive actual employee exercise behavior data for the purpose of estimating the expected term of the award. The latticebinomial valuation model includes various assumptions, including volatility, risk-free interest rate, expected term, and dividend yield. Below are theunderlying assumptions used to value stock options assumed through business acquisitions in Fiscal 2013. Stock-based compensation expense recognized forstock options awards assumed in Fiscal 2012 was not material.
Fiscal Year Ended February 1, 2013Weighted-average grant date fair value of stock options assumed per option $ 3.09Expected term (in years) 4.5Risk-free interest rate (U.S. Government Treasury Note) 1.3%Volatility 36%Dividend Yield 3.2%
For a limited number of performance-based restricted stock units that include a market-based condition, Dell uses the Monte Carlo simulation valuation modelto estimate fair value. Stock-based compensation expense recognized for awards that include a market-based condition was not material for Fiscal 2013, Fiscal2012, or Fiscal 2011.
Restricted Stock Awards
Non-vested restricted stock awards and activities For F iscal 2013, Fiscal 2012, and Fiscal 2011 were as follows:
Numberof
Shares
Weighted-Average
Grant DateFair Value
(in millions) (per share)Non-vested restricted stock: Non-vested restricted stock balance as of January 29, 2010 40 $ 16.84
Granted 26 14.53Vested(a) (17) 19.10Forfeited (7) 15.21
Non-vested restricted stock balance as of January 28, 2011 42 14.71Granted 22 15.19Vested(a) (18) 16.47Forfeited (4) 14.05
Non-vested restricted stock balance as of February 3, 2012 42 14.29Granted 27 16.97Vested(a) (19) 13.39Forfeited (8) 16.71
Non-vested restricted stock balance as of February 1, 2013 42 $ 15.95____________________(a) Upon vesting of restricted stock units, some of the underlying shares are generally sold to cover the required withholding taxes. However, select participants may choose the net
shares settlement method to cover withholding tax requirements. Total shares withheld were approximately 930,000, 426,000, and 354,000 for Fiscal 2013, Fiscal 2012, and Fiscal2011, respectively. Total payments for the employee's tax obligations to the taxing authorities were $16 million, $6 million, and $5 million in Fiscal 2013, Fiscal 2012, and Fiscal2011, respectively, and are reflected as a financing activity within the Consolidated Statements of Cash Flows.
104

Table of ContentsDELL INC.
NOTES TO CONSOLIDATED FINANCIAL STATEMENTS (Continued)
For Fiscal 2013, Fiscal 2012, and Fiscal 2011, the total estimated vest date fair value of restricted stock awards was $297 million, $273 million, and $250million, respectively.
At February 1, 2013, February 3, 2012, and January 28, 2011, there was $354 million, $348 million, and $341 million, respectively, of unrecognized stock-based compensation expense, net of estimated forfeitures, related to non-vested restricted stock awards expected to be recognized over a weighted-average periodof approximately 1.8, 1.8, and 1.9 years, respectively.
Stock-based Compensation Expense
Stock-based compensation expense was allocated as follows:
Fiscal Year Ended
February 1,
2013 February 3,
2012 January 28,
2011 (in millions)
Stock-based compensation expense: Cost of net revenue $ 5 9 $ 5 9 $ 57Operating expenses 288 303 275
Stock-based compensation expense before taxes 347 362 332Income tax benefit (104) (108) (97)
Stock-based compensation expense, net of income taxes $ 243 $ 254 $ 235
Employee Benefit Plans
401(k) Plan — Dell has a defined contribution retirement plan (the “401(k) Plan”) that complies with Section 401(k) of the Internal Revenue Code.Substantially all employees in the U.S. are eligible to participate in the 401(k) Plan. Effective January 1, 2008, Dell matches 100% of each participant'svoluntary contributions, subject to a maximum contribution of 5% of the participant's compensation, and participants vest immediately in all Dellcontributions to the 401(k) Plan. Dell's contributions during Fiscal 2013, Fiscal 2012, and Fiscal 2011 were $175 million, $168 million, and $132 million,respectively. Dell's contributions are invested according to each participant's elections in the investment options provided under the Plan. Investment optionsinclude Dell common stock, but neither participant nor Dell contributions are required to be invested in Dell common stock.
Deferred Compensation Plan — Dell has a non-qualified deferred compensation plan (the “Deferred Compensation Plan”) for the benefit of certainmanagement employees and non-employee directors. The Deferred Compensation Plan permits the deferral of base salary and annual incentive bonus. Thedeferrals are held in a separate trust, which has been established by Dell to administer the Plan. The assets of the trust are subject to the claims of Dell'screditors in the event that Dell becomes insolvent. Consequently, the trust qualifies as a grantor trust for income tax purposes (known as a “Rabbi Trust”). Inaccordance with the accounting provisions for deferred compensation arrangements where amounts earned are held in a Rabbi Trust and invested, the assetsand liabilities of the Deferred Compensation Plan are presented in long-term investments and accrued and other liabilities, respectively, in the ConsolidatedStatements of Financial Position. The assets held by the trust are classified as trading securities with changes recorded to interest and other, net. These assetswere valued at $112 million at February 1, 2013, and are disclosed in Note 2 and 3 of the Notes to Consolidated Financial Statements. Changes in the deferredcompensation liability are recorded to compensation expense.
105

Table of ContentsDELL INC.
NOTES TO CONSOLIDATED FINANCIAL STATEMENTS (Continued)
NOTE 15 — SEGMENT INFORMATION
Through Fiscal 2013, Dell managed its business in four global customer-centric operating segments: Large Enterprise, Public, Small and Medium Business,and Consumer. Large Enterprise includes sales of IT infrastructure and service solutions to large global and national corporate customers. Public includessales to educational institutions, governments, health care organizations, and law enforcement agencies, among others. SMB includes sales of complete ITsolutions to small and medium-sized businesses. Consumer includes sales to individual consumers and retailers around the world.
The business segments disclosed in the accompanying Consolidated Financial Statements are based on this organizational structure and information used byDell's management to evaluate the business segment results. Dell's measure of segment operating income for management reporting purposes excludes broadbased long-term incentives, amortization of intangible assets, and severance and facility actions and acquisition-related costs.
In the first quarter of Fiscal 2013, Dell made certain segment realignments in order to conform to the way Dell managed segment performance through Fiscal2013. These realignments affected all of Dell's operating segments, but primarily consisted of the transfer of small office business customers from its SMBoperating segment to its Consumer segment. Dell has recast prior period amounts to provide visibility and comparability. None of these changes impactsDell's previously reported consolidated net revenue, gross margin, operating income, net income, or earnings per share.
On January 10, 2013, Dell announced its intention to replace its current segment reporting structure described above with the following four product andservices business units in the first quarter of Fiscal 2014:
• End-User Computing Group (“EUC”)• Enterprise Solutions Group (“ESG”)• Dell Services• Dell Software Group
EUC will include notebooks, desktop PCs, thin client products, tablets, third-party software, and client-related peripherals. ESG will include servers,networking, storage, converged infrastructure offerings, and ESG related peripherals. Dell Services will include a broad range of IT and business services,including support and deployment services, infrastructure, cloud, and security services, and applications and business process services. The Dell SoftwareGroup will include systems management, security, and information management.
106

Table of ContentsDELL INC.
NOTES TO CONSOLIDATED FINANCIAL STATEMENTS (Continued)
The following table presents net revenue by Dell's reportable global segments as well as a reconciliation of consolidated segment operating income to Dell'sconsolidated operating income:
Fiscal Year Ended
February 1,
2013 February 3,
2012 January 28,
2011 (in millions)
Net revenue: Large Enterprise $ 17,781 $ 18,786 $ 18,111Public 14,828 16,070 16,377Small and Medium Business 13,413 13,547 12,608Consumer 10,918 13,668 14,398
Total $ 56,940 $ 62,071 $ 61,494Consolidated operating income: Large Enterprise $ 1,553 $ 1,889 $ 1,490Public 1,238 1,584 1,446Small and Medium Business 1,505 1,581 1,383Consumer (11) 433 180
Segment operating income 4,285 5,487 4,499Broad based long-term incentives (a) (312) (352) (350)Amortization of intangible assets (613) (391) (349)Severance and facility actions and acquisition-related costs (a)(b) (348) (313) (227)Other(c) — — (140)
Total $ 3,012 $ 4,431 $ 3,433____________________ (a) Broad based long-term incentives include stock-based compensation and other long-term incentive awards. See Note 14 of the Notes to Consolidated Financial Statements for
additional information.(b) Acquisition-related costs consist primarily of retention payments, integration costs, and consulting fees.(c) Other includes a $100 million settlement for an SEC investigation and a $40 million settlement for a securities litigation lawsuit that were both incurred in the first quarter of Fiscal
2011.
107

Table of ContentsDELL INC.
NOTES TO CONSOLIDATED FINANCIAL STATEMENTS (Continued)
For Fiscal 2013, segment assets consisted primarily of accounts receivable, net. Prior to Fiscal 2013, Dell's segment assets also included inventories. However,beginning in the first quarter of Fiscal 2013, Dell no longer manages inventory by segment. The following table presents total assets by Dell's reportablesegments:
February 1,
2013 February 3,
2012 (a)
(in millions)Total segment assets: Corporate $ 40,247 $ 37,575Large Enterprise 3,054 2,729Public 1,940 1,873Small and Medium Business 1,161 1,107Consumer 1,138 1,249
Total $ 47,540 $ 44,533____________________ (a) Segment assets previously reported have been recast for the segment realignment discussed above. This segment realignment did not impact Dell's previously reported consolidated
current assets or consolidated total assets.
The following table presents depreciation expense by Dell's reportable business segments:
Fiscal Year Ended
February 1,
2013 February 3,
2012 January 28,
2011 (in millions)
Depreciation expense: Large Enterprise $ 166 $ 162 $ 180Public 138 145 170Small and Medium Business 125 133 146Consumer 102 105 125
Total $ 531 $ 545 $ 621 The following tables present net revenue and long-lived asset information allocated between the U.S. and foreign countries:
Fiscal Year Ended
February 1,
2013 February 3,
2012 January 28,
2011 (in millions)
Net revenue: United States $ 28,231 $ 30,404 $ 31,912Foreign countries 28,709 31,667 29,582
Total $ 56,940 $ 62,071 $ 61,494
February 1,
2013 February 3,
2012 (in millions)Long-lived assets: United States $ 1,448 $ 1,577Foreign countries 678 547
Total $ 2,126 $ 2,124
108

Table of ContentsDELL INC.
NOTES TO CONSOLIDATED FINANCIAL STATEMENTS (Continued)
The allocation between domestic and foreign net rev enue is based on the location of the customers. Net revenue and long-lived assets from any single foreigncountry did not constitute more than 10% of Dell's consolidated net revenues or long-lived assets during Fiscal 2013, Fiscal 2012, or Fiscal 2011.
The following table presents net revenue by product and services categories:
Fiscal Year Ended
February 1,
2013 February 3,
2012 January 28,
2011 (in millions)
Net revenue: Enterprise Solutions and Services:
Enterprise Solutions: Servers and networking $ 9,294 $ 8,336 $ 7,609Storage 1,699 1,943 2,295
Services 8,396 8,322 7,673Third-party software and peripherals 9,257 10,222 10,261Client:
Mobility 15,303 19,104 18,971Desktop PCs 12,991 14,144 14,685
Net revenue $ 56,940 $ 62,071 $ 61,494
109

Table of ContentsDELL INC.
NOTES TO CONSOLIDATED FINANCIAL STATEMENTS (Continued)
NOTE 16 — SUPPLEMENTAL CONSOLIDATED FINANCIAL INFORMATION
Supplemental Consolidated Statements of Financial Position Information
The following table provides information on amounts included in accounts receivable, net, inventories, net, property, plant, and equipment, net, accrued andother liabilities, deferred revenue, and other non-current liabilities, as well as prepaid expenses as of February 1, 2013, and February 3, 2012.
February 1,
2013 February 3,
2012 (in millions)
Accounts receivable, net: Gross accounts receivable $ 6,701 $ 6,539Allowance for doubtful accounts (72) (63)
Total $ 6,629 $ 6,476Inventories, net:
Production materials $ 593 $ 753Work-in-process 283 239Finished goods 506 412
Total $ 1,382 $ 1,404
Prepaid expenses(a) $ 446 $ 362Property, plant, and equipment, net:
Computer equipment $ 2,591 $ 2,309Land and buildings 1,957 1,843Machinery and other equipment 752 782
Total property, plant, and equipment 5,300 4,934Accumulated depreciation and amortization (3,174) (2,810)
Total $ 2,126 $ 2,124_____________________(a) Prepaid expenses are included in other current assets in the Consolidated Statements of Financial Position.
110

Table of ContentsDELL INC.
NOTES TO CONSOLIDATED FINANCIAL STATEMENTS (Continued)
Supplemental Consolidated Statements of Financial Position Information (cont.)
February 1,
2013 February 3,
2012 (a)
(in millions)Accrued and other current liabilities:
Compensation $ 1,182 $ 1,604Warranty liability 492 572Income and other taxes 807 432Other 1,163 1,132
Total $ 3,644 $ 3,740 Deferred revenue:
Deferred extended warranty revenue $ 7,103 $ 7,002Other deferred services revenue 497 378
Total deferred services revenue 7,600 7,380Deferred revenue - Dell software 552 —Other deferred revenue 192 213
Total deferred revenue $ 8,344 $ 7,593Short-term portion $ 4,373 $ 3,738Long-term portion 3,971 3,855
Total deferred revenue $ 8,344 $ 7,593 Other non-current liabilities:
Warranty liability $ 270 $ 316Unrecognized tax benefits, net 2,908 2,563Deferred tax liabilities 918 405Other 91 89
Total $ 4,187 $ 3,373 _____________________(a) Certain prior year amounts have been reclassified from accrued and other liabilities and other non-current liabilities on the Consolidated Statements of Financial Position to short-termdeferred revenue and long-term deferred revenue, respectively, to conform to the current year presentation.
Supplemental Consolidated Statements of Income
The table below provides details of interest and other, net for Fiscal 2013, Fiscal 2012, and Fiscal 2011:
Fiscal Year Ended
February 1,
2013 February 3,
2012 January 28,
2011 (in millions)
Interest and other, net: Investment income, primarily interest $ 100 $ 81 $ 47Gains on investments, net 35 8 6Interest expense (270) (279) (199)Foreign exchange (18) 5 4Other (18) (6) 5 9
Interest and other, net $ (171) $ (191) $ (83)
111

Table of ContentsDELL INC.
NOTES TO CONSOLIDATED FINANCIAL STATEMENTS (Continued)
Valuation and Qualifying Accounts
FiscalYear Description
Balance at Beginningof Period
Charged toIncome
Statement Charged toAllowance
Balanceat End of
PeriodTrade Receivables:2013 Allowance for doubtful accounts $ 63 $ 100 $ 91 $ 722012 Allowance for doubtful accounts $ 9 6 $ 90 $ 123 $ 632011 Allowance for doubtful accounts $ 115 $ 124 $ 143 $ 9 6Customer Financing Receivables (a):2013 Allowance for financing receivable losses $ 202 $ 158 $ 168 $ 1922012 Allowance for financing receivable losses $ 241 $ 144 $ 183 $ 2022011 Allowance for financing receivable losses $ 237 $ 258 $ 254 $ 241Trade Receivables:2013 Allowance for customer returns $ 86 $ 694 $ 668 $ 1122012 Allowance for customer returns $ 102 $ 607 $ 623 $ 862011 Allowance for customer returns $ 79 $ 581 $ 558 $ 102
(a) Charge-offs to the allowance for financing receivable losses for customer financing receivables includes principal and interest.
112

Table of ContentsDELL INC.
NOTES TO CONSOLIDATED FINANCIAL STATEMENTS (Continued)
NOTE 17 — UNAUDITED QUARTERLY RESULTS
The following tables present selected unaudited Consolidated Statements of Income for each quarter of Fiscal 2013 and Fiscal 2012:
Fiscal Year 2013 First Second Third Fourth Quarter Quarter Quarter Quarter (in millions, except per share data)
Net revenue $ 14,422 $ 14,483 $ 13,721 $ 14,314Gross margin $ 3,067 $ 3,138 $ 2,872 $ 3,109Net income $ 635 $ 732 $ 475 $ 530Earnings per share:
Basic $ 0.36 $ 0.42 $ 0.27 $ 0.30Diluted $ 0.36 $ 0.42 $ 0.27 $ 0.30
Cash dividends declared per common share $ — $ — $ 0.08 $ 0.08Weighted-average shares outstanding:
Basic 1,759 1,747 1,735 1,738Diluted 1,774 1,753 1,742 1,748
Fiscal Year 2012 First Second Third Fourth Quarter Quarter Quarter Quarter (in millions, except per share data)
Net revenue $ 15,017 $ 15,658 $ 15,365 $ 16,031Gross margin $ 3,432 $ 3,525 $ 3,469 $ 3,385Net income $ 945 $ 890 $ 893 $ 764Earnings per share:
Basic $ 0.50 $ 0.48 $ 0.49 $ 0.43Diluted $ 0.49 $ 0.48 $ 0.49 $ 0.43
Weighted-average shares outstanding: Basic 1,908 1,858 1,813 1,778Diluted 1,923 1,871 1,828 1,796
113

Table of ContentsDELL INC.
NOTES TO CONSOLIDATED FINANCIAL STATEMENTS (Continued)
NOTE 18 — SUBSEQUENT EVENT
Merger Agreement
On February 5, 2013, Dell announced that it had signed a definitive agreement and plan of merger (the “merger agreement”) pursuant to which it will beacquired by Denali Holding Inc. (“Parent”), a Delaware corporation owned by Michael S. Dell, the Chairman, Chief Executive Officer and founder of Dell,and investment funds affiliated with Silver Lake Partners, a global private equity firm (“Silver Lake”). Following completion of the transaction, Mr. Dell willcontinue to lead Dell as Chairman and Chief Executive Officer and will maintain a significant equity investment in Dell by contributing his Dell shares toParent and making a cash investment in Parent. Subject to the satisfaction or permitted waiver of closing conditions set forth in the merger agreement, themerger is expected to be consummated before the end of the second quarter of the fiscal year ending January 31, 2014.
At the effective time of the merger, each share of Dell's common stock issued and outstanding immediately before the effective time, other than certain excludedshares, will be converted into the right to receive $13.65 in cash, without interest (the “merger consideration”). Shares of common stock held by the Parentand its subsidiaries, shares held by Mr. Dell and certain of Mr. Dell's related parties (together with Mr. Dell, the “MD Investors”), and by Dell or any wholly-owned subsidiary of Dell will not be entitled to receive the merger consideration.
Dell's stockholders will be asked to vote on the adoption of the merger agreement and the merger at a special stockholders meeting that will be held on a date tobe announced. The closing of the merger is subject to a non-waivable condition that the merger agreement be adopted by the affirmative vote of the holders of(1) at least a majority of all outstanding shares of common stock and (2) at least a majority of all outstanding shares of common stock held by stockholdersother than Parent and its subsidiaries, the MD Investors, any other officers and directors of Dell or any other person having any equity interest in, or any rightto acquire any equity interest in, Parent's merger subsidiary or any person of which the merger subsidiary is a direct or indirect subsidiary. Consummation ofthe merger is also subject to certain customary conditions. The merger agreement does not contain a financing condition.
The merger agreement places limitations on Dell's ability to engage in certain types of transactions without Parent's consent during the period between thesigning of the merger agreement and the effective time of the merger. During this period, Dell may not repurchase shares of its common stock or declaredividends in excess of the quarterly rate of $0.08 per share authorized under its current dividend policy. In addition, with limited exceptions, Dell may notincur additional debt other than up to $1.8 billion under its existing commercial paper program, $2.0 billion under its revolving credit facilities, $1.5 billionunder its structured financing debt facilities, and up to $25 million of additional indebtedness. Further, other than in transactions in the ordinary course ofbusiness or within specified dollar limits and certain other limited exceptions, Dell generally may not acquire other businesses, make investments in otherpersons, or sell, lease, or encumber its material assets.
Parent has obtained equity and debt financing commitments for the transactions contemplated by the merger agreement, the aggregate proceeds of which,together with the proceeds of a rollover investment of Dell shares in Parent by the MD Investors, an investment in subordinated securities and the availablecash of Dell, will be sufficient for Parent to pay the aggregate merger consideration and all related fees and expenses. The commitment of financial institutionsto provide debt financing for the transaction is subject to a number of customary conditions, including the execution and delivery by the borrowers and theguarantors of definitive documentation consistent with the debt commitment letter.
Pursuant to the terms of a “go-shop” provision in the merger agreement, during the period beginning on the date of the merger agreement and expiring afterMarch 22, 2013, Dell and its subsidiaries and their respective representatives may initiate, solicit and encourage any alternative acquisition proposals fromthird parties, provide nonpublic information to such third parties and participate in discussions and negotiations with such third parties regarding alternativeacquisition proposals. Under the terms and conditions set forth in the merger agreement, before the company stockholder approvals adopting the mergeragreement, the Board of Directors may change its recommendation, including in order to approve, and may authorize Dell to enter into, an alternativeacquisition proposal if the special committee of the Board of Directors that recommended approval of the merger has determined in good faith, afterconsultation with outside counsel and its financial advisors, that such alternative acquisition proposal would be more favorable to Dell's stockholders, takinginto account all of the terms and conditions of such proposal (including, among other things, the financing, likelihood and timing of its consummation andany adjustments to the merger agreement).
114

Table of ContentsDELL INC.
NOTES TO CONSOLIDATED FINANCIAL STATEMENTS (Continued)
The merger agreement contains certain termination rights for Dell and Parent. Among such rights, and subject to certain limitations, either Dell or Parent mayterminate the merger agreement if the merger is not completed by November 5, 2013.
The terms of the merger agreement did not impact Dell's Consolidated Financial Statements as of and for the fiscal year ended February 1, 2013.
115

Table of Contents
ITEM 9 — CHANGES IN AND DISAGREEMENTS WITH ACCOUNTANTS ON ACCOUNTING AND FINANCIAL DISCLOSURE
None.
ITEM 9A — CONTROLS AND PROCEDURES
Exhibits 31.1 and 31.2 to this report include the certifications of our Chief Executive Officer and Chief Financial Officer required by Rule 13a-14 under theSecurities Exchange Act of 1934 (the “Exchange Act”). This Item 9A includes information concerning the controls and control evaluations referred to in thosecertifications. Management's Report on Internal Control over Financial Reporting
Management, under the supervision of the Chief Executive Officer and the Chief Financial Officer, is responsible for establishing and maintaining adequateinternal control over financial reporting. Internal control over financial reporting (as defined in Rules 13a-15(f) and 15d(f) under the Exchange Act) is aprocess designed to provide reasonable assurance regarding the reliability of financial reporting and the preparation of financial statements for externalpurposes in accordance with GAAP. Internal control over financial reporting includes those policies and procedures which (a) pertain to the maintenance ofrecords that, in reasonable detail, accurately and fairly reflect the transactions and dispositions of assets, (b) provide reasonable assurance that transactionsare recorded as necessary to permit preparation of financial statements in accordance with GAAP, (c) provide reasonable assurance that receipts andexpenditures are being made only in accordance with appropriate authorization of management and the board of directors, and (d) provide reasonableassurance regarding prevention or timely detection of unauthorized acquisition, use, or disposition of assets that could have a material effect on the financialstatements.
In connection with the preparation of this report, our management, under the supervision and with the participation of our Chief Executive Officer and ChiefFinancial Officer, conducted an evaluation of the effectiveness of our internal control over financial reporting as of February 1, 2013, based on the criteriaestablished in Internal Control — Integrated Framework issued by the Committee of Sponsoring Organizations of the Treadway Commission. As a resultof that evaluation, management has concluded that our internal control over financial reporting was effective as of February 1, 2013. The effectiveness of ourinternal control over financial reporting as of February 1, 2013, has been audited by PricewaterhouseCoopers LLP, our independent registered publicaccounting firm, as stated in their report, which is included in “Part II — Item 8 — Financial Statements and Supplementary Data.”
Changes in Internal Control over Financial Reporting
Dell's management, with the participation of Dell's Chief Executive Officer and Chief Financial Officer, has evaluated whether any change in Dell's internalcontrol over financial reporting occurred during the fourth quarter of Fiscal 2013. Based on their evaluation, management concluded that there has been nochange in Dell's internal control over financial reporting during the fourth quarter of Fiscal 2013 that has materially affected, or is reasonably likely tomaterially affect, Dell's internal control over financial reporting. Evaluation of Disclosure Controls and Procedures
Disclosure controls and procedures (as defined in Rules 13a-15(e) and 15d-15(e) under the Exchange Act) are designed to ensure that information required tobe disclosed in reports filed or submitted under the Exchange Act is recorded, processed, summarized, and reported within the time periods specified in SECrules and forms and that such information is accumulated and communicated to management, including the Chief Executive Officer and the Chief FinancialOfficer, to allow timely decisions regarding required disclosures.
In connection with the preparation of this report, our management, under the supervision and with the participation of our Chief Executive Officer and ChiefFinancial Officer, conducted an evaluation of the effectiveness of the design and operation of our disclosure controls and procedures as of February 1, 2013.Based on that evaluation, our management has concluded that our disclosure controls and procedures were effective as of February 1, 2013.
Inherent Limitations in Internal Controls
Our system of controls is designed to provide reasonable, not absolute, assurance regarding the reliability and integrity of accounting and financial reporting.Management does not expect that our disclosure controls and procedures or our internal control over financial reporting will prevent or detect all errors and allfraud. A control system, no matter how well designed and operated, can provide only reasonable, not absolute, assurance that the objectives of the controlsystem will be met. These inherent limitations include the following:
116

• Judgments in decision-making can be faulty, and control and process breakdowns can occur because of simple errors or mistakes.
• Controls can be circumvented by individuals, acting alone or in collusion with each other, or by management override.
• The design of any system of controls is based in part on certain assumptions about the likelihood of future events, and there can be no assurance that anydesign will succeed in achieving its stated goals under all potential future conditions.
• Over time, controls may become inadequate because of changes in conditions or deterioration in the degree of compliance with associated policies orprocedures.
• The design of a control system must reflect the fact that resources are constrained, and the benefits of controls must be considered relative to their costs. ITEM 9B — OTHER INFORMATION
None.
117

Table of Contents
PART IIIITEM 10 — DIRECTORS, EXECUTIVE OFFICERS AND CORPORATE GOVERNANCE
We have adopted a code of ethics applicable to our principal executive officer and other senior financial officers, who include our principal financial officer,principal accounting officer, controller, and persons performing similar functions. The code of ethics, which we refer to as our Code of Conduct, is availableon our Internet website at www.dell.com. To the extent required by SEC rules, we intend to disclose any amendments to this code and any waiver of aprovision of the code for the benefit of our principal executive officer, principal financial officer, principal accounting officer, controller, or personsperforming similar functions, on our website within any period that may be required under SEC rules from time to time.
See “Part I — Item 1 — Business — Executive Officers of Dell” for information about our executive officers, which is incorporated by reference in thisItem 10. Other information required by this Item 10 is incorporated herein by reference to our definitive proxy statement for our 2013 annual meeting ofstockholders, referred to as the “2013 proxy statement,” which we will file with the SEC on or before 120 days after our 2013 fiscal year-end, and which willappear in the 2013 proxy statement under the captions “Proposal 1 — Election of Directors” and “Additional Information — Section 16(a) BeneficialOwnership Reporting Compliance.”
ITEM 11 — EXECUTIVE COMPENSATION
Information required by this Item 11 is incorporated herein by reference to the 2013 proxy statement, including the information in the 2013 proxy statementappearing under the captions “Proposal 1 — Election of Directors — Director Compensation” and “Executive Compensation.”
ITEM 12 — SECURITY OWNERSHIP OF CERTAIN BENEFICIAL OWNERS AND MANAGEMENT AND RELATED STOCKHOLDERMATTERS
Information required by this Item 12 is incorporated herein by reference to the 2013 proxy statement, including the information in the 2013 proxy statementappearing under the captions “Stock Ownership” and “Executive Compensation — Equity Compensation Plans.”
ITEM 13 — CERTAIN RELATIONSHIPS AND RELATED TRANSACTIONS, AND DIRECTOR INDEPENDENCE
Information required by this Item 13 is incorporated herein by reference to the 2013 proxy statement, including the information in the 2013 proxy statementappearing under the captions “Proposal 1 — Elections of Directors” and “Additional Information — Certain Relationships and Related Transactions.”
ITEM 14 — PRINCIPAL ACCOUNTING FEES AND SERVICES
Information required by this Item 14 is incorporated herein by reference to the 2013 proxy statement, including the information in the 2013 proxy statementappearing under the caption “Proposal 2 — Ratification of Independent Auditor.”
118

Table of Contents
PART IV
ITEM 15 — EXHIBITS, FINANCIAL STATEMENT SCHEDULES
Financial Statements
The following financial statements are filed as a part of this report under “Part II — Item 8 — Financial Statements and Supplementary Data”:
PageFinancial Statements:
Report of Independent Registered Public Accounting Firm 61Consolidated Statements of Financial Position at February 1, 2013, and February 3, 2012 62Consolidated Statements of Income for the fiscal years ended February 1, 2013, February 3, 2012, and January 28, 2011 63Consolidated Statements of Comprehensive Income for the fiscal years ended February 1, 2013, February 3, 2012, and January 28, 2011 64Consolidated Statements of Cash Flows for the fiscal years ended February 1, 2013, February 3, 2012, and January 28, 2011 6 5Consolidated Statements of Stockholders’ Equity for the fiscal years ended February 1, 2013, February 3, 2012, and January 28, 2011 6 6Notes to Consolidated Financial Statements 67
A list of the exhibits filed or furnished with this report (or incorporated by reference to exhibits previously filed or furnished) is provided in the Exhibit indexon page 123 of this report.
119

Table of Contents
Financial Statement Schedule
Schedule II — Valuation and Qualifying Accounts for the three fiscal years ended February 1, 2013, February 3, 2012, and January 28, 2011 is included inNote 16 of Notes to Consolidated Financial Statements included in "Part II — Item 8 — Financial Statements and Supplementary Data." All other schedulescalled for by Form 10-K are omitted because they are inapplicable or the required information is shown in the consolidated financial statements, or notesthereto, included herein.
120

Table of Contents
SIGNATURES
Pursuant to the requirements of Section 13 or 15(d) of the Securities Exchange Act of 1934, the registrant has duly caused this report to be signed on its behalfby the undersigned, thereunto duly authorized.
DELL INC.
By: /s/ MICHAEL S. DELL Michael S. Dell Chairman and Chief Executive Officer (Duly authorized officer)Date: March 12, 2013
121
Table of Contents
Pursuant to the requirements of the Securities Exchange Act of 1934, this report has been signed below by the following persons on behalf of the registrant andin the capacities and as of the date indicated.
Name Title Date
/s/ MICHAEL S. DELL Chairman and Chief Executive Officer(principal executive officer)
March 12, 2013Michael S. Dell
/s/ JAMES W. BREYER Director March 12, 2013
James W. Breyer
/s/ DONALD J. CARTY Director March 12, 2013Donald J. Carty
/s/ JANET F. CLARK Director March 12, 2013
Janet F. Clark
/s/ LAURA CONIGLIARO Director March 12, 2013Laura Conigliaro
/s/ KENNETH M. DUBERSTEIN Director March 12, 2013Kenneth M. Duberstein
/s/ WILLIAM H. GRAY, III Director March 12, 2013
William H. Gray, III
/s/ GERARD J. KLEISTERLEE
Director
March 12, 2013
Gerard J. Kleisterlee
/s/ KLAUS S. LUFT Director March 12, 2013
Klaus S. Luft
/s/ ALEX J. MANDL Director March 12, 2013
Alex J. Mandl
/s/ SHANTANU NARAYEN
Director
March 12, 2013
Shantanu Narayen
/s/ H. ROSS PEROT, JR.
Director
March 12, 2013
H. Ross Perot, Jr.
/s/ BRIAN T. GLADDEN
Senior Vice President and Chief Financial Officer(principal financial officer)
March 12, 2013
Brian T. Gladden
/s/ YVONNE MCGILL
Vice President, Corporate Finance and Chief AccountingOfficer (principal accounting officer)
March 12, 2013
Yvonne Mcgill
122

Table of Contents
Exhibits
Exhibit No. Description of Exhibit2.1
Agreement and Plan of Merger, dated as of February 5, 2013, by and among Dell Inc. ("Dell"), Denali Holding Inc.,Denali Intermediate Inc. and Denali Acquiror Inc. (incorporated by reference to Exhibit 2.1 of Dell's Current Report on Form8-K filed February 6, 2013, as amended by Current Report on Form 8-K/A filed on February 15, 2013, Commission FileNo. 0-17017)
3.1
—
Restated Certificate of Incorporation (incorporated by reference to Exhibit 3.1 of the Quarterly Report on Form 10-Q of DellInc. for the fiscal quarter ended April 29, 2011, Commission File No. 0-17017)
3.2
—
Restated Bylaws, as amended and effective as of August 16, 2010 (incorporated by reference to Exhibit 3.2 of Dell'sQuarterly Report on Form 10-Q for the fiscal quarter ended July 30, 2010, Commission File No. 0-17017)
4.1
—
Indenture, dated as of April 27, 1998, between Dell Computer Corporation and Chase Bank of Texas, NationalAssociation (incorporated by reference to Exhibit 99.2 of Dell's Current Report on Form 8-K filed April 28, 1998,Commission File No. 0-17017)
4.2
—
Officers' Certificate pursuant to Section 301 of the Indenture establishing the terms of Dell's 7.10% Senior Debentures Due2028 (incorporated by reference to Exhibit 99.4 of Dell's Current Report on Form 8-K filed April 28, 1998, CommissionFile No. 0-17017)
4.3
—
Form of Dell's 7.10% Senior Debentures Due 2028 (incorporated by reference to Exhibit 99.6 of Dell's Current Report onForm 8-K filed April 28, 1998, Commission File No. 0-17017)
4.4
—
Indenture, dated as of April 17, 2008, between Dell and The Bank of New York Mellon Trust Company, N.A. (formerlyThe Bank of New York Trust Company, N.A.), as trustee (including the form of notes) (incorporated by reference toExhibit 4.1 of Dell's Current Report on Form 8-K filed April 17, 2008, Commission File No. 0-17017)
4.5
—
Indenture, dated as of April 6, 2009, between Dell and The Bank of New York Mellon Trust Company, N.A., as trustee(incorporated by reference to Exhibit 4.1 of Dell's Current Report on Form 8-K filed April 6, 2009, Commission File No. 0-17017)
4.6
—
First Supplemental Indenture, dated April 6, 2009, between Dell and The Bank of New York Mellon Trust Company,N.A., as trustee (incorporated by reference to Exhibit 4.2 of Dell's Current Report on Form 8-K filed April 6, 2009,Commission File No. 0-17017)
4.7
—
Form of 5.625% Notes due 2014 (incorporated by reference to Exhibit 4.3 of Dell's Current Report on Form 8-K filedApril 6, 2009, Commission File No. 0 ‑17017)
4.8
—
Second Supplemental Indenture, dated June 15, 2009, between Dell and The Bank of New York Mellon Trust Company,N.A., as trustee (incorporated by reference to Exhibit 4.1 of Dell's Current Report on Form 8-K filed June 15, 2009,Commission File No. 0-17017)
4.9
—
Form of 3.375% Notes due 2012 (incorporated by reference to Exhibit 4.2 of Dell's Current Report on Form 8-K filedJune 15, 2009, Commission File No. 0 ‑17017)
4.10
—
Form of 5.875% Notes due 2019 (incorporated by reference to Exhibit 4.3 of Dell's Current Report on Form 8-K filedJune 15, 2009, Commission File No. 0 ‑17017)
4.11
—
Third Supplemental Indenture, dated September 10, 2010, between Dell and The Bank of New York Mellon TrustCompany, N.A., as trustee (incorporated by reference to Exhibit 4.1 of Dell's Current Report on Form 8-K filedSeptember 10, 2010, Commission File No. 0-17017)
4.12
—
Form of 1.40% Notes due 2013 (incorporated by reference to Exhibit 4.2 of Dell's Current Report on Form 8-K filedSeptember 10, 2010, Commission File No. 0-17017)
4.13
—
Form of 2.30% Notes due 2015 (incorporated by reference to Exhibit 4.3 of Dell's Current Report on Form 8-K filedSeptember 10, 2010, Commission File No. 0-17017)

4.14
—
Form of 5.40% Notes due 2040 (incorporated by reference to Exhibit 4.4 of Dell's Current Report on Form 8-K filedSeptember 10, 2010, Commission File No. 0-17017)
4.15
—
Fourth Supplemental Indenture, dated March 31, 2011, between Dell and The Bank of New York Mellon TrustCompany, N.A., as trustee (incorporated by reference to Exhibit 4.1 of Dell's Current Report on Form 8-K filed March 31,2011, Commission File No. 0-17017)
4.16
—
Form of Floating Rate Notes due 2014 (incorporated by reference to Exhibit 4.2 of Dell's Current Report on Form 8-K filedMarch 31, 2011, Commission File No. 0-17017)
4.17
—
Form of 2.100% Notes due 2014 (incorporated by reference to Exhibit 4.3 of Dell's Current Report on Form 8-K filed March31, 2011, Commission File No. 0-17017)
123

Table of Contents
Exhibit No. Description of Exhibit4.18
—
Form of 3.100% Notes due 2016 (incorporated by reference to Exhibit 4.4 of Dell's Current Report on Form 8-K filedMarch 31, 2011, Commission File No. 0-17017)
4.19
—
Form of 4.625% Notes due 2021 (incorporated by reference to Exhibit 4.5 of Dell's Current Report on Form 8-K filedMarch 31, 2011, Commission File No. 0-17017)
10.1
* —
Amended and Restated Dell Computer Corporation 1994 Incentive Plan (incorporated by reference to Exhibit 99 of Dell'sRegistration Statement on Form S-8 filed October 31, 2000, Registration No. 333-49014)
10.2
* —
Amended and Restated Dell Computer Corporation 1998 Broad-Based Stock Option Plan (incorporated by reference toExhibit 99 of Dell's Registration Statement on Form S-8 filed October 31, 2000, Registration No. 333-49016)
10.3
* —
Dell Computer Corporation 2002 Long-Term Incentive Plan (incorporated by reference to Exhibit 10.1 of Dell's QuarterlyReport on Form 10-Q for the fiscal quarter ended August 2, 2002, Commission File No. 0-17017)
10.4
* —
Dell Inc. Amended and Restated 2002 Long-Term Incentive Plan (incorporated by reference to Appendix A of Dell's 2007proxy statement filed October 31, 2007, Commission File No. 0-17017)
10.5
* —
Amended and Restated Dell Inc. Deferred Compensation Plan effective as of January 1, 2005 (incorporated by reference toExhibit 10.7 of Dell's Annual Report on Form 10-K for the fiscal year ended January 30, 2009, Commission File No. 0-17017)
10.6
* —
Amended and Restated Dell Inc. Deferred Compensation Plan for Non-Employee Directors effective as of January 1, 2005(incorporated by reference to Exhibit 10.8 of Dell's Annual Report on Form 10-K for the fiscal year ended January 30,2009, Commission File No. 0-17017)
10.7
* —
Executive Annual Incentive Bonus Plan (incorporated by reference to Appendix A of Dell's 2008 proxy statement filedJune 2, 2008, Commission File No. 0-17017)
10.8
* —
Form of Restricted Stock Agreement for Non-Employee Directors under the 2002 Long-Term Incentive Plan (incorporatedby reference to Exhibit 99.1 of Dell's Current Report on Form 8-K filed July 27, 2006, Commission File No. 0-17017)
10.9
* —
Form of Restricted Stock Unit Agreement for Non-Employee Directors under the 2002 Long-Term Incentive Plan(incorporated by reference to Exhibit 99.2 of Dell's Current Report on Form 8-K filed July 27, 2006, Commission File No.0-17017)
10.10
* —
Form of Stock Unit Agreement for grant to Donald J. Carty under the 2002 Long-Term Incentive Plan (incorporated byreference to Exhibit 99.2 of Dell's Current Report on Form 8-K filed December 20, 2006, Commission File No. 0-17017)
10.11
* —
Form of Restricted Stock Unit Agreement for Non-Employee Directors under the Amended and Restated 2002 Long-TermIncentive Plan (incorporated by reference to Exhibit 10.10 of Dell's Quarterly Report on Form 10-Q for the fiscal quarterended May 4, 2007, Commission File No. 0-17017)
10.12
* —
Form of Restricted Stock Unit Agreement for Non-Employee Directors under the Amended and Restated 2002 Long-TermIncentive Plan (incorporated by reference to Exhibit 10.12 of Dell's Annual Report on Form 10-K for the fiscal year endedJanuary 28, 2011, Commission File No. 0-17017)
10.13
* —
Form of Restricted Stock Unit Agreement for Executive Officers under the Amended and Restated 2002 Long-TermIncentive Plan (incorporated by reference to Exhibit 10.23 of Dell's Annual Report on Form 10-K for the fiscal year endedJanuary 30, 2009, Commission File No. 0-17017)
10.14
* —
Form of Restricted Stock Unit Agreement for Executive Officers under the Amended and Restated 2002 Long-TermIncentive Plan (incorporated by reference to Exhibit 10.4 of Dell's Quarterly Report on Form 10-Q for the fiscal quarterended April 30, 2010, Commission File No. 0-17017)
10.15
* —
Form of Restricted Stock Unit Agreement for New Hire Senior Executive Officers under the Amended and Restated 2002Long-Term Incentive Plan (incorporated by reference to Exhibit 10.5 of Dell's Quarterly Report on Form 10-Q for the fiscalquarter ended April 30, 2010, Commission File No. 0-17017)
10.16
* —
Form of Performance Based Stock Unit Agreement for employees under the 2002 Long-Term Incentive Plan (incorporatedby reference to Exhibit 99.2 of Dell's Current Report on Form 8-K filed March 14, 2006, Commission File No. 0-17017)
10.17
* —
Form of Performance Based Stock Unit Agreement for Executive Officers under the Amended and Restated 2002 Long-Term Incentive Plan (incorporated by reference to Exhibit 10.17 of Dell's Annual Report on Form 10-K for the fiscal yearended February 1, 2008, Commission File No. 0-17017)
124

Table of Contents
Exhibit No. Description of Exhibit10.18
* —
Form of Performance Based Stock Unit Agreement for Executive Officers under the Amended and Restated 2002 Long-Term Incentive Plan (incorporated by reference to Exhibit 10.21 of Dell's Annual Report on Form 10-K for the fiscal yearended January 30, 2009, Commission File No. 0-17017)
10.19
* —
Form of Performance Based Stock Unit Agreement for Key Vice Presidents under the Amended and Restated 2002 Long-Term Incentive Plan (incorporated by reference to Exhibit 10.1 of Dell's Quarterly Report on Form 10-Q for the fiscalquarter ended April 30, 2010, Commission File No. 0-17017)
10.20
* —
Form of Performance Based Stock Unit Agreement for Communications Solutions Executive Officers under the Amendedand Restated 2002 Long-Term Incentive Plan (incorporated by reference to Exhibit 10.2 of Dell's Quarterly Report on Form10-Q for the fiscal quarter ended April 30, 2010, Commission File No. 0-17017)
10.21
* —
Form of Nonstatutory Stock Option Agreement for Non-Employee Directors under the 2002 Long-Term Incentive Plan(incorporated by reference to Exhibit 99.3 of Dell's Current Report on Form 8-K filed July 27, 2006, Commission File No.0-17017)
10.22
* —
Form of Nonstatutory Stock Option Agreement for grant to Donald J. Carty under the 2002 Long-Term Incentive Plan(incorporated by reference to Exhibit 99.1 of Dell's Current Report on Form 8-K filed December 20, 2006, CommissionFile No. 0-17017)
10.23
* —
Form of Nonstatutory Stock Option Agreement for Non-Employee Directors under the Amended and Restated 2002 Long-Term Incentive Plan (incorporated by reference to Exhibit 10.11 of Dell's Quarterly Report on Form 10-Q for the fiscalquarter ended May 4, 2007, Commission File No. 0-17017)
10.24
* —
Form of Nonstatutory Stock Option Agreement for Executive Officers under the Amended and Restated 2002 Long-TermIncentive Plan (incorporated by reference to Exhibit 10.22 of Dell's Annual Report on Form 10-K for the fiscal year endedJanuary 30, 2009, Commission File No. 0-17017)
10.25
* —
Form of Nonstatutory Stock Option Agreement for Executive Officers under the Amended and Restated 2002 Long-TermIncentive Plan (incorporated by reference to Exhibit 10.3 of Dell's Quarterly Report on Form 10-Q for the fiscal quarterended April 30, 2010, Commission File No. 0-17017)
10.26
* —
Form of Indemnification Agreement between Dell and each Non-Employee Director of Dell (incorporated by reference toExhibit 10.11 to Dell's Annual Report on Form 10-K for the fiscal year ended January 31, 2003, Commission File No. 0-17017)
10.27
* —
Form of Indemnification Agreement between Dell and each Executive Officer of Dell (incorporated by reference to Exhibit10.27 of Dell's Annual Report on Form 10-K for the Fiscal year ended January 28, 2011, Commission File No. 0-17017)
10.28
* —
Form of Protection of Sensitive Information, Noncompetition and Nonsolicitation Agreement (incorporated by reference toExhibit 99.3 of Dell's Current Report on Form 8-K filed February 21, 2007, Commission File No. 0-17017)
10.29
* —
Form of Protection of Sensitive Information, Noncompetition and Nonsolicitation Agreement for Executive Officers(incorporated by reference to Exhibit 10.1 of Dell's Current Report on Form 8-K filed July 16, 2007, Commission File No.0-17017)
10.30
* —
Form of Protection of Sensitive Information, Noncompetition and Nonsolicitation Agreement for Executive Officers(incorporated by reference to Exhibit 10.1 of Dell's Current Report on Form 8-K filed September 12, 2007, CommissionFile No. 0-17017)
10.31
* —
Form of Protection of Sensitive Information, Noncompetition and Nonsolicitation Agreement
10.32
* —
Retention Bonus, Merger and Modification Agreement between Dell and Ronald G. Garriques (incorporated by reference toExhibit 99.1 of Dell's Current Report on Form 8-K filed March 9, 2009, Commission File No. 0-17017)
10.33
* —
Separation Agreement and Release between Ronald G. Garriques and Dell (incorporated by reference to Exhibit 99.1 ofDell's Current Report on Form 8-K filed November 17, 2010, Commission File No. 0-17017)
10.34
* —
Separation Agreement and Release between Dell and Peter Altabef (incorporated by reference to Exhibit 10.1 of Dell'sCurrent Report on Form 8-K filed January 13, 2011, Commission File No. 0-17017)
10.35
* —
Dell Inc. 2012 Long-Term Incentive Plan (the "2012 Long-Term Incentive Plan") (incorporated by reference to Exhibit 10.1of Dell's Current Report on Form 8-K filed July 19, 2012, Commission File No. 0-17017)
125
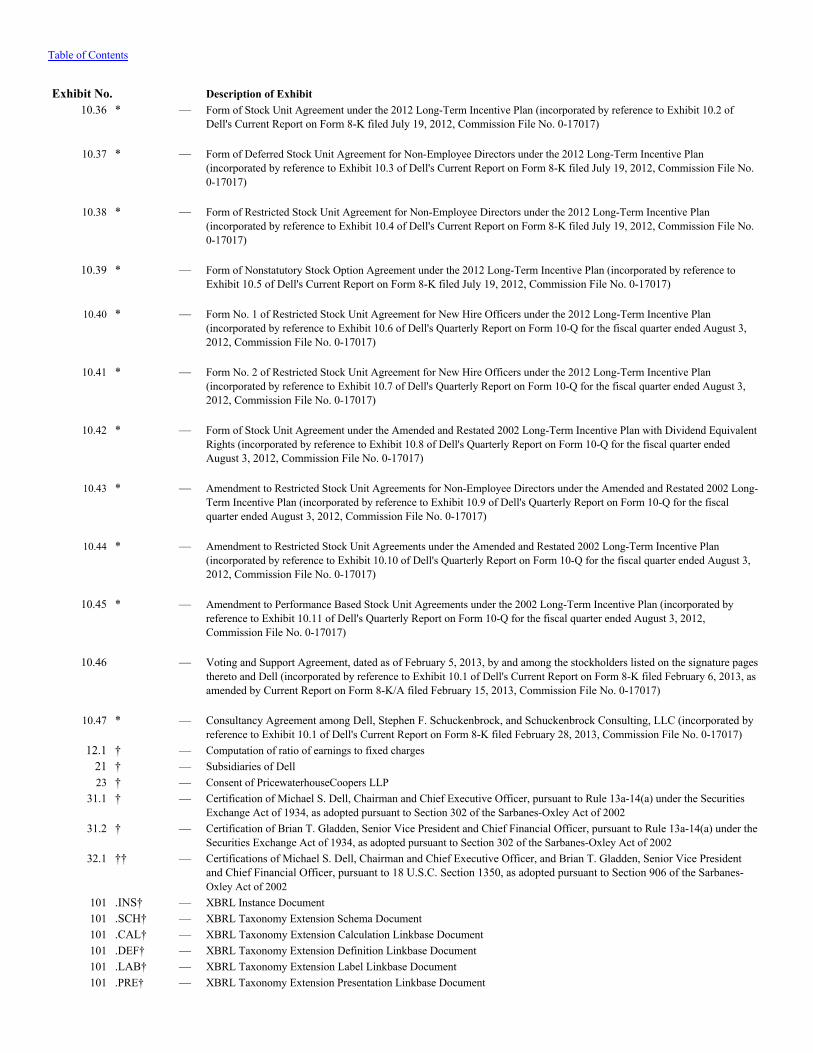
Table of Contents
Exhibit No. Description of Exhibit10.36
* —
Form of Stock Unit Agreement under the 2012 Long-Term Incentive Plan (incorporated by reference to Exhibit 10.2 ofDell's Current Report on Form 8-K filed July 19, 2012, Commission File No. 0-17017)
10.37
* —
Form of Deferred Stock Unit Agreement for Non-Employee Directors under the 2012 Long-Term Incentive Plan(incorporated by reference to Exhibit 10.3 of Dell's Current Report on Form 8-K filed July 19, 2012, Commission File No.0-17017)
10.38
* —
Form of Restricted Stock Unit Agreement for Non-Employee Directors under the 2012 Long-Term Incentive Plan(incorporated by reference to Exhibit 10.4 of Dell's Current Report on Form 8-K filed July 19, 2012, Commission File No.0-17017)
10.39
* —
Form of Nonstatutory Stock Option Agreement under the 2012 Long-Term Incentive Plan (incorporated by reference toExhibit 10.5 of Dell's Current Report on Form 8-K filed July 19, 2012, Commission File No. 0-17017)
10.40
* —
Form No. 1 of Restricted Stock Unit Agreement for New Hire Officers under the 2012 Long-Term Incentive Plan(incorporated by reference to Exhibit 10.6 of Dell's Quarterly Report on Form 10-Q for the fiscal quarter ended August 3,2012, Commission File No. 0-17017)
10.41
* —
Form No. 2 of Restricted Stock Unit Agreement for New Hire Officers under the 2012 Long-Term Incentive Plan(incorporated by reference to Exhibit 10.7 of Dell's Quarterly Report on Form 10-Q for the fiscal quarter ended August 3,2012, Commission File No. 0-17017)
10.42
* —
Form of Stock Unit Agreement under the Amended and Restated 2002 Long-Term Incentive Plan with Dividend EquivalentRights (incorporated by reference to Exhibit 10.8 of Dell's Quarterly Report on Form 10-Q for the fiscal quarter endedAugust 3, 2012, Commission File No. 0-17017)
10.43
* —
Amendment to Restricted Stock Unit Agreements for Non-Employee Directors under the Amended and Restated 2002 Long-Term Incentive Plan (incorporated by reference to Exhibit 10.9 of Dell's Quarterly Report on Form 10-Q for the fiscalquarter ended August 3, 2012, Commission File No. 0-17017)
10.44
* —
Amendment to Restricted Stock Unit Agreements under the Amended and Restated 2002 Long-Term Incentive Plan(incorporated by reference to Exhibit 10.10 of Dell's Quarterly Report on Form 10-Q for the fiscal quarter ended August 3,2012, Commission File No. 0-17017)
10.45
* —
Amendment to Performance Based Stock Unit Agreements under the 2002 Long-Term Incentive Plan (incorporated byreference to Exhibit 10.11 of Dell's Quarterly Report on Form 10-Q for the fiscal quarter ended August 3, 2012,Commission File No. 0-17017)
10.46
—
Voting and Support Agreement, dated as of February 5, 2013, by and among the stockholders listed on the signature pagesthereto and Dell (incorporated by reference to Exhibit 10.1 of Dell's Current Report on Form 8-K filed February 6, 2013, asamended by Current Report on Form 8-K/A filed February 15, 2013, Commission File No. 0-17017)
10.47
* —
Consultancy Agreement among Dell, Stephen F. Schuckenbrock, and Schuckenbrock Consulting, LLC (incorporated byreference to Exhibit 10.1 of Dell's Current Report on Form 8-K filed February 28, 2013, Commission File No. 0-17017)
12.1 † — Computation of ratio of earnings to fixed charges21 † — Subsidiaries of Dell23 † — Consent of PricewaterhouseCoopers LLP
31.1
† —
Certification of Michael S. Dell, Chairman and Chief Executive Officer, pursuant to Rule 13a-14(a) under the SecuritiesExchange Act of 1934, as adopted pursuant to Section 302 of the Sarbanes-Oxley Act of 2002
31.2
† —
Certification of Brian T. Gladden, Senior Vice President and Chief Financial Officer, pursuant to Rule 13a-14(a) under theSecurities Exchange Act of 1934, as adopted pursuant to Section 302 of the Sarbanes-Oxley Act of 2002
32.1
†† —
Certifications of Michael S. Dell, Chairman and Chief Executive Officer, and Brian T. Gladden, Senior Vice Presidentand Chief Financial Officer, pursuant to 18 U.S.C. Section 1350, as adopted pursuant to Section 906 of the Sarbanes-Oxley Act of 2002
101 .INS† — XBRL Instance Document101 .SCH† — XBRL Taxonomy Extension Schema Document101 .CAL† — XBRL Taxonomy Extension Calculation Linkbase Document101 .DEF† — XBRL Taxonomy Extension Definition Linkbase Document101 .LAB† — XBRL Taxonomy Extension Label Linkbase Document101 .PRE† — XBRL Taxonomy Extension Presentation Linkbase Document

126

Table of Contents
* Identifies Exhibit that consists of or includes a management contract or compensatory plan or arrangement.† Filed with this report.†† Furnished with this report.
127

EXHIBIT 12.1
DELL INC.RATIO OF EARNINGS TO FIXED CHARGES
Fiscal Year Ended
February 1, 2013 February 3, 2012 January 28, 2011 January 29,
2010 January 30,
2009 (in millions, except ratios)
Earnings Pre-tax income from continuing operations $ 2,841 $ 4,240 $ 3,350 $ 2,024 $ 3,324Add: Fixed Charges adjusted for capitalizedinterest 316 315 228 191 132
Total $ 3,157 $ 4,555 $ 3,578 $ 2,215 $ 3,456Fixed Charges(a) Interest Expense $ 270 $ 279 $ 199 $ 160 $ 93Capitalized Interest — — — — —Estimate of interest in rent expense 46 36 29 31 39
Total $ 316 $ 315 $ 228 $ 191 $ 132
Ratio of Earnings to Fixed Charges 10 14 16 12 26____________________________(a) Fixed charges included in the calculation of this ratio consist of: (i) interest expensed, plus (ii) interest capitalized (when applicable), plus (iii) a reasonable estimation of the interest
factor included in rental expense.

Exhibit 21
Dell Inc. Subsidiary List
Other U.S. Entities Jurisdiction Dell Inc. DelawareAelita Software Corporation DelawareAppAssure Technologies Inc. DelawareASAP Software Express Inc. IllinoisAventail LLC DelawareBakBone Software, Inc CaliforniaBluefolder, Inc ColoradoBoomi, Inc DelawareBracknell Boulevard (Block C) L.L.C. DelawareBracknell Boulevard (Block D) L.L.C. DelawareClerity Solutions, Inc. IllinoisCompellent Technologies Inc. DelawareCredant Technologies Inc. DelawareCredant Technologies International, Inc. DelawareCSCAN Acquisition Corp. New YorkDCC Executive Security Inc. DelawareDell America Latina Corp. DelawareDell Asset Revolving Trust DelawareDell Asset Securitization GP L.L.C. DelawareDell Asset Securitization Holding L.P. DelawareDell Colombia Inc. DelawareDell Computer Holdings L.P. TexasDell Conduit Funding L.P. DelawareDell Conduit GP L.L.C. DelawareDell DFS Corporation DelawareDell DFS Holdings L.L.C. DelawareDell Equipment Funding L.P. DelawareDell Equipment GP L.L.C DelawareDell Federal Systems Corporation DelawareDell Federal Systems GP L.L.C. DelawareDell Federal Systems L.P. TexasDell Federal Systems LP L.L.C. DelawareDell Financial Services L.L.C. DelawareDell Funding L.L.C. NevadaDell Global Holdings IV L.L.C. DelawareDell Global Holdings IX L.L.C. DelawareDell Global Holdings L.L.C. DelawareDell Global Holdings VI L.L.C. DelawareDell Global Holdings VII L.L.C. DelawareDell Global Holdings VIII L.L.C DelawareDell Global Holdings X L.L.C DelawareDell International Holdings I L.L.C. DelawareDell International L.L.C. Delaware
1

Other U.S. Entities Jurisdiction Dell Marketing Corporation DelawareDell Marketing GP L.L.C. DelawareDell Marketing L.P. TexasDell Marketing LP L.L.C. DelawareDell Product and Process Innovation Services Corp. DelawareDell Products Corporation DelawareDell Products GP L.L.C. DelawareDell Products L.P. TexasDell Products LP L.L.C. DelawareDell Protective Services Inc. DelawareDell Receivables Corporation DelawareDell Receivables GP L.L.C. DelawareDell Receivables L.P. TexasDell Receivables LP L.L.C. DelawareDell Revolver Company L.P. DelawareDell Revolver Funding L.L.C. NevadaDell Revolver GP. L.L.C. DelawareDell Services Federal Government, Inc. (fka Perot Systems Government Services, Inc.) VirginiaDell USA Corporation DelawareDell USA GP L.L.C. DelawareDell USA L.P. TexasDell USA LP L.L.C. DelawareDell World Trade Corporation DelawareDell World Trade GP L.L.C. DelawareDell World Trade L.P. TexasDell World Trade LP L.L.C. DelawareDFS Funding L.L.C. DelawareDFS-SPV L.L.C. DelawareFastlane Technologies Corporation DelawareForce10 Networks Global, Inc. DelawareForce10 Networks International, Inc. DelawareForce10 Networks, Inc. DelawareFvision Acquisition Corp (fka Teqio Resources, Inc) NevadaGale Technologies, Inc. CaliforniaImceda Software Inc DelawareInvirtus, Inc. DelawareLicense Technologies Group, Inc. DelawareMagnum Technologies, Inc. MinnesotaNetPro Computing Canada, Inc. ArizonaNetPro Computing France, Inc. ArizonaNetPro Computing Germany, Inc. ArizonaNetPro Computing UK, Inc. ArizonaNetPro Computing, Inc. DelawareNetPro Engineering, Inc. ArizonaNetPro Europe, Inc. ArizonaPacketTrap Networks,Inc DelawarePerot Systems Application Solutions Inc. DelawarePerot Systems Communications Services, Inc. Delaware
2

Other U.S. Entities Jurisdiction Perot Systems Corporation TexasPrSM Corporation TennesseePSC GP Corporation DelawarePSC Healthcare Software, Inc. DelawarePSC LP Corporation DelawarePSC Management Limited Partnership TexasPSM Holdings 1 L.L.C. DelawarePSM Holdings 2 L.L.C. DelawareQuest Holding Company, LLC CaliforniaQuest Software Public Sector Inc DelawareQuest Software, Inc. DelawareQuikCycle Inc. CaliforniaSafari I, Inc DelawareSafari II GP LLC DelawareSafari II, Inc DelawareScriptLogic Corporation DelawareSecureWorks Holding Corp. GeorgiaSecureWorks Inc. GeorgiaSmarsh CRM Service, Inc. (fka iNation, Inc.) ArizonaSmarsh, Inc. New YorkSonicWALL L.L.C. DelawareSymlabs Inc. DelawareTransaction Applications Group, Inc. NebraskaTurin Networks International, Inc. DelawareVintela, Inc. UtahVirtualFabrix, Inc CaliforniaVizioncore IllinoisVkernel Corp. DelawareWyse International L.L.C. DelawareWyse Technology L.L.C. Delaware
3

Americas International Jurisdiction 1397639 Ontario, Inc Canada881229 Alberta ULC (changed suffix from Ltd) CanadaAlienware Latin America, S.A (Renamed Dell Costa Rica SA) Costa RicaBolts Acq. Corp. CanadaCanada Branch of Perot Systems Corporation CanadaCorporacion Dell de Venezuela SA VenezuelaCredant Technologies, Inc. CanadaDell America Latina Corp., Argentina Branch ArgentinaDell Canada Inc. CanadaDell Colombia Inc., Colombia Branch ColombiaDell Computadores do Brasil Ltda. BrazilDell Computer de Chile Ltda. ChileDell Computer Services de Mexico SA de CV MexicoDell DFS Canada Inc. CanadaDell Export Sales Corporation BarbadosDell Global Holdings III L.P. Cayman IslandsDell Global Holdings Ltd. Cayman IslandsDell Guatemala Ltda GuatemalaDell Honduras S de RL de CV HondurasDell Mexico, S.A. de C.V. MexicoDell Panama S. de R.L. PanamaDell Perú, SAC PeruDell Puerto Rico Corp. Puerto RicoDell Quebec Inc. CanadaDell Technology Services Inc. S.R.L. Costa RicaDell Trinidad and Tobago Limited Trinidad and TobagoForce10 International, Ltd. Cayman IslandsMake Technologies Inc. CanadaPerot Systems TSI (Bermuda) Ltd. BermudaQuest Software Canada (fka Fast Lane Techn., Inc.) CanadaQuest Software Mexico S de R.L. de C.V. MexicoQuest Software, Ltd BrazilSafari Limited II LP CanadaSafari Limited Partnership CanadaSonicWALL BV - Canada Branch CanadaSonicWALL Mexico, S de RL de CV MexicoTrellia Networks, Inc. CanadaTXZ Holding Company Limited BermudaWyse Technology (Canada) Ltd. CanadaWyse Technology Holdings (Cayman) Ltd. Cayman IslandsWyse Techonology S.A de C.V. Mexico
4

Europe, Middle East & Africa Jurisdiction Abu Dhabi Branch of PSC Healthcare Software, Inc. Abu DhabiAelita Software Limited (UK) UKAelita Software Moscow Branch RussiaAelita Software St Petersbug Branch RussiaAlienware Limited IrelandAventail Europe Ltd UKBakBone Software GmbH GermanyBakBone Software Ltd. UKBakBone Software SARL FranceBracknell Boulevard Management Company Limited United KingdomBranch of Dell (Free Zone Company L.L.C.) Saudi ArabiaChange Base Ltd UKCharonware s.r.o. Czech RepublicCompellent Technologies France Sarl FranceCompellent Technologies Germany GmbH GermanyCompellent Technologies Italy Srl ItalyCompellent Technologies Netherlands BV NetherlandsCredant Technologies Belgium, Inc. (Dormant) BelgiumCredant Technologies GmbH GermanyCredant Technologies UK United KingdomDell (PS) BV (f.k.a. Perot Systems Nederland B.V.) NetherlandsDell (Switzerland) GmbH SwitzerlandDell A.B. SwedenDell A.S. NorwayDell A/S DenmarkDell Asia B.V. NetherlandsDell B.V. NetherlandsDell Computer (Proprietary) Ltd South AfricaDell Computer EEIG United KingdomDell Computer International (II) – Comercio de Computadores Sociedade Unipessoal Lda PortugalDell Computer S.A. SpainDell Computer spol. sro Czech RepublicDell Corporation Limited United KingdomDell Corporation Limited – Northern Ireland Place of Business Northern IrelandDell DFS Holdings Kft. HungaryDell DFS Ltd IrelandDell DFS Ltd. - Spain Branch SpainDell Direct IrelandDell Distribution (EMEA) Limited External Company (Ghana) [renamed Dell Emerging Markets (EMEA) Limited ExternalCompany (Ghana)] GhanaDell Distribution Maroc (Succ) MoroccoDell Emerging Market (EMEA) Ltd (Russia Representative Office) RussiaDell Emerging Markets (EMEA) Limited United KingdomDell Emerging Markets (EMEA) Limited - Egypt Representative Office EgyptDell Emerging Markets (EMEA) Limited – Representative Office RomaniaDell Emerging Markets (EMEA) Limited - Representative Office (Jordan) JordanDell Emerging Markets (EMEA) Limited - Representative Office (Republic of Croatia) CroatiaDell Emerging Markets (EMEA) Limited (Kazakhstan Representative Office) KazakhstanDell Emerging Markets (EMEA) Limited (Uganda Representative Office) Uganda
5

Europe, Middle East & Africa Jurisdiction Dell Emerging Markets (EMEA) Limited Magyarorszagi Kereskedelmi Kepviselet – Rep. Office HungaryDell Emerging Markets (EMEA) Limited Representative Office - Lebanon LebanonDell Emerging Markets (EMEA) Limited Trade Representative Office (Bulgaria) BulgariaDell FZ – LLC U.A.E.Dell FZ -LLC - Qatar Branch QatarDell FZ-LLC – Bahrain Branch BahrainDell Gesm.b.H. AustriaDell Global B.V. NetherlandsDell Global Holdings II BV NetherlandsDell Global Holdings III BV NetherlandsDell Global International B.V. NetherlandsDell GmbH GermanyDell Halle GmbH GermanyDell Hungary Technology Solutions Trade LLC HungaryDell III – Comercio de Computadores, Unipessoal LDA PortugalDell International Holdings IX B.V. NetherlandsDell International Holdings Kft. HungaryDell International Holdings SAS FranceDell International Holdings VIII B.V. NetherlandsDell International Holdings X B.V. NetherlandsDell International Holdings XII Coöperatoef U.A. NetherlandsDell International Services SRL RomaniaDell L.L.C. RussiaDell N.V. BelgiumDell Products IrelandDell Products (Europe) B.V. NetherlandsDell Products (Poland) Sp. z o.o PolandDell Products Manufacturing Ltd. IrelandDell Research IrelandDell S.A. SwitzerlandDell S.A. FranceDell S.p.A. ItalyDell s.r.o. SlovakiaDell SA LuxembourgDell SAS MoroccoDell Services GmbH (FKA. Perot Systems (Germany) GmbH) GermanyDell Services S.r.l. ItalyDELL SOLUTIONS (UK) LTD United KingdomDell Sp.z.o.o. PolandDell Taiwan B.V. NetherlandsDell Technology & Solutions (Nigeria) Limited NigeriaDell Technology & Solutions Israel Ltd. IsraelDell Technology & Solutions Ltd. (Formerly Original Solutions Limited) IrelandDell Technology Products and Services S.A GreeceDell Teknoloji Limited Şirketi TurkeyDFS BV NetherlandsDIH IX CV NetherlandsDIH VI CV Netherlands
6

Europe, Middle East & Africa Jurisdiction DIH VII CV NetherlandsDIH VIII CV NetherlandsDIH X CV NetherlandsFastlane Technologies UK UKForce10 Networks Germany (Branch) GermanyForce10 Networks Ltd. UKFresh Dew Investments Ltd. British Virgin IslandsLecco Technology (UK) Limited UKLLC Dell Ukraine UkraineLumenare Networks Mauritius Ltd. MauritiusMurecia Investments Ltd British Virgin IslandsOptiGrowth Capital Sarl (fka Quest Capital Sarl) LuxemburgOy Dell A.B. FinlandPassGo Technologies Ltd UKPassGo Technologies Trustees Ltd UKPerot Systems (Switzerland) GmbH SwitzerlandPerot Systems (UK) Ltd. United KingdomPerot Systems B.V. NetherlandsPerot Systems Europe Limited United KingdomPerot Systems Investments B.V. NetherlandsPerot Systems TSI (Hungary) Liquidity Management LLC HungaryPerot Systems TSI (Mauritius) Pvt. Ltd. MauritiusPerot Systems TSI (Netherlands) B.V. NetherlandsQ.S.I. Quest Software Israel Limited IsraelQSFT Svenska AB SwedenQuest Holdings Sarl LuxemburgQuest Scandinavia AS DenmarkQuest Software (UK) Ltd. UKQuest Software Belgium BelgiumQuest Software Company Limited Jersey (Non-resident Irish)Quest Software Espana, SL SpainQuest Software France Sarl FranceQuest Software Gmbh GermanyQuest Software Int’l Limited (fka QS Ireland Ltd.) IrelandQuest Software Italia Srl ItalyQuest Software Netherlands B.V. NetherlandsQuest Software Norge A/S NorwayQuest Software Switzerland Gmbh SwitzerlandSecureWorks UK Ltd. UKSecureWorks UK Ltd. - Finland Branch FinlandSoftware Ltd Russia Rep Office RussiaSonicWALL AG SwitzerlandSonicWALL BV NetherlandsSonicWALL BV - Belgium Branch BelgiumSonicWALL BV - Dubai Branch UAESonicWALL BV - France Branch FranceSonicWALL BV - Germany Branch GermanySonicWALL BV - Ireland Branch Ireland
7

Europe, Middle East & Africa Jurisdiction SonicWALL BV - Spain Branch SpainSonicWALL BV - Sweden Branch SwedenSonicWALL BV - UK Branch UKSupport Center, BV (pka Sitraka) NetherlandsSymlabs Espana, S.L. SpainSymlabs S.A. Portugal PortugalWyse Technology (UK), LTD UKWyse Technology Gmbh Germany GermanyWyse Technology International B.V. NetherlandsWyse Technology SA France France
8

Asia-Pacific & Japan Jurisdiction Active Concepts PTY AustraliaAlienware Corporation (Pacific Rim), Pty Ltd. AustraliaBakBone Software India Pvt. Ltd. IndiaBearing Point Management Consulting (Shanghai) Ltd. ChinaCredant Technologies International, Inc. AustraliaDell (Chengdu) Company Limited ChinaDell (China) Company Limited ChinaDell (China) Company Limited, Beijing Branch ChinaDell (China) Company Limited, Beijing Liaison Office ChinaDell (China) Company Limited, Chengdu Branch ChinaDell (China) Company Limited, Chengdu Liaison Office ChinaDell (China) Company Limited, Dalian Branch ChinaDell (China) Company Limited, Guangzhou Branch ChinaDell (China) Company Limited, Guangzhou Liaison Office ChinaDell (China) Company Limited, Hangzhou Liaison Office ChinaDell (China) Company Limited, Nanjing Liaison Office ChinaDell (China) Company Limited, Shanghai Branch ChinaDell (China) Company Limited, Shanghai Liaison Office ChinaDell (China) Company Limited, Shenzhen Liaison Office ChinaDell (China) Company Limited, Xiamen Branch ChinaDell (Xiamen) Company Limited ChinaDell (Xiamen) Company Limited, Dalian Branch ChinaDell Asia Holdings Pte. Ltd. SingaporeDell Asia Pacific Sdn Bhd (Pakistan Liaison Office) PakistanDell Asia Pacific Sdn. MalaysiaDell Asia Pacific Sdn. Philippines Representative Office PhilippinesDell Asia Pte. Ltd. SingaporeDell Australia Pty. Limited AustraliaDell B.V., Taiwan Branch TaiwanDell Corporation (Thailand) Co., Ltd. ThailandDell Global B.V., Singapore Branch SingaporeDell Global Business Center Sdn. Bhd. MalaysiaDell Global BV (Bangladesh Representative Office) BangladeshDell Global BV (Indonesia Representative Office) IndonesiaDell Global BV (Pakistan Liaison Office) PakistanDell Global BV (Philippines Representative Office) PhilippinesDell Global BV (Sri-Lanka Representative Office) Sri LankaDell Global BV (Vietnam Representative Office), renamed Dell Global BV (Hanoi Representative Office) VietnamDell Global Pte. Ltd. SingaporeDell Hong Kong Limited Hong KongDell India (Sales & Marketing) Private Limited IndiaDell India Private Ltd. IndiaDell Information Technology (Hunan) Company Limited ChinaDell Information Technology (Kunshan) Company Limited ChinaDell International Inc. South KoreaDell International Services India Private Limited (f.k.a. Perot Systems TSI (India) Private Limited) IndiaDell International Services Philippines Inc. PhilippinesDell Japan Inc. Japan
9

Asia-Pacific & Japan Jurisdiction Dell New Zealand Limited New ZealandDell Procurement (Xiamen) Company Limited ChinaDell Procurement (Xiamen) Company Limited, Shanghai Branch ChinaDell Procurement (Xiamen) Company Limited, Shenzhen Liaison Office ChinaDell Sales Malaysia Sdn Bhd MalaysiaDell Services (China) Company Limited ChinaDell Services Pte. Ltd. (f/k/a Perot Systems (Singapore) Pte. Ltd.) SingaporeDell Singapore Pte. Ltd. SingaporeDell Taiwan B.V., Taiwan Branch TaiwanEqualLogic Japan Company Limited JapanForce10 Networks (Shanghai) Ltd. ChinaForce10 Networks Hong Kong (Branch) Hong KongForce10 Networks India Pvt. Ltd. IndiaForce10 Networks Malaysia (Branch) MalaysiaForce10 Networks Singapore Pte. Ltd. SingaporeGale Networks Private Limited IndiaImceda Software Australia Pty. Ltd. AustraliaImceda Technologies Pty. Ltd. AustraliaOcarina Networks India Pvt. Ltd. IndiaPerot Systems (Malaysia) Sdn. Bhd. MalaysiaPerot Systems (Shanghai) Consulting Co., Limited ChinaPerot Systems Holdings Pte. Ltd SingaporePT Dell Indonesia IndonesiaQSFT India Private Ltd. Inc IndiaQuest New Zealand Ltd (fka Aftermail NZ) New ZealandQuest Software (Zhuhai) Ltd. (fka Lecco Tech China) ChinaQuest Software Beijing Company Limited ChinaQuest Software Greater China Limited Hong KongQuest Software Japan Ltd JapanQuest Software Korea Ltd. KoreaQuest Software Limited (fka Lecco Tech Limited) Hong KongQuest Software Pty. Ltd. AustraliaQuest Software Sales Sdn Bhd MalaysiaQuest Software Singapore Pty Limited SingaporeScriptLogic Australia AustraliaSonicWALL BV - Australia Branch AustraliaSonicWALL BV - Beijing Rep. Office ChinaSonicWALL BV - Hong Kong Branch Hong KongSonicWALL BV - India Branch IndiaSonicWALL BV - Japan Branch JapanSonicWALL BV - Korea Branch South KoreaSonicWALL BV - Singapore Branch SingaporeSonicWALL BV - Taiwan Branch TaiwanSonicWALL Infosecurity Private Limited IndiaSonicWall Services Private Limited IndiaSonicWALL Shanghai Limited ChinaTurin Networks India Pvt. Ltd. IndiaVintela Australia Pty., Ltd (fka Wedgetail Comm) Australia
10

Asia-Pacific & Japan Jurisdiction Vintela Pty, Ltd AustraliaWyse Australia Pty. Ltd Australia AustraliaWyse Technology (Beijing) Co. Ltd China ChinaWyse Technology KK Japan JapanWyse Technology Ltd Taiwan TaiwanWyse Technology Sales & Marketing India Private Ltd. IndiaWyse Technology Singapore Pte Ltd SingaporeWyse Techonology China (HK) Ltd. Hong KongWyse Techonology Software Development India Private Ltd. India
11

EXHIBIT 23
CONSENT OF INDEPENDENT REGISTERED PUBLIC ACCOUNTING FIRM
We hereby consent to the incorporation by reference in the Registration Statements on Form S ‑3 (No. 333-172872) and Form S-8 (Nos. 033-54583, 033-63273,333-58039, 333-66415, 333-49014, 333-49016, 333-69724, 333-69726, 333-100342, 333-111214, 333-147882, 333-158216, 333-177202, 333-182758, and333-184945) of Dell Inc. of our report dated March 12, 2013 relating to the financial statements, and the effectiveness of internal control over financialreporting, which appears in this Form 10 ‑K.
/s/ PRICEWATERHOUSECOOPERS LLP
Austin, TexasMarch 12, 2013

EXHIBIT 31.1
CERTIFICATION OF MICHAEL S. DELL, CHAIRMAN ANDCHIEF EXECUTIVE OFFICER, PURSUANT TO RULE 13a-14(a) UNDER
THE SECURITIES EXCHANGE ACT OF 1934, AS ADOPTEDPURSUANT TO SECTION 302 OF THE SARBANES-OXLEY ACT OF 2002
I, Michael S. Dell, certify that:
1. I have reviewed this Annual Report on Form 10-K of Dell Inc.;
2. Based on my knowledge, this report does not contain any untrue statement of a material fact or omit to state a material fact necessary to make thestatements made, in light of the circumstances under which such statements were made, not misleading with respect to the period covered by this report;
3. Based on my knowledge, the financial statements, and other financial information included in this report, fairly present in all material respects thefinancial condition, results of operations and cash flows of the registrant as of, and for, the periods presented in this report;
4. The registrant's other certifying officer(s) and I are responsible for establishing and maintaining disclosure controls and procedures (as defined inExchange Act Rules 13a-15(e) and 15d-15(e)) and internal control over financial reporting (as defined in Exchange Act Rules 13a-15(f) and 15d-15(f))for the registrant and have:
(a) Designed such disclosure controls and procedures, or caused such disclosure controls and procedures to be designed under our supervision, toensure that material information relating to the registrant, including its consolidated subsidiaries, is made known to us by others within thoseentities, particularly during the period in which this report is being prepared;
(b) Designed such internal control over financial reporting, or caused such internal control over financial reporting to be designed under our supervision,to provide reasonable assurance regarding the reliability of financial reporting and the preparation of financial statements for external purposes inaccordance with generally accepted accounting principles;
(c) Evaluated the effectiveness of the registrant's disclosure controls and procedures and presented in this report our conclusions about the effectivenessof the disclosure controls and procedures, as of the end of the period covered by this report based on such evaluation; and
(d) Disclosed in this report any change in the registrant's internal control over financial reporting that occurred during the registrant's most recent fiscalquarter (the registrant's fourth fiscal quarter in the case of an annual report) that has materially affected, or is reasonably likely to materially affect,the registrant's internal control over financial reporting; and
5. The registrant's other certifying officer(s) and I have disclosed, based on our most recent evaluation of internal control over financial reporting, to theregistrant's auditors and the audit committee of the registrant's board of directors (or persons performing the equivalent functions):
(a) All significant deficiencies and material weaknesses in the design or operation of internal control over financial reporting which are reasonably likelyto adversely affect the registrant's ability to record, process, summarize and report financial information; and
(b) Any fraud, whether or not material, that involves management or other employees who have a significant role in the registrant's internal control overfinancial reporting.
March 12, 2013 /s/ MICHAEL S. DELL Michael S. Dell Chairman and Chief Executive Officer

EXHIBIT 31.2
CERTIFICATION OF BRIAN T. GLADDEN, SENIOR VICE PRESIDENT ANDCHIEF FINANCIAL OFFICER, PURSUANT TO RULE 13a-14(a) UNDER
THE SECURITIES EXCHANGE ACT OF 1934, AS ADOPTEDPURSUANT TO SECTION 302 OF THE SARBANES-OXLEY ACT OF 2002
I, Brian T. Gladden, certify that:
1. I have reviewed this Annual Report on Form 10-K of Dell Inc.;
2. Based on my knowledge, this report does not contain any untrue statement of a material fact or omit to state a material fact necessary to make thestatements made, in light of the circumstances under which such statements were made, not misleading with respect to the period covered by this report;
3. Based on my knowledge, the financial statements, and other financial information included in this report, fairly present in all material respects thefinancial condition, results of operations and cash flows of the registrant as of, and for, the periods presented in this report;
4. The registrant's other certifying officer(s) and I are responsible for establishing and maintaining disclosure controls and procedures (as defined inExchange Act Rules 13a-15(e) and 15d-15(e)) and internal control over financial reporting (as defined in Exchange Act Rules 13a-15(f) and 15d-15(f))for the registrant and have:
(a) Designed such disclosure controls and procedures, or caused such disclosure controls and procedures to be designed under our supervision, toensure that material information relating to the registrant, including its consolidated subsidiaries, is made known to us by others within thoseentities, particularly during the period in which this report is being prepared;
(b) Designed such internal control over financial reporting, or caused such internal control over financial reporting to be designed under our supervision,to provide reasonable assurance regarding the reliability of financial reporting and the preparation of financial statements for external purposes inaccordance with generally accepted accounting principles;
(c) Evaluated the effectiveness of the registrant's disclosure controls and procedures and presented in this report our conclusions about the effectivenessof the disclosure controls and procedures, as of the end of the period covered by this report based on such evaluation; and
(d) Disclosed in this report any change in the registrant's internal control over financial reporting that occurred during the registrant's most recent fiscalquarter (the registrant's fourth fiscal quarter in the case of an annual report) that has materially affected, or is reasonably likely to materially affect,the registrant's internal control over financial reporting; and
5. The registrant's other certifying officer(s) and I have disclosed, based on our most recent evaluation of internal control over financial reporting, to theregistrant's auditors and the audit committee of the registrant's board of directors (or persons performing the equivalent functions):
(a) All significant deficiencies and material weaknesses in the design or operation of internal control over financial reporting which are reasonably likelyto adversely affect the registrant's ability to record, process, summarize and report financial information; and
(b) Any fraud, whether or not material, that involves management or other employees who have a significant role in the registrant's internal control overfinancial reporting.
March 12, 2013 /s/ BRIAN T. GLADDEN Brian T. Gladden Senior Vice President and Chief Financial Officer

EXHIBIT 32.1
CERTIFICATIONS OF MICHAEL S. DELL, CHAIRMAN AND CHIEF EXECUTIVE OFFICER,AND BRIAN T. GLADDEN, SENIOR VICE PRESIDENT
AND CHIEF FINANCIAL OFFICER, PURSUANT TO 18 U.S.C. SECTION 1350,AS ADOPTED PURSUANT TO SECTION 906 OF THE SARBANES-OXLEY ACT OF 2002
The undersigned officers of Dell Inc. hereby certify that (a) Dell Inc.'s Annual Report on Form 10-K for the fiscal year ended February 1, 2013, as filed withthe Securities and Exchange Commission, fully complies with the requirements of Section 13(a) of the Securities Exchange Act of 1934 and (b) informationcontained in the report fairly presents, in all material respects, the financial condition and results of operations of Dell Inc.
Date: March 12, 2013 /s/ MICHAEL S. DELL Michael S. Dell Chairman and Chief Executive Officer
Date: March 12, 2013 /s/ BRIAN T. GLADDEN Brian T. Gladden Senior Vice President and Chief Financial Officer