Embed Size (px)
Citation preview
E-ASSOC: ENHANCED ENERGY EFFICIENT USERASSOCIATION ALGORITHM FOR FUTURE
CELLULAR NETWORKS
by
MAREESH KUMAR ISSAR
A thesis submitted to the
School of Graduate Studies
Rutgers, The State University of New Jersey
In partial fulfillment of the requirements
For the degree of
Master of Science
Graduate Program in Electrical and Computer Engineering
Written under the direction of
Dipankar Raychaudhuri
And approved by
New Brunswick, New Jersey
October, 2020
c© 2020
Mareesh Kumar Issar
ALL RIGHTS RESERVED
ABSTRACT OF THE THESIS
E-ASSOC: Enhanced Energy Efficient User ASSOCiation
Algorithm for Future Cellular Networks
By MAREESH KUMAR ISSAR
Thesis Director:
Dipankar Raychaudhuri
Future cellular networks need to reduce their carbon footprint in view of rapidly increas-
ing data traffic from emerging applications including Augmented Reality (AR)/ Virtual
Reality (VR), autonomous vehicles and Internet of Things (IoT). A potential solution
is the addition of small base stations, overlaid upon the macro base station, installed
at locations encountering traffic hotspot or a coverage gap. However, the addition of
base stations leads to an increase in the overall static network power consumption.
Algorithms for energy efficiency aim to strike a balance between network throughput
and power consumption. In this work, we evaluate several existing optimization based
user association algorithms focusing on load balancing and power minimization metrics.
Verification of the performance for all user association algorithms is carried out using
MATLAB based system level simulator for a network topology comprising of one macro
and four pico base stations considering static users. Motivated by the gains demon-
strated using optimization based schemes, we consider the design of a lower complexity
class of heuristic user association algorithms with comparable performance. The pro-
posed E-ASSOC algorithm utilizes load at each base station and the difference amongst
ii
the two best Signal to Noise Ratios (SNRs) for each user as its threshold metrics. Sim-
ulation results demonstrate a gain of 41.26% in the total system throughput along
with reduction of 32.96% in the system power consumption. Eventually indicating
an increase of 87.83% in energy efficiency over the baseline max-SNR based associa-
tion algorithm along with decrease of 7.2% for load balancing algorithm and 10.13%
for power minimization algorithm. Fairness of the algorithms examined using Jain’s
Fairness Index (JFI) also shows marked improvement over the baseline scheme.
iii
Acknowledgements
First and foremost, I would like to thank my advisor Professor Dipankar Raychaudhuri
for his patience and constant guidance. He is the best advisor I could have asked for.
Despite his busy schedule, he always had time to answer my professional and personal
queries by providing nuggets of information whenever I got stuck. He has always been
a constant source of motivation and his advice on focusing on fundamentals, trying to
be original and innovative in your work, setting ambitious technology goals for your
work and thinking about the broader impact on society has struck a chord with me.
I would also like to thank my committee members Professor Roy Yates and Professor
Predrag Spasojevic for their valuable feedback, insights, and approach on formulating
and deciphering research problems throughout the duration of this project.
I would also like to express my heartfelt gratitude to all the WINLAB faculty and
staff members especially Ivan Seskar for always squeezing in time from his busy schedule
to respond to my questions.
I am extremely grateful to all my WINLAB labmates - Prasad Netalkar for endless
car journeys, constant mentoring and motivation. Siddharth Rupavatharam for always
being available for discussions on almost any topic. Mohsen Rajabpour, Vishakha
Ramani, Dr. Sumit Maheshwari, Dr. Jiachen Chen, Wuyang Zhang, Mohammad
Yousefvand, and Shalini Choudhury for debugging my work.
Finally, I would like to express my sincere gratitude to my family members especially
my mother and my father for their constant encouragement, support, and unconditional
love. Thank you for everything!
iv
Dedication
To my mother Dr. Pratibha Issar, my father Dr. Sanjeev Kumar Issar and my younger
brother Arnesh Kumar Issar
v
Table of Contents
Abstract . . . . . . . . . . . . . . . . . . . . . . . . . . . . . . . . . . . . . . . . ii
Acknowledgements . . . . . . . . . . . . . . . . . . . . . . . . . . . . . . . . . iv
Dedication . . . . . . . . . . . . . . . . . . . . . . . . . . . . . . . . . . . . . . . v
List of Tables . . . . . . . . . . . . . . . . . . . . . . . . . . . . . . . . . . . . . viii
List of Figures . . . . . . . . . . . . . . . . . . . . . . . . . . . . . . . . . . . . ix
1. Introduction . . . . . . . . . . . . . . . . . . . . . . . . . . . . . . . . . . . 1
1.1. Problem Statement . . . . . . . . . . . . . . . . . . . . . . . . . . . . . . 4
1.2. Main Contributions . . . . . . . . . . . . . . . . . . . . . . . . . . . . . . 6
2. Cellular System Background . . . . . . . . . . . . . . . . . . . . . . . . . 7
2.1. Homogeneous Networks . . . . . . . . . . . . . . . . . . . . . . . . . . . 7
2.2. Heterogeneous Networks . . . . . . . . . . . . . . . . . . . . . . . . . . . 7
2.3. User Association . . . . . . . . . . . . . . . . . . . . . . . . . . . . . . . 9
2.4. Energy Efficiency . . . . . . . . . . . . . . . . . . . . . . . . . . . . . . . 11
3. System Model . . . . . . . . . . . . . . . . . . . . . . . . . . . . . . . . . . 13
3.1. System Assumptions . . . . . . . . . . . . . . . . . . . . . . . . . . . . . 13
3.2. System Model . . . . . . . . . . . . . . . . . . . . . . . . . . . . . . . . . 14
3.3. Performance Evaluation Metrics . . . . . . . . . . . . . . . . . . . . . . 16
3.3.1. Fairness . . . . . . . . . . . . . . . . . . . . . . . . . . . . . . . . 16
3.3.2. System Throughput . . . . . . . . . . . . . . . . . . . . . . . . . 17
3.3.3. System Power Consumption . . . . . . . . . . . . . . . . . . . . . 18
vi
4. User Association Algorithms . . . . . . . . . . . . . . . . . . . . . . . . . 21
4.1. Max-SNR based User Association Algorithm . . . . . . . . . . . . . . . 21
4.2. Load Balancing based User Association Algorithm . . . . . . . . . . . . 22
4.3. Power Minimization based User Association Algorithm . . . . . . . . . . 24
4.4. E-ASSOC User Association Algorithm . . . . . . . . . . . . . . . . . . . 26
5. Evaluation Results . . . . . . . . . . . . . . . . . . . . . . . . . . . . . . . 29
6. Conclusion and Future Work . . . . . . . . . . . . . . . . . . . . . . . . . 33
6.1. Conclusion . . . . . . . . . . . . . . . . . . . . . . . . . . . . . . . . . . 33
6.2. Future Work . . . . . . . . . . . . . . . . . . . . . . . . . . . . . . . . . 33
Bibliography . . . . . . . . . . . . . . . . . . . . . . . . . . . . . . . . . . . . . 34
vii
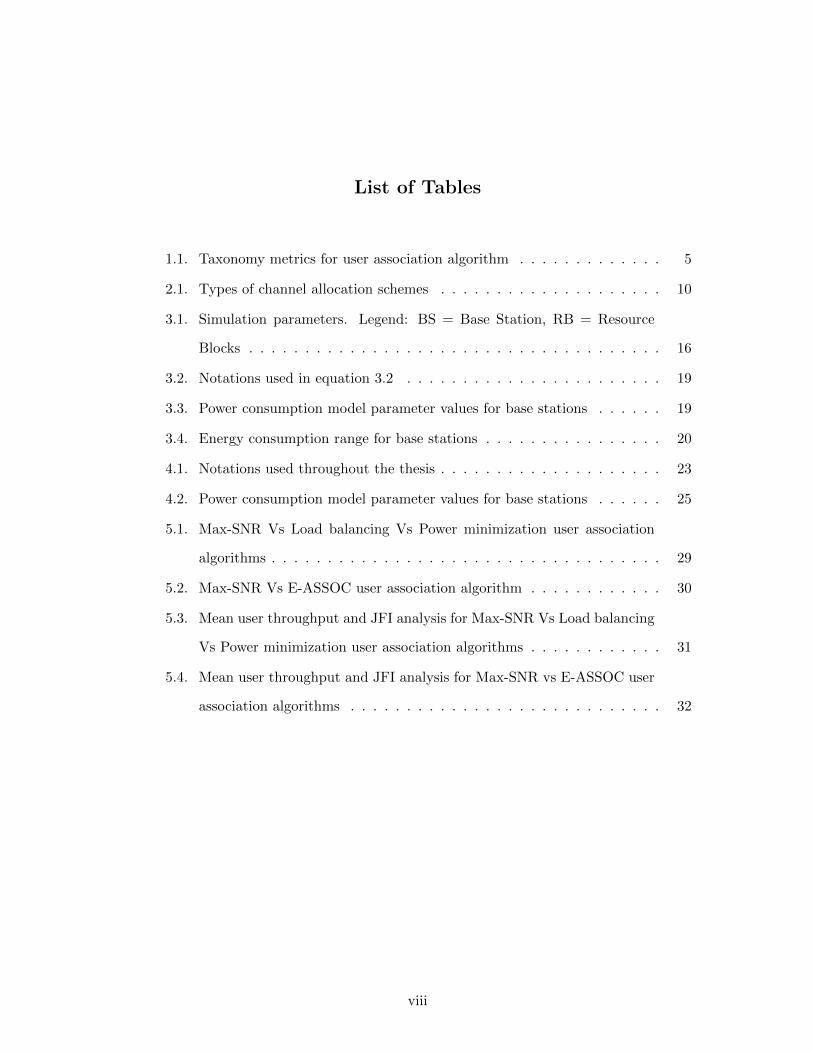
List of Tables
1.1. Taxonomy metrics for user association algorithm . . . . . . . . . . . . . 5
2.1. Types of channel allocation schemes . . . . . . . . . . . . . . . . . . . . 10
3.1. Simulation parameters. Legend: BS = Base Station, RB = Resource
Blocks . . . . . . . . . . . . . . . . . . . . . . . . . . . . . . . . . . . . . 16
3.2. Notations used in equation 3.2 . . . . . . . . . . . . . . . . . . . . . . . 19
3.3. Power consumption model parameter values for base stations . . . . . . 19
3.4. Energy consumption range for base stations . . . . . . . . . . . . . . . . 20
4.1. Notations used throughout the thesis . . . . . . . . . . . . . . . . . . . . 23
4.2. Power consumption model parameter values for base stations . . . . . . 25
5.1. Max-SNR Vs Load balancing Vs Power minimization user association
algorithms . . . . . . . . . . . . . . . . . . . . . . . . . . . . . . . . . . . 29
5.2. Max-SNR Vs E-ASSOC user association algorithm . . . . . . . . . . . . 30
5.3. Mean user throughput and JFI analysis for Max-SNR Vs Load balancing
Vs Power minimization user association algorithms . . . . . . . . . . . . 31
5.4. Mean user throughput and JFI analysis for Max-SNR vs E-ASSOC user
association algorithms . . . . . . . . . . . . . . . . . . . . . . . . . . . . 32
viii
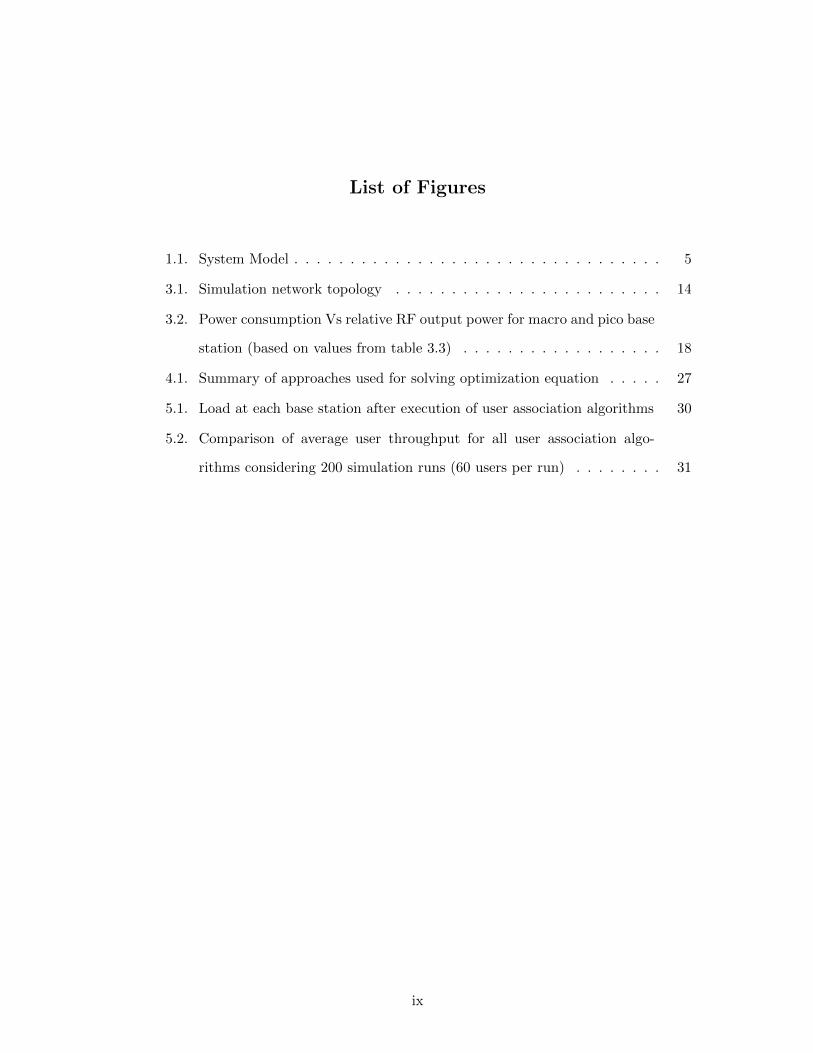
List of Figures
1.1. System Model . . . . . . . . . . . . . . . . . . . . . . . . . . . . . . . . . 5
3.1. Simulation network topology . . . . . . . . . . . . . . . . . . . . . . . . 14
3.2. Power consumption Vs relative RF output power for macro and pico base
station (based on values from table 3.3) . . . . . . . . . . . . . . . . . . 18
4.1. Summary of approaches used for solving optimization equation . . . . . 27
5.1. Load at each base station after execution of user association algorithms 30
5.2. Comparison of average user throughput for all user association algo-
rithms considering 200 simulation runs (60 users per run) . . . . . . . . 31
ix
1
Chapter 1
Introduction
The long-term trend of ever-increasing data demand often follows Cooper’s law, where
the traffic doubles every two-and-a-half year. According to Ericsson’s Mobility Report
[1], by 2025 5G networks will carry about 45% of the world’s mobile data traffic and
have around 2.6 billion subscriptions covering up to 65% of world’s population. A wide
range of upcoming applications like autonomous vehicles, Internet of Things (IoT), and
edge computing all contribute to a substantial data rate and bandwidth requirement.
Fulfillment of the increasing data demands for current as well as emerging cellular
networks is often associated with a surge in network-wide energy consumption. The
2015 report [2] estimates that 1.15% (242 TWh) of the total electricity grid supply
globally was consumed by telecom networks which also resulted in 0.53% (169 Mt) of
the global carbon emissions (energy related). Air conditioning and signal processing
circuits consume about 60% of power dissipated at the base stations [3]. Putting the
base stations with no load into sleep mode helps in saving power consumed by the
network [4]. To reduce power consumption at the base station, 5G New Radio (NR)
takes advantage of base station sleep mode and traffic activity pattern. Other solutions
include the use of energy-saving software and operating site infrastructure proactively
using Artificial Intelligence (AI) [5, 6].
To improve the cellular energy efficiency, without sacrificing Quality-of-Service (QoS)
at the users, the network topology could be densified to enable higher spatial reuse. This
is achieved by overlaying a layer of Small Cell Access points (SCAs) to offload traffic
from macro cells, exploiting the fact that most data traffic is localized. Recent deploy-
ment of city-scale programmable testbeds like COSMOS [7] have enabled researchers
2
to deploy and test their applications and algorithms (pertaining to future wireless net-
works) on such emerging topics in a real-world environment.
The upcoming 5G cellular network is expected to support the following require-
ments:
• Increased demand for data.
• Improved QoS.
• Reduced Energy Consumption.
Key technologies proposed to accomplish these objectives are heterogeneous network
[8], mmWave [9], massive MIMO (Multiple Input and Multiple Output) [10], and Cen-
tralized Radio Access Network (C-RAN). Heterogeneous network (HetNet) consists of
low complexity small cells like picocell, femtocell and relay, deployed inside the macro-
cell coverage region, transmitting at power lower than the macro. These small cells
help to offload traffic and improve the spectral efficiency. Owing to their small size,
they are generally easier to install, run and maintain.
User association refers to the process which determines the base station to which
a user will associate before the data transmission begins. Liu et al. in [11] have
extensively analyzed existing user association algorithms and their impact on various
upcoming technologies for 5G. Traditional user association algorithms tend to attach
users to the base station from which they receive the strongest signal [12]. This approach
works adequately for a homogeneous network with a small number of users. But such
a scheme overlooks the possibility of load balancing across lightly loaded neighbouring
base stations. The problem is further intensified in a heterogeneous scenario [13]. The
user association problem morphs itself into the re-association and handover problem
when the users in the system are mobile [14].
In a HetNet scenario, maximum signal strength based association scheme leads to
underutilization of the small cells as most of the users tend to attach to the macro
cell (due to its large transmit power). I. Guvenc [15] proposes the use of biased user
association as a solution to the problem. This technique changes the power received
3
from the pico base station by adding a fixed bias [16]. Okino et al. [17] showed the
importance of an adaptive bias factor for different load scenarios. A major drawback
of this scheme is that users attached to the small cell (using the bias approach) tend
to experience interference from neighbouring macrocell [18]. The issue of interference
can be alleviated using 3GPP enhanced intercell interference coordination (eICIC) via
almost blank subframes (ABSs) [19].
3GPP Release 8/9 Long-Term Evolution (LTE) HetNet [20] analyzed two schemes,
first with open access picocells and the second with closed access femtocell. They
showed that a single picocell can double the area spectral efficiency without impacting
the macro tier whereas femtocell leads to deterioration of performance in both macro
and femto users. Their simulation results was based on actual behaviour of Physical
Downlink Shared Channel (PDSCH) rather than Shannon capacity formula.
In cellular networks we often deal with improving metrics like energy efficiency,
system throughput, reducing latency etc. Often these metrics are inter-related to one
another i.e. if one improves then the other might deteriorate. Reference [21] describes
the frameworks for handling the trade offs amongst such conflicting metrics. As the
demand for data rises so does the energy consumption of the network. Recently, green
communication techniques have been proposed in order to tackle the issue of the in-
creased power consumption [22]. The term energy efficiency (bits/Joule) can be defined
as the ratio of the total system level throughput to the system level power consumption
[23].
In order to maximize the linear sum of user throughput, the base stations should
serve the users who get the best signal because other users with poor signal quantity
tend to consume more network resources [24]. Thus another important metric while
designing user association algorithm is fairness. Jain’s fairness index is a widely used
metric for fairness evaluation [25]. Reference [24] examined the problem of network-
wide proportional fairness (balancing system throughput while maintaining fairness) by
focusing on a generalized objective function.
Cellular system optimizations are generally modelled as utility maximization prob-
lem with corresponding resource constraints such as QoS constraints, load constraints
4
at base stations etc. The assumption that a user can be associated to only one base
station tends to make the problem combinatorial in nature, which is often NP-Hard. A
widely used method to tackle this issue is by treating the user association variable for
each user to be a real value in the interval [0,1] rather than a binary variable [26].
3GPP release 12 focuses on dual connectivity techniques [27] for improving the
performance related to a mobile user. In dual connectivity, a user receives constant
signalling messages from a macro base station. Simulation and investigation of the
impact of several user association schemes in the presence of dual connectivity has
been presented in [28].
The impact of user mobility in HetNets has been studied in [29] and the results
showed an improvement in the overall network performance using a speed-dependent
bias factor. Authors in [30] proposed a distributed user association algorithm based
on an online reinforcement learning based approach for implementing load balancing in
vehicular networks using spatial-temporal traffic pattern.
Recent work like [31] focus on ultra reliable and low latency communication (URLLC)
in HetNet solving jointly the issue of user offloading and resource optimization. Base
station sleeping strategy based on traffic estimated at the base station using machine
learning techniques has been analyzed in [32].
1.1 Problem Statement
User association algorithms have been widely studied [11] for their pivotal role in im-
proving the spectrum efficiency, load balancing and energy efficiency of networks. En-
ergy efficiency is defined as the ratio of total network throughput to total network
power consumption. Several works have proposed and analyzed optimization based
approaches for increasing the network throughput (while maintaining fairness) [26] and
reducing the network level power consumption (while maintaining QoS) [33]. A major
drawback of such approaches is the computational complexity and large time duration
spent on computing the near-optimal values. Thus, the goal of this work is to improve
the energy efficiency for cellular networks by designing a low-complexity heuristic based
5
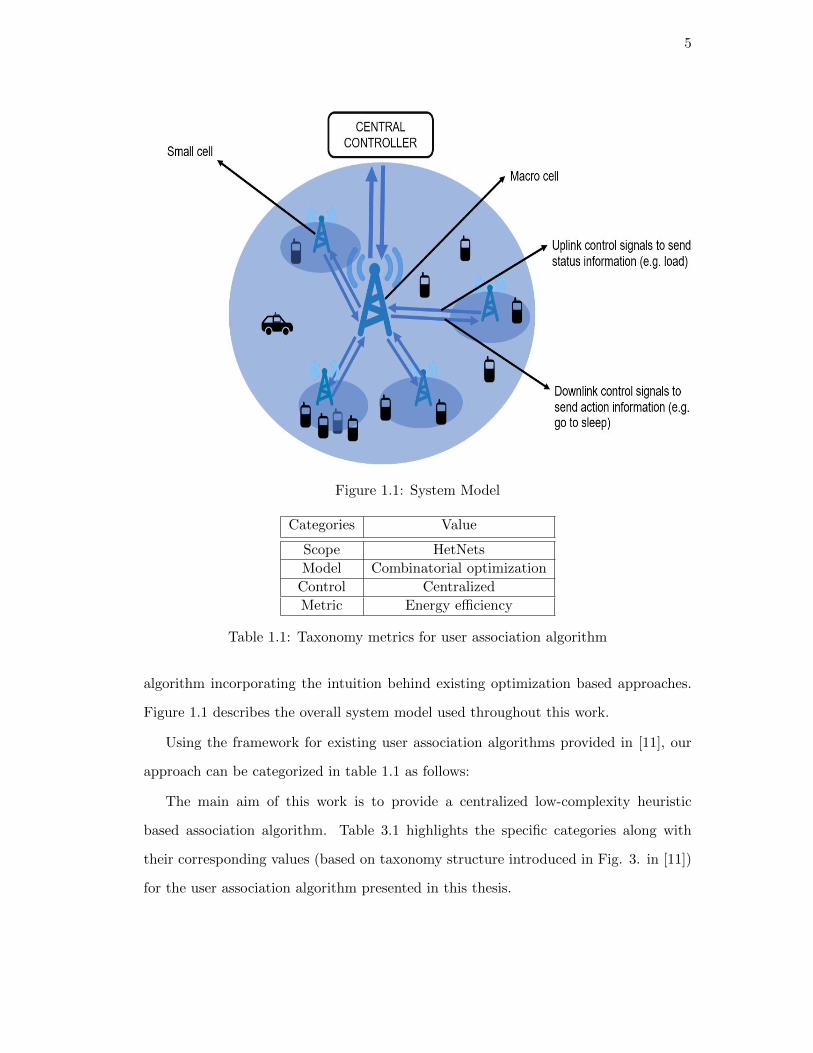
Figure 1.1: System Model
Categories Value
Scope HetNets
Model Combinatorial optimization
Control Centralized
Metric Energy efficiency
Table 1.1: Taxonomy metrics for user association algorithm
algorithm incorporating the intuition behind existing optimization based approaches.
Figure 1.1 describes the overall system model used throughout this work.
Using the framework for existing user association algorithms provided in [11], our
approach can be categorized in table 1.1 as follows:
The main aim of this work is to provide a centralized low-complexity heuristic
based association algorithm. Table 3.1 highlights the specific categories along with
their corresponding values (based on taxonomy structure introduced in Fig. 3. in [11])
for the user association algorithm presented in this thesis.
6
1.2 Main Contributions
The major contributions of this work are as follows:
• Comparison of the performance of several existing optimization based user asso-
ciation algorithms with the baseline max-SNR based association algorithm.
• Design and implementation of a low-complexity centralized heuristic based asso-
ciation scheme to improve the system level energy efficiency.
This work aims to evaluate the performance of optimization based association
algorithms for comparison with the max-SNR based association algorithm. We
present a heuristic based association algorithm derived from the insights obtained
from the optimization based schemes. Detailed MATLAB simulations were carried
out to study the performance of all the user association algorithms and their
impact on the system level performance using metrics like system level energy
efficiency, throughput, power consumption, load at each base station, mean user
throughput and JFI.
7
Chapter 2
Cellular System Background
2.1 Homogeneous Networks
Homogeneous network refers to a cellular network comprising of base stations having
similar capabilities. Cell planning tools often use the concept of frequency reuse for
their effective deployment. The base stations are usually deployed on a standalone
tower or a building rooftop. They usually have a three sector coverage region, with
each sector covering 120◦. In order to meet the rising data traffic demands, cellular
networks utilize several enhancements over homogeneous networks. In this thesis, we
focus our attention on one such enhancement - HetNet.
2.2 Heterogeneous Networks
Traditional networks comprised of macro base stations using a single access technology.
HetNet on the other hand uses a tiered approach where low-power, low-complexity small
base stations are overlaid inside the macro base station’s coverage area. Small base sta-
tions help in addressing the issue of traffic hot spots and coverage gaps while improving
the spectral efficiency and facilitating network infrastructure scaling. Operators usually
tend to deploy small base stations in hot spot locations like schools, stadiums or malls.
The operator is also responsible for providing the necessary backhaul for them.
The different tiers of base station deployment are distinguished primarily based on
their transmit powers [34]. The transmit power for macro base station typically lies in
the range of 5W - 40W. Small cells can be classified into the following types:
• Low power outdoor nodes (250mW – 2W).
8
– Pico base station: These are typically operator owned. They have a smaller
coverage area and lower load capacity as compared to macro base stations.
– Relay node: They are used to enhance the network coverage [35].
• Femto base station: These are suitable for environments where there is a small
variation in the user density, for example in indoor office (with home Digital
Subscriber Line (DSL) or cable modem as their backhaul) and have transmit
power in the range (≤100mW). They can be configured with the following types
of restricted access schemes:
– Open access: In this access scheme any user can connect to the femto base
station.
– Closed access: In this access scheme only registered users can connect to the
femto base station.
– Hybrid access: In this access scheme any user can connect to the femto base
station but registered users will have a higher priority.
In co-channel HetNet deployments (macro and small base stations transmitting at
the same frequency) interference coordination techniques are required. Interference
might also arise from the femto base stations which allow only registered users to
connect to them. Thus macro/small base stations need resource partitioning across
them to mitigate these effects. The resource partitioning is done primarily in the time
domain (best suited in case of limited spectrum), frequency domain (used primarily for
asynchronous networks) or the spatial domain (present in case of Coordinated Multi
Point). For the time domain resource partitioning macro base stations transmits certain
ABS, during which pico base stations transmit. These are primarily decided based on
either the load at the pico base station or the data rate requirement of the users.
An important point to note here is that the macro base station transmits the common
control signals even during ABS. Other slow adaptive interference mitigation techniques
work at a timescale much larger than the scheduling intervals by regulating the transmit
power of the base stations for maximizing the total network utility while satisfying the
Quality of Service (QoS) constraints of the users.
9
2.3 User Association
The process by which a user attaches/connects to a cell tower (macro base station or
small base station) before it starts receiving data is called user association.
Conventional user association mechanisms usually focus on signal strength as their
deciding parameter i.e. the user will attach itself to the base station from which it
receives the strongest signal [36]. A major drawback of this approach is that since
the macro base station transmits at a power that is much higher than the small base
station, we can usually see an unbalanced amount of load (number of users attached to
a base station) on the macro base station in comparison to the small base station. This
imbalance is responsible for hampering the quality of experience for the users connected
to macro base station as it leads to degradation in their received data rates because the
users are now competing for the fixed resource (bandwidth) at the base station. It also
leads to underutilization of resources at the small base station, since they are powered
up and running far below their maximum load capacity.
To mitigate this issue 3GPP suggests a technique called Cell Range Expansion
(CRE). Utilizing this technique the small cell base stations can increase their Reference
Signal Receive Power (RSRP) value such that they are more attractive (in terms of
signal strength) than the macro base station for their nearby users. Finding the exact
value for this bias is not a straightforward task as the bias value changes with various
system parameters like load at base station and distance between the user and the base
station [26].
Depending on the implementation, user association algorithms can be categorised
as follows:
Centralized user association algorithms: Requires a central controller (often
co-located with macro base station) that has the complete overview of a large region
comprising of macro as well as small base stations. A centralized static framework
to study the relation of user association and resource allocation in HetNet (focusing
on global proportional fairness metric) was proposed in [37]. Co-channel deployment,
orthogonal deployment and partially shared/overlap deployment (shown in table 2.1)
10
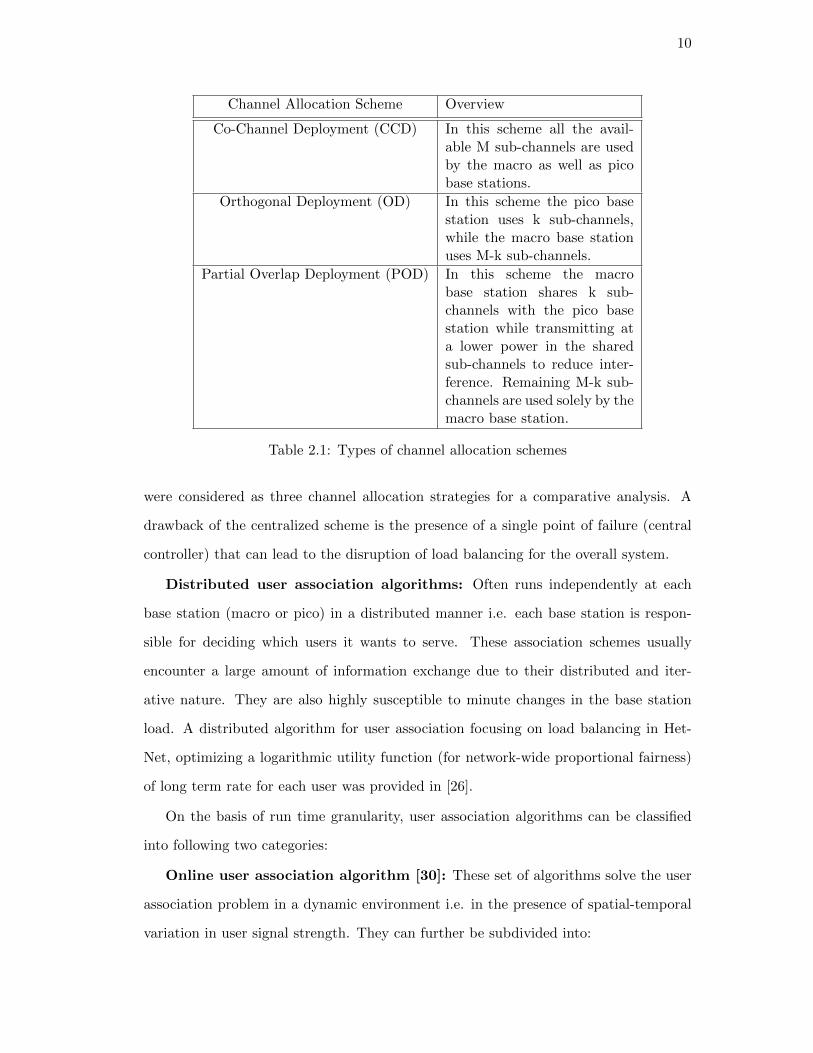
Channel Allocation Scheme Overview
Co-Channel Deployment (CCD) In this scheme all the avail-able M sub-channels are usedby the macro as well as picobase stations.
Orthogonal Deployment (OD) In this scheme the pico basestation uses k sub-channels,while the macro base stationuses M-k sub-channels.
Partial Overlap Deployment (POD) In this scheme the macrobase station shares k sub-channels with the pico basestation while transmitting ata lower power in the sharedsub-channels to reduce inter-ference. Remaining M-k sub-channels are used solely by themacro base station.
Table 2.1: Types of channel allocation schemes
were considered as three channel allocation strategies for a comparative analysis. A
drawback of the centralized scheme is the presence of a single point of failure (central
controller) that can lead to the disruption of load balancing for the overall system.
Distributed user association algorithms: Often runs independently at each
base station (macro or pico) in a distributed manner i.e. each base station is respon-
sible for deciding which users it wants to serve. These association schemes usually
encounter a large amount of information exchange due to their distributed and iter-
ative nature. They are also highly susceptible to minute changes in the base station
load. A distributed algorithm for user association focusing on load balancing in Het-
Net, optimizing a logarithmic utility function (for network-wide proportional fairness)
of long term rate for each user was provided in [26].
On the basis of run time granularity, user association algorithms can be classified
into following two categories:
Online user association algorithm [30]: These set of algorithms solve the user
association problem in a dynamic environment i.e. in the presence of spatial-temporal
variation in user signal strength. They can further be subdivided into:
11
• Periodic online user association algorithms - These algorithms run periodically
after a fixed period of time.
• Trigger-based online user association algorithms - These algorithms run only when
a certain predefined event has occurred.
Offline user association algorithm [37]: These algorithms solve the user asso-
ciation problem in a static environment considering a snapshot (for a particular time
instance) of the overall system.
Formulating and solving user association problems using convex optimization tech-
niques for networks with modest size and complexity becomes computationally intensive
especially for their real time implementation. Thus a low-complexity heuristic based
association scheme [33] (showing performance close to optimal schemes) is preferable
for deployment in a real-world scenario.
2.4 Energy Efficiency
Energy efficiency of a cellular network is often described by the ratio of system level
throughput to system level power consumption. Two prominent technologies that aid in
enhancing the energy efficiency are small cells and massive MIMO. Small cells improve
the performance of the network by reducing the distance between the base station and
the user, thereby improving the SNR and energy efficiency [38]. We often face a trade-
off while deploying small cells as adding more small cells increases the static part of
power consumption which is not in our control, thus we aim to reduce the dynamic
part (load dependent) by as much as possible. Power consumption can also be reduced
by switching some of the small cells to sleep mode. Massive MIMO improves the
energy efficiency by adding more antennas at the base station and using sophisticated
techniques like beamforming allowing spatial multiplexing of users and/or higher SNR.
Recent works like [39] have studied the impact of base station equipped with re-
newable energy supply in a HetNet environment. Such base stations are often focused
on using the harvested energy to the fullest rather than the traditional on-grid power
supply. A low complexity centralized green energy aware user association scheme that
12
offloads users from base stations having low green energy to ones having larger green
energy (without violating the minimum data rate for each user) was presented in [33].
13
Chapter 3
System Model
3.1 System Assumptions
We make the following assumptions for our system model:
• Analysis is done on the downlink signal because a macro base station, uses 87%
of its total power consumption for downlink communication but only 13% is used
for uplink [40].
• All the users are stationary (when the snapshot of the system is observed) and
automatically attach to the macro base station when pico base stations are fully
loaded or in sleep/turned off mode.
• Macro base station and pico base stations (with non-overlapping coverage area)
transmit at different frequencies to avoid cross-tier interference.
• For simplification purpose, perfect backhaul and channel conditions (in the ab-
sence of fast fading) are assumed for the duration of the algorithm.
• All the base stations are considered to be active/switched on. They are transmit-
ting at all times with their maximum transmit power (fixed and known a priori).
• Macro base station cannot be overloaded i.e. it can support all the users present
in the system. The maximum load capacity for the pico base station is assumed
to be 1/macro pico load factor [41, 42].
• A user can only be associated to a single base station and each base station divides
its allocated bandwidth equally among its users.
14
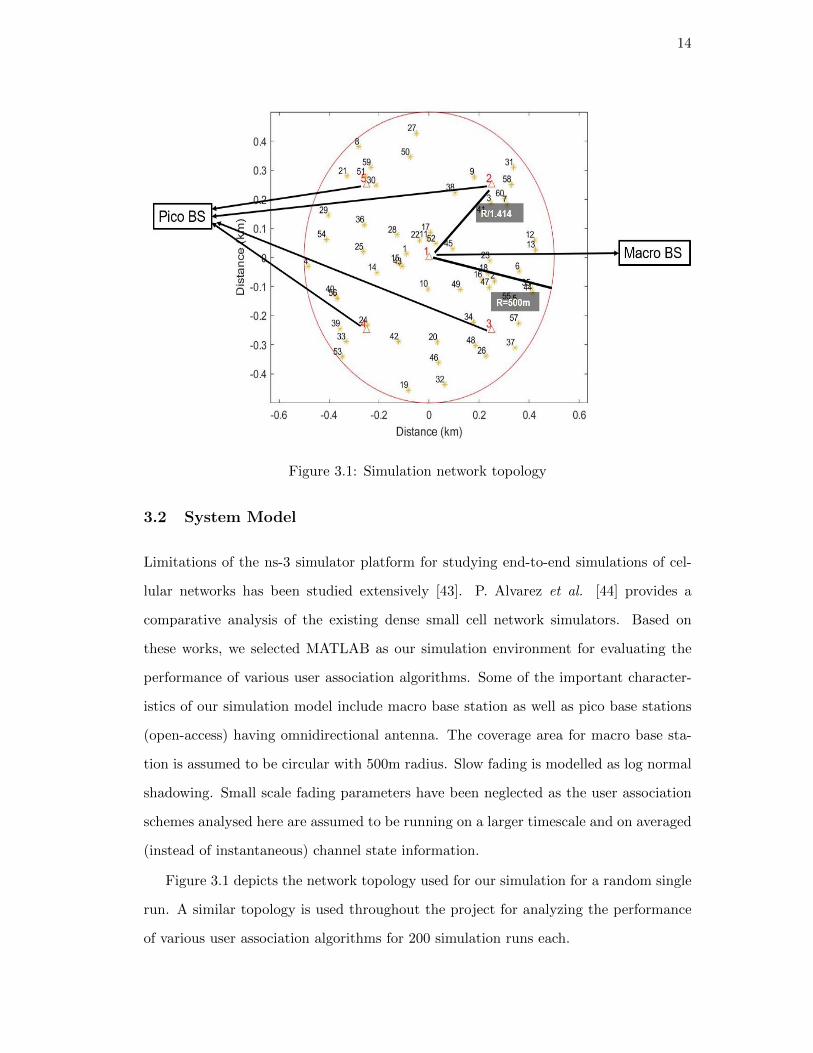
Figure 3.1: Simulation network topology
3.2 System Model
Limitations of the ns-3 simulator platform for studying end-to-end simulations of cel-
lular networks has been studied extensively [43]. P. Alvarez et al. [44] provides a
comparative analysis of the existing dense small cell network simulators. Based on
these works, we selected MATLAB as our simulation environment for evaluating the
performance of various user association algorithms. Some of the important character-
istics of our simulation model include macro base station as well as pico base stations
(open-access) having omnidirectional antenna. The coverage area for macro base sta-
tion is assumed to be circular with 500m radius. Slow fading is modelled as log normal
shadowing. Small scale fading parameters have been neglected as the user association
schemes analysed here are assumed to be running on a larger timescale and on averaged
(instead of instantaneous) channel state information.
Figure 3.1 depicts the network topology used for our simulation for a random single
run. A similar topology is used throughout the project for analyzing the performance
of various user association algorithms for 200 simulation runs each.
15
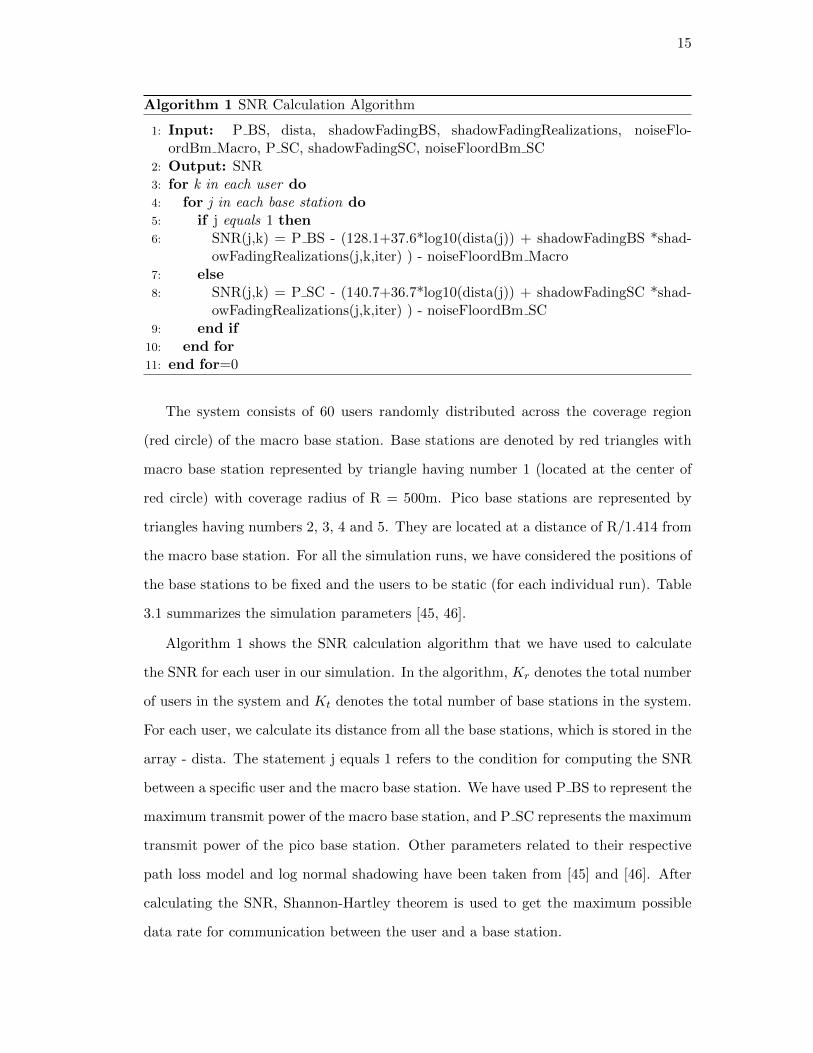
Algorithm 1 SNR Calculation Algorithm
1: Input: P BS, dista, shadowFadingBS, shadowFadingRealizations, noiseFlo-ordBm Macro, P SC, shadowFadingSC, noiseFloordBm SC
2: Output: SNR3: for k in each user do4: for j in each base station do5: if j equals 1 then6: SNR(j,k) = P BS - (128.1+37.6*log10(dista(j)) + shadowFadingBS *shad-
owFadingRealizations(j,k,iter) ) - noiseFloordBm Macro7: else8: SNR(j,k) = P SC - (140.7+36.7*log10(dista(j)) + shadowFadingSC *shad-
owFadingRealizations(j,k,iter) ) - noiseFloordBm SC9: end if
10: end for11: end for=0
The system consists of 60 users randomly distributed across the coverage region
(red circle) of the macro base station. Base stations are denoted by red triangles with
macro base station represented by triangle having number 1 (located at the center of
red circle) with coverage radius of R = 500m. Pico base stations are represented by
triangles having numbers 2, 3, 4 and 5. They are located at a distance of R/1.414 from
the macro base station. For all the simulation runs, we have considered the positions of
the base stations to be fixed and the users to be static (for each individual run). Table
3.1 summarizes the simulation parameters [45, 46].
Algorithm 1 shows the SNR calculation algorithm that we have used to calculate
the SNR for each user in our simulation. In the algorithm, Kr denotes the total number
of users in the system and Kt denotes the total number of base stations in the system.
For each user, we calculate its distance from all the base stations, which is stored in the
array - dista. The statement j equals 1 refers to the condition for computing the SNR
between a specific user and the macro base station. We have used P BS to represent the
maximum transmit power of the macro base station, and P SC represents the maximum
transmit power of the pico base station. Other parameters related to their respective
path loss model and log normal shadowing have been taken from [45] and [46]. After
calculating the SNR, Shannon-Hartley theorem is used to get the maximum possible
data rate for communication between the user and a base station.
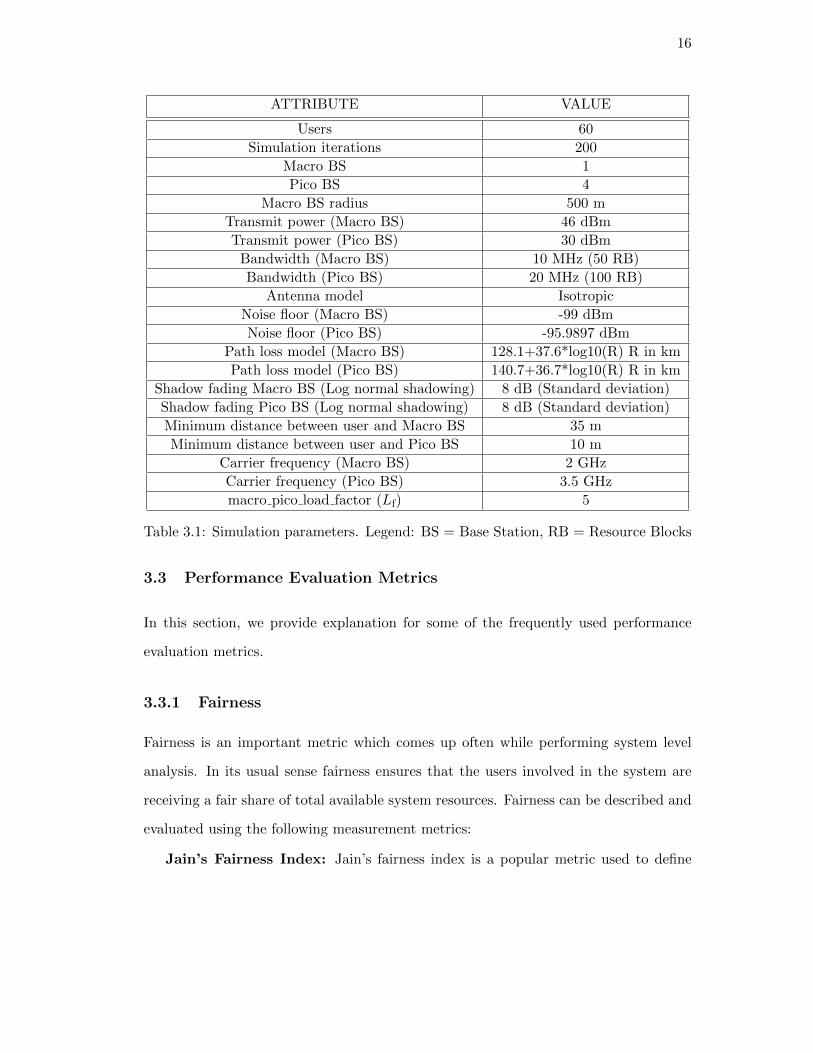
16
ATTRIBUTE VALUE
Users 60
Simulation iterations 200
Macro BS 1
Pico BS 4
Macro BS radius 500 m
Transmit power (Macro BS) 46 dBm
Transmit power (Pico BS) 30 dBm
Bandwidth (Macro BS) 10 MHz (50 RB)
Bandwidth (Pico BS) 20 MHz (100 RB)
Antenna model Isotropic
Noise floor (Macro BS) -99 dBm
Noise floor (Pico BS) -95.9897 dBm
Path loss model (Macro BS) 128.1+37.6*log10(R) R in km
Path loss model (Pico BS) 140.7+36.7*log10(R) R in km
Shadow fading Macro BS (Log normal shadowing) 8 dB (Standard deviation)
Shadow fading Pico BS (Log normal shadowing) 8 dB (Standard deviation)
Minimum distance between user and Macro BS 35 m
Minimum distance between user and Pico BS 10 m
Carrier frequency (Macro BS) 2 GHz
Carrier frequency (Pico BS) 3.5 GHz
macro pico load factor (Lf) 5
Table 3.1: Simulation parameters. Legend: BS = Base Station, RB = Resource Blocks
3.3 Performance Evaluation Metrics
In this section, we provide explanation for some of the frequently used performance
evaluation metrics.
3.3.1 Fairness
Fairness is an important metric which comes up often while performing system level
analysis. In its usual sense fairness ensures that the users involved in the system are
receiving a fair share of total available system resources. Fairness can be described and
evaluated using the following measurement metrics:
Jain’s Fairness Index: Jain’s fairness index is a popular metric used to define
17
and measure fairness. It is defined as:
J (R1, ...Rn, ...RN ) =
(N∑
n=1Rn
)2
N
(N∑
n=1(Rn)2
) (3.1)
where,
N −Number of users
Rn − Throughput ofn-th user
According to the equation 3.1, the index value lies in the range 1/N (worst case) to
1 (best case). When the value of the index is close to 1, it signifies that all the users
in the system are getting equal throughput. A major drawback with this index is that
even if all the users are getting equal rate there might be several users whose demand
is less than the rate they are receiving. This leads to decline of system resources.
User Requirement Satisfaction (URS): In this approach if the network is able
to meet each users demand then the network is said to be fair to all the users. For
implementation purposes we could bin different data demands into predefined categories
of video traffic, VoIP traffic etc. Another variation to this can be the approach where
the network decides and provides each user with a predetermined minimum data rate.
Max-min fairness: The main idea behind max-min fairness is to first fulfill the
demand of the user with the minimum requirement of resources, then fulfill subsequent
demands (arranged in increasing order of their requirement). For example, if the re-
quirements for 4 users are: [2, 2.5, 4, 5] and the total available resources are 10, the
max-min fairness would allocate resources in the following way:
Iteration 1: [2.5, 2.5, 2.5, 2.5]
Iteration 2: [2, 2.66, 2.66, 2.66]
Iteration 3: [2, 2.66, 2.7, 2.7]
3.3.2 System Throughput
A trivial approach, for increasing the total system throughput, is to drop the users with
the lowest signal strength (users near the edge of the network coverage) since they are
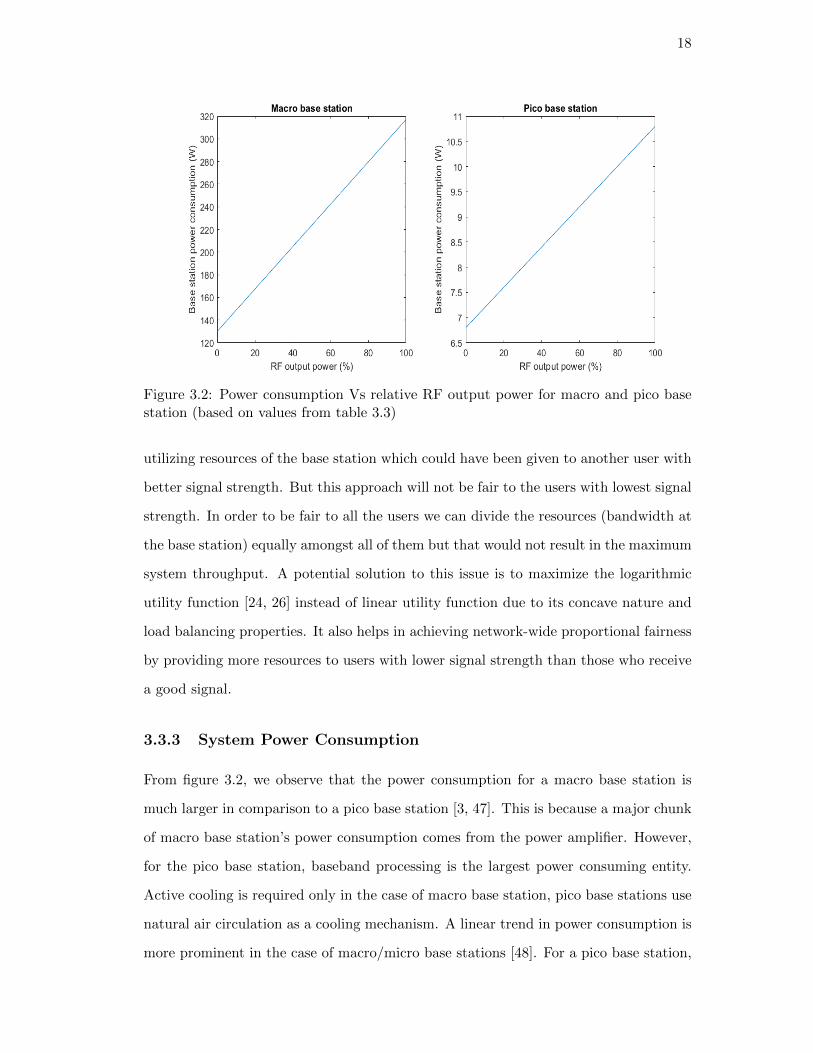
18
Figure 3.2: Power consumption Vs relative RF output power for macro and pico basestation (based on values from table 3.3)
utilizing resources of the base station which could have been given to another user with
better signal strength. But this approach will not be fair to the users with lowest signal
strength. In order to be fair to all the users we can divide the resources (bandwidth at
the base station) equally amongst all of them but that would not result in the maximum
system throughput. A potential solution to this issue is to maximize the logarithmic
utility function [24, 26] instead of linear utility function due to its concave nature and
load balancing properties. It also helps in achieving network-wide proportional fairness
by providing more resources to users with lower signal strength than those who receive
a good signal.
3.3.3 System Power Consumption
From figure 3.2, we observe that the power consumption for a macro base station is
much larger in comparison to a pico base station [3, 47]. This is because a major chunk
of macro base station’s power consumption comes from the power amplifier. However,
for the pico base station, baseband processing is the largest power consuming entity.
Active cooling is required only in the case of macro base station, pico base stations use
natural air circulation as a cooling mechanism. A linear trend in power consumption is
more prominent in the case of macro/micro base stations [48]. For a pico base station,
19
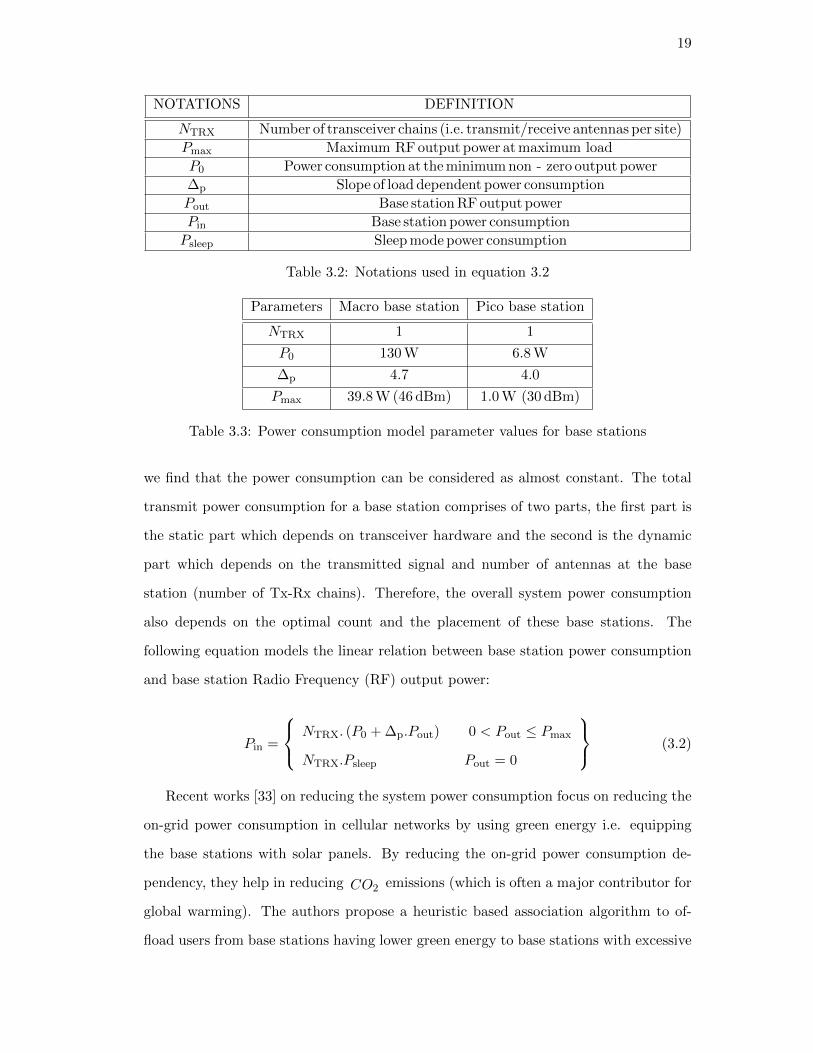
NOTATIONS DEFINITION
NTRX Number of transceiver chains (i.e. transmit/receive antennas per site)
Pmax Maximum RF output power at maximum load
P0 Power consumption at the minimum non - zero output power
∆p Slope of load dependent power consumption
Pout Base station RF output power
Pin Base station power consumption
Psleep Sleep mode power consumption
Table 3.2: Notations used in equation 3.2
Parameters Macro base station Pico base station
NTRX 1 1
P0 130 W 6.8 W
∆p 4.7 4.0
Pmax 39.8 W (46 dBm) 1.0 W (30 dBm)
Table 3.3: Power consumption model parameter values for base stations
we find that the power consumption can be considered as almost constant. The total
transmit power consumption for a base station comprises of two parts, the first part is
the static part which depends on transceiver hardware and the second is the dynamic
part which depends on the transmitted signal and number of antennas at the base
station (number of Tx-Rx chains). Therefore, the overall system power consumption
also depends on the optimal count and the placement of these base stations. The
following equation models the linear relation between base station power consumption
and base station Radio Frequency (RF) output power:
Pin =
NTRX. (P0 + ∆p.Pout) 0 < Pout ≤ Pmax
NTRX.Psleep Pout = 0
(3.2)
Recent works [33] on reducing the system power consumption focus on reducing the
on-grid power consumption in cellular networks by using green energy i.e. equipping
the base stations with solar panels. By reducing the on-grid power consumption de-
pendency, they help in reducing CO2 emissions (which is often a major contributor for
global warming). The authors propose a heuristic based association algorithm to of-
fload users from base stations having lower green energy to base stations with excessive
20
Value Macro base station Pico base station
Minimum power consumption (1% load) 131.87 W 6.84 W
Maximum power consumption (100% load) 317.06 W 10.8 W
Table 3.4: Energy consumption range for base stations
green energy, since solving the optimization problem formulated by them to obtain the
optimal user association was NP-Hard.
21
Chapter 4
User Association Algorithms
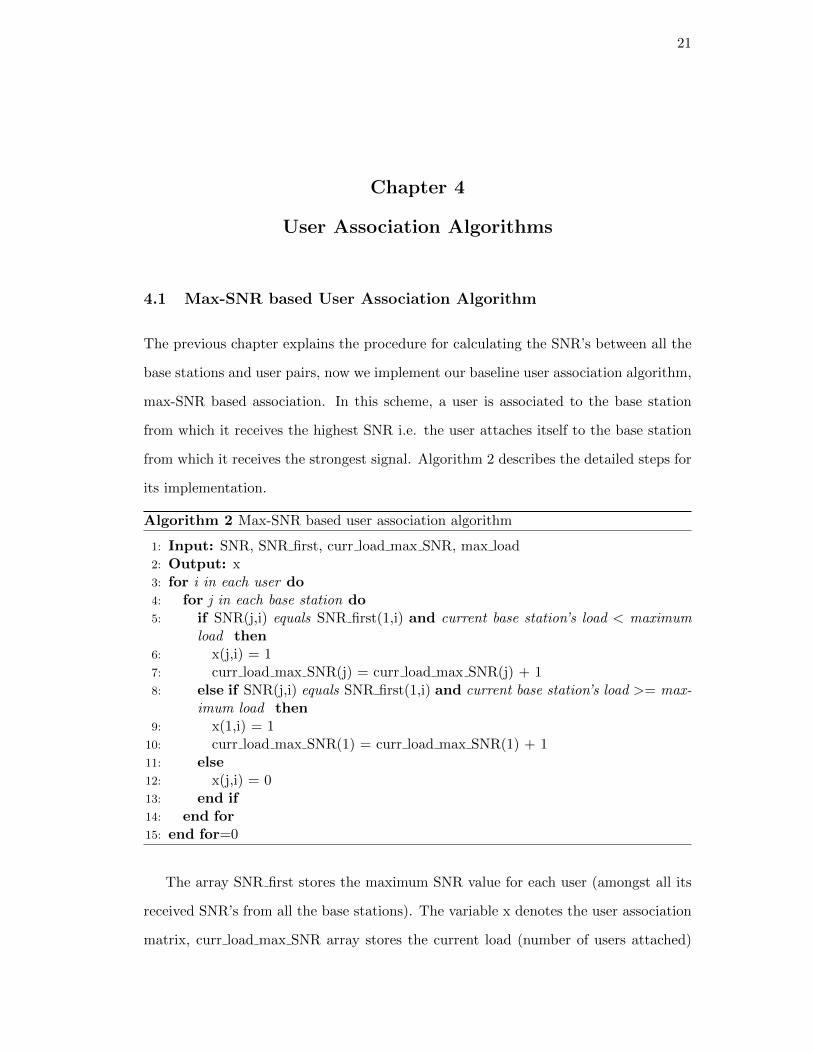
4.1 Max-SNR based User Association Algorithm
The previous chapter explains the procedure for calculating the SNR’s between all the
base stations and user pairs, now we implement our baseline user association algorithm,
max-SNR based association. In this scheme, a user is associated to the base station
from which it receives the highest SNR i.e. the user attaches itself to the base station
from which it receives the strongest signal. Algorithm 2 describes the detailed steps for
its implementation.
Algorithm 2 Max-SNR based user association algorithm
1: Input: SNR, SNR first, curr load max SNR, max load2: Output: x3: for i in each user do4: for j in each base station do5: if SNR(j,i) equals SNR first(1,i) and current base station’s load < maximum
load then6: x(j,i) = 17: curr load max SNR(j) = curr load max SNR(j) + 18: else if SNR(j,i) equals SNR first(1,i) and current base station’s load >= max-
imum load then9: x(1,i) = 1
10: curr load max SNR(1) = curr load max SNR(1) + 111: else12: x(j,i) = 013: end if14: end for15: end for=0
The array SNR first stores the maximum SNR value for each user (amongst all its
received SNR’s from all the base stations). The variable x denotes the user association
matrix, curr load max SNR array stores the current load (number of users attached)
22
at each base station and max load stores the maximum permissible load for each base
station.
Going through all the possible SNR’s for a particular user, if any particular SNR
matches with the maximum SNR for that user and the current load at base station
is less than its maximum load, we set the association matrix as 1 for that particular
user base station pair. If the base station having the best SNR is fully loaded then
we attach the user to the macro base station. Otherwise, we set the association value
as 0 for that user and base station pair. After obtaining the user association matrix
(considering all the users) we use Shannon’s capacity formula to calculate each user’s
maximum throughput.
4.2 Load Balancing based User Association Algorithm
Several association schemes for HetNet are represented by Fig. 2. in [26]. It highlights
the challenges faced using a max-SNR (similar to max-SINR scheme depicted in the
figure) based association scheme. From the figure, we observe that this scheme leads
to a heavily loaded macro base station (shown in the figure by the point from where all
the blue lines originate). This leads to the following major issues:
• Underutilization of resources at the pico base stations because most of the users
are attached to the macro base station (even the users within the range of pico
base station).
• Degradation in the QoS of the users attached to the macro base station because
the bandwidth at the macro base station is fixed and an increase in the number
of users leads to more users competing for it. This leads to a reduction in the
share of bandwidth allocated to each attached user.
The above drawbacks motivated the need for designing a load balancing based user
association algorithm that tries to balance load amongst macro and pico base stations
by shifting users from macro base station to pico base stations. This scheme would also
lead to an increase in the overall system throughput because with the reduction of load
at the macro, users attached to it will experience a throughput gain. Also, the shifted
23
NOTATIONS DEFINITION
Rij Maximum throughput of user i attached to base station j
Bj Bandwidth of the base station j
Rij min Minimum throughput supported by user i attached to base station j
SNRij Signal-to-Noise Ratio of user i attached to base station j
NTRX Number of transceiver chains (i.e. transmit/receive antennas per site)
Pout Base station RF output power
Pin Base station power consumption
Psleep Sleep mode power consumption
Pmax Maximum RF output power at maximum load
∆p Slope of load dependent power consumption
P0 Power consumption at the minimum non - zero output power
U Set of all users {U1, U2, ...}B Set of all base stations {M,S1, S2, ...}xij User association matrix
Kr Total number of users in the system
Kt Total number of base stations in the system
Lf
(Maximum load capacity of macro base stationMaximum load capacity of pico base station
)Table 4.1: Notations used throughout the thesis
users might experience a gain in their throughput as they are now attached to the pico
base station having larger bandwidth than macro thus leading to an efficient use of the
available system resources.
To implement the load balancing scheme [26], we formulate the following optimiza-
tion equation.
maxx
(∑i∈U
∑j∈B
xij log
(Rij∑
k∈Uxkj
))subject to
∑j∈B
xij = 1, ∀i ∈ U
0 ≤ xij ≤ 1, ∀i ∈ U, and ∀j ∈ B∑k∈U
xkj ≤(KrLf
), ∀j ∈ B\M
where,
Rij = Bj log2 (1 + SNRij)
(4.1)
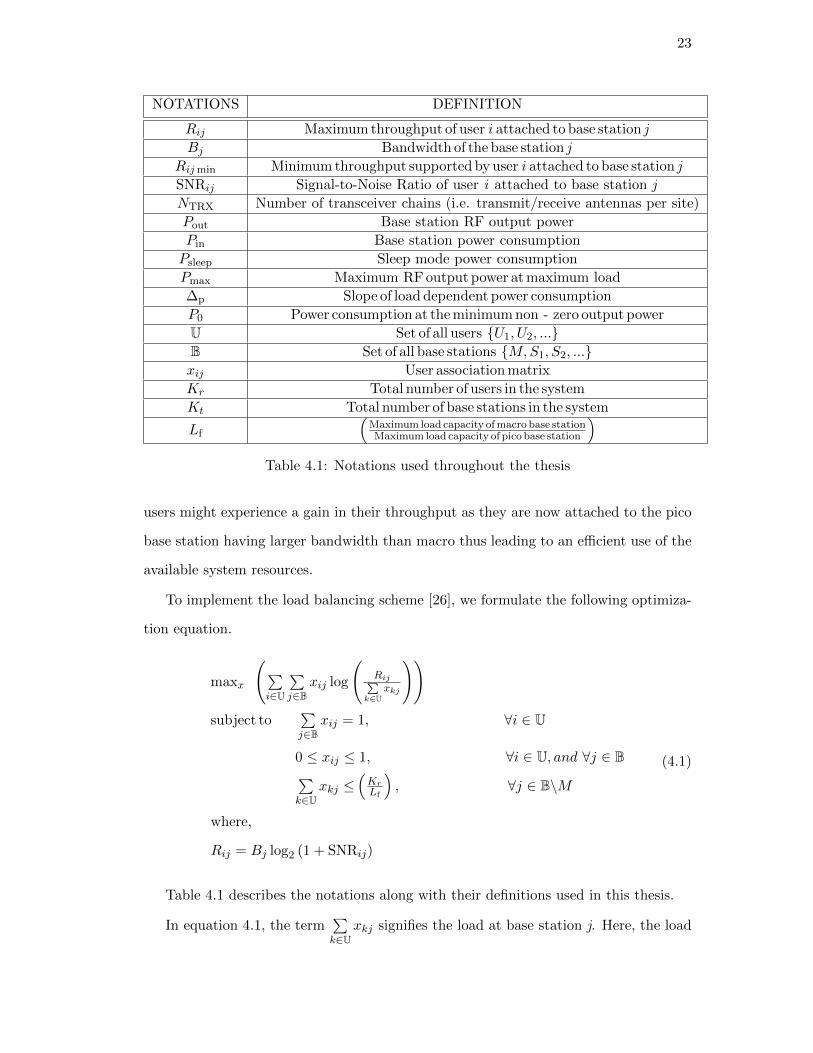
Table 4.1 describes the notations along with their definitions used in this thesis.
In equation 4.1, the term∑k∈U
xkj signifies the load at base station j. Here, the load
24
is measured by the number of users attached to a base station.
The first constraint ensures that a user can only be connected to a single base
station.
The second constraint is a relaxed association constraint where 0 signifies no as-
sociation and 1 signifies full association. Ideally, the association variable should be
a binary variable. But the association problem becomes combinatorial in nature due
to this binary association variable. Its complexity for the brute force association al-
gorithm is Θ(
(Kt)Kr
)[26]. Solving this computation becomes nearly impossible for
even a modest-sized network. Further, the exact optimization problem with binary
association constraint is NP-hard. Thus, in order to mitigate this issue, [26] uses the
relaxation which allows the association variable to take any real value from 0 to 1. The
physical significance of this relaxation is that it allows the users to be attached to more
than one base station, i.e. “Fractional User Association”. After solving the convex
optimization equation 4.1 using the CVX [49], we can get the final user association
matrix by rounding up the values to either 0 or 1.
The last constraint is regarding the maximum load capacity of the pico base stations
(maximum number of users that can be attached to the pico base station).
4.3 Power Minimization based User Association Algorithm
From figure 13 in [47], we observe that the power consumption for macro base station
is much larger as compared to the pico base station. The total energy distribution for
macro base station, indicates that its power consumption can be modelled using a linear
equation. Similar equations can also be used for pico but the power consumption for
pico base station is almost constant [47].
The following equation models the linear power consumption behaviour of a base
station [48].
Pin =
NTRX. (P0 + ∆p.Pout) 0 < Pout ≤ Pmax
NTRX.Psleep Pout = 0
(4.2)
25
Parameters Macro base station Pico base station
NTRX 1 1
P0 130 W 6.8 W
∆p 4.7 4.0
Pmax 39.8 W (46 dBm) 1.0 W (30 dBm)
Table 4.2: Power consumption model parameter values for base stations
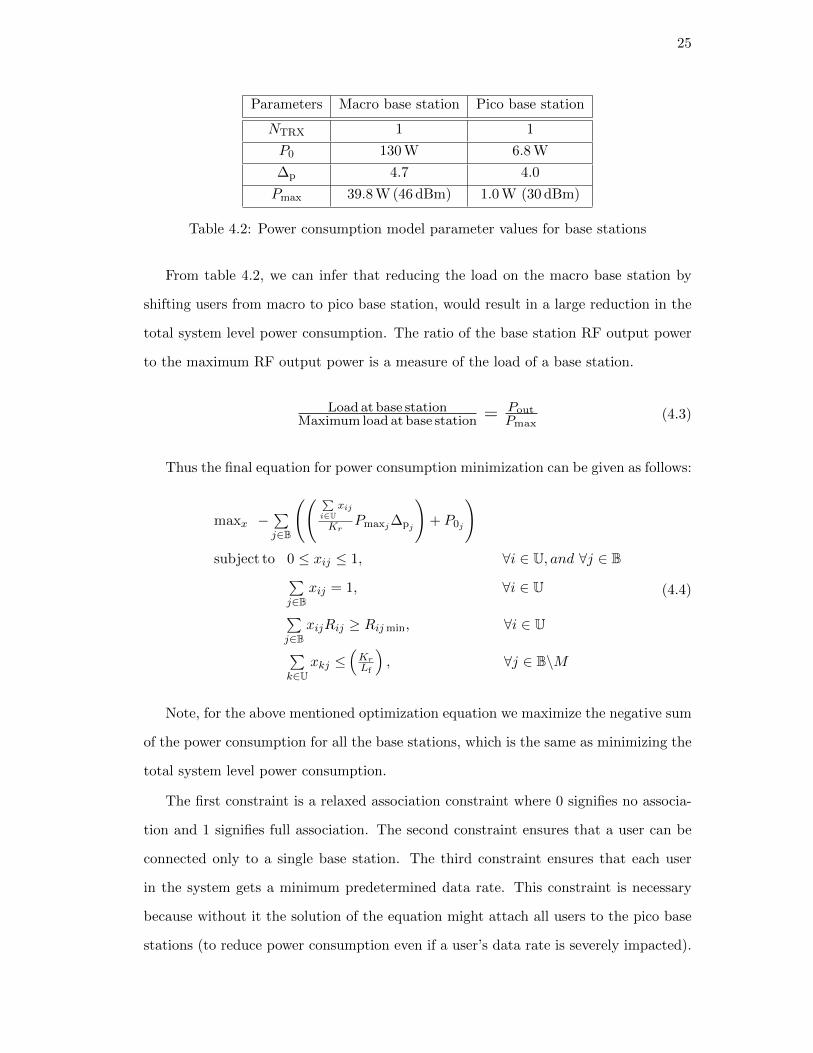
From table 4.2, we can infer that reducing the load on the macro base station by
shifting users from macro to pico base station, would result in a large reduction in the
total system level power consumption. The ratio of the base station RF output power
to the maximum RF output power is a measure of the load of a base station.
Load at base stationMaximum load at base station = Pout
Pmax(4.3)
Thus the final equation for power consumption minimization can be given as follows:
maxx −∑j∈B
(( ∑i∈U
xij
KrPmaxj∆pj
)+ P0j
)subject to 0 ≤ xij ≤ 1, ∀i ∈ U, and ∀j ∈ B∑
j∈Bxij = 1, ∀i ∈ U∑
j∈BxijRij ≥ Rij min, ∀i ∈ U∑
k∈Uxkj ≤
(KrLf
), ∀j ∈ B\M
(4.4)
Note, for the above mentioned optimization equation we maximize the negative sum
of the power consumption for all the base stations, which is the same as minimizing the
total system level power consumption.
The first constraint is a relaxed association constraint where 0 signifies no associa-
tion and 1 signifies full association. The second constraint ensures that a user can be
connected only to a single base station. The third constraint ensures that each user
in the system gets a minimum predetermined data rate. This constraint is necessary
because without it the solution of the equation might attach all users to the pico base
stations (to reduce power consumption even if a user’s data rate is severely impacted).
26
The last constraint guarantees that none of the pico base stations is overloaded.
4.4 E-ASSOC User Association Algorithm
In this section, we focus on improving the system level energy efficiency. User associa-
tion algorithms maximizing the system throughput (log objective function for propor-
tional fairness) with load balancing while transmitting at full power on the allocated
sub-channels and implementing user association constraints have been extensively stud-
ied in [37]. Association schemes minimizing the power consumption of the system while
satisfying QoS requirements of each user, power constraints at the base stations and
user association constraints have been considered in [10, 33].
From the analysis of load balancing based association scheme and the power mini-
mization based association scheme, we find that in order to achieve the above metrics
(to improve energy efficiency) we need to offload users from macro base station to pico
base station.
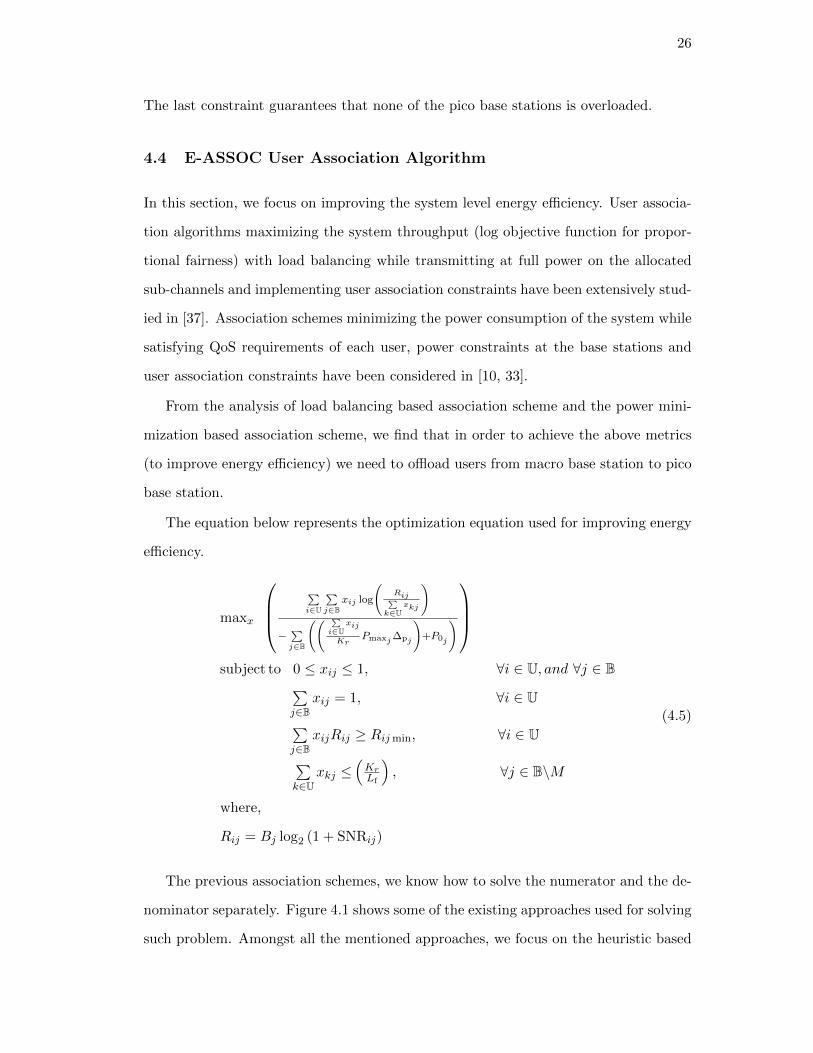
The equation below represents the optimization equation used for improving energy
efficiency.
maxx
∑i∈U
∑j∈B
xij log
(Rij∑
k∈Uxkj
)
−∑j∈B
(( ∑i∈U
xij
KrPmaxj ∆pj
)+P0j
)
subject to 0 ≤ xij ≤ 1, ∀i ∈ U, and ∀j ∈ B∑j∈B
xij = 1, ∀i ∈ U∑j∈B
xijRij ≥ Rij min, ∀i ∈ U∑k∈U
xkj ≤(KrLf
), ∀j ∈ B\M
where,
Rij = Bj log2 (1 + SNRij)
(4.5)
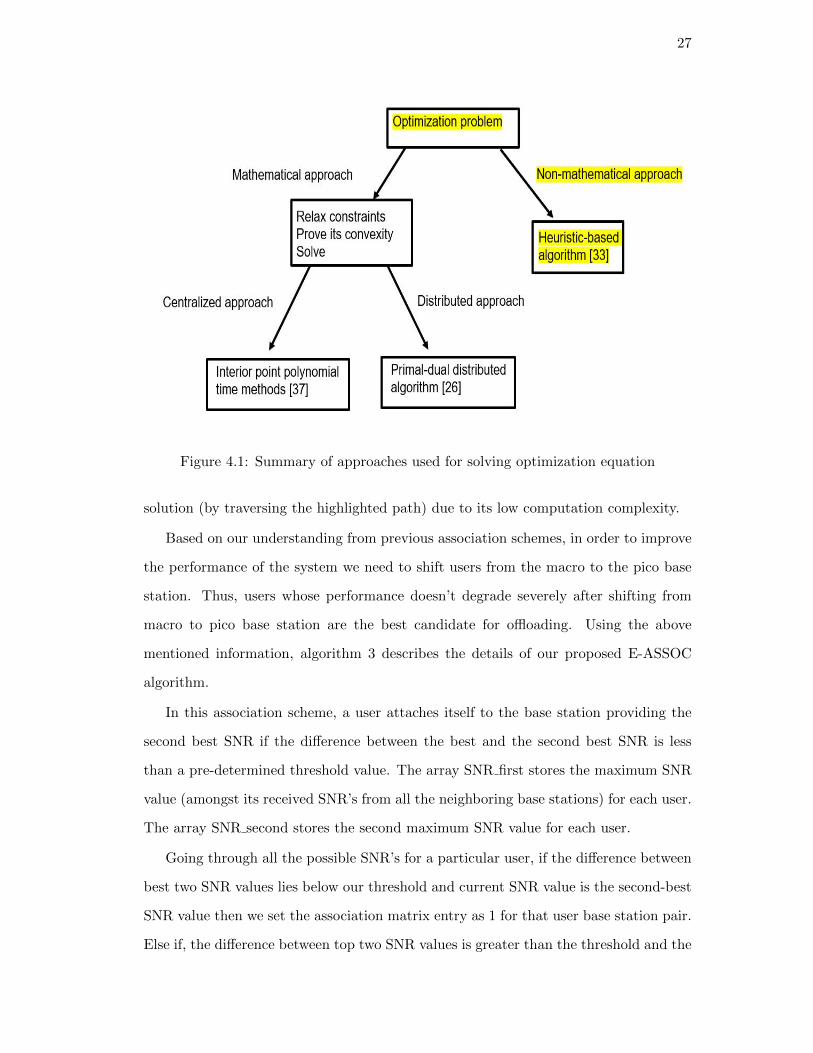
The previous association schemes, we know how to solve the numerator and the de-
nominator separately. Figure 4.1 shows some of the existing approaches used for solving
such problem. Amongst all the mentioned approaches, we focus on the heuristic based
27
Figure 4.1: Summary of approaches used for solving optimization equation
solution (by traversing the highlighted path) due to its low computation complexity.
Based on our understanding from previous association schemes, in order to improve
the performance of the system we need to shift users from the macro to the pico base
station. Thus, users whose performance doesn’t degrade severely after shifting from
macro to pico base station are the best candidate for offloading. Using the above
mentioned information, algorithm 3 describes the details of our proposed E-ASSOC
algorithm.
In this association scheme, a user attaches itself to the base station providing the
second best SNR if the difference between the best and the second best SNR is less
than a pre-determined threshold value. The array SNR first stores the maximum SNR
value (amongst its received SNR’s from all the neighboring base stations) for each user.
The array SNR second stores the second maximum SNR value for each user.
Going through all the possible SNR’s for a particular user, if the difference between
best two SNR values lies below our threshold and current SNR value is the second-best
SNR value then we set the association matrix entry as 1 for that user base station pair.
Else if, the difference between top two SNR values is greater than the threshold and the
28
current SNR value is best SNR value, we set the association matrix as 1. Otherwise,
we set the value to be zero.
Algorithm 3 E-ASSOC user association algorithm
1: Input: SNR, SNR first, SNR second, curr load heur, max load, threshold val2: Output: x3: for i in each user do4: for j in each base station do5: if SNR(j,i) equals SNR first(1,i) and current base station’s load < maximum
load and j is pico base station then6: x(j,i) = 17: curr load heur(j) = curr load heur(j) + 18: else if SNR(j,i) equals SNR first(1,i) and current base station’s load >= max-
imum load and j is pico base station then9: x(1,i) = 1
10: curr load heur(1) = curr load heur(1) + 111: else if SNR(j,i) equals SNR second(1,i) and current base station’s load < max-
imum load and j is pico base station and (SNR first(1,i) - SNR second(1,i))<= threshold val then
12: x(j,i) = 113: curr load heur(j) = curr load heur(j) + 114: else if SNR(j,i) equals SNR second(1,i) and current base station’s load
>= maximum load and j is pico base station and (SNR first(1,i) -SNR second(1,i)) <= threshold val then
15: x(1,i) = 116: curr load heur(1) = curr load heur(1) + 117: else if SNR(j,i) equals SNR first(1,i) and j is macro base station and
(SNR first(1,i) - SNR second(1,i)) > threshold val then18: x(1,i) = 119: curr load heur(1) = curr load heur(1) + 120: else21: x(j,i) = 022: end if23: end for24: end for=0
29
Chapter 5
Evaluation Results
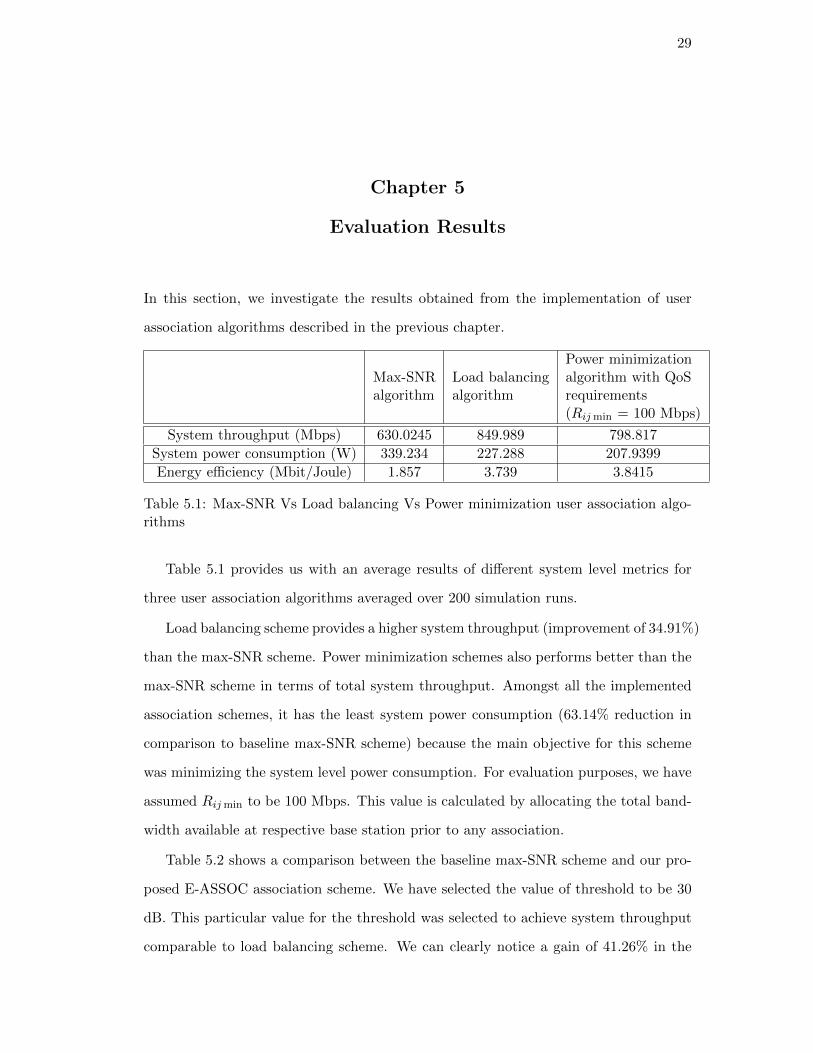
In this section, we investigate the results obtained from the implementation of user
association algorithms described in the previous chapter.
Max-SNRalgorithm
Load balancingalgorithm
Power minimizationalgorithm with QoSrequirements(Rij min = 100 Mbps)
System throughput (Mbps) 630.0245 849.989 798.817
System power consumption (W) 339.234 227.288 207.9399
Energy efficiency (Mbit/Joule) 1.857 3.739 3.8415
Table 5.1: Max-SNR Vs Load balancing Vs Power minimization user association algo-rithms
Table 5.1 provides us with an average results of different system level metrics for
three user association algorithms averaged over 200 simulation runs.
Load balancing scheme provides a higher system throughput (improvement of 34.91%)
than the max-SNR scheme. Power minimization schemes also performs better than the
max-SNR scheme in terms of total system throughput. Amongst all the implemented
association schemes, it has the least system power consumption (63.14% reduction in
comparison to baseline max-SNR scheme) because the main objective for this scheme
was minimizing the system level power consumption. For evaluation purposes, we have
assumed Rij min to be 100 Mbps. This value is calculated by allocating the total band-
width available at respective base station prior to any association.
Table 5.2 shows a comparison between the baseline max-SNR scheme and our pro-
posed E-ASSOC association scheme. We have selected the value of threshold to be 30
dB. This particular value for the threshold was selected to achieve system throughput
comparable to load balancing scheme. We can clearly notice a gain of 41.26% in the
30
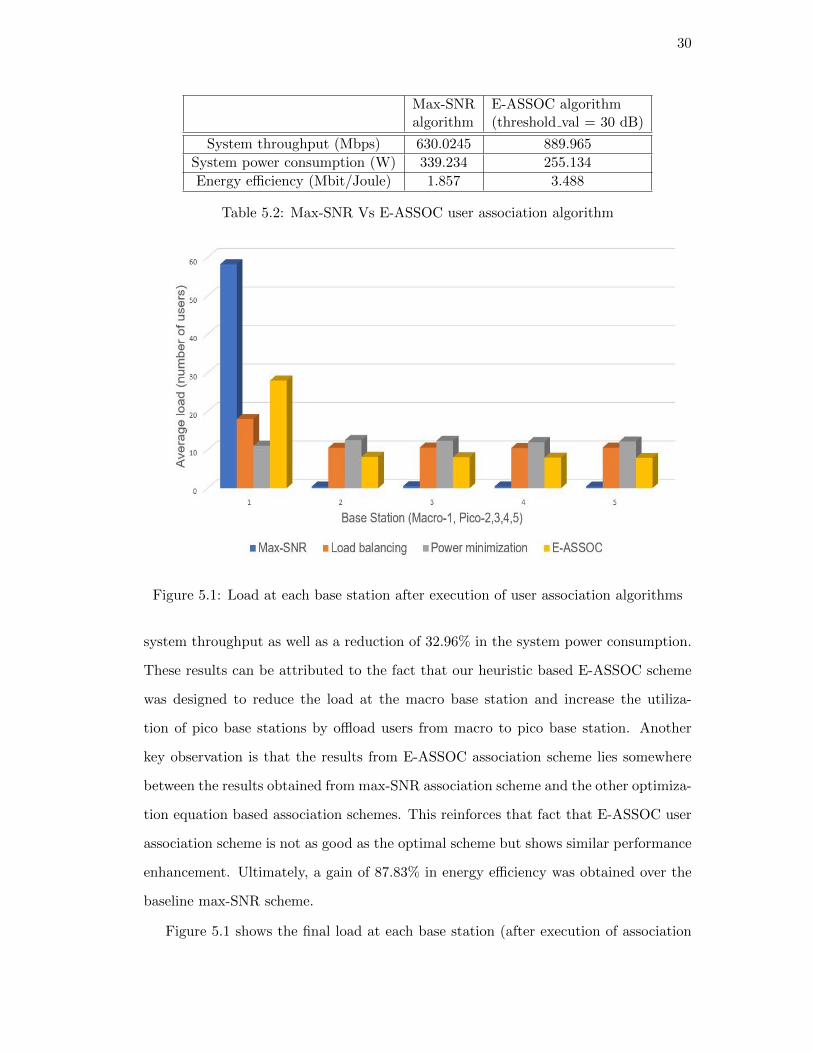
Max-SNRalgorithm
E-ASSOC algorithm(threshold val = 30 dB)
System throughput (Mbps) 630.0245 889.965
System power consumption (W) 339.234 255.134
Energy efficiency (Mbit/Joule) 1.857 3.488
Table 5.2: Max-SNR Vs E-ASSOC user association algorithm
Figure 5.1: Load at each base station after execution of user association algorithms
system throughput as well as a reduction of 32.96% in the system power consumption.
These results can be attributed to the fact that our heuristic based E-ASSOC scheme
was designed to reduce the load at the macro base station and increase the utiliza-
tion of pico base stations by offload users from macro to pico base station. Another
key observation is that the results from E-ASSOC association scheme lies somewhere
between the results obtained from max-SNR association scheme and the other optimiza-
tion equation based association schemes. This reinforces that fact that E-ASSOC user
association scheme is not as good as the optimal scheme but shows similar performance
enhancement. Ultimately, a gain of 87.83% in energy efficiency was obtained over the
baseline max-SNR scheme.
Figure 5.1 shows the final load at each base station (after execution of association
31
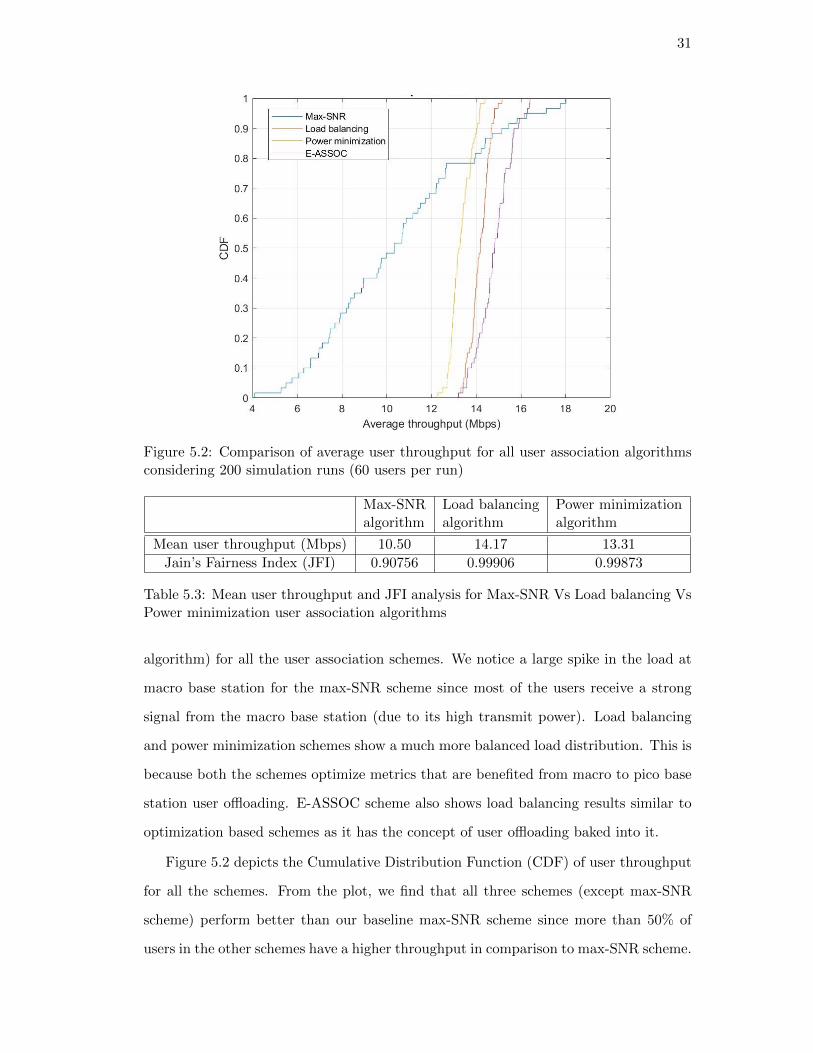
Figure 5.2: Comparison of average user throughput for all user association algorithmsconsidering 200 simulation runs (60 users per run)
Max-SNRalgorithm
Load balancingalgorithm
Power minimizationalgorithm
Mean user throughput (Mbps) 10.50 14.17 13.31
Jain’s Fairness Index (JFI) 0.90756 0.99906 0.99873
Table 5.3: Mean user throughput and JFI analysis for Max-SNR Vs Load balancing VsPower minimization user association algorithms
algorithm) for all the user association schemes. We notice a large spike in the load at
macro base station for the max-SNR scheme since most of the users receive a strong
signal from the macro base station (due to its high transmit power). Load balancing
and power minimization schemes show a much more balanced load distribution. This is
because both the schemes optimize metrics that are benefited from macro to pico base
station user offloading. E-ASSOC scheme also shows load balancing results similar to
optimization based schemes as it has the concept of user offloading baked into it.
Figure 5.2 depicts the Cumulative Distribution Function (CDF) of user throughput
for all the schemes. From the plot, we find that all three schemes (except max-SNR
scheme) perform better than our baseline max-SNR scheme since more than 50% of
users in the other schemes have a higher throughput in comparison to max-SNR scheme.
32
Max-SNR algorithm E-ASSOC algorithm
Mean user throughput (Mbps) 10.50 14.83
Jain’s Fairness Index 0.90756 0.99738
Table 5.4: Mean user throughput and JFI analysis for Max-SNR vs E-ASSOC userassociation algorithms
From Table 5.3, observing the JFI values for all the different schemes, we find that
the load balancing scheme has the best JFI value. This means that the load balancing
scheme allocates the system resources most fairly amongst all the other schemes as it
uses network-wide proportional fairness as its optimization metric. Power minimization
scheme is not as good as the load balancing scheme in terms of fairness but has a very
close value. Max-SNR scheme is the least fair amongst all the schemes. In terms of mean
user throughput, load balancing and power minimization algorithms show significant
improvement over the baseline max-SNR based association algorithm.
A comparative study of the E-ASSOC scheme and the baseline max-SNR scheme is
shown in table 5.4. The values indicate superior performance of the E-ASSOC scheme
over the max-SNR scheme for both mean user throughput as well as overall network-
wide fairness.
33
Chapter 6
Conclusion and Future Work
6.1 Conclusion
In this work, we proposed and evaluated a centralized heuristic based user association
algorithm (E-ASSOC) to enhance the energy efficiency of HetNet over the existing
baseline max-SNR association algorithm. Design of our algorithm was based on the
insights obtained from existing optimization based association schemes. Results show
that the proposed E-ASSOC scheme achieves a gain of 87.83% in energy efficiency
(bits/Joule) relative to baseline scheme.
6.2 Future Work
This sections emphasises on some of future areas for further exploration.
• Mobile users: All the association schemes analysed in this work were based on
a snapshot of the network i.e. considering static user positions. However, there is
a need to evaluate the schemes with mobile users taking interference into account.
• Linear Fractional Programming: The heuristic scheme proposed in this
work is often considered as a non-mathematical solution. It would be interest-
ing to compare its performance with the final optimization equation (for energy
efficiency) using a more rigorous mathematical approach.
• Evaluation for 5G systems: The simulation environment considered through-
out this work utilized path loss models from 3GPP LTE specification. With
rapidly emerging 5G standards, it becomes important to asses the performance
of these algorithms on the latest standards.
34
Bibliography
[1] Ericsson, “Ericsson mobility report,” 2019. [Online].
Available: https://www.ericsson.com/4acd7e/assets/local/mobility-report/
documents/2019/emr-november-2019.pdf
[2] J. Malmodin and D. Lunden, “The electricity consumption and operational carbon
emissions of ict network operators 2010-2015,” 2018.
[3] G. Auer, V. Giannini, C. Desset, I. Godor, P. Skillermark, M. Olsson, M. A. Imran,
D. Sabella, M. J. Gonzalez, O. Blume et al., “How much energy is needed to run
a wireless network?” IEEE Wireless Communications, vol. 18, no. 5, pp. 40–49,
2011.
[4] D. Feng, C. Jiang, G. Lim, L. J. Cimini, G. Feng, and G. Y. Li, “A survey of energy-
efficient wireless communications,” IEEE Communications Surveys & Tutorials,
vol. 15, no. 1, pp. 167–178, 2012.
[5] Ericsson, “Breaking the energy curve report,” 2020. [On-
line]. Available: https://www.ericsson.com/495d5c/assets/local/
about-ericsson/sustainability-and-corporate-responsibility/documents/2020/
breaking-the-energy-curve-report.pdf
[6] ——, “A technical look at 5g energy consumption and perfor-
mance,” 2019. [Online]. Available: https://www.ericsson.com/en/blog/2019/
9/energy-consumption-5g-nr
[7] D. Raychaudhuri, I. Seskar, G. Zussman, T. Korakis, D. Kilper, T. Chen,
J. Kolodziejski, M. Sherman, Z. Kostic, X. Gu et al., “Challenge: Cosmos: A
city-scale programmable testbed for experimentation with advanced wireless,” in
35
Proceedings of the 26th Annual International Conference on Mobile Computing and
Networking, 2020, pp. 1–13.
[8] B. A. Bjerke, “Lte-advanced and the evolution of lte deployments,” IEEE Wireless
Communications, vol. 18, no. 5, pp. 4–5, 2011.
[9] M. Xiao, S. Mumtaz, Y. Huang, L. Dai, Y. Li, M. Matthaiou, G. K. Karagiannidis,
E. Bjornson, K. Yang, I. Chih-Lin et al., “Millimeter wave communications for
future mobile networks,” IEEE Journal on Selected Areas in Communications,
vol. 35, no. 9, pp. 1909–1935, 2017.
[10] E. Bjornson, M. Kountouris, and M. Debbah, “Massive mimo and small cells:
Improving energy efficiency by optimal soft-cell coordination,” in ICT 2013. IEEE,
2013, pp. 1–5.
[11] D. Liu, L. Wang, Y. Chen, M. Elkashlan, K.-K. Wong, R. Schober, and L. Hanzo,
“User association in 5g networks: A survey and an outlook,” IEEE Communica-
tions Surveys & Tutorials, vol. 18, no. 2, pp. 1018–1044, 2016.
[12] N. Docomo, “Performance of eicic with control channel coverage limitation,” R1-
103264, 3GPP Std., Montreal, Canada, 2010.
[13] J. G. Andrews, “Seven ways that hetnets are a cellular paradigm shift,” IEEE
Communications Magazine, vol. 51, no. 3, pp. 136–144, 2013.
[14] H. Shokri-Ghadikolaei, C. Fischione, G. Fodor, P. Popovski, and M. Zorzi, “Mil-
limeter wave cellular networks: A mac layer perspective,” IEEE Transactions on
Communications, vol. 63, no. 10, pp. 3437–3458, 2015.
[15] I. Guvenc, “Capacity and fairness analysis of heterogeneous networks with range
expansion and interference coordination,” IEEE Communications Letters, vol. 15,
no. 10, pp. 1084–1087, 2011.
[16] A. Khandekar, N. Bhushan, J. Tingfang, and V. Vanghi, “Lte-advanced: Hetero-
geneous networks,” in 2010 European wireless conference (EW). IEEE, 2010, pp.
978–982.
36
[17] K. Okino, T. Nakayama, C. Yamazaki, H. Sato, and Y. Kusano, “Pico cell range ex-
pansion with interference mitigation toward lte-advanced heterogeneous networks,”
in 2011 IEEE International Conference on Communications Workshops (ICC).
IEEE, 2011, pp. 1–5.
[18] H.-S. Jo, Y. J. Sang, P. Xia, and J. G. Andrews, “Outage probability for het-
erogeneous cellular networks with biased cell association,” in 2011 IEEE Global
Telecommunications Conference-GLOBECOM 2011. IEEE, 2011, pp. 1–5.
[19] Q. Ye, M. Al-Shalash, C. Caramanis, and J. G. Andrews, “On/off macrocells and
load balancing in heterogeneous cellular networks,” in 2013 IEEE global commu-
nications conference (GLOBECOM). IEEE, 2013, pp. 3814–3819.
[20] R. Bendlin, V. Chandrasekhar, R. Chen, A. Ekpenyong, and E. Onggosanusi,
“From homogeneous to heterogeneous networks: A 3gpp long term evolution rel.
8/9 case study,” in 2011 45th Annual Conference on Information Sciences and
Systems. IEEE, 2011, pp. 1–5.
[21] E. Bjornson, E. A. Jorswieck, M. Debbah, and B. Ottersten, “Multiobjective signal
processing optimization: The way to balance conflicting metrics in 5g systems,”
IEEE Signal Processing Magazine, vol. 31, no. 6, pp. 14–23, 2014.
[22] R. Q. Hu and Y. Qian, “An energy efficient and spectrum efficient wireless het-
erogeneous network framework for 5g systems,” IEEE Communications Magazine,
vol. 52, no. 5, pp. 94–101, 2014.
[23] L. Su, C. Yang, Z. Xu, and A. F. Molisch, “Energy-efficient downlink transmission
with base station closing in small cell networks,” in 2013 IEEE International Con-
ference on Acoustics, Speech and Signal Processing. IEEE, 2013, pp. 4784–4788.
[24] T. Bu, L. Li, and R. Ramjee, “Generalized proportional fair scheduling in third
generation wireless data networks,” in IEEE INFOCOM, 2006, pp. 1–12.
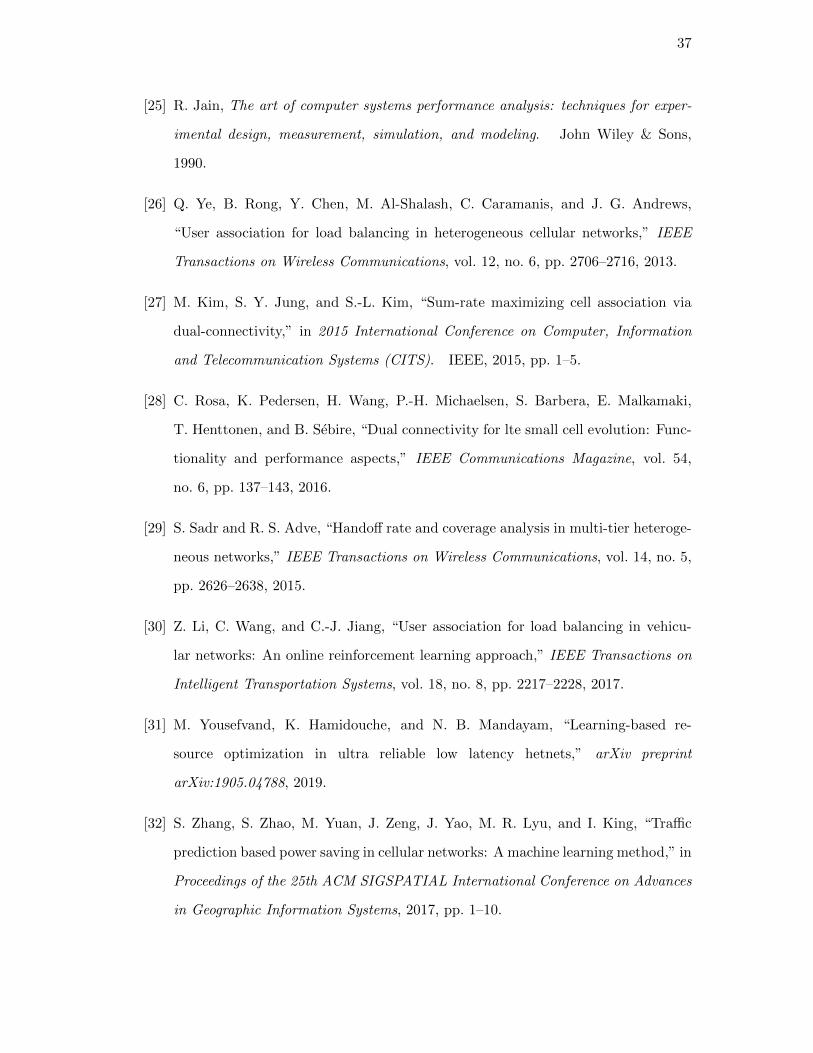
37
[25] R. Jain, The art of computer systems performance analysis: techniques for exper-
imental design, measurement, simulation, and modeling. John Wiley & Sons,
1990.
[26] Q. Ye, B. Rong, Y. Chen, M. Al-Shalash, C. Caramanis, and J. G. Andrews,
“User association for load balancing in heterogeneous cellular networks,” IEEE
Transactions on Wireless Communications, vol. 12, no. 6, pp. 2706–2716, 2013.
[27] M. Kim, S. Y. Jung, and S.-L. Kim, “Sum-rate maximizing cell association via
dual-connectivity,” in 2015 International Conference on Computer, Information
and Telecommunication Systems (CITS). IEEE, 2015, pp. 1–5.
[28] C. Rosa, K. Pedersen, H. Wang, P.-H. Michaelsen, S. Barbera, E. Malkamaki,
T. Henttonen, and B. Sebire, “Dual connectivity for lte small cell evolution: Func-
tionality and performance aspects,” IEEE Communications Magazine, vol. 54,
no. 6, pp. 137–143, 2016.
[29] S. Sadr and R. S. Adve, “Handoff rate and coverage analysis in multi-tier heteroge-
neous networks,” IEEE Transactions on Wireless Communications, vol. 14, no. 5,
pp. 2626–2638, 2015.
[30] Z. Li, C. Wang, and C.-J. Jiang, “User association for load balancing in vehicu-
lar networks: An online reinforcement learning approach,” IEEE Transactions on
Intelligent Transportation Systems, vol. 18, no. 8, pp. 2217–2228, 2017.
[31] M. Yousefvand, K. Hamidouche, and N. B. Mandayam, “Learning-based re-
source optimization in ultra reliable low latency hetnets,” arXiv preprint
arXiv:1905.04788, 2019.
[32] S. Zhang, S. Zhao, M. Yuan, J. Zeng, J. Yao, M. R. Lyu, and I. King, “Traffic
prediction based power saving in cellular networks: A machine learning method,” in
Proceedings of the 25th ACM SIGSPATIAL International Conference on Advances
in Geographic Information Systems, 2017, pp. 1–10.
38
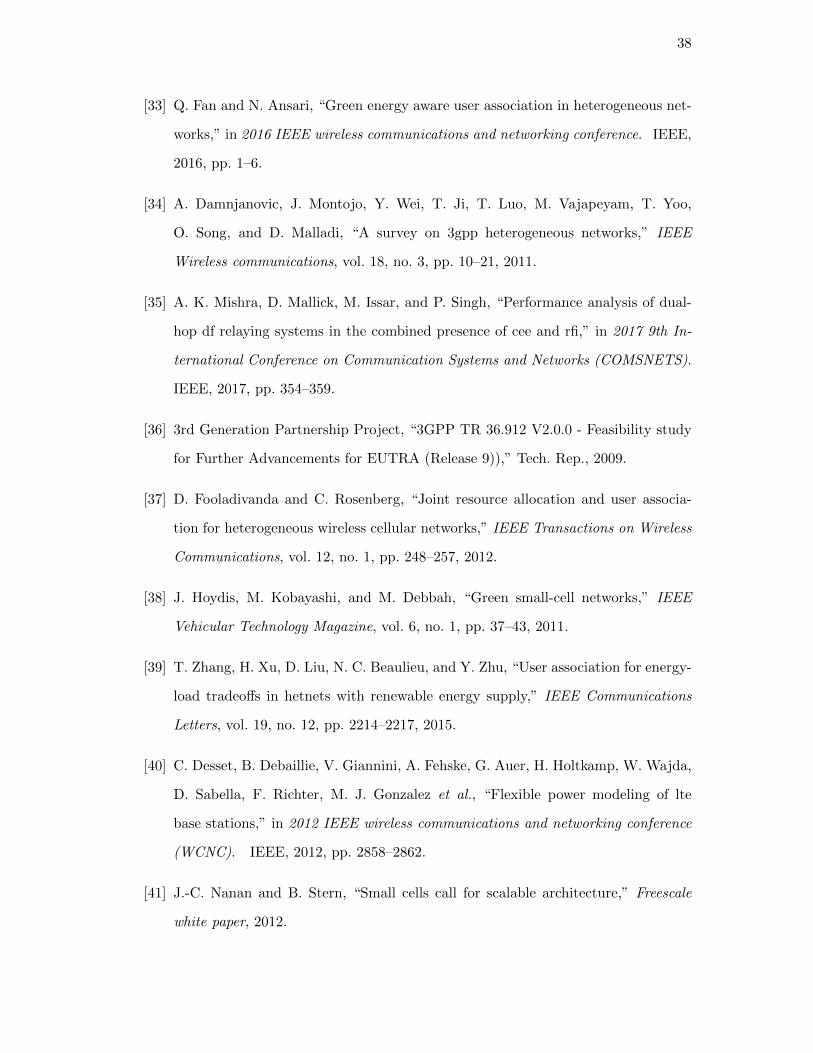
[33] Q. Fan and N. Ansari, “Green energy aware user association in heterogeneous net-
works,” in 2016 IEEE wireless communications and networking conference. IEEE,
2016, pp. 1–6.
[34] A. Damnjanovic, J. Montojo, Y. Wei, T. Ji, T. Luo, M. Vajapeyam, T. Yoo,
O. Song, and D. Malladi, “A survey on 3gpp heterogeneous networks,” IEEE
Wireless communications, vol. 18, no. 3, pp. 10–21, 2011.
[35] A. K. Mishra, D. Mallick, M. Issar, and P. Singh, “Performance analysis of dual-
hop df relaying systems in the combined presence of cee and rfi,” in 2017 9th In-
ternational Conference on Communication Systems and Networks (COMSNETS).
IEEE, 2017, pp. 354–359.
[36] 3rd Generation Partnership Project, “3GPP TR 36.912 V2.0.0 - Feasibility study
for Further Advancements for EUTRA (Release 9)),” Tech. Rep., 2009.
[37] D. Fooladivanda and C. Rosenberg, “Joint resource allocation and user associa-
tion for heterogeneous wireless cellular networks,” IEEE Transactions on Wireless
Communications, vol. 12, no. 1, pp. 248–257, 2012.
[38] J. Hoydis, M. Kobayashi, and M. Debbah, “Green small-cell networks,” IEEE
Vehicular Technology Magazine, vol. 6, no. 1, pp. 37–43, 2011.
[39] T. Zhang, H. Xu, D. Liu, N. C. Beaulieu, and Y. Zhu, “User association for energy-
load tradeoffs in hetnets with renewable energy supply,” IEEE Communications
Letters, vol. 19, no. 12, pp. 2214–2217, 2015.
[40] C. Desset, B. Debaillie, V. Giannini, A. Fehske, G. Auer, H. Holtkamp, W. Wajda,
D. Sabella, F. Richter, M. J. Gonzalez et al., “Flexible power modeling of lte
base stations,” in 2012 IEEE wireless communications and networking conference
(WCNC). IEEE, 2012, pp. 2858–2862.
[41] J.-C. Nanan and B. Stern, “Small cells call for scalable architecture,” Freescale
white paper, 2012.
39
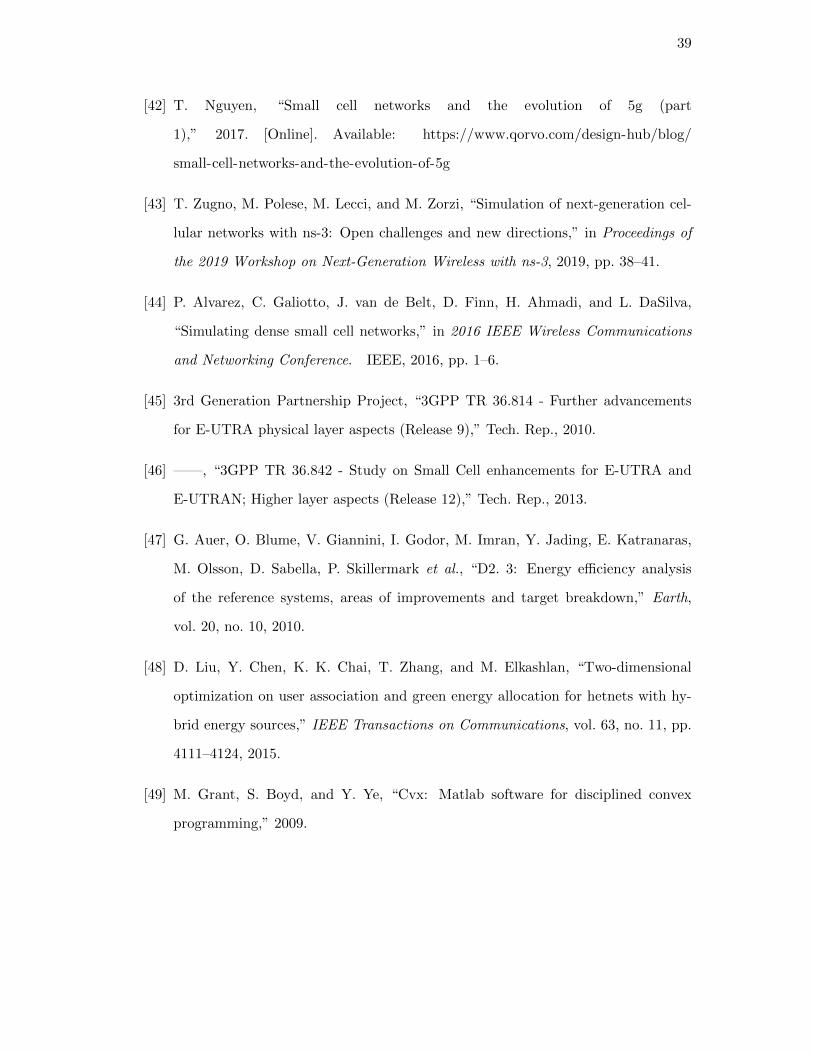
[42] T. Nguyen, “Small cell networks and the evolution of 5g (part
1),” 2017. [Online]. Available: https://www.qorvo.com/design-hub/blog/
small-cell-networks-and-the-evolution-of-5g
[43] T. Zugno, M. Polese, M. Lecci, and M. Zorzi, “Simulation of next-generation cel-
lular networks with ns-3: Open challenges and new directions,” in Proceedings of
the 2019 Workshop on Next-Generation Wireless with ns-3, 2019, pp. 38–41.
[44] P. Alvarez, C. Galiotto, J. van de Belt, D. Finn, H. Ahmadi, and L. DaSilva,
“Simulating dense small cell networks,” in 2016 IEEE Wireless Communications
and Networking Conference. IEEE, 2016, pp. 1–6.
[45] 3rd Generation Partnership Project, “3GPP TR 36.814 - Further advancements
for E-UTRA physical layer aspects (Release 9),” Tech. Rep., 2010.
[46] ——, “3GPP TR 36.842 - Study on Small Cell enhancements for E-UTRA and
E-UTRAN; Higher layer aspects (Release 12),” Tech. Rep., 2013.
[47] G. Auer, O. Blume, V. Giannini, I. Godor, M. Imran, Y. Jading, E. Katranaras,
M. Olsson, D. Sabella, P. Skillermark et al., “D2. 3: Energy efficiency analysis
of the reference systems, areas of improvements and target breakdown,” Earth,
vol. 20, no. 10, 2010.
[48] D. Liu, Y. Chen, K. K. Chai, T. Zhang, and M. Elkashlan, “Two-dimensional
optimization on user association and green energy allocation for hetnets with hy-
brid energy sources,” IEEE Transactions on Communications, vol. 63, no. 11, pp.
4111–4124, 2015.
[49] M. Grant, S. Boyd, and Y. Ye, “Cvx: Matlab software for disciplined convex
programming,” 2009.


![Design of an Efficient Edge Enhanced Image Scalar … of an Efficient Edge Enhanced Image Scalar for Image Processing Applications 1Rashmi. H, 2Suganya. S 1PG Student [VLSI], Dept](https://img.pdfslide.net/doc/110x75/5ae4a1087f8b9a495c8ed193/design-of-an-efficient-edge-enhanced-image-scalar-of-an-efficient-edge-enhanced.jpg)