Embed Size (px)
Citation preview
NOISE EXPOSURE FORECAST CONTOUR INTERPRETATIONS
"OF AIRCRAFT NOISE TRADEOFF STUDIES
LTECHNICAL REPORT
FAA-NO-69-2MAY 1969
byrDwight E. Bishop
Richard D. Horonjeff
F Bolt Beranek and Newman Inc.15808 Wyandotte Street
Van Nuys, California 91406Ir Prepared for
Department of Transportat.!onFederal Aviation Administration
r Office of Noise Abatement
Under Contract FA68UA-1900
This report has been approved for general availability. Thecontents of this report reflect the views of the contractor,who is responsible fof the facts and the accuracy of the datapresented herein, and do not necessarily reflect the officalviews or policy of the FAA. This report does not constitute
I a standard, specification, or regulation.
I
Iu.
IT
ABSTRACT
The u•-ative effectiveness of several changes in aircraftoperating procedures and aircraft hardwareI -refto-ing.:noise[p asr6 near airports were rated by determining the relativechanges in land areas falling within the Noise Exposure Forecast30 and 40 contours. Sets of NEF contours were constructed fortwo different -m1*e--ot aircraft types operating from a singlerunway airport; the number of operations per day was variedfrom 200 to 1000. The changes Included power cutbacks aftertakeoff, two segment approaches and retrofit of four-engine turbo-
I r fan aircraft with acoustically-lined nacelles or with a "quietengine".I There was a significant reduction In land area exposedto NEF 304.om.J1 noise environments by the Introduction of eitherlined nacelles or quiet engines. Operational changes alonegenerally Aesulted In moderate reductions (and even some increases)in the land areas falling within the NEF 30 or 40 contours. Therelative eftectiveness of the changes did not vary appreciablywith the number of operations.
4
It
I.
[1ii
[S
TABLE OP CONTENTS
Paxe-No.
LIST OF TABLES v
LIST OF FIGURES vi
I. INTRODUCTION. . . . . . . . . . . . . 1II. STUDY APPROACH AND ASSUMPTIONS . . . . . . 4
A. Noise Exposure Forecast Procedures . . . . 4B. Aircraft Noise And Performance Characteristics 5
III. ANALYSIS PROCEDURE ..... 15A. Airport Operations ......... 15B. Runway Utilization .. . .. ......... ... 17C. NEF Area Calculations ........ 17
IV. TRADEOFF STUDY COMPARISONS . . . .. . . . 20A. Operational Changes .. . . . . . . 31B. Equipment Changes ..... ........ .. 31C. Comparison of Operational And Equipment
Changes .... ........ . . . 32D. Variations With Total Number Of Operations 32E. Major Trends .............. . 35
REFERENCES
APPENDIX
iv
S . . .. . |
l LIST OF TABLES
Table No. Page Fo.SI LIST OF CHANGES IN OPERATIONS AND AIR-
CRAFT CHARACTERISTICS ...... 2
II BASIC ASSUMPTIONS FOR TAKEOFF PROFILESDISTANCES AND NOISE REDUCTION DUE TOTHRUST CUTBACK AFTER TAKEOFF .... 6
S[III REDUCTION IN APPROACH LEVELS FOR 60GLIDE SEGMENT. . . . .. . . . . 7
IV CHANGES IN NOISE LEVELS DUE TO ACOUS-TICALLY LINED NACELLES FOR FOUR-ENGINETURBOFAN AIRCRAFT8
V REDUCTION IN EFFECTIVE PERCEIVED NOISELEVELS PRODUCED BY POUR-ENGINE TURBOFANAIRCRAFT RETROFITTED WITH "QUIET"ENGINES ........... 9
VI AIRCRAFT MIX FOR TRADEOFF STUDIES . . . 16
VII LAND AREAS WITHIN NEF 30 AND NEF 40CONTOURS . . . . . . . . . . 18
VIII RELATIVE AREAS OF LAND WITHIN NEFCONTOURS FOR VARIOUS CHANGES IN AIR-"CRAFT OR OPERATING PROCEDURES . . . . 21
IX SUMMARY OF SOME COMPARISONS FROM NEFTRADEOFF STUDY . . . . . . . . .22
t
III,
IL _
3 LIST OF FIGURES
I Figure No. Page No.
1 VARIATION IN EFFECTIVE PERCEIVED NOISELEVELS WITH DISTANCE FOR VARIOUS AIRCRAFT5 CLASSES - TAKEOFF POWER . . . . . .. 10
2 VARIATION IN EFFECTIVE PERCEIVED NOISELEVELS WITH DISTANCE FOR VARIOUS AIRCRAFTCLASSES - APPROACH POWER . . .... ii
3 GENERALIZED TAKEOFF PROFILES . . . . . 12
4 VARIATION IN PERCEIVED NOISE LEVELS WITHDISTANCE FOR FOUR-ENGINE TURBOFAN AIRCRAFTRETROFITTED WITH NASA QUIET ENGINE . . . 13
5 AIRCRAFT FLIGHT PROFILE MODIFICATIONS . . 14
I 6 SKETCH OF RUNWAY AND FLIGHT PATH CONFIGURA-TIONS ................... 19
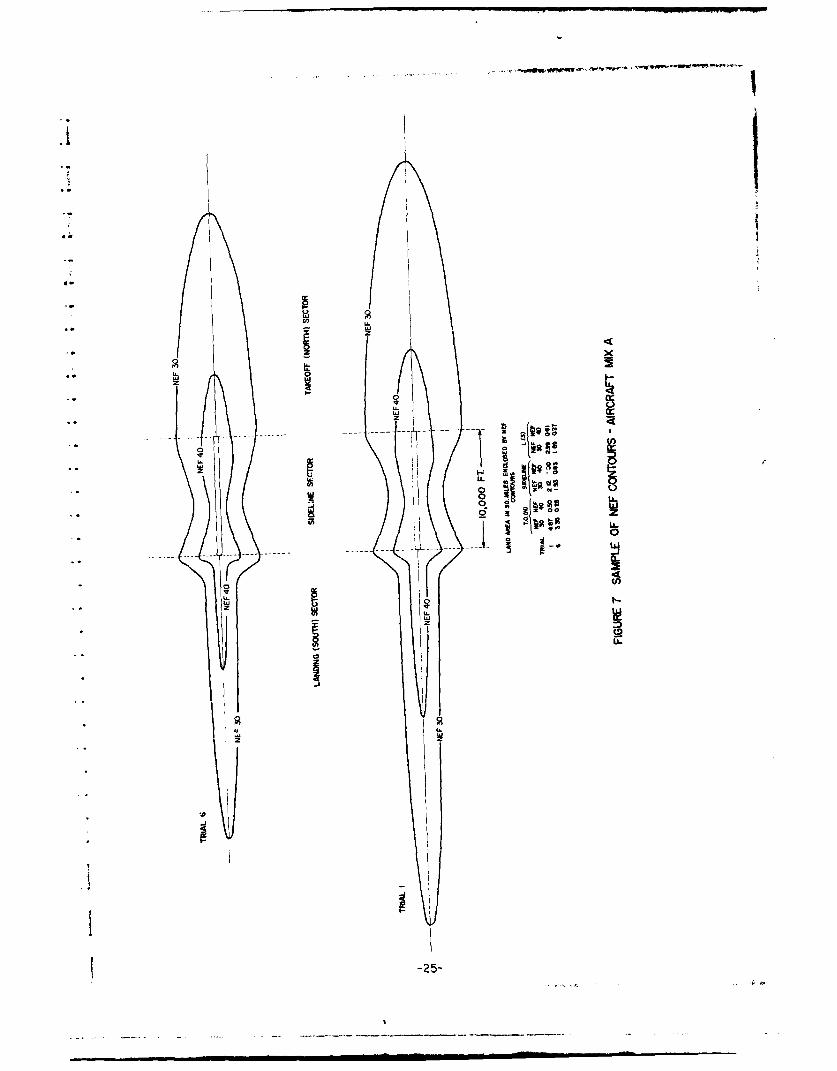
3 7 SAMPLE OF NEF CONTOURS - AIRCRAFT MIX A 25
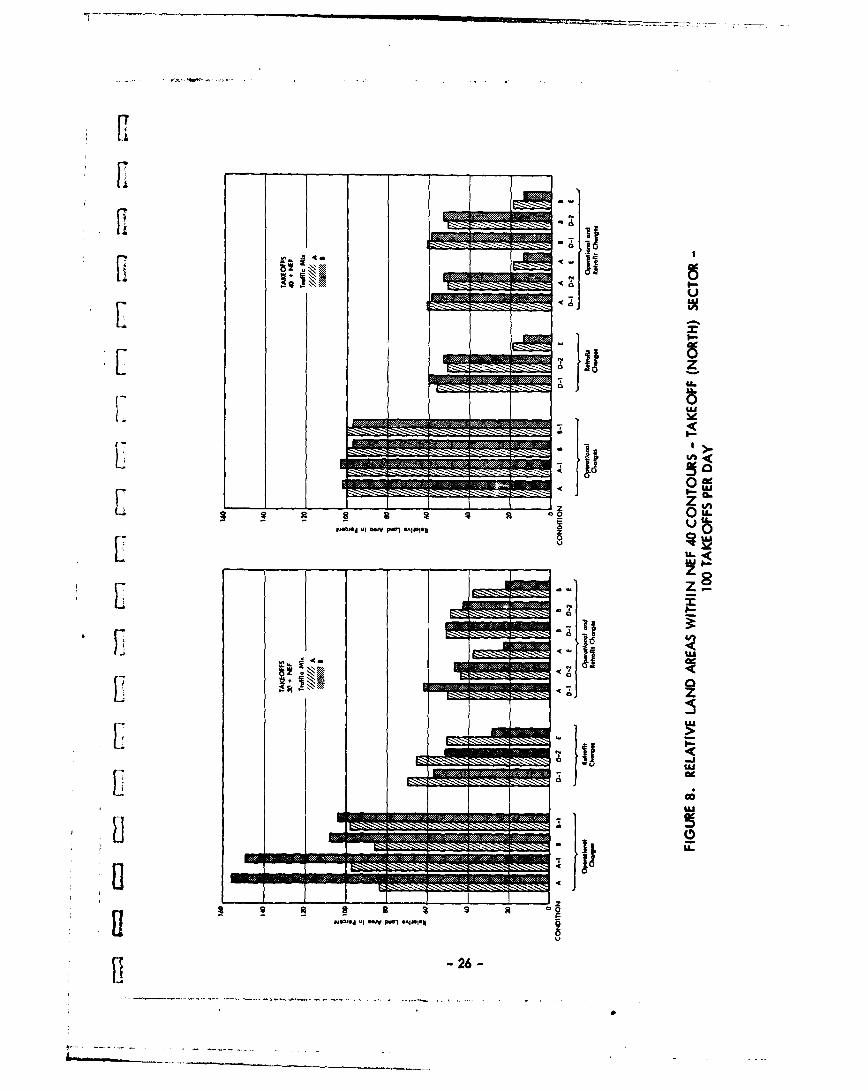
8 RELATIVE LAND AREAS EWITHIN NEF 30 AND NEF 40CONTOURS - TAKEOFF (NORTH) SECTOR - 100TAKEOFFS PER DAY ... ......... 26
9 RELATIVE LAND AREAS WITHIN NEF 30 AND NEF 40CONTOURS - LANDING (SOUTH) SECTOR - 100LANDINGS PER DAY . . .. ........ 27
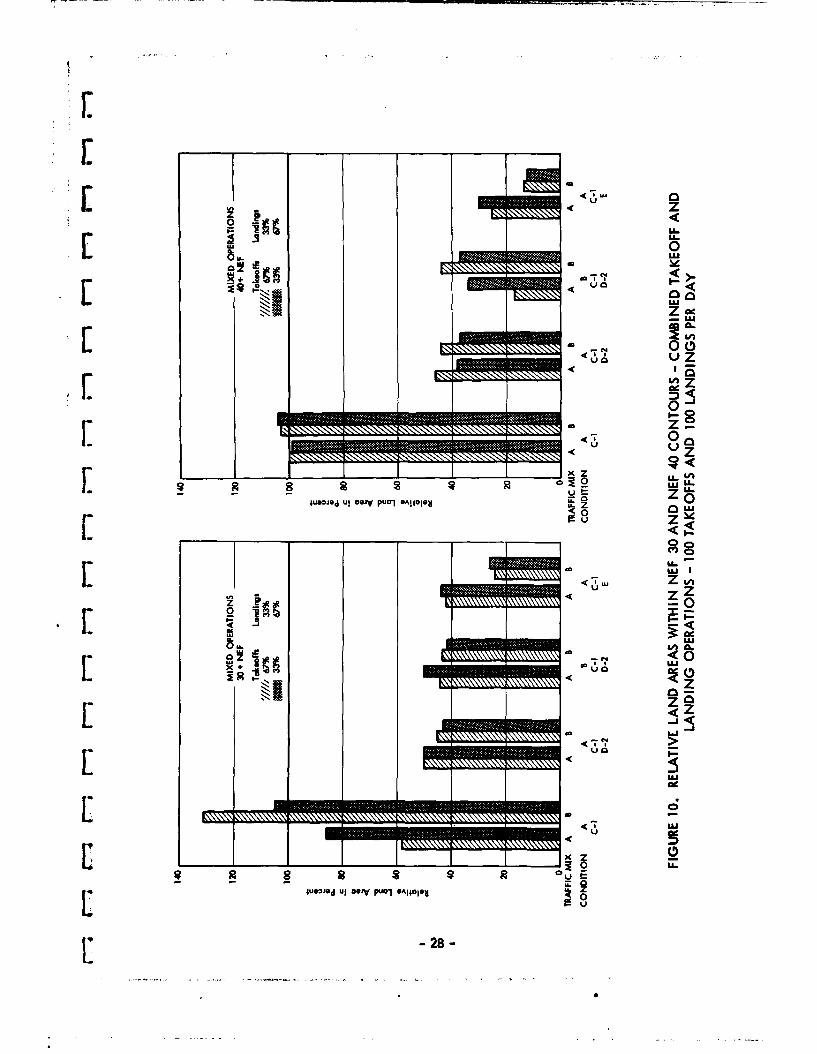
10 RELATIVE LAND AREAS WITHIN NEF 30 AND NEF 40CONTOURS - COMBINED TAKEOFF AND LANDINGOPERATIONS - 100 TAKEOFFS AND 100 LANDINGSPER DAY . . .... ........... 28
III
IvI!
Jr
LIST OF FIGURES (Con't)
5 Figure No. Page No.
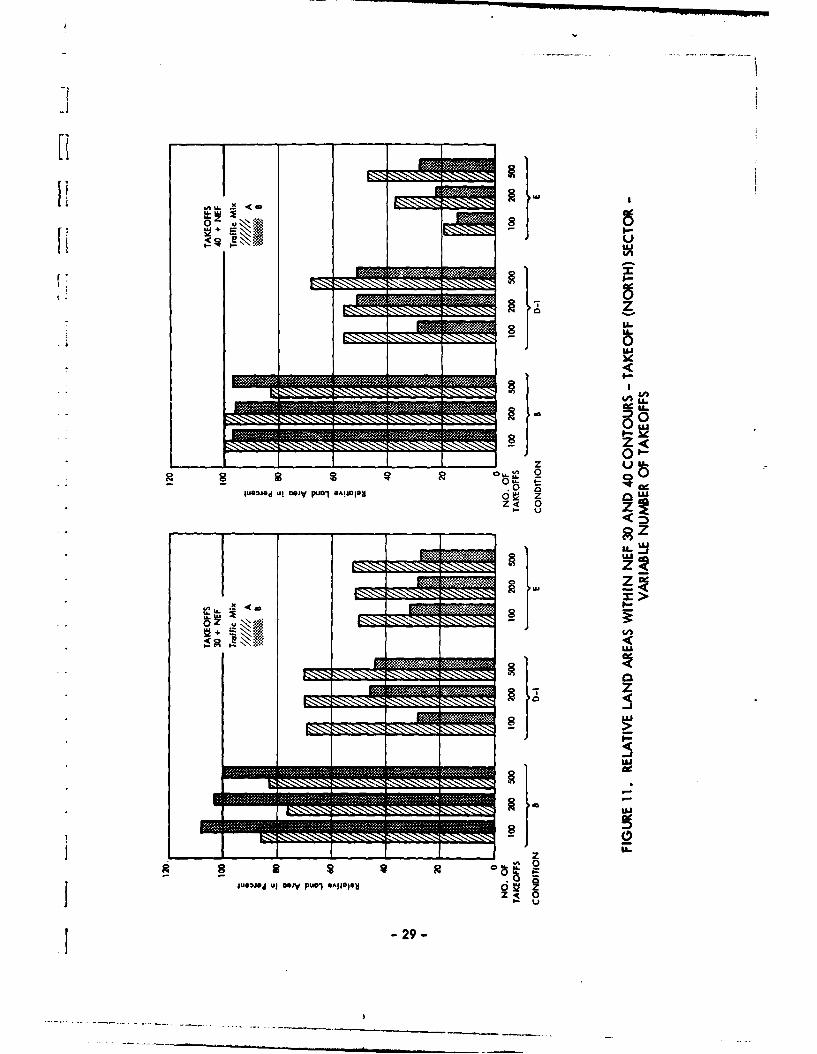
3 11 RELATIVE LAND AREAS WITHIN NEF 30 ANDNEF 40 CONTOURS - TAKEOFF (NORTH) SEC-TOR - VARIABLE NUMBER OF TAKEOFFS . . . 29
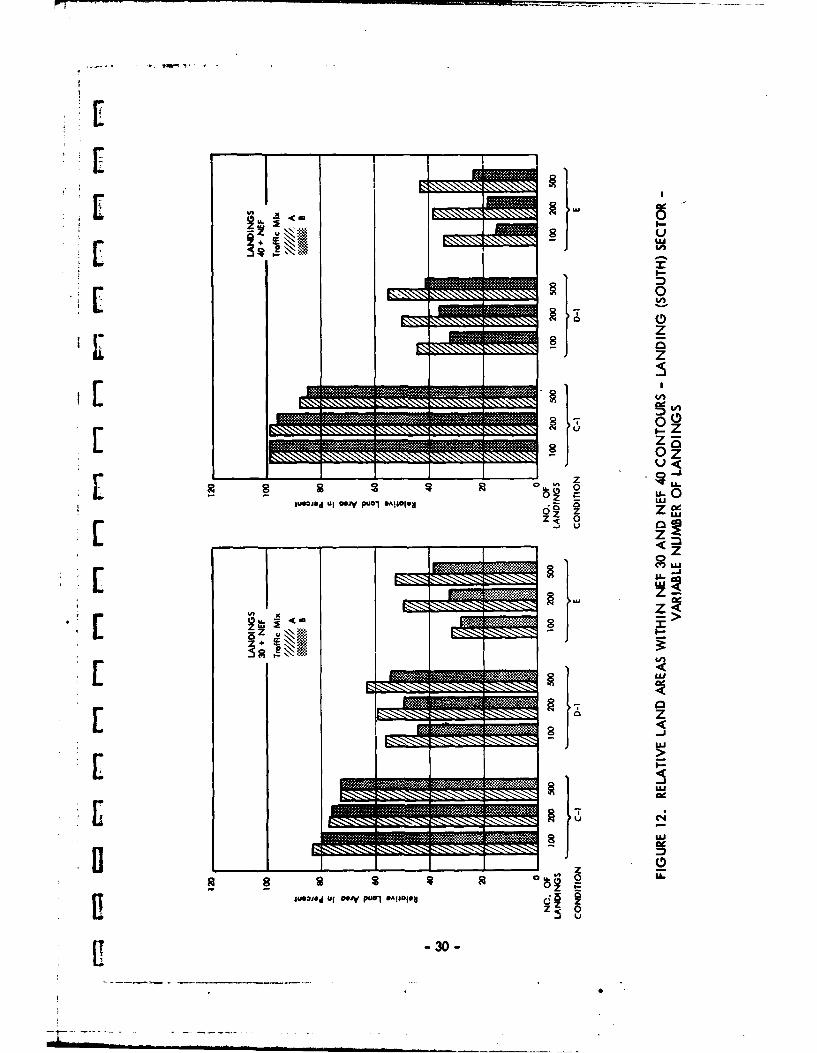
12 RELATIVE LAND AREAS WITHIN NEF 30 ANDNEF 40 CONTOURS -- LANDING (SOUTH) SEC-TOR - VARIABLE NUMBER OF LANDINGS . . . 30
13 VARIATION IN TKAEOFF SECTOR LAND AREASWITHIN NE? 30 AND NEF 40 CONTOURS WITHNUMBER OF TAKEOFFS .. ........ 33
KtIII
I vii
:1,
- -- V
5 I. INTRODUCTION
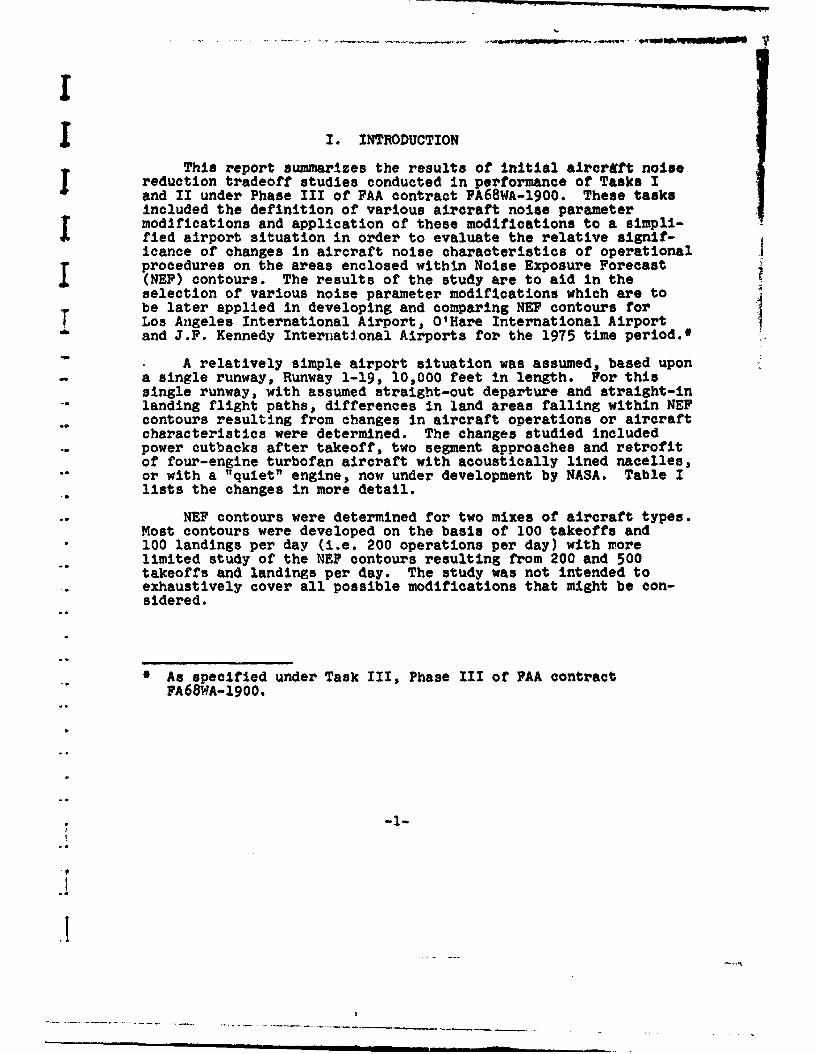
This report summarizes the results of initial aircraft noiseI reduction tradeoff studies conducted in performance of Tasks Iand II under Phase III of FAA contract FA68WA-1900. These tasksincluded the definition of various aircraft noise parametermodifications and application of these modifications to a simpli-fied airport situation in order to evaluate the relative signif-icance of changes in aircraft noise characteristics of operationalprocedures on the areas enclosed within Noise Exposure Forecast(NEF) contours. The results of the study are to aid in theselection of various noise parameter modifications which are tobe later applied in developing and comparing NEV contours forI Los Angeles International Airport, O'Hare International Airportand J.F. Kennedy International Airports for the 1975 time period.*
A relatively simple airport situation was assumed, based upona single runway, Runway 1-19, 10,000 feet in length. For thissingle runway, with assumed straight-out departure and straight-in"landing flight paths, differences in land areas falling within NEFcontours resulting from changes in aircraft operations or aircraftcharacteristics were determined. The changes studied includedpower cutbacks after takeoff, two segment approaches and retrofitof four-engine turbofan aircraft with acoustically lined nacelles,"or with a "quiet" engine, now under development by NASA. Table Ilists the changes in more detail.
NEF contours were determined for two mixes of aircraft types.Most contours were developed on the basis of 100 takeoffs and100 landings per day (i.e. 200 operations per day) with morelimited study of the NE? contours resulting from 200 and 500takeoffs and landings per day. The study was not intended toexhaustively cover all possible modifications that might be con-sidered.
* As specified under Task III, Phase III of FAA contractPA68WA-1900.
* -1-
°.
I P
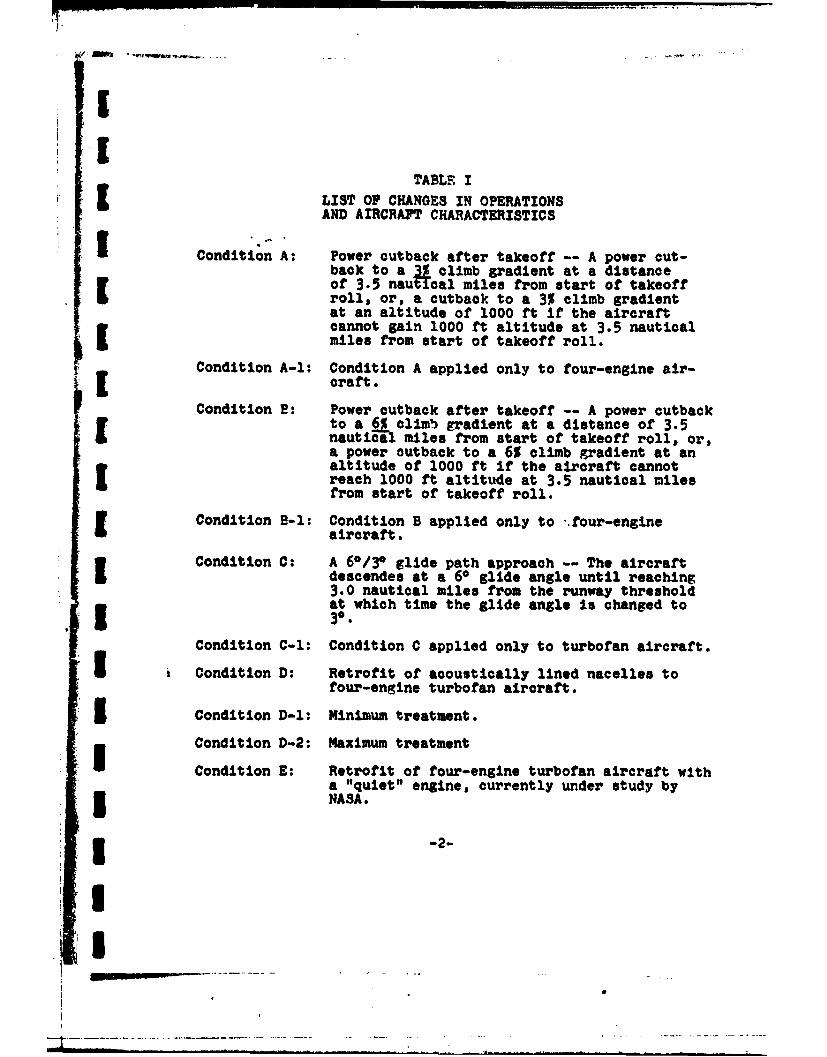
TABLE ILIST OP CHANGES IN OPERATIONSAND AIRCRAFT CHARACTERISTICS
Condition A: Power cutback after takeoff -- A power cut-back to a 3 climb gradient at a distanceof 3.5 nau~cal miles from start of takeoffrolls or, a cutback to a 3% climb gradientat an altitude of 1000 ft if the aircraftcannot gain 1000 ft altitude at 3.5 nauticalmiles from start of takeoff roll.
Condition A-l: Condition A applied only to four-engine air-craft.
Condition B: Power cutback after takeoff -- A power cutbackto a 6% climb gradient at a distance of 3.5nautical miles from start of takeoff roll, or,a power outback to a 6% climb gradient at analtitude of 1000 ft If the aircraft cannotreach 1000 ft altitude at 3.5 nautical milesfrom start of takeoff roll.
Condition B-l: Condition B applied only to "four-engineaircraft.
3 Condition C: A 60/3 glide path approach -- The aircraftdescendes at a 60 glide angle until reaching3.0 nautical miles from the runway thresholdat which time the glide angle is changed to30.
Condition C-l: Condition C applied only to turbofan aircraft.
I Condition D: Retrofit of acoustically lined nacelles to
four-engine turbofan aircraft.
5 Condition D-l: Minimum treatment.
Condition D-2: Maximum treatment
Condition E: Retrofit of four-engine turbofan aircraft witha "quiet" engine, currently under study by
* NASA.
3 -2-
>1
Section II outlines the study approach and basic assump-tions employed in the study. Section III outlines the analysisprocedure. Section IV presents some tradeoff study comparisonsand summarizes the major trends evident from the study.
as
1 -3
.I
1J
II. STUDY APPROACH AND ASSUMPTIONS
[L A. Noise Exposure Forecast Procedures
Noise Exposure Forecast (NEF) procedures have been developedIn the parallel studies of references 1 and 2. The procedures inthis report follow closely those of reference 1.* Basically,the NEF proc 'ures provide estimates of the total noise environ-
ment arisin. .-rom the multiple operations of aircraft during take-off and lrin.a operations in the vicinity of an airport. The NEFvalues are calculated from knowledge of: (a) measures of the
~ r aircraft flyover noise described in terms of the Effective Per-b ceived Noise Level (EPNL), expressed in EPNdB; and (b) the average
number of flyovers per daytime and per nighttime periods. Forconvenience, the basic equations for calculating the NE? valuesat a ground position are given in the Appendix.
One of the major applications of the NEF procedures is incomparing the noise environment near an airport for both currentand expected future conditions and to examine the effects onland use of changes in modes of operations or mixes of air-craft. In these circumstances one must consider the effect ofnumbers of operations of different types of aircraft. Since oneis concerned in determining the total noise exposure resulting
r from the operation of a number of aircraft of various character-istics, trip lengths, etc. precise descriptions of aircraft noiseand aircraft performance may be replaced by approximations. Hencegeneralized descriptions of aircraft noise in terms of EPNL vadistance curves and generalized aircraft takeoff and landingprofiles will usually be adequate.
Interpretations of the NEP values in terms of expected influ-ence on various land uses and expected community response aregiven in references 1 and 2. In this report, contours of NEF 30and 40 values are given. These define the three Noise ExposureForecast areas described in Table II of reference 1.
£ * Currently, Committee A-21 of the Society of Automotive Engineersis reviewing the NEF procedure of reference I and 2 for the pur-pose of recommending a common procedure use. For the purposesof the current study, differences in calculation proceduresbetween those discussed in this report and those under considera-tion by the SAE are not likely to be large.
im
iI
U
T
B. Aircraft Noise And Performance Characteristics
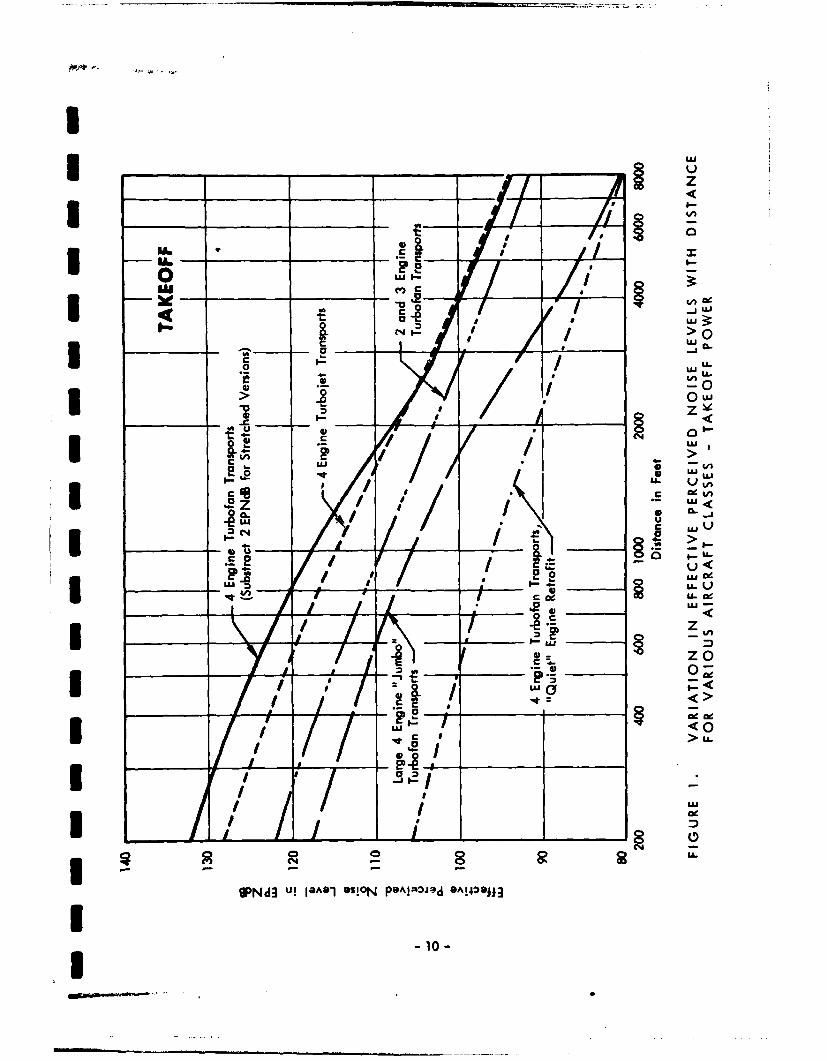
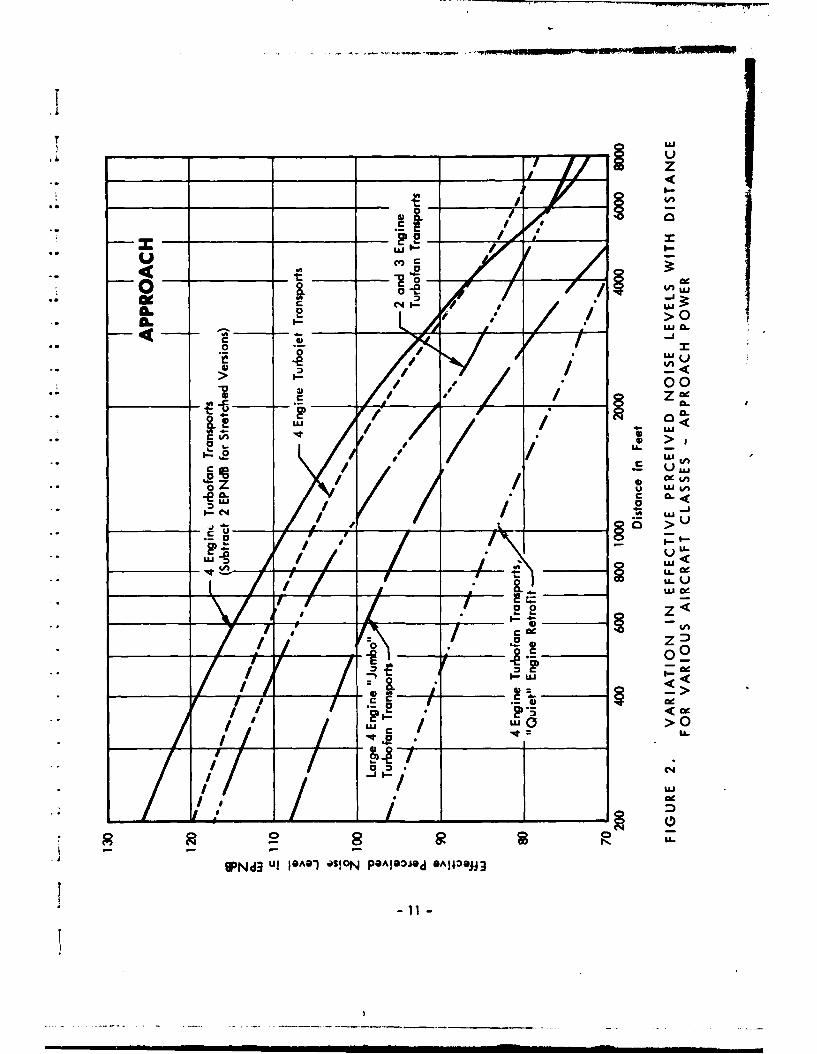
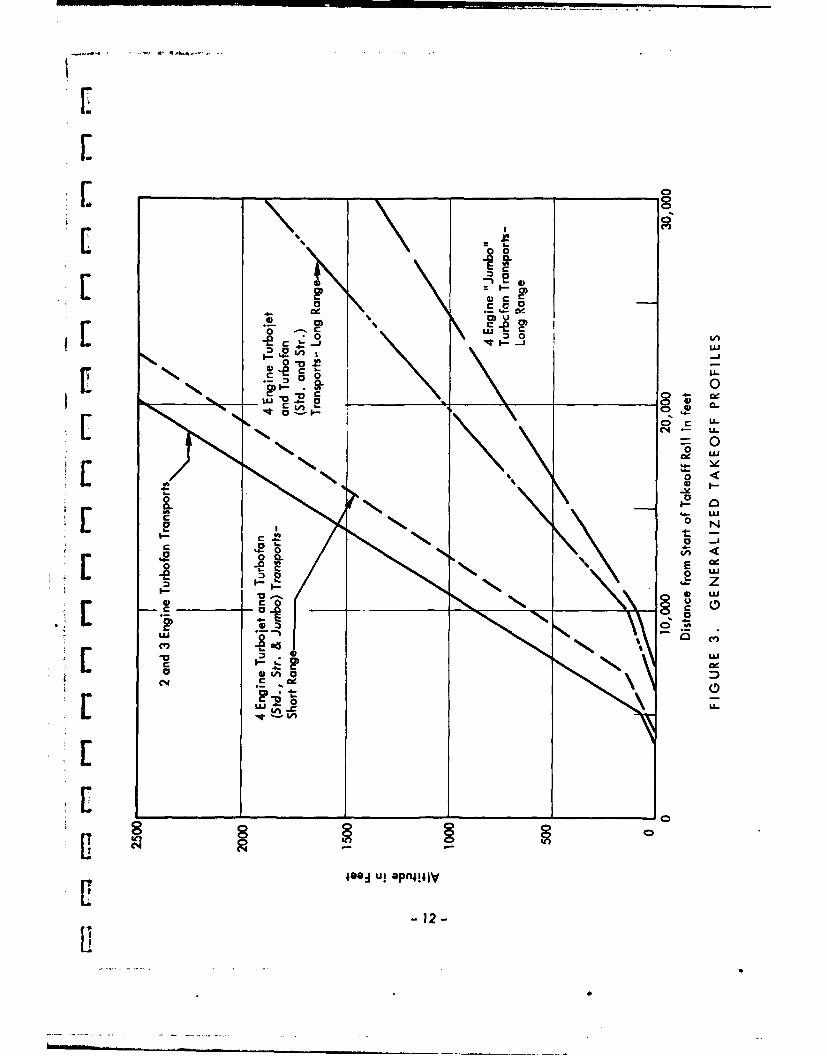
J In this study the major aircraft classifications and thenoise and takeoff and landing profile characteristics for theseclassifications are the same as utilized in reference 1. Figures1 and 2 present the EPNL vs distance characteristics for air-to-ground sound propagation. Figure 1 shows the takeoff character-istics while Fig. 2 shows the approach characteristics.* Figure
I 3 shows the basic takeoff profiles assumed in the study.
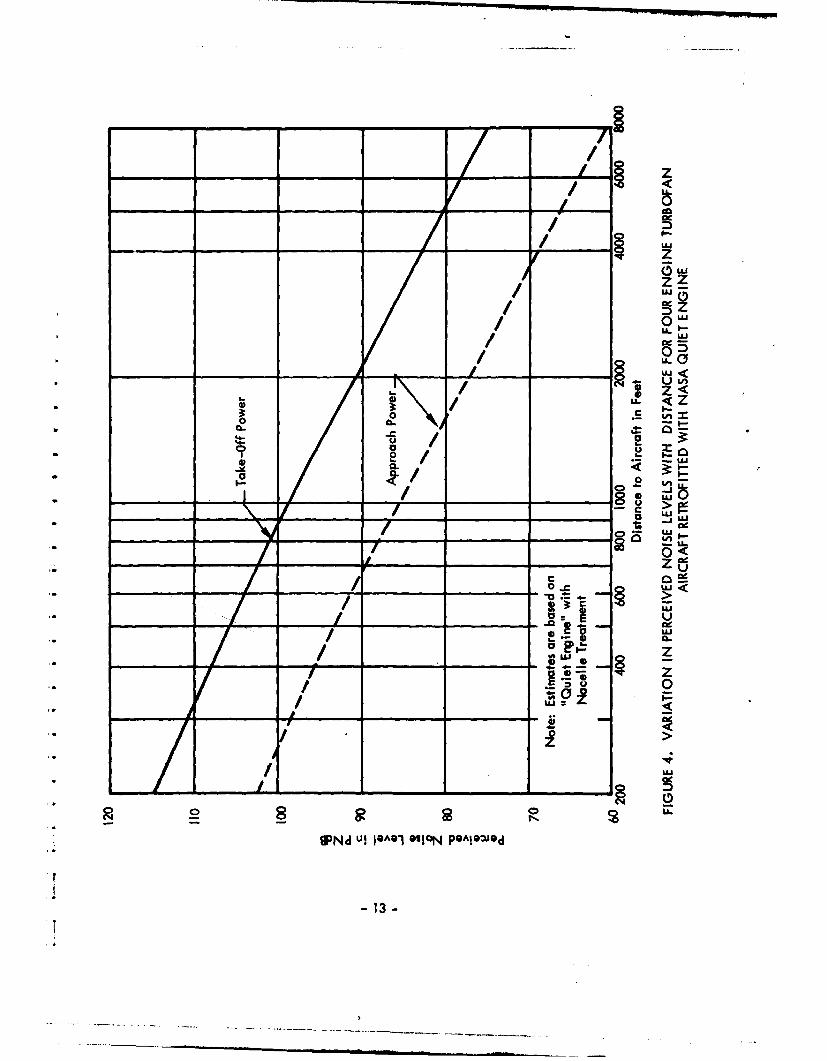
The estimates for the four-engine turbofan aircraft retro-fitted with the "quiet" engine are based upon perceived noiselevel estimates provided by NASA, reference 3, and further inter-preted by BBN for the purposes of this study. The perceived noiselevel (PNL) vs distance curves assumed for the quiet engine areshown in Fig. 4.
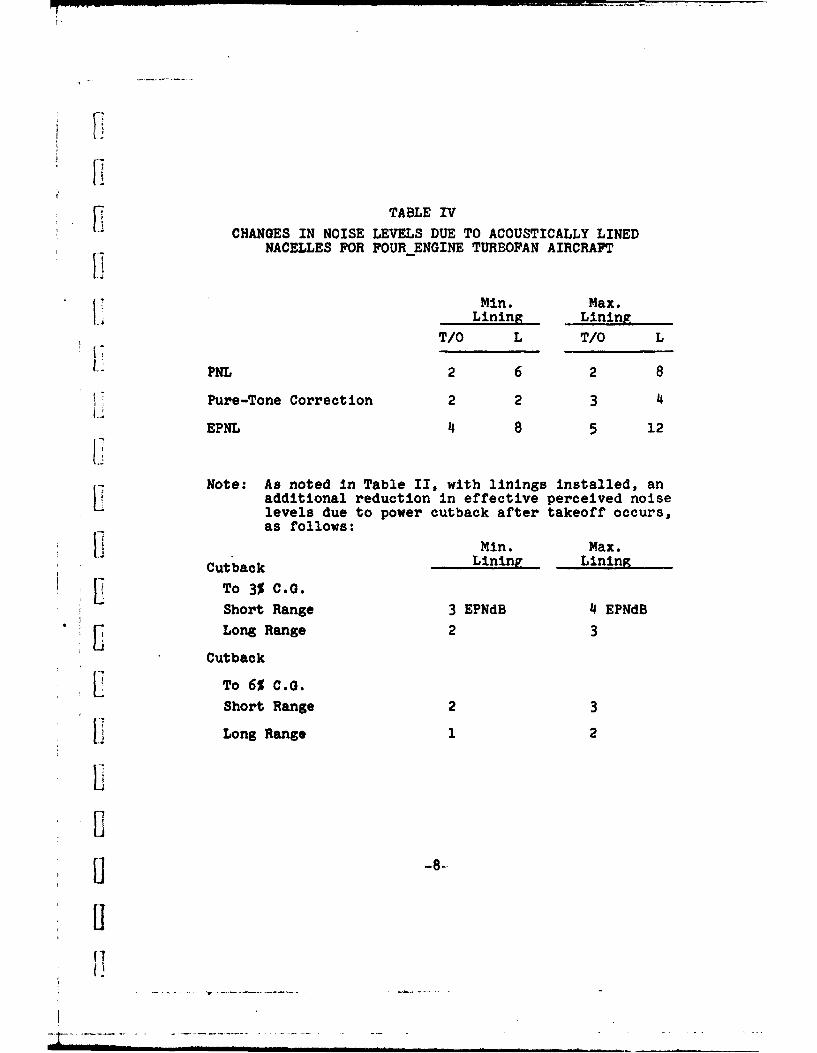
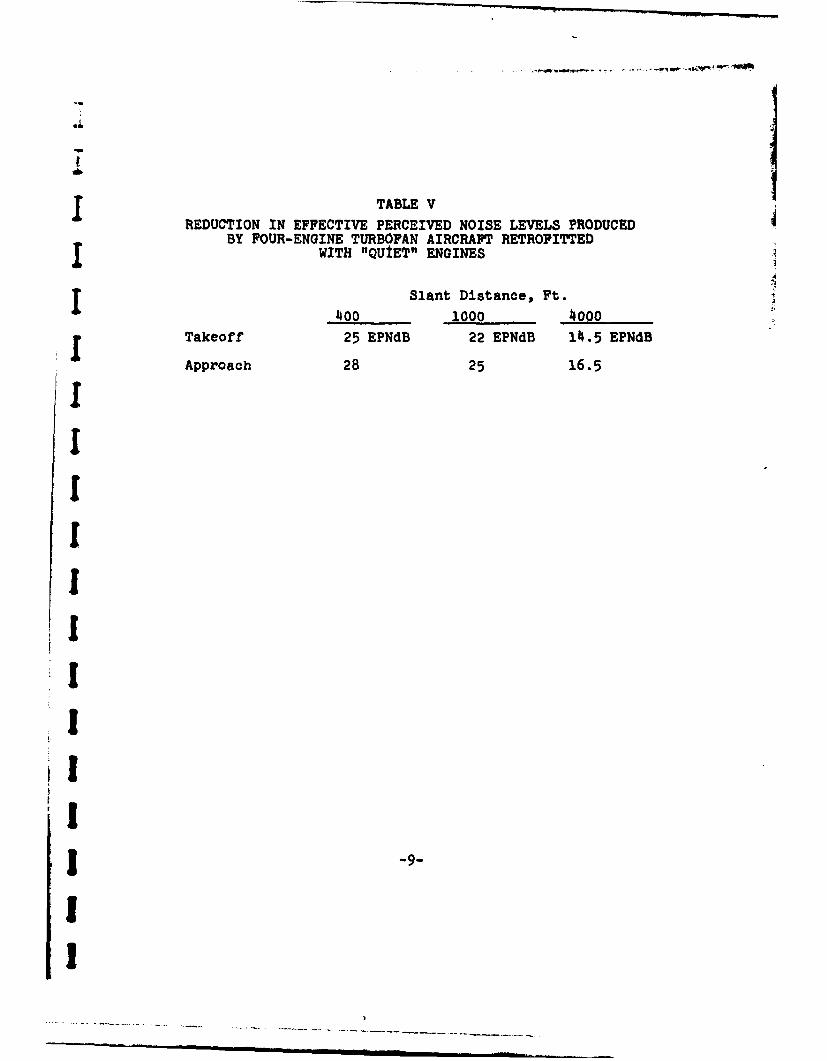
Table I lists the changes introduced in the study; Fig. 5illustrates the changes in profiles introduced by the power cut-back after takeoff, and by the two segment approach. Tables IIthrough V lists the changes in noise levels assumed for thevarious conditions listed in Table I. Table II lists the reductionin noise level assumed due to power cutback after takeoff (conditionsA and B of Table I). Table III lists the reduction in approachnoise for a 6 degree glide slope compared to a 3 degree glideslope (condition C). Table IV lists the changes in noise levelsassumed due to retrofit of acoustically-lined nacelles to largefour-engine turbofan aircraft (condition D). Two degrees ofeffectiveness in the nacelle treatment were assumed. The changein effective perceived noise levels assumed for the quiet engineretrofit (condition E) is summarized in Table V. (These valueswere obtained from comparison of the curves given in Figs. 1 and2.) A change in takeoff performance was also assumed with theengine retrofit, resulting from an increase in thrust for the quietengine.
SAE Committee A-21 is reviewing available noise informationand revised EPNL vs distance curves have recently been developed.These characteristics will be used in future NEF studies. How-ever the differences in noise data would not result in majorchanges in the findings presented in this report.
I
Iii
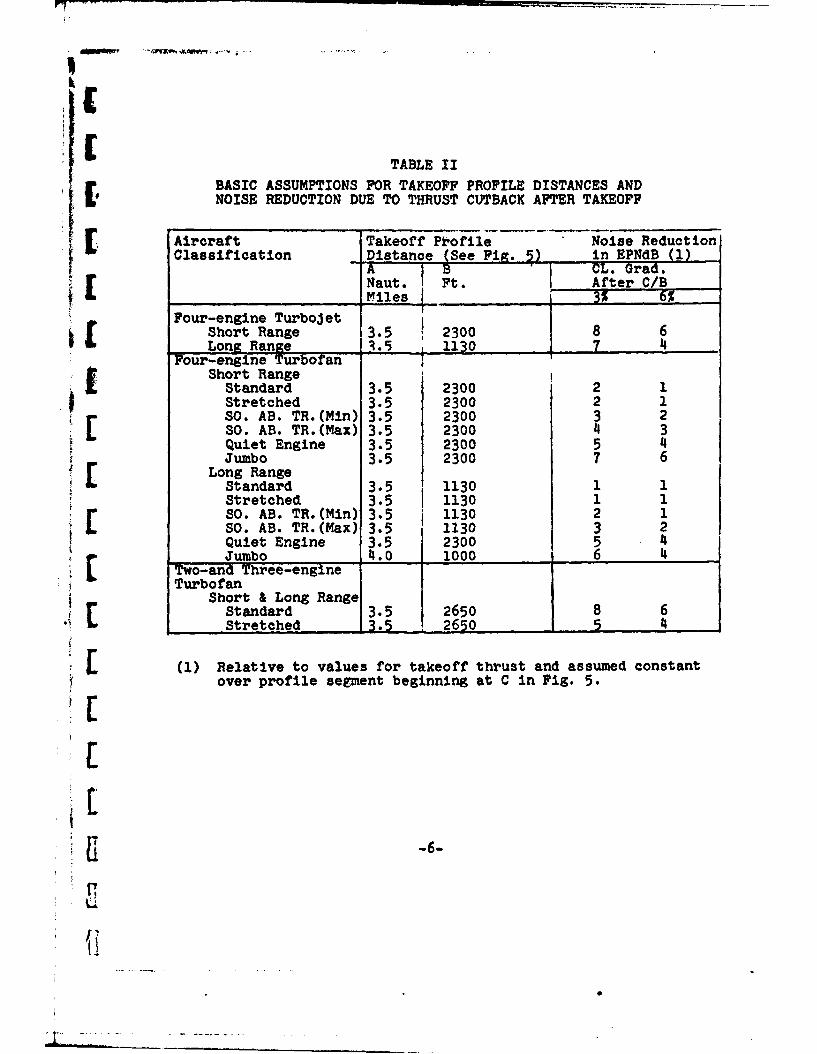
TABLE IIBASIC ASSUMPTIONS FOR TAKEOFF PROFILE DISTANCES ANDNOISE REDUCTION DUE TO THRUST CUTBACK AFTER TAKEOFF
Aircraft Takeoff Profile Noise Reduction
Classification Distance (See Pig. 5) in EPNdB (1)A71 B CL. Grad.Naut. Ft. After C/BFiles 3 6%
Four-engine TurbojetShort Range 3.5 2300Long Range 3.5 1130 7 4
Four-engine TurbofanShort Range
Standard 3.5 2300 2 1Stretched 3.5 2300 2 1
r SO. AB. TR.(Min) 3.5 2300SO. AB. TR.(Max) 3.5 2300 4 3Quiet Engine 3.5 2300 5 4Jumbo 3.5 2300 7 6
Long RangeStandard 3.5 1130 1 1Stretched 3.5 1130 1 1SO. AB. TR.(Min) 3.5 1130 2 1SO. AB. TR.(Max) 3. 11303 2Quiet Engine 3.5 2300 5 4Jumbo 4.0 1000 6 4
Two-and Three-engine ITurbofan
Short & Long Range Ir Standard 3.5 2650 8 6Stretched 35 2650 605 4
L (1) Relative to values for takeoff thrust and assumed constantover profile segment beginning at C in Fig. 5.
S~-6-
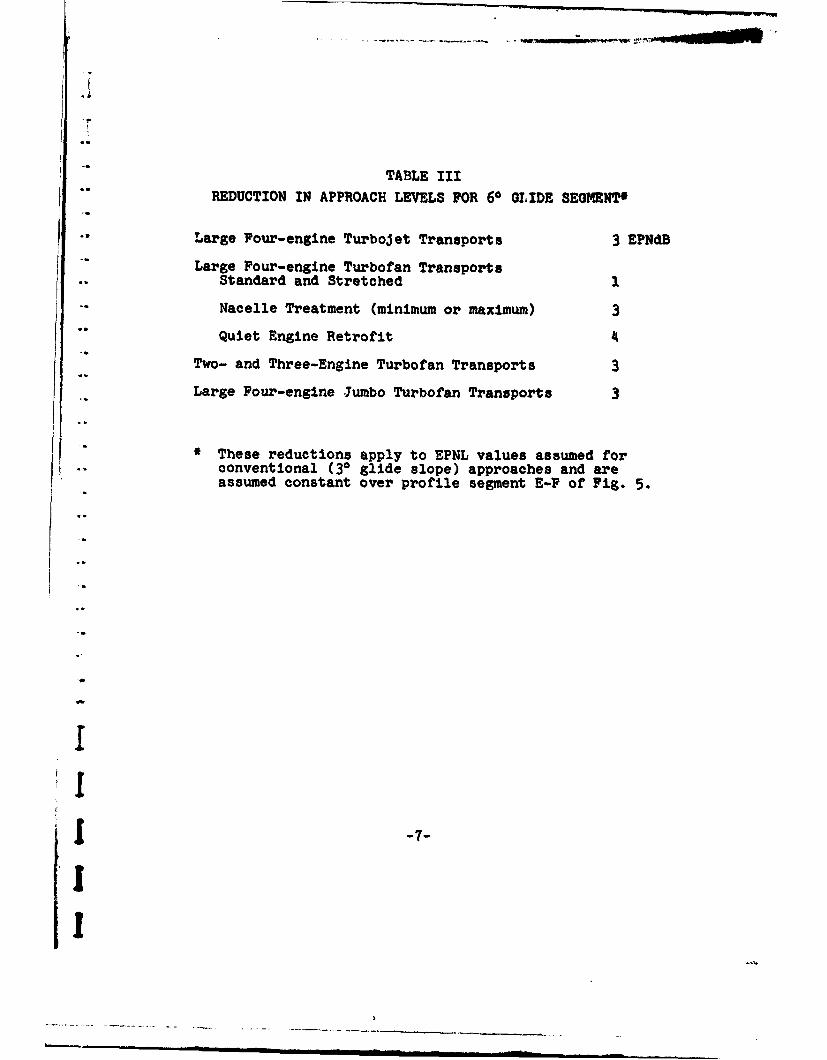
TABLE IIIREDUCTION IN APPROACH LEVELS FOR 66 GLIDE SEGMENTO
"Large Four-engine Turbojet Transports 3 EPNdB"Large Pour-engine Turbofan Transports
Standard and Stretched 1
-" Nacelle Treatment (minimum or maximum) 3Quiet Engine Retrofit 4
Two- and Three-Engine Turbofan Transports 3.. Large Four-engine Jumbo Turbofan Transports 3
These reductions apply to EPNL values assumed forconventional (30 glide slope) approaches and areassumed constant over profile segment E-F of Fig. 5.
iI
[I
F TABLE IV
CHANGES IN NOISE LEVELS DUE TO ACOUSTICALLY LINEDl JNACELLES FOR FOUR ENGINE TURBOFAN AIRCRAFT
Mini. Max.SLining Lining
T/O L T/O L
PNL 2 6 2 8
Pure-Tone Correction 2 2 3 4
EPNL 4 8 5 12
Note: As noted in Table II, with linings installed, anadditional reduction in effective perceived noiselevels due to power cutback after takeoff occurs,as follows:
L1 Min. Max.Cutback Lining Lining
To 3% C.G.
Short Range 3 EPNdB 4 EPNdBLong Range 2 3
Cutback
STo 6% C.G.Short Range 2 3
SLong Range 1 2
I.
I (1m
Ib
TABLE VREDUCTION IN EFFECTIVE PERCEIVED NOISE LEVELS PRODUCED
BY FOUR-ENGINE TURBOFAN AIRCRAFT RETROFITTEDIWITH "QUtET" ENGINES4
I Slant Distance, Ft.400 1000 4000
Takeoff 25 EPNdB 22 EPNdB 14.5 EPNdB
Approach 28 25 16.5
9II!I
III
I
I
1m I l !a -
- I1
IVJif.
IM IC-0 A
) CC00
-o0
U~ __
% -1
E LLS
IL. u nC C~
LUU
aI C4 c LU
1LLI<LU LZ.
ILLLLU M
I -10- mA
z
La-
0 c0
_0 -e_ -J
IL 0
0 &LIL-eI- 00
u.U
cILU
.a- c..kAz ISO IJ &
9L 8 LUL d !IL IO PASJd A4OJ
I- C141-
% 0
0 --- r-03 0
LLJ
0
0<
0-
0 N
S4AE
[0 UJ0
1% 0
D iL
cr- 12 D
[12
/L____ ___ _ __ __ _ ___0
I LA9x
0 LAJ(
U-IU Lop
E- in X41 @:
o 0
31 1-Of
a 0 -0
a- / 04 & LL
al:
713-

tv m S .- cu ! I ,•I II I I;•I l,,••.l 2 •....... a. '•'-.~ a'-' - r e - '~ .... r • '......% 'r'• ..... .
II1[
NOW .0 - .a - -
S[ ~/// b
A. Broke Release
B. Liftoff
[ a C. Begin Thrust Cutback
D. Begin Cruise
S[(a) Thrust Cutbacic After Takeoff
[ E. Begin First Segment Approach
F. Begin Second Segment Approach
G. Touchdown
Approx. 1000'
3 N. Miles j1000Runway
(b) Two Segment Approach Threshold
FIGURE 5. AIRCRAFT FLIGHT PROFILE MODIFICATIONS
[1 -14-
III. ANALYSIS PROCEDURE
A. Airport Operations
The Noise Exposure Forecast value at a particular groundII point near an aircraft flight path is dependent upon the noiselevels produced by the different types of aircraft and the numberof operations (per day) of each type of aircraft that generate these
j levels. The sizes and shapes of the NEP contours are dependentupon the total number of flights per day and the proportions ofaircraft types making-up t he total number of operations. Thus,the changes in NEF contours produced by a given change in aircraftcharacteristics will be dependent upon both the volume of operationsand the various proportions of aircraft making-up the total aircraftmix.
In this study, two different aircraft mixes were chosen. Theproportion of aircraft in the two mixes are listed in Table VI.Mix A has a relatively high proportion of two-.and three-engineturbofan aircraft and a significant proportion of large four-" engine turbofan aircraft operating at relatively short ranges(less than 2000 nautical miles). It is representative of themix of aircraft at large midcontinent airports--Chicago O'HareAirport, for example. Mix B includes a relatively high pro-portion of large four-engine turbofan aircraft operatins over
-long ranges. The proportion of two- and three-engine turbofanaircraft is relatively small. This mix is typical of airportshandling many intercontinental flights--New York J.P. KennedyAirport, for example.
For a large portion of the study, 100 takeoffs and 100 landingsper daytime period for each mix was assumed (i.e. a total of 200operations per day). For several changes, NEF contours were alsocalculated with the number of operations, takeoffs and landingsfor each mix increased to 400 and 1000 per day.*
• The study was not extended beyond 500 takeoffs and 500 land-ings (1000 operations) since a review of the expected volumeof operations per runway at several major airports indicatedthat a maximum utilization of a single runway for 1975 isunlikely to exceed 1000 operations of the jet powered aircraft"considered in our study.
15
S~-15-
]
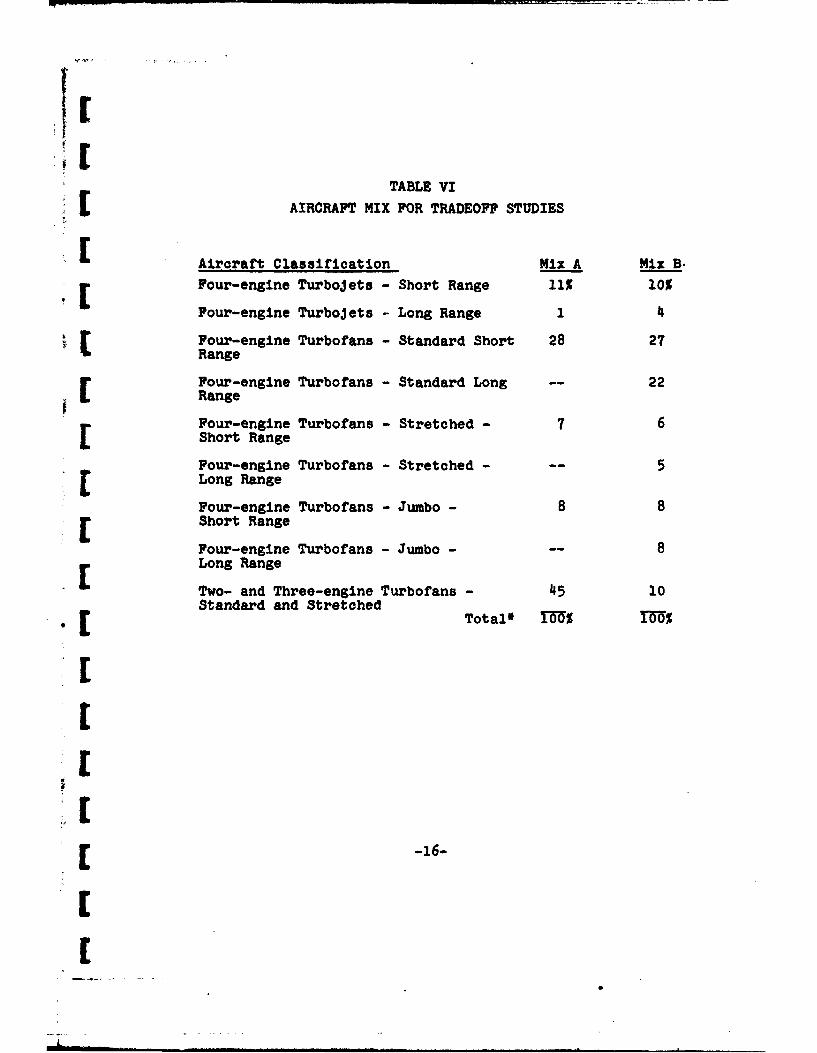
TABLE VI
AIRCRAFT MIX FOR TRADEOFF STUDIES
Aircraft Classification Mix A Mix B.[ Four-engine Turbojets - Short Range 11% 10%
Four-engine Turbojets - Long Range 1 4
v Four-engine Turbofans - Standard Short 28 27Range
Four-engine Turbofans - Standard Long 22Range
Four-engine Turbofans - Stretched - 7 6Short Range
Four-engine Turbofans - Stretched - 5f Long RangeFour-engine Turbofans - Jumbo - 8 8
[ Short Range
Four-engine Turbofans - Jumbo - 8r Long RangeTwo- and Three-engine Turbofans - 45 10Standard and Stretched'C Total* O%•_M0%
[
[
[ -6
I"B. Runway Utilization
The shape and size of Noise Exposure Forecast contours under"any flight path are also affected by the type of operations(takeoff or landing) as well as the mix of aircraft and volume ofoperations. Some runways may be used for both takeoff and land-ing operations and adjacent areas may be exposed to noise fromboth takeoff and landing operations. Other areas may be exposed"to only takeoff noise or only approach noise.
In our study, we considered two runway utilizations, sketched-. in Fig. 6. For most of the study, we considered "one-way"1
operations with Runway 1 carrying 100% of the takeoffs and 100%of the landings. However, for several trials, we considered variedoperations where Runway 1 carried 67% of the takeoff operations"and 67% of the landing operations, while Runway 19 carried theremaining 33% of takeoff and landing operations.
-- C. NEF Area Calculations
Based upon the runway configurations and aircraft mixesdescribed above, NEF areas were computed for a number of trials.The different trials included baseline operations with no changes"introduced, operational changes, changes in aircraft character-istics and combination changes in which changes in operations andchanges in aircraft were considered.
For each trial, coordinates for NEF 30 and 40 values weredetermined by a digital computer. NEF 30 and 40 contours werethen determined and the land areas falling within the two contourswere computed. In determining the areas, the land around the
* airport was divided into three sectors as shown in Fig. 6. Thetakeoff, or north, sector refers to the land area north of the
"". north end of Runway 1-19 i.e. extending beyond 10,000 feetfrom the start of Runway 1. The landing,or south sector refers
"- to land areas south of the south end of Runway 1-i9. Thesideline sector includes areas to either side of the runway asindicated in Fig. 6. For each of the sectors the land areasexposed to NEF values in excess of 30 and in excess of 40 weredetermined.
Table VII lists for each trial the land areas falling withinthe .`EF 30 and NEF 40 contours for each of the airport sectors.
- This data provides the basis for the discussion presentedin the following section.
-17-
i v | | | l • b

TABLE VII
LAND AREAS WITHIN NEF 30 AND NEU 40 CONTOURS
p AIRPORT SECTOR1
AREAS IN SQ. MI.
T.O. (N) SIDELINE L (S)
2 R/W NEF NEF NEF NEF NEF NEFTrial Changes Util.3 Mix 40+ 30+ 40+ 30+ 40+ 30+
1* None (a) A 0.498 4.870 0.996 2.124 0.rI1 2.989B 1.265 7.988 1.080 2.160 0.792 3.739
2 A (a) A 0.498 4.027 0.996 2.124 ... ...1.293 12.469 1.077 2.157 ... ...
3 A-I (a) A 0.498 4.700 0.996 2.124 ... ...B 1.291 11.922 1.077 2.157 ... ...
4 C (a) A ... ... ... ...- 0.609 2.358R ---- 0.789 2.836L C-I (a) A --- --- 0.609 2.472B --- --- --- --- 0.790 2.991
6 D-1 (a) .1 0.277 3.350 0.834 1.927 0.267 1.688P 0.758 4.552 0.862 1.864 0.254 1.657
7 D-2 (a) A 0.256 3.164 0.804 1.895 0.235 1.542B 0.672 4.090 0.181 1.808 0.163 1.309
8 A,C-1,D-2 (a) % 0.256 2.155 0.804 1.895 0.234 1.387B 0.665 3.789 0.816 1.803 0.163 1.245
9* None (b) A 0.573 4.194 0.937 2.012 0.602 3.602R 1.125 6.393 1.025 2.091 0.960 4.954
I0 A,C-1 (b) A 0.572 3.639 0.937 2.012 0.598 3.117B 1.157 8.358 1.023 2.087 0.995 5.210
11 A,C-1,D-2 (b) A 0.262 2.110 0.723 1.733 0.230 1.789B 0.495 2.902 0.730 1.662 0.357 2.122
12 E (a) A 0.096 2.426 0.653 1.756 0.206 1.385B 0.176 2.245 0.573 1.524 0.116 1.040
13 A,C-1,E (a) A 0.096 1.853 0.653 1.756 0.205 1.307B 0.176 1.798 0.573 1.524 0.116 1.049
14 A,C-1,E (b) A 0.142 1.777 0.594 1.607 0.181 1.575
B 0.145 1.535 0.510 1.383 0.117 1.309
r15 B (a) A 0.498 4.192 0.996 2.124B 1 . 2 3 0 8 . 5 9 9 1 . 0 7 7 2 . 1 5 7 . . .. . .
16 B-1 (a) A 0.498 4.782 0.996 2.124 ... ...B 1 . 2 3 0 8 . 3 40 1 . 0 7 7 2 . 3 0 0 . . . . . .
17 B,C-I,D-2 (a) A 0.256 2.376 0.804 1.895 0.234 1.387B 0.665 3.436 0.816 1.803 0.163 1.245
18 B,C-1,D-2 (b) A 0.263 2.139 0.725 1.736 0.230 1.803B 0.495 2.762 0.730 1.662 0.357 2.076
19 B,C-I,E (a) A 0.096 1.852 0.653 1.756 0.205 1.307B 0.176 1.786 0.573 1.524 0.116 1.040
* .. 20 A,D-I (a) A 0.832 1.926 0.304 2.448 ... ...
B 0.858 1.858 0.746 4.976 ... ...
21 B,D-I (a) A 0.832 1.926 0.304 2.468 ... ...
"B 0.858 1.858 0.748 4.072 ... ...
22* --- (a) A 1.284 2.548 0.964 10.170 1.042 4.548B 1.358 2.568 2.084 15.612 1.322 5.497
23* --- (a) A 1.738 3.146 2.356 27.186 1.951 7.364B 1.798 3.098 4.238 39.684 2.467 8.676
24 B,C-I (a) A 1.284 2.548 0.964 7.776 1.036 3.494B 1.356 2.564 1.998 16,022 1.270 4.172
25 B,C-I (a) A 1.738 3.146 1.964 22.442 1.726 5.356B 1.796 3.0-1 4.126 39.798 2.106 6.320
26 D-1 (a) A 1.096 2.3L. 0.634 7.104 0.516 2.682B 0.980 2.116 1.066 7.222 0.482 2.690
27 D-1 (a) A 1.554 2.990 1.604 18.928 1.068 4.644B 1.376 2.692 2.166 17.410 1 016 4.686
28 E (a) A 0.912 2.216 0.354 5.236 0.394 2.221B 0.784 1.914 0.462 4.366 0.240 1.779
29 E (a) A 1.374 2.870 1.112 14.158 0.844 3.860B 1.150 2.526 1.168 10,578 0.566 3.306
SBaseline - no change introduced 3 (a) R/W 1 -100%See Figure 6 4(b) R/W 1 - 67%; F/W 19 - 33%
U 2See Table I for description of changes See Table VI

.19 19
EP lI - I~. CI
I-I
00
"One - Way" Operlons "Combined" Operaton
FIGURE6. SKETCH OF RUNWAY AND FLIGHTi PATH CONFIGURATIONS
19-
1U, !S
S. . . . - - . m m I | Ir |
[
IV.. TRADEOFF STUDY COMPARISONSComoartlsons of the effect of various changes can be made
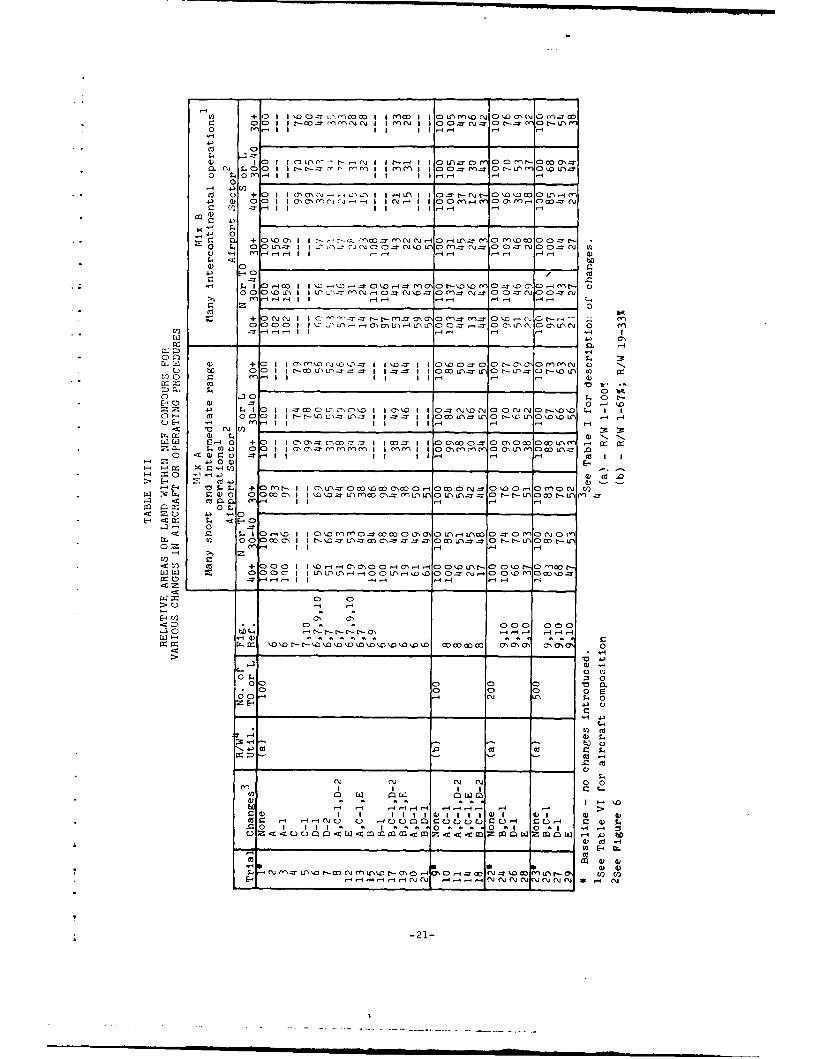
directly using the data provided in Table VII. To facilitatemaking comparisons in terms of area cha~nges, the data providedfor the takeoff (north) and landing (south) sectors have beenre-tabulated in Table VIII in terms of percentages. The per-centages were computed by taking the baseline NEF areas as 100%If and comparing the NEF areas for succeeding changes with respectto the baseline areas. Separate baselines were considered foraircraft Mix A and Mix B.
i An example will perhaps make the procedure clearer. Figure7 shows the NEF contours for Mix A, Trials 1 and 6. Shown inthe figure are the areas computed for the land within the NEF30 and NEF 40 contours. (These are also tabulated in Table VII.)Trial 1 Is the baseline reference (no changes); in Trial 6, theretrofit of four-engine turbofan aircraft with lined nacelles(limited effectiveness) has been introduced. If one now compares$1 the area exposed to NEF 30+ values for the takeoff sector (Trial6) with that for the baseline (Trial 1), one obtains a ratio of
- 3.35 sq. mi. to 4.87 sq. mi. or 69%. It is this value that istabulated in the appropriate column of Table VIII.I The percentage chanees given in Table VIII are also presentedin graphical form in Figs. 8 through 12. Figure 8 showsvarious land area percentages for the takeoff sector. Separategraphs are shown depicting the relative area changes for NEF30+ and NEF 40+ land areas. Figure 9 shows a correspondingcomparison for the landing sector. Figure 10 shows a comparisonfor mixed takeoff and landing operations. Figures 11 and 12compares the percentage changes in takeoff and landing sectorland areas for three different total number of operations studied.
A number of comparisons and changes may be noted. A summaryof the most pertinent comparisons are tabulated in Table IX.Only the most important ones will be discussed Individually.
"1 I -20-
cm
C>) +01 1 '00 .r m n (V I I mC'~0 I I C O NZU)L z r - "0 01 1 r~nC4II'(J 0 . j O - ~U
0 0m I-I II 1-4-4 -
Co) U + ) I r\ ___. -____n __ NI 1 N_
I, Q 0 CI M Ot))1 n -, -( N I 4 0 0Lt) I 0 00 ~m-0 C~m
o~~ ~ ""0fl-I -o "0 1c,-I4' 0
r_ C4 +0.)tNa 0 -XM/lCi - 1 \-X() ýM DC 0 0-rrCa 0 +0 1 U 0"R- -,--. N' c II -*- l'.ý Ir o 0.m-eTNý -rj o.0o o0r,-.,
-) ) 00 I-I 00 1 1 ý 4- 0 ID CN-I = m 0) -C)t Dý T1 3 )- ý
0 Y r4 r--4I II 1-I-I 4
V) x -H 0
bi C)C I 00 u-s. U- -7 1~ 1j =7 0 OD- V\J'\ zrl C unC 0 t-- u '.) 0 o t- \.o ) Ct)
M ) 0 C_ _ _ __ _ _ M0a
U - EE-.0
I- 011C r-4C ý I ~ c M= 0 ' at\ 00 0 C0o C D 00, UDU'0) 0ý 0 C Cr\ I Iý mC . ) C'.) -4 m. m~ I0 C) 0 ý C"4 m' C 0 0 U-\ (-C0 0 or ('Z
ý f V . +0 fn00 I1 (3, l - 0-0 \0 0L70 01 0 -00 O L\0 0 0 m 0C\j 0V) '-l C .- II I-14 - I1
- - 0
00 \0 I .: - 00 )a N nr 3c 70M0C0(m. 0. a) + OD (7 E- \. ý7L -0 C'. l I -ý -7 -oo Z -- I 0 M0.O= 7 00 t- '00 -'.C.J U N
-C .20 ca T O 4a C ' Cýr4riC k l , -DýoC-0ý0(-' 0)I -0 0 c- '0 ' ný ' r 0ID00=Cjr4 cMC Dý
OE'~1 H I I 4 2
4000000-C -t. . tl a, .- I /4--
r*ýýl~s~~ Io ID *'X14. 0) ma w .00 ýCý0
* ~ yr. 0 00 0 004I' 0u~~ 4 0(-~ CL
44 0 02C I I
-0 r 1-44 1 -- 4 -4-4 'l
-44
*~ *~ 0~ N 00 00
I2- I I 1')
00
o .14
-40) 4-3 l:\3I-M I -4nt- \0 r r -4- DCl='0 D mUt ) VE. ~ ~ ~ ~ . Ca 4 'J \ " C\J -4 C
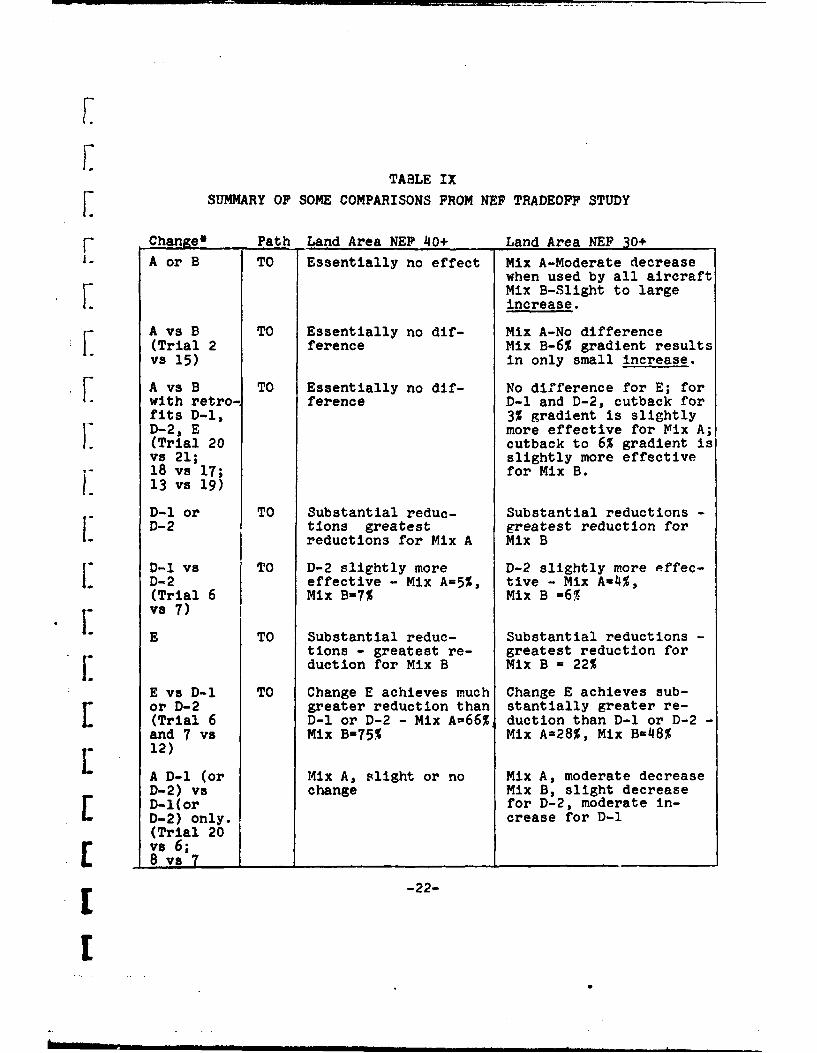
TABLE IX
[ SUMMARY OF SOME COMPARISONS FROM NEF TRADEOFF STUDY
v Change* Path Land Area NEF 40+ Land Area NEF 30+A or B TO Essentially no effect Mix A-Moderate decrease
when used by all aircraftMix B-Slight to largeincrease.
A vs B TO Essentially no dif- Mix A-No difference(Trial 2 ference Mix B-6% gradient resultsvs 15) in only small increase.
A vs B TO Essentially no dif- No difference for E; forwith retro- ference D-1 and D-2, cutback forfits D-l, 3% gradient is slightly
V D-2, E more effective for Mix A;(Trial 20 cutback to 6% gradient isvs 21; slightly more effective18 vs 17; for Mix B.13 vs 19)
D-1 or TO Substantial reduc- Substantial reductions -D-2 tions greatest greatest reduction for
reductions for Mix A Mix B
D-1 vs TO D-2 slightly more D-2 slightly more effec-D-2 effective - Mix A=5%, tive - Mix Aa4%,(Trial 6 Mix B=7% Mix B -6%
vs) 7)
E TO Substantial reduc- Substantial reductions -tions - greatest re- greatest reduction forI" duction for Mix B Mix B = 22%
E vs D-1 TO Change E achieves much Change E achieves sub-or D-2 greater reduction than stantially greater re-(Trial 6 D-1 or D-2 - Mix A=66% duction than D-1 or D-2 -
and 7 vs Mix B=75% Mix A=28%, Mix B=48%12)
A D-1 (or Mix A, slight or no Mix A, moderate decreaseD-2) vs change Mix B, slight decreaseD-l(or for D-2, moderate in-D-2) only. crease for D-1(Trial 20vs 6;8 vs 7,
[ -22-
r
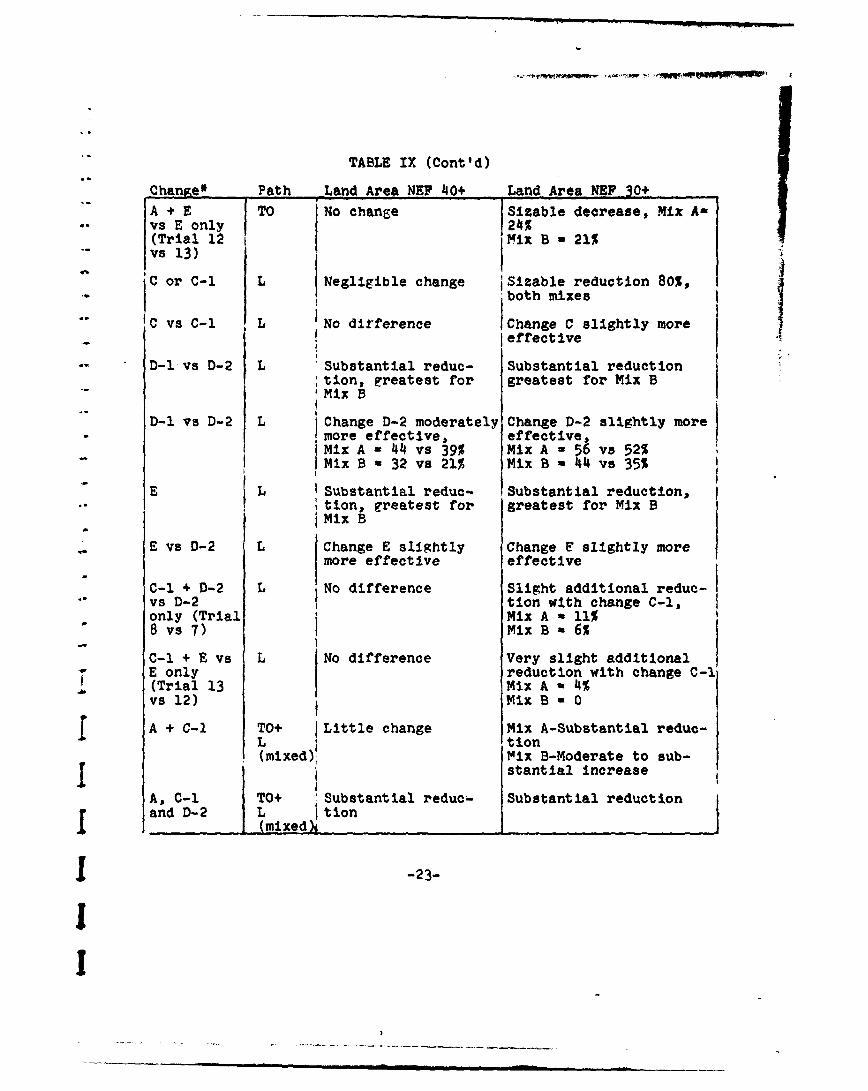
TABLE IX (Cont'd)
Chan"e* Path Land Area NEF 40+ Land Area NEF 30+
A + E TO No change Sizable decrease, -Rix An(vs E only 24%(Trial 12 Mix B - 21%" ~vs 13)
C or C-1 L Negligible change Sizable reduction 80%,both mixes
'C vs C-I L lNo dirference Change C slightly moreg e t t fo effective
D-1 vs D-2 L Substantial reduc- Substantial reductionStion, greatest for greatest for Mix B"Mix B
D-1 vs D-2 L iChange D-2 moderately Change D-2 slightly more-!more effective, effective,
Mix A - 44 vs 39% Mix A - 56 vs 52%- Mix B a 32 vs 21% Mix B - 4 vs 35%
"E L I Substantial reduc- tSubstantial reduction,• tion, greatest for greatest for Mix B
Mix B
E vs D-2 L Change E slightly Change F slightly moremore effective effective
C-I + D-2 L No difference Slight additional reduc-"vs D-2 tion with change C-1,only (Trial Mix A a 11%8 vs 7) Mix B a 6%
C-I + E vs L No difference Very slight additionalSE only[ reduction with change C-1(Trial 13 Mix A a 4%vs 12) Mix B a 0
£A + C-1 TO+ Little change Mix A-Substantial reduc-L t tion(mixed)' Mix B-Moderate to sub-J ,stantial Increase
A, C-I TO+ 'Substantial reduc- Substantial reductionand D-2 L I tion
_ (mixed)i
-23-
!
II
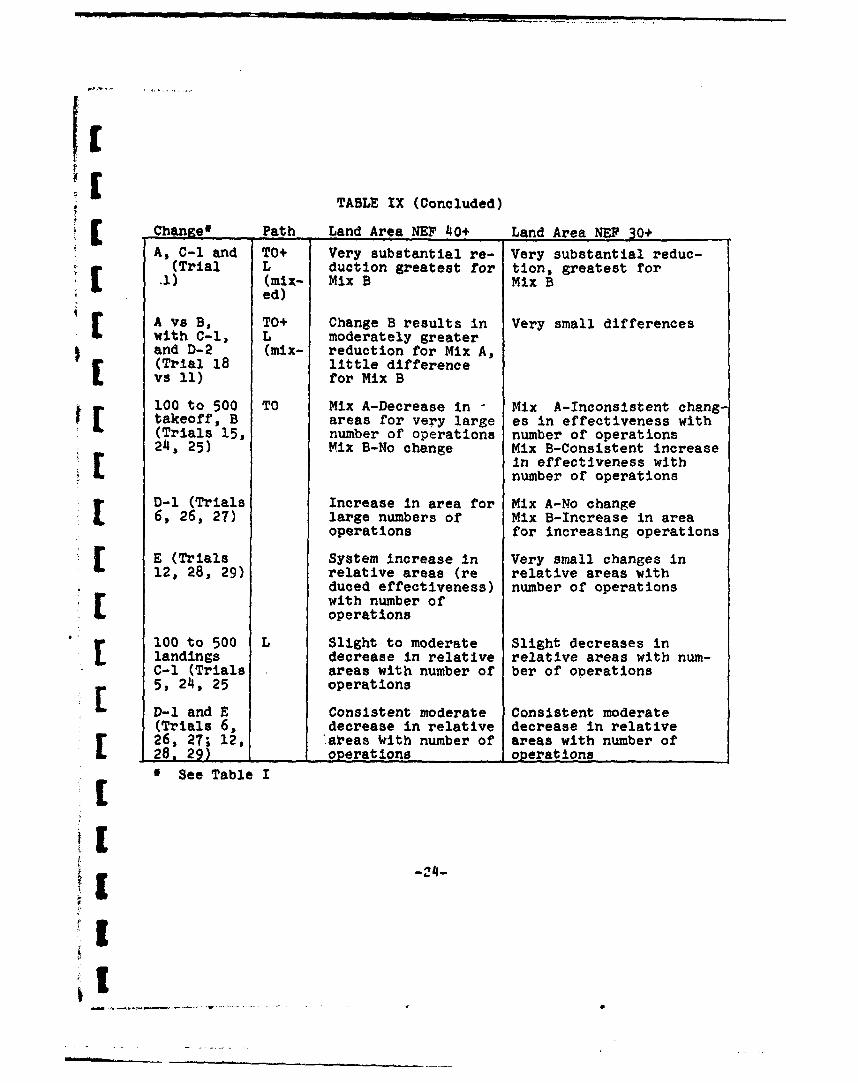
TABLE IX (Concluded)
r Change* Path Land Area NEF 40+ Land Area NEF 30+A, C-I and TO+ Very substantial re- Very substantial reduc-
(Trial L duction greatest for tion, greatest for.1) (mix- Mix B Mix B
ed)
A vs B, TO+ Change B results in Very small differences[ with C-1, L moderately greaterand D-2 (mix- reduction for Mix A,[ (Trial 18 little differencevs 11) for Mix B
100 to 500 TO Mix A-Decrease in - Mix A-Inconsistent chang-takeoff, B areas for very large es in effectiveness with(Trials 15, number of operations number of operations24, 25) Mix B-No change Mix B-Consistent increase
F in effectiveness withnumber of operations
D-1 (Trials Increase in area for Mix A-No change6, 26, 27) large numbers of Mix B-Increase in area
operations for increasing operations
E (Trials System increase in Very small changes in12, 28, 29) relative areas (re relative areas with
duced effectiveness) number of operationswith number ofoperations
100 to 500 L Slight to moderate Slight decreases inE landings decrease in relative relative areas with num-C-i (Trials areas with number of ber of oDerations5, 24, 25 operations
D-1 and E Consistent moderate Consistent moderate(Trials 6, decrease in relative decrease in relative[ 26, 27; 12, .areas With number of areas with number ofL28, 29) _oerations operations
* See Table IS[
4i
Li
tI
, 0
•- I
.. " L_. ... -- I-
0!
SU5.
, , . I | nl | II i li |t I n I |: n u
Fil
U ~ -;lkUU
0
I-.
ILU.[Iz
- I
Lu..
-26-

I LU
o 22
10
IC - U4
00InI~ 0z
51 .1
I ilk0>
4UOJ~dufD..y .- 27-uu~
z
LeL
oLL
I U-
< I aU
-% n Z
00
4U*Oj~d Uj .l p~D" , OA1401 011
L -28-U
~A
0
uJILfl
L.
0 u
z<~ 0
U-LL
0
z < 0
¶ z
__9 zU-a
*U.~SJ U s~ypuo~*Aj4~S~ ~s.
-29
3I <z + u'~iI
0
z
lizO
02 2L 0_u4USOJed Uj DOJVy PUDJC *A14010 LII
oz zUz~z
IL -j
z+z
z
'U
.0*Js Uf "JV UIO100
.1 z-30-
A. O~erational Changes
The left-hand sections of Fig. 8 shows the changes resultingfrom introduction of power cutback to 3% (or 6%) climb gradientsupon the takeoff (north) NEF contours. As expected, there islittle or no change in the NEF 40+ contour areas since these"areas are little affected by a power cutback at 3.5 nauticalmiles. For the NEF 30 land area, there is a sizable reduction fortraffic Mix A but a very significant increase for traffic Mix B.This reflects the very small reduction in noise with a powercutback for most current four-engine turbofan aircraft (aircraft"with JT3D engines). In general, the differences in land areasbetween cutbacks to a 3% or to a 6% climb gradient are relativelysmall; although it can be noted that a power cutback to a 6%climb gradient reduces the amount of increase in NEF 30+ landareas for traffic Mix B.
The left-hand sections of Fig. 9 indicate the effect ofintroducing two-segment approaches in the landing (south) segment.There is little change in the NEF 40+ land areas resulting,largely, from the choice of three nautical miles as the pointfor the transition from the 60 to 30 glide slopes. There is an
*. approximate 20% reduction in the NEF 30+ land areas due to theintroduction of two-segment approaches.
An example of the effect of power cutbacks and two-segmentapproaches on a runway handling both takeoffs and landings maybe seen in Fig. i0 (condition A and C-l). There is essentiallyno change in the NEF 40+ areas. however, there are sizablechanges in the NEF 30+ area with significant reductions observedfor traffic Mix A and moderate to slight increases with traffic"Mix B. This again reflects the limited noise reduction occurringafter power cutback for current large four-engine, turbofanaircraft.
B. Equipment Changes
The effects on NEF contour areas of introducing lined nacelles,or a "quiet engine," are shown in the middle sectors of Figs. 8,9 and 10. Examination of Fig. 8 will show the substantialreductions in both the NEF 30+ and NEF 40+ land areas due to theretrofits. The largest reductions are observed for traffic Aix Breflecting the larger proportion of aircraft which woudl be
"-31-

C
directly affected by the retrofits. Comparisons of change D-1vs D-2 show that there is about 5% difference in land areas forthe two degrees (limited and maximum) of nacelle treatment. How-ever, further reductions in areas are evident with the quiet engineinstallation. (This installation includes not only a furtherreduction in noise but an improvement in takeoff performance dueto the increased thrust assumed for the quiet engine retrofit.)Comparison of the NEF contours under the landing path show verysignificant reductions due to retrofits.
C. Comparison of Operational And Equipment Changes
C The right-hAnd figure portion of Figs. 8 and 9 show the resultsof some combined operational and equipment changes. For the NEF
r 40+ land areas under the takeoff paths, introduction of operationali 1changes, i.e., power cutback, results in little change over the
reductions due to equipment changes only. However, the NEF 30+land areas show substantial reductions (15 to 20%) with trafficMix A when power cutback procedures are introduced. There is,however only moderate change (except for the quiet engine retrofit)for traffic Mix B when power cutback procedures are introduced.
The right-hand portion of Fig. 9 shows the effects under thelanding segment. Similarly, there is little change in the YE?40+ land areas but some slight reductions in the NEF 30+ areawhen a two-segment approach is introduced for a fleet equipped withfour-engine turbofan aircraft with either lined nacelles or[ "quiet" engines.
For mixed takeoff and landing operations, some comparisonsare shown in Fig. 10. One may note, among other things, that there
• •is less reduction in land area for a cutback to 3% than for a1 6% climb gradient, with aircraft retrofitted with lined nacelles.
[ D. Variations With Total Number of Operations
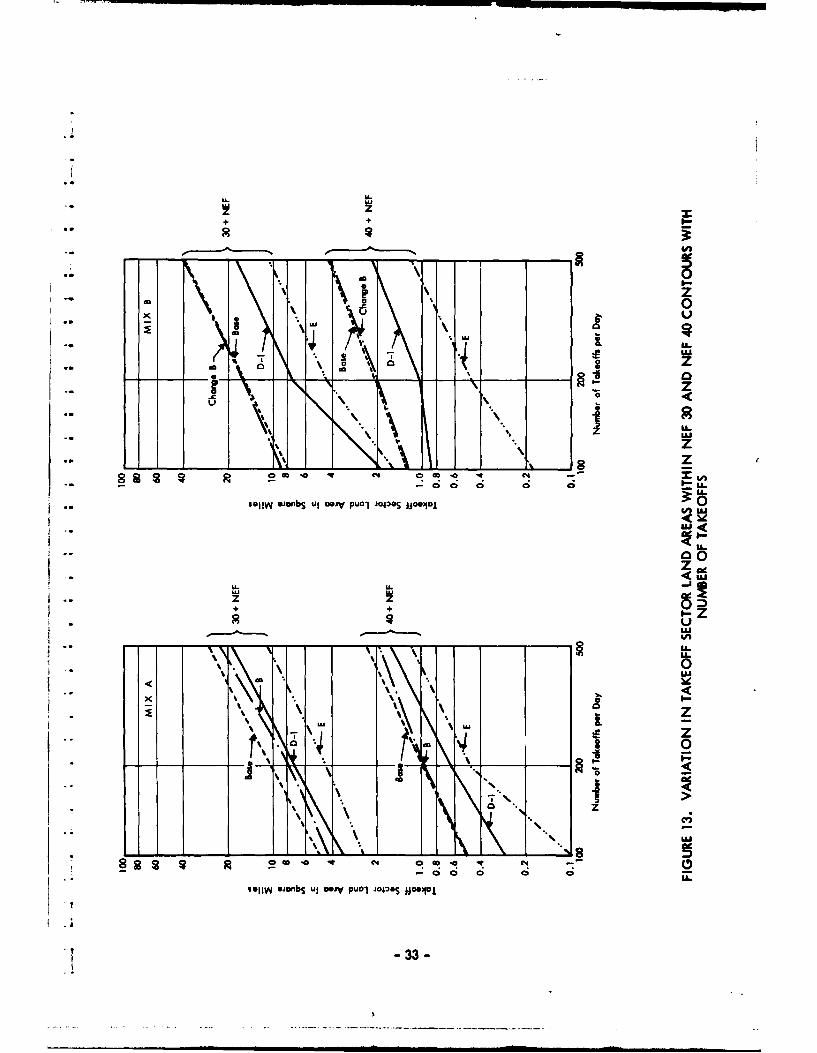
Figures 11 and 12 show the relative land areas within NEF 30and 40 zones taking as baseline references 100, 200 and 500Lr landings and takeoffs per day (i.e. 200, 400 and 1000 operationsper day). As shown in the figure, the relative effectiveness ofthe various noise reduction changes vary somewhat with numberof operations. To further indicate this, Fig. 13 shows theland areas in the takeoff sector falling within the NEF 30 and 40
S[ -32-
hA •
LI
-am
2 LL.
UU
.4L
00z of
<MlLL LL.
ILl ILz z
U.
% .4
.4.4
!5 00 C4
C4 0001 V
so011W *jofbS ul oojy puD, jo0oo5 H0 N? a a
-33-

contours plotted as a function of the number of takeoffs per day.(Both areas and numbers of operations are plotted on logarithmic[scales In Fig. 13.) The fact that the curves are broken and arenot parallel indicates some variation in effectiveness of thechanges with number of operations. However although there is somevariability with volume of operations, the relative ranking ofthe effectiveness of various changes is quite consistent andgenerally remains unchanged as the number of operations is varied.
I. With operational changes only (power cutback and/or twosegment approaches) there is a general trend toward increasedeffectiveness with an increase in number of operations. Forretrofit with either lined nacelles or quiet engine retrofit appliedto four-engine turbofan aircraft, there is a general trend towardslightly less effectiveness as the number of operations is
F increased.
The relative effectiveness of the various noise reductionchanges is influenced by the number of operations for a numberof reasons. The aircraft takeoff profiles are not the same fordifferent aircraft classifications and the EPNL curves for thedifferent aircraft classifications are not parallel, hence theimportance of a given class of aircraft in determining a given NEFvalue may slowly change with the number of operations.
F For segmented takeoff or landing profiles, such as the powerL cutback after takeoff (or the two segment approach), the choice of
the distance at which the power cutback (or change in glide slopeangles) is made will influence the shape of a curve showing therelative effectiveness of the change vs. number of operations.For example, with only small number of operations, the NEF 40contour may well close before the 3.5 nautical miles power cutbackpoint is reached, hence the land area within the NEF 40 contourwould not be affected by the power cutback procedure. However asthe number of operations is increased, the NEF 40 contour wouldclose at a point beyond the point at which the power cutbackbecomes effective. In this case portions of the area includedwithin the NE? 40 contour would be influenced by the power cutback.Fur .her increases in number of operations would include more andmore land within the NE? 40 contour which would be affected bythe power cutback.
E -34-
[
E. Major Trends
An important trend denoted by the results discussed above isthe significant reduction in land areas exposed to NEF 30 or-40+ noise environment by the introduction of either lined nacellesor the quiet engines. On the other hand, operational changesalone generally result in less substantial reduction (and evensome increases) in land areas.*
With retrofits of the current four-engine turbofan fleet,the largest reductions in land areas result from the introductionof power cutback or two-segment approaches.
While the arbitrariness of the boundaries used in this studylimit the direct application of the results of this study to anyparticular airport, the major trends (such as the significantreduction in NE? contours due to Introduction of lined nacelles ora quiet engine) would likely be very apparent in any airporthandling a sizable proportion of four-engine turbofan aircraft.It should also be pointed out that retrofits applied to two-and three-engine turbofan aircraft, as well as four-engine turbofanaircraft, would result in a further shrinkage of the land areaswithin the NEF 40 and 30 land areas.
Although not specifically discussed above, but clearly evidentfrom study of Table VII, a shrinkage of sideline NEFboundaries also results from introduction of quieter aircraft(lined nacelles or "quiet" engine retrofit), but operationalchanges alone will produce no change in the sideline sector NEFboundaries.
-35-
REFERENCES
1. D.E. Bishop, R.D. Horonjeff, "Procedures for DevelopingNoise Exposure Forecast Areas for Aircraft Flight Opera-r[ tions," FAA Report DS-67-10, August 1967.
2. SAE Research Comaittee R2.5 "Technique for DevelopingNoise Exposure Forecasts," FAA Report DS-67-14, August1967.
3. Based on interpretation of information contained inLetter, Reference 2532, from F.J. Montegani, LewisResearch Center, NASA to D.E. Bishop, dated 31 July1968.
14. W.C. Sperry, "Aircraft Noise Evaluation," FAA ReportNO-68-34, September 1968.
[A[[
'II -36-
II

I
IAPPENDIX
SUMMARY OF BASIC NOISE EXPOSUREFORECAST EQUATIONS
*In calculation of NEF values, aircraft noise levels are expreseed in terms of the effective perceived noise level (EPNL) asdefined in reference 4. In estimating the noise exposure near anairport or flight path resulting from the operation of a numberof different aircraft, it is convenient to group the aircraft inclasses based upon consideration of the aircraft noise character-istics and takeoff and landing performance. Each class isassigned a description of the noise in terms of a set of EPNL vs.distance curves and a set of takeoff and landing profiles. Thus,for a given class of aircraft at a particular power setting (i.e.takeoff power) it is assumed that the aircraft noise characteristic:may be described by a single EPNL vs. distance curve.
The total noise exposure produced by aircraft operations ata given point is viewed as being composed of the effective per-ceived noise levels produced by different aircraft classes flyingalong different flight paths. For aircraft class i on flight pathJ, the NEF (iJ) can be expressed as
NEF (iJ) - EPNL (iJ) + 10 log [ (day ) + (night)
where (Eq. 1)
NEF (iJ) * Noise Exposure Forecast value produced by aircraftclass (i) along flight path segment (j).
EPNL (iJ) = Effective perceived noise level produced atthe given point by aircraft class (i) flyingalong flight path segment (j)
f K - Constant normalizing the adjustment in NFF values due tovolume of operations. Different values of K are used fordaytime and nighttime movements.
C - Arbitrary normalization constant.
A-1SO
-0
.1
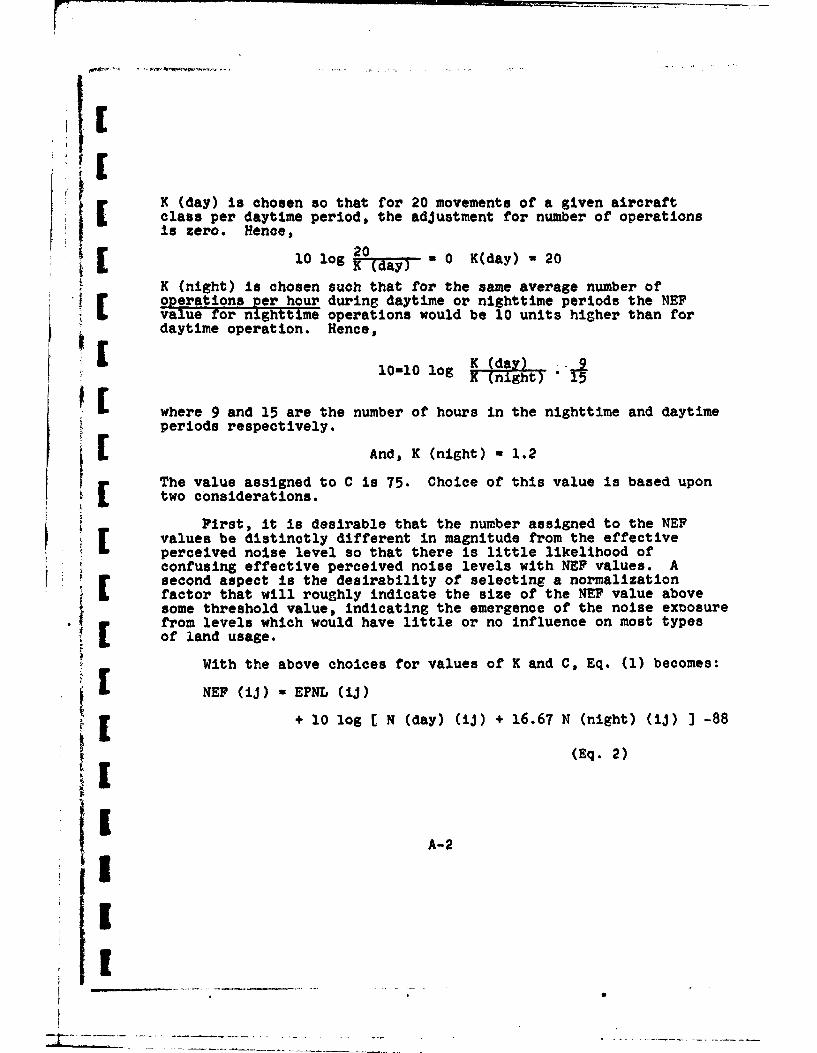
K (day) is chosen so that for 20 movements of a given aircraftclass per daytime period, the adjustment for number of operationsis zero. Hence,
20 2
K (night) is chosen such that for the same average number of3 operations per hour during daytime or nighttime periods the NE?
value for nighttime operations would be 10 units higher than fordaytime operation. Hence,
110-10 log K (dayn .K (night) .5
S[ where 9 and 15 are the number of hours in the nighttime and daytimeperiods respectively.
And, K (night) a 1.2
The value assigned to C is 75. Choice of this value is based upontwo considerations.
Pirst, it is desirable that the number assigned to the NE?values be distinctly different in magnitude from the effectiveperceived noise level so that there is little likelihood ofconfusing effective perceived noise levels with NEF values. A[ second aspect is the desirability of selecting a normalizationfactor that will roughly indicate the size of the NEF value abovesome threshold value, indicating the emergence of the noise exposure
"t 4from levels which would have little or no influence on most typesf of land usage.
With the above choices for values of K and C, Eq. (1) becomes:
[NE? (ij) - EPNL (ij)
+ 10 log [ N (day) (ii) + 16.67 N (night) (IJ) ] -88
(Eq. 2)
A-2
I. . .

i ,,- • -a .. n - m u, • M •
.ie
,JI
For only daytime operations, as assumed for the cases studied
- in this report, Eq. 2 becomes simply:
± NE? (iJ)=EPNL (ij) * 10 log C N (day) (iJ) j - 88
Ii (Eq. 2a)
The total NEF at the given ground position may be determinedby summation of all the individual NEF (1j) values on an "energy"basis:
SNE?= 10 log ati g aNEF (tj)
T 103
i (Eq. 3)
iiiT
A
ii


![A Comparison of Two Takeoff and Climb Out Flap Retraction ...catsr.ite.gmu.edu/pubs/ICNS_2016_CompareFlapRetract_12292015[1].pdf · Procedure Flap retraction is part of the takeoff](https://img.pdfslide.net/doc/110x75/5b3c16137f8b9a986e8cc9c4/a-comparison-of-two-takeoff-and-climb-out-flap-retraction-catsritegmuedupubsicns2016compareflapretract122920151pdf.jpg)