Embed Size (px)
Citation preview
1E C
O N
O M
I C
O U
T L
O O
K
I S S
U E
S,
N E
E
N G
L A
N D
B
O A
R D
O
F
E D
U C
A T
I O
N,
B O
S T
O N
, D
E C
E M
B E
R 5
, 2
0 0
8
Jim Glassman, [email protected], 212-270-0778
0
1
2
3
4
5
6
Jan 07 Apr 07 Jun 07 Sep 07 Dec 07 Mar 08 Jun 08 Sep 08 Dec 080
1
2
3
4
5
6
3-month dollar-based Libor
3-month overnight indexed swap rate (OIS)
When fear rules …

2E C
O N
O M
I C
O U
T L
O O
K
I S S
U E
S,
N E
E
N G
L A
N D
B
O A
R D
O
F
E D
U C
A T
I O
N,
B O
S T
O N
, D
E C
E M
B E
R 5
, 2
0 0
8
Jim Glassman, [email protected], 212-270-0778
In defense of policy activism …
3E C
O N
O M
I C
O U
T L
O O
K
I S S
U E
S,
N E
E
N G
L A
N D
B
O A
R D
O
F
E D
U C
A T
I O
N,
B O
S T
O N
, D
E C
E M
B E
R 5
, 2
0 0
8
Jim Glassman, [email protected], 212-270-0778
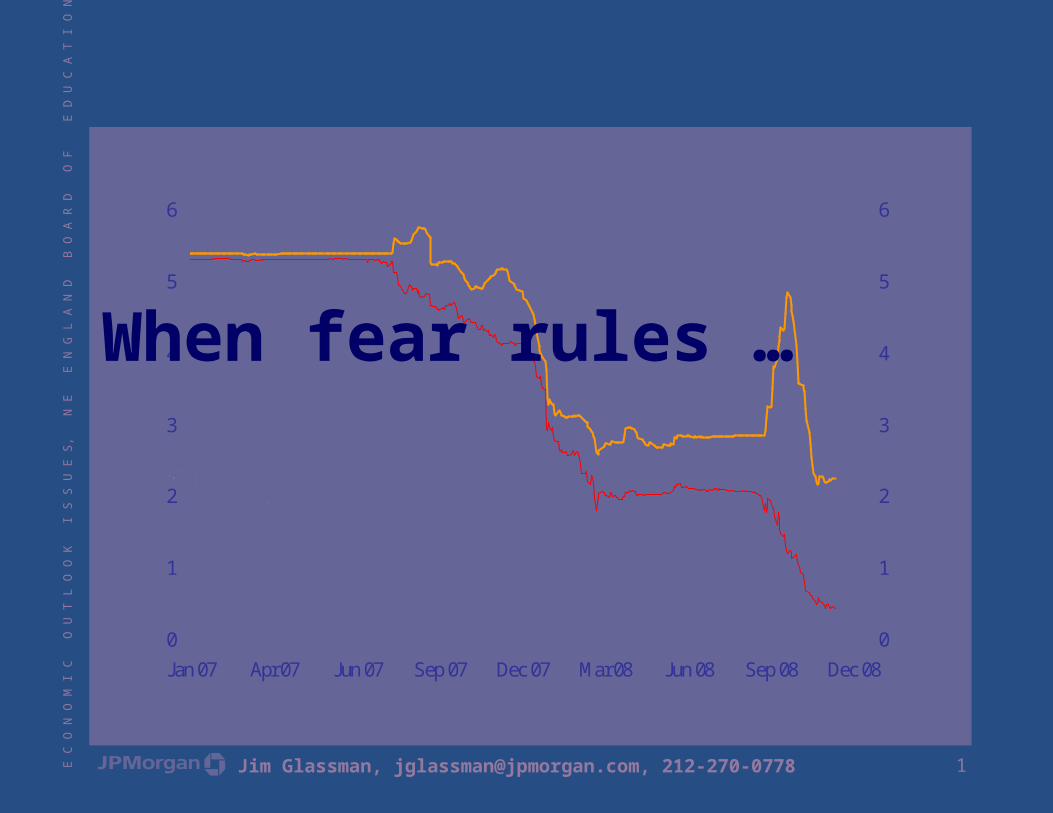
Market economies cycle …US real GDP (percent change from four quarters earlier)
Source: NBER recession bars; US Department of Commerce; various academic sources
-20
-15
-10
-5
0
5
10
15
20
25
1852 1862 1872 1882 1892 1902 1912 1922 1932 1942 1952 1962 1972 1982 1992 2002-20
-15
-10
-5
0
5
10
15
20
25
Average historical growth = 3.75% annually
4E C
O N
O M
I C
O U
T L
O O
K
I S S
U E
S,
N E
E
N G
L A
N D
B
O A
R D
O
F
E D
U C
A T
I O
N,
B O
S T
O N
, D
E C
E M
B E
R 5
, 2
0 0
8
Jim Glassman, [email protected], 212-270-0778
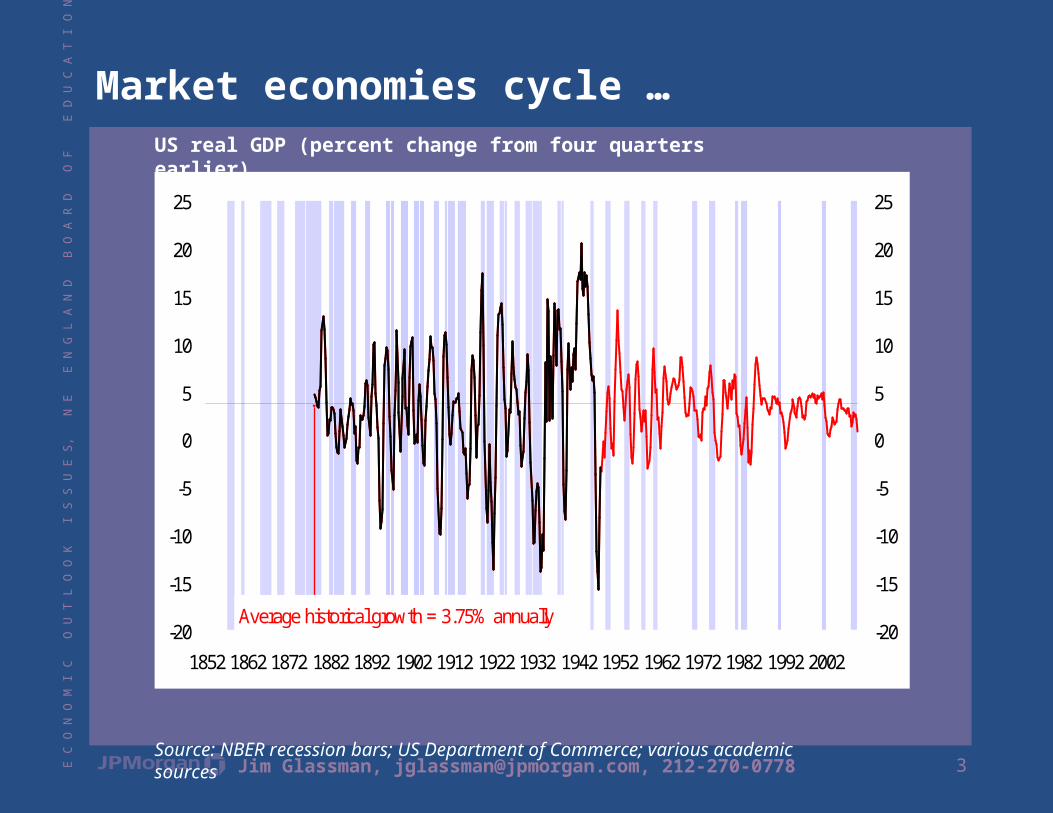
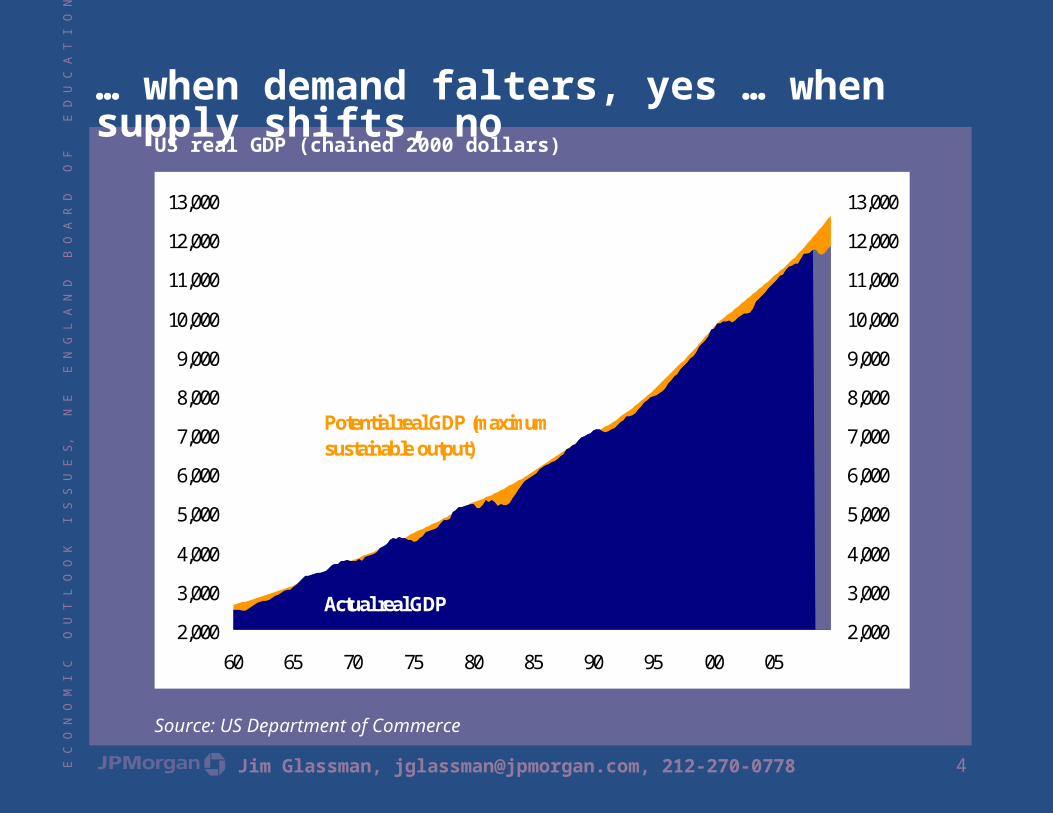
… when demand falters, yes … when supply shifts, noUS real GDP (chained 2000 dollars)
Source: US Department of Commerce
2,000
3,000
4,000
5,000
6,000
7,000
8,000
9,000
10,000
11,000
12,000
13,000
60 65 70 75 80 85 90 95 00 052,000
3,000
4,000
5,000
6,000
7,000
8,000
9,000
10,000
11,000
12,000
13,000
Potential real GDP (maximum sustainable output)
Actual real GDP
5E C
O N
O M
I C
O U
T L
O O
K
I S S
U E
S,
N E
E
N G
L A
N D
B
O A
R D
O
F
E D
U C
A T
I O
N,
B O
S T
O N
, D
E C
E M
B E
R 5
, 2
0 0
8
Jim Glassman, [email protected], 212-270-0778
Three hurdles, two cleared …(1) Inflated housing values(2) Oil’s convulsion(3) Irrational fears
6E C
O N
O M
I C
O U
T L
O O
K
I S S
U E
S,
N E
E
N G
L A
N D
B
O A
R D
O
F
E D
U C
A T
I O
N,
B O
S T
O N
, D
E C
E M
B E
R 5
, 2
0 0
8
Jim Glassman, [email protected], 212-270-0778
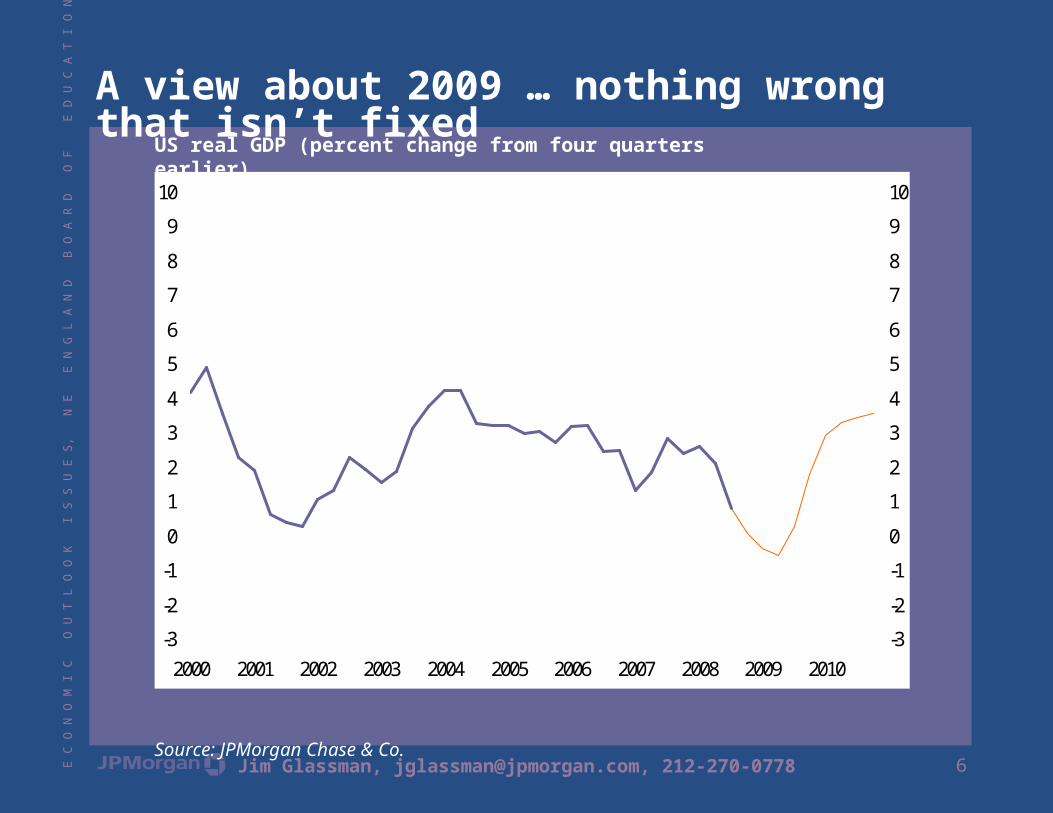
A view about 2009 … nothing wrong that isn’t fixedUS real GDP (percent change from four quarters earlier)
Source: JPMorgan Chase & Co.
-3
-2
-1
0
1
2
3
4
5
6
7
8
9
10
2000 2001 2002 2003 2004 2005 2006 2007 2008 2009 2010-3
-2
-1
0
1
2
3
4
5
6
7
8
9
10
7E C
O N
O M
I C
O U
T L
O O
K
I S S
U E
S,
N E
E
N G
L A
N D
B
O A
R D
O
F
E D
U C
A T
I O
N,
B O
S T
O N
, D
E C
E M
B E
R 5
, 2
0 0
8
Jim Glassman, [email protected], 212-270-0778
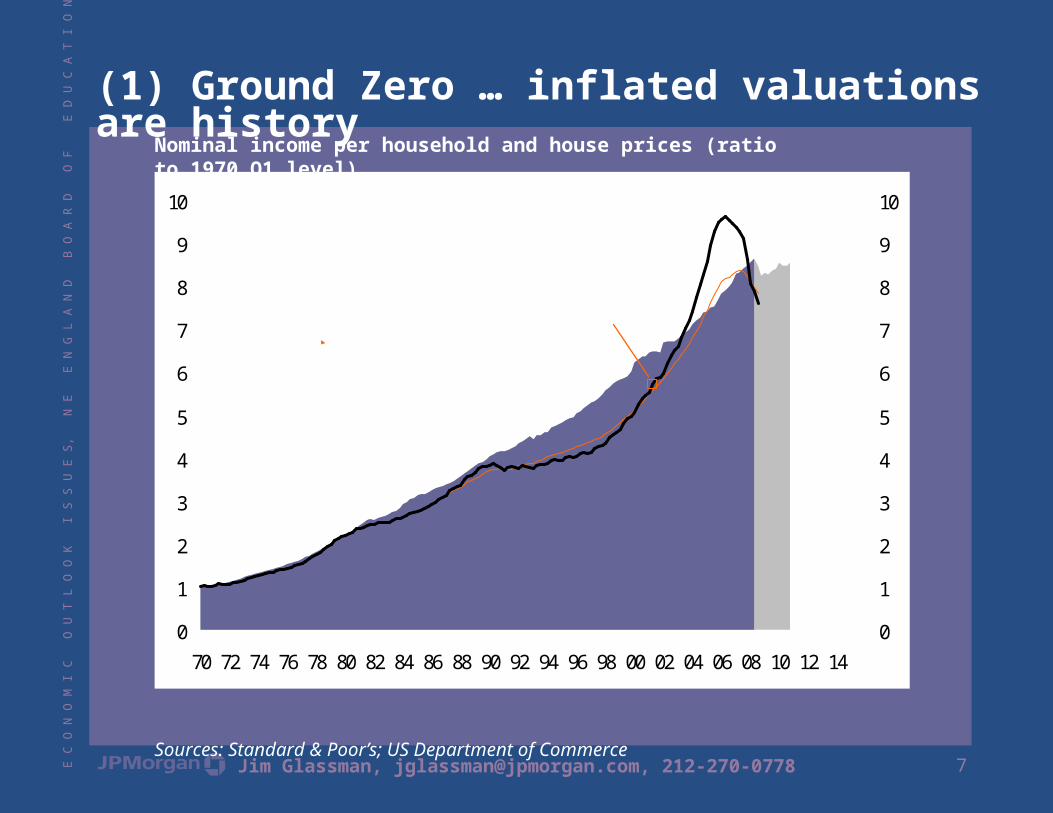
(1) Ground Zero … inflated valuations are historyNominal income per household and house prices (ratio to 1970 Q1 level)
Sources: Standard & Poor’s; US Department of Commerce
0
1
2
3
4
5
6
7
8
9
10
70 72 74 76 78 80 82 84 86 88 90 92 94 96 98 00 02 04 06 08 10 12 140
1
2
3
4
5
6
7
8
9
10Existing house prices (Case-Shiller national index)FHFA (previously Ofheo) purchase only indexGross nominal income per household
2001 Q2
8E C
O N
O M
I C
O U
T L
O O
K
I S S
U E
S,
N E
E
N G
L A
N D
B
O A
R D
O
F
E D
U C
A T
I O
N,
B O
S T
O N
, D
E C
E M
B E
R 5
, 2
0 0
8
Jim Glassman, [email protected], 212-270-0778
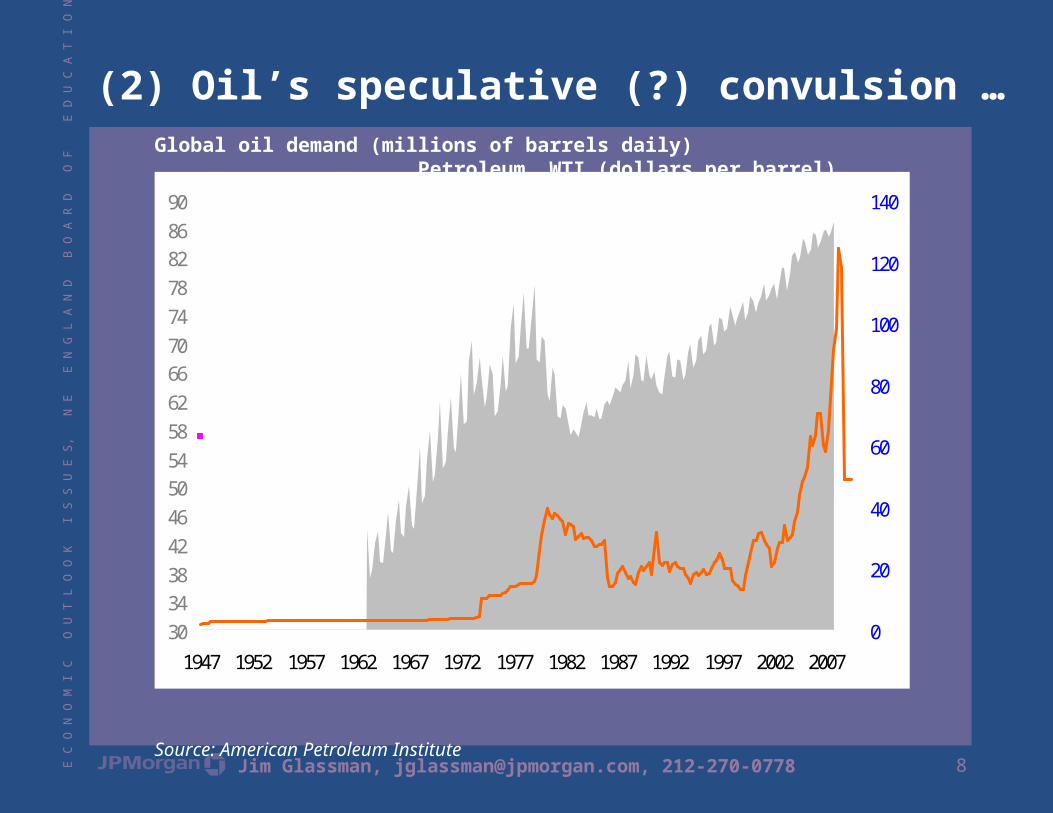
(2) Oil’s speculative (?) convulsion …Global oil demand (millions of barrels daily) Petroleum, WTI (dollars per barrel)
Source: American Petroleum Institute
30343842465054586266707478828690
1947 1952 1957 1962 1967 1972 1977 1982 1987 1992 1997 2002 20070
20
40
60
80
100
120
140Global petroleum demand (left)Petroleum price (right)
9E C
O N
O M
I C
O U
T L
O O
K
I S S
U E
S,
N E
E
N G
L A
N D
B
O A
R D
O
F
E D
U C
A T
I O
N,
B O
S T
O N
, D
E C
E M
B E
R 5
, 2
0 0
8
Jim Glassman, [email protected], 212-270-0778
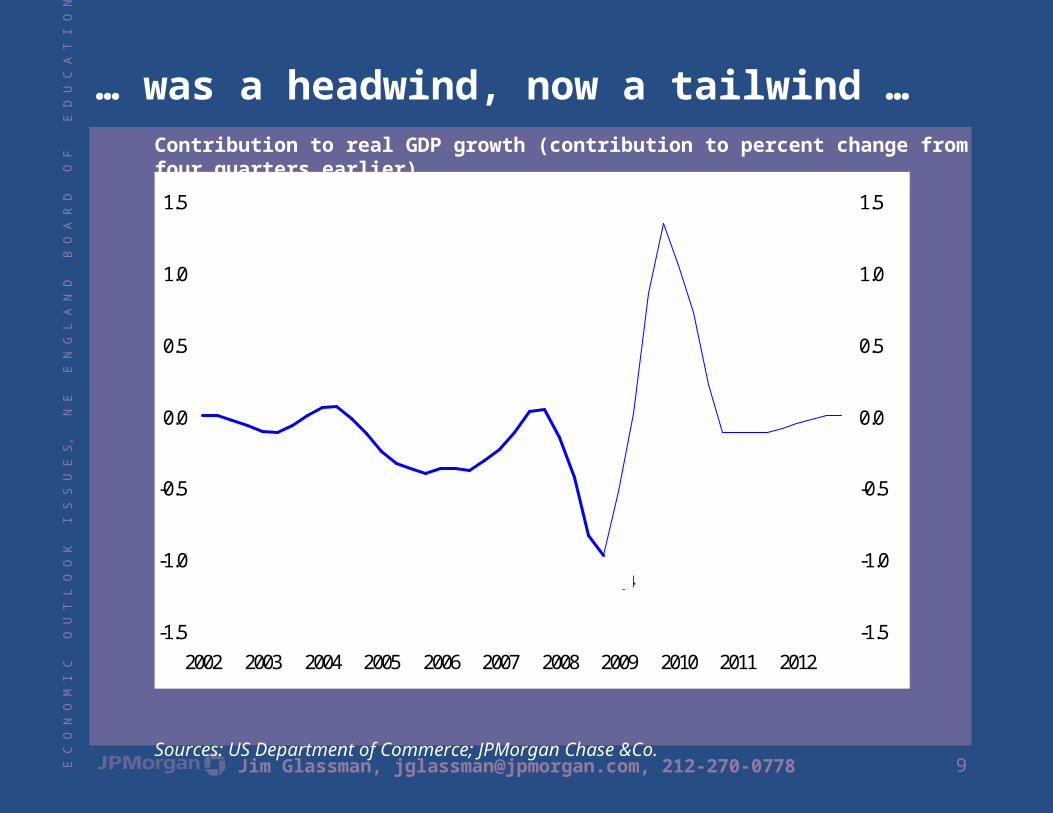
… was a headwind, now a tailwind …Contribution to real GDP growth (contribution to percent change from four quarters earlier)
Sources: US Department of Commerce; JPMorgan Chase &Co.
-1.5
-1.0
-0.5
0.0
0.5
1.0
1.5
2002 2003 2004 2005 2006 2007 2008 2009 2010 2011 2012-1.5
-1.0
-0.5
0.0
0.5
1.0
1.5
Oil price assumption
2008 Q4 = $50 per barrel2009 Q4 = $55 per barrel2010 Q4 = $60 per barrel
2008 Q4
10E C
O N
O M
I C
O U
T L
O O
K
I S S
U E
S,
N E
E
N G
L A
N D
B
O A
R D
O
F
E D
U C
A T
I O
N,
B O
S T
O N
, D
E C
E M
B E
R 5
, 2
0 0
8
Jim Glassman, [email protected], 212-270-0778
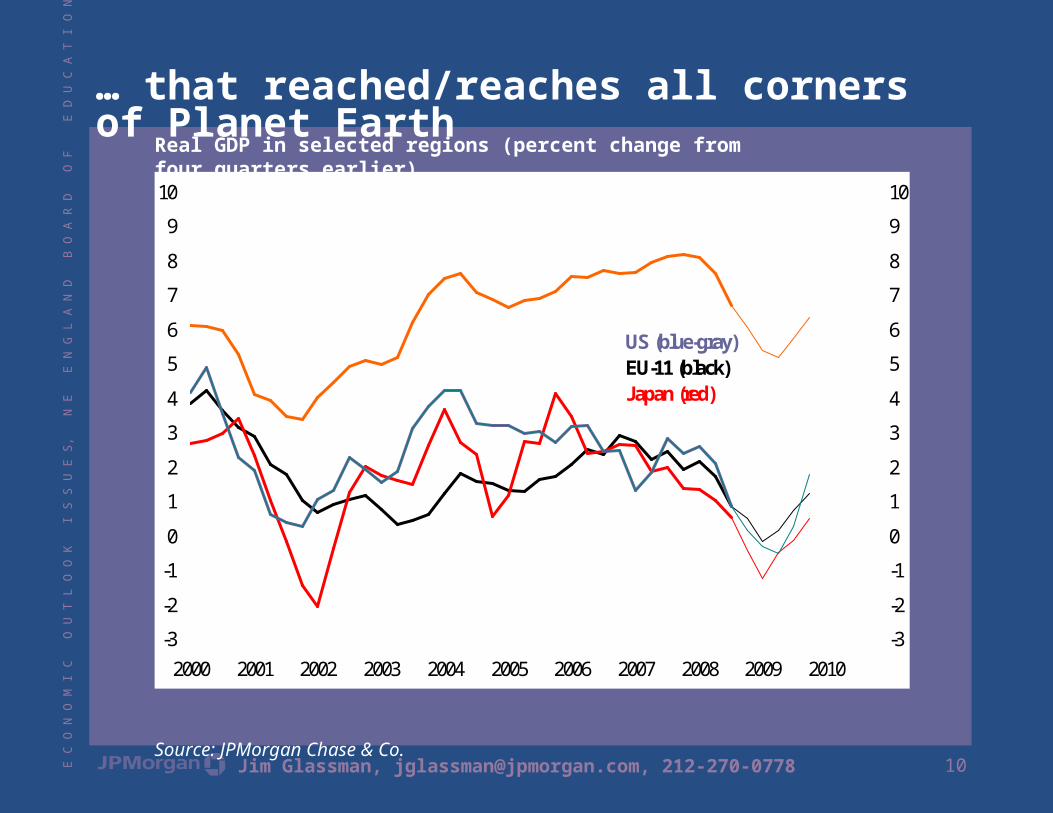
… that reached/reaches all corners of Planet EarthReal GDP in selected regions (percent change from four quarters earlier)
Source: JPMorgan Chase & Co.
-3
-2
-1
0
1
2
3
4
5
6
7
8
9
10
2000 2001 2002 2003 2004 2005 2006 2007 2008 2009 2010-3
-2
-1
0
1
2
3
4
5
6
7
8
9
10
US (blue-gray)EU-11 (black)Japan (red)
Emerging economies in Asia, Eastern Europe and Latin America (orange)
11E C
O N
O M
I C
O U
T L
O O
K
I S S
U E
S,
N E
E
N G
L A
N D
B
O A
R D
O
F
E D
U C
A T
I O
N,
B O
S T
O N
, D
E C
E M
B E
R 5
, 2
0 0
8
Jim Glassman, [email protected], 212-270-0778
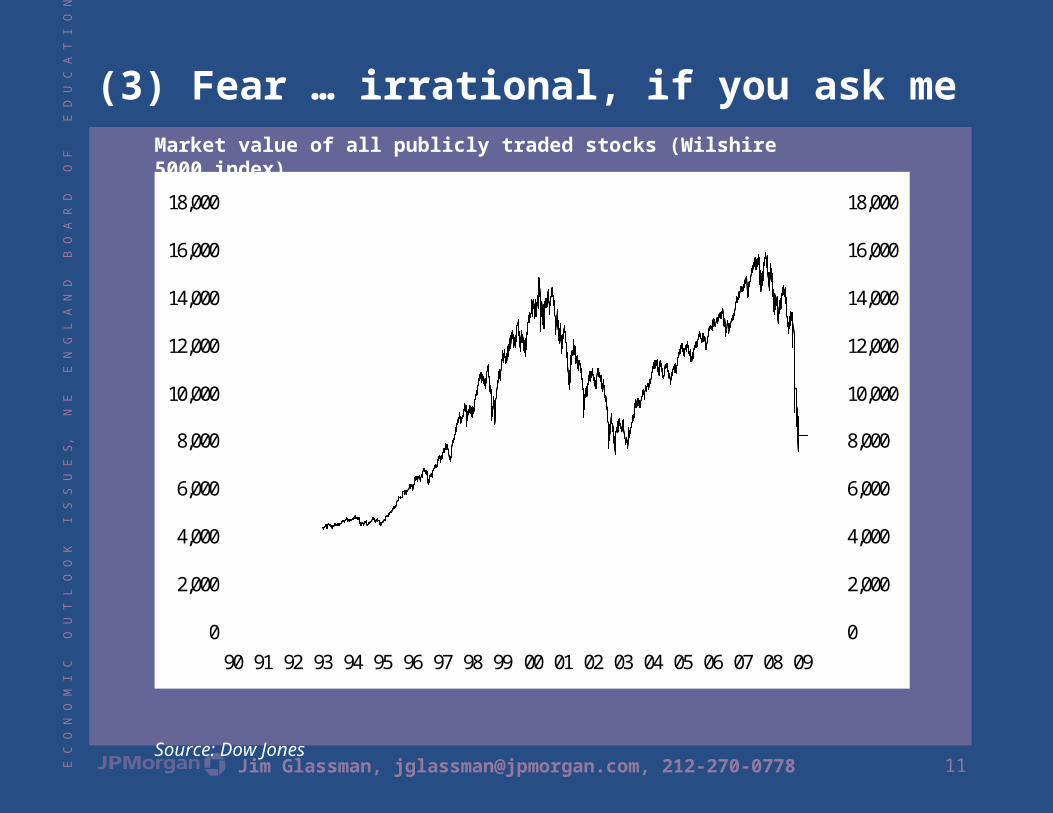
(3) Fear … irrational, if you ask meMarket value of all publicly traded stocks (Wilshire 5000 index)
Source: Dow Jones
0
2,000
4,000
6,000
8,000
10,000
12,000
14,000
16,000
18,000
90 91 92 93 94 95 96 97 98 99 00 01 02 03 04 05 06 07 08 090
2,000
4,000
6,000
8,000
10,000
12,000
14,000
16,000
18,000
12E C
O N
O M
I C
O U
T L
O O
K
I S S
U E
S,
N E
E
N G
L A
N D
B
O A
R D
O
F
E D
U C
A T
I O
N,
B O
S T
O N
, D
E C
E M
B E
R 5
, 2
0 0
8
Jim Glassman, [email protected], 212-270-0778
Two red herrings/myths …(1) The housing ATM story(2) Household debt
13E C
O N
O M
I C
O U
T L
O O
K
I S S
U E
S,
N E
E
N G
L A
N D
B
O A
R D
O
F
E D
U C
A T
I O
N,
B O
S T
O N
, D
E C
E M
B E
R 5
, 2
0 0
8
Jim Glassman, [email protected], 212-270-0778
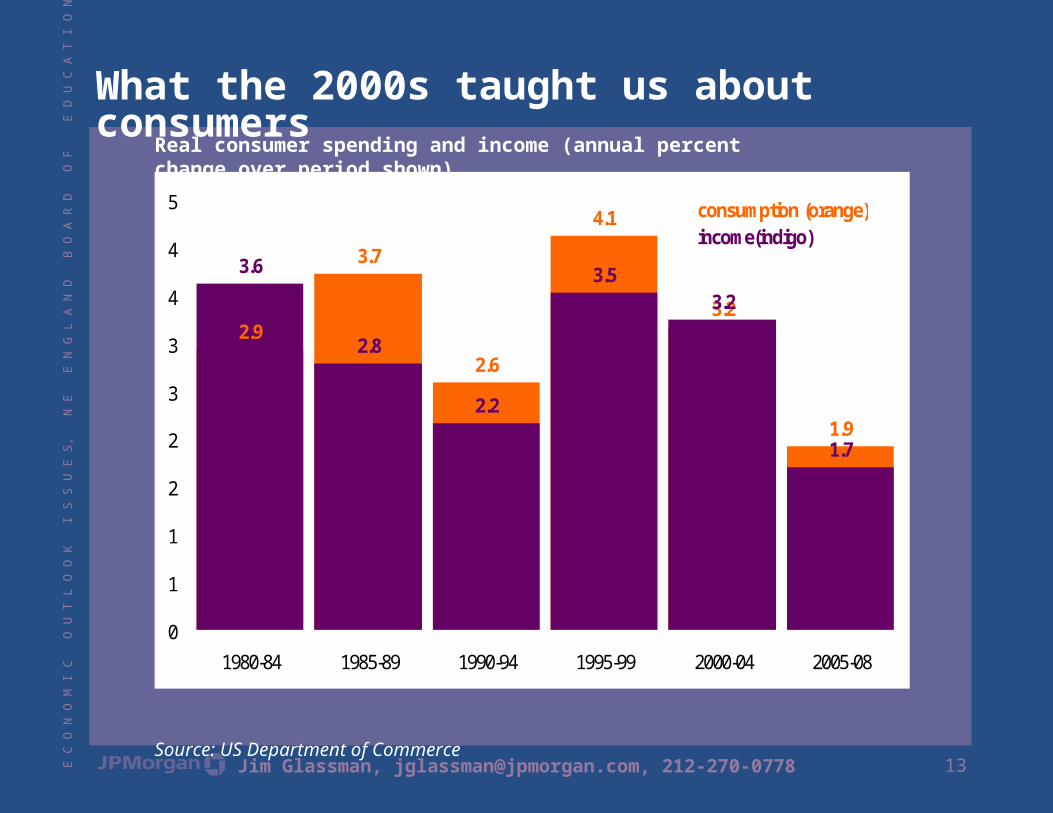
What the 2000s taught us about consumersReal consumer spending and income (annual percent change over period shown)
Source: US Department of Commerce
2.9
3.7
2.6
4.1
3.2
1.9
3.6
2.8
2.2
3.53.2
1.7
0
1
1
2
2
3
3
4
4
5
1980-84 1985-89 1990-94 1995-99 2000-04 2005-08
consumption (orange)income(indigo)
14E C
O N
O M
I C
O U
T L
O O
K
I S S
U E
S,
N E
E
N G
L A
N D
B
O A
R D
O
F
E D
U C
A T
I O
N,
B O
S T
O N
, D
E C
E M
B E
R 5
, 2
0 0
8
Jim Glassman, [email protected], 212-270-0778
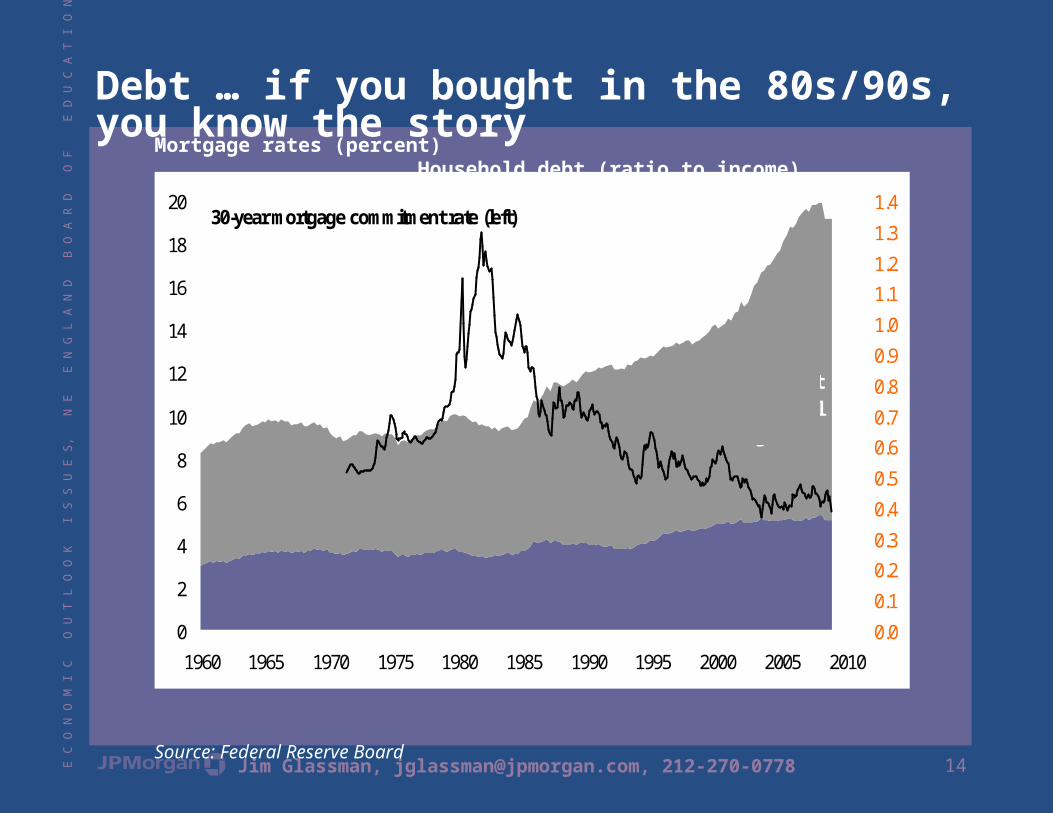
Debt … if you bought in the 80s/90s, you know the storyMortgage rates (percent) Household debt (ratio to income)
Source: Federal Reserve Board
0
2
4
6
8
10
12
14
16
18
20
1960 1965 1970 1975 1980 1985 1990 1995 2000 2005 20100.0
0.1
0.20.3
0.4
0.5
0.60.7
0.8
0.9
1.0
1.11.2
1.3
1.430-year mortgage commitment rate (left)
Ratio of non-mortgage debt to disposable personal income (right)
Ratio of mortgage debt to disposable personal
income (right)
15E C
O N
O M
I C
O U
T L
O O
K
I S S
U E
S,
N E
E
N G
L A
N D
B
O A
R D
O
F
E D
U C
A T
I O
N,
B O
S T
O N
, D
E C
E M
B E
R 5
, 2
0 0
8
Jim Glassman, [email protected], 212-270-0778
Two structural “challenges” …(1) End of an era for consumers(2) Financial deleveraging
16E C
O N
O M
I C
O U
T L
O O
K
I S S
U E
S,
N E
E
N G
L A
N D
B
O A
R D
O
F
E D
U C
A T
I O
N,
B O
S T
O N
, D
E C
E M
B E
R 5
, 2
0 0
8
Jim Glassman, [email protected], 212-270-0778
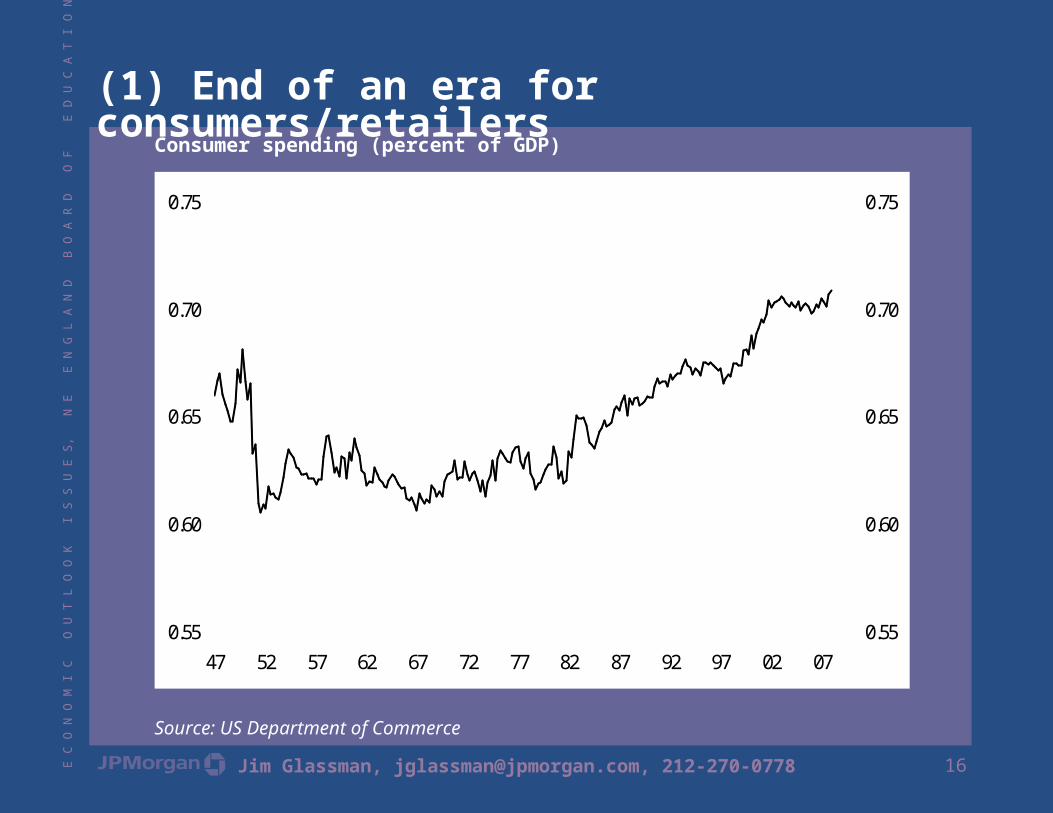
(1) End of an era for consumers/retailersConsumer spending (percent of GDP)
Source: US Department of Commerce
0.55
0.60
0.65
0.70
0.75
47 52 57 62 67 72 77 82 87 92 97 02 070.55
0.60
0.65
0.70
0.75
17E C
O N
O M
I C
O U
T L
O O
K
I S S
U E
S,
N E
E
N G
L A
N D
B
O A
R D
O
F
E D
U C
A T
I O
N,
B O
S T
O N
, D
E C
E M
B E
R 5
, 2
0 0
8
Jim Glassman, [email protected], 212-270-0778
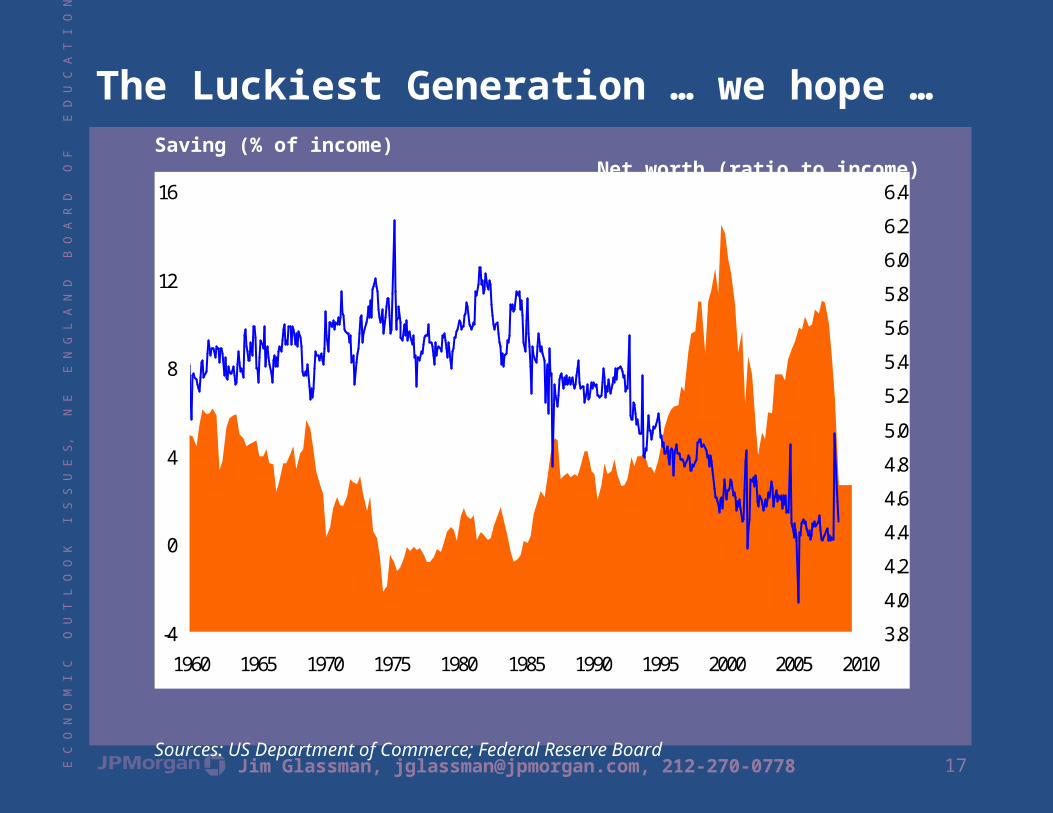
The Luckiest Generation … we hope …Saving (% of income) Net worth (ratio to income)
Sources: US Department of Commerce; Federal Reserve Board
-4
0
4
8
12
16
1960 1965 1970 1975 1980 1985 1990 1995 2000 2005 20103.8
4.0
4.2
4.4
4.6
4.8
5.0
5.2
5.4
5.6
5.8
6.0
6.2
6.4Ratio of net worth to income (right)
Saving rate, the line (left)
18E C
O N
O M
I C
O U
T L
O O
K
I S S
U E
S,
N E
E
N G
L A
N D
B
O A
R D
O
F
E D
U C
A T
I O
N,
B O
S T
O N
, D
E C
E M
B E
R 5
, 2
0 0
8
Jim Glassman, [email protected], 212-270-0778
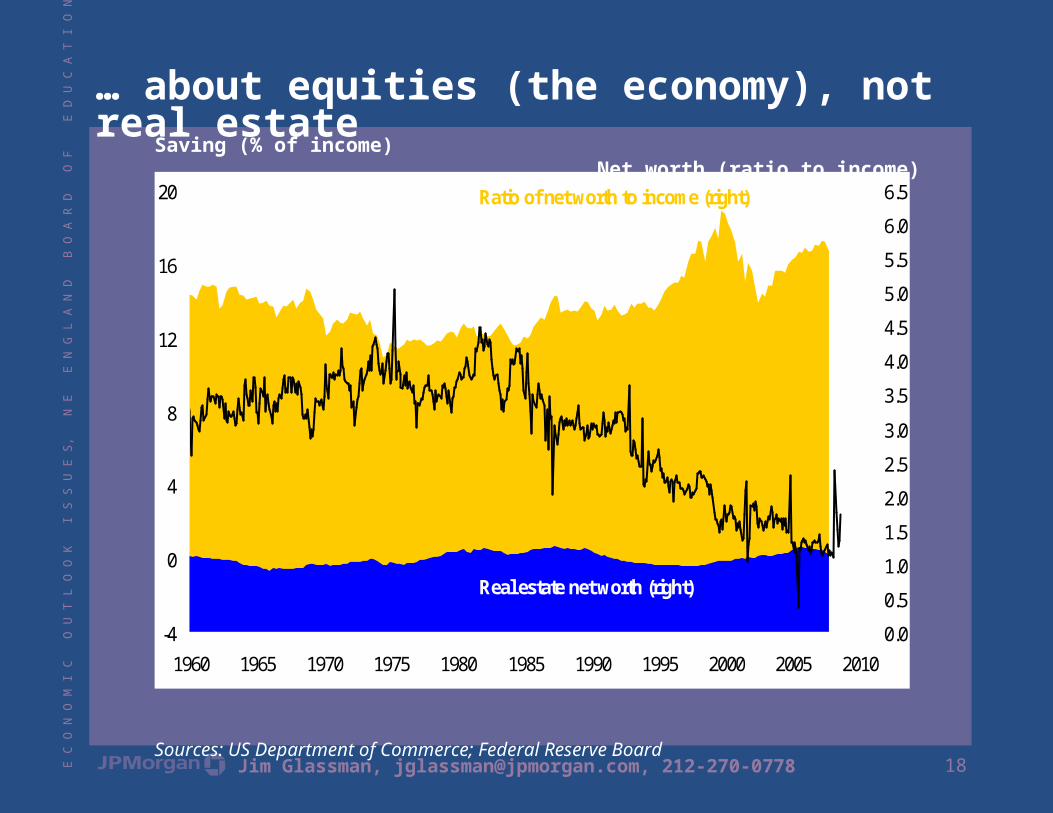
… about equities (the economy), not real estateSaving (% of income) Net worth (ratio to income)
Sources: US Department of Commerce; Federal Reserve Board
-4
0
4
8
12
16
20
1960 1965 1970 1975 1980 1985 1990 1995 2000 2005 20100.0
0.5
1.0
1.5
2.0
2.5
3.0
3.5
4.0
4.5
5.0
5.5
6.0
6.5Ratio of net worth to income (right)
Real estate net worth (right)
Saving rate, the line (left)
19E C
O N
O M
I C
O U
T L
O O
K
I S S
U E
S,
N E
E
N G
L A
N D
B
O A
R D
O
F
E D
U C
A T
I O
N,
B O
S T
O N
, D
E C
E M
B E
R 5
, 2
0 0
8
Jim Glassman, [email protected], 212-270-0778
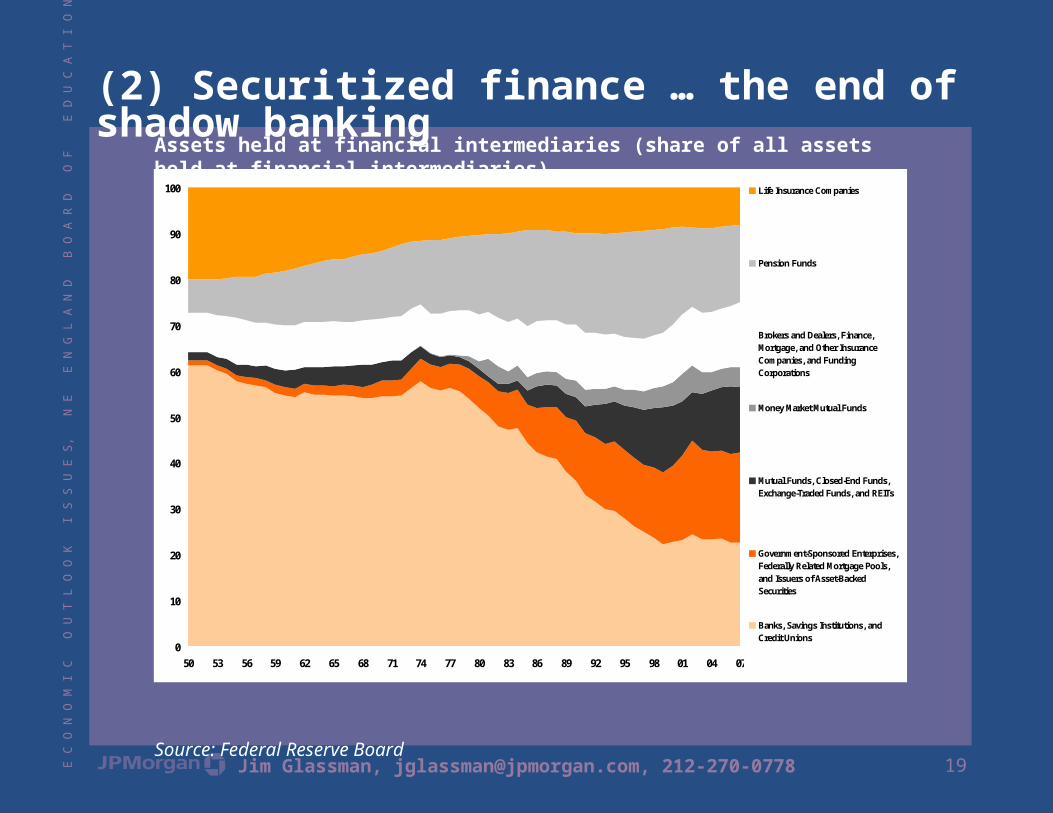
(2) Securitized finance … the end of shadow bankingAssets held at financial intermediaries (share of all assets held at financial intermediaries)
Source: Federal Reserve Board
0
10
20
30
40
50
60
70
80
90
100
50 53 56 59 62 65 68 71 74 77 80 83 86 89 92 95 98 01 04 07
Life Insurance Companies
Pension Funds
Brokers and Dealers, Finance,Mortgage, and Other InsuranceCompanies, and FundingCorporations
Money Market Mutual Funds
Mutual Funds, Closed-End Funds,Exchange-Traded Funds, and REITs
Government-Sponsored Enterprises,Federally Related Mortgage Pools,and Issuers of Asset-BackedSecurities
Banks, Savings Institutions, andCredit Unions
20E C
O N
O M
I C
O U
T L
O O
K
I S S
U E
S,
N E
E
N G
L A
N D
B
O A
R D
O
F
E D
U C
A T
I O
N,
B O
S T
O N
, D
E C
E M
B E
R 5
, 2
0 0
8
Jim Glassman, [email protected], 212-270-0778
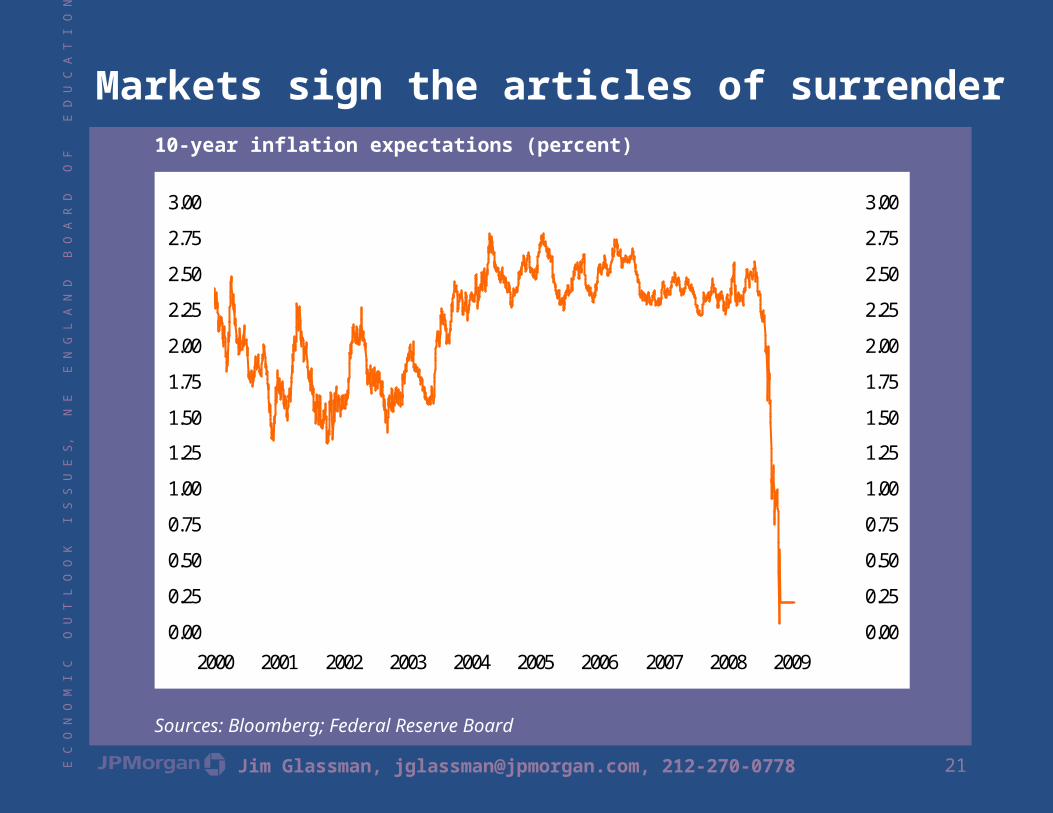
Inflation … R.I.P.
21E C
O N
O M
I C
O U
T L
O O
K
I S S
U E
S,
N E
E
N G
L A
N D
B
O A
R D
O
F
E D
U C
A T
I O
N,
B O
S T
O N
, D
E C
E M
B E
R 5
, 2
0 0
8
Jim Glassman, [email protected], 212-270-0778
Markets sign the articles of surrender10-year inflation expectations (percent)
Sources: Bloomberg; Federal Reserve Board
0.00
0.25
0.50
0.75
1.00
1.25
1.50
1.75
2.00
2.25
2.50
2.75
3.00
2000 2001 2002 2003 2004 2005 2006 2007 2008 20090.00
0.25
0.50
0.75
1.00
1.25
1.50
1.75
2.00
2.25
2.50
2.75
3.00
22E C
O N
O M
I C
O U
T L
O O
K
I S S
U E
S,
N E
E
N G
L A
N D
B
O A
R D
O
F
E D
U C
A T
I O
N,
B O
S T
O N
, D
E C
E M
B E
R 5
, 2
0 0
8
Jim Glassman, [email protected], 212-270-0778
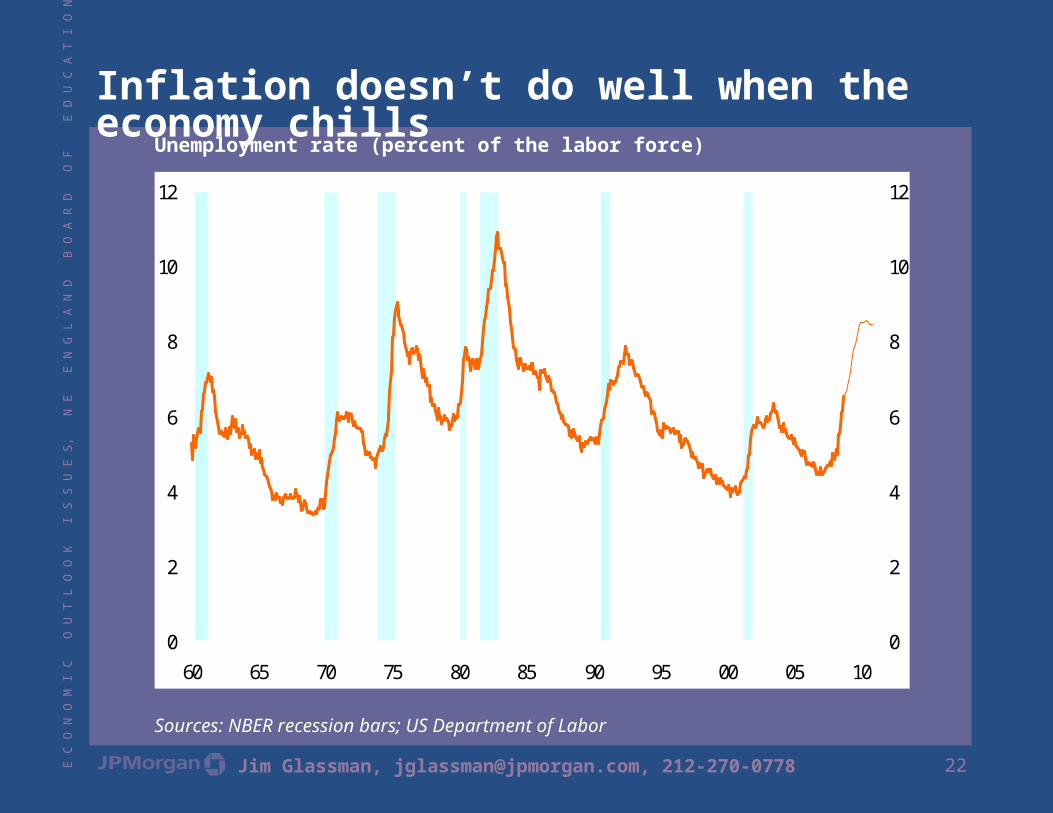
Inflation doesn’t do well when the economy chillsUnemployment rate (percent of the labor force)
Sources: NBER recession bars; US Department of Labor
0
2
4
6
8
10
12
60 65 70 75 80 85 90 95 00 05 100
2
4
6
8
10
12
23E C
O N
O M
I C
O U
T L
O O
K
I S S
U E
S,
N E
E
N G
L A
N D
B
O A
R D
O
F
E D
U C
A T
I O
N,
B O
S T
O N
, D
E C
E M
B E
R 5
, 2
0 0
8
Jim Glassman, [email protected], 212-270-0778
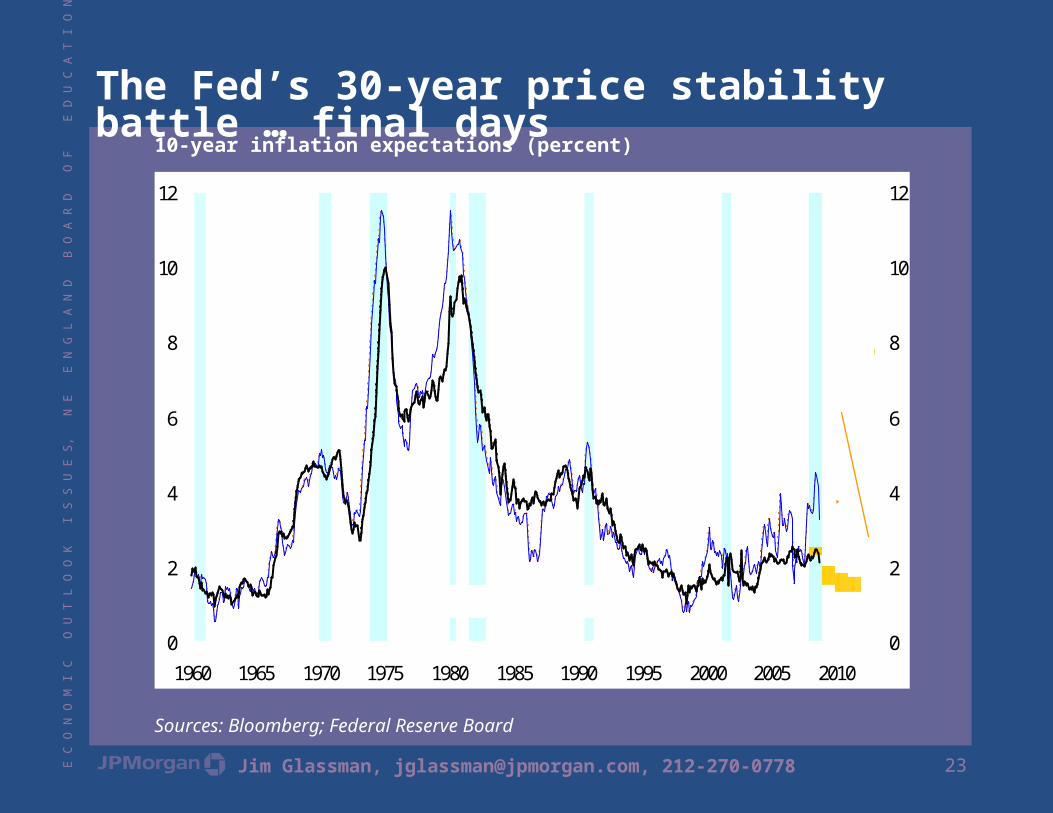
The Fed’s 30-year price stability battle … final days10-year inflation expectations (percent)
Sources: Bloomberg; Federal Reserve Board
0
2
4
6
8
10
12
1960 1965 1970 1975 1980 1985 1990 1995 2000 2005 20100
2
4
6
8
10
12
Chain PCE price index
Core chain PCE price index
The
FOMC's
forecast
for core
PCE chain
price
inflation

24E C
O N
O M
I C
O U
T L
O O
K
I S S
U E
S,
N E
E
N G
L A
N D
B
O A
R D
O
F
E D
U C
A T
I O
N,
B O
S T
O N
, D
E C
E M
B E
R 5
, 2
0 0
8
Jim Glassman, [email protected], 212-270-0778
… the stuff of opportunity
25E C
O N
O M
I C
O U
T L
O O
K
I S S
U E
S,
N E
E
N G
L A
N D
B
O A
R D
O
F
E D
U C
A T
I O
N,
B O
S T
O N
, D
E C
E M
B E
R 5
, 2
0 0
8
Jim Glassman, [email protected], 212-270-0778
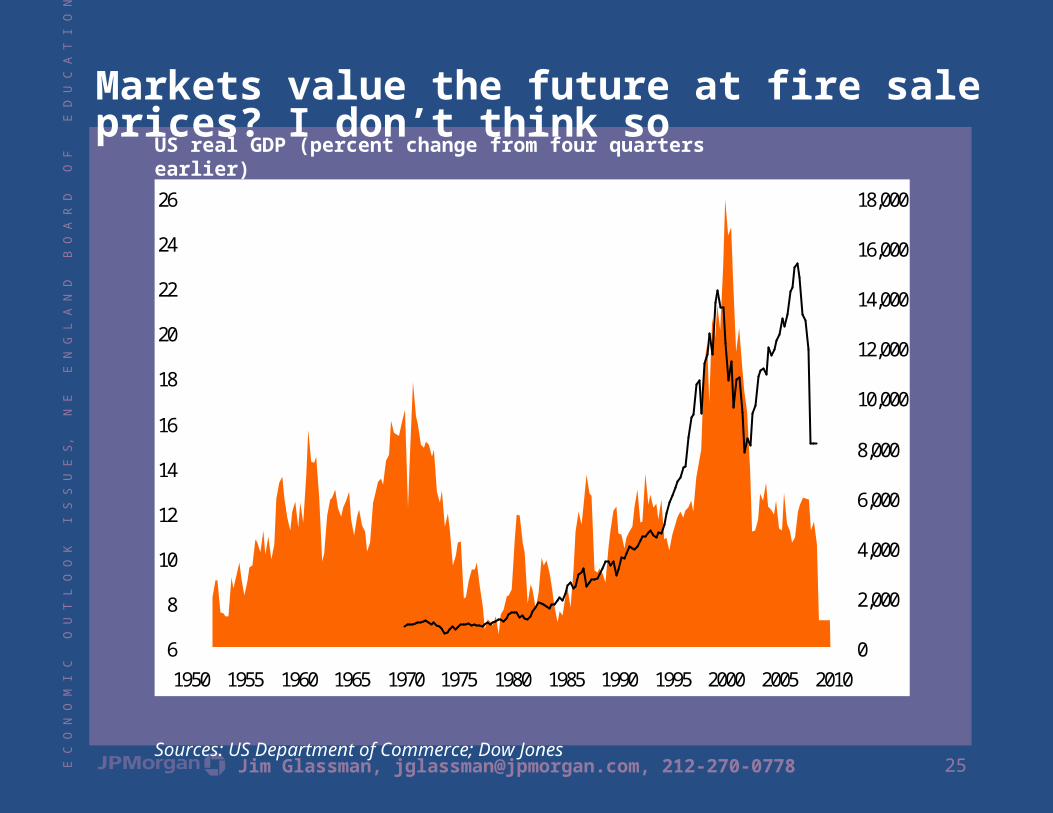
Markets value the future at fire sale prices? I don’t think soUS real GDP (percent change from four quarters earlier)
Sources: US Department of Commerce; Dow Jones
6
8
10
12
14
16
18
20
22
24
26
1950 1955 1960 1965 1970 1975 1980 1985 1990 1995 2000 2005 20100
2,000
4,000
6,000
8,000
10,000
12,000
14,000
16,000
18,000
Price-earnings ratio (left scale)
Wilshire 5000 (right scale)
26E C
O N
O M
I C
O U
T L
O O
K
I S S
U E
S,
N E
E
N G
L A
N D
B
O A
R D
O
F
E D
U C
A T
I O
N,
B O
S T
O N
, D
E C
E M
B E
R 5
, 2
0 0
8
Jim Glassman, [email protected], 212-270-0778
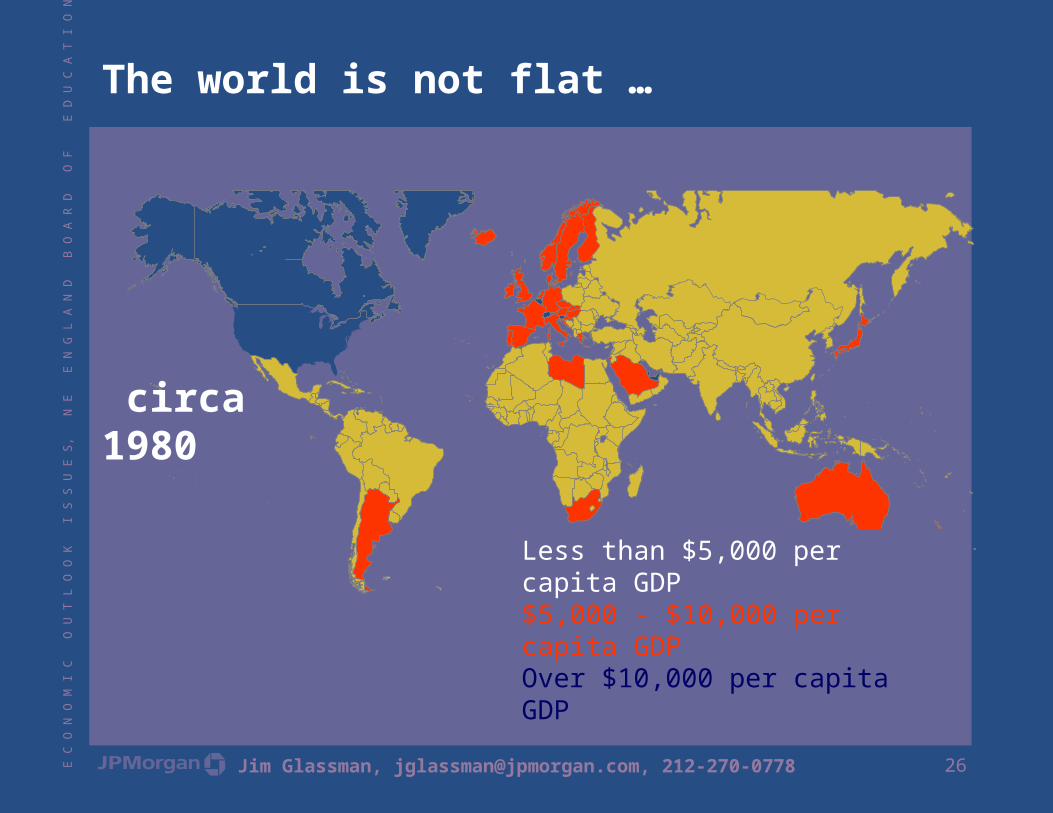
Less than $5,000 per capita GDP$5,000 - $10,000 per capita GDPOver $10,000 per capita GDP
The world is not flat …
circa 1980
27E C
O N
O M
I C
O U
T L
O O
K
I S S
U E
S,
N E
E
N G
L A
N D
B
O A
R D
O
F
E D
U C
A T
I O
N,
B O
S T
O N
, D
E C
E M
B E
R 5
, 2
0 0
8
Jim Glassman, [email protected], 212-270-0778
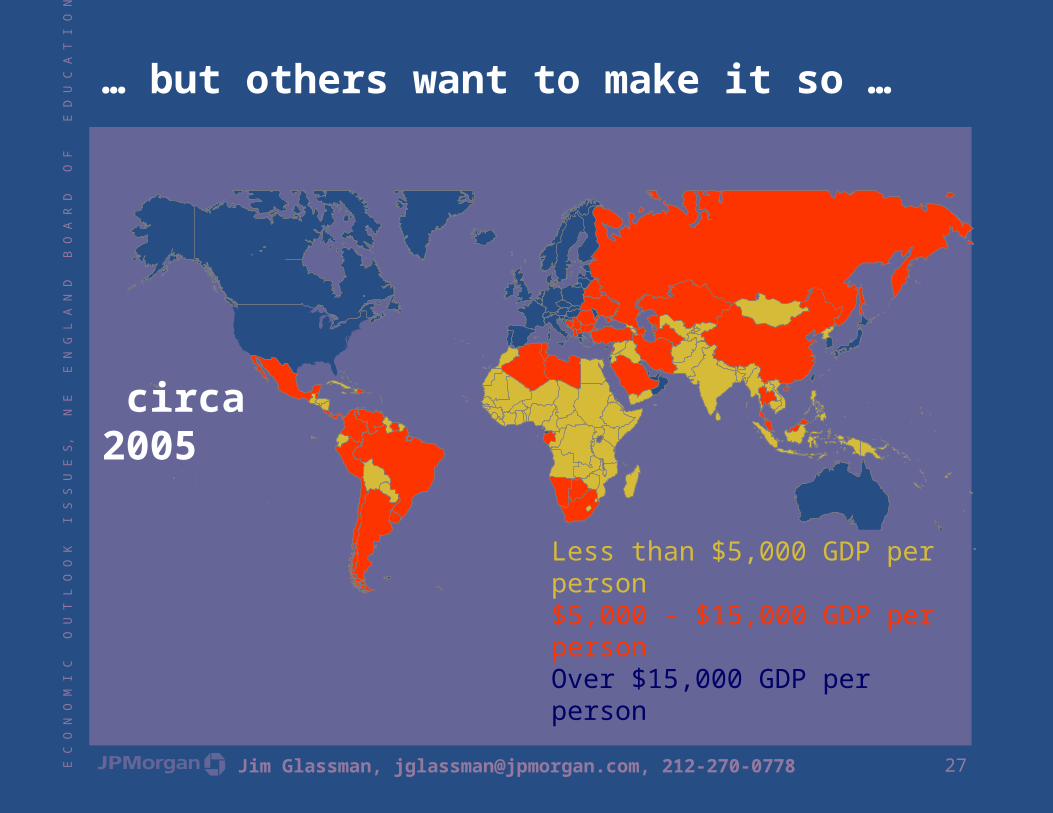
Less than $5,000 GDP per person$5,000 - $15,000 GDP per personOver $15,000 GDP per person
… but others want to make it so …
circa 2005

28E C
O N
O M
I C
O U
T L
O O
K
I S S
U E
S,
N E
E
N G
L A
N D
B
O A
R D
O
F
E D
U C
A T
I O
N,
B O
S T
O N
, D
E C
E M
B E
R 5
, 2
0 0
8
Jim Glassman, [email protected], 212-270-0778
Appendix I. Threats to our way
29E C
O N
O M
I C
O U
T L
O O
K
I S S
U E
S,
N E
E
N G
L A
N D
B
O A
R D
O
F
E D
U C
A T
I O
N,
B O
S T
O N
, D
E C
E M
B E
R 5
, 2
0 0
8
Jim Glassman, [email protected], 212-270-0778
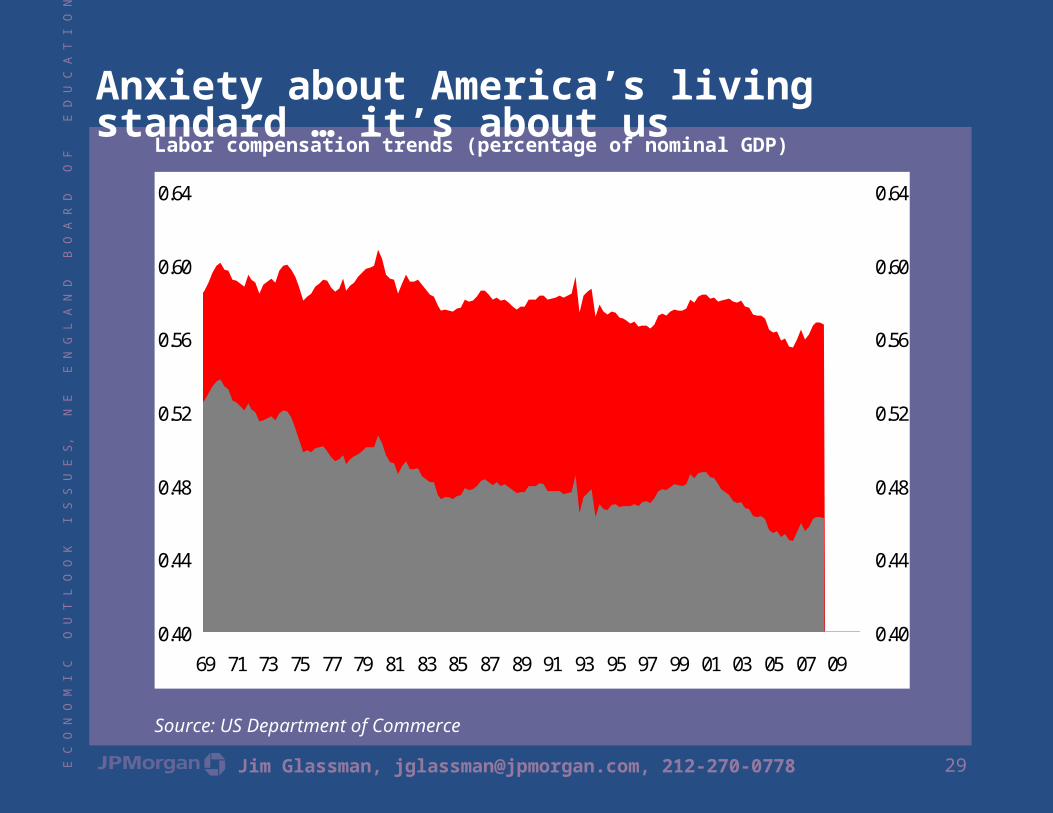
Anxiety about America’s living standard … it’s about usLabor compensation trends (percentage of nominal GDP)
Source: US Department of Commerce
0.40
0.44
0.48
0.52
0.56
0.60
0.64
69 71 73 75 77 79 81 83 85 87 89 91 93 95 97 99 01 03 05 07 090.40
0.44
0.48
0.52
0.56
0.60
0.64
Compensation
Wages and salaries (including average hourly earnings)

30E C
O N
O M
I C
O U
T L
O O
K
I S S
U E
S,
N E
E
N G
L A
N D
B
O A
R D
O
F
E D
U C
A T
I O
N,
B O
S T
O N
, D
E C
E M
B E
R 5
, 2
0 0
8
Jim Glassman, [email protected], 212-270-0778
Analysts’ Compensation: The research analysts responsible for the preparation of this report receive compensation based upon various factors, including the quality and accuracy of research, client feedback, competitive factors and overall firm revenues. The firm’s overall revenues include revenues from its investment banking and fixed income business units. Principal Trading: JPMorgan and/or its affiliates normally make a market and trade as principal in the securities discussed in this report.
Legal Entities: JPMorgan is the marketing name for JPMorgan Chase & Co. and its subsidiaries and affiliates worldwide. J.P. Morgan Securities Inc. is a member of NYSE and SIPC. JPMorgan Chase Bank, N.A. is a member of FDIC and is authorized and regulated in the UK by the Financial Services Authority. J.P. Morgan Futures Inc. is a member of the NFA. J.P. Morgan Securities Ltd. (JPMSL) is a member of the London Stock Exchange and is authorized and regulated by the Financial Services Authority. J.P. Morgan Equities Limited is a member of the Johannesburg Securities Exchange and is regulated by the FSB. J.P. Morgan Securities (Asia Pacific) Limited (CE number AAJ321) is regulated by the Hong Kong Monetary Authority. JPMorgan Chase Bank, Singapore branch is regulated by the Monetary Authority of Singapore. J.P. Morgan Securities Asia Private Limited is regulated by the MAS and the Financial Services Agency in Japan. J.P. Morgan Australia Limited (ABN 52 002 888 011/AFS License No: 238188) (JPMSAL) is a licensed securities dealer
General: Information has been obtained from sources believed to be reliable but JPMorgan does not warrant its completeness or accuracy except with respect to any disclosures relative to JPMSI and/or its affiliates and the analyst’s involvement with the issuer. Opinions and estimates constitute our judgment as at the date of this material and are subject to change without notice. Past performance is not indicative of future results. The investments and strategies discussed here may not be suitable for all investors; if you have any doubts you should consult your investment advisor. The investments discussed may fluctuate in price or value. Changes in rates of exchange may have an adverse effect on the value of investments. This material is not intended as an offer or solicitation for the purchase or sale of any financial instrument. JPMorgan and/or its affiliates and employees may act as placement agent, advisor or lender with respect to securities or issuers referenced in this report. Clients should contact analysts at and execute transactions through a JPMorgan entity in their home jurisdiction unless governing law permits otherwise. This report should not be distributed to others or replicated in any form without prior consent of JPMorgan. U.K. and European Economic Area (EEA): Investment research issued by JPMSL has been prepared in accordance with JPMSL’s Policies for Managing Conflicts of Interest in Connection with Investment Research. This report has been issued in the U.K. only to persons of a kind described in Article 19 (5), 38, 47 and 49 of the Financial Services and Markets Act 2000 (Financial Promotion) Order 2001 (all such persons being referred to as “relevant persons”). This document must not be acted on or relied on by persons who are not relevant persons. Any investment or investment activity to which this document relates is only available to relevant persons and will be engaged in only with relevant persons. In other EEA countries, the report has been issued to persons regarded as professional investors (or equivalent) in their home jurisdiction. Australia: This material is issued and distributed by JPMSAL in Australia to “wholesale clients” only. JPMSAL does not issue or distribute this material to “retail clients.” The recipient of this material must not distribute it to any third party or outside Australia without the prior written consent of JPMSAL. For the purposes of this paragraph the terms “wholesale client” and “retail client” have the meanings given to them in section 761G of the Corporations Act 2001. Korea: This report may have been edited or contributed to from time to time by affiliates of J.P. Morgan Securities (Far East) Ltd, Seoul branch.
Copyright 2008 JPMorgan Chase & Co. All rights reserved. Additional information available upon request.