Embed Size (px)
Citation preview

United Nations E/CN.3/2004/6
Economic and Social Council Distr.: General17 December 2003
Original: English
03-66598 (E) 220104
*0366598*
Statistical CommissionThirty-fifth session2-5 March 2004Item 3 (e) of the provisional agenda*Demographic and social statistics:statistics of drugs and drug use
Report of the United Nations Office on Drugs and Crime
Note by the Secretary-General
The Secretary-General has the honour to transmit to the StatisticalCommission the report of the United Nations Office on Drugs and Crime onstatistics of drugs and drug use. The report is transmitted to the Commission inaccordance with a request of the Statistical Commission at its thirty-fourthsession.** The Commission may wish to take note of the work of the Office onDrugs and Crime in the area of statistics of drugs and drug use.
* E/CN.3/2004/1.** See Official Records of the Economic and Social Council, 2003, Supplement No. 4 (E/2003/24),
chap. I.A.

2
E/CN.3/2004/6
Statistics of drugs and drug use
Report of the United Nations Office on Drugs and Crime
SummaryThe present report is a summary of the 2003 edition of the annual statistical
publication of the United Nations Office on Drugs and Crime, Global Illicit DrugTrends, which can be downloaded from http://www.unodc.org/unodc/en/global_illicit_drug_trends.html, bought in United Nations bookshops, or orderedfrom the United Nations Office on Drugs and Crime.
This summary presents, first, an analysis of the main illicit markets for heroin,cocaine, cannabis and amphetamine-type stimulants and, secondly, synthesizes themain trends in illicit drug production, trafficking and consumption. The analysis ofthe main illicit markets focuses on the period from 1998 to 2002, since theinternational community is presently reviewing progress in achieving the targets setat the twentieth special session of the General Assembly, held in 1998. Theconsideration of illicit drug production, trafficking and consumption trends focuseson 2001 and 2002.
ContentsParagraphs Page
I. Main trends in illicit drug markets, 1998-2002. . . . . . . . . . . . . . . . . . . . . . . . . . . . . . 1–23 3
A. Heroin . . . . . . . . . . . . . . . . . . . . . . . . . . . . . . . . . . . . . . . . . . . . . . . . . . . . . . . . . . 2–6 3
B. Cocaine . . . . . . . . . . . . . . . . . . . . . . . . . . . . . . . . . . . . . . . . . . . . . . . . . . . . . . . . . 7–10 4
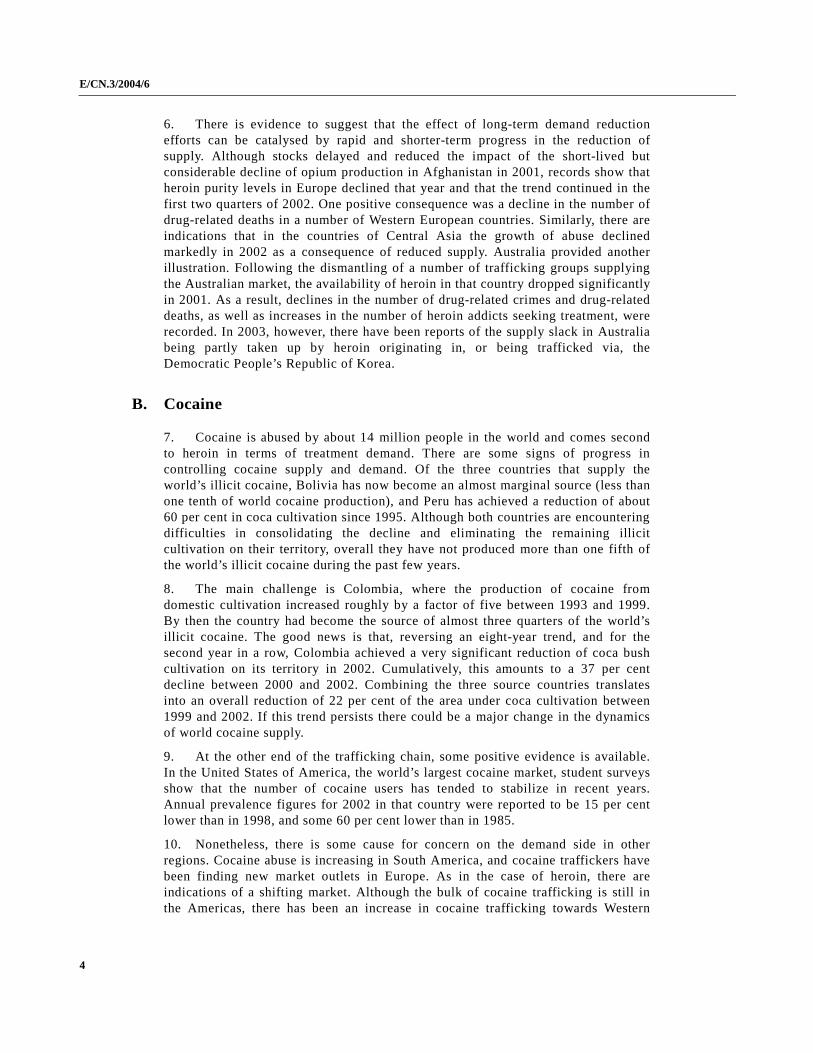
C. Cannabis . . . . . . . . . . . . . . . . . . . . . . . . . . . . . . . . . . . . . . . . . . . . . . . . . . . . . . . . 11–16 5
D. Amphetamine-type stimulants . . . . . . . . . . . . . . . . . . . . . . . . . . . . . . . . . . . . . . . 17–23 5
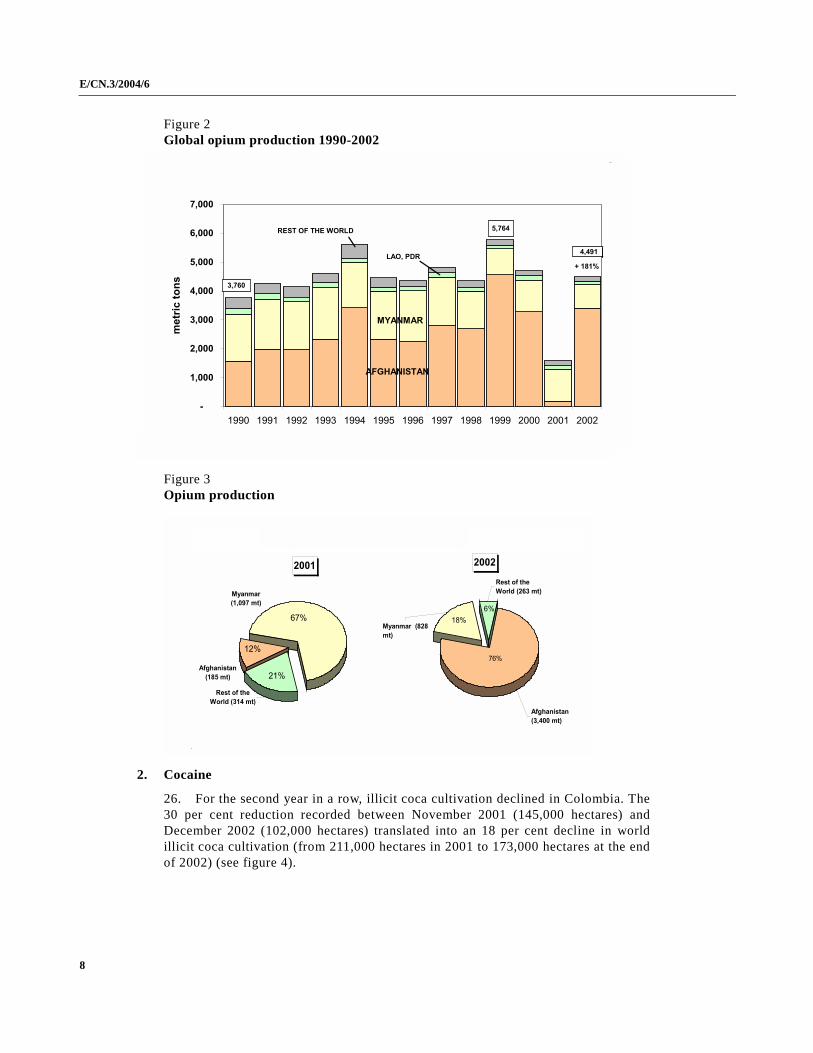
II. Main trends in production, trafficking and consumption, 2001-2002 . . . . . . . . . . . . 24–43 7
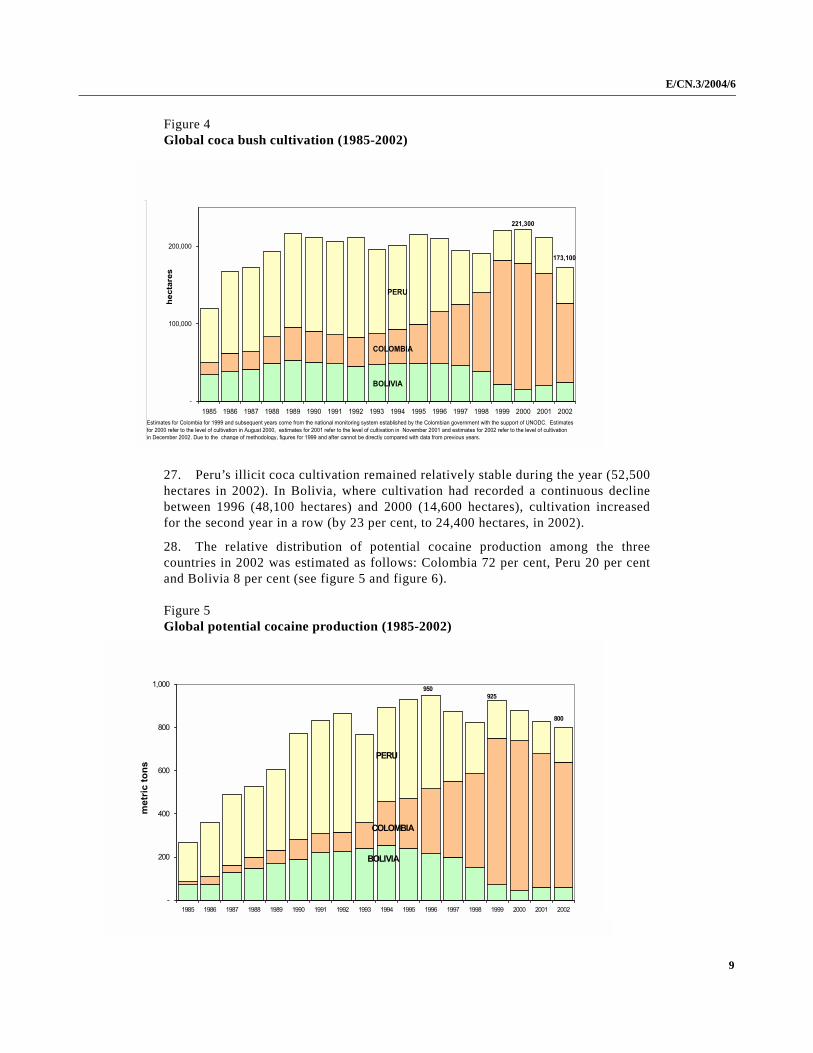
A. Production . . . . . . . . . . . . . . . . . . . . . . . . . . . . . . . . . . . . . . . . . . . . . . . . . . . . . . . 24–29 7
B. Trafficking . . . . . . . . . . . . . . . . . . . . . . . . . . . . . . . . . . . . . . . . . . . . . . . . . . . . . . . 30–35 10
C. Consumption . . . . . . . . . . . . . . . . . . . . . . . . . . . . . . . . . . . . . . . . . . . . . . . . . . . . . 36–43 14

3
E/CN.3/2004/6
I. Main trends in illicit drug markets, 1998-2002
1. The evolution of the main illicit drug markets in recent years provides anuneven picture of positive and negative developments, depending on the drugs andthe regions considered. Overall, the evolution of world heroin and cocaine marketsshows some positive tendencies. The picture is confused for synthetic drugs andfairly negative for cannabis.
A. Heroin
2. Treatment data consistently show that illicit heroin use has the most severehealth consequences for drug abusers. The United Nations Office on Drugs andCrime estimated that in 2000-2001 about 15 million people in the world abusedopium and heroin. Although this figure has not changed much since the late 1990s,gaps in the data prevent precise monitoring of changes in global demand for illicitopium and heroin from year to year. The impression of the relative stability of theglobal heroin market since the end of the 1990s can be supported by an assessmentof the supply situation, for which there is more robust data. About 4,400 metric tonsof illicit opium were produced in 1998. Four years later, in 2002, the production(approximately 4,500 metric tons) is more or less at the same level. Underneath theapparent stability of global production, however, major shifts are at work.
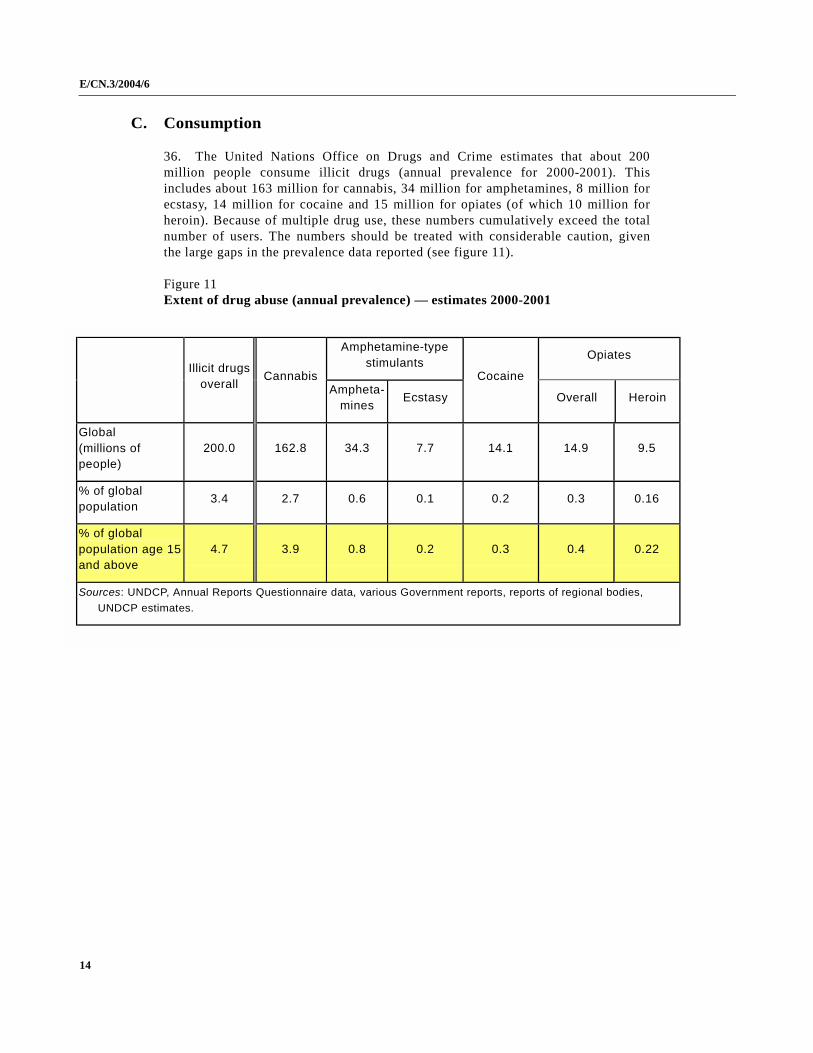
3. Statistics on agricultural land devoted to illicit opium poppy cultivation in theworld show that the market is changing. While global opium production remainedbasically stable over a four-year period, illicit opium poppy cultivation declined by25 per cent. The answer to this apparent paradox can be found in a considerable shiftof production from South-East to South-West Asia. Progress made in Myanmar andthe Lao People’s Democratic Republic resulted in a 40 per cent reduction in the areaunder opium poppy cultivation in that region between 1998 and 2002. Thisdownward trend continued in 2003. If the current rate of reduction in South-EastAsia is sustained, the Golden Triangle could well become a minor source of illicitopium in the next few years. This would close a century-long chapter in the historyof drug control. Meanwhile, a 16 per cent increase was recorded in South-West Asiafrom 1998 to 2002. The higher productivity of the irrigated opium fields inAfghanistan explains why the world’s opium output remained stable while the levelof cultivation was going down. The result has been an increasing concentration ofillicit opium production in a single country, Afghanistan.
4. Regional shifts have also reshaped the patterns of heroin abuse in the world.There are some improvements in Western Europe, but the rapid growth of opiumproduction in Afghanistan has fuelled the development of a large heroin market inthe region and, further, in Central Asia, the Russian Federation and Eastern Europe.Caused largely by the increase in intravenous heroin abuse, the HIV/AIDS epidemichas been expanding at an alarming rate.
5. The new heroin markets in Eastern Europe, the Russian Federation and CentralAsia are not yet as lucrative as the Western European markets. The economicincentive they provide to traffickers is thus lower. They do, however, offer thepotential to offset the reduction in profitability per transaction by expanding theconsumer base. There are already more opiate abusers in those regions than inWestern Europe, and the potential for further growth is large.
4
E/CN.3/2004/6
6. There is evidence to suggest that the effect of long-term demand reductionefforts can be catalysed by rapid and shorter-term progress in the reduction ofsupply. Although stocks delayed and reduced the impact of the short-lived butconsiderable decline of opium production in Afghanistan in 2001, records show thatheroin purity levels in Europe declined that year and that the trend continued in thefirst two quarters of 2002. One positive consequence was a decline in the number ofdrug-related deaths in a number of Western European countries. Similarly, there areindications that in the countries of Central Asia the growth of abuse declinedmarkedly in 2002 as a consequence of reduced supply. Australia provided anotherillustration. Following the dismantling of a number of trafficking groups supplyingthe Australian market, the availability of heroin in that country dropped significantlyin 2001. As a result, declines in the number of drug-related crimes and drug-relateddeaths, as well as increases in the number of heroin addicts seeking treatment, wererecorded. In 2003, however, there have been reports of the supply slack in Australiabeing partly taken up by heroin originating in, or being trafficked via, theDemocratic People’s Republic of Korea.
B. Cocaine
7. Cocaine is abused by about 14 million people in the world and comes secondto heroin in terms of treatment demand. There are some signs of progress incontrolling cocaine supply and demand. Of the three countries that supply theworld’s illicit cocaine, Bolivia has now become an almost marginal source (less thanone tenth of world cocaine production), and Peru has achieved a reduction of about60 per cent in coca cultivation since 1995. Although both countries are encounteringdifficulties in consolidating the decline and eliminating the remaining illicitcultivation on their territory, overall they have not produced more than one fifth ofthe world’s illicit cocaine during the past few years.
8. The main challenge is Colombia, where the production of cocaine fromdomestic cultivation increased roughly by a factor of five between 1993 and 1999.By then the country had become the source of almost three quarters of the world’sillicit cocaine. The good news is that, reversing an eight-year trend, and for thesecond year in a row, Colombia achieved a very significant reduction of coca bushcultivation on its territory in 2002. Cumulatively, this amounts to a 37 per centdecline between 2000 and 2002. Combining the three source countries translatesinto an overall reduction of 22 per cent of the area under coca cultivation between1999 and 2002. If this trend persists there could be a major change in the dynamicsof world cocaine supply.
9. At the other end of the trafficking chain, some positive evidence is available.In the United States of America, the world’s largest cocaine market, student surveysshow that the number of cocaine users has tended to stabilize in recent years.Annual prevalence figures for 2002 in that country were reported to be 15 per centlower than in 1998, and some 60 per cent lower than in 1985.
10. Nonetheless, there is some cause for concern on the demand side in otherregions. Cocaine abuse is increasing in South America, and cocaine traffickers havebeen finding new market outlets in Europe. As in the case of heroin, there areindications of a shifting market. Although the bulk of cocaine trafficking is still inthe Americas, there has been an increase in cocaine trafficking towards Western

5
E/CN.3/2004/6
Europe. The share of global cocaine seizures in Western Europe more than doubledbetween 1998 and 2001, rising from 8 per cent to 17 per cent during that period.Information on consumption tells the same story. The majority of Western Europeancountries reported an increase in cocaine abuse for 2001.
C. Cannabis
11. Cannabis continues to be the most widely produced, trafficked and consumedillicit drug worldwide.
12. Given the global spread of cannabis production and the virtual absence ofmonitoring systems, no reliable production estimates for cannabis are available. (InMorocco, which is one of the largest producers of cannabis resin, the United NationsOffice on Drugs and Crime and the Government are launching the first survey ofcannabis cultivation this year.) Rising levels of cannabis seizures and abuse suggest,however, that production is also increasing.
13. About two thirds of the 86 countries that reported cannabis consumption trendsto the United Nations Office on Drugs and Crime last year indicated an increase ofcannabis abuse in 2001. Overall seizures of cannabis rose by some 40 per centbetween 1998 and 2001.
14. A distinction should be made between cannabis resin and herb products.Seizure data over the period 1998-2001 suggest a relative stability in the traffickingpatterns of cannabis resin, which continues to be seized primarily in Western Europe(about three quarters of all seizures). It was therefore cannabis herb seizures thataccounted for the increase noted above. More than 60 per cent of all cannabis herbseizures in 2001 were reported from the Americas. However, the strongest increasewas in Africa, probably reflecting a combination of large-scale cultivation ofcannabis and increased enforcement efforts in recent years. More than a quarter ofall cannabis herb seizures are now reported from countries in Africa, compared withlittle more than 10 per cent in 1998-1999.
15. Finally, seizures of cannabis plants — an indicator of the efforts made byGovernments to eradicate cannabis fields — seem to be declining, possibly anindication of the lesser priority given to cannabis eradication by some Governments.
16. There are, however, some positive trends. In the United States of America, forinstance, cannabis abuse (annual prevalence) fell in 2002 among high-schoolstudents and was almost 10 per cent lower than in 1997 and some 30 per cent lowerthan in the late 1970s. In Australia, cannabis abuse among the general populationdeclined by 23 per cent over the 1998-2001 period.
D. Amphetamine-type stimulants
17. Amphetamine-type stimulants (ATS) are synthetic drugs that include thechemically related amphetamine, methamphetamine and ecstasy. Unlike thetraditional plant-based drugs, the production of ATS starts with readily availablechemicals, in easily concealed laboratories. This makes an assessment of thelocation, extent and evolution of the production of such illicit drugs extremelydifficult. In order to obtain a clearer picture of this complex situation, the United

6
E/CN.3/2004/6
Nations Office on Drugs and Crime is presently undertaking a global survey onATS.
18. Seizures of laboratories and end products, as well as reports on consumption,indicate that the expansion of the ATS market is continuing. More laboratories weredetected and dismantled worldwide over the last few years than ever before,particularly in the United States of America. But the market is also changing, partlyin response to drug control agencies’ efforts to tackle the problem, and partly as aresult of the dynamics of abuse patterns.
19. Trafficking in methamphetamine accounts for the bulk of trafficking in ATSand has been clearly shifting towards East and South-East Asia in recent years.Seizures in 2001 declined, however, possibly a consequence of better controls ofephedrine (one of the main precursors) and first successes in reducingmethamphetamine production in China. The Democratic People’s Republic of Koreaseems to be emerging as a significant source and trans-shipment area formethamphetamine going to Japan, which is the region’s most lucrative ATS market.
20. In 2000 close to 90 per cent of all countries reporting to the United NationsOffice on Drugs and Crime on trends in the abuse of methamphetamine reported anincrease. By 2001 this proportion fell to 52 per cent. Japan reported a stabilization inmethamphetamine abuse in 2001, following years of increase. Thailand, in contrast,affected by large-scale methamphetamine imports from neighbouring Myanmar,seized the largest quantity of methamphetamine worldwide in 2001 and reported afurther increase in ATS abuse for 2001.
21. Europe, notably the Netherlands, Poland and Belgium, continues to be themain centre of clandestine amphetamine production. Seizures of amphetamine inWestern Europe peaked around 1998 and have shown a downward trend since, butproduction and trafficking continued to increase in Eastern Europe. This couldsignal an underlying shift of amphetamine production to Eastern Europe, andpossibly a less buoyant demand in Western Europe. While half of all WesternEuropean countries reported an increase in amphetamine abuse in 2000, thisproportion fell somewhat, to 33 per cent, in 2001.
22. Trafficking in ecstasy increased strongly throughout the 1990s. In 2001,however, ecstasy seizures declined, mainly in North America and Western Europe.Europe (particularly the Netherlands and Belgium) is still the main centre of globalecstasy production. However, its relative importance seems to be declining asecstasy production is appearing in other parts of the world. In the mid-1990s,Western European countries reported about 80 per cent of all ecstasy seizures. Thisproportion fell to about 50 per cent in 2000 and 2001. Trafficking in ecstasy hasincreased particularly in the Americas in recent years, though it is now found inother regions as well, notably in South-East Asia, southern Africa and the Near andMiddle East.
23. Ecstasy abuse, after a period of decline, has again shown signs of increase inWestern Europe. In the United States of America it declined, for the first time inyears, in 2002. In other regions, particularly the Caribbean and parts of SouthAmerica, Oceania, South-East Asia, the Near East and southern Africa, it seems tobe accelerating.

7
E/CN.3/2004/6
II. Main trends in production, trafficking and consumption,2001-2002
A. Production
1. Opium/heroin
24. After the steep decline recorded in 2001, world illicit opium and heroinproduction recovered in 2002, despite a reduction of cultivation by 23 per cent inMyanmar and 18 per cent in the Lao People’s Democratic Republic. This increasewas due to the resumption of large-scale opium poppy cultivation in Afghanistan.Global illicit opium poppy cultivation (see figure 1) climbed back to about 180,000hectares in 2002 (against 144,000 hectares in 2001 and 222,000 hectares in 2000).The resulting opium production (see figure 2) was estimated at about 4,500 metrictons (against 1,600 metric tons in 2001 and 4,700 metric tons in 2000).
25. In 2002 the relative distribution of illicit opium production among the mainsource countries (see figure 3) was as follows: Afghanistan (76 per cent), Myanmar(18 per cent), the Lao People’s Democratic Republic (2 per cent) and Colombia(1 per cent). The remaining 3 per cent came from other countries (Mexico, Pakistan,Thailand, Viet Nam, etc.) where marginal production is reported.
Figure 1Global opium poppy cultivation 1990-2002
8
E/CN.3/2004/6
Figure 2Global opium production 1990-2002
-
1,000
2,000
3,000
4,000
5,000
6,000
7,000
1990 1991 1992 1993 1994 1995 1996 1997 1998 1999 2000 2001 2002
me
tric
to
ns
MYANMAR
REST OF THE WORLD
LAO, PDR
3,760
5,764
4,491
AFGHANISTAN
GLOBAL OPIUM PRODUCTION 1990-2002
+ 181%
Figure 3Opium production
2. Cocaine
26. For the second year in a row, illicit coca cultivation declined in Colombia. The30 per cent reduction recorded between November 2001 (145,000 hectares) andDecember 2002 (102,000 hectares) translated into an 18 per cent decline in worldillicit coca cultivation (from 211,000 hectares in 2001 to 173,000 hectares at the endof 2002) (see figure 4).
OPIUM PRODUCTION
2001
Rest of the
World (314 mt)
Myanmar
(1,097 mt)
Afghanistan
(185 mt)
67%
21%
12%
2002
Afghanistan
(3,400 mt)
Myanmar (828
mt)
Rest of the
World (263 mt)
18%
76%
6%
9
E/CN.3/2004/6
Figure 4Global coca bush cultivation (1985-2002)
27. Peru’s illicit coca cultivation remained relatively stable during the year (52,500hectares in 2002). In Bolivia, where cultivation had recorded a continuous declinebetween 1996 (48,100 hectares) and 2000 (14,600 hectares), cultivation increasedfor the second year in a row (by 23 per cent, to 24,400 hectares, in 2002).
28. The relative distribution of potential cocaine production among the threecountries in 2002 was estimated as follows: Colombia 72 per cent, Peru 20 per centand Bolivia 8 per cent (see figure 5 and figure 6).
Figure 5Global potential cocaine production (1985-2002)
-
100,000
200,000
1985 1986 1987 1988 1989 1990 1991 1992 1993 1994 1995 1996 1997 1998 1999 2000 2001 2002
hecta
res
BOLIVIA
COLOMBIA
PERU
GLOBAL COCA BUSH CULTIVATION (1985 - 2002)
Estimates for Colombia for 1999 and subsequent years come from the national monitoring system established by the Colombian government with the support of UNODC. Estimates
for 2000 refer to the level of cultivation in August 2000, estimates for 2001 refer to the level of cultivation in November 2001 and estimates for 2002 refer to the level of cultivation
in December 2002. Due to the change of methodology, figures for 1999 and after cannot be directly compared with data from previous years.
221,300
173,100
-
200
400
600
800
1,000
1985 1986 1987 1988 1989 1990 1991 1992 1993 1994 1995 1996 1997 1998 1999 2000 2001 2002
me
tric
to
ns
PERU
BOLIVIA
COLOMBIA
GLOBAL POTENTIAL COCAINE PRODUCTION (1985 - 2002)
950
800
925

10
E/CN.3/2004/6
Figure 6Potential cocaine production
3. Cannabis and amphetamine-type stimulants
29. The lack of adequate data does not enable the United Nations Office on Drugsand Crime to precisely monitor trends in cannabis and synthetic drug productionfrom year to year. However, indirect indicators suggest that global production ofcannabis and amphetamine-type stimulants continued to increase in recent years,although regional variations could be observed.
B. Trafficking
30. Overall trafficking, as reflected in the number of seizure cases reported,continued growing in 2001, though at a slower pace than in the 1990s. The latestseizure data received from Member States in replies to the Annual ReportsQuestionnaire refer to the year 2001 (see figure 7 and figure 10).
Figure 7Global (reported) seizure cases (1985-2001)
2001 2002
POTENTIAL COCAINE PRODUCTION
Peru 150 mt
18%
Colombia
617 mt
75%
Bolivia
60 mt
7%
Bolivia
60 mt
8%
Colombia
580 mt
72%
Peru 160 mt
20%
Global (reported) seizure cases (1985-2001)
309,933282,070
826,098
1,293,440
1,374,987
0
200,000
400,000
600,000
800,000
1,000,000
1,200,000
1,400,000
1985
1986
1987
1988
1989
1990
1991
1992
1993
1994
1995
1996
1997
1998
1999
2000
2001
Reported seizure cases Trend

11
E/CN.3/2004/6
Global seizures in metric tons (based on weight equivalents)
in 2000 and 2001
2.3
10.4
4.5
26.2
11.6
53.9
1.4
107.1
129.6
365.9
0.0 100.0 200.0 300.0 400.0
Depressants
Methaqualone
Ecstasy
Stimulants
Morphine
Heroin
Opium plants
Opium
Coca leaf
Cocaine*
tons
20012000
*Cocaine excluding seizures in liquid form
1,102
1. Cannabis
31. The largest quantities seized worldwide were of cannabis herb, followed bycannabis resin. Seized quantities of cannabis remained stable in 2001. The largestcannabis herb seizures in 2001 were reported from Mexico; the largest cannabisresin seizures were made by Spain (see figure 8).
Figure 8Global seizures in metric tons (based on weight equivalents) in 2000 and 2001
2. Cocaine
32. The third-largest quantities of drugs seized worldwide were of cocaine. Theyremained more or less stable in 2001. The largest cocaine seizures were reportedfrom the United States of America, followed by Colombia (see figure 9).
Figure 9Global seizures in metric tons (based on weight equivalents) in 2000 and 2001
Global seizures in metric tons (based on weight equivalents) in 2000 and 2001
897
4,676
0 1,000 2,000 3,000 4,000 5,000
Cannabis resin
Cannabis herb
2000 2001

12
E/CN.3/2004/6
3. Opiates
33. Overall, seizures of opiates declined by 23 per cent in 2001. The decline isattributed to the considerable decline of opium production in Afghanistan that year.Most opiate seizures (opium, morphine and heroin) continued to be made by theIslamic Republic of Iran. The largest seizures of heroin, however, were reportedfrom China in 2001.
4. Amphetamine-type stimulants (excluding ecstasy)
34. Following years of massive growth, seizures of amphetamine-type stimulants(excluding ecstasy) fell in 2001 by 36 per cent. This decline was due mainly tolower methamphetamine seizures reported by China, which in recent yearsaccounted for the bulk of such seizures. Nonetheless, global ATS seizures(excluding ecstasy) were still four times as high as in 1995 and eight times as highas in 1990. The largest ATS seizures in 2001 were reported from Thailand.
5. Ecstasy
35. Ecstasy seizures fell by about 10 per cent in 2001. Declines were recorded in anumber of major markets, including the United States of America, Canada, theNetherlands, France and Italy. The largest ecstasy seizures were reported from theNetherlands, followed by the United States of America.

13
E/CN.3/2004/6
Figure 10Trends in world seizures — 1991-2001(in metric tons)
(in metric tons)TRENDS IN WORLD SEIZURES - 1991-2001
AMPHETAMINE-TYPE STIMULANTS
-5
1015202530354045
1991 1992 1993 1994 1995 1996 1997 1998 1999 2000 2001
OPIUM
-
50
100
150
200
250
300
1991 1992 1993 1994 1995 1996 1997 1998 1999 2000 2001
HEROIN AND MORPHINE
-102030405060708090
1991 1992 1993 1994 1995 1996 1997 1998 1999 2000 2001
CANNABIS HERB
-
500
1,000
1,500
2,000
2,500
3,000
3,500
4,000
4,500
5,000
1991 1992 1993 1994 1995 1996 1997 1998 1999 2000 2001
COCAINE
-
50
100
150
200
250
300
350
400
450
1991 1992 1993 1994 1995 1996 1997 1998 1999 2000 2001
CANNABIS RESIN
-
200
400
600
800
1,000
1,200
1991 1992 1993 1994 1995 1996 1997 1998 1999 2000 2001
14
E/CN.3/2004/6
C. Consumption
36. The United Nations Office on Drugs and Crime estimates that about 200million people consume illicit drugs (annual prevalence for 2000-2001). Thisincludes about 163 million for cannabis, 34 million for amphetamines, 8 million forecstasy, 14 million for cocaine and 15 million for opiates (of which 10 million forheroin). Because of multiple drug use, these numbers cumulatively exceed the totalnumber of users. The numbers should be treated with considerable caution, giventhe large gaps in the prevalence data reported (see figure 11).
Figure 11Extent of drug abuse (annual prevalence) — estimates 2000-2001
Amphetamine-typestimulants Opiates
Illicit drugsoverall Cannabis
Ampheta-mines Ecstasy
Cocaine
Overall Heroin
Global(millions ofpeople)
200.0 162.8 34.3 7.7 14.1 14.9 9.5
% of globalpopulation 3.4 2.7 0.6 0.1 0.2 0.3 0.16
% of globalpopulation age 15and above
4.7 3.9 0.8 0.2 0.3 0.4 0.22
Sources: UNDCP, Annual Reports Questionnaire data, various Government reports, reports of regional bodies,UNDCP estimates.

15
E/CN.3/2004/6
37. Reports indicate that, overall, the global drug problem continues to spread ingeographical terms, as more countries reported increases rather than decreases indrug abuse (see figure 12). As in previous years, the strongest increase in abuselevels was for cannabis, followed by amphetamine-type stimulants. There are,however, indications that the rate of increase is slowing down, with the exception ofecstasy.
Figure 12Global substance abuse trends: selected drugs in 2001(based on information from 92 countries)
Source: UNODC, Annual Reports Questionnaire Data.
Global substance abuse trends*:
selected drugs in 2001 (based on information from 92 countries)
1
4
5
9
9
10
11
9
15
6
5
13
14
1
3
5
9
12
12
14
19
19
23
33
33
41
46
50
40 20 0 20 40 60
Methaqualone
Morphine
Khat
LSD
Hallucinogens
Barbiturates
Opium
Inhalants
Crack
Benzodiazepines
Heroin
Ecstasy
Cocaine
Amphetamines
Cannabis
Number of countries reporting
decrease increase
Source: UNODC, Annual Reports Questionnaire data.

16
E/CN.3/2004/6
38. The main problem drugs in the world, as reflected in demand for treatment,remained the opiates, followed by cocaine. In much of East and South-East Asia,ATS are the main problem drugs. In Africa, treatment demand continues to beconcentrated on cannabis (see figure 13).
Figure 13Main problem drugs (as reflected in treatment demand) in the late 1990s(updated in 2003)
Sources: UNODC, Annual Reports Questionnaire Data/DELTA and National Government Reports.
17
E/CN.3/2004/6
1. Opium/heroin
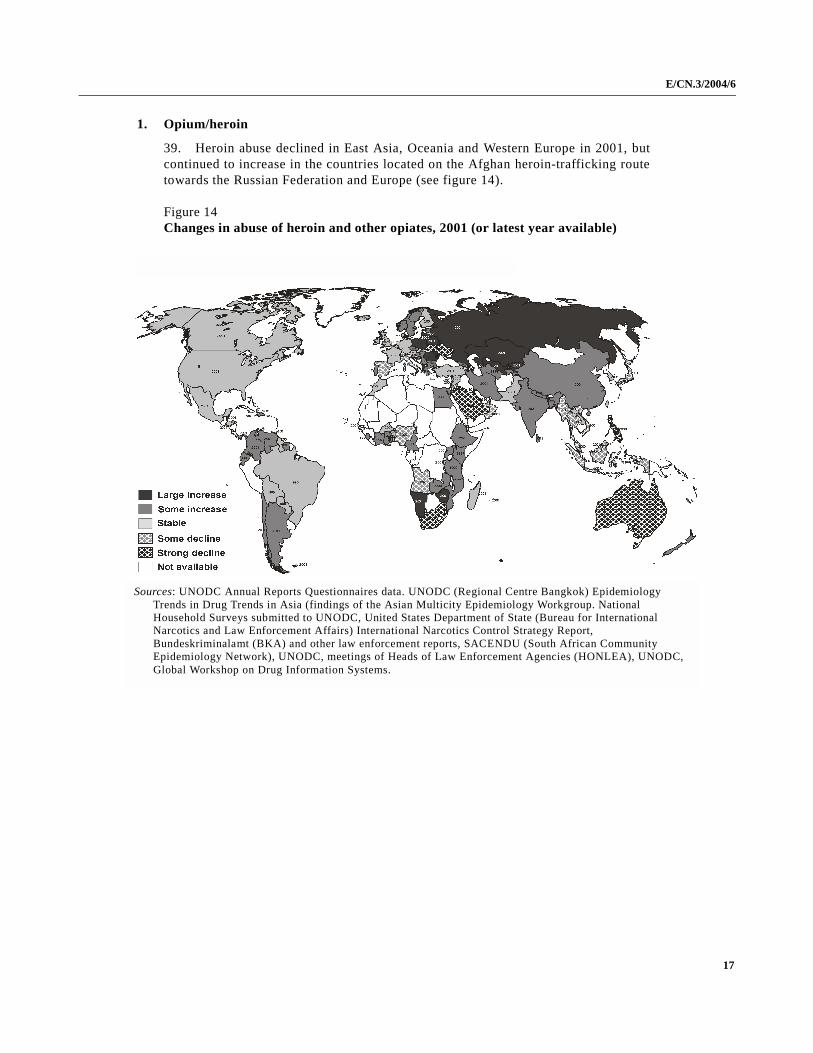
39. Heroin abuse declined in East Asia, Oceania and Western Europe in 2001, butcontinued to increase in the countries located on the Afghan heroin-trafficking routetowards the Russian Federation and Europe (see figure 14).
Figure 14Changes in abuse of heroin and other opiates, 2001 (or latest year available)
Sources: UNODC Annual Reports Questionnaires data. UNODC (Regional Centre Bangkok) EpidemiologyTrends in Drug Trends in Asia (findings of the Asian Multicity Epidemiology Workgroup. NationalHousehold Surveys submitted to UNODC, United States Department of State (Bureau for InternationalNarcotics and Law Enforcement Affairs) International Narcotics Control Strategy Report,Bundeskriminalamt (BKA) and other law enforcement reports, SACENDU (South African CommunityEpidemiology Network), UNODC, meetings of Heads of Law Enforcement Agencies (HONLEA), UNODC,Global Workshop on Drug Information Systems.
18
E/CN.3/2004/6
2. Cocaine
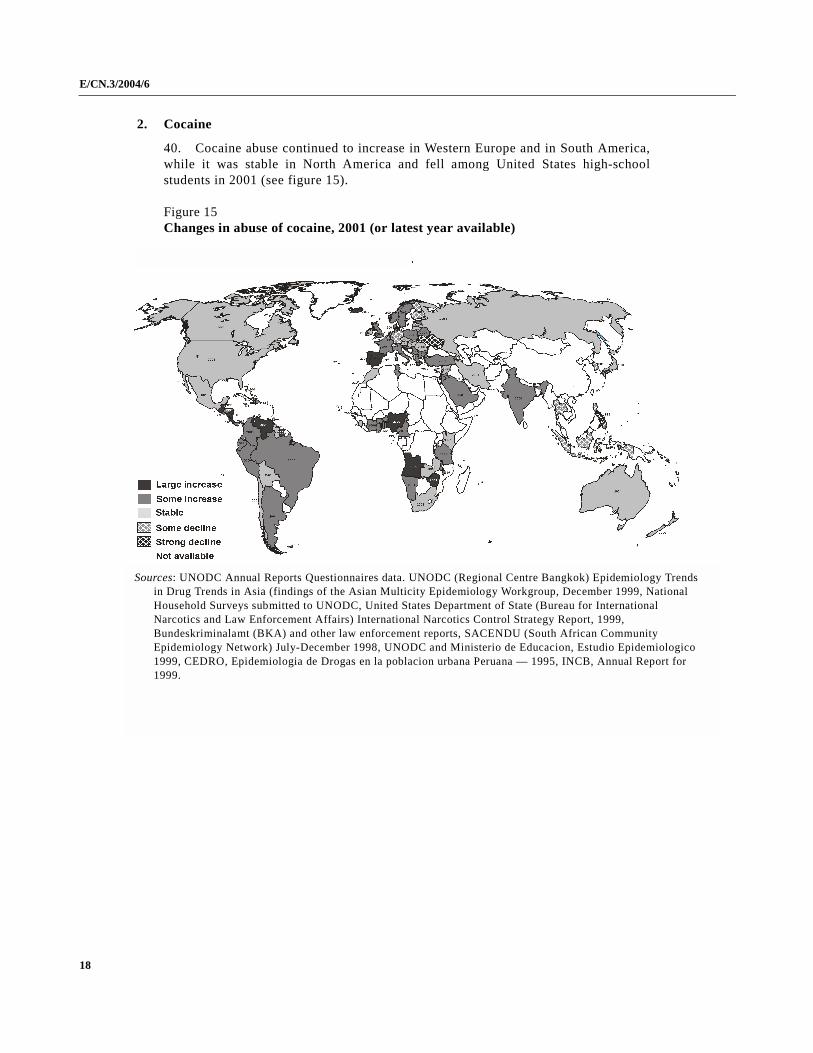
40. Cocaine abuse continued to increase in Western Europe and in South America,while it was stable in North America and fell among United States high-schoolstudents in 2001 (see figure 15).
Figure 15Changes in abuse of cocaine, 2001 (or latest year available)
S
ources: UNODC Annual Reports Questionnaires data. UNODC (Regional Centre Bangkok) Epidemiology Trendsin Drug Trends in Asia (findings of the Asian Multicity Epidemiology Workgroup, December 1999, NationalHousehold Surveys submitted to UNODC, United States Department of State (Bureau for InternationalNarcotics and Law Enforcement Affairs) International Narcotics Control Strategy Report, 1999,Bundeskriminalamt (BKA) and other law enforcement reports, SACENDU (South African CommunityEpidemiology Network) July-December 1998, UNODC and Ministerio de Educacion, Estudio Epidemiologico1999, CEDRO, Epidemiologia de Drogas en la poblacion urbana Peruana — 1995, INCB, Annual Report for1999.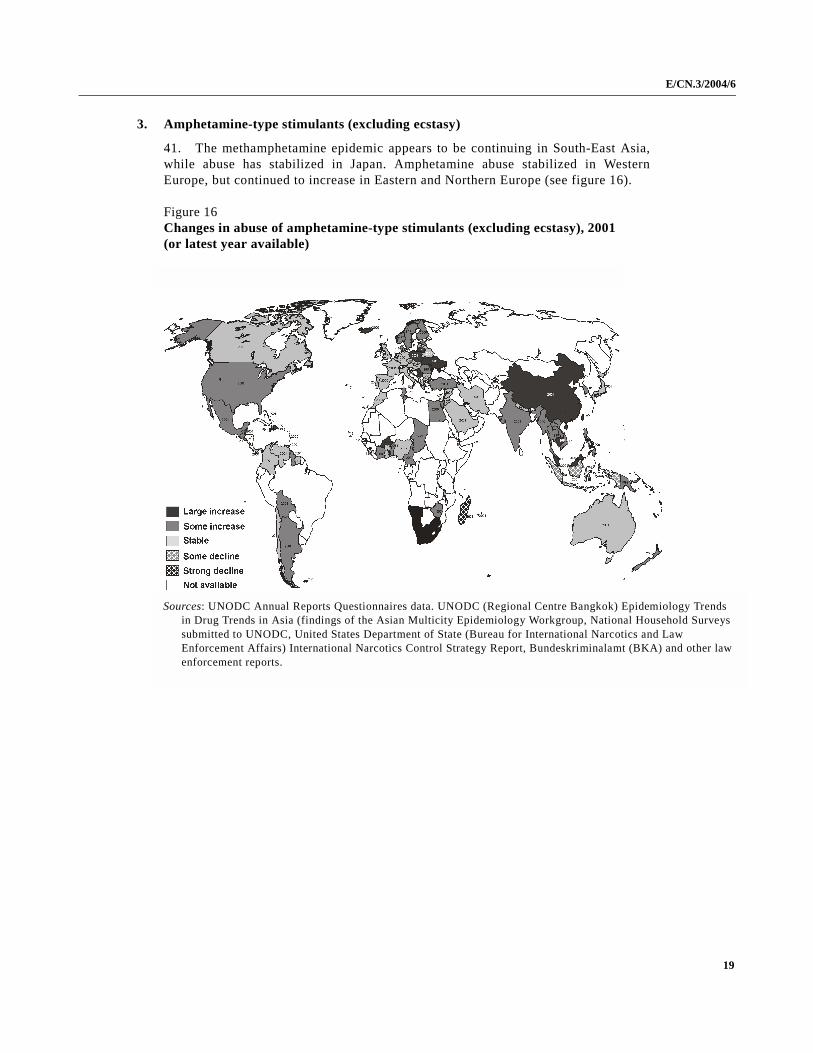
E/CN.3/2004/6
3. Amphetamine-type stimulants (excluding ecstasy)
41. The methamphetamine epidemic appears to be continuing in South-East Asia,while abuse has stabilized in Japan. Amphetamine abuse stabilized in WesternEurope, but continued to increase in Eastern and Northern Europe (see figure 16).
Figure 16Changes in abuse of amphetamine-type stimulants (excluding ecstasy), 2001(or latest year available)
Sources: UNODC Annual Reports Questionnaires data. UNODC (Regional Centre Bangkok) Epidemiology Trendsin Drug Trends in Asia (findings of the Asian Multicity Epidemiology Workgroup, National Household Surveyssubmitted to UNODC, United States Department of State (Bureau for International Narcotics and LawEnforcement Affairs) International Narcotics Control Strategy Report, Bundeskriminalamt (BKA) and other lawenforcement reports.
19

20
E/CN.3/2004/6
4. Ecstasy
42. Most countries reporting on ecstasy saw increasing levels of abuse (see figure 17).
Figure 17Changes in abuse of ecstasy (MDA, MDEA, MDMA), 2001(or latest year available)
Sources: UNODC Annual Reports Questionnaires data. UNODC (Regional Centre Bangkok) Epidemiology Trendsin Drug Trends in Asia (findings of the Asian Multicity Epidemiology Workgroup, National Household Surveyssubmitted to UNODC, United States Department of State (Bureau for International Narcotics and LawEnforcement Affairs) International Narcotics Control Strategy Report; Bundeskriminalamt (BKA) and other lawenforcement reports.
21
E/CN.3/2004/6
5. Cannabis
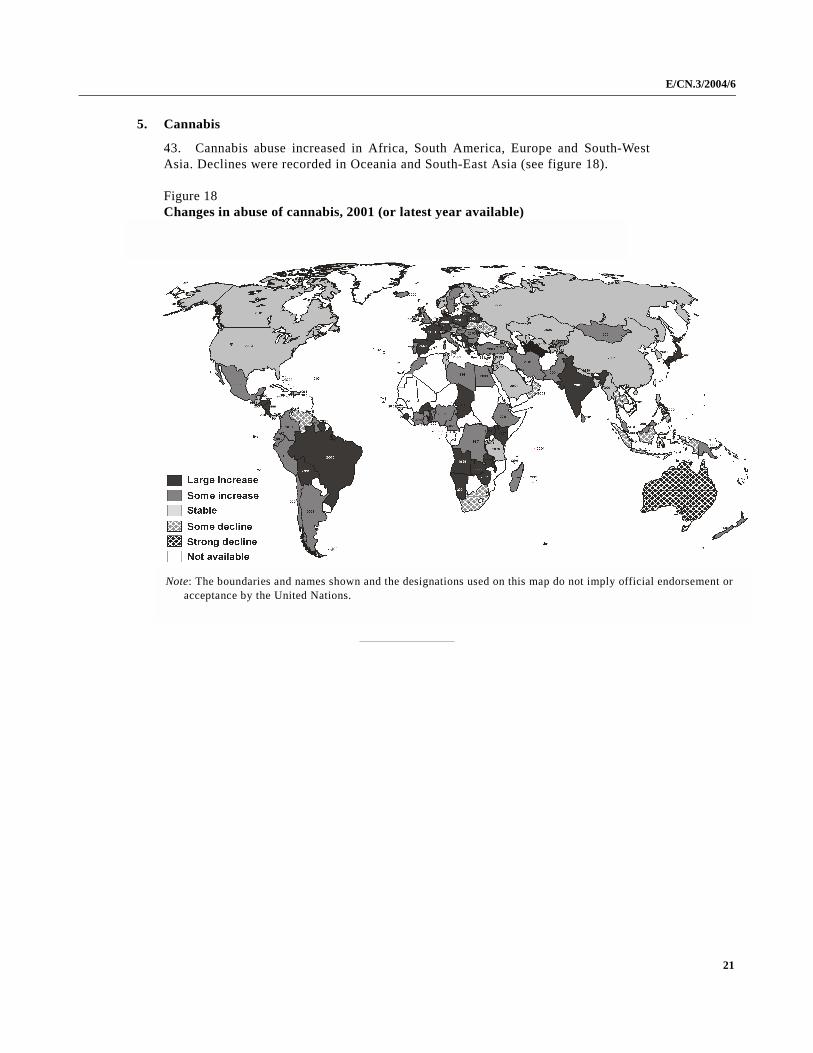
43. Cannabis abuse increased in Africa, South America, Europe and South-WestAsia. Declines were recorded in Oceania and South-East Asia (see figure 18).
Figure 18Changes in abuse of cannabis, 2001 (or latest year available)
Note: The boundaries and names shown and the designations used on this map do not imply official endorsement oracceptance by the United Nations.