Embed Size (px)
Citation preview
Earthquake ground motion estimation using
strong-motion re ords: A review of equations
for the estimation of peak ground a eleration
and response spe tral ordinates
J. Douglas
a;�
a
Department of Civil & Environmental Engineering; Imperial College of S ien e,
Te hnology & Medi ine; London; SW7 2BU; U.K.
Abstra t
Engineering seismology is the link between earth s ien es and engineering. The main
input of engineering seismology in engineering design are loading onditions whi h
must satisfy ertain onditions regarding their level and frequen y of o urren e
during the lifetime of a stru ture. One method for estimating these loading ondi-
tions are through equations based on strong ground motion re orded during previous
earthquakes. These equations have a handful of independent parameters, su h as
magnitude and sour e-to-site distan e, and a dependent parameter, su h as peak
ground a eleration or spe tral a eleration, and the oeÆ ients in the equation are
usually found by regression analysis.
This review examines su h equations in terms of: data sele tion, a elerogram
pro essing te hniques of the strong-motion re ords used to onstru t the equations,
the hara terisation of earthquake sour e, travel path and lo al site used and re-
gression te hniques employed to �nd the �nal equations.
Preprint submitted to Earth-S ien e Reviews 17 June 2002
It is found that little agreement has been rea hed in the past thirty years of ground
motion estimation relation studies. Workers have hosen their te hniques based on
the available data, whi h varies greatly with geographi al region. Also it is noted
that there is a need to in lude more independent parameters into ground motion
estimation equations if the large un ertainties asso iated with su h equations are
to be signi� antly redu ed. The data required to do this is, unfortunately, s ar e.
Key words: seismology, geologi hazards, seismi hazard, engineering seismology,
attenuation relations
1 Introdu tion
Engineering seismology is the link between earth s ien es and engineering. The
main input of engineering seismology in engineering design are loading ondi-
tions whi h must satisfy ertain onditions regarding their level and frequen y
of o urren e during the lifetime of a stru ture. Loading onditions appropri-
ate for a parti ular type of stru ture are expressed in terms of ground motion
in the frequen y and/or time domains. One method for estimating these load-
ing onditions are through equations based on strong ground motion re orded
during previous earthquakes. These equations have a handful of independent
parameters, su h as magnitude and sour e-to-site distan e, and a dependent
parameter, su h as peak ground a eleration or spe tral a eleration, and the
oeÆ ients in the equation are usually found by regression analysis. Although
the equations are often referred to as attenuation relationships, attenuation
relations or attenuation equations, they predi t more than how ground motion
�
Tel: +44 (0)20 7594 6060, Fax: +44 (0)20 7225 2716.
Email address: john.douglas�i .a .uk (J. Douglas).
2
varies with distan e. The equations are vital to probabilisti seismi hazard
analysis, as Cornell (1968) shows, and also to deterministi seismi hazard
analysis. Hen e over the past thirty years ground motion estimation equations
have been mu h studied and many versions published.
A number of reviews of ground motion estimation studies have been made
in the past whi h provide a good summary of the methods used, the results
obtained and the problems asso iated with su h relations. Trifuna and Brady
(1975, 1976) provide a brief summary and omparison of published relations.
Idriss (1978) presents a omprehensive review of published ground motion
estimation relations up until 1978, in luding a number whi h are not easily
available. Boore and Joyner (1982) provide a review of ground motion estima-
tion studies published in 1981 and omment on empiri al predi tion of strong
ground motion in general. Campbell (1985) ontains a full survey of ground
motion estimation equations up until 1985. Joyner and Boore (1988) give an
ex ellent analysis of ground motion predi tion methodology in general, and
ground motion estimation relations in parti ular; Joyner and Boore (1996)
update this by in luding more re ent studies. Ambraseys and Bommer (1995)
provide an overview of relations whi h are used for seismi design in Europe
although they do not provide details about methods used. After these studies
were ompleted many more equations were derived. Campbell (2002 ,a,b) are
three ex ellent re ent reviews of equations for the estimation of strong ground
motions and in lude the oeÆ ents of, and omparisons between, 14 well-used
equations.
Douglas (2001a, 2002a) summarises over 120 studies that derived equations
for the estimation of peak ground a eleration and over 80 studies that derived
equations for the estimation of response spe tral ordinates. This arti le is a
3
review of the pro edures adopted in the past thirty years to derive equations
for the estimation of ground motions using strong-motion re ords. It seeks to
ompliment the re ent reviews by Campbell by fo ussing on the methods used
to derive the equations. Appendix A summarises the available equations for
estimating peak ground a eleration.
The omplete pro edure that needs to be followed to derive ground motion
estimation equations using re orded strong-motion data is outlined below.
(1) Earthquakes are re orded using strong-motion instruments to get a set
of re ords for analysis.
(2) If the earthquakes were re orded on analogue a elerographs, whi h use
paper or �lm, then the a elerograms are digitised to get the data into a
form usable for numeri al analysis.
(3) The digitised strong-motion re ords are pro essed to remove short- and
long-period noise, whi h is introdu ed in the re ording and digitisation
stages. This pro essing usually onsists of �tting a zero baseline to the
re ord and then applying a bandpass �lter.
(4) A dependent variable is sele ted and al ulated from the strong-motion
re ords. This dependent variable, su h as peak ground a eleration or
spe tral a eleration, should be useful for seismi design and analysis.
(5) Independent variables, su h as magnitude and sour e-to-site distan e,
that hara terise the strong-motion re ords in the data set are then ol-
le ted for all the time-histories used.
(6) Regression analysis is performed to derive equations to estimate the de-
pendent variable (a strong-motion parameter) given the independent vari-
ables. At the same time the standard deviation of the equations are al-
ulated.
4
(7) The derived equations are used in seismi hazard analysis, either deter-
ministi or probabilisti , to give estimates of the strong ground motion
that ould be expe ted at a site during a future earthquake.
2 Strong ground motion parameters
Peak ground a eleration (PGA) is still often used as a parameter to des ribe
strong ground motion although it is only useful for analysis of short period
(T . 0:3 s) stru tures. PGA is simply the amplitude of the largest peak a el-
eration re orded on an a elerogram at a site during a parti ular earthquake.
PGA is the most simple strong-motion parameter and hen e more than 120
equations (Douglas, 2001a, 2002a) have been derived in the past to predi t it.
These equations are dis ussed in this arti le.
Consider the SDOF system illustrated in Figure 1. This system onsists of
a mass m, moving on a fri tionless surfa e, driven by a horizontal ground
motion with a eleration U
tt
, with a spring with sti�ness k and a dashpot
with a oeÆ ient of vis ous damping .
Let u(t) be the horizontal displa ement of the mass at time t. Then using
Newton's se ond law and resolving for es horizontally gives:
mu
tt
+ u
t
+ ku+mU
tt
= 0
Dividing by m and letting !
2
0
= k=m and �
0
= =2!
0
m yields the equation of
motion:
5
u
tt
+ 2�
0
!
0
u
t
+ !
2
0
u = �U
tt
: (1)
Equation 1 is usually used to model the elasti response of stru tures to earth-
quake ex itation, see for example Chopra (1995). Under intense ground motion
stru tures often deform beyond their linear elasti range and behave inelas-
ti ally. A more omplex model than that given in Equation 1 is required to
model su h inelasti behaviour, see for example Chopra (1995, hap. 7). These
models are not onsidered here.
During an earthquake although the response of a stru tural system hanges
with time, whi h may be important for some appli ations, often only the
maximum response whi h a system undergoes is required for design purposes.
Consider the stru tural model illustrated in Figure 1 and assume the ground
a eleration is U
tt
(t) and the mass, m, has displa ement u(t), velo ity u
t
(t)
and a eleration u
tt
(t) then the three values of maximum response of interest
are:
maximum absolute response a eleration S
a
= max
t
ju
tt
+ U
tt
j,
maximum relative response velo ity S
v
= max
t
ju
t
j,
maximum relative response displa ement S
d
= max
t
juj.
Two for es a t on the mass one is due to the spring and the other due to the
equivalent vis ous damping. These for es must resist the total inertial for es
of the system, mu
tt
and mU
tt
hen e, mS
a
gives the maximum for e a ting
whi h must be resisted by the entire system.
From these quantities two `pseudo' values an be al ulated:
maximum absolute pseudo-a eleration S
0
a
= (2�=T )
2
S
d
,
6
maximum relative pseudo-velo ity S
0
v
= (2�=T )S
d
,
where T is the natural period of the system.
mS
0
a
gives the for e whi h must be resisted by the spring (Chopra, 1995)
and not the omplete system. For small oeÆ ients of riti al damping and
relatively short periods S
a
and S
0
a
are almost identi al (Chopra, 1995).
Maximum relative pseudo-velo ity, S
0
v
, is related to the peak value of strain
energy, E
S
, stored in the system during the earthquake by the equation: E
S
=
mS
02
v
=2 (Chopra, 1995, p. 200).
A plot of the quantities de�ned above as a fun tion of the natural vibration
period, T , and damping, �, of the system is alled a response spe trum. It
provides a onvenient means of summarizing the peak response of all possible
linear single-degree-of-freedom (SDOF) systems to a parti ular omponent of
ground motion (Chopra, 1995).
Over 80 equations (Douglas, 2001a, 2002a) have been derived in the past to
predi t response spe tral ordinates be ause response spe tra have proved to
be useful for seismi analysis of stru tures. These equations are also dis ussed
in this arti le.
3 Types of ground motion estimation equations
Draper and Smith (1981) de�ne three main types of mathemati al models
used by s ientists:
Fun tional When the true fun tional relationship between response (the
7
value to be predi ted) and the predi tor variables is known and is used.
Control When the independent e�e ts of ea h of the ontrol variables (the
predi tor variables) an be estimated through designed experiments.
Predi tive When neither fun tional or ontrol models an be used and within
the data mu h inter- orrelation exists, so alled `problems with messy data'.
They do not need to be fun tional.
Most published ground motion estimation relations have some physi al basis,
hen e some aspe ts of fun tional models are present. Sin e all the physi al
aspe ts asso iated with seismi ground motion are not known in detail and
even if they were it would be impossible to express them in the form of one
simple equation, ground motion estimation relations are predi tive models.
Trifuna (1980) notes that ground motion estimation relations should be based
on a fun tional form from the physi al nature of phenomena but be ause of
la k of data this annot be a hieved; Caillot and Bard (1993) also state that the
form of the equation must have some physi al basis. Controlled experiments
annot obviously be performed with ground motion aused by earthquakes
be ause no two earthquakes are the same, nor are the travel paths to station
or the lo al site onditions and hen e there is no repeatability
1
. Therefore
ontrol models are not possible.
4 Data sele tion riteria
Early ground motion estimation studies (e.g. Milne and Davenport, 1969; Es-
teva, 1970; Ambraseys, 1975) give little or no information on the data sele tion
1
Explosions �red at test sites approximate to repeat runs for travel time studies.
8
riteria adopted, probably be ause at that time few strong-motion re ords were
available and to ensure that the number of re ords used was not too small no
sele tion was made. This se tion on erns what riteria have been applied
in the past for the sele tion of re ords; in Se tion 10 sele tion based on site
onditions is dis ussed.
A major hoi e made is: data from whi h ountry, region or seismote toni
regime will be used. Most often authors only use data from one ountry (or
part of the ountry), for example western North Ameri a (mainly Califor-
nia) (e.g. Milne and Davenport, 1969; Esteva, 1970; Joyner and Boore, 1981;
Crouse and M Guire, 1996; Chapman, 1999) or Japan (e.g. Iwasaki et al., 1980;
Kawashima et al., 1984; Kamiyama et al., 1992; Molas and Yamazaki, 1995;
Kobayashi et al., 2000). For these two regions there are many time-histories
from a wide distribution of magnitudes, distan es and other seismologi al pa-
rameters su h as sour e me hanism so the oeÆ ients derived through re-
gression are stable and not ontrolled by a few data points. Trifuna (1976)
does not use data from regions, other than western USA, be ause attenuation
varies with geologi al provin e and magnitude determination is di�erent in
other ountries. Even for those authors who use a riteria based on a par-
ti ular region, di�eren es an still o ur, for example Crouse and M Guire
(1996) and Sadigh et al. (1997) both develop equations for use in California
but Crouse and M Guire (1996) ex lude data from the Mammoth Lakes area
(whi h is an a tive vol ani region) be ause it is atypi al of the rest of Califor-
nia whereas Sadigh et al. (1997) in lude 65 re ords from the Mammoth Lakes
area.
Others have also limited their data to those re orded within one ountry,
for example Italy (Sabetta and Pugliese, 1987; Mohammadioun, 1991; Tento
9
et al., 1992; Caillot and Bard, 1993). Su h riteria though is arti� ial be ause
ea h ountry is not a single seismote toni regime and nor are earthquakes
from one ountry ompletely di�erent to those in another. To limit the data
by su h riteria an lead to a small suite of re ords with a limited spread
of independent parameters, for example Sabetta and Pugliese (1987) use 95
re ords from 17 earthquakes with magnitudes between 4:6 and 6:8. This means
the equation may be ontrolled by a few data points and for independent
variables outside this limited range predi tions ould be in orre t, a problem
whi h Sabetta and Pugliese (1987) themselves note. Some areas, for exam-
ple I eland (Sigbj�ornsson and Baldvinsson, 1992) and Hawaii (Munson and
Thurber, 1997), seem to have mu h di�erent attenuation properties than non-
vol ani regions whi h means developing equations based solely on data from
these small areas may be justi�ed although again there is a la k of data. Zhao
et al. (1997) ex lude some New Zealand re ords whi h may have been a�e ted
by di�erent attenuation properties in vol ani regions.
To over ome the la k of re ords some authors supplement their data with
a elerograms from other regions of the world whi h are felt to be te toni ally
similar. For example, Campbell (1981) uses eight re ords from outside western
USA (from shallow te toni plate boundaries) be ause they make an important
ontribution to understanding near-sour e ground motion and this outweighs
di�eren es whi h may exist due to te toni s and re ording pra ti e. Di�eren es
in anelasti attenuation between the di�erent areas are minimized by using
only near-sour e re ords and he uses only data from instruments with similar
dynami hara teristi s to avoid problems due to re ording pra ti e. This
in reases the distribution of the data spa e so that the derived equations have
a greater appli ability. M Cann Jr. and E hezwia (1984) also use data from
10
outside western N. Ameri a, even though te toni s and travel paths may be
di�erent, be ause additional information in the near �eld is onsidered more
important. Theodulidis and Papaza hos (1992) supplement their Greek data
with 16 re ords from other regions (Japan and Alaska) to in rease the number
of re ords from large (7:0 � M � 7:5) shallow earthquakes whi h an o ur
in Gree e but for whi h no Greek strong-motion re ords exist. Fukushima
et al. (1988) use 200 re ords, from distan es 0:1{48 km, from western USA to
onstrain the near-sour e behaviour of the ground motion estimation equation
be ause Japanese data from this distan e range are la king.
Ground motion estimation relations have been derived for parti ular te toni
regimes and not simply based on a ountry's borders. Dahle et al. (1990b)
present a study using re ords from worldwide intraplate areas, de�ned as te -
toni ally stable and geologi ally more uniform than plate boundaries, although
due to la k of data they hoose data from `reasonably' intraplate areas. Spu-
di h et al. (1996, 1999) �nd equations for extensional regimes (where litho-
sphere is expanding `areally') using worldwide data. Crouse (1991) in ludes
data from any zone with strong seismi oupling, su h as younger subdu tion
zones, unless there are ompelling reasons to ex lude data. This is done be-
ause there are not enough data available from Cas adia, whi h is his area of
interest. A number of workers (Abrahamson and Litehiser, 1989; Ambraseys
and Bommer, 1991; Ambraseys, 1995; Ambraseys et al., 1996; Sarma and Sr-
bulov, 1996; Campbell, 1997; Bozorgnia et al., 2000) derived equations for
shallow rustal earthquakes using data from wide regions, in luding the whole
Earth, be ause, it is felt, su h earthquakes and regions are similar world-
wide. Campbell (1997) in ludes shallow subdu tion interfa e earthquakes in
his mainly shallow rustal set of re ords, be ause previous studies have found
11
that their near-sour e ground motion is similar to that from shallow rustal
earthquakes. The distan e alibration fun tions of regional lo al magnitude
s ales for di�erent parts of the world are examined by Boore (1989) and it
is found that they are similar to distan es of about 100 km but di�er beyond
that. Boore (1989) thinks that this is be ause di�ering anelasti attenuation
and wave propagation e�e ts in di�erent rustal stru tures should not play a
large role at lose distan es. Therefore within the range where ground motions
have engineering signi� an e (about 100 km) data from di�erent parts of the
whole ould be ombined as far as distan e dependen e is on erned.
Criteria based on sour e depth have been used as an earthquake sele tion
riterion, see Table 2.
A minimum magnitude riterion is often applied, see Table 3. A natural on-
straint on the minimum magnitude whi h often o urs for spe tral ordinates
is that re ords from analogue instruments of small magnitude earthquakes are
not always digitised, be ause digitization is a time- onsuming and expensive
pro ess. Therefore the digital form of su h re ords, from whi h response spe -
tra are al ulated, are not available and so su h re ords annot be used for
deriving ground motion estimation equations. This onstraint does not o ur
for re ords from digital a elerographs, whi h are be oming more ommon, be-
ause they are re orded dire tly in digital form. Blume (1977) and Ambraseys
(1995) study the e�e t of di�erent minimum magnitude ut-o�s; Ambraseys
(1995) �nds that the ut-o� used has little e�e t on ground motion estimates.
Sele tion based on a ura y of the magnitudes is used by Campbell (1981)
and Sabetta and Pugliese (1987), who use only earthquakes with magnitudes
a urate to within 0:3 units, and Ambraseys and Bommer (1991), who require
the standard deviation of M
s
to be known.
12
Minimum and maximum distan e riteria are sometimes applied for a vari-
ety of reasons. Blume (1977) investigates the e�e t of using di�erent distan e
ut-o�s. M Guire (1977) ex ludes re ords with epi entral or rupture distan e
smaller than one-half the estimated length of rupture to ex lude those re ords
from the near-sour e region whi h are governed by di�erent physi al laws
than those far from the sour e. A minimum distan e riterion, of 2 km, was
applied by Wang et al. (1999) be ause 2 km is the minimum error in epi en-
tral lo ations and hen e in luding re ords from smaller distan es may give
errors in the results. La k of far-�eld data motivates Molas and Yamazaki
(1995) to ex lude re ords from greater than 200 km and Crouse et al. (1988)
to remove data with distan es or magnitudes well outside the range of most
sele ted re ords. Campbell (1981, 1997) uses only near-sour e re ords to avoid
omplex propagation e�e ts observed at longer distan es. Only re ords asso-
iated with reliable distan es are used by Campbell (1981) and Sabetta and
Pugliese (1987) by in luding only earthquakes with lo ations (epi entres or
rupture distan e) known to within 5 km or less. Other studies use previously
published ground motion estimation relations to impose magnitude dependent
distan e limits. Fukushima and Tanaka (1990) remove re ords with predi ted
PGA < 0:1ms
�2
(the assumed trigger level) to avoid biasing the attenuation
rate, Fukushima et al. (1995) ex lude re ords with predi ted PGV < 0:1 ms
�1
so pre ise attenuation is found and Kobayashi et al. (2000) ex lude data from
distan es with predi ted PGA < 0:02ms
�2
.
Previous studies have tried to redu e possible bias due to using re ords from
large distan es whi h may not be typi al of the attenuation rate, through
two alternative pro edures. Joyner and Boore (1981) ex lude re ords from
distan es greater than or equal to shortest distan e to an instrument whi h did
13
not trigger. This has been made more stri t by Boore et al. (1993) who ex lude
re ords from distan es greater than the distan e to the �rst re ord triggered
on the S wave and for spe tral ordinates ex lude re ords from distan es greater
than the distan e to the �rst non-digitised re ord (whi h is assumed to be of
smaller amplitude than the digitised re ords). Boore et al. (1994a) on lude
that this riterion may be over stri t be ause it is independent of geology and
azimuth. Ambraseys and Bommer (1991) and Spudi h et al. (1996, 1999) do
not use su h a riterion be ause their sets of re ords are non-homogeneous and
from irregularly spa ed networks with di�erent and unknown trigger levels,
thus making su h a riterion diÆ ult or impossible to apply. Crouse (1991) also
does not apply this riterion but onsiders his sample adequate for regression
and although it may overestimate smaller distant motion it would properly
estimate larger motions whi h are of greater on ern for design. Although this
is true the ground motion estimation equation obtained would not predi t the
median hazard at all distan es and therefore the use of it in seismi hazard
analysis, for example, whi h requires the 50% hazard urve would bias the
results. The other method for removing bias due to non-triggered instruments
is the regression based method of Campbell and Bozorgnia (1994), Campbell
(1997) and Chapman (1999) whi h uses all the available strong-motion data to
derive ground motion estimation relations to predi t the non-triggering ut-o�
distan e.
Ex lusion of re ords based on minimum PGA has been proposed as a sele tion
riteria, see Table 4. Blume (1977) studies e�e t of di�erent PGA ut-o�s but
Blume (1980) does not employ a PGA ut-o� be ause it is, by itself, a poor
index of damage in most ases.
Time-history quality is also a riterion used by some authors. Campbell (1981)
14
only in ludes re ords whi h triggered early enough to apture the strong phase
of shaking and hen e the ground motion is not underestimated. Dahle et al.
(1990b) ex lude re ords whi h are not available unpro essed and without suf-
� ient information on instrument natural frequen y and damping. Lee (1995)
only uses re ords with high signal-to-noise ratio. Youngs et al. (1997) remove
poor quality time-histories and those whi h do not ontain the main portion
of shaking from their set of data. Re ords of short duration terminating early
in the oda are not in luding in the analysis of Chapman (1999). Sabetta and
Pugliese (1987) use only the �rst sho k of a re ord if it is a well separated
multiple sho k re ord and magnitude and fo al parameters apply only to �rst
sho k. All these riteria are valid and would help to redu e some of the s atter
in the ground motion but less subje tive methods are required if re ords are
not simply reje ted be ause they do not seem to mat h the rest of the data.
Cousins et al. (1999) retains data from lipped seismograms.
It is ommon to use only those re ords whi h are not signi� antly a�e ted
by soil-stru ture intera tion although many alternative suggestions have been
made on how to sele t su h re ords, see Tables 5 and 6 whi h give the �rst
time that an author applies a parti ular riterion.
Ohsaki et al. (1980a), Campbell (1981) and Crouse and M Guire (1996) re-
move re ords thought to be a�e ted by high topographi al relief.
Criteria are sometimes used to a hieve a set of data whi h will not lead to
biased results simply be ause of its distribution. M Guire (1978) uses no more
that seven re ords from the same earthquake and no more than nine from a
single site to minimize underestimation of varian e and he retains re ords to
give a large distan e and magnitude range. Campbell (1981) and Devillers and
15
Mohammadioun (1981) do not use all data from San Fernando to minimize
bias due to the large number of re ords. This problem is also noted by Trifuna
(1976) who s reens the data to minimize possible bias due to uneven distri-
bution of data amongst di�erent magnitude ranges and soil onditions and
from ex essive ontribution to the database from several abundantly re orded
earthquakes. Boore et al. (1993) do not use data from more than one sta-
tion with the same site ondition within a ir le of radius 1 km so that the
underestimation of varian e is minimized. Niazi and Bozorgnia (1991) sele t
earthquakes to over broad range of magnitude, distan e and azimuth and
to ensure thorough overage of whole SMART-1 array (at least 25 stations
re orded ea h sho k). Other riteria for the minimum number of re ords per
earthquake used are 3 or more (Atkinson, 1997) and 2 or more (Abrahamson
and Litehiser, 1989), both to improve ability of regression to distinguish be-
tween magnitude and distan e dependen e. Caillot and Bard (1993) sele ts
re ords so mean and standard deviation of magnitude and hypo entral dis-
tan e in ea h site ategory are equal.
One other sele tion riterion is that based on the intensity measured at the
re ording site (Devillers and Mohammadioun, 1981; Mohammadioun, 1991,
1994b). They group their data by single intensities (from V to VIII and higher)
and by ranges of intensities and perform the analysis separately on ea h of
these subsets. Therefore even though they do not in lude site intensity as an
independent parameter expli itly, to use their equations still requires a pre-
di tion of the intensity whi h will o ur at the site, along with hoosing the
magnitude and distan e. Hen e they require the user to make a hoi e for a
parameter, site-intensity, whi h if known would mean there would be little
reason for using a ground motion estimation relation to predi t the response
16
spe trum at the site. Mohammadioun (1994b) highlights another problem with
the te hnique be ause the re ording site intensities may be average intensi-
ties within the area of the site and hen e would negle t possible mi rozoning
e�e ts. A more te hni al problem is mentioned by Mohammadioun (1991),
who does not use intensity-based sele tion for his derivation of spe tral equa-
tions for Italy be ause of the risk of reating a data population whi h is not
statisti ally signi� ant.
5 Corre tion te hniques
As with data sele tion pro edures, early ground motion estimation studies do
not state how their strong-motion re ords were orre ted (e.g. Milne and Dav-
enport, 1969; Esteva, 1970; Ambraseys, 1975), thus either un orre ted re ords
were used or standard orre tion pro edures were employed. Sin e the paper
of Trifuna (1976) who gives frequen ies between whi h the a elerations used
are thought to be a urate, details of orre tion te hniques used for deriving
ground motion estimation relations have often been reported, but again, like
data sele tion pro edures, there is little agreement about the best method
to use. However, be ause time-histories from di�erent types of a elerographs
have been used and be ause of the wide variety of levels of ground motion that
have been used in di�erent studies, there is no general best pro edure. Tento
et al. (1992) state that orre tion pro edure plays a relevant role in analysis
and that it introdu es inhomogeneities and errors due to the subje tive hoi e
of low frequen y �lter limits.
Almost all studies, where details are given, have �ltered their strong-motion
re ords using a variety of passbands and types of �lter. The ut-o� frequen ies
17
used either have been the same for all re ords or have been hosen for ea h
re ord individually using a number of di�erent te hniques. Table 7 summarises
the methods for individually sele ting low and high ut-o� frequen ies and the
frequen ies hosen.
Some authors have applied standard �lter ut-o�s to their re ords apparently
irrespe tive of the quality of time-histories. Gaull (1988) bandpass �lters his
re ords to get the PGA asso iated with periods between 2 and 10Hz, be ause
high frequen y PGA from un orre ted re ords is not of engineering signif-
i an e. Although this is true, be ause the PGA is often used to an hor a
response spe trum at zero period, using the PGA not asso iated with high
frequen ies to estimate the spe trum is in orre t. Dahle et al. (1990b) use an
ellipti al �lter with passband 0:25 to 25Hz. Niazi and Bozorgnia (1992) use a
trapezoidal �lter with orner frequen ies 0:07, 0:10, 25 and 30:6Hz. Kamiyama
et al. (1992) �lter with passband 0:24 and 11Hz. Molas and Yamazaki (1995)
use a low- ut �lter with osine shaped transition from 0:01 to 0:05Hz. For long
re ords (more than 10 s duration) and some shorter re ords (between 5 and
10 s duration) Ambraseys et al. (1996) use a passband 0:20 to 25Hz. Sarma
and Srbulov (1996) employ a low pass ellipti al �lter. Caillot and Bard (1993)
use ut-o�s 0:5 and 30Hz. The appli ation of the same ut-o� frequen ies for
all a elerograms used is justi�ed for those studies whi h use a homogeneous
set of re ords re orded on the same type of instrument and digitised in the
same way (e.g. Niazi and Bozorgnia, 1992; Molas and Yamazaki, 1995). For
those authors who use strong-motion re ords from a wide variety of sour es
whi h have been re orded on di�erent types of instrument and have di�er-
ent digitisation qualities (Dahle et al., 1990b; Ambraseys et al., 1996; Sarma
and Srbulov, 1996) using su h a general pro edure is probably not justi�ed.
18
Bommer et al. (1998) show, however, that the hoi e of the ut-o� frequen ies
does not signi� antly a�e t spe tral ordinates for periods within the range of
main engineering interest (about 0:1 to 2 s), therefore a ommon orre tion
may not a�e t the results. For spe ial stru tures, with periods longer than 2 s,
the ut-o� frequen y used ould be important.
Sin e the paper of Trifuna (1976), removal of the transdu er response (instru-
ment orre tion) from the time-history is often performed (e.g. Sabetta and
Pugliese, 1987; Spudi h et al., 1996; Cousins et al., 1999). The need to orre t
re ords from Japanese instruments to yield reliable PGAs, be ause they sub-
stantially suppress high frequen ies, is noted by Kawashima et al. (1986). Data
from seismographs also needs to be instrument orre ted be ause of their dif-
ferent frequen y response ompared with a elerographs (Cousins et al., 1999).
Instrument orre tion requires, at least, the natural frequen y and damping
of the a elerograph, information whi h is sometimes la king and hen e su h
orre tions annot be applied (Ambraseys et al., 1996). Chiaruttini and Siro
(1981) do not orre t their Friuli re ords for instrument response but �nd this
does not substantially alter PGA and Bommer et al. (1998) do not employ
instrument orre tion be ause it is not important for displa ement spe tra.
Whether the orre ted or un orre ted PGAs should be in luded is another
topi of debate. Campbell (1981) uses PGA from unpro essed a elerograms
be ause fully pro essed PGAs are generally smaller due to de imation and
�ltering of re ords. Un orre ted PGAs are also used by Munson and Thurber
(1997). Other studies, it is supposed, use orre ted PGAs. Ambraseys and
Bommer (1991) and Ambraseys (1995) use PGAs from a elerograms whi h
have undergone a wide variety of di�erent pro essing te hniques, in luding
no orre tion, for their studies. They �nd that most di�eren es (whi h they
19
an he k) are small (below 4 or 5%) but for some re ords the di�eren es
may be larger (up to 10%). Munson and Thurber (1997) also �nd small di�er-
en es between un orre ted and orre ted PGA. Sabetta and Pugliese (1987)
�nd their orre tion te hnique provides reliable estimates of PGA and hen e
un orre ted PGA values do not need to be used. A elerogram orre tion pro-
edures are used to �nd the a tual ground motion whi h o urred at the site
therefore un orre ted PGA values are not the real PGAs. There is an in onsis-
ten y between using un orre ted estimates of PGA but orre ting the re ords
to �nd spe tral ordinates whi h leads to the PGA ground motion estimation
equation not mat hing the spe tral ordinate equations at high frequen ies.
However, su h di�eren es are probably small enough to be negle ted when
ompared with other assumptions made.
A few studies have in luded other sour es of PGA values apart from those
given on a elerograms. Chiaruttini and Siro (1981) use some PGA estimates
from velo ity time-histories. Gar ia-Fernandez and Canas (1995) only use
PGA values derived from Fourier amplitude spe tra at 5Hz from short-period
analogue time-histories. Cousins et al. (1999) di�erentiate seismograms to
yield PGA estimates. Su h te hniques to supplement a limited set of re ords,
parti ularly in the far �eld where a elerographs may not be triggered, are
useful but estimates of PGA from the transformation of measurements from
instruments with mu h di�erent hara teristi s than a elerographs must be
veri�ed to be onsistent with those from a elerographs.
The hoi e of orre tion method strongly a�e ts the range of periods within
whi h the spe tral ordinates al ulated an be assumed to be orre t and not
signi� antly a�e ted by the orre tion pro edure. This question has started
to be dis ussed re ently be ause seismi design is be oming more interested
20
in long-period ground motion whi h is the range most a�e ted by noise and
hen e by the orre tion te hnique, whi h seeks to remove this noise but in
the pro ess also removes information on the a tual ground motion. Moham-
madioun (1991) provides no ground motion estimation equations for periods
greater than 2 s be ause he uses un orre ted time-histories whi h it is felt
ontain long-period noise. The 2 s limit on the a eptability of the derived
equations is also noted by Tento et al. (1992), who �nd that the re ord de-
pendent orre tion pro edure they adopt signi� antly a�e ts the results for
periods greater than 2 s. Boore et al. (1993) also only provide spe tral ordinate
equations for periods between 0:1 and 2 s be ause of the low sampling rate of
older time-histories, low signal-to-noise ratios and �lter ut-o�s a�e ting spe -
tral ordinates for periods outside this range. Lee (1995) believes his re ords
are not adequate for response spe trum al ulation outside the period range
0:04 to 2 s. An even shorter period range for a eptable spe tral ordinates is
stated by Theodulidis and Papaza hos (1994), who believe that for periods
greater than 0:5 s the di�erent digitisation (manual or automati ) and or-
re tion (baseline �tting or �ltering) te hniques they have used means longer
period values are signi� antly a�e ted. Niazi and Bozorgnia (1992) believe
their low frequen y ut-o� may be too low for re ords from small earthquakes
but hoosing a higher frequen y for this ut-o� would remove information
on long-period ground motion. If they adopted a re ord dependent orre -
tion pro edure and then in deriving long-periods equations use only those
re ords whi h did not require a higher frequen y ut-o�, this problem would
be over ome. Su h a method has been adopted by a number of re ent work-
ers (Spudi h et al., 1996, 1999; Abrahamson and Silva, 1997; Bommer et al.,
1998). Spudi h et al. (1996) use spe tral values only from the passband of the
�lter. Abrahamson and Silva (1997) use spe tral values only within frequen y
21
band 1:25f
h
to 0:8f
l
(where f
h
is the high-pass orner frequen y and f
l
is
the low-pass orner frequen y). Spudi h et al. (1999) uses a similar riteria of
only using spe tral ordinates within 1:25f
h
and 0:75f
l
and for eight re ords
whi h were pro essed in a di�erent way the a eptable range was 0:1 to 1 s.
Bommer et al. (1998) use ea h re ord's spe tral ordinates for regression up
to 0:1 s less than the period of the �lter ut-o� used for that re ord. These
te hniques mean that the number of re ords and distribution of re ords used
for the regression analysis hanges with period and hen e it must be he ked
that for ea h period the number and distribution of data points is adequate
to derive reliable oeÆ ients. There may be a problem of onsisten y between
spe tral estimates, derived from the ground motion estimation relations, for
short periods, for whi h probably most of the re ords were used, ompared
with long periods, for whi h the stronger ground motions are probably more
represented.
6 Combination of horizontal measurements
Most a elerograms onsist of three mutually orthogonal omponents: two
horizontal and one verti al. Seven di�erent ways of ombining the horizontal
omponents have been investigated, these are given below.
(1) Arithmeti mean: a
M
= [max ja
1
(t)j
for t
+max ja
2
(t)j
for t
℄=2.
(2) Both: a
B;1
= max ja
1
(t)j
for t
and a
B;2
= max ja
2
(t)j
for t
.
(3) Geometri mean: a
G
=
q
max ja
1
(t)j
for t
max ja
2
(t)j
for t
.
Note that: log a
G
= flog[max ja
1
(t)j
for t
℄ + log[max ja
2
(t)j
for t
℄g=2.
(4) Largest omponent: a
L
= max[max ja
1
(t)j
for t
;max ja
2
(t)j
for t
℄.
(5) Random: a
r
= max ja
1
(t)j
for t
or a
r
= max ja
2
(t)j
for t
, hosen randomly.
22
(6) Resultant: a
R
= max[max ja
1
(t) os � + a
2
(t) sin �j
for t
℄
for �
. Corre t al u-
lation of this ombination requires that the two horizontal omponents
re ords are perfe tly aligned with respe t to time and that they are ex-
a tly mutually perpendi ular. This may not always be true, espe ially for
digitised a elerograms from me hni ally triggered analogue instruments.
(7) Ve torial addition: a
V
=
q
max ja
1
(t)j
2
for t
+max ja
2
(t)j
2
for t
. This assumes
that the maximum ground amplitudes o ur simultaneously on the two
horizontal omponents; this is a onservative assumption.
Using both horizontal omponents or the geometri mean of the two ompo-
nents leads to exa tly the same regression oeÆ ients when logarithms of the
ground motion measurements are used. This an be demonstrated by onsid-
ering the normal equations whi h are solved to give the least squares estimate
of the oeÆ ients (Douglas, 2001b). The standard deviation of the equation
derived using both horizontal omponents will, however, usually be di�erent
to the standard deviation of the equation derived using the geometri mean
of the two horizontal omponents.
7 Separation of ground motion estimation relations into sour e,
path and site dependen e
Traditionally dis ussion of ground motion from earthquakes has been split into
three se tions: sour e, travel path and site, upon whi h the ground motion at
the site depends. This separation is somewhat simplisti , be ause the bound-
aries between ea h part are not learly de�ned and be ause the sour e a�e ts
the path's properties and path properties a�e t site onditions. This separa-
tion though will be followed here be ause it makes reviewing previous ground
23
motion estimation relationships easier but it is ompli ated by the previously
des ribed problems and by the use of non-linear equations in whi h sour e,
path and site parameters are not separated.
The following dis ussion is in terms of the untransformed ground motion, y,
as opposed to log y on whi h the regression is almost always performed.
8 Chara terisation of sour e
Earthquake magnitude, M , has been almost the only parameter used to har-
a terise the earthquake sour e in ground motion estimation relations, although
many di�erent magnitude s ales and ombinations of s ales have been used.
Re ently parameters asso iated with the sour e me hanism have also been in-
luded although again there are a number of alternative methods for in luding
this information in the equation.
Early studies (e.g. Esteva, 1970; Donovan, 1973), did not state whi h magni-
tude s ale they use. Many authors use lo al magnitude (also alled Ri hter
magnitude), M
L
, to derive their ground motion estimation relations (e.g.
M Guire, 1977; Campbell, 1989; Tento et al., 1992; Mohammadioun, 1994b).
This may be be ause these are the only magnitude estimates available for
the hosen earthquakes. Chiaruttini and Siro (1981) use M
L
be ause it is de-
termined at short distan es, it is homogeneously determined for small earth-
quakes up to saturation at about M
L
= 7:0 and be ause it is determined at
about 1Hz whi h is lose to the a elerometer band. Mohammadioun (1994b)
uses M
L
be ause it is generally available and is uniformly determined but
states that it may not be the best hoi e. Ambraseys (1995) does not use M
L
24
be ause there are no M
L
estimates for many of the earthquakes in his set and
many estimates of M
L
are unreliable. Boore (1989) states that M
L
is diÆ ult
to predi t for design earthquakes be ause atalogues of histori al earthquakes
often ontain unreliable M
L
estimates.
Another magnitude s ale whi h is ommonly used is surfa e-wave magnitude,
M
s
(Dahle et al., 1990b; Ambraseys and Bommer, 1991; Ambraseys, 1995;
Ambraseys et al., 1996; Crouse and M Guire, 1996; Bommer et al., 1998).
Dahle et al. (1990b) use M
s
be ause it is reasonably unbiased with respe t
to sour e dimensions and there is a globally onsistent al ulation method.
Theodulidis and Papaza hos (1992) mainly use M
s
but for the foreign earth-
quakes in their set they use M
w
or M
JMA
whi h they state to be equivalent
between 6:0 and 8:0. Ambraseys (1995) states that the onversion of M
L
to
M
s
should not be done be ause of un ertainty in onversion whi h should be
retained. This holds for all onversions between magnitude s ales but be ause
only M
w
an be found for all size earthquakes onversion from one s ale to
another is often ne essary at small and large magnitudes, for example Dahle
et al. (1990b) and Ambraseys et al. (1996) use some M
s
onverted from other
magnitude s ales (M
L
, m
b
, oda length magnitude). Japanese Meteorologi al
Agen y magnitude, M
JMA
, has been employed in many Japanese ground mo-
tion estimation relations (e.g. Kawashima et al., 1984; Kamiyama et al., 1992;
Fukushima et al., 1995) although Kawashima et al. (1984) notes that it may
not ne essarily be the most suitable parameter to represent magnitude but it
is the only one whi h exists for all earthquakes in their set of re ords. Peng
et al. (1985) use Chinese surfa e-wave magnitude but also use m
b
and M
s
and
�nd larger residuals. When using M
s
it is important that the measurements
are orre ted for fo al depth, whi h signi� antly a�e ts the estimates of M
s
25
for earthquakes with fo al depths greater than 20 km (e.g. Herak et al., 2001).
Re ently most equations have been derived using moment magnitude, M
w
,
(e.g. Boore et al., 1993; Lawson and Krawinkler, 1994; Sadigh et al., 1997;
Kobayashi et al., 2000) whi h is dire tly related to the size of the sour e and
the slip along the fault, unlike other magnitude s ales whi h are empiri ally
derived and have no physi al meaning. The other major advantage of M
w
is
that it does not saturate for large magnitudes, and an be al ulated for small
magnitudes, and hen e provides a good measure of the energy released over
the entire magnitude range. The size and slip of histori al earthquakes an
be found using geologi al data whi h an then be dire tly related to M
w
for
use in assessing the design earthquake; this is more diÆ ult to do for other
magnitude s ales (Boore, 1989). However, M
w
is not usually al ulated for
earthquakes with magnitudes less than about 5 and also it has only been
uniformly al ulated sin e 1977 and hen e for earlier earthquakes estimates of
M
w
are more diÆ ult, if not impossible, to �nd. To over ome these diÆ ulties
some authors (e.g. Joyner and Boore, 1981; Xu et al., 1984; Crouse, 1991;
Dahle et al., 1995) have used magnitudes from other s ales (e.g. M
L
, M
s
) as
estimates of M
w
for those earthquakes whi h do not have a published M
w
value. If only a few earthquakes in the set of data do not have a M
w
value,
if the magnitude s ale hosen to supplement M
w
is equivalent to moment
magnitude for that size of earthquake and if the number of re ords asso iated
with these earthquakes is small then this method is satisfa tory.
The other main te hnique for providing a homogeneous magnitude s ale for
all sizes of earthquakes is to use one magnitude s ale for small earthquakes,
usuallyM
L
and one s ale for larger earthquakes, usuallyM
s
. Campbell (1981)
introdu ed this idea to develop magnitude estimates that are generally on-
26
sistent with M
w
. He tried di�erent division points, for the hange from M
L
to M
s
, between 5:5 and 6:5 and found that the magnitude is quite insensitive
to hoi e, but he uses 6:0 as do Abrahamson and Litehiser (1989). Sabetta
and Pugliese (1987) use 5:5 as the hange-over point from M
L
to M
s
and �nd
that this ombined magnitude s ale assures a linear relationship between log-
arithm of PGA and magnitude and avoids saturation e�e ts of M
L
. Niazi and
Bozorgnia (1991) use 6:6 as the division point. Lee (1993) usesM
L
forM . 6:5
and other di�erent (unspe i�ed) magnitude s ales for M > 6:5. He does this
be ause seismi hazard analysis often uses atalogues whi h do not spe ify
magnitude s ale and often the estimates are nonhomogeneous. Even though
this may be so, in reasing the un ertainty, asso iated with the ground motion
estimation relation, by using a mixture of magnitude s ales means that it an
never be orre tly used for seismi hazard analysis be ause there is no orre t
magnitude s ale and the un ertainties are then in reased unne essarily.
Almost all studies in lude a fa tor whi h has an exponential dependen e on
magnitude, exp aM , this is be ause the energy released by an earthquake is
exponentially dependent on magnitude (Ri hter, 1958).
It has been proposed that strong ground motion does not in rease without
bound for in reasing magnitudes and that as magnitude in reases ground
motion does not in rease at a onstant rate. This is known as magnitude
saturation. Bolt and Abrahamson (1982) split their data into four broad mag-
nitude groups and �t an equation whi h has no magnitude-dependent fa tors
to the ground motion within ea h group. They �nd no systemati in rease
in near-sour e PGA as a fun tion of magnitude although the derived equa-
tions predi t lower PGA for larger magnitudes whi h, as Joyner and Boore
(1983) point out, is not realisti . Hen e this study may be biased by a la k
27
of data for large magnitudes. Trifuna (1976) was the �rst to in lude a fa tor
to model magnitude saturation, by using a fa tor that is exponentially depen-
dent on the magnitude squared, i.e. exp bM
2
, in addition to the normal fa tor
exp aM . For a positive oeÆ ient, a and a negative oeÆ ient b it predi ts
a maximum ground motion whi h ould o ur however great the magnitude.
Su h fa tors have been in luded by, for example Trifuna (1980), Joyner and
Fumal (1984), Huo and Hu (1991), Boore et al. (1993), Lee (1995), Lawson and
Krawinkler (1994), Chapman (1999) and Abrahamson and Silva (1997). Other
authors (Joyner and Boore, 1981; Kawashima et al., 1984; Crouse et al., 1988;
Crouse, 1991) in orporate fa tors like exp bM
2
into their equations but �nd
that the oeÆ ient b is not statisti ally signi� ant or that it does not improve
the adjusted multiple orrelation oeÆ ient so remove the fa tor. Modelling
quadrati dependen e on magnitude requires re ords from large magnitude
earthquakes that are often la king (Trifuna , 1976). To over ome this la k of
data Spudi h et al. (1996, 1999) adopt oeÆ ients, a and b, from Boore et al.
(1993). Lee (1995) uses only re ords with M � 4:25 so that a and b have
the orre t sign to give magnitude saturation for large magnitudes. Needing
to apply su h methods to for e physi ally realisti oeÆ ients suggests that
magnitude saturation is not supported by the data used and that ex luding
the fa tor, exp bM
2
, would be preferable. However, magnitude saturation is
supported theoreti ally, see for example Douglas (2002b).
Fa tors whi h are exponentially proportional to higher powers of magnitude
have been in orporated into equations by Sadigh et al. (1997), who in lude a
fa tor exp k
1
M
2:5
, Abrahamson and Silva (1997) who in lude a fa tor exp k
2
(8:5�
M)
3
, and Youngs et al. (1997), who in lude a fa tor exp k
3
M
3
, for the pre-
di tion of spe tral a eleration. Campbell (1997) uses a non-linear magnitude
28
dependent term, exp k
4
tanhM .
Kamiyama et al. (1992) take the idea of magnitude saturation to its extreme
by modelling PGA as ompletely independent of magnitude up to a distan e
whi h is exponentially dependent on magnitude. For distan es greater than
this near-sour e zone the predi ted ground motion is exponentially dependent
on magnitude.
An alternative method for modelling di�erent magnitude dependen e for small
and large earthquakes is to derive separate equations for M
w
< 6:5 and for
M
w
� 6:5 (e.g. Sadigh et al., 1997; Sadigh and Egan, 1998). This te hnique
relies on a large set of data that is well distributed in terms of magnitude so
that there is enough data to derive reliable equations for the separate subsets,
although Sadigh et al. (1997) onstrain the predi tions to be the same at
M
w
= 6:5.
Ambraseys (1995) notes that be ause the onversion ofM
s
toM
w
is non-linear
there is a non-linear relationship between M
w
and ground motion predi tion
using an equation derived using M
s
. Hen e some degree of magnitude satu-
ration is impli it in ground motion estimation relations based on M
s
, even if
only a fa tor exp aM
s
is in luded, be ause M
s
saturates at large magnitudes
and so the equation does not predi t onstantly in reasing ground motion for
in reasing earthquake size (as measured by M
w
). This form of magnitude sat-
uration, however, is not onstrained by the strong-motion data used to derive
the equation.
Figure 2 ompares the s aling of horizontal peak ground a eleration withM
w
for some re ent equations derived using data from shallow rustal earthquakes.
This �gure shows the magnitude saturation of near-�eld PGA modelled in
29
some re ent studies (e.g. Sadigh et al., 1997; Campbell and Bozorgnia, 1994)
and the impli it magnitude saturation of the equation by Ambraseys et al.
(1996).
Some studies may impli itly a ount for sour e me hanism by in luding many
sho ks from the same area whi h have a similar me hanism, for example Tri-
funa (1976) notes that the large proportion of data from the San Fernando
earthquake he uses may bias the results.
Campbell (1981) examines residuals from regression and �nds reverse fault-
ing PGA values are systemati ally higher (signi� ant at the 10% level) than
other motions but on ludes this may be due to data from outside western
N. Ameri a and so does not model the e�e t. Niazi and Bozorgnia (1991)
also �nd eviden e, by examining residuals, of higher ground motion from re-
verse faulting and lower motion from normal faulting as ompared with the
mean, but it is not modelled be ause the me hanisms of four earthquakes
are unknown. Crouse et al. (1988) split data by fault me hanism and �nd no
signi� ant di�eren es between thrust, normal and strike-slip. Spudi h et al.
(1999) �nd no signi� ant di�eren e between strike-slip and normal ground
motions in extensional regimes.
Abrahamson and Litehiser (1989) in lude a simple multipli ative fa tor to
model di�eren e in ground motion between reverse (and reverse-oblique) and
other sour e me hanisms. Boore et al. (1994a) �nd marginal statisti al signif-
i an e for the di�eren e between strike-slip and reverse-slip ground motion,
whi h they later model as a multipli ative fa tor (Boore et al., 1994b). Sadigh
et al. (1997) also model this di�eren e using a multipli ative fa tor (they in-
lude normal faulting ground motion in the strike-slip group be ause it was
30
not found to be signi� antly di�erent than strike-slip motion). Zhao et al.
(1997) and Cousins et al. (1999) in lude a multipli ative fa tor to a ount for
the di�eren e between rustal reverse motion and other motions. Campbell
and Bozorgnia (2002) in orporate fa tors to model di�eren e between strike-
slip (in luding normal), reverse and thrust ground motions. M Verry et al.
(2000) in lude fa tors, in their rustal earthquake equation, to model di�er-
en es between normal, reverse-oblique and reverse ground motions. Crouse
and M Guire (1996) try a multipli ative fa tor, to predi t the di�eren e be-
tween reverse and strike-slip motion, in their equation but they �nd it is not
signi� ant and the in onsisten y of the result between soil lasses means it is
diÆ ult to atta h signi� an e to fault type.
More omplex fa tors to model the di�eren es in ground motion aused by
di�erent fault me hanisms have re ently been in luded in ground motion esti-
mation relations. Abrahamson and Silva (1997) in lude magnitude dependent
fault me hanism fa tors and Campbell and Bozorgnia (1994) and Campbell
(1997) in lude distan e and magnitude dependent fa tors.
Sadigh and Egan (1998) provides di�erent equations for reverse and strike-
slip (in luding normal faulting) ground motion. This an in orporate omplex
multipli ative fa tors (dependent on magnitude, distan e and soil ategory)
relating ground motion asso iated with reverse faulting to that from strike-slip
faulting but it requires mu h data to ensure that the predi tions are realisti
for all ombinations of magnitude and distan e.
Sharma (1998) does not attempt to in lude sour e me hanism fa tors be ause
sour e me hanisms are not well de�ned for all earthquakes in his set of re ords ,
whi h ome from the southern Himalayas, and in luding too many oeÆ ients
31
and a small amount of data may lead to errors.
Figure 3 ompares the estimated ratio of horizontal peak ground a elera-
tion and response spe tral amplitudes between reverse and strike-slip fault-
ing earthquakes using some re ent equations derived using data from shallow
rustal earthquakes. This �gure shows that reverse faulting earthquakes are
expe ted to show signi� antly larger response spe tral amplitudes (up to a
fa tor of 1:5) than strike-slip faulting earthquakes at short to intermediate
periods (T � 1 s) and lower spe tral amplitudes for longer periods. However
there are onsiderable di�eren es in the estimated ratios of reverse to strike-
slip faulting ground motions between the di�erent sets of equations. These
di�eren es are due to di�erent de�nitions of reverse and strike-slip faulting,
di�erent sets of earthquakes and re ords used and di�erent fun tional forms
employed.
Re ent attempts have been made to model di�eren es in ground motion due
to the general te toni setting of the earthquake. Chiaruttini and Siro (1981)
were the �rst to expli itly onsider the te toni setting ( hara terised by the
earthquakes' geographi al lo ation) by developing separate equations for three
di�erent areas (Friuli, Italy; An ona, Italy; and the rest of the Alpide belt)
and also one equation whi h models the di�eren es by a multipli ative fa tor.
Fukushima and Tanaka (1990) allow di�erent magnitude s aling for western N.
Ameri an earthquakes than for Japanese sho ks. Youngs et al. (1997) in lude
a multipli ative fa tor to predi t the signi� ant di�eren e between ground
motion from interfa e and intraslab subdu tion zone earthquakes. Zhao et al.
(1997) also in lude a fa tor to a ount for the di�eren e between ground mo-
tion from interfa e subdu tion zone sho ks and other types of earthquake.
M Verry et al. (2000) in lude fa tors, in their subdu tion zone equation, to
32
predi t the di�eren e between ground shaking from interfa e and deep slab
sho ks. Si and Midorikawa (2000) in lude two fa tors to model the di�er-
en e between rustal, interplate and intraplate Japanese earthquakes. A re-
ent study on modelling di�eren es between ground motion due to the general
te toni setting is that by Parvez et al. (2001) who �nd large di�eren es in
ground motions between the eastern and western Himalayas.
Kobayashi et al. (2000) �nd their equation over predi ts ground motion from
interfa e earthquakes ompared with intraslab motions. Crouse et al. (1988)
�nd some di�eren es between ground motion in di�erent subdu tion zones but
do not model them, partly be ause some di�eren es may be be ause of site
e�e ts. Crouse et al. (1988) also try to �nd orrelations between seismote -
toni information (age, onvergen e, dip, onta t width, maximum subdu tion
depth, maximum histori al earthquake, maximum rupture length, stress drop
and seismi slip) and ground motion in ea h zone. They �nd weak orrelations
for stress drop and the maximum histori al earthquake but la k on�den e in
the results be ause of un ertainty in stress drop estimates.
Other studies have found that the di�eren e between strong ground motion in
di�erent seismote toni regions is not signi� ant. Sabetta and Pugliese (1987)
ex lude re ords from di�erent seismote toni and geologi al regions and repeat
their analysis and �nd predi ted PGA is similar. No signi� ant di�eren e is
found between Guerrero (Mexi o) ground motion and other Central Ameri an
motion nor between subdu tion and shallow rustal strong ground motion by
Dahle et al. (1995). Sharma (1998) negle ts te toni type be ause of a small
set of re ords and be ause only small di�eren es are expe ted. Atkinson (1997)
he ks for di�eren es in ground motion between rustal, interfa e and intraslab
sho ks and �nds no dependen e on te toni type.
33
Azimuthal dependen e of ground motion has been investigated in three stud-
ies. Sabetta and Pugliese (1987) �nd that some of their PGA values show
azimuthal dependen e although this is not modelled be ause it would require
more oeÆ ients and the dire tion of the azimuthal e�e t is di�erent from
region to region. Lungu et al. (1994, 1995b) split data into separate quad-
rants and �nd ground motion estimation equations for ea h subset; they �nd
azimuthal dependen e. The on lusions of this study are based on limited
strong-motion data in ea h quadrant oming from only four earthquakes and
hen e spe ial hara teristi s of these four earthquakes may explain the az-
imuthal dependen e. This azimuthal dependen e may also be partly due to
di�eren es in travel-paths.
8.1 Chara terisation of depth
In orporation of depth through sele tion riteria has been dis ussed in Se -
tion 4, this se tion des ribes how depth is in luded in the ground motion
estimation equation.
The use of distan e measures whi h ontain information on the depth of the
sour e, i.e. hypo entral distan e, rupture distan e, seismogeni distan e, en-
troid distan e, energy entre distan e, equivalent hypo entral distan e or sur-
fa e proje tion distan e with fo al depth [as used by Ambraseys and Bommer
(1991), Sigbj�ornsson and Baldvinsson (1992) and Ambraseys (1995)℄ for es
deeper earthquakes to predi t smaller ground motions than shallower sho ks.
This is a tually a path e�e t.
For sets of earthquakes with depths up to about 250 km (for example those
34
from subdu tion zones) a fa tor whi h is exponentially dependent on depth
is often in luded as well as using a distan e measure whi h in ludes depth
(hypo entral, entroid, energy entre or rupture distan e) (Crouse, 1991; Lungu
et al., 1994, 1995b; Molas and Yamazaki, 1995; Atkinson, 1997; Youngs et al.,
1997; Zhao et al., 1997; Shabestari and Yamazaki, 1998; Cousins et al., 1999;
Shabestari and Yamazaki, 2000; Si and Midorikawa, 2000). Annaka and Nozawa
(1988), Molas and Yamazaki (1995) and Youngs et al. (1997) �nd it signif-
i antly in reases oeÆ ients of determination, R
2
, or alternatively de reases
the standard deviation. Kamiyama and Yanagisawa (1986) use su h a fa -
tor but employ epi entral distan e. De�nitions of depth used to hara terise
the sour e have been fo al depth (e.g. Atkinson, 1997), depth to top of fault
(e.g. Molas and Yamazaki, 1995), entroid depth (e.g. Zhao et al., 1997) and
average depth of fault plane (e.g. Si and Midorikawa, 2000).
Figure 4 ompares the predi ted e�e t of depth on horizontal peak ground
a eleration for four equations derived for subdu tion zone earthquakes in
di�erent regions of the world. This �gure shows that the e�e t of depth an be
signi� ant (for example the equation of Cousins et al. (1999) predi ts about
a fa tor of about four in rease in PGA as the depth in reases from 20 to
100 km) and that the rate of in rease in PGA with depth is similar in the
di�erent equations. There is a large di�eren e, however, in the absolute size
of the predi ted PGAs between the di�erent equations of over a fa tor of
ten di�eren e [ ompare, for example, the estimate PGA using the equation of
Cousins et al. (1999) and that using the equation of Crouse (1991)℄.
Some studies (Kawashima et al., 1986; Crouse et al., 1988) have in luded su h
fa tors but have found that they do not signi� antly redu e errors asso iated
with the equation. Campbell (1989) in ludes a fa tor exponentially dependent
35
on depth and alternatively one linearly dependent on depth but although
predi tion is improved, and the residual plots no longer show a dependen e
on fo al depth, he does not re ommend the use of the equations be ause fo al
depths are asso iated with (possibly large) errors and hen e the dependen e
may be false. Campbell (1989) uses a set of earthquakes with a limited range
of fo al depths (1:8 to 24:3 km) over whi h fo al depth dependen e may not
exist. Ambraseys (1995) also notes that fo al depths are poorly determined
and revises many fo al depths using time between P and S-wave arrivals. This
un ertainty in fo al depths means that fo al depth dependen e is diÆ ult to
test unless the range of depths is mu h greater than the errors asso iated with
ea h depth estimate. Si and Midorikawa (2000) �nd that magnitude and depth
are positively orrelated so their asso iated oeÆ ients may be in orre tly
determined, espe ially when using rupture distan e.
More omplex depth dependent terms are tried by Kawashima et al. (1986),
in luding fa tors whi h are dependent on depth and magnitude and depth
and distan e, but �nd there is no signi� ant in rease in the adjusted multi-
ple orrelation oeÆ ient. A depth dependent anelasti attenuation fa tor is
in luded and retained by Atkinson (1997).
Lungu et al. (1994, 1995b) �nd faster attenuation for deeper earthquakes om-
pared with shallower sho ks (this is based on attenuation rates for a few indi-
vidual earthquakes) whereas Molas and Yamazaki (1995) group earthquakes
by depth and �nd similar predi tions for ea h group and for all the data to-
gether.
36
9 Chara terisation of path
The distan e travelled from the sour e to the site, d, is the parameter used
in all ground motion estimation relations to hara terise the path, although
many di�erent de�nitions of this distan e are used (see Se tion 9.1).
9.1 De�nitions of sour e-to-site distan e
Joyner and Boore (1981) state that the orre t distan e to use in ground
motion estimation relations is the distan e from the origin of the a tual wave,
whi h produ ed the measurement of ground motion (for example PGA or
SA), to the station but this is diÆ ult to determine for past earthquakes
and impossible to predi t for future earthquakes. To over ome this diÆ ulty
ten di�erent measures have been proposed to hara terise the distan e to the
earthquake sour e:
Epi entral distan e d
e
: Distan e to the epi entre of the earthquake, i.e. the
distan e to the horizontal proje tion of the rupture's starting point.
This is the easiest distan e measure to use be ause the epi entre is the
lo ation information given for all earthquakes.
The use of epi entral distan e in hazard analysis is for small earthquakes
reasonably straightforward be ause easily available atalogues of previous
epi entres an be used as the future sour es or if line or surfa e sour e zones
are used then epi entres an be distributed on these sour e zones.
Hypo entral distan e d
h
: Distan e to the hypo entre of the earthquake,
i.e. the distan e to the rupture's starting point.
Like epi entres, hypo entres are reported for most earthquakes but a -
37
urate measures of fo al depth are often diÆ ult to obtain unless there
is a good distribution of stations with distan e from the sour e (Gubbins,
1990). Most damaging earthquakes o ur within a shallow region of the rust
(about the top 30 km) and hen e d
e
and d
h
be ome equal at intermediate
and large distan es.
Sin e fo al depth be omes less important as the size of the earthquake
in reases (be ause the earthquake ruptures the entire seismogeni layer) and
be ause fo al depths of small earthquakes, for whi h depth is important,
are likely to be asso iated with large errors, the use of hypo entral distan e
in ground motion estimation relations is unlikely to de rease the standard
deviation of the �nal equation. This on lusion is only valid for shallow
rustal earthquakes.
The use of hypo entral distan e in ground motion estimation relations
also means that further information needs to be gathered, ompared with
distan e measures that do not in lude depth, during hazard assessment.
However, available atalogues of previous earthquakes usually ontain depth
information.
Rupture entroid distan e d
: Distan e to the entroid of the rupture.
This distan e measure requires an estimate of the dimensions of the rup-
ture plane so that the entroid an be de�ned; it an be diÆ ult to de�ne
this plane. However, be ause it is measured to a point sour e un ertainties
in de�ning the exa t lo ation of the rupture plane will have less of an e�e t
on rupture entroid distan es than for line or surfa e measures.
Centre-of-energy-release distan e d
E
: Distan e to a point on the fault
rupture where energy onsidered to be on entrated (Crouse et al., 1988;
Crouse, 1991).
This distan e is similar to rupture entroid distan e.
38
Surfa e proje tion distan e (also alled Joyner-Boore or fault distan e) d
f
:
Distan e to the surfa e proje tion of the rupture plane of the fault (Joyner
and Boore, 1981); for a point within the proje tion d
f
= 0.
For line or surfa e distan es (EHD, D, d
f
, d
f;h
, d
r
and d
s
) and also the
point distan es d
and d
E
the lo ation of the rupture plane must be known.
The un ertainties and problems involved in �nding rupture planes are dis-
ussed by workers developing relationships between magnitude and gross
hara teristi s of faulting su h as rupture length (e.g. Bonilla et al., 1984;
Wells and Coppersmith, 1994). Te hniques for de�ning the lo ation of the
probable rupture plane are dis ussed in Douglas (2001b).
Surfa e proje tion distan es an have large un ertainties (up to 20 km for
ertain earthquakes and stations) be ause there are no published studies
on the rupture plane or be ause there are several and no obvious way of
de iding whi h is best. The errors in surfa e proje tion distan es ould be
larger for earthquakes o urring during a sequen e of similar sized sho ks
when aftersho ks and geodeti data are likely to be diÆ ult to use. Su h
earthquakes will probably have M < 6 and hen e rupture lengths of around
10 km, so epi entral distan e will be more reliable than surfa e proje tion
distan e. The urrent pra ti e of quoting surfa e proje tion distan es to
one de imal pla e should not be taken as meaning that the distan es are
a urately known to 0:1 km.
Surfa e proje tion distan e with fo al depth d
f;h
: Distan e to the pro-
je tion of the rupture on a plane at the fo al depth.
The horizontal distan e part of surfa e proje tion distan e with fo al
depth are obviously asso iated with the same un ertainty as surfa e proje -
tion distan e and errors in fo al depths have already been dis ussed.
Rupture distan e (also alled sour e or fault distan e) d
r
: Distan e to
39
rupture surfa e.
Estimates of this distan e requires the same information as for d
f
together
with the depth of rupture whi h like fo al depth is diÆ ult to obtain for
many earthquakes. The verti al resolution of aftersho k lo ations an be
poor and so it is diÆ ult to de�ne the dip of the fault.
For future earthquakes, rupture distan e an be estimated using mapped
faults although it requires that the dip and depth of the faults are known.
Seismogeni distan e d
s
: Distan e to seismogeni rupture surfa e, assumes
that the near-surfa e rupture in sediments is non-seismogeni (Campbell,
1997).
Marone and S holz (1998) �nd that well-developed faults, i.e. faults that
have undergone signi� ant net displa ement and as a result ontain thi k
zones of wear material (gouge), display an absen e of seismi ity in about
the top 3 km. Therefore su h faults may exhibit stable slip within this zone
and unstable slip below this depth where the gouge be omes onsolidated.
On the other hand poorly-developed faults, i.e. faults with little or no net
displa ement and hen e no appre iable gouge zone, display seismi failure
throughout the upper zone. Seismogeni distan e is measured to the part of
fault where unstable slip o urs.
Campbell (1997) believes that seismogeni distan e an be `reliably and
easily determined for most signi� ant earthquakes' but, in fa t, it has the
same diÆ ulties in its determination as rupture distan e, whi h an be large,
plus the requirement of de�ning depth to the seismogeni layer.
There will be little di�eren e between rupture and seismogeni distan e
if rupture distan es are de�ned to a rupture plane whi h is de�ned by:
aftersho k distribution, be ause aftersho ks do not o ur in stable slip zones;
or fault slip inversion, whi h will de�ne the part of the rupture plane where
40
most slip o urred whi h orrelates with the unstable zone (e.g. Ar huleta,
1984; Marone and S holz, 1998). Seismogeni distan es are only likely to
be signi� antly di�erent to rupture distan es for earthquakes with surfa e
rupture whi h if it o urred for a well-developed fault, su h as the Imperial
Valley fault, would be onsidered to be the result of unstable slip at depth
and not the stable slip in the gouge near the surfa e.
Campbell (1997) provides an equation for estimating the minimum seis-
mogeni distan e possible given M
w
, rupture width, dip of rupture, depth
to top of seismogeni zone and depth to bottom of seismogeni zone for a
future earthquake, if no other information is available. However, the use of
this equation in hazard assessment means that any redu tion in un ertainty
brought about by the use of seismogeni distan e, ompared with other
distan e measures, will be reintrodu ed.
Ellipti al distan e D or average site to rupture end distan e ASRED:
Mean of the distan es to the extremities of the fault surfa e rupture (Bureau,
1978; Zhou et al., 1989), if no surfa e rupture o urred then the proje tion
of the top of the rupture should be used.
No measurements of the width or depth of rupture are needed so ellipti-
al distan e has less un ertainty than either surfa e proje tion, rupture or
seismogeni distan es.
One onsequen e of using ellipti al distan e is that it automati ally mod-
els near-�eld attening of the attenuation urves without needing an equiv-
alent depth term. For large magnitudes this at area in reases in size and
ellipti al distan e use for es a nonlinear in rease in a eleration with in-
rease in magnitude. The onsequen e of using this distan e is that the
magnitude dependent terms in luded in the de ay part of ground motion
estimation equations by some authors (e.g. Campbell, 1981) do not need to
41
be in luded separately (Douglas, 2001b).
As ellipti al distan e requires only the ends of a fault to be lo ated it
is easier to estimate for future earthquakes o urring along de�ned surfa e
faults.
Equivalent hypo entral distan e EHD: Distan e from a virtual point sour e
that provides the same energy to the site as does a �nite-size fault (Ohno
et al., 1993). De�ned by: 1=EHD
2
=
P
n
i=1
M
2
0;i
X
�2
i
=
P
n
i=1
M
2
0;i
, where n is
the number of segments on the rupture plane, M
0;i
is the seismi moment
density on the ith segment and X
i
is the distan e between ith segment and
site.
It in ludes the e�e ts of fault size, fault geometry and inhomogeneous
slip distribution (Ohno et al., 1993). Ohno et al. (1996), Kawano et al.
(2000) and Si and Midorikawa (2000) use EHD to derive their ground motion
estimation equations.
To al ulate EHD reliably requires mu h more information about an
earthquake than other distan e metri s used in ground motion estimation
equations, namely it needs the distribution of displa ement on the fault
plane (assuming that the sour e time fun tion is the same for all small seg-
ments on the fault plane) (Ohno et al., 1993). For large (M & 6:5), well
re orded earthquakes maps of su h distributions are being in reasingly pro-
du ed and published although for the same earthquake there are o asion-
ally many di�erent interpretations of the rupture for the same earthquake.
Figure 6 ompares ontours of equal EHD for uniform moment release
along a horizontal line sour e to linearly in reasing moment release along a
horizontal line sour e.
EHD for faults with linearly in reasing moment release predi ts slower
de ay of ground motion at the end where most moment is released ompared
42
with the end where the moment release is least (Figure 6). As distan e from
the fault in reases the ontours of equal EHD for both uniform and linearly
in reasing ground motion be ome most ir ular and hen e the de ay of
ground motion is modelled as if the energy was released from a point sour e.
For uniform moment release the point sour e is at the entre of the fault
and for linearly in reasing moment it is near the end of the fault where
most of the moment was released. This ompares with surfa e proje tion
distan e and rupture distan e where the ontours of equal distan e never
be ome ir ular (see Figure 8) and so there is not one point sour e from
whi h all the energy is assumed to be radiated.
Reliable determination of the fault slip that o urred during an earth-
quake, whi h is required for al ulation of EHD, needs a large number of
near-�eld a elerograms. Therefore it an only be estimated where there
is a high density of a elerographs, su h as California, Japan and Taiwan.
Even when su h data does exists the determined fault slip is still not pre-
isely de�ned as an be demonstrated by omparing some of the di�erent
inversions of fault slip for the Imperial Valley earthquake (15/10/1979).
The earthquake has been, and ontinues to be, intensely studied be ause of
the wealth of high-quality near-�eld strong-motion data and there have been
many di�erent fault slip determinations made. Figure 7 shows a omparison
of six of these inversions. From Figure 7 it an be seen that although there
are similarities between the inversions, su h as the area of large slip (about
2m) in the entre of the fault, there are also signi� ant di�eren es. These
di�eren es in slip translate into di�eren es in the EHDs for the stations
whi h re orded the earthquake.
When no inversions of the fault slip have been made, either uniform slip
along the entire fault is assumed or hypo entral distan e is used su h as
43
was done by Ohno et al. (1996) for some small magnitude earthquakes and
for earthquakes with limited near-sour e re ordings.
As short period ground motions (in luding PGA) is aused by lo al varia-
tions in the fault slip (Hanks and Johnson, 1976; M Garr, 1981; Boatwright
and Boore, 1982; M Garr, 1982) EHD is unlikely to improve the modelling
of su h motions as it is an average of the moment release over the entire fault
whi h does not have a large e�e t on short period motions. Therefore any
possible improvement in modelling the variation due to distan e by using
EHD is probably likely to be for long period ground motions whi h are more
dependent on the moment release over the entire fault. Ohno et al. (1996)
and Si and Midorikawa (2000) have not found signi� antly lower standard
deviations by using EHD rather than simpler distan e metri s.
EHD is obviously mu h more diÆ ult to al ulate than the more om-
mon distan e measures su h as epi entral, hypo entral, surfa e proje tion
or rupture distan e.
At present the estimation of the pattern of fault slip in future earthquakes
is impossible therefore the use of EHD in hazard analysis is also impossible
ex ept if uniform or simple slip patterns (see Figure 6) are assumed.
For all these reasons, although EHD, ompared with simpler distan e met-
ri s, is a more physi ally-based distan e metri and possibly has the ability
to more adequately model the variations in long period ground motions, its
use in ground motion estimation relations will not signi� antly redu e the
asso iated un ertainty.
Idriss (1978) splits distan e measurements into two groups: those measured
to a point (d
e
, d
h
, d
and d
E
) and those measured to a line or surfa e (d
f
,
d
f;h
, d
r
, d
s
, D and EHD). Some of these distan e measures obey inequalities:
44
d
f
� d
r
� d
s
(d
f
= d
r
for verti al ruptures whi h rea h the surfa e and for
points on the foot wall of ruptures whi h rea h the surfa e) and d
f
� d
e
� D.
At large distan es from the sour e all measures be ome almost equal, thus at
great distan es whi h is used is unimportant.
Figure 8 shows the ontours of equal distan e using the epi entral, surfa e pro-
je tion, rupture and ellipti al distan es from a fault of length 50 km, width
20 km, dip 30
Æ
whi h rea hed the surfa e, with the hypo entre at the bottom of
the north eastern orner of the rupture. Only these four di�erent distan es are
plotted be ause hypo entral, surfa e proje tion with fo al depth and seismo-
geni distan es all have similar hara teristi s to those ontours for epi entral,
surfa e proje tion and rupture distan e respe tively. Figure 8 shows the di�er-
ent assumptions, of how ground motion attenuates with distan e, made when
di�erent distan e metri s are used.
The most ommon form of de ay term is a power law de ay (whi h orresponds
to geometri de ay due to the spreading of waves from a sour e) using a mod-
i�ed distan e, R, therefore the de ay term is R
��
. Distan e is often modi�ed
through the addition of a onstant, i.e. R = d + � (e.g. Esteva, 1970), or by
assuming that the sour e is at some depth, h, and then using the slant dis-
tan e, R =
p
d
2
+ h
2
(e.g. Joyner and Boore, 1981). The a tual distan e, d,
is not usually used, ex ept when hypo entral distan e (e.g. Caillot and Bard,
1993) or mainly far-�eld data (e.g. Singh et al., 1987) is used, be ause for
small d unrealisti ally high values of ground motion are predi ted. The form
R = d+ � does not orrespond to a physi al situation (even though Donovan
and Bornstein (1978) suggest it does), unlike the form R =
p
d
2
+ h
2
, and
hen e relating the de ay rate, �, found using this form to the real de ay rate
of di�erent types of seismi waves is not orre t. Often the al ulated de ay
45
rate using R = d+ � as opposed to R =
p
d
2
+ h
2
is greater, for example M -
Cann Jr. and E hezwia (1984) use one set of PGA values and �t both forms of
distan e dependen e and �nd using the �rst form (with � = 25 km assigned)
� = �1:915 whereas using the se ond form (with h = 3:852 km found through
regression) � = �0:913. Only in the far �eld, d� �, does (d+ �)
��
a tually
give a de ay rate � against d and hen e only the de ay rates where there is
mu h data (usually d � �) should be ompared.
The power, �, whi h ontrols the de ay rate is either �xed or found during
the regression. Joyner and Boore (1981) onstrain � to unity be ause this is
the de ay rate for body waves whi h they assume ause the peak ground a -
eleration; this hoi e of � has been followed by many other authors (e.g. Am-
braseys and Bommer, 1991; Munson and Thurber, 1997). Gar ia-Fernandez
and Canas (1995) onstrain � to
1
2
be ause they assume their peak a eler-
ation is asso iated with Lg waves. Ambraseys and Bommer (1991) also use
� = 0:83 be ause they assume PGA is asso iated with the Airy phase. Camp-
bell (1981) onstrains � to 1:75 whi h he says is representative of far-�eld de ay
of PGA, although note this is for R = d+� and hen e it may be larger than if
R =
p
d
2
+ h
2
was used. Kamiyama et al. (1992) and Kamiyama (1995) on-
strain the de ay rate to �1:64 using results from other studies. Often though
� is found during the regression whi h is better, sin e the equation would �t
the data more losely, but requires a well distributed set of data in terms of
distan e and not too many other oeÆ ients to �nd. Joyner and Boore (1983)
state that they onstrain � to 1 in Joyner and Boore (1981) be ause they
believe their data did not permit a physi ally meaningful, simultaneous deter-
mination of a spreading oeÆ ient and a oeÆ ient of anelasti attenuation.
If the data is insuÆ ient then nonphysi al oeÆ ients an be found whi h
46
although apparently mat h the data well, predi t unrealisti ground motions
at the edges of the data spa e.
Campbell (1981) introdu es the on ept of magnitude dependent � or h, whi h
means that the part of the attenuation urve (roughly the near �eld) with
smaller de ay rate than that in the far �eld is not onstant for all sizes of
earthquakes. This is known as distan e saturation. Usually � and h are of the
form A exp(BM), whereM is the magnitude, be ause this makes the attened
region of the urve proportional to the size of the fault rupture zone whi h
has been found to be exponentially dependent on magnitude (e.g. Ambraseys
and Ja kson, 1998). Kamiyama et al. (1992) and Kamiyama (1995) give a
model where PGA is ompletely independent of distan e within a zone whi h is
exponentially dependent on magnitude. Joyner and Boore (1981), Sabetta and
Pugliese (1987), Boore et al. (1994a) and Ambraseys (1995) �nd no eviden e
for magnitude dependent h for their data and distan e de�nition (distan e
to surfa e proje tion of rupture), although Sabetta and Pugliese (1987) state
that their experiment is not on lusive due to the distribution of data (there
are only a few near-�eld re ords from large magnitude earthquakes in their
set of re ords). Joyner and Boore (1981) prefer a magnitude independent h
be ause fewer oeÆ ients need to be found.
Campbell (1997) models di�erent de ay for thrust(-oblique) and reverse(-
oblique) faults than that for other sour e me hanisms (strike-slip and normal).
This e�e t must be due to di�erent seismi waves being predominant in a -
elerograms from earthquakes with di�erent sour e me hanisms be ause the
travel path is independent of the sour e me hanism.
47
Trifuna and Lee (1989) and Lee (1993) use an attenuation term that is de-
pendent on fo al depth, magnitude and orrelation radius of sour e fun tion
(whi h an be approximated by shear-wave velo ity).
Campbell (1997), Youngs et al. (1997) and Campbell and Bozorgnia (2002)
model di�erent de ay rates for sites in di�erent soil ategories. This idea,
although it may be supported by their data, only has a physi al meaning
(di�erent lo al site ampli� ations) as a site e�e t and not as a path e�e t
be ause although lo ally the soil may be known this does not mean su h
geology is onstant along the travel path. Gaull (1988) and Yamabe and Kanai
(1988) present models with magnitude dependent de ay rates even in the far
�eld. In the far �eld all earthquakes are seen by the site as point sour es and
hen e the far-�eld de ay rate should be independent of magnitude.
Re orded strong ground motion is omposed of many types of seismi waves
(P, S, Lg and surfa e waves). These wave attenuate with individual rates,
therefore di�erent waves dominate at di�erent distan es, making the de ay of
peak ground motion omplex. Trifuna and Brady (1975, 1976) and Trifuna
(1976) model this by using the distan e alibration fun tion used for the al-
ulation of M
L
, derived by Ri hter (1958), whi h has a hange of slope at
d = 75 km be ause for d < 75 km body waves predominate, with de ay � d
�1
,
where as for d > 75 km surfa e waves predominate, with de ay � d
�1=2
. Dahle
et al. (1990b,a) also in orporate a hange of slope into their de ay term (al-
though it is not a smooth transition from one de ay rate to another) whi h
models the hange from spheri al spreading, i.e. d
�1
, of S waves to ylindri-
al spreading, i.e. d
�5=6
, of Lg waves at 100 km, although they note that the
point where the slope hanges depends on rustal stru ture and fo al depth.
Theoreti al onsideration of the importan e of rustal stru ture on the rate
48
of de ay of seismi waves is ontain within, for example, Burger et al. (1987)
and Suhadol and Chiaruttini (1987). M Cann Jr. and E hezwia (1984) on-
sider an expression of the near-�eld response of an elasti whole spa e whi h
in orporates the �rst and se ond order geometri al spreading terms through
an expression, (A=d
2
+B=d)
C
, whi h allows the peak ground motions to ome
from the ombined e�e t of two di�erent types of wave.
Joyner and Boore (1981) introdu e a term, of form exp kR, to model anelasti
de ay. This has been adopted by a number of subsequent authors (e.g. Am-
braseys and Bommer, 1991; Sigbj�ornsson and Baldvinsson, 1992) although
often the geometri al de ay power, �, is �xed at unity so that a realisti , i.e.
negative, anelasti oeÆ ient is found. If � is not �xed then k is often found
to be positive (e.g. Ambraseys et al., 1996), whi h predi ts in reasing ground
motion for in reasing distan e at large distan es.
Abrahamson and Litehiser (1989) only in lude an anelasti term for inter-
plate earthquakes. Atkinson (1997) in ludes a depth dependent anelasti de-
ay term. Cousins et al. (1999) and M Verry et al. (2000) in lude a term to
a ount for the higher anelasti de ay due to the waves travelling through a
vol ani region. Lee (1995) in ludes an anelasti de ay term whi h be omes
the only de ay term for distan es greater than a distan e dependent on fo al
depth, magnitude and orrelation radius of sour e fun tion. Trifuna (1976)
states that be ause the representative frequen y of peak amplitudes varies
with distan e and be ause the relative digitisation noise also hanges with
distan e it is diÆ ult to in lude an anelasti de ay term.
Abrahamson and Silva (1997) in lude a term, whi h is dependent on distan e,
for sites on the hanging wall of a fault rupture. Their term probably a ounts
49
for a site on the hanging wall seeing more of the rupture plane than a site on
the foot wall but their ompli ated form for this term may not be justi�ed by
their limited amount of data.
Donovan and Bornstein (1978) use a ompli ated distan e dependen e, involv-
ing geometri al de ay but also fa tors whi h model magnitude and distan e-
dependent de ay. Su h a form of distan e dependen e, although it may be
supported by their data, is unne essarily omplex, when it does not redu e
the un ertainty asso iated with ground motion predi tion, espe ially be ause
they �t their non-linear equation, ontaining 6 oeÆ ients, to only 59 re ords
from 10 earthquakes.
Bolt and Abrahamson (1982) use a form of distan e dependen e whi h does
not have a physi al basis, i.e. they do not try to estimate geometri al de ay
or anelasti de ay oeÆ ients (Bolt and Abrahamson, 1983). Bolt and Abra-
hamson (1983) state the reason for their hoi e was to provide a form that
will predi t a elerations validly, parti ularly near the sour e.
10 Chara terisation of site
Lo al site onditions at an a elerograph station an dramati ally a�e t the
strong ground motion re orded, for example S henk (1984) relates the great
variability in re orded ground motions up to 30 km to di�erent site onditions.
Therefore attempts are made in most ground motion estimation relations to
model the e�e t of di�erent near-surfa e ground onditions on strong motion.
Some publi ations (e.g. Lungu et al., 1995b) however, use data from a wide
variety of sites with di�erent properties (ranging from sti� soil to very soft
50
soil sites) and do not try to model or examine any di�eren es. Equations that
do not examine or model di�eren es in site response are of limited value,
espe ially when the equations are for intermediate- and long-period spe tral
ordinates, whi h an be signi� antly a�e ted by lo al site onditions.
Data sele tion riteria, whi h seek to limit the a elerograms used to those
re orded at stations with similar lo al site onditions, are the simplest te h-
niques whi h have been employed. Esteva (1970), Fa ioli (1978), Ohsaki et al.
(1980b), Campbell (1989), Dahle et al. (1990b), Mohammadioun (1994a) and
Xiang and Gao (1994) restri t their data to those from sites omparable to
sti� lay or ompa t onglomerate, soft soil sites, bedro k sites, deep soil
(depth greater than 10m) sites, ro k sites, ro k sites with V
s
� 750ms
�1
and
basement ro k sites respe tively. Some studies do not sele t re ords from a
homogeneous set of sites but only ex lude those whi h are a�e ted by signi�-
ant soil ampli� ation or non-linearity (usually soft soil sites) (e.g. M Guire,
1977; Campbell, 1981; Ohno et al., 1996; Sadigh et al., 1997; M Verry et al.,
2000; Si and Midorikawa, 2000). Other studies (Iwasaki et al., 1980; Ohsaki
et al., 1980a; Chiaruttini and Siro, 1981; Kawashima et al., 1986; Huo and
Hu, 1991; Caillot and Bard, 1993; Crouse and M Guire, 1996; Sadigh et al.,
1997) in lude data from di�erent site ategories but perform the regression
on subsets of re ords with the same site lassi� ation. The advantage of this
method is that non-linear soil behaviour is impli itly in luded, be ause the
magnitude and distan e s aling for ea h site ategory is independent of that
for the other ategories. Unless there are a lot of re ords and the distributions
within ea h lass are similar, di�eren es between the predi ted ground motion
on di�erent types of sites may not be signi� ant and may be simply due to
the la k of omparable data.
51
Two studies have taken this idea to its extreme and only used re ords from
a single station (Denham and Small, 1971; Singh et al., 1987). Niazi and
Bozorgnia (1991) use re ords from the SMART-1 array, where the stations
have essentially identi al site onditions, but �nd that there is still mu h un-
ertainty. Su h studies are of limited use for design be ause stru tures will
not be built on the exa t lo ation of the instrument nor is it easy to de ide
whether another lo ation has similar site onditions to the a elerograph sta-
tion. However, su h studies are of use for resear h about lo al site e�e ts and
also about the auses and properties of the s atter asso iated with equations
for the estimation of strong ground motions.
The most ommonly used te hnique to in orporate site e�e ts into an ground
motion estimation relation is to use multipli ative fa tors between ground mo-
tion at one type of site and that at another. Trifuna (1976) introdu es this
method; he uses three site ategories and the multipli ative fa tor between
basement ro k and intermediate type ro k is for ed to be half the multipli a-
tive fa tor between solid hard basement ro k and alluvium sites thus limiting
the generality of the method. The number of multipli ative fa tors used is
usually one less than the number of site ategories used, thus allowing di�er-
ent s alings amongst the site ategories (e.g. Boore et al., 1993; Lawson and
Krawinkler, 1994; Ambraseys et al., 1996; Sabetta and Pugliese, 1996; Chap-
man, 1999). Lee (1995) lassi�es stations into three geologi al site lasses and
two lo al soil lasses, although the di�eren e between geologi al and lo al
s ales is not lear, so there are six ategories in total but only three fa tors.
All the data is used to derive the magnitude and distan e s aling, making
the oeÆ ients more robust, and removing bias from the ampli� ation fa tors
between the di�erent site lasses due to the distribution of the data. Possi-
52
ble non-linear behaviour though annot be modelled by these fa tors be ause
they are equal throughout the dataspa e. A ombination of this method with
the more general method explained above was used by Crouse and M Guire
(1996), who ompute multipli ative fa tors for two of their four soil ategories
be ause of the la k of data within the two ategories. Caillot and Bard (1993)
initially derive equations for ea h of their two site ategory subsets separately
but �nd that the magnitude and distan e oeÆ ients of the two sets of equa-
tions are not signi� antly di�erent so they employ a simple multipli ative
fa tor. This shows that non-linear e�e ts are probably not that important,
although Caillot and Bard (1993) use a set of re ords with many weak motion
time-histories so the non-linear e�e ts may be masked.
Some studies have insuÆ ient data to derive adequate site ategory multi-
pli ative fa tors so they adopt multipli ative fa tors from previous studies
(e.g. Atkinson, 1997; Spudi h et al., 1999). If the site ategories used in the
two studies are similar enough then this is a valid pro edure be ause true site
oeÆ ients should only depend on lo al site onditions at the stations.
Multipli ative fa tors between ground motion on di�erent types of site are
not always modelled as the same throughout the data spa e. M Guire (1978)
attempts to in lude a distan e dependent multipli ative fa tor but it is not
statisti ally signi� ant; a magnitude dependent fa tor, although statisti ally
signi� ant, does not redu e s atter and M Guire (1978) thinks it may be bi-
ased due to la k of ro k re ords so it is not adopted. Campbell (1997) in orpo-
rates distan e dependent site fa tors and Cousins et al. (1999), M Verry et al.
(2000) and Campbell and Bozorgnia (2002) in lude distan e and magnitude-
dependent site fa tors. Although Youngs et al. (1997) develop two separate
equations for deep soil and ro k sites they employ a joint regression method,
53
be ause there is not enough data to apply regression to the individual subsets.
Non-linear soil behaviour is expli itly a ounted for in Abrahamson and Silva
(1997) through the use of a fa tor whi h in ludes the predi ted PGA on ro k;
a fa tor also in luded by M Verry et al. (2000) although they adopted the o-
eÆ ients of Abrahamson and Silva (1997) be ause they have too few re ords
to give realisti estimates of the oeÆ ients. This problem highlights the main
disadvantage of using su h ompli ated fa tors, namely that a large, well dis-
tributed set of re ords is required to �nd robust estimates of oeÆ ients in a
non-linear equation.
Choi es of site ategories into whi h a station is pla ed is ontrolled by the
quality of available site information. Complex lassi� ations annot be used,
even if desired, unless there is adequate data for all the sites used (Spudi h
et al., 1999). Thus early studies (e.g. M Guire, 1978; Joyner and Boore, 1981)
and some re ent studies (e.g. Zhao et al., 1997; Spudi h et al., 1999) simply
use a binary lassi� ation of soil (or alluvium) and ro k. Usually a site is las-
si�ed as soil (or alluvium) if it has soil of more than between 4 (Joyner and
Boore, 1981) and 20m (Abrahamson and Silva, 1997) thi k, be ause a shallow
soil layer is not thought to greatly a�e t the ground motion. Some studies
though have found that shallow soil sites have signi� antly higher ground mo-
tions than ro k or sti� soil sites and that ro k and deep soil sites have similar
ground motion (Campbell, 1981; Sabetta and Pugliese, 1987; Campbell, 1989)
although this is for PGA (a high frequen y parameter) whi h is less a�e ted
by lo al site onditions. Ambraseys and Bommer (1991) attribute the appar-
ent small dependen e of horizontal PGA on site lassi� ation to the la k of
available information whi h ompelled them to use a simple binary system.
As more site information on strong-motion stations has be ome available the
54
number of site lasses used has grown, so that there are three or more at-
egories of in reasing sti�ness (roughly in reasing shear-wave velo ity) (e.g.
Trifuna , 1976; Kawashima et al., 1986; Fukushima and Tanaka, 1990; Law-
son and Krawinkler, 1994; Campbell, 1997; Chapman, 1999; Kobayashi et al.,
2000). Some studies de�ne the boundaries of the ategories in terms of shear-
wave velo ity (e.g. Boore et al., 1993; Ambraseys et al., 1996) but in fa t there
are no shear-wave velo ity measurements for many of the stations they use,
so a rough lassi� ation is made. Due to the diÆ ulty of �nding site informa-
tion Theodulidis and Papaza hos (1992) examined the PGV/PGA ratio for
some of their Alaskan sites to de ide whether they were ro k or soil, whi h
is based on empiri al formulae whi h �nd di�eren es in this ratio due to the
lo al site onditions. There is some un ertainty in su h formulae, due partly
to the variability of ground motion and partly to the a elerogram orre tion
method used to �nd PGV and hen e lassi� ation based on PGV/PGA is
unreliable. Sadigh and Egan (1998) show that PGV/PGA depends on mag-
nitude, distan e and sour e me hanism and not just site onditions and so
are is needed in interpreting PGV/PGA ratios in terms of site onditions.
However, De anini et al. (2000) show that useful information on site ondi-
tions an be obtained from PGV/PGA and so it is a useful te hnique if no
measured wave velo ities are available. In an attempt to redu e the subje tiv-
ity of lassifying Greek stations into ro k or alluvium ategories Theodulidis
and Papaza hos (1992) use the opinion of seven spe ialists and then use the
average lassi� ation; this is a time- onsuming pro ess.
Examination of residuals for sites with di�erent soil ategories is a useful
method for sets of re ords where site information is not omplete, and hen e
annot be in luded expli itly within the equation. This type of analysis was
55
performed by Abrahamson and Litehiser (1989).
To over ome the subje tivity of soil ategories some studies have used dire tly
measured properties of the ground beneath the a elerograph station. The
most ommonly used measurement is the near-surfa e shear-wave velo ity, V
s
.
Blume (1977) �nds that the site impenden e, �V
s
(where � is the density of
the ground whi h is approximately a onstant), is the best measure of site
ondition and he uses it to derive site fa tors for his equation although the
paper is not entirely lear how this is done. Joyner and Fumal (1984) use the
average shear-wave velo ity to one-quarter the wavelength of waves of period
of on ern (although often these shear-wave velo ities are extrapolated using
geologi al data); the basis of this hoi e is energy onservation along ray tubes.
Shear-wave velo ity is usually only measured down to shallow depths so 30m
is often used as the referen e depth to whi h to ompute the average shear-
wave velo ity, although Boore et al. (1994a) state that ideally they would like
to use depth to one quarter wavelength. Boore et al. (1994a) and Ambraseys
(1995) in lude site fa tors based on average shear-wave velo ity to 30m in
their equations. Unlike other formulations to in orporate site onditions into
ground motion estimation relations, dire tly using shear-wave velo ity has the
advantage of being physi ally based so the oeÆ ients an be examined to
he k that they are reasonable. Also it is better be ause there is no need for
subje tive ategories (Ambraseys, 1995). This has two advantages: �rstly no
de isions need to be made about the ategories to use or whi h ategory a
parti ular station is in and se ondly when the equation is used for design the
shear-wave velo ity at the site an be measured and used dire tly in the for-
mula, removing the need for more subje tive judgement on the part of the
designer who does not know exa tly how site lassi� ations were originally
56
done. The major problem with using V
s
is that there are no published mea-
surements at most strong-motion stations, espe ially those outside California
or Japan (Ambraseys, 1995; Spudi h et al., 1999). Di�erent hoi es of the
referen e depth to ompute the average V
s
an lead to di�erent results (Am-
braseys, 1995) so subje tivity is not ompletely removed although Boore et al.
(1994a) believe one-quarter wavelength depth is the best to use but for long
periods this is hundreds of metres for whi h the data is urrently unavailable.
Another disadvantage of this method is that surfa e waves ould be important
(Joyner and Fumal, 1984; Boore et al., 1994a), espe ially for long periods, and
their ampli� ations are not modelled by using V
s
dire tly in the equation like
it is at present (Joyner and Fumal, 1984). Also it does not model the e�e t of
the thi kness of attenuating material (Boore et al., 1994a) or resonan e e�e ts
(Joyner and Fumal, 1984).
Some studies have used site fa tors based on other measurements whi h an
possibly over ome some of the disadvantages of shear-wave velo ity, although
not all have a physi al basis. Joyner and Fumal (1984) in lude site fa tors
based on V
s
and depth to underlying ro k, H, and �nd orrelation for long
periods but no orrelation for short periods although they state it is inappro-
priate to use depth to ro k at present be ause the San Fernando strong-motion
data does not show any signi� ant orrelation. Trifuna (1980) and Trifuna
and Lee (1989) in lude a multipli ative fa tor whi h is exponentially depen-
dent on the depth of sedimentary deposit although Trifuna and Lee (1989)
note that this is not always known at every lo ation so they also provide an
equation using simple site ategories. A ombination of depth to ro k and site
ategories is employed by Lee (1993) and Campbell (1997) although Camp-
bell uses a omplex depth s aling fa tor. Combinations of depth to ro k and
57
site ategories are not the most eÆ ient site parameters be ause they are not
stri tly independent, for example if a site is lassi�ed as ro k then the depth
to ro k must be zero. This orrelation ould ause problems when oeÆ ients
of both these fa tors are sought.
A single parameter whi h is a rough ombination of shear-wave velo ity and
depth to bedro k is the natural period of the site, T , whi h for a single layer
equals 4H=V
s
. The need to in lude a term re e ting expli itly lo al ampli� a-
tion dependent on natural period of the soil is noted by Benito et al. (1992)
be ause they �nd little orrelation between simple soil ategories and ground
motion. A fa tor exponentially dependent on natural period is in luded by
Tong and Katayama (1988) and Sun and Peng (1993), although Tong and
Katayama (1988) �nd that it has little e�e t on estimation. Using natural
period expli itly rather than depth to ro k and shear-wave velo ity redu es
generality be ause if both H and V
s
are in luded there are more oeÆ ients to
be determined, allowing modelling of attenuation e�e ts through the soil layer
(whi h depends on depth) and also impedan e (whi h depends on shear-wave
velo ity). Also the natural period of the site is less available for strong-motion
re ording sites than is shear-wave velo ity and hen e it is easier to use shear-
wave velo ity than natural period of the site.
The most site spe i� pro edure is to use individual oeÆ ients for ea h sta-
tion. This idea was introdu ed by Kamiyama and Yanagisawa (1986) (although
Kobayashi and Midorikawa (1982) developed a method whi h is similar) and
has sin e been adopted in many Japanese studies (Kamiyama et al., 1992;
Fukushima et al., 1995; Molas and Yamazaki, 1995; Shabestari and Yamazaki,
1998; Kawano et al., 2000; Shabestari and Yamazaki, 2000). Its two advan-
tages are that no site information is required about the stations in luded in
58
the set of re ords, hen e eliminating subje tive soil ategories or the need to
measure shear-wave velo ity or similar quantities, and all site e�e ts should be
modelled through the use of automati ally derived transfer fun tions. To use
this method a large number of re ords are required for ea h station, hen e its
use in Japan where there is an abundan e of data, otherwise the station oef-
� ients are not adequately determined. For example, if ea h station re orded
only one earthquake then the standard deviation of the ground motion esti-
mation equation would be zero be ause the individual site oeÆ ients would
equal the residuals from the regression without any site fa tors. This though
would not be orre t be ause the derived oeÆ ients annot be related to site
response but ould be due to either sour e, path or site e�e ts. A number
of re ords at ea h station are required, with di�erent sour e and path on-
ditions, before the site oeÆ ients tend to the true values, whi h gives the
orre t transfer fun tion for ea h site. Kamiyama and Yanagisawa (1986) �nd
a good agreement between the site oeÆ ients (transformed to ampli� ation
spe tra) and the ampli� ation spe tra predi ted using the shear-wave velo -
ity pro�les of the stations. Molas and Yamazaki (1995) �nd weak orrelation
between station oeÆ ients and soil ategories although there is mu h s atter.
Unless the individual site oeÆ ients an be related to the theoreti al transfer
fun tion at ea h station or to some other feature of the site, ground motion
estimation relations in luding these individual fa tors are impossible to use for
the predi tion of ground motion at a site whi h is not within the original set of
re ords. Even if a relation ould be found between site hara teristi s and the
oeÆ ients, the use of su h equations in seismi hazard analysis, where many
sites are onsidered, would require detailed information on all those under
investigation.
59
The most omputational intensive method for in luding lo al site e�e ts within
an ground motion estimation study is to onvert all the re orded time-histories
from sites with a variety of properties to time-histories whi h would have been
re orded on a site with given properties. This pro edure was adopted by An-
naka and Nozawa (1988), who use 1D propagation theory to transform re ords
from sites with V
s
< 300ms
�1
to re ords from sites with V
s
> 300ms
�1
,
and Kawano et al. (2000), who strip o� the e�e ts of the uppermost lay-
ers of ground under a station to get a re ord whi h omes from a site with
0:5 � V
s
� 2:7 kms
�1
. Altering the re orded time-history in this way ould
lead to in reased un ertainty be ause the ground motion is not simply a�e ted
by the ground dire tly under the station (1D e�e t) but by the ground within
an unde�ned area (2D and 3D e�e ts).
No published ground motion estimation relation onsiders topographi al ef-
fe ts ex ept those whi h ex lude re ords believed to be a�e ted by topography,
see Se tion 4, and Zhao et al. (1997) who in lude in their ro k ategory re ords
from stations where topographi e�e ts are expe ted.
Figure 5 ompares the estimated ratio of horizontal peak ground a eleration
and response spe tral amplitudes between soft soil sites and hard ro k sites and
between sti� soil sites and hard ro k sites using some re ent equations. This
�gure shows that soil sites are expe ted to show signi� antly larger response
spe tral amplitudes (up to a fa tor of 2:5) than ro k sites at almost all periods
of engineering interest with the maximum ratio o urring around T = 1 s.
However there are onsiderable di�eren es in the estimated ratios of soil and
ro k ground motions between the di�erent sets of equations. Compare, for
example, the estimated ratios using the equations of Campbell and Bozorgnia
(2002), whi h predi t large ratios (up to a fa tor of 2:5 for soft and sti� soil),
60
and those of Lussou et al. (2001), whi h predi t mu h smaller ratios (up to
a fa tor of 1:3 for sti� soil and 1:6 for soft soil). These di�eren es are due to
di�erent site lassi� ations, di�erent sets of sites and re ords used and di�erent
fun tional forms employed.
11 Analysis te hniques
The majority of ground motion estimation studies use the ordinary least
squares method (or an unspe i�ed pro edure) to derive the oeÆ ients of
their equation. However, more omplex pro edures have been developed to
over ome problems en ountered due to the inhomogeneity, in terms of inde-
pendent parameters, of most strong-motion sets. These inhomogeneities are
listed below.
� In most strong-motion sets, unless they are spe ially sele ted, there is a
strong orrelation between magnitude and distan e of the re ords, be ause
larger earthquakes an be dete ted at greater distan es than smaller earth-
quakes.
� There is an abundan e of a elerograms from large distan es (from between
about 50 and 200 km) and there still is a la k of near-�eld data from large
earthquakes whi h are most important for seismi design.
� Some earthquakes (for example San Fernando) o ur within a region with
a large number of a elerographs so there are many available re ords.
Regression te hniques have been developed to ountera t the ill e�e t on the
estimated oeÆ ients (and hen e predi tions) aused by ea h of these hara -
teristi s.
61
Donovan (1973) was the �rst to �nd that orrelation between magnitude and
distan e leads to hanges in the derived oeÆ ients. The regression method
most often used to redu e the e�e t of magnitude and distan e orrelation
is the two-stage te hnique introdu ed by Joyner and Boore (1981). In this
method, the distan e dependent oeÆ ients are derived �rst, using individ-
ual amplitude s aling fa tors for ea h earthquake. In the se ond stage the
magnitude-dependent oeÆ ients are derived by �tting a urve to these ampli-
tude s aling fa tors. Fukushima and Tanaka (1990) ondu t simple numeri al
experiments to show that for sets with a strong orrelation between magnitude
and distan e the distan e dependen e is redu ed, when ordinary least squares
is used, ompared with the de ay asso iated with an individual earthquake.
They �nd the two-stage method yields distan e oeÆ ients similar to those as-
so iated with individual earthquakes. This usefulness of the two-stage method
has also been demonstrated by Abrahamson and Litehiser (1989), Fukushima
et al. (1995), Molas and Yamazaki (1995), Sharma (1998) and Sharma (2000)
for their highly orrelated ( orrelation oeÆ ients up to 0:63) magnitude and
distan e values. Sabetta and Pugliese (1987), Boore et al. (1994a), Ambraseys
(1995), Ambraseys et al. (1996) and Sabetta and Pugliese (1996) have found
that one-stage and two-stage methods yield similar predi tions, espe ially at
intermediate distan es where there is most of the data. Ambraseys and Bom-
mer (1991) prefer a one-stage method be ause more than half the earthquakes
in their set of re ords were only re orded by one instrument and in the se ond
stage these are ex luded from the al ulation of the magnitude dependen e,
thereby omitting a large proportion of their data from the regression. Spudi h
et al. (1999) also use a one-stage method be ause two-stage methods underesti-
mate the earthquake-to-earthquake omponent of variation for sets of re ords
like theirs with many singly-re orded earthquakes. Caillot and Bard (1993)
62
state that the two-stage method may be misleading be ause for some spe tral
periods it does not redu e the varian e; they also �nd signi� ant hanges in
predi tions between one and two-stage methods. A similar te hnique is ap-
plied by Orphal and Lahoud (1974), who use data from the well-re orded San
Fernando earthquake to �nd the distan e dependent oeÆ ient and then the
rest of the data, from other less well-re orded earthquakes, to de�ne the mag-
nitude s aling. Gaull (1988) applied a variation of this method. This method
assumes that the distan e de ay is the same for all earthquakes; an assump-
tion whi h is not ne essarily justi�ed. M Cue et al. (1988) implemented the
reverse of this idea, �rstly �nding the magnitude dependen e by examining
PGA for many events re orded at the same distan e and then using all data
to �nd the distan e dependen e.
A more omplex pro edure to over ome the e�e t of a strong orrelation be-
tween magnitude and distan e ( orrelation oeÆ ient 0:84) was developed
by Tong and Katayama (1988). It is based on a `reliability' parameter for
ea h earthquake, it is the produ t of the number of re ords from that earth-
quake and the oeÆ ient of determination of a regression equation, derived
for ea h earthquake individually, whi h estimates the geometri al de ay rate.
Using earthquakes with `reliability' values greater than unity they �nd that a
weighted average, using the `reliability' values, leads to a distan e dependen e
oeÆ ient whi h is not a�e ted by the orrelation between magnitude and
distan e.
A method was introdu ed by Trifuna (1976), where the set of re ords is split
up into 24 di�erent magnitude, site and omponent (horizontal or verti al) in-
tervals. The magnitude, site, omponent and on�den e interval dependent o-
eÆ ients are al ulated using one PGA value from ea h interval. This method
63
redu es the possible bias in the oeÆ ients due to a large number of re ords
with similar magnitudes. Another pro edure to redu e this bias was used by
Blume (1980). The data is divided into distan e dependent bands and within
ea h band a regression equation dependent on magnitude is found whi h is
used to al ulate the predi ted ground motion at a single point within the
interval. Ea h of these points is used to �nd the overall distan e dependent
oeÆ ient.
By far the most ommon te hnique for minimizing possible bias, due to a
many re ords with similar asso iated distan es and magnitudes, is weighted
regression. Huo and Hu (1991) divide their dataspa e into magnitude-distan e
intervals within whi h ea h re ord has a weight equal to the re ipro al of
the number of re ords within that interval and then all subdivisions have
equal weight. Similar s hemes have been implemented by Caillot and Bard
(1993) and Crouse and M Guire (1996). Si and Midorikawa (2000) give near-
sour e re ords mu h higher weight than those from large distan es. Caillot and
Bard (1993) and Munson and Thurber (1997) �nd that weighting an have a
signi� ant e�e t on the predi tions.
To give more weight to near-�eld PGA values, whi h are more important for
engineering design, Bolt and Abrahamson (1982) use non-linear regression on
the untransformed PGA rather than on the logarithm of PGA. They believe
that the equation derived by Joyner and Boore (1981) is not strongly a�e ted
by the near-�eld data, limiting its usefulness. The statisti al assumption be-
hind the analysis of Bolt and Abrahamson (1982) is that the un ertainty
asso iated with PGA is the same for all levels of ground motion (Draper and
Smith, 1981, pp. 237{238). This assumption must be false be ause otherwise
using the standard deviation asso iated with the equation, to derive predi ted
64
ground motion for per entiles less than 50%, would lead to the predi tion
of negative PGA (by de�nition a positive quantity). Also working dire tly on
the untransformed PGA violates the requirement of the standard least-squares
method that the residuals be homos edasti , i.e. that the residuals are sim-
ilarly distributed with respe t to the predi ted value and the independent
parameters.
The problem of well-re orded earthquakes (for example San Fernando, Impe-
rial Valley and Northridge) having an unwanted strong in uen e on the regres-
sion [as noted by Trifuna (1976)℄ is also usually redu ed through a weighting
s heme; an idea �rst introdu ed by Campbell (1981). Campbell (1981) divides
the dataspa e into a number of distan e intervals within whi h ea h re ord is
weighted by a relative weighting fa tor equal to the re ipro al of the number
of re ords within that interval from the earthquake with whi h the re ord is
asso iated. Variations on this pro edure have been adopted by M Cann Jr.
and E hezwia (1984), Abrahamson and Litehiser (1989), Campbell (1989), Ni-
azi and Bozorgnia (1991), Sun and Peng (1993), Campbell (1997) and Sharma
(1998). The two-stage method of Joyner and Boore (1981) also redu es the
bias due to well-re orded sho ks. The opposite weighting is applied by Si and
Midorikawa (2000) who give more weighting to the well-re orded earthquakes.
Donovan and Bornstein (1978) �nd that, although 32% of their data is from
one earthquake (San Fernando), no bias is introdu ed
Campbell (1997) tries to redu e the bias due to a number of re ordings being
made at lose sites during the same earthquake [the same possible bias that
Boore et al. (1993) redu e by in luding only one re ord from similar sites
whi h were less than 1 km apart℄ through a weighting s heme.
65
Ambraseys and Bommer (1991) hoose not to apply weights with their re-
gression analysis be ause it involves assumptions whi h are diÆ ult to verify.
The ordinary least-squares method is applied by Xu et al. (1984), who justify
its use by the small number of re ords they employ. Campbell and Bozorgnia
(2002) do not apply weights for their regression be ause of the relatively uni-
form distribution of their re ordings with respe t to magnitude and distan e.
The �nal reason for not using the ordinary least-squares te hnique is so that
the oeÆ ients obtained are physi ally realisti . For highly non-linear forms
of the equation, where a small hange in one oeÆ ient strongly a�e ts an-
other oeÆ ient's value, spe ial te hniques need to be employed. Dahle et al.
(1995) use a Bayesian one-stage method to yield physi ally possible oeÆ-
ients. Crouse and M Guire (1996) apply onstraints to their oeÆ ients so
that predi ted ground motion is an in reasing fun tion magnitude and de-
reasing fun tion of distan e. Kamiyama et al. (1992) obtain one of their o-
eÆ ients, whi h ontrols how far the at part of the attenuation urve (where
there is no de ay with distan e) extends, by a trial and error pro ess so it
is onsistent with empiri al estimates of fault length. If the un onstrained
oeÆ ients are nonphysi al then it means that the data used is insuÆ ient
for the omplexity of equation employed. This is a problem with M Verry
et al. (2000) who use a very omplex fun tional form for their ground motion
estimation relation and then must use many oeÆ ients from Abrahamson
and Silva (1997) be ause their set is insuÆ ient to derive realisti oeÆ ients.
Campbell (1997) notes that his adopted fun tional form has too many oeÆ-
ients so it is ne essary to perform the analysis in many steps �nding di�erent
sets of oeÆ ients at ea h stage to ensure a stable result is obtained. Yamabe
and Kanai (1988) apply a two-stage regression, whi h removes the problems
66
aused by produ ts of independent variables be ause the two stages onsist of
ordinary linear regression. This method though annot be used for the vast
majority of non-linear fun tional forms whi h have been proposed.
The other method for obtaining physi ally realisti oeÆ ients is by using sub-
sets of the data for di�erent parts of the analysis. This is espe ially useful for
data whi h is dominated by far-�eld re ords but where the adopted equation
involves oeÆ ients whi h are only important in the near �eld. Donovan and
Bornstein (1978) divide their data a ording to distan e and �nd the equa-
tion by least squares (no details of this pro ess are provided in the paper).
Abrahamson and Litehiser (1989) group their data into 0:5 magnitude unit
intervals and �t simple equations to ea h subset, the oeÆ ients of whi h are
then used to �nd the overall fun tional form and oeÆ ients of their non-
linear distan e saturation term, whi h ontrols the predi ted ground motion
in the near �eld. A similar te hnique is employed by Huo and Hu (1991) and
Si and Midorikawa (2000) to �nd the oeÆ ients of their distan e satura-
tion terms although they use the data from a sele tion of earthquakes rather
than magnitude-binned data. Only the earthquakes asso iated with the most
reliable information (those with M
s
> 6:0) are used by Theodulidis and Pa-
paza hos (1992) to �nd distan e oeÆ ients whi h for es them to adopt a
four-stage regression te hnique to in orporate all the other data.
S henk (1982, 1984) �ts the equation to PGA values by eye and not through re-
gression analysis. S henk (1982) does this be ause the least squares method is
often highly dependent on marginal observations, meaning that ertain points
an have a large in uen e on the derived oeÆ ients. Although this is true,
�tting an equation by eye is not an obje tive method, and so annot be re-
peated by another person and get the same result, and it is impossible to use
67
for ompli ated fun tional forms where the data annot be visualised easily.
Only one published ground motion estimation relation (Huo and Hu, 1991)
makes the important observation that the independent variables used in ground
motion estimation relations (for example magnitude and distan e) are asso i-
ated with their own un ertainties. They develop a method based on weighted
onsistent least-squares whi h takes the un ertainties in magnitude and dis-
tan e into a ount when deriving the equation. The equations and standard
derivations derived by Huo and Hu (1991) using this method and using a stan-
dard method that assumes the independent parameters are exa t are similar.
For predi tion purposes it is best to assume that there are no errors in the
independent parameters be ause the standard method gives the equation that
minimises the least-squares error in predi tion. However, if the oeÆ ients in
the equation are of interest, for example to ompare with oeÆ ients predi ted
on a theoreti al basis, then a regression method that assumes there are errors
in the independent parameters is better.
Brillinger and Preisler (1984, 1985) introdu e the maximum-likelihoodmethod
for deriving equations for the estimation of strong ground motion. The method
is also known as the random e�e ts method (Abrahamson and Youngs, 1992).
In the random-e�e ts te hnique the error is assumed to onsist of two parts: an
earthquake-to-earthquake omponent, whi h is the same for all re ords from
the same earthquake, and a re ord-to-re ord omponent, whi h expresses the
variability between ea h re ord not expressed by the earthquake-to-earthquake
omponent. The standard deviation of these two errors is found along with
the oeÆ ients. This method is thought to take better a ount of the fa t
that ea h re ord from the same earthquake is not stri tly independent. Joyner
and Boore (1993) provides a good dis ussion of this method. This regression
68
method has be ome the most ommonly used method and is used by, for
example, Boore et al. (1993), Abrahamson and Silva (1997) and Spudi h et al.
(1999).
12 Con lusions
From the above dis ussion it an be seen that little agreement has been rea hed
in the past thirty years of ground motion estimation relation studies, in terms
of data sele tion; hara terisation of sour e, path or site; or regression te h-
niques employed. Workers have hosen their te hniques based on the available
data, whi h varies greatly with geographi al region.
The method hosen must also depend on the purpose to whi h the equations
are to be used. For example, if the equations are to be used for seismi hazard
analysis of a large region for whi h only rude site information is available
deriving an equation using omplex site fa tors whi h are diÆ ult to orrelate
with the rude site information would make the hazard analysis more om-
pli ated, although the derived equations with the omplex site fa tors may
model the physi s of the problem better. If, however, the equation was to be
used for a spe i� site for whi h detailed soil and wave velo ity pro�les are
available in luding omplex site response modelling in the equation would be
justi�ed and useful.
The ground motion re orded during a parti ular earthquake at a parti ular
site is the the result of a nonlinear ombination of many fa tors. As has been
shown above many di�erent hoi es have been made in deriving equations
for the estimation of strong ground motion therefore it is diÆ ult to orre-
69
late apparent di�eren es in the estimated ground motions the seismote toni
onditions of the areas where the a elerograms used were re orded. This is
be ause of di�eren es in magnitude s ale, distan e metri and site lassi�-
ations used, fun tional form adopted and, probably mainly, be ause of the
distribution of the data used in terms of magnitude and distan e.
Estimated ground motions from re ent equations for most ombinations of
magnitude and distan e mat h losely, see Figure 2. Estimated ground motions
from early equations, however, show a large dispersion, see Figure 9 whi h
shows di�eren es of up to a fa tor of ten in predi ted PGA for a M
w
= 4:5
earthquake at d
f
= 50 km using the equations of Trifuna (1976) and Esteva
and Villaverde (1973). The large di�eren es in early equations to estimate
ground motions are be ause of a la k of data, espe ially near-�eld data from
large earthquakes, a la k of detailed sour e, path and site information and
the simple te hniques used to derive the equations. As strong-motion data
has be ome more quantiful and of higher quality and the te hniques used to
derive the equations more sophisti ated the predi ted ground motions have
be ome more similar.
There are, however, a number of important questions in ground motion esti-
mation on whi h there is disagreement. Examples of these are given below.
� For whi h regions of the world are strong ground motions signi� antly dif-
ferent than ground motions in other regions? If ground motions in ertain
regions of the world are suÆ iently similar to those in other regions data
from these di�erent areas an be ombined to improve the robustness of the
derived equations.
� How do near-�eld ground motion amplitudes s ale with magnitude?
70
� What is the most appropriate distan e metri to use? This will depend
on the type of data available (it is impossible to use a omplex metri
where information on the fault rupture is not available) and also on the
type of earthquakes under onsideration (fo al depth has been shown to
signi� antly a�e t ground motion amplitudes and hen e its in lusion for
areas a�e ted by deep earthquakes is important).
� What is the best way to in lude site e�e ts into the equations?
Many fa tors are known to a�e t ground motions re orded at a site (Boore,
1983; Joyner, 1987; Joyner and Boore, 1988; Anderson, 1991; Douglas, 2001b)
that are negle ted in urrently used equations for the estimation of earthquake
ground motions. These fa tors in lude: stress onditions in the rust in luding
stress drop (both stati and dynami ), rupture propagation leading to di-
re tivity e�e ts, radiation pattern, di�ering de ay rates for di�erent types of
wave, variations in subsurfa e topography (basin e�e ts), fo ussing and topog-
raphy. Negle ting these fa tors leads to large standard deviations when su h
equations are used. These large standard deviations mean that earthquake en-
gineers must in lude large fa tors of safety into their designs. Figure 10 shows
the un ertainty (de�ned in as a fa tor of one standard deviation) of published
equations for the estimation of horizontal peak ground a eleration against the
date when the equation was �rst published. It shows that in the past thirty
years there has been little or no de rease in the asso iated standard deviations
of the al ulated equations to estimate strong ground motions. This arti le has
showed, however, that ea h step of the pro edure followed in deriving these
equations has been s rutinised and improvements suggested.
In order to improve the pre ision of ground motion estimates new indepen-
dent parameters, su h as more sophisti ated site hara terisation, need to be
71
in luded into the equations. Examples of su h independent parameters that
should be in luded in future equations, be ause they an be measured before
an earthquake o urs, are: stati stress drop and rustal stru ture, both of
whi h are regionally dependent; the e�e t of basins, whi h is espe ially impor-
tant for long-period ground motions; resonan e and impedan e e�e ts in the
soil deposits beneath the site; and non-linear site response. To in lude these
e�e ts needs, however, detailed information whi h, unfortunately, is urrently
la king, espe ially in Europe and the Middle East.
Ground motion estimation using strong-motion re ords is still an rapidly
evolving subje t and every year about �ve new sets of equations are derived
and published. Therefore a future review su h as this will probably empha-
sise di�erent points than onsidered here. Future studies should on entrate
on trying to answer the still outstanding issues mentioned above and should
make full use of the available data.
13 A knowledgements
This study was funded by EPSRC grant no. GR/L87385 and EC grant no.
EVR1-CT-1999-40008; I thank both funding agen ies for their support. I thank
Prof. N.N. Ambraseys, Dr J.J. Bommer, Dr P.M. Smit, Anna Baba, Julian
Gar ia-Mayordomo, Mar o Pagani, Jorge Prieto-Salazar, Carlos Rodriguez,
Tizi Rossetto and Iain Tromans for referen es and their enthusiasm towards
the original reports. I thank Dr A. Dahle for sending me a opy of Dahle et al.
(1991). Also I thank Dr S.K. Sarma and Prof. P. Suhadol for examining me
for my Ph.D.; my thesis and onsequently this paper were improved signif-
i antly by their omments. In addition, riti al reviews by Prof. P. Fajfar,
72
Dr K. W. Campbell and Prof. G. Panza were helpful and lead to signi� ant
improvements to the arti le.
Referen es
Abrahamson, N. A., Litehiser, J. J., Jun 1989. Attenuation of verti al peak
a eleration. Bulletin of the Seismologi al So iety of Ameri a 79 (3), 549{
580.
Abrahamson, N. A., Silva, W. J., Jan/Feb 1997. Empiri al response spe -
tral attenuation relations for shallow rustal earthquakes. Seismologi al Re-
sear h Letters 68 (1), 94{127.
Abrahamson, N. A., Youngs, R. R., Feb 1992. A stable algorithm for regres-
sion analyses using the random e�e ts model. Bulletin of the Seismologi al
So iety of Ameri a 82 (1), 505{510.
Alfaro, C. S., Kiremidjian, A. S., White, R. A., 1990. Seismi zoning and
ground motion parameters for El Salvador. Te h. Rep. 93, The John A.
Blume Earthquake Engineering Center, Stanford University, not seen. Re-
ported in Bommer et al. (1996).
Algermissen, S. T., Hansen, S. L., Thenhaus, P. C., 1988. Seismi hazard evalu-
ation for El Salvador. Te h. rep., Report for the US Agen y for International
Development, not seen. Reported in Bommer et al. (1996).
Ambraseys, N., Douglas, J., Aug 2000. Reappraisal of the e�e t of verti al
ground motions on response. ESEE Report 00-4, Department of Civil and
Environmental Engineering, Imperial College, London, also available on in-
ternet at: http://www.esee. v.i .a .uk/reports.htm.
Ambraseys, N. N., 1975. Trends in engineering seismology in Europe. In: Pro-
eedings of Fifth European Conferen e on Earthquake Engineering. Vol. 3.
73
pp. 39{52.
Ambraseys, N. N., Jan 1990. Uniform magnitude re-evaluation of European
earthquakes asso iated with strong-motion re ords. Earthquake Engineering
and Stru tural Dynami s 19 (1), 1{20.
Ambraseys, N. N., Apr 1995. The predi tion of earthquake peak ground a el-
eration in Europe. Earthquake Engineering and Stru tural Dynami s 24 (4),
467{490.
Ambraseys, N. N., Bommer, J. J., 1991. The attenuation of ground a elera-
tions in Europe. Earthquake Engineering and Stru tural Dynami s 20 (12),
1179{1202.
Ambraseys, N. N., Bommer, J. J., 1992. On the attenuation of ground a elera-
tions in Europe. In: Pro eedings of Tenth World Conferen e on Earthquake
Engineering. Vol. 2. pp. 675{678.
Ambraseys, N. N., Bommer, J. J., 1995. Attenuation relations for use in Eu-
rope: An overview. In: Elnashai, A. S. (Ed.), Pro eedings of Fifth SECED
Conferen e on European Seismi Design Pra ti e. pp. 67{74.
Ambraseys, N. N., Bommer, J. J., Sarma, S. K., Nov 1992. A review of seismi
ground motions for UK design. ESEE Report 92-8, Department of Civil
Engineering, Imperial College, London.
Ambraseys, N. N., Ja kson, J. A., 1998. Faulting asso iated with histori al
and re ent earthquakes in the Eastern Mediterranean region. Geophysi al
Journal International 133 (2), 390{406.
Ambraseys, N. N., Simpson, K. A., 1996. Predi tion of verti al response spe -
tra in Europe. Earthquake Engineering and Stru tural Dynami s 25 (4),
401{412.
Ambraseys, N. N., Simpson, K. A., Bommer, J. J., 1996. Predi tion of hori-
zontal response spe tra in Europe. Earthquake Engineering and Stru tural
74
Dynami s 25 (4), 371{400.
Anderson, J. G., Apr 1991. Strong motion seismology. Reviews of Geophysi s
29, 700{720, part 2.
Annaka, T., Nozawa, Y., 1988. A probabilisti model for seismi hazard es-
timation in the Kanto distri t. In: Pro eedings of Ninth World Conferen e
on Earthquake Engineering. Vol. II. pp. 107{112.
Aptikaev, F., Kopni hev, J., 1980. Correlation between seismi vibration pa-
rameters and type of faulting. In: Pro eedings of Seventh World Conferen e
on Earthquake Engineering. Vol. 1. pp. 107{110.
Ar huleta, R. J., Jun 1984. A faulting model for the 1979 Imperial Valley
earthquake. Journal of Geophysi al Resear h 89 (B6), 4559{4585.
Atkinson, G. M., Jul{De 1990. A omparison of eastern North Ameri an
ground motion observations with theoreti al predi tions. Seismologi al Re-
sear h Letters 61 (3{4), 171{180.
Atkinson, G. M., 1997. Empiri al ground motion relations for earthquakes in
the Cas adia region. Canadian Journal of Civil Engineering 24, 64{77.
Benito, B., Rinaldis, D., Gorelli, V., Pa iello, A., 1992. In uen e of the mag-
nitude, distan e and natural period of soil in the strong ground motion. In:
Pro eedings of Tenth World Conferen e on Earthquake Engineering. Vol. 2.
pp. 773{779.
Blume, J. A., 1977. The SAM pro edure for site-a eleration-magnitude rela-
tionships. In: Pro eedings of Sixth World Conferen e on Earthquake Engi-
neering. Vol. I. pp. 416{422.
Blume, J. A., 1980. Distan e partitioning in attenuation studies. In: Pro eed-
ings of Seventh World Conferen e on Earthquake Engineering. Vol. 2. pp.
403{410.
Boatwright, J., Boore, D. M., De 1982. Analysis of the ground a elerations
75
radiated by the 1980 Livermore Valley earthquakes for dire tivity and dy-
nami sour e hara teristi s. Bulletin of the Seismologi al So iety of Amer-
i a 72 (6), 1843{1865.
Bolt, B. A., Abrahamson, N. A., De 1982. New attenuation relations for
peak and expe ted a elerations of strong ground motion. Bulletin of the
Seismologi al So iety of Ameri a 72 (6), 2307{2321.
Bolt, B. A., Abrahamson, N. A., O t 1983. Reply to W. B. Joyner and D. M.
Boore's \Comments on `New attenuation relations for peak and expe ted
a elerations of strong ground motion' ". Bulletin of the Seismologi al So-
iety of Ameri a 73 (5), 1481{1483.
Bommer, J. J., Elnashai, A. S., Chlimintzas, G. O., Lee, D., Mar 1998. Re-
view and development of response spe tra for displa ement-based seismi
design. ESEE Report 98-3, Department of Civil Engineering, Imperial Col-
lege, London.
Bommer, J. J., Hern�andez, D. A., Navarrete, J. A., Salazar, W. M., 1996.
Seismi hazard assessments for El Salvador. Geof��si a Interna ional 35 (3),
227{244.
Bonilla, M. G., Mark, R. K., Lienkaemper, J. J., De 1984. Statisti al re-
lations among earthquake magnitude, surfa e rupture length, and surfa e
fault displa ement. Bulletin of the Seismologi al So iety of Ameri a 74 (6),
2379{2411.
Boore, D. M., Jul 1983. Strong-motion seismology. Reviews of Geophysi s and
Spa e Physi s 21 (6), 1308{1318.
Boore, D. M., Sep 1989. The Ri hter s ale: Its development and use for deter-
mining earthquake sour e parameters. Te tonophysi s 166 (1{3), 1{14.
Boore, D. M., Joyner, W. B., De 1982. The empiri al predi tion of ground
motion. Bulletin of the Seismologi al So iety of Ameri a 72 (6), S43{S60,
76
part B.
Boore, D. M., Joyner, W. B., Fumal, T. E., 1993. Estimation of response
spe tra and peak a elerations from western North Ameri an earthquakes:
An interim report. Open-File Report 93-509, U.S. Geologi al Survey.
Boore, D. M., Joyner, W. B., Fumal, T. E., 1994a. Estimation of response
spe tra and peak a elerations from western North Ameri an earthquakes:
An interim report. Part 2. Open-File Report 94-127, U.S. Geologi al Survey.
Boore, D. M., Joyner, W. B., Fumal, T. E., 1994b. Ground motion estimates
for strike- and reverse-slip faults, provided to the Southern California Earth-
quake Center and widely distributed as an insert in Boore et al. (1994a).
Not seen. Reported in Boore et al. (1997).
Boore, D. M., Joyner, W. B., Fumal, T. E., Jan/Feb 1997. Equations for es-
timating horizontal response spe tra and peak a eleration from western
North Ameri an earthquakes: A summary of re ent work. Seismologi al Re-
sear h Letters 68 (1), 128{153.
Bouhadad, Y., Laouami, N., Bensalem, R., Larbes, S., 1998. Seismi hazard
estimation in the entral Tell Atlas of Algeria (Algiers-Kabylia). In: Pro-
eedings of Eleventh European Conferen e on Earthquake Engineering.
Bozorgnia, Y., Campbell, K. W., Niazi, M., 2000. Observed spe tral hara ter-
isti s of verti al ground motion re orded during worldwide earthquakes from
1957 to 1995. In: Pro eedings of Twelfth World Conferen e on Earthquake
Engineering. Paper No. 2671.
Brillinger, D. R., Preisler, H. K., 1984. An exploratory analysis of the Joyner-
Boore attenuation data. Bulletin of the Seismologi al So iety of Ameri a
74 (4), 1441{1450.
Brillinger, D. R., Preisler, H. K., 1985. Further analysis of the Joyner-Boore
attenuation data. Bulletin of the Seismologi al So iety of Ameri a 75 (2),
77
611{614.
Bureau, G. J., Jun 1978. In uen e of faulting on earthquake attenuation.
In: Pro eedings of the ASCE Geote hni al Engineering Division Spe iality
Conferen e: Earthquake Engineering and Soil Dynami s. Vol. I. pp. 290{307.
Burger, R. W., Somerville, P. G., Barker, J. S., Herrmann, R. B., Helmberger,
D. V., Apr 1987. The e�e t of rustal stru ture on strong ground motion
attenuation relations in eastern North Ameri a. Bulletin of the Seismologi al
So iety of Ameri a 77 (2), 420{439.
Caillot, V., Bard, P. Y., 1993. Magnitude, distan e and site dependent spe tra
from Italian a elerometri data. European Earthquake Engineering VII (1),
37{48.
Cama ho, E., Lindholm, C., Dahle, A., Bungum, H., 1997. Seismi hazard
assessment in Panama. Engineering Geology 48 (1-2), 1{6.
Campbell, K. W., De 1981. Near-sour e attenuation of peak horizontal a el-
eration. Bulletin of the Seismologi al So iety of Ameri a 71 (6), 2039{2070.
Campbell, K. W., Aug 1985. Strong motion attenuation relations: A ten-year
perspe tive. Earthquake Spe tra 1 (4), 759{804.
Campbell, K. W., O t 1989. The dependen e of peak horizontal a eleration
on magnitude, distan e, and site e�e ts for small-magnitude earthquakes in
California and eastern North Ameri a. Bulletin of the Seismologi al So iety
of Ameri a 79 (5), 1311{1346.
Campbell, K. W., Sep 1990. Empiri al predi tion of near-sour e soil and soft-
ro k ground motion for the Diablo Canyon power plant site, San Luis Obispo
ounty, California. Te h. rep., Dames & Moore, Evergreen, Colorado, pre-
pared for Lawren e Livermore National Laboratory. Not seen. Reported in
Idriss (1993).
Campbell, K. W., Jan 1993. Empiri al predi tion of near-sour e ground motion
78
from large earthquakes. In: Pro eedings of the International Workshop on
Earthquake Hazard and Large Dams in the Himalaya. Indian National Trust
for Art and Cultural Heritage, New Delhi, India.
Campbell, K. W., Jan/Feb 1997. Empiri al near-sour e attenuation relation-
ships for horizontal and verti al omponents of peak ground a eleration,
peak ground velo ity, and pseudo-absolute a eleration response spe tra.
Seismologi al Resear h Letters 68 (1), 154{179.
Campbell, K. W., 2002a. A ontemporary guide to strong-motion attenuation
relations. In: Lee, W. H. K., Kanamori, H., Jennings, P. C., Kisslinger, C.
(Eds.), International Handbook of Earthquake and Engineering Seismology.
A ademi Press, London.
Campbell, K. W., 2002b. Engineering models of strong ground motion. In:
Chen, W. F., S awthorn, C. (Eds.), Handbook of Earthquake Engineering.
CRC Press, Bo a Raton, FL, USA, Ch. 5.
Campbell, K. W., 2002 . Strong-motion attenuation relations. In: Lee, W.
H. K., Kanamori, H., Jennings, P. C., Kisslinger, C. (Eds.), International
Handbook of Earthquake and Engineering Seismology. A ademi Press,
London, Ch. 60.
Campbell, K. W., Bozorgnia, Y., Jul 1994. Near-sour e attenuation of peak
horizontal a eleration from worldwide a elerograms re orded from 1957 to
1993. In: Pro eedings of the Fifth U.S. National Conferen e on Earthquake
Engineering. Vol. III. pp. 283{292.
Campbell, K. W., Bozorgnia, Y., Nov 2000. New empiri al models for predi t-
ing near-sour e horizontal, verti al, and V=H response spe tra: Impli ations
for design. In: Pro eedings of the Sixth International Conferen e on Seismi
Zonation.
Campbell, K. W., Bozorgnia, Y., 2002. Mutually onsistent near-sour e at-
79
tenuation relations for the horizontal and verti al omponents of PGA and
a eleration response spe tra. Bulletin of the Seismologi al So iety of Amer-
i a Submitted.
Chang, T.-Y., Cotton, F., Angelier, J., O t 2001. Seismi attenuation and
peak ground a eleration in Taiwan. Bulletin of the Seismologi al So iety
of Ameri a 91 (5), 1229{1246.
Chapman, M. C., Nov 1999. On the use of elasti input energy for seismi
hazard analysis. Earthquake Spe tra 15 (4), 607{635.
Chiaruttini, C., Siro, L., De 1981. The orrelation of peak ground horizontal
a eleration with magnitude, distan e, and seismi intensity for Friuli and
An ona, Italy, and the Alpide belt. Bulletin of the Seismologi al So iety of
Ameri a 71 (6), 1993{2009.
Chopra, A. K., 1995. Dynami s of Stru tures | Theory and Appli ation to
Earthquake Engineering. Prenti e Hall International, In .
Chou, C.-C., Uang, C.-M., O t 2000. Establishing absorbed energy spe tra |
an attenuation approa h. Earthquake Engineering and Stru tural Dynami s
29 (10), 1441{1455.
Climent, A., Taylor, W., Ciudad Real, M., Strau h, W., Villagr�an, M., Dahle,
A., Bungum, H., 1994. Spe tral strong motion attenuation in Central Amer-
i a. Te h. Rep. 2-17, NORSAR, not seen. Reported in Cama ho et al. (1997)
and Bommer et al. (1996).
Cornell, C. A., O t 1968. Engineering seismi risk analysis. Bulletin of the
Seismologi al So iety of Ameri a 58 (5), 1583{1606.
Cornell, C. A., Banon, H., Shakal, A. F., Jul{Aug 1979. Seismi motion and
response predi tion alternatives. Earthquake Engineering and Stru tural
Dynami s 7 (4), 295{315.
Cousins, W. J., Zhao, J. X., Perrin, N. D., De 1999. A model for the atten-
80
uation of peak ground a eleration in New Zealand earthquakes based on
seismograph and a elerograph data. Bulletin of the New Zealand So iety
for Earthquake Engineering 32 (4), 193{220.
Crouse, C. B., 1991. Ground-motion attenuation equations for earthquakes on
the Cas adia subdu tion zones. Earthquake Spe tra 7 (2), 201{236.
Crouse, C. B., M Guire, J. W., Aug 1996. Site response studies for purpose of
revising NEHRP seismi provisions. Earthquake Spe tra 12 (3), 407{439.
Crouse, C. B., Vyas, Y. K., S hell, B. A., Feb 1988. Ground motion from
subdu tion-zone earthquakes. Bulletin of the Seismologi al So iety of Amer-
i a 78 (1), 1{25.
Dahle, A., Bugum, H., Kvamme, L. B., 1990a. Attenuation modelling based
on intraplate earthquake re ordings. In: Pro eedings of Ninth European
Conferen e on Earthquake Engineering. Vol. 4-A. pp. 121{129.
Dahle, A., Bungum, H., Kvamme, L. B., Nov 1990b. Attenuation models in-
ferred from intraplate earthquake re ordings. Earthquake Engineering and
Stru tural Dynami s 19 (8), 1125{1141.
Dahle, A., Bungum, H., Kvamme, L. B., 1991. Empiri ally derived PSV spe -
tral attenuation models for intraplate onditions. European Earthquake En-
gineering 3, 42{52.
Dahle, A., Climent, A., Taylor, W., Bungum, H., Santos, P., Ciudad Real,
M., Linholm, C., Strau h, W., Segura, F., 1995. New spe tral strong mo-
tion attenuation models for Central Ameri a. In: Pro eedings of the Fifth
International Conferen e on Seismi Zonation. Vol. II. pp. 1005{1012.
De anini, L., Mollaioli, F., F., P. G., Romanelli, F., Va ari, F., De 2000.
Peri olosit�a sismi a della Si ilia sud orientale. Terremoti di s enario per
Augusta, Sira usa e Noto. In: De anini, L., Panza, G. F. (Eds.), S enari di
peri olosit�a sismi a ad Augusta, Sira usa e Noto. CNR-Gruppo Nazionale
81
per la Difesa dai Terremoti, Rome, Italy, pp. 80{151, in Italian.
Denham, D., Small, G. R., Mar 1971. Strong motion data entre: Bureau of
mineral resour es, Canada. Bulletin of the New Zealand So iety for Earth-
quake Engineering 4 (1), 15{30.
Denham, D., Small, G. R., Everingham, I., 1973. Some strong-motion results
from Papua New Guinea 1967{1972. In: Pro eedings of Fifth World Con-
feren e on Earthquake Engineering. Vol. 2. pp. 2324{2327.
Devillers, C., Mohammadioun, B., 1981. Fren h methodology for determining
site-adapted SMS (S�eisme Major�e de S�e urit�e) spe tra. In: Transa tions
of the 6th International Conferen e on Stru tural Me hani s in Rea tor
Te hnology. Vol. K(a). K 1/9.
Donovan, N. C., 1973. A statisti al evaluation of strong motion data in luding
the February 9, 1971 San Fernando earthquake. In: Pro eedings of Fifth
World Conferen e on Earthquake Engineering. Vol. 1. pp. 1252{1261.
Donovan, N. C., Bornstein, A. E., Jul 1978. Un ertainties in seismi risk anal-
ysis. Journal of The Geote hni al Engineering Division, ASCE 104 (GT7),
869{887.
Douglas, J., Jan 2001a. A omprehensive worldwide summary of strong-motion
attenuation relationships for peak ground a eleration and spe tral ordi-
nates (1969 to 2000). ESEE Report 01-1, Department of Civil and Environ-
mental Engineering, Imperial College, London.
Douglas, J., O t 2001b. A riti al reappraisal of some problems in engineering
seismology. Ph.D. thesis, University of London.
Douglas, J., May 2002a. Errata of and additions to ESEE Report No. 01-1: `A
omprehensive worldwide summary of strong-motion attenuation relation-
ships for peak ground a eleration and spe tral ordinates (1969 to 2000)'.
SM Report 02-1, Department of Civil and Environmental Engineering, Im-
82
perial College, London.
Douglas, J., 2002b. Note on s aling of peak ground a eleration and peak
ground velo ity with magnitude. Geophysi al Journal International 148 (2),
336{339.
Draper, N. R., Smith, H., 1981. Applied Regression Analysis, 2nd Edition.
John Wiley & Sons.
Ekstr�om, G., Dziewonski, A. M., Mar 1988. Eviden e of bias in estimations of
earthquake size. Nature 332, 319{323.
Esteva, L., 1970. Seismi risk and seismi design. In: Hansen, R. (Ed.), Seismi
Design for Nu lear Power Plants. The M.I.T. Press, pp. 142{182.
Esteva, L., Villaverde, R., 1973. Seismi risk, design spe tra and stru tural
reliability. In: Pro eedings of Fifth World Conferen e on Earthquake Engi-
neering. Vol. 2. pp. 2586{2596.
Fa ioli, E., Jun 1978. Response spe tra for soft soil sites. In: Pro eedings of
the ASCE Geote hni al Engineering Division Spe iality Conferen e: Earth-
quake Engineering and Soil Dynami s. Vol. I. pp. 441{456.
Free, M. W., 1996. The attenuation of earthquake strong-motion in intraplate
regions. Ph.D. thesis, University of London.
Free, M. W., Ambraseys, N. N., Sarma, S. K., Feb 1998. Earthquake ground-
motion attenuation relations for stable ontinental intraplate regions. ESEE
Report 98-1, Department of Civil Engineering, Imperial College, London.
Fukushima, Y., Gariel, J.-C., Tanaka, R., 1994. Predi tion relations of seismi
motion parameters at depth using borehole data. In: Pro eedings of Tenth
European Conferen e on Earthquake Engineering. Vol. 1. pp. 417{422.
Fukushima, Y., Gariel, J.-C., Tanaka, R., De 1995. Site-dependent attenua-
tion relations of seismi motion parameters at depth using borehole data.
Bulletin of the Seismologi al So iety of Ameri a 85 (6), 1790{1804.
83
Fukushima, Y., Tanaka, T., 1990. A new attenuation relation for peak hori-
zontal a eleration of strong earthquake ground motion in Japan. Bulletin
of the Seismologi al So iety of Ameri a 80 (4), 757{783.
Fukushima, Y., Tanaka, T., Kataoka, S., 1988. A new attenuation relationship
for peak ground a eleration derived from strong-motion a elerograms. In:
Pro eedings of Ninth World Conferen e on Earthquake Engineering. Vol. II.
pp. 343{348.
Gar ia-Fernandez, M., Canas, J., 1995. Regional peak ground a eleration
estimates in the Iberian peninsula. In: Pro eedings of the Fifth International
Conferen e on Seismi Zonation. Vol. II. pp. 1029{1034.
Gariel, J.-C., Ar huleta, R. J., Bou hon, M., Aug 1990. Rupture pro ess of
an earthquake with kilometri size fault inferred from the modeling of near-
sour e re ords. Bulletin of the Seismologi al So iety of Ameri a 80 (4),
870{888.
Gaull, B. A., 1988. Attenuation of strong ground motion in spa e and time in
southwest Western Australia. In: Pro eedings of Ninth World Conferen e
on Earthquake Engineering. Vol. II. pp. 361{366.
Gubbins, D., 1990. Seismology and Plate Te toni s. Cambridge University
Press.
Hanks, T. C., Johnson, D. A., Jun 1976. Geophysi al assessment of peak
a elerations. Bulletin of the Seismologi al So iety of Ameri a 66 (3), 959{
968.
Hartzell, S., Helmberger, D. V., Apr 1982. Strong-motion modeling of the
Imperial Valley earthquake of 1979. Bulletin of the Seismologi al So iety of
Ameri a 72 (2), 571{596.
Hartzell, S. H., Heaton, T. H., De 1983. Inversion of strong ground motion
and teleseismi waveform data for the fault rupture history of the 1979
84
Imperial Valley, California, earthquake. Bulletin of the Seismologi al So iety
of Ameri a 73 (6), 1553{1583.
Herak, M., Panza, G. F., Costa, G., 2001. Theoreti al and observed depth
orre tion for m
s
. Pure and Applied Geophysi s 158 (8), 1517{1530.
Huo, J., Hu, Y., 1991. Attenuation laws onsidering the randomness of mag-
nitude and distan e. Earthquake Resear h in China 5 (1), 17{36.
Idriss, I. M., Jun 1978. Chara teristi s of earthquake ground motions. In: Pro-
eedings of the ASCE Geote hni al Engineering Division Spe iality Confer-
en e: Earthquake Engineering and Soil Dynami s. Vol. III. pp. 1151{1265.
Idriss, I. M., 1993. Pro edures for sele ting earthquake ground motions at ro k
sites. Te h. Rep. NIST GCR 93-625, National Institute of Standards and
Te hnology.
Iwasaki, T., Kawashima, K., Saeki, M., 1980. E�e ts of seismi and geote h-
ni al onditions on maximum ground a elerations and response spe tra.
In: Pro eedings of Seventh World Conferen e on Earthquake Engineering.
Vol. 2. pp. 183{190.
Ja ob, K. H., Gariel, J.-C., Armbruster, J., Hough, S., Friberg, P., Tuttle,
M., May 1990. Site-spe i� ground motion estimates for New York ity. In:
Pro eedings of the Fourth U.S. National Conferen e on Earthquake Engi-
neering. Vol. 1. pp. 587{596.
Jain, S. K., Roshan, A. D., Arlekar, J. N., Basu, P. C., Nov 2000. Empiri al
attenuation relationships for the Himalayan earthquakes based on Indian
strong motion data. In: Pro eedings of the Sixth International Conferen e
on Seismi Zonation.
Johnson, R. A., Aug 1973. An earthquake spe trum predi tion te hnique.
Bulletin of the Seismologi al So iety of Ameri a 63 (4), 1255{1274.
Joyner, W. B., Jul 1987. Strong-motion seismology. Reviews of Geophysi s
85
25 (6), 1149{1160.
Joyner, W. B., Boore, D. M., De 1981. Peak horizontal a eleration and
velo ity from strong-motion re ords in luding re ords from the 1979 Impe-
rial Valley, California, earthquake. Bulletin of the Seismologi al So iety of
Ameri a 71 (6), 2011{2038.
Joyner, W. B., Boore, D. M., O t 1983. Comments on \New attenuation re-
lations for peak and expe ted a elerations of strong ground motion," by
B.A. Bolt and N.A. Abrahamson. Bulletin of the Seismologi al So iety of
Ameri a 73 (5), 1479{1480.
Joyner, W. B., Boore, D. M., Jun 1988. Measurement, hara terization, and
predi tion of strong ground motion. In: Pro eedings of Earthquake Engi-
neering & Soil Dynami s II. Geote hni al Division, ASCE, pp. 43{102.
Joyner, W. B., Boore, D. M., Apr 1993. Methods for regression analysis of
strong-motion data. Bulletin of the Seismologi al So iety of Ameri a 83 (2),
469{487.
Joyner, W. B., Boore, D. M., Aug 1996. Re ent developments in strong motion
attenuation relationships. In: Pro eedings of the 28th Joint Meeting of the
U.S.-Japan Cooperative Program in Natural Resour e Panel on Wind and
Seismi E�e ts. pp. 101{116.
Joyner, W. B., Fumal, T. E., 1984. Use of measured shear-wave velo ity for
predi ting geologi site e�e ts on strong ground motion. In: Pro eedings of
Eighth World Conferen e on Earthquake Engineering. Vol. II. pp. 777{783.
Kamiyama, M., O t 1989. Regression analyses of strong-motion spe tra in
terms of a simpli�ed faulting sour e model. In: Pro eedings of the Fourth
International Conferen e on Soil Dynami s and Earthquake Engineering.
pp. 113{126.
Kamiyama, M., 1995. An attenuation model for the peak values of strong
86
ground motions with emphasis on lo al soil e�e ts. In: Pro eedings of the
First International Conferen e on Earthquake Geote hni al Engineering.
Vol. 1. pp. 579{585.
Kamiyama, M., O'Rourke, M., Flores-Berrones, R., Sep 1992. A semi-empiri al
analysis of strong-motion peaks in terms of seismi sour e, propagation path
and lo al site onditions. Te h. Rep. NCEER-92-0023, National Center for
Earthquake Engineering Resear h.
Kamiyama, M., Yanagisawa, E., Jun 1986. A statisi al model for estimating
response spe tra of strong earthquake ground motions with emphasis on
lo al soil onditions. Soils and Foundations 26 (2), 16{32.
Kawano, H., Takahashi, K., Takemura, M., Tohdo, M., Watanabe, T., Noda,
S., 2000. Empiri al response spe tral attenuations on the ro ks with VS =
0:5 to 3:0 km=s in Japan. In: Pro eedings of Twelfth World Conferen e on
Earthquake Engineering. Paper No. 0953.
Kawashima, K., Aizawa, K., Takahashi, K., 1984. Attenuation of peak ground
motion and absolute a eleration response spe tra. In: Pro eedings of
Eighth World Conferen e on Earthquake Engineering. Vol. II. pp. 257{264.
Kawashima, K., Aizawa, K., Takahashi, K., O t 1985. Attenuation of peak
ground motions and absolute a eleration response spe tra of verti al
earthquake ground motion. Pro eedings of JSCE Stru tural Engineer-
ing/Earthquake Engineering 2 (2), 415{422.
Kawashima, K., Aizawa, K., Takahashi, K., Mar{Apr 1986. Attenuation of
peak ground a eleration, velo ity and displa ement based on multiple re-
gression analysis of Japanese strong motion re ords. Earthquake Engineer-
ing and Stru tural Dynami s 14 (2), 199{215.
Kobayashi, H., Midorikawa, S., 1982. A semi-empiri al method for estimating
response spe tra of near-�eld ground motions with regard to fault rupture.
87
In: Pro eedings of Seventh European Conferen e on Earthquake Engineer-
ing. Vol. 2. pp. 161{168.
Kobayashi, H., Nagahashi, S., 1977. Response spe tra on seismi bedro k dur-
ing earthquake. In: Pro eedings of Sixth World Conferen e on Earthquake
Engineering. Vol. I. pp. 516{522.
Kobayashi, S., Takahashi, T., Matsuzaki, S., Mori, M., Fukushima, Y., Zhao,
J. X., Somerville, P. G., 2000. A spe tral attenuation model for Japan using
digital strong motion re ords of JMA87 type. In: Pro eedings of Twelfth
World Conferen e on Earthquake Engineering. Paper No. 2786.
Lawson, R. S., Krawinkler, H., 1994. Cumulative damage potential of seismi
ground motion. In: Pro eedings of Tenth European Conferen e on Earth-
quake Engineering. Vol. 2. pp. 1079{1086.
Lee, V. W., Jan 1993. S aling PSV from earthquake magnitude, lo al soil,
and geologi depth of sediments. Journal of The Geote hni al Engineering
Division, ASCE 119 (1), 108{126.
Lee, V. W., 1995. Pseudo relative velo ity spe tra in former Yugoslavia. Eu-
ropean Earthquake Engineering IX (1), 12{22.
Lee, V. W., Mani� , M., 1994. Empiri al s aling of response spe tra in former
Yugoslavia. In: Pro eedings of Tenth European Conferen e on Earthquake
Engineering. Vol. 4. pp. 2567{2572.
Lee, V. W., Trifuna , M. D., May 1995. Pseudo relative velo ity spe tra of
strong earthquake ground motion in California. Te h. Rep. CE 95-04, De-
partment of Civil Engineering, University of Southern California, Los An-
geles, California, U.S.A.
Lee, V. W., Trifuna , M. D., Todorovska, M. I., Novikova, E. I., Apr 1995. Em-
piri al equations des ribing attenuation of peak of strong ground motion, in
terms of magnitude, distan e, path e�e ts and site onditions. Te h. Rep.
88
CE 95-02, Department of Civil Engineering, University of Southern Califor-
nia, Los Angeles, California, U.S.A.
Lungu, D., Coman, O., Moldoveanu, T., Aug 1995a. Hazard analysis for
Vran ea earthquakes. Appli ation to Cernavoda NPP site in Romania. In:
Pro eedings of the 13th International Conferen e on Stru tural Me hani s
in Rea tor Te hnology. Division K, Paper No. 538.
Lungu, D., Cornea, T., Craifaleanu, I., Aldea, A., 1995b. Seismi zonation of
Romania based on uniform hazard response ordinates. In: Pro eedings of
the Fifth International Conferen e on Seismi Zonation. Vol. I. pp. 445{452.
Lungu, D., Cornea, T., Craifaleanu, I., Demetriu, S., Jun 1996. Probabilisti
seismi hazard analysis for inelasti stru tures on soft soils. In: Pro eedings
of Eleventh World Conferen e on Earthquake Engineering.
Lungu, D., Demetriu, S., Radu, C., Coman, O., 1994. Uniform hazard response
spe tra for Vran ea earthquakes in Romania. In: Pro eedings of Tenth Eu-
ropean Conferen e on Earthquake Engineering. Vol. 1. pp. 365{370.
Lussou, P., Bard, P. Y., Cotton, F., Fukushima, Y., Jan 2001. Seismi de-
sign regulation odes: Contribution of K-Net data to site e�e t evaluation.
Journal of Earthquake Engineering 5 (1), 13{33.
Mani , M. I., 1998. A new site dependent attenuation model for predi tion
of peak horizontal a eleration in Northwestern Balkan. In: Pro eedings of
Eleventh European Conferen e on Earthquake Engineering.
Marone, C., S holz, C. H., Jun 1998. The depth of seismi faulting and the
upper transition from stable to unstable slip regimes. Geophysi al Resear h
Letters 15 (6), 621{624.
M Cann Jr., M. W., E hezwia, H., 1984. Investigating the un ertainty in
ground motion predi tion. In: Pro eedings of Eighth World Conferen e on
Earthquake Engineering. Vol. II. pp. 297{304.
89
M Cue, K., De 1986. Strong motion attenuation in eastern Australia.
In: Earthquake Engineering Symposium. National Conferen e Publi ation
86/15. Institution of Engineers Australia, not seen. Reported in Free (1996).
M Cue, K., Gibson, G., Wesson, V., 1988. Intraplate re ording of strong mo-
tion in southeastern Australia. In: Pro eedings of Ninth World Conferen e
on Earthquake Engineering. Vol. II. pp. 355{360.
M Garr, A., May 1981. Analysis of peak ground motion in terms of a model
of inhomogenous faulting. Journal of Geophysi al Resear h 86 (B5), 3901{
3912.
M Garr, A., De 1982. Upper bounds on near-sour e peak ground motion
based on a model of inhomogeneous faulting. Bulletin of the Seismologi al
So iety of Ameri a 72 (6), 1825{1841.
M Guire, R. K., 1977. Seismi design spe tra and mapping pro edures using
hazard analysis based dire tly on os illator response. Earthquake Engineer-
ing and Stru tural Dynami s 5, 211{234.
M Guire, R. K., Apr 1978. Seismi ground motion parameter relations. Jour-
nal of The Geote hni al Engineering Division, ASCE 104 (GT4), 481{490.
M Verry, G. H., Dowri k, D. J., Sritharan, S., Cousins, W. J., Porritt, T. E.,
1993. Attenuation of peak ground a elerations in New Zealand. In: Pro-
eedings of the International Workshop on Strong Motion Data. Vol. 2. pp.
23{38, not seen. Cited in M Verry et al. (1995).
M Verry, G. H., Dowri k, D. J., Zhao, J. X., November 1995. Attenuation
of peak ground a elerations in New Zealand. In: Pa i� Conferen e on
Earthquake Engineering. Vol. 3. pp. 287{292.
M Verry, G. H., Zhao, J. X., Abrahamson, N. A., Somerville, P. G., 2000.
Crustal and subdu tion zone attenuation relations for New Zealand earth-
quakes. In: Pro eedings of Twelfth World Conferen e on Earthquake Engi-
90
neering. Paper No. 1834.
Milne, W. G., 1977. Seismi risk maps for Canada. In: Pro eedings of Sixth
World Conferen e on Earthquake Engineering. Vol. I. p. 930, 2-508.
Milne, W. G., Davenport, A. G., Apr 1969. Distribution of earthquake risk in
Canada. Bulletin of the Seismologi al So iety of Ameri a 59 (2), 729{754.
Mohammadioun, B., 1991. The predi tion of response spe tra for the anti-
seismi design of stru tures spe i� ity of data from intra ontinential envi-
ronments. European Earthquake Engineering V (2), 8{17.
Mohammadioun, B., 1994a. Predi tion of seismi motion at the bedro k from
the strong-motion data urrently available. In: Pro eedings of Tenth Euro-
pean Conferen e on Earthquake Engineering. Vol. 1. pp. 241{245.
Mohammadioun, G., 1994b. Cal ulation of site-adapted referen e spe tra from
the statisti al analysis of an extensive strong-motion data bank. In: Pro eed-
ings of Tenth European Conferen e on Earthquake Engineering. Vol. 1. pp.
177{181.
Molas, G. L., Yamazaki, F., O t 1995. Attenuation of earthquake ground mo-
tion in Japan in luding deep fo us events. Bulletin of the Seismologi al
So iety of Ameri a 85 (5), 1343{1358.
Molas, G. L., Yamazaki, F., Mar 1996. Attenuation of response spe tra in
Japan using new JMA re ords. Bulletin of Earthquake Resistant Stru ture
Resear h Center 29, 115{128.
Monguilner, C. A., Ponti, N., Pavoni, S. B., 2000a. Relationships between basi
ground motion parameters for earthquakes of the Argentine western region.
In: Pro eedings of Twelfth World Conferen e on Earthquake Engineering.
Paper no. 1195.
Monguilner, C. A., Ponti, N., Pavoni, S. B., Ri harte, D., 2000b. Statisti al
hara terization of the response spe tra in the Argentine Republi . In: Pro-
91
eedings of Twelfth World Conferen e on Earthquake Engineering. Paper
no. 1825.
Munson, C. G., Thurber, C. H., Aug 1997. Analysis of the attenuation of
strong ground motion on the island of Hawaii. Bulletin of the Seismologi al
So iety of Ameri a 87 (4), 945{960.
Musson, R. M. W., Marrow, P. C., Winter, P. W., May 1994. At-
tenuation of earthquake ground motion in the UK. Te h. Rep.
AEA/CS/16422000/ZJ745/004, AEA Te hnology Consultan y Servi es
(SRD) and British Geologi al Survey.
Niazi, M., Bozorgnia, Y., Jun 1991. Behaviour of near-sour e peak horizontal
and verti al ground motions over SMART-1 array, Taiwan. Bulletin of the
Seismologi al So iety of Ameri a 81 (3), 715{732.
Niazi, M., Bozorgnia, Y., 1992. Behaviour of near-sour e verti al and horizon-
tal response spe tra at SMART-1 array, Taiwan. Earthquake Engineering
and Stru tural Dynami s 21, 37{50.
Ohno, S., Ohta, T., Ikeura, T., Takemura, M., 1993. Revision of attenuation
formula onsidering the e�e t of fault size to evaluate strong motion spe tra
in near �eld. Te tonophysi s 218, 69{81.
Ohno, S., Takemura, M., Niwa, M., Takahashi, K., 1996. Intensity of strong
ground motion on pre-quaternary stratum and surfa e soil ampli� ations
during the 1995 Hyogo-ken Nanbu earthquake, Japan. Journal of Physi s of
the Earth 44 (5), 623{648.
Ohsaki, Y., Sawada, Y., Hayashi, K., Ohmura, B., Kumagai, C., 1980a. Spe -
tral hara teristi s of hard ro k motions. In: Pro eedings of Seventh World
Conferen e on Earthquake Engineering. Vol. 2. pp. 231{238.
Ohsaki, Y., Watabe, M., Tohdo, M., 1980b. Analyses on seismi ground motion
parameters in luding verti al omponents. In: Pro eedings of Seventh World
92
Conferen e on Earthquake Engineering. Vol. 2. pp. 97{104.
Olson, A. H., Apsel, R. J., De 1982. Finite faults and inverse theory with
appli ations to the 1979 Imperial Valley earthquake. Bulletin of the Seis-
mologi al So iety of Ameri a 72 (6), 1969{2001.
Orphal, D. L., Lahoud, J. A., O t 1974. Predi tion of peak ground motion
from earthquakes. Bulletin of the Seismologi al So iety of Ameri a 64 (5),
1563{1574.
Parvez, I. A., Gusev, A. A., Panza, G. F., Petukhin, A. G., 2001. Prelimi-
nary determination of the interdependen e among strong-motion amplitude,
earthquake magnitude and hypo entral distan e for the Himalayan region.
Geophysi al Journal International 144 (3), 577{596.
Peng, K.-Z., Wu, F. T., Song, L., May{Jun 1985. Attenuation hara teristi s of
peak horizontal a eleration in northeast and southwest China. Earthquake
Engineering and Stru tural Dynami s 13 (3), 337{350.
Perea, T., Sordo, E., 1998. Dire t response spe trum predi tion in luding lo al
site e�e ts. In: Pro eedings of Eleventh European Conferen e on Earthquake
Engineering.
Petrovski, D., Mar ellini, A., 1988. Predi tion of seismi movement of a site:
Statisi al approa h. In: Pro . UN Sem. on Predi t. of Earthquakes. Lisbon,
Portugal, 14{18 November. Not seen. Reported in Ambraseys and Bommer
(1995).
PML, 1982. British earthquakes. Te h. Rep. 115/82, Prin ipia Me hani a Ltd.,
London, not seen. Reported in Ambraseys et al. (1992).
PML, 1985. Seismologi al studies for UK hazard analysis. Te h. Rep. 346/85,
Prin ipia Me hani a Ltd., London, not seen. Reported in Ambraseys et al.
(1992).
Radu, C., Lungu, D., Demetriu, S., Coman, O., Sep 1994. Re urren e, atten-
93
uation and dynami ampli� ation for intermediate depth Vran ea earth-
quakes. In: Pro eedings of the XXIV General Assembly of the ESC. Vol.
III. pp. 1736{1745.
Ramazi, H. R., S henk, V., Sep 1994. Preliminary results obtained from strong
ground motion analzses [si ℄ of Iranian earthquakes. In: Pro eedings of the
XXIV General Assembly of the ESC. Vol. III. pp. 1762{1770.
Ri hter, C. F., 1958. Elementary Seismology. Freeman and Co., San Fran is o,
USA.
Rinaldis, D., Berardi, R., Theodulidis, N., Margaris, B., 1998. Empiri al pre-
di tive models based on a joint Italian & Greek strong-motion database: I,
peak ground a eleration and velo ity. In: Pro eedings of Eleventh Euro-
pean Conferen e on Earthquake Engineering.
Sabetta, F., Pugliese, A., O t 1987. Attenuation of peak horizontal a elera-
tion and velo ity from Italian strong-motion re ords. Bulletin of the Seis-
mologi al So iety of Ameri a 77 (5), 1491{1513.
Sabetta, F., Pugliese, A., Apr 1996. Estimation of response spe tra and simu-
lation of nonstationary earthquake ground motions. Bulletin of the Seismo-
logi al So iety of Ameri a 86 (2), 337{352.
Sadigh, K., Chang, C.-Y., Abrahamson, N. A., Chiou, S. J., Power, M. S., Mar
1993. Spe i� ation of long-period ground motions: Updated attenuation re-
lationships for ro k site onditions and adjustment fa tors for near-fault
e�e ts. In: Pro eedings of ATC-17-1 Seminar on Seismi Isolation, Passive
Energy Dissipation, and A tive Control. pp. 59{70.
Sadigh, K., Chang, C.-Y., Egan, J. A., Makdisi, F., Youngs, R. R., Jan/Feb
1997. Attenuation relationships for shallow rustal earthquakes based on
California strong motion data. Seismologi al Resear h Letters 68 (1), 180{
189.
94
Sadigh, R. K., Egan, J. A., 1998. Updated relationships for horizontal peak
ground velo ity and peak ground displa ement for shallow rustal earth-
quakes. In: Pro eedings of the Sixth U.S. National Conferen e on Earth-
quake Engineering.
Sarma, S. K., Free, M. W., November 1995. The omparision of attenuation re-
lationships for peak horizontal a eleration in intraplate regions. In: Pa i�
Conferen e on Earthquake Engineering. Vol. 2. pp. 175{184.
Sarma, S. K., Srbulov, M., Aug 1996. A simpli�ed method for predi tion of
kinemati soil-foundation intera tion e�e ts on peak horizontal a eleration
of a rigid foundation. Earthquake Engineering and Stru tural Dynami s
25 (8), 815{836.
Sarma, S. K., Srbulov, M., 1998. A uniform estimation of some basi ground
motion parameters. Journal of Earthquake Engineering 2 (2), 267{287.
S henk, V., 1982. Peak parti le ground motions in earthquake near-�eld. In:
Pro eedings of Seventh European Conferen e on Earthquake Engineering.
Vol. 2. pp. 211{217.
S henk, V., Mar 1984. Relations between ground motions and earthquake
magnitude, fo al distan e and epi entral intensity. Engineering Geology
20 (1/2), 143{151.
Sen, M. K., May 1990. Deep stru tural omplexity and site response in Los
Angeles basin. In: Pro eedings of the Fourth U.S. National Conferen e on
Earthquake Engineering. Vol. 1. pp. 545{553.
Shabestari, K. T., Yamazaki, F., 2000. Attenuation relation of response spe tra
in Japan onsidering site-spe i� term. In: Pro eedings of Twelfth World
Conferen e on Earthquake Engineering. Paper No. 1432.
Shabestari, T. K., Yamazaki, F., 1998. Attenuation of JMA seismi inten-
sity using re ent JMA re ords. In: Pro eedings of the 10th Japan Earth-
95
quake Engineering Symposium. Vol. 1. pp. 529{534, not seen. Reported in
Shabestari and Yamazaki (2000).
Sharma, M. L., Aug 1998. Attenuation relationship for estimation of peak
ground horizontal a eleration using data from strong-motion arrays in In-
dia. Bulletin of the Seismologi al So iety of Ameri a 88 (4), 1063{1069.
Sharma, M. L., 2000. Attenuation relationship for estimation of peak ground
verti al a eleration using data from strong motion arrays in India. In: Pro-
eedings of Twelfth World Conferen e on Earthquake Engineering. Paper
No. 1964.
Si, H., Midorikawa, S., 2000. New attenuation relations for peak ground a -
eleration and velo ity onsidering e�e ts of fault type and site ondition.
In: Pro eedings of Twelfth World Conferen e on Earthquake Engineering.
Paper No. 0532.
Sigbj�ornsson, R., 1990. Strong motion measurements in I eland and seismi
risk assessment. In: Pro eedings of Ninth European Conferen e on Earth-
quake Engineering. Vol. 10-A. pp. 215{222.
Sigbj�ornsson, R., Baldvinsson, G. I., 1992. Seismi hazard and re ordings of
strong ground motion in I eland. In: Pro eedings of Tenth World Confer-
en e on Earthquake Engineering. Vol. 1. pp. 419{424.
Simpson, K. A., 1996. Attenuation of strong ground-motion in orporating
near-surfa e foundation onditions. Ph.D. thesis, University of London.
Singh, R. P., Aman, A., Prasad, Y. J. J., 1996. Attenuation relations for
strong seismi ground motion in the Himalayan region. Pure and Applied
Geophysi s 147 (1), 161{180.
Singh, S. K., Gutierreez, C., Arboleda, J., Ordaz, M., 1993. Peligro s��smi o en
El Salvador. Te h. rep., Universidad Na ional Aut�onoma de M�exi o, M�exi o,
not seen. Reported in Bommer et al. (1996).
96
Singh, S. K., Mena, E., Castro, R., Carmona, C., O t 1987. Empiri al predi -
tion of ground motion in Mexi o City from oastal earthquakes. Bulletin of
the Seismologi al So iety of Ameri a 77 (5), 1862{1867.
Smit, P., Sep 1998. Strong motion attenuation model for entral Europe. In:
Pro eedings of Eleventh European Conferen e on Earthquake Engineering.
Smisma.
Smit, P., De 2000. Personal ommuni ation 4/12/2000.
Smit, P., Arzoumanian, V., Javakhishvili, Z., Are�ev, S., Mayer-Rosa, D., Bal-
assanian, S., Chelidze, T., 2000. The digital a elerograph network in the
Cau asus. In: Balassanian, S. (Ed.), Earthquake Hazard and Seismi Risk
Redu tion | Advan es in Natural and Te hnologi al Hazards Resear h.
Kluwer A ademi Publishers, presented at 2nd International Conferen e
on Earthquake Hazard and Seismi Risk Redu tion, Yerevan, Armenia,
15/9/1998{21/9/1998.
Spudi h, P., Flet her, J., Hellweg, M., Boatwright, J., Sullivan, C., Joyner, W.,
Hanks, T., Boore, D., M Garr, A., Baker, L., Lindh, A., 1996. Earthquake
ground motions in extensional te toni regimes. Open-File Report 96-292,
U.S. Geologi al Survey, not seen. Reported in Spudi h et al. (1997).
Spudi h, P., Flet her, J. B., Hellweg, M., Boatwright, J., Sullivan, C., Joyner,
W. B., Hanks, T. C., Boore, D. M., M Garr, A., Baker, L. M., Lindh,
A. G., Jan/Feb 1997. SEA96 | A new predi tive relation for earthquake
ground motions in extensional te toni regimes. Seismologi al Resear h Let-
ters 68 (1), 190{198.
Spudi h, P., Joyner, W. B., Lindh, A. G., Boore, D. M., Margaris, B. M.,
Flet her, J. B., O t 1999. SEA99: A revised ground motion predi tion re-
lation for use in extensional te toni regimes. Bulletin of the Seismologi al
So iety of Ameri a 89 (5), 1156{1170.
97
Suhadol , P., Chiaruttini, C., 1987. A theoreti al study of the dependen e
of the peak ground a eleration on sour e and stru ture parameters. In:
Erdik, M., Toks�oz, M. (Eds.), Strong Ground Motion Seismology. D. Reidel
Publishing Company, pp. 143{183.
Sun, F., Peng, K., 1993. Attenuation of strong ground motion in western
U.S.A. Earthquake Resear h in China 7 (1), 119{131.
Takahashi, T., Kobayashi, S., Fukushima, Y., Zhao, J. X., Nakamura, H.,
Somerville, P. G., Nov 2000. A spe tral attenuation model for Japan using
strong motion data base. In: Pro eedings of the Sixth International Confer-
en e on Seismi Zonation.
Tamura, K., Sasaki, Y., Aizawa, K., May 1990. Attenuation hara teristi s of
ground motions in the period range of 2 to 20 se onds | for appli ation to
the seismi design of long-period stru tures. In: Pro eedings of the Fourth
U.S. National Conferen e on Earthquake Engineering. Vol. 1. pp. 495{504.
Taylor Castillo, W., Santos Lopez, P., Dahle, A., Bungum, H., 1992. Digitiza-
tion of strong-motion data and estimation of PGA attenuation. Te h. Rep.
2-4, NORSAR, not seen. Reported in Bommer et al. (1996).
Tento, A., Fran es hina, L., Mar ellini, A., 1992. Expe ted ground motion
evaluation for Italian sites. In: Pro eedings of Tenth World Conferen e on
Earthquake Engineering. Vol. 1. pp. 489{494.
Theodulidis, N. P., Papaza hos, B. C., 1992. Dependen e of strong ground
motion on magnitude-distan e, site geology and ma roseismi intensity for
shallow earthquakes in Gree e: I, peak horizontal a eleration, velo ity and
displa ement. Soil Dynami s and Earthquake Engineering 11, 387{402.
Theodulidis, N. P., Papaza hos, B. C., 1994. Dependen e of strong ground
motion on magnitude-distan e, site geology and ma roseismi intensity for
shallow earthquakes in Gree e: II horizontal pseudovelo ity. Soil Dynami s
98
and Earthquake Engineering 13 (5), 317{343.
Tong, H., Katayama, T., 1988. Peak a eleration attenuation by eliminating
the ill-e�e t of the orrelation between magnitude and epi entral distan e.
In: Pro eedings of Ninth World Conferen e on Earthquake Engineering.
Vol. II. pp. 349{354.
Trifuna , M. D., Feb 1976. Preliminary analysis of the peaks of strong earth-
quake ground motion { dependen e of peaks on earthquake magnitude, epi-
entral distan e, and re ording site onditions. Bulletin of the Seismologi al
So iety of Ameri a 66 (1), 189{219.
Trifuna , M. D., 1977. Fore asting the spe tral amplitudes of strong earth-
quake ground motion. In: Pro eedings of Sixth World Conferen e on Earth-
quake Engineering. Vol. I. pp. 139{152.
Trifuna , M. D., O t 1978. Response spe tra of earthquake ground motions.
Journal of The Engineering Me hani s Division, ASCE 104 (EM5), 1081{
1097.
Trifuna , M. D., 1980. E�e ts of site geology on amplitudes of strong motion.
In: Pro eedings of Seventh World Conferen e on Earthquake Engineering.
Vol. 2. pp. 145{152.
Trifuna , M. D., Anderson, J. G., 1978. Preliminary empiri al models for
s aling pseudo relative velo ity spe tra. Te h. Rep. 78-04, Department of
Civil Engineering, University of Southern California, Los Angeles, Califor-
nia, U.S.A., not seen. Cited in Lee et al. (1995).
Trifuna , M. D., Brady, A. G., 1975. On the orrelation of peak a eleration
of strong motion with earthquake magnitude, epi entral distan e and site
onditions. In: Pro eedings of the U.S. National Conferen e on Earthquake
Engineering. pp. 43{52.
Trifuna , M. D., Brady, A. G., Jul{Sep 1976. Correlations of peak a eleration,
99
velo ity and displa ement with earthquake magnitude, distan e and site
onditions. Earthquake Engineering and Stru tural Dynami s 4 (5), 455{
471.
Trifuna , M. D., Lee, V. W., 1979. Dependen e of pseudo relative velo ity
spe tra of strong motion a eleration on depth of sedimentary deposits.
Te h. Rep. 79-10, Department of Civil Engineering, University of Southern
California, Los Angeles, California, U.S.A., not seen. Cited in Lee et al.
(1995).
Trifuna , M. D., Lee, V. W., 1985. Preliminary empiri al model for s aling
pseudo relative velo ity spe tra of strong earthquake a eleration in terms of
magnitude, distan e, site intensity and re ording site ondition. Te h. Rep.
85-04, Department of Civil Engineering, University of Southern California,
Los Angeles, California, U.S.A., not seen. Cited in Trifuna and Lee (1979).
Trifuna , M. D., Lee, V. W., Jul 1989. Empiri al models for s aling pseudo
relative velo ity spe tra of strong earthquake a elerations in terms of mag-
nitude, distan e, site intensity and re ording site onditions. Soil Dynami s
and Earthquake Engineering 8 (3), 126{144.
Tromans, I. J., Bommer, J. J., Sep 2002. The attenuation of strong-motion
peaks in Europe. In: Pro eedings of Twelfth European Conferen e on Earth-
quake Engineering. Paper no. 394.
Tsai, Y. B., Brady, F. W., Clu�, L. S., May 1990. An integrated approa h for
hara terization of ground motions in PG&E's long term seismi program
for Diablo Canyon. In: Pro eedings of the Fourth U.S. National Conferen e
on Earthquake Engineering. Vol. 1. pp. 597{606.
Wang, B.-Q., Wu, F. T., Bian, Y.-J., 1999. Attenuation hara teris-
ti s of peak a ele-ration in north China and omparison with those
in the eastern part of North Ameri a. A ta Seismologi a Sini a
100
12 (1), on internet at: http://www. hinainfo.gov. n/periodi al/dizhen-
E/dzxb99/dzxb9901/990104.htm.
Wang, G., Tao, X., Nov 2000. A new two-stage pro edure for �tting atten-
uation relationship of strong ground motion. In: Pro eedings of the Sixth
International Conferen e on Seismi Zonation.
Wells, D. L., Coppersmith, K. J., Aug 1994. New empiri al relationships
among magnitude, rupture length, rupture width, rupture area, and sur-
fa e displa ement. Bulletin of the Seismologi al So iety of Ameri a 84 (4),
974{1002.
Xiang, J., Gao, D., 1994. The attenuation law of horizontal peak a eleration
on the ro k site in Yunnan area. Earthquake Resear h in China 8 (4), 509{
516.
Xu, Z., Shen, X., Hong, J., 1984. Attenuation relation of ground motion in
northern China. In: Pro eedings of Eighth World Conferen e on Earthquake
Engineering. Vol. II. pp. 335{342.
Yamabe, K., Kanai, K., 1988. An empiri al formula on the attenuation of
the maximum a eleration of earthquake motions. In: Pro eedings of Ninth
World Conferen e on Earthquake Engineering. Vol. II. pp. 337{342.
Yokota, H., Shiba, K., Okada, K., 1988. The hara teristi s of underground
earthquake motions observed in the mud stone layer in Tokyo. In: Pro eed-
ings of Ninth World Conferen e on Earthquake Engineering. Vol. II. pp.
429{434.
Youngs, R. R., Chiou, S.-J., Silva, W. J., Humphrey, J. R., Jan/Feb 1997.
Strong ground motion attenuation relationships for subdu tion zone earth-
quakes. Seismologi al Resear h Letters 68 (1), 58{73.
Youngs, R. R., Day, S. M., Stevens, J. L., Jun 1988. Near �eld ground motions
on ro k for large subdu tion earthquakes. In: Pro eedings of Earthquake
101
Engineering & Soil Dynami s II. Geote hni al Division, ASCE, pp. 445{
462.
Zhao, J. X., Dowri k, D. J., M Verry, G. H., Jun 1997. Attenuation of
peak ground a eleration in New Zealand earthquakes. Bulletin of the New
Zealand National So iety for Earthquake Engineering 30 (2), 133{158.
Zhou, X., Su, J., Wang, G., 1989. A modi� ation of the fault-rupture model
and its appli ation in seismi hazard analysis. Earthquake Resear h in China
3 (4), 351{365.
102
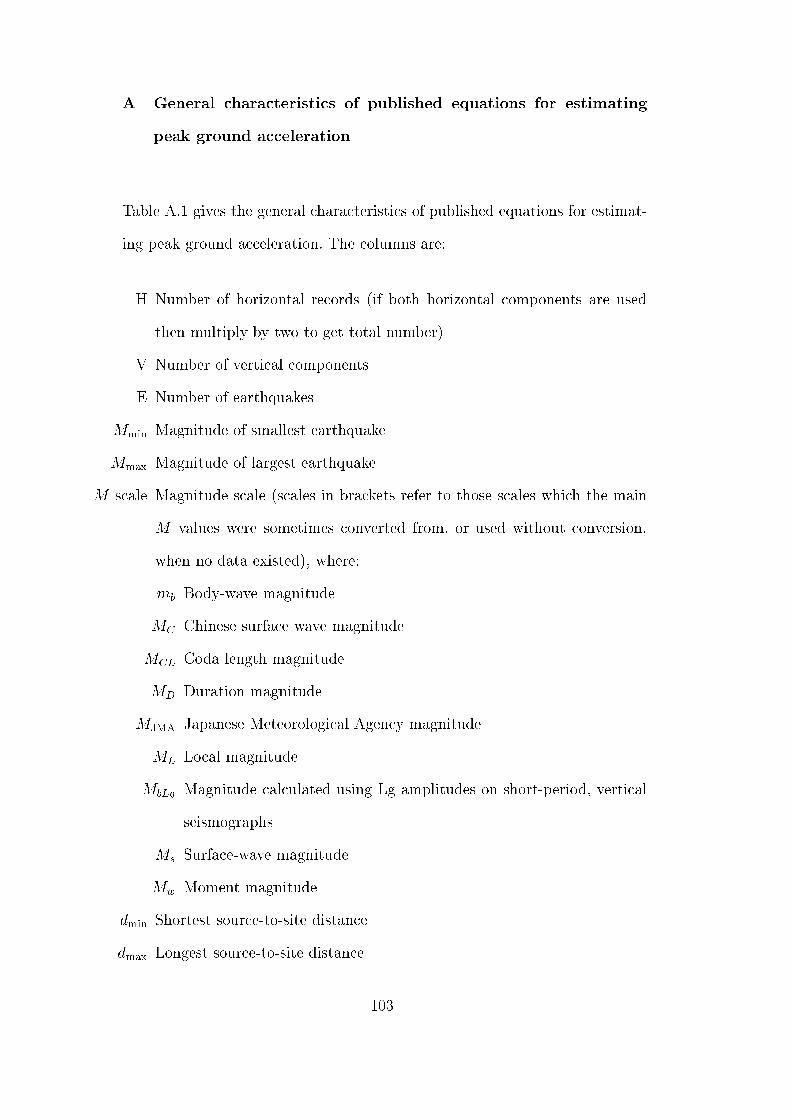
A General hara teristi s of published equations for estimating
peak ground a eleration
Table A.1 gives the general hara teristi s of published equations for estimat-
ing peak ground a eleration. The olumns are:
H Number of horizontal re ords (if both horizontal omponents are used
then multiply by two to get total number)
V Number of verti al omponents
E Number of earthquakes
M
min
Magnitude of smallest earthquake
M
max
Magnitude of largest earthquake
M s ale Magnitude s ale (s ales in bra kets refer to those s ales whi h the main
M values were sometimes onverted from, or used without onversion,
when no data existed), where:
m
b
Body-wave magnitude
M
C
Chinese surfa e wave magnitude
M
CL
Coda length magnitude
M
D
Duration magnitude
M
JMA
Japanese Meteorologi al Agen y magnitude
M
L
Lo al magnitude
M
bLg
Magnitude al ulated using Lg amplitudes on short-period, verti al
seismographs
M
s
Surfa e-wave magnitude
M
w
Moment magnitude
d
min
Shortest sour e-to-site distan e
d
max
Longest sour e-to-site distan e
103
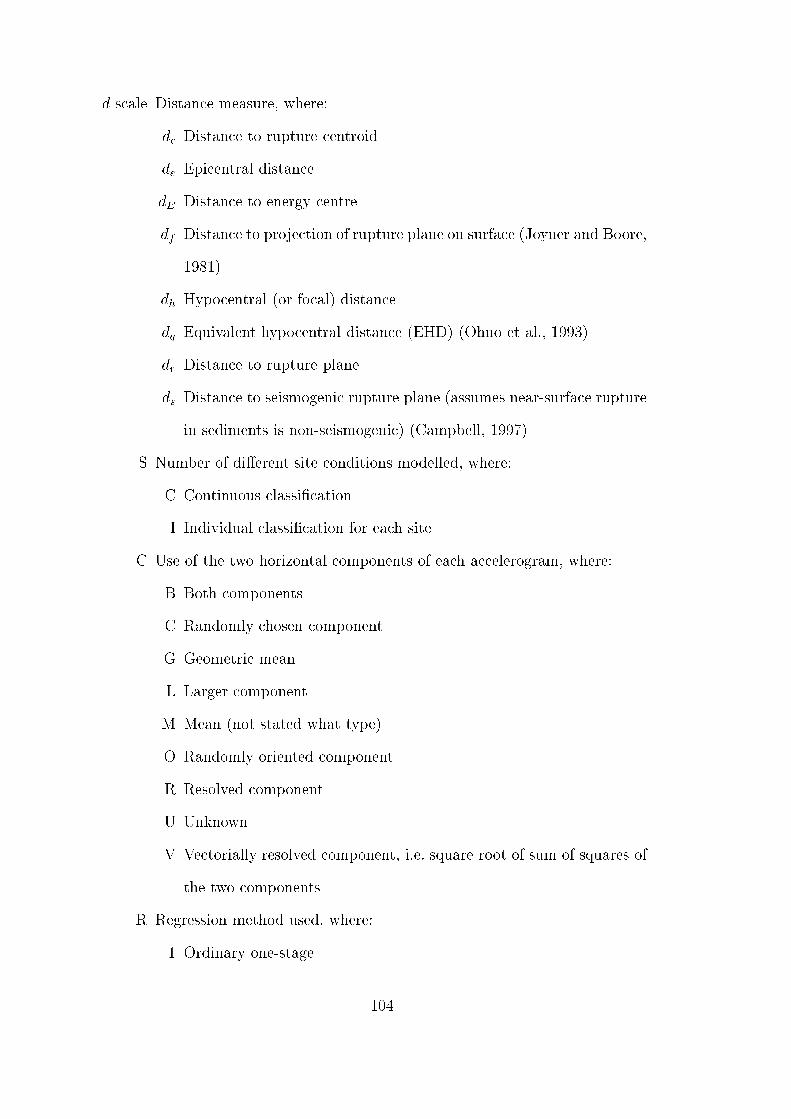
d s ale Distan e measure, where:
d
Distan e to rupture entroid
d
e
Epi entral distan e
d
E
Distan e to energy entre
d
f
Distan e to proje tion of rupture plane on surfa e (Joyner and Boore,
1981)
d
h
Hypo entral (or fo al) distan e
d
q
Equivalent hypo entral distan e (EHD) (Ohno et al., 1993)
d
r
Distan e to rupture plane
d
s
Distan e to seismogeni rupture plane (assumes near-surfa e rupture
in sediments is non-seismogeni ) (Campbell, 1997)
S Number of di�erent site onditions modelled, where:
C Continuous lassi� ation
I Individual lassi� ation for ea h site
C Use of the two horizontal omponents of ea h a elerogram, where:
B Both omponents
C Randomly hosen omponent
G Geometri mean
L Larger omponent
M Mean (not stated what type)
O Randomly oriented omponent
R Resolved omponent
U Unknown
V Ve torially resolved omponent, i.e. square root of sum of squares of
the two omponents
R Regression method used, where:
1 Ordinary one-stage
104

1B Bayesian one-stage
1M Maximum likelihood one-stage (Joyner and Boore, 1993)
1W Weighted one-stage
2 Two-stage (Joyner and Boore, 1981)
2M Maximum likelihood two-stage (Joyner and Boore, 1993)
2W Two-stage with se ond staged weighted as des ribed in Joyner and
Boore (1988)
O Other method
U Unknown
M Sour e me hanisms (and te toni type) of earthquakes (letters in bra kets
refer to those me hanism whi h are separately modelled), where:
A All (this is assumed if no information is given in the referen e)
B Interslab
F Interfa e
I Intraplate
N Normal
O Oblique
R Reverse
S Strike-slip
T Thrust
`+' refers to extra re ords from outside region used to supplement data. (. . . )
refer either to magnitudes of supplementing re ords or to those used for part of
analysis. * means information is approximate be ause either read from graph
or found in another way.
105
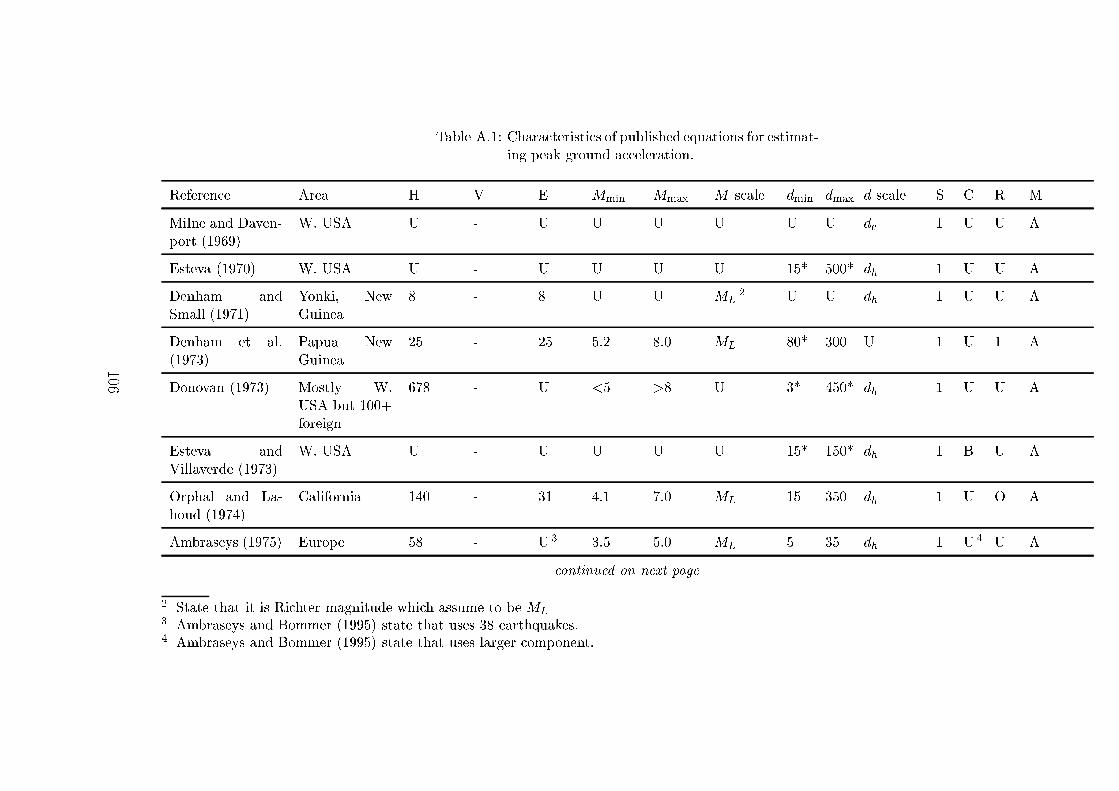
Table A.1: Chara teristi s of published equations for estimat-
ing peak ground a eleration.
Referen e Area H V E M
min
M
max
M s ale d
min
d
max
d s ale S C R M
Milne and Daven-
port (1969)
W. USA U - U U U U U U d
e
1 U U A
Esteva (1970) W. USA U - U U U U 15* 500* d
h
1 U U A
Denham and
Small (1971)
Yonki, New
Guinea
8 - 8 U U M
L
2
U U d
h
1 U U A
Denham et al.
(1973)
Papua New
Guinea
25 - 25 5.2 8.0 M
L
80* 300 U 1 U 1 A
Donovan (1973) Mostly W.
USA but 100+
foreign
678 - U <5 >8 U 3* 450* d
h
1 U U A
Esteva and
Villaverde (1973)
W. USA U - U U U U 15* 150* d
h
1 B U A
Orphal and La-
houd (1974)
California 140 - 31 4.1 7.0 M
L
15 350 d
h
1 U O A
Ambraseys (1975) Europe 58 - U
3
3.5 5.0 M
L
5 35 d
h
1 U
4
U A
ontinued on next page
2
State that it is Ri hter magnitude whi h assume to be M
L
3
Ambraseys and Bommer (1995) state that uses 38 earthquakes.
4
Ambraseys and Bommer (1995) state that uses larger omponent.
106
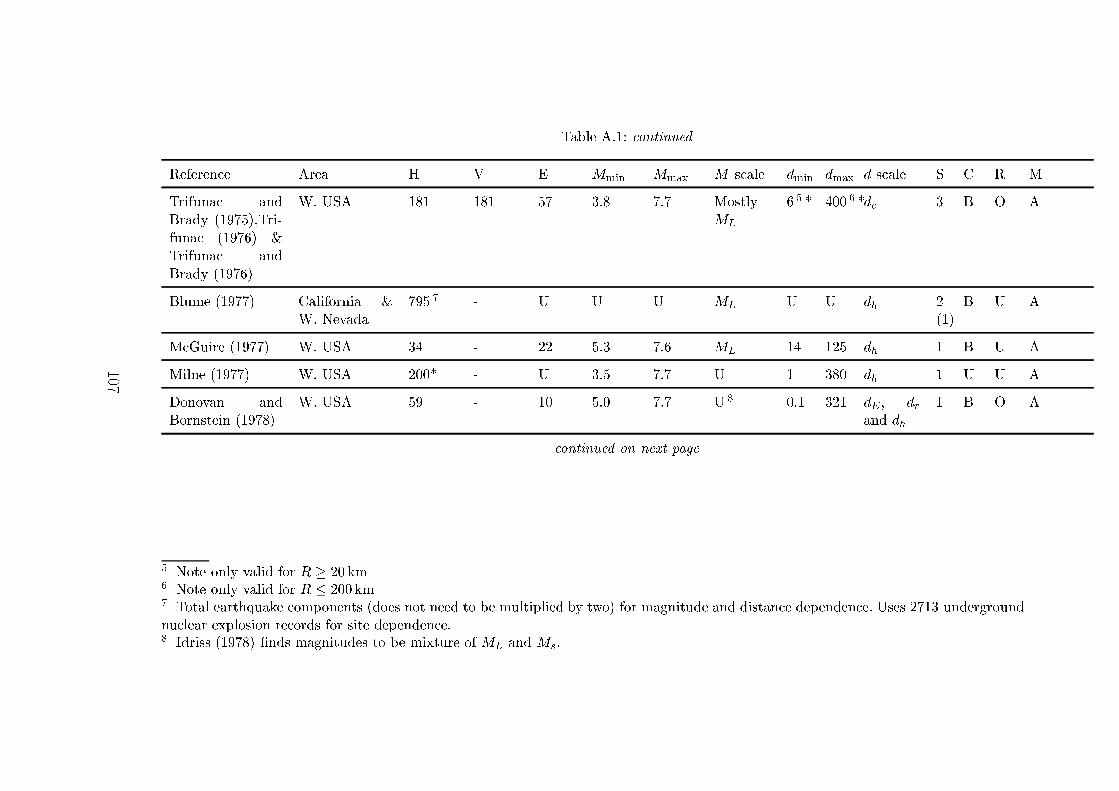
Table A.1: ontinued
Referen e Area H V E M
min
M
max
M s ale d
min
d
max
d s ale S C R M
Trifuna and
Brady (1975),Tri-
funa (1976) &
Trifuna and
Brady (1976)
W. USA 181 181 57 3.8 7.7 Mostly
M
L
6
5
* 400
6
*d
e
3 B O A
Blume (1977) California &
W. Nevada
795
7
- U U U M
L
U U d
h
2(1)
B U A
M Guire (1977) W. USA 34 - 22 5.3 7.6 M
L
14 125 d
h
1 B U A
Milne (1977) W. USA 200* - U 3.5 7.7 U 1 380 d
h
1 U U A
Donovan and
Bornstein (1978)
W. USA 59 - 10 5.0 7.7 U
8
0.1 321 d
E
, d
r
and d
h
1 B O A
ontinued on next page
5
Note only valid for R � 20 km
6
Note only valid for R � 200 km
7
Total earthquake omponents (does not need to be multiplied by two) for magnitude and distan e dependen e. Uses 2713 underground
nu lear explosion re ords for site dependen e.
8
Idriss (1978) �nds magnitudes to be mixture of M
L
and M
s
.
107
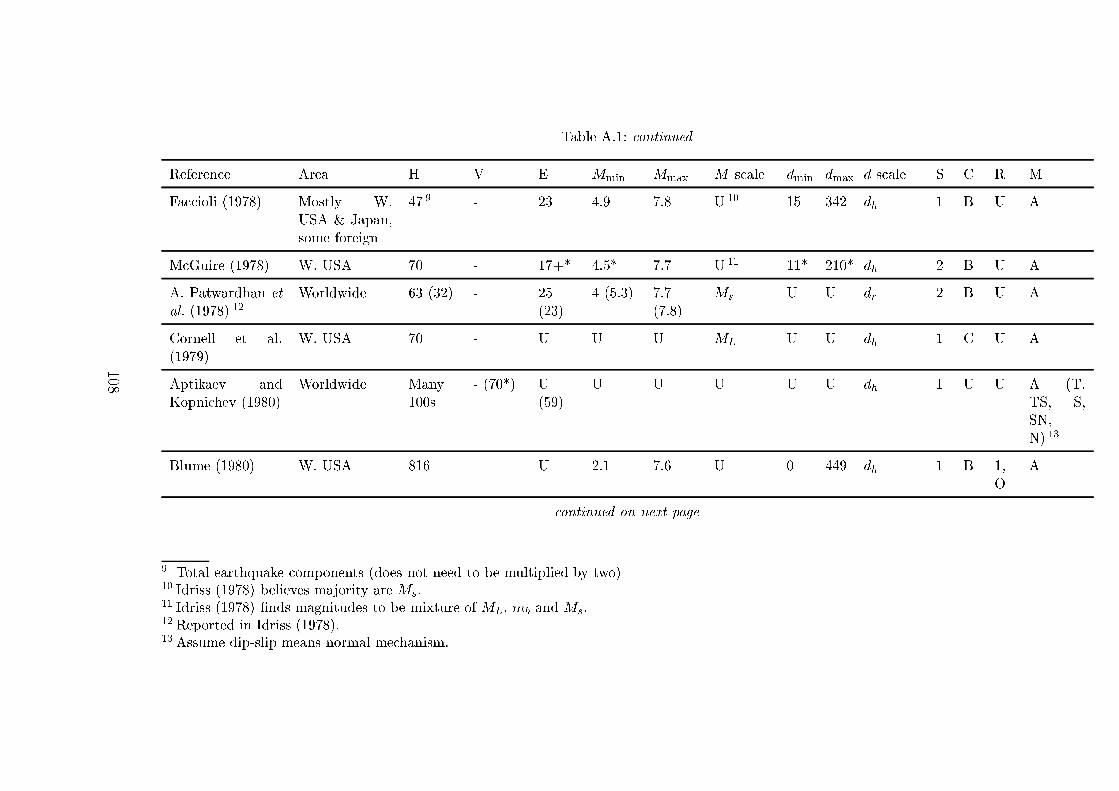
Table A.1: ontinued
Referen e Area H V E M
min
M
max
M s ale d
min
d
max
d s ale S C R M
Fa ioli (1978) Mostly W.
USA & Japan,
some foreign
47
9
- 23 4.9 7.8 U
10
15 342 d
h
1 B U A
M Guire (1978) W. USA 70 - 17+* 4.5* 7.7 U
11
11* 210* d
h
2 B U A
A. Patwardhan et
al. (1978)
12
Worldwide 63 (32) - 25
(23)
4 (5.3) 7.7
(7.8)
M
s
U U d
r
2 B U A
Cornell et al.
(1979)
W. USA 70 - U U U M
L
U U d
h
1 C U A
Aptikaev and
Kopni hev (1980)
Worldwide Many
100s
- (70*) U(59)
U U U U U d
h
1 U U A (T,
TS, S,
SN,
N)
13
Blume (1980) W. USA 816 - U 2.1 7.6 U 0 449 d
h
1 B 1,
O
A
ontinued on next page
9
Total earthquake omponents (does not need to be multiplied by two)
10
Idriss (1978) believes majority are M
s
.
11
Idriss (1978) �nds magnitudes to be mixture of M
L
, m
b
and M
s
.
12
Reported in Idriss (1978).
13
Assume dip-slip means normal me hanism.
108
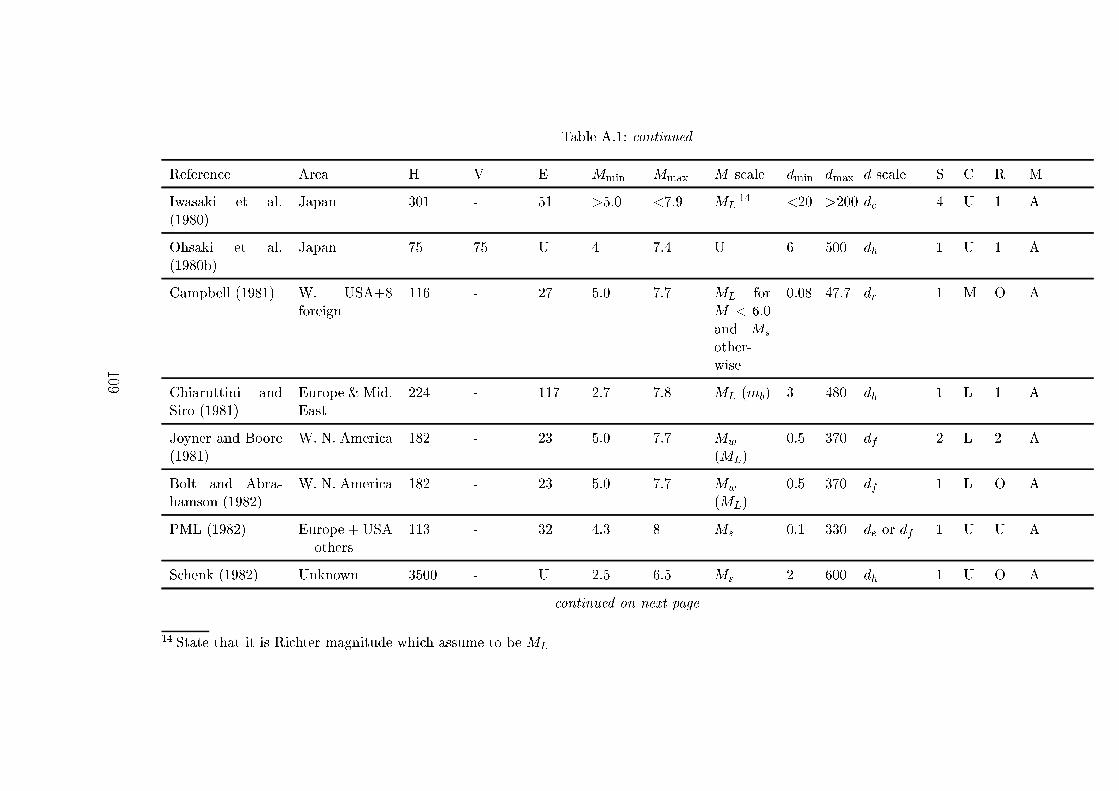
Table A.1: ontinued
Referen e Area H V E M
min
M
max
M s ale d
min
d
max
d s ale S C R M
Iwasaki et al.
(1980)
Japan 301 - 51 >5.0 <7.9 M
L
14
<20 >200 d
e
4 U 1 A
Ohsaki et al.
(1980b)
Japan 75 75 U 4 7.4 U 6 500 d
h
1 U 1 A
Campbell (1981) W. USA+8
foreign
116 - 27 5.0 7.7 M
L
for
M < 6:0
and M
s
other-
wise
0.08 47.7 d
r
1 M O A
Chiaruttini and
Siro (1981)
Europe & Mid.
East
224 - 117 2.7 7.8 M
L
(m
b
) 3 480 d
h
1 L 1 A
Joyner and Boore
(1981)
W. N. Ameri a 182 - 23 5.0 7.7 M
w
(M
L
)
0.5 370 d
f
2 L 2 A
Bolt and Abra-
hamson (1982)
W. N. Ameri a 182 - 23 5.0 7.7 M
w
(M
L
)
0.5 370 d
f
1 L O A
PML (1982) Europe + USA
+ others
113 - 32 4.3 8 M
s
0.1 330 d
e
or d
f
1 U U A
S henk (1982) Unknown 3500 - U 2.5 6.5 M
s
2 600 d
h
1 U O A
ontinued on next page
14
State that it is Ri hter magnitude whi h assume to be M
L
109
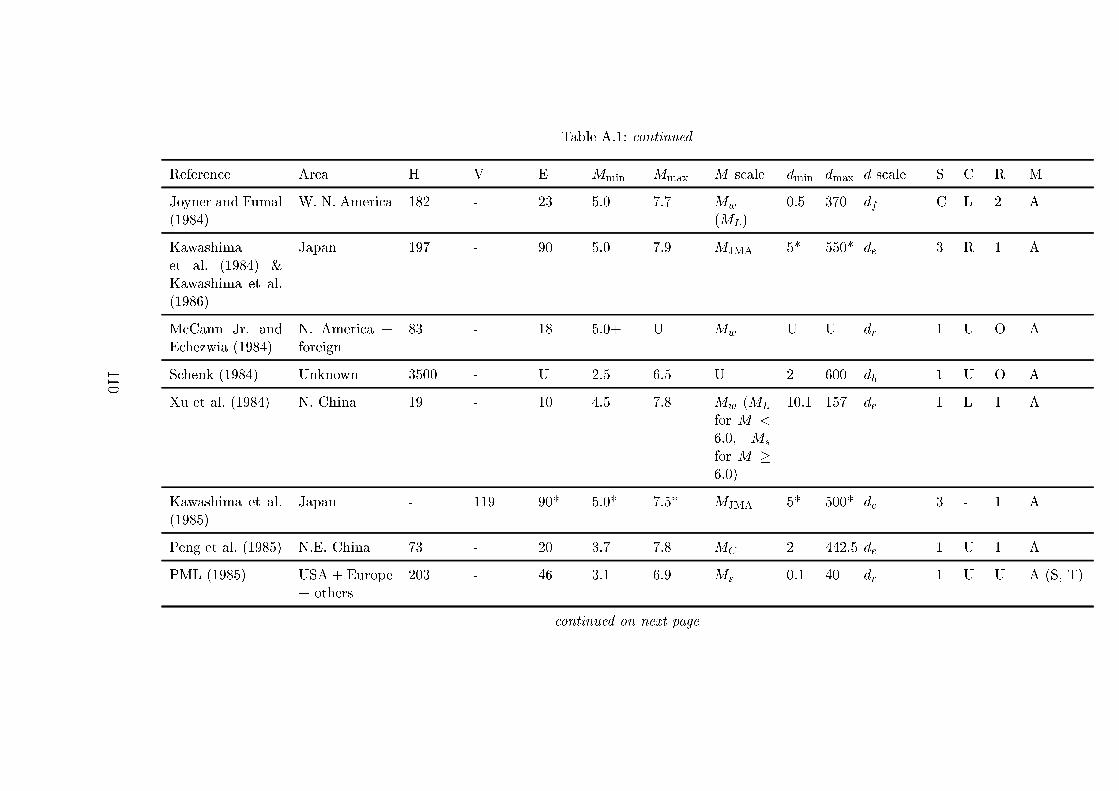
Table A.1: ontinued
Referen e Area H V E M
min
M
max
M s ale d
min
d
max
d s ale S C R M
Joyner and Fumal
(1984)
W. N. Ameri a 182 - 23 5.0 7.7 M
w
(M
L
)
0.5 370 d
f
C L 2 A
Kawashima
et al. (1984) &
Kawashima et al.
(1986)
Japan 197 - 90 5.0 7.9 M
JMA
5* 550* d
e
3 R 1 A
M Cann Jr. and
E hezwia (1984)
N. Ameri a +
foreign
83 - 18 5:0+ U M
w
U U d
r
1 U O A
S henk (1984) Unknown 3500 - U 2.5 6.5 U 2 600 d
h
1 U O A
Xu et al. (1984) N. China 19 - 10 4.5 7.8 M
w
(M
L
for M <
6:0, M
s
for M �
6:0)
10.1 157 d
e
1 L 1 A
Kawashima et al.
(1985)
Japan - 119 90* 5.0* 7.5* M
JMA
5* 500* d
e
3 - 1 A
Peng et al. (1985) N.E. China 73 - 20 3.7 7.8 M
C
2 442.5 d
e
1 U 1 A
PML (1985) USA + Europe
+ others
203 - 46 3.1 6.9 M
s
0.1 40 d
r
1 U U A (S, T)
ontinued on next page
110
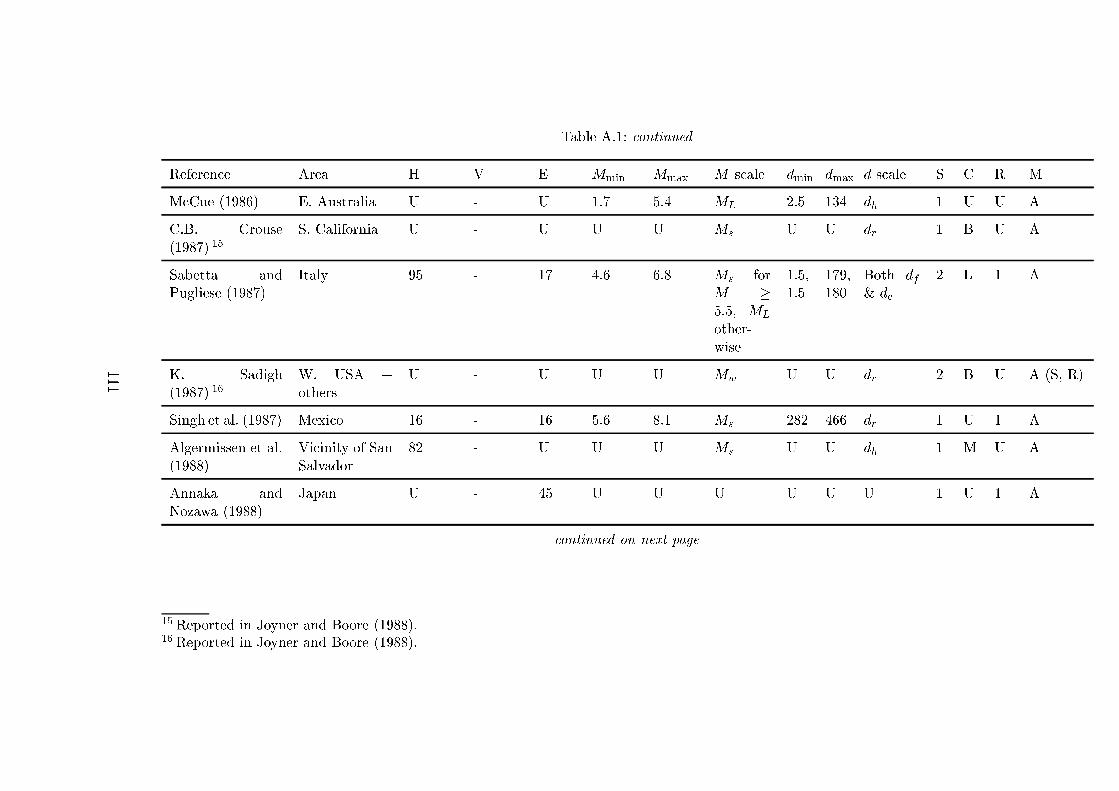
Table A.1: ontinued
Referen e Area H V E M
min
M
max
M s ale d
min
d
max
d s ale S C R M
M Cue (1986) E. Australia U - U 1.7 5.4 M
L
2.5 134 d
h
1 U U A
C.B. Crouse
(1987)
15
S. California U - U U U M
s
U U d
r
1 B U A
Sabetta and
Pugliese (1987)
Italy 95 - 17 4.6 6.8 M
s
for
M �
5:5, M
L
other-
wise
1.5,
1.5
179,
180
Both d
f
& d
e
2 L 1 A
K. Sadigh
(1987)
16
W. USA +
others
U - U U U M
w
U U d
r
2 B U A (S, R)
Singh et al. (1987) Mexi o 16 - 16 5.6 8.1 M
s
282 466 d
r
1 U 1 A
Algermissen et al.
(1988)
Vi inity of San
Salvador
82 - U U U M
s
U U d
h
1 M U A
Annaka and
Nozawa (1988)
Japan U - 45 U U U U U U 1 U 1 A
ontinued on next page
15
Reported in Joyner and Boore (1988).
16
Reported in Joyner and Boore (1988).
111
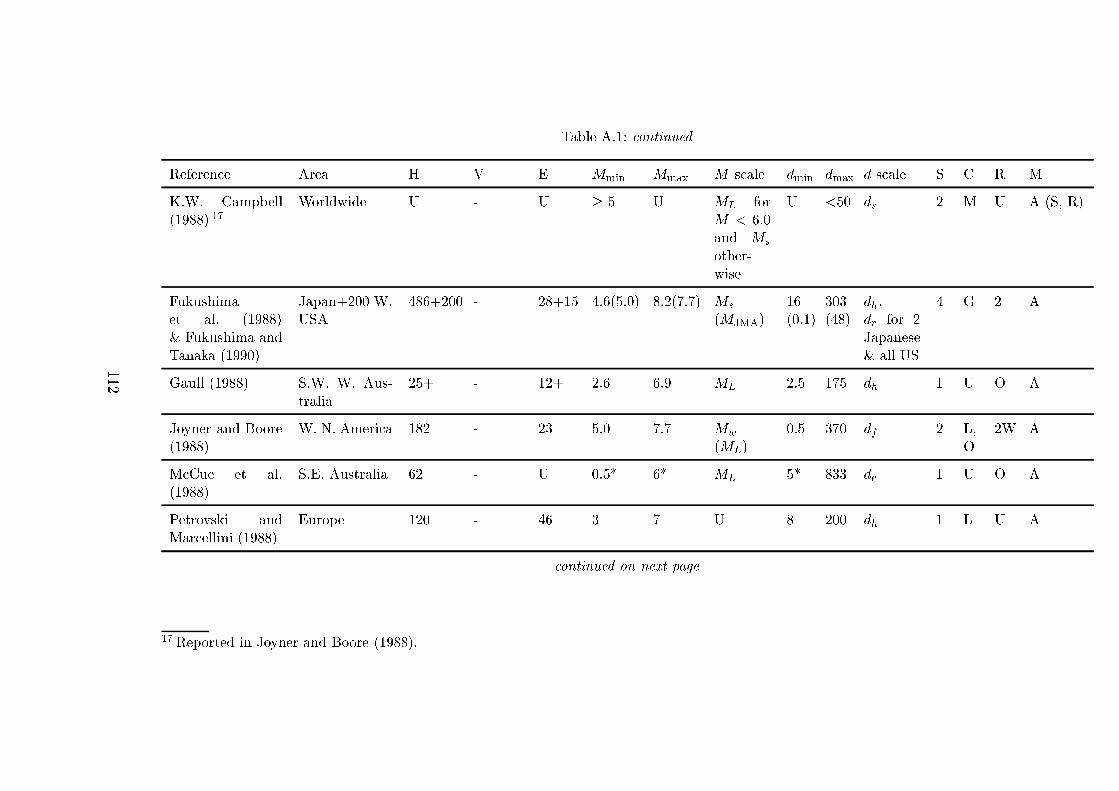
Table A.1: ontinued
Referen e Area H V E M
min
M
max
M s ale d
min
d
max
d s ale S C R M
K.W. Campbell
(1988)
17
Worldwide U - U � 5 U M
L
for
M < 6:0
and M
s
other-
wise
U <50 d
s
2 M U A (S, R)
Fukushima
et al. (1988)
& Fukushima and
Tanaka (1990)
Japan+200 W.
USA
486+200 - 28+15 4.6(5.0) 8.2(7.7) M
s
(M
JMA
)
16
(0.1)
303
(48)
d
h
,
d
r
for 2
Japanese
& all US
4 G 2 A
Gaull (1988) S.W. W. Aus-
tralia
25+ - 12+ 2.6 6.9 M
L
2.5 175 d
h
1 U O A
Joyner and Boore
(1988)
W. N. Ameri a 182 - 23 5.0 7.7 M
w
(M
L
)
0.5 370 d
f
2 L,
O
2W A
M Cue et al.
(1988)
S.E. Australia 62 - U 0.5* 6* M
L
5* 833 d
e
1 U O A
Petrovski and
Mar ellini (1988)
Europe 120 - 46 3 7 U 8 200 d
h
1 L U A
ontinued on next page
17
Reported in Joyner and Boore (1988).
112
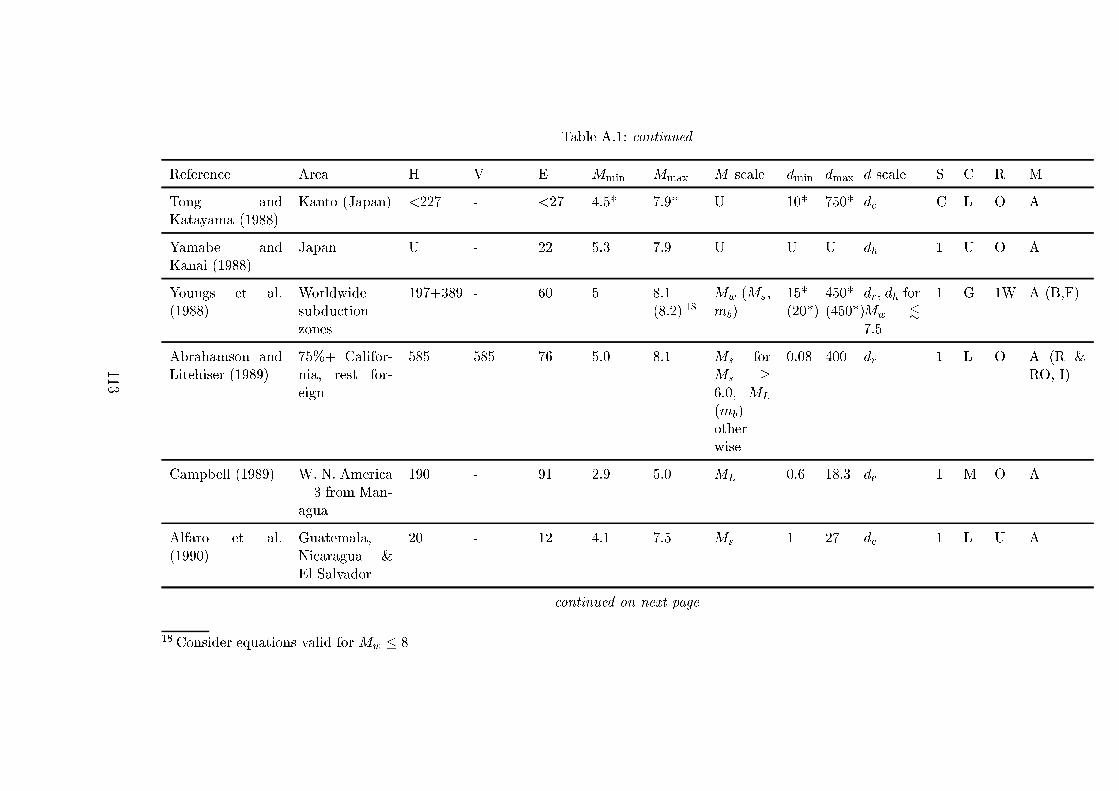
Table A.1: ontinued
Referen e Area H V E M
min
M
max
M s ale d
min
d
max
d s ale S C R M
Tong and
Katayama (1988)
Kanto (Japan) <227 - <27 4.5* 7.9* U 10* 750* d
e
C L O A
Yamabe and
Kanai (1988)
Japan U - 22 5.3 7.9 U U U d
h
1 U O A
Youngs et al.
(1988)
Worldwide
subdu tion
zones
197+389 - 60 5 8.1
(8.2)
18
M
w
(M
s
,
m
b
)
15*
(20*)
450*
(450*)
d
r
, d
h
for
M
w
.
7:5
1 G 1W A (B,F)
Abrahamson and
Litehiser (1989)
75%+ Califor-
nia, rest for-
eign
585 585 76 5.0 8.1 M
s
for
M
s
�
6:0, M
L
(m
b
)
other-
wise
0.08 400 d
r
1 L O A (R &
RO, I)
Campbell (1989) W. N. Ameri a
+ 3 from Man-
agua
190 - 91 2.9 5.0 M
L
0.6 18.3 d
e
1 M O A
Alfaro et al.
(1990)
Guatemala,
Ni aragua &
El Salvador
20 - 12 4.1 7.5 M
s
1 27 d
e
1 L U A
ontinued on next page
18
Consider equations valid for M
w
� 8
113
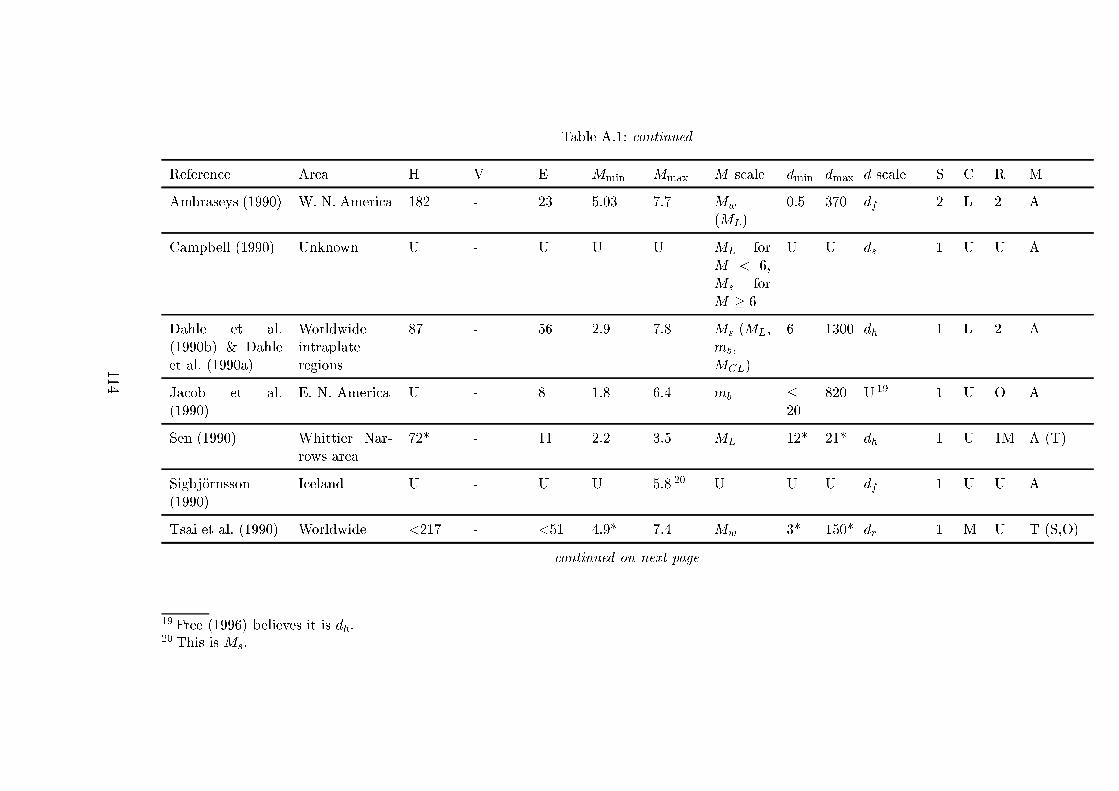
Table A.1: ontinued
Referen e Area H V E M
min
M
max
M s ale d
min
d
max
d s ale S C R M
Ambraseys (1990) W. N. Ameri a 182 - 23 5.03 7.7 M
w
(M
L
)
0.5 370 d
f
2 L 2 A
Campbell (1990) Unknown U - U U U M
L
for
M < 6,
M
s
for
M � 6
U U d
s
1 U U A
Dahle et al.
(1990b) & Dahle
et al. (1990a)
Worldwide
intraplate
regions
87 - 56 2.9 7.8 M
s
(M
L
,
m
b
,
M
CL
)
6 1300 d
h
1 L 2 A
Ja ob et al.
(1990)
E. N. Ameri a U - 8 1.8 6.4 m
b
�20
820 U
19
1 U O A
Sen (1990) Whittier Nar-
rows area
72* - 11 2.2 3.5 M
L
12* 21* d
h
1 U 1M A (T)
Sigbj�ornsson
(1990)
I eland U - U U 5.8
20
U U U d
f
1 U U A
Tsai et al. (1990) Worldwide <217 - <51 4.9* 7.4 M
w
3* 150* d
r
1 M U T (S,O)
ontinued on next page
19
Free (1996) believes it is d
h
.
20
This is M
s
.
114
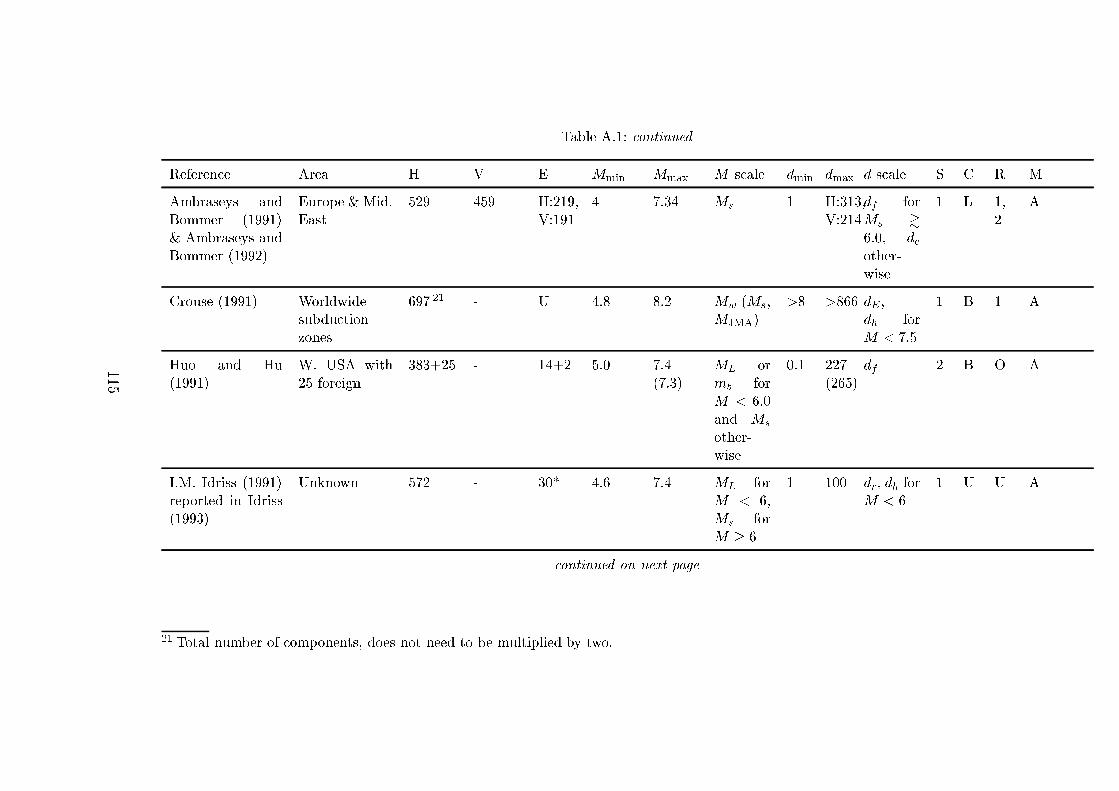
Table A.1: ontinued
Referen e Area H V E M
min
M
max
M s ale d
min
d
max
d s ale S C R M
Ambraseys and
Bommer (1991)
& Ambraseys and
Bommer (1992)
Europe & Mid.
East
529 459 H:219,
V:191
4 7.34 M
s
1 H:313,
V:214
d
f
for
M
s
&
6:0, d
e
other-
wise
1 L 1,
2
A
Crouse (1991) Worldwide
subdu tion
zones
697
21
- U 4.8 8.2 M
w
(M
s
,
M
JMA
)
>8 >866 d
E
,
d
h
for
M < 7:5
1 B 1 A
Huo and Hu
(1991)
W. USA with
25 foreign
383+25 - 14+2 5.0 7.4
(7.3)
M
L
or
m
b
for
M < 6:0
and M
s
other-
wise
0.1 227
(265)
d
f
2 B O A
I.M. Idriss (1991)
reported in Idriss
(1993)
Unknown 572 - 30* 4.6 7.4 M
L
for
M < 6,
M
s
for
M � 6
1 100 d
r
, d
h
for
M < 6
1 U U A
ontinued on next page
21
Total number of omponents, does not need to be multiplied by two.
115
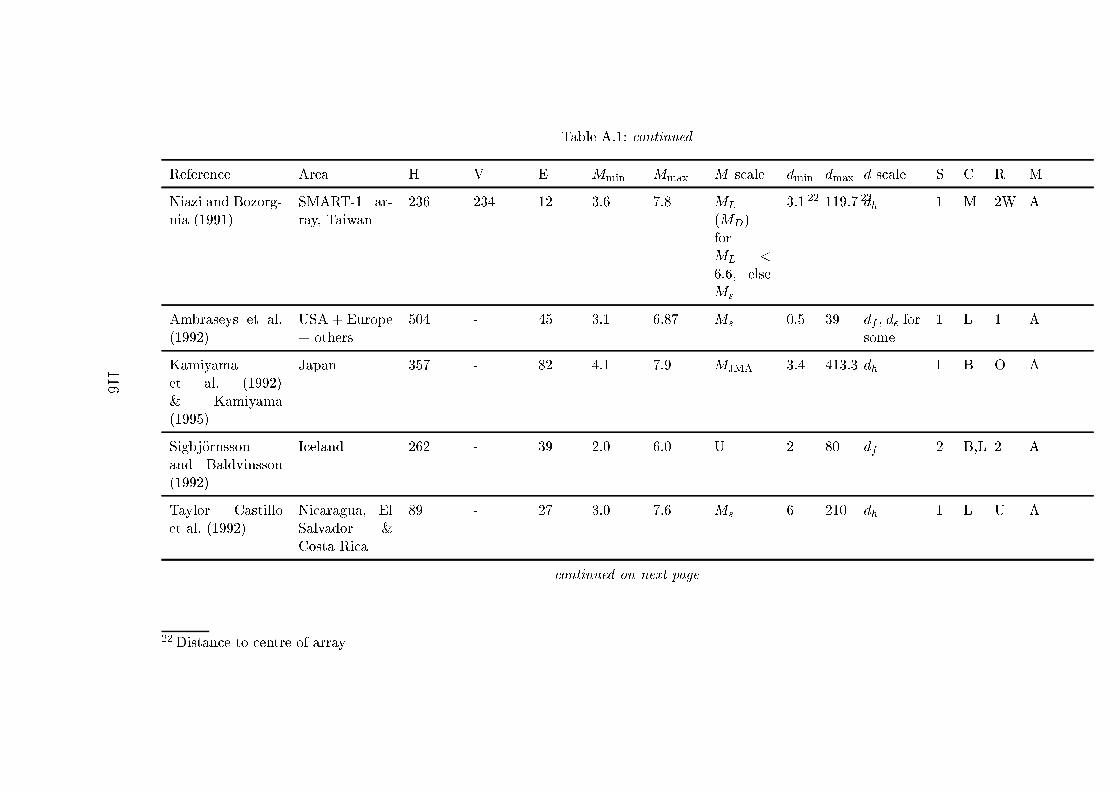
Table A.1: ontinued
Referen e Area H V E M
min
M
max
M s ale d
min
d
max
d s ale S C R M
Niazi and Bozorg-
nia (1991)
SMART-1 ar-
ray, Taiwan
236 234 12 3.6 7.8 M
L
(M
D
)
for
M
L
<
6:6, else
M
s
3.1
22
119.7
22
d
h
1 M 2W A
Ambraseys et al.
(1992)
USA + Europe
+ others
504 - 45 3.1 6.87 M
s
0.5 39 d
f
, d
e
for
some
1 L 1 A
Kamiyama
et al. (1992)
& Kamiyama
(1995)
Japan 357 - 82 4.1 7.9 M
JMA
3.4 413.3 d
h
I B O A
Sigbj�ornsson
and Baldvinsson
(1992)
I eland 262 - 39 2.0 6.0 U 2 80 d
f
2 B,L 2 A
Taylor Castillo
et al. (1992)
Ni aragua, El
Salvador &
Costa Ri a
89 - 27 3.0 7.6 M
s
6 210 d
h
1 L U A
ontinued on next page
22
Distan e to entre of array
116
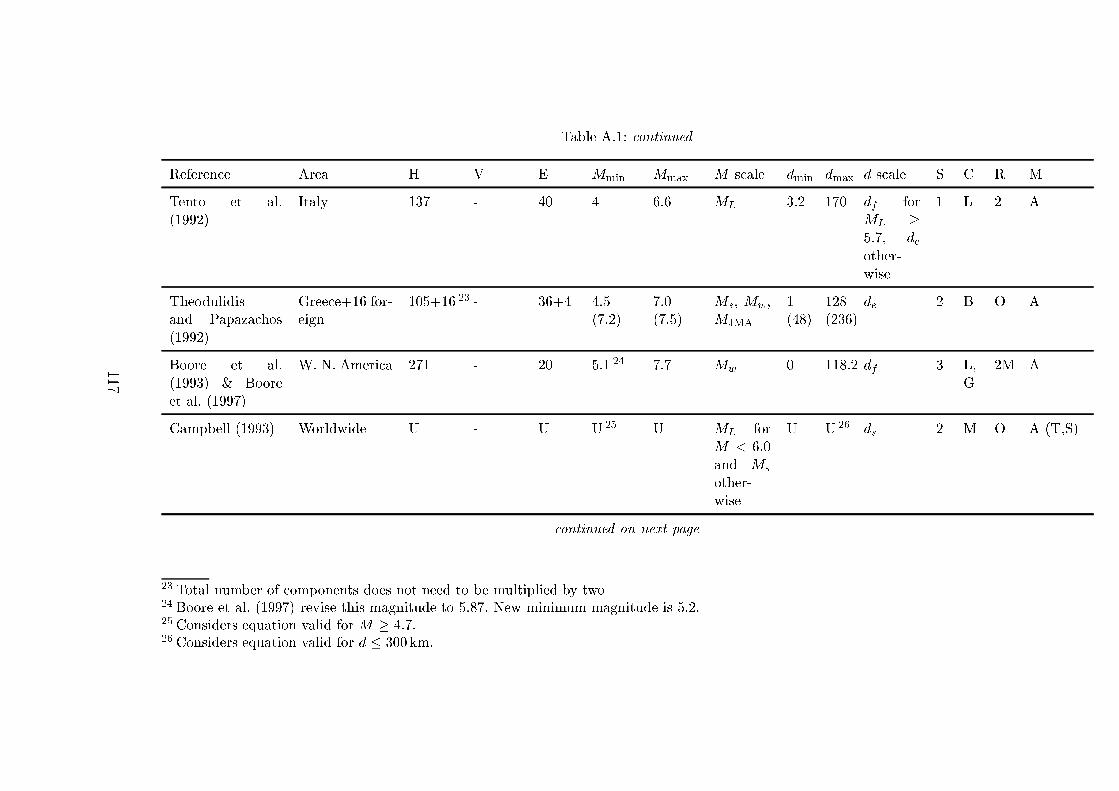
Table A.1: ontinued
Referen e Area H V E M
min
M
max
M s ale d
min
d
max
d s ale S C R M
Tento et al.
(1992)
Italy 137 - 40 4 6.6 M
L
3.2 170 d
f
for
M
L
�
5:7, d
e
other-
wise
1 L 2 A
Theodulidis
and Papaza hos
(1992)
Gree e+16 for-
eign
105+16
23
- 36+4 4.5
(7.2)
7.0
(7.5)
M
s
, M
w
,
M
JMA
1(48)
128
(236)
d
e
2 B O A
Boore et al.
(1993) & Boore
et al. (1997)
W. N. Ameri a 271 - 20 5.1
24
7.7 M
w
0 118.2 d
f
3 L,
G
2M A
Campbell (1993) Worldwide U - U U
25
U M
L
for
M < 6:0
and M
s
other-
wise
U U
26
d
s
2 M O A (T,S)
ontinued on next page
23
Total number of omponents does not need to be multiplied by two
24
Boore et al. (1997) revise this magnitude to 5:87. New minimum magnitude is 5:2.
25
Considers equation valid for M � 4:7.
26
Considers equation valid for d � 300 km.
117
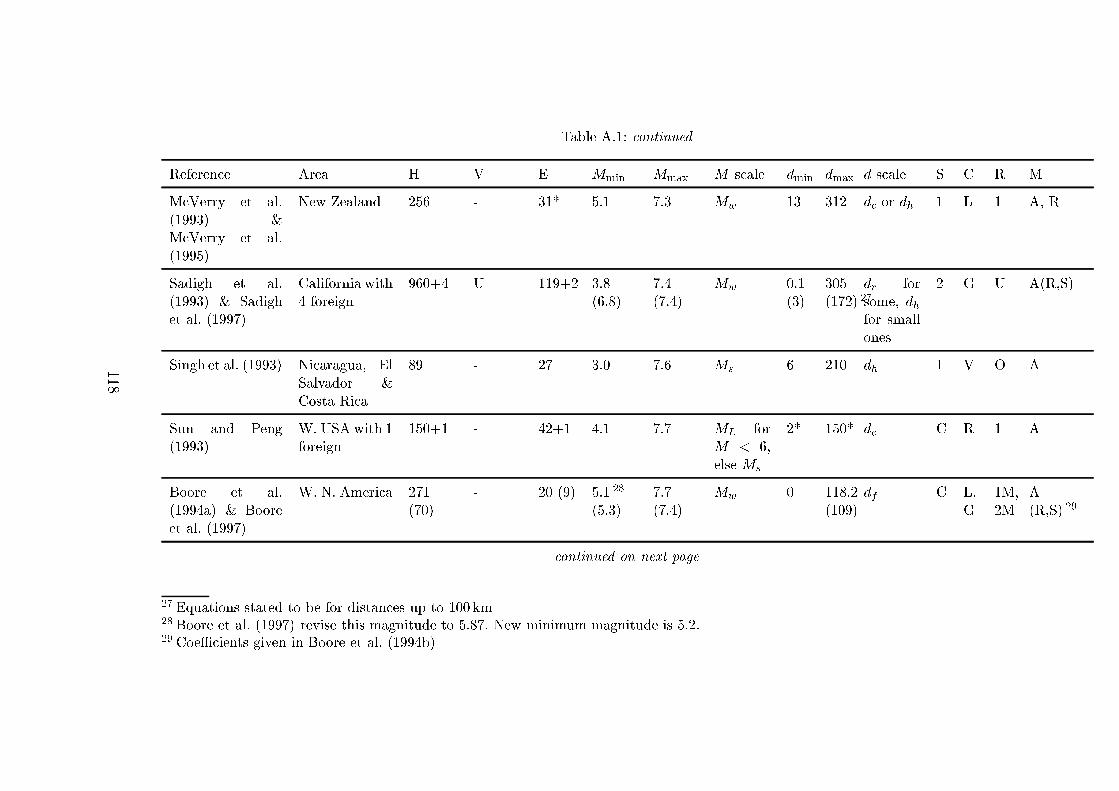
Table A.1: ontinued
Referen e Area H V E M
min
M
max
M s ale d
min
d
max
d s ale S C R M
M Verry et al.
(1993) &
M Verry et al.
(1995)
New Zealand 256 - 31* 5.1 7.3 M
w
13 312 d
or d
h
1 L 1 A, R
Sadigh et al.
(1993) & Sadigh
et al. (1997)
California with
4 foreign
960+4 U 119+2 3.8
(6.8)
7.4
(7.4)
M
w
0.1
(3)
305
(172)
27
d
r
for
some, d
h
for small
ones
2 G U A(R,S)
Singh et al. (1993) Ni aragua, El
Salvador &
Costa Ri a
89 - 27 3.0 7.6 M
s
6 210 d
h
1 V O A
Sun and Peng
(1993)
W. USA with 1
foreign
150+1 - 42+1 4.1 7.7 M
L
for
M < 6,
else M
s
2* 150* d
e
C R 1 A
Boore et al.
(1994a) & Boore
et al. (1997)
W. N. Ameri a 271
(70)
- 20 (9) 5.1
28
(5.3)
7.7
(7.4)
M
w
0 118.2
(109)
d
f
C L,
G
1M,
2M
A(R,S)
29
ontinued on next page
27
Equations stated to be for distan es up to 100 km
28
Boore et al. (1997) revise this magnitude to 5:87. New minimum magnitude is 5:2.
29
CoeÆ ients given in Boore et al. (1994b)
118
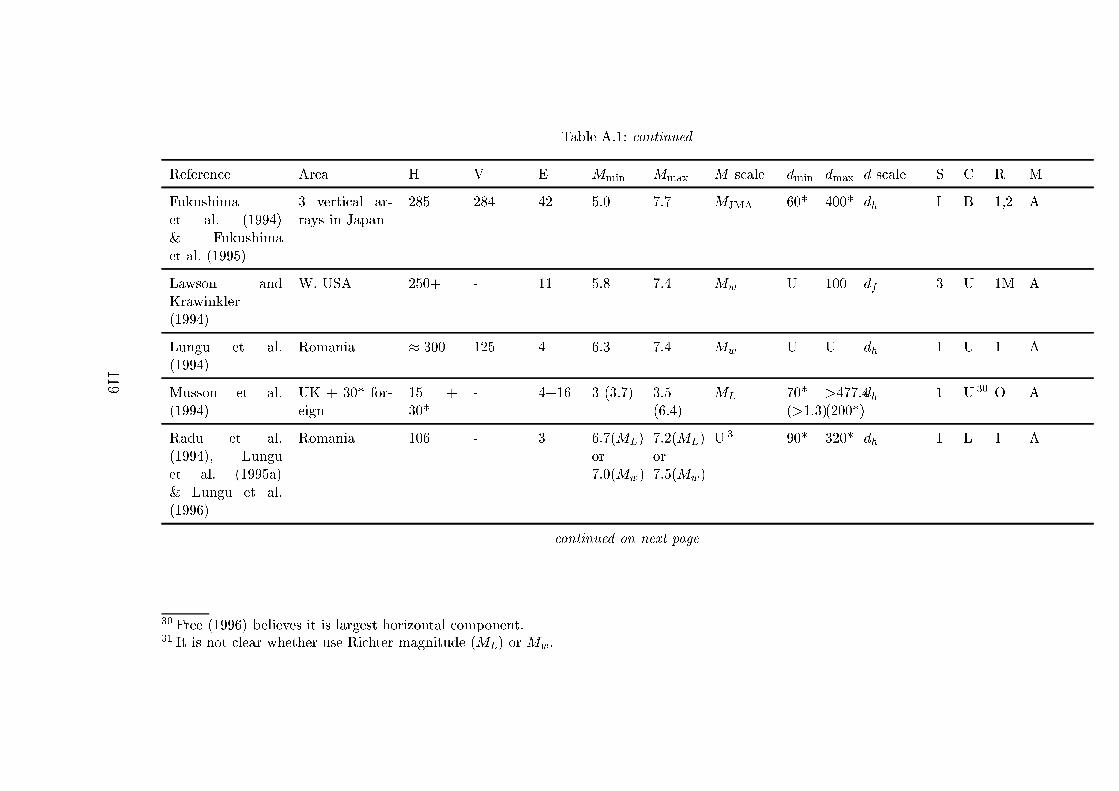
Table A.1: ontinued
Referen e Area H V E M
min
M
max
M s ale d
min
d
max
d s ale S C R M
Fukushima
et al. (1994)
& Fukushima
et al. (1995)
3 verti al ar-
rays in Japan
285 284 42 5.0 7.7 M
JMA
60* 400* d
h
I B 1,2 A
Lawson and
Krawinkler
(1994)
W. USA 250+ - 11 5.8 7.4 M
w
U 100 d
f
3 U 1M A
Lungu et al.
(1994)
Romania � 300 125 4 6.3 7.4 M
w
U U d
h
1 U 1 A
Musson et al.
(1994)
UK + 30* for-
eign
15 +
30*
- 4+16 3 (3.7) 3.5
(6.4)
M
L
70*
(>1.3)
>477.4
(200*)
d
h
1 U
30
O A
Radu et al.
(1994), Lungu
et al. (1995a)
& Lungu et al.
(1996)
Romania 106 - 3 6.7(M
L
)
or
7.0(M
w
)
7.2(M
L
)
or
7.5(M
w
)
U
31
90* 320* d
h
1 L 1 A
ontinued on next page
30
Free (1996) believes it is largest horizontal omponent.
31
It is not lear whether use Ri hter magnitude (M
L
) or M
w
.
119
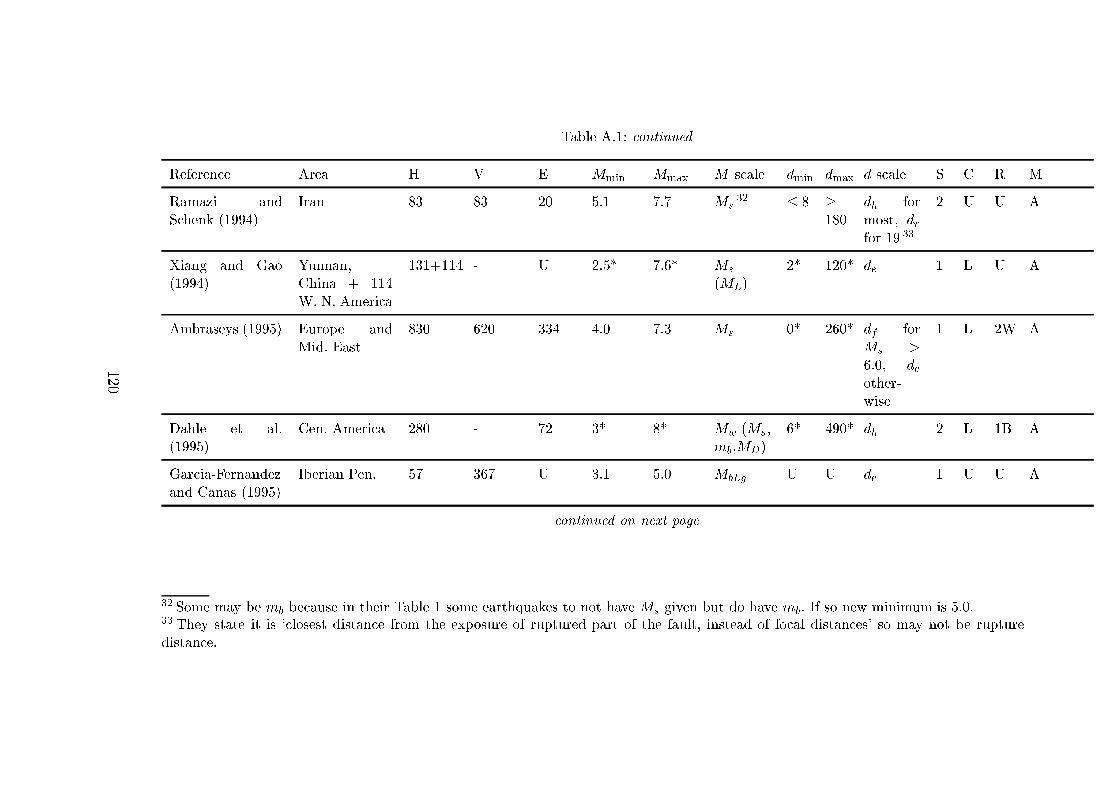
Table A.1: ontinued
Referen e Area H V E M
min
M
max
M s ale d
min
d
max
d s ale S C R M
Ramazi and
S henk (1994)
Iran 83 83 20 5.1 7.7 M
s
32
� 8 �180
d
h
for
most, d
r
for 19
33
2 U U A
Xiang and Gao
(1994)
Yunnan,
China + 114
W. N. Ameri a
131+114 - U 2.5* 7.6* M
s
(M
L
)
2* 120* d
e
1 L U A
Ambraseys (1995) Europe and
Mid. East
830 620 334 4.0 7.3 M
s
0* 260* d
f
for
M
s
>
6:0, d
e
other-
wise
1 L 2W A
Dahle et al.
(1995)
Cen. Ameri a 280 - 72 3* 8* M
w
(M
s
,
m
b
,M
D
)
6* 490* d
h
2 L 1B A
Gar ia-Fernandez
and Canas (1995)
Iberian Pen. 57 367 U 3.1 5.0 M
bLg
U U d
e
1 U U A
ontinued on next page
32
Some may be m
b
be ause in their Table 1 some earthquakes to not have M
s
given but do have m
b
. If so new minimum is 5.0.
33
They state it is ` losest distan e from the exposure of ruptured part of the fault, instead of fo al distan es' so may not be rupture
distan e.
120
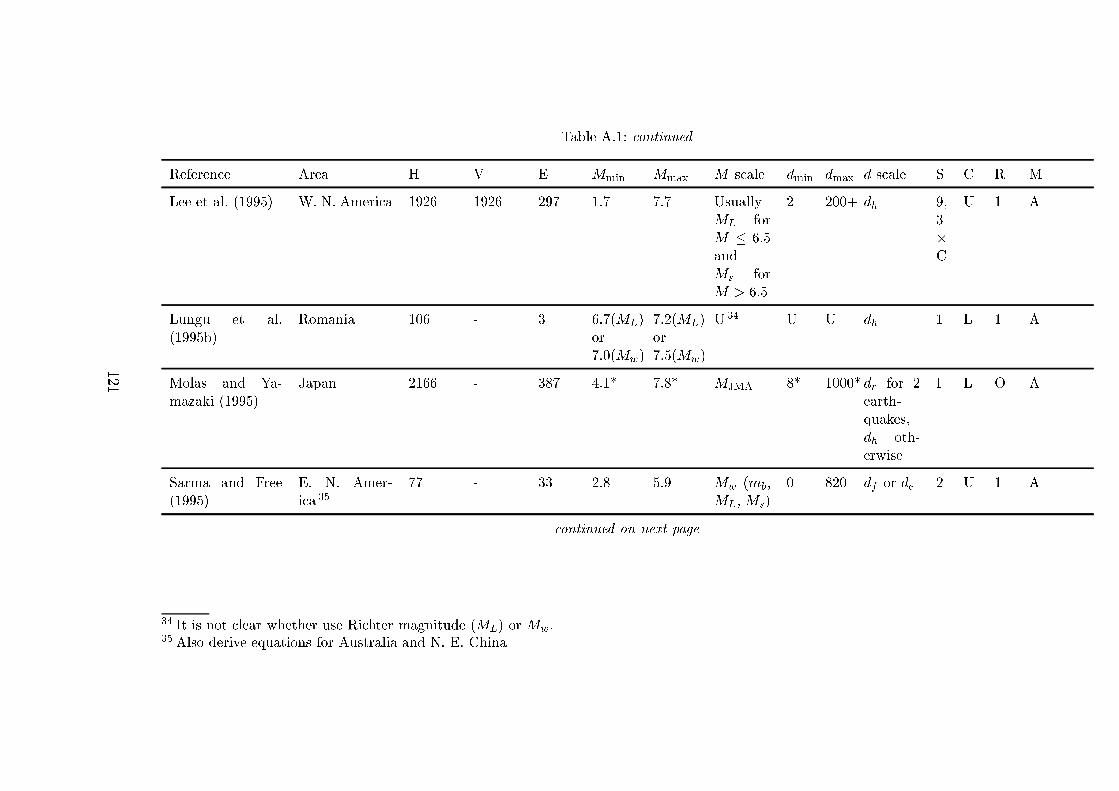
Table A.1: ontinued
Referen e Area H V E M
min
M
max
M s ale d
min
d
max
d s ale S C R M
Lee et al. (1995) W. N. Ameri a 1926 1926 297 1.7 7.7 Usually
M
L
for
M � 6:5
and
M
s
for
M > 6:5
2 200+ d
h
9,
3�
C
U 1 A
Lungu et al.
(1995b)
Romania 106 - 3 6.7(M
L
)
or
7.0(M
w
)
7.2(M
L
)
or
7.5(M
w
)
U
34
U U d
h
1 L 1 A
Molas and Ya-
mazaki (1995)
Japan 2166 - 387 4.1* 7.8* M
JMA
8* 1000* d
r
for 2
earth-
quakes,
d
h
oth-
erwise
I L O A
Sarma and Free
(1995)
E. N. Amer-
i a
35
77 - 33 2.8 5.9 M
w
(m
b
,
M
L
, M
s
)
0 820 d
f
or d
e
2 U 1 A
ontinued on next page
34
It is not lear whether use Ri hter magnitude (M
L
) or M
w
.
35
Also derive equations for Australia and N. E. China
121
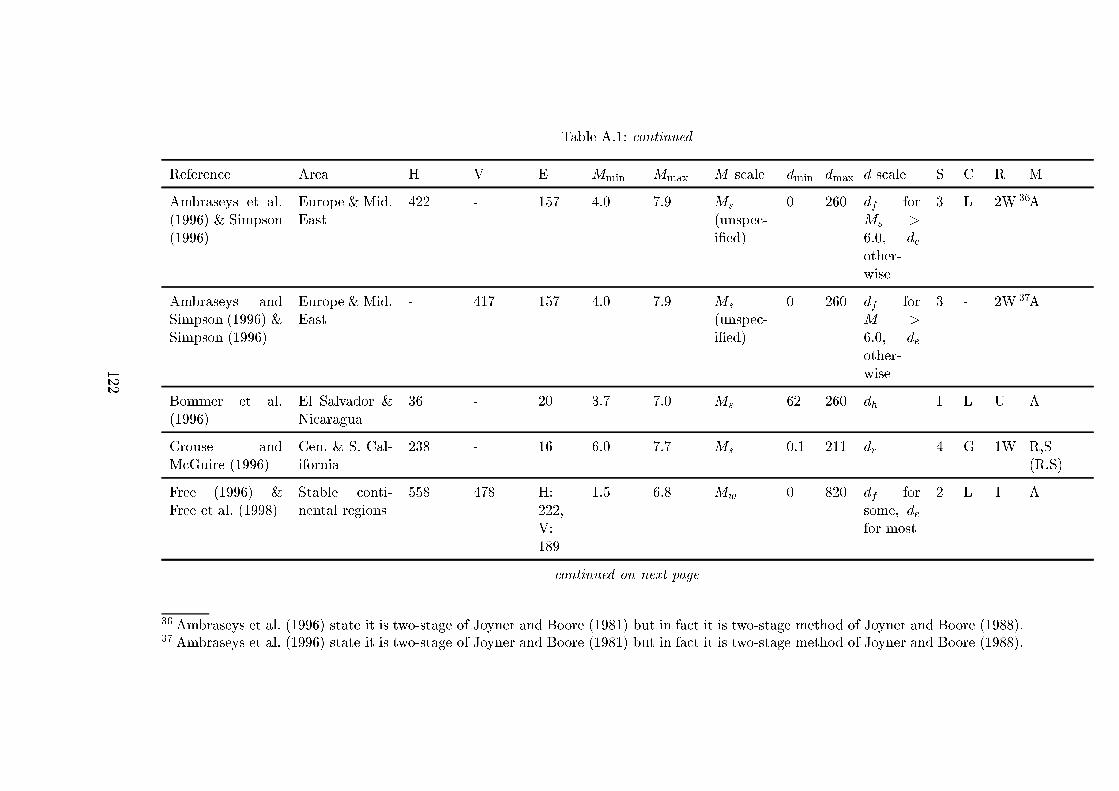
Table A.1: ontinued
Referen e Area H V E M
min
M
max
M s ale d
min
d
max
d s ale S C R M
Ambraseys et al.
(1996) & Simpson
(1996)
Europe & Mid.
East
422 - 157 4.0 7.9 M
s
(unspe -
i�ed)
0 260 d
f
for
M
s
>
6:0, d
e
other-
wise
3 L 2W
36
A
Ambraseys and
Simpson (1996) &
Simpson (1996)
Europe & Mid.
East
- 417 157 4.0 7.9 M
s
(unspe -
i�ed)
0 260 d
f
for
M >
6:0, d
e
other-
wise
3 - 2W
37
A
Bommer et al.
(1996)
El Salvador &
Ni aragua
36 - 20 3.7 7.0 M
s
62 260 d
h
1 L U A
Crouse and
M Guire (1996)
Cen. & S. Cal-
ifornia
238 - 16 6.0 7.7 M
s
0.1 211 d
r
4 G 1W R,S
(R,S)
Free (1996) &
Free et al. (1998)
Stable onti-
nental regions
558 478 H:
222,
V:
189
1.5 6.8 M
w
0 820 d
f
for
some, d
e
for most
2 L 1 A
ontinued on next page
36
Ambraseys et al. (1996) state it is two-stage of Joyner and Boore (1981) but in fa t it is two-stage method of Joyner and Boore (1988).
37
Ambraseys et al. (1996) state it is two-stage of Joyner and Boore (1981) but in fa t it is two-stage method of Joyner and Boore (1988).
122
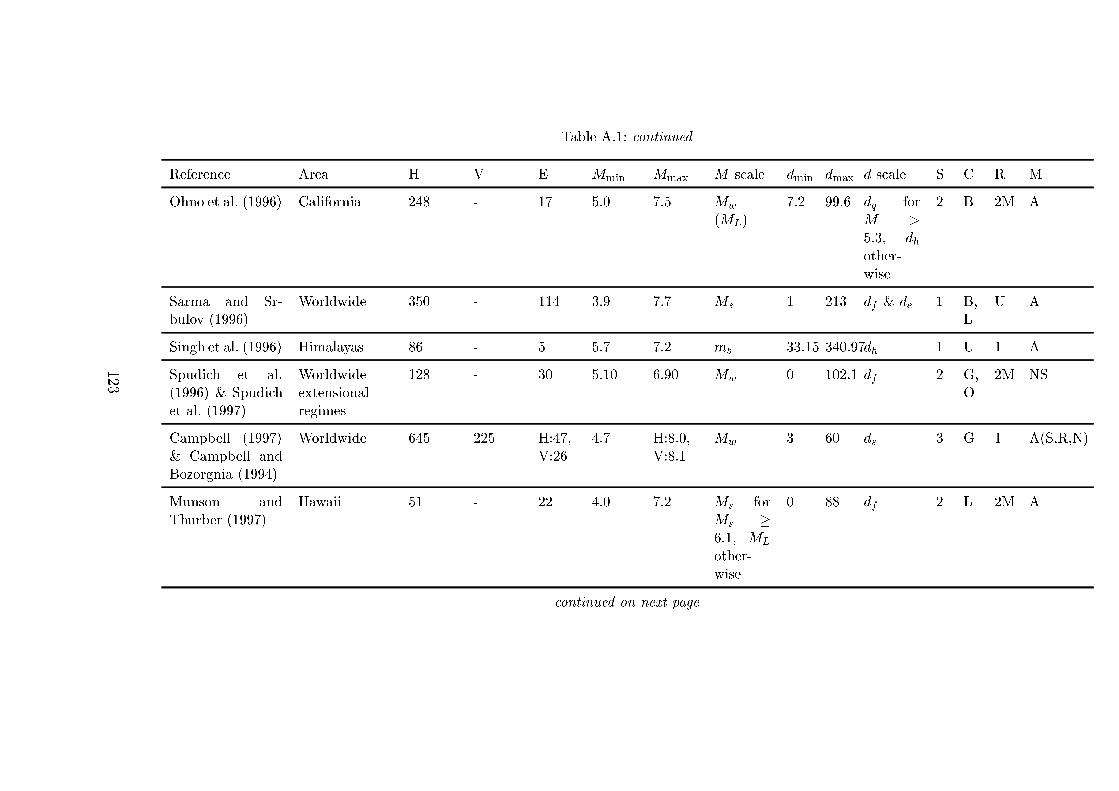
Table A.1: ontinued
Referen e Area H V E M
min
M
max
M s ale d
min
d
max
d s ale S C R M
Ohno et al. (1996) California 248 - 17 5.0 7.5 M
w
(M
L
)
7.2 99.6 d
q
for
M >
5:3, d
h
other-
wise
2 B 2M A
Sarma and Sr-
bulov (1996)
Worldwide 350 - 114 3.9 7.7 M
s
1 213 d
f
& d
e
1 B,
L
U A
Singh et al. (1996) Himalayas 86 - 5 5.7 7.2 m
b
33.15 340.97d
h
1 U 1 A
Spudi h et al.
(1996) & Spudi h
et al. (1997)
Worldwide
extensional
regimes
128 - 30 5.10 6.90 M
w
0 102.1 d
f
2 G,
O
2M NS
Campbell (1997)
& Campbell and
Bozorgnia (1994)
Worldwide 645 225 H:47,
V:26
4.7 H:8.0,
V:8.1
M
w
3 60 d
s
3 G 1 A(S,R,N)
Munson and
Thurber (1997)
Hawaii 51 - 22 4.0 7.2 M
s
for
M
s
�
6:1, M
L
other-
wise
0 88 d
f
2 L 2M A
ontinued on next page
123
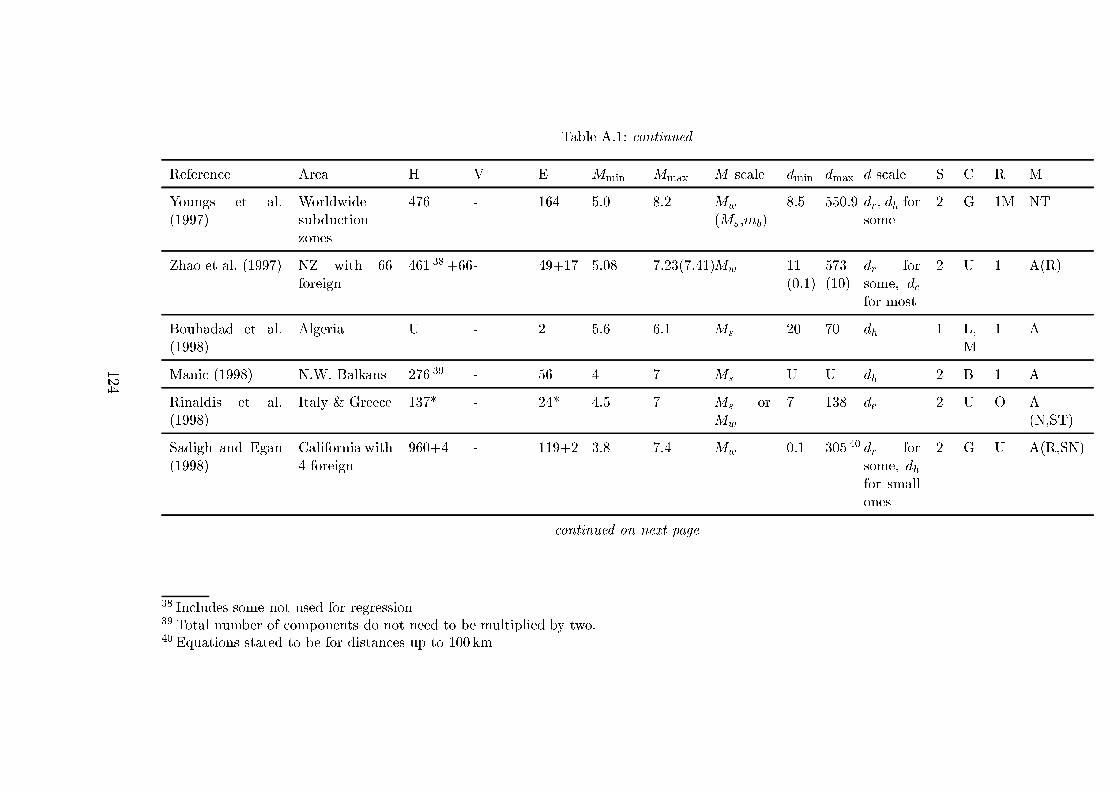
Table A.1: ontinued
Referen e Area H V E M
min
M
max
M s ale d
min
d
max
d s ale S C R M
Youngs et al.
(1997)
Worldwide
subdu tion
zones
476 - 164 5.0 8.2 M
w
(M
s
,m
b
)
8.5 550.9 d
r
, d
h
for
some
2 G 1M NT
Zhao et al. (1997) NZ with 66
foreign
461
38
+66- 49+17 5.08 7.23(7.41)M
w
11
(0.1)
573
(10)
d
r
for
some, d
for most
2 U 1 A(R)
Bouhadad et al.
(1998)
Algeria U - 2 5.6 6.1 M
s
20 70 d
h
1 L,
M
1 A
Mani (1998) N.W. Balkans 276
39
- 56 4 7 M
s
U U d
h
2 B 1 A
Rinaldis et al.
(1998)
Italy & Gree e 137* - 24* 4.5 7 M
s
or
M
w
7 138 d
e
2 U O A(N,ST)
Sadigh and Egan
(1998)
California with
4 foreign
960+4 - 119+2 3.8 7.4 M
w
0.1 305
40
d
r
for
some, d
h
for small
ones
2 G U A(R,SN)
ontinued on next page
38
In ludes some not used for regression
39
Total number of omponents do not need to be multiplied by two.
40
Equations stated to be for distan es up to 100 km
124
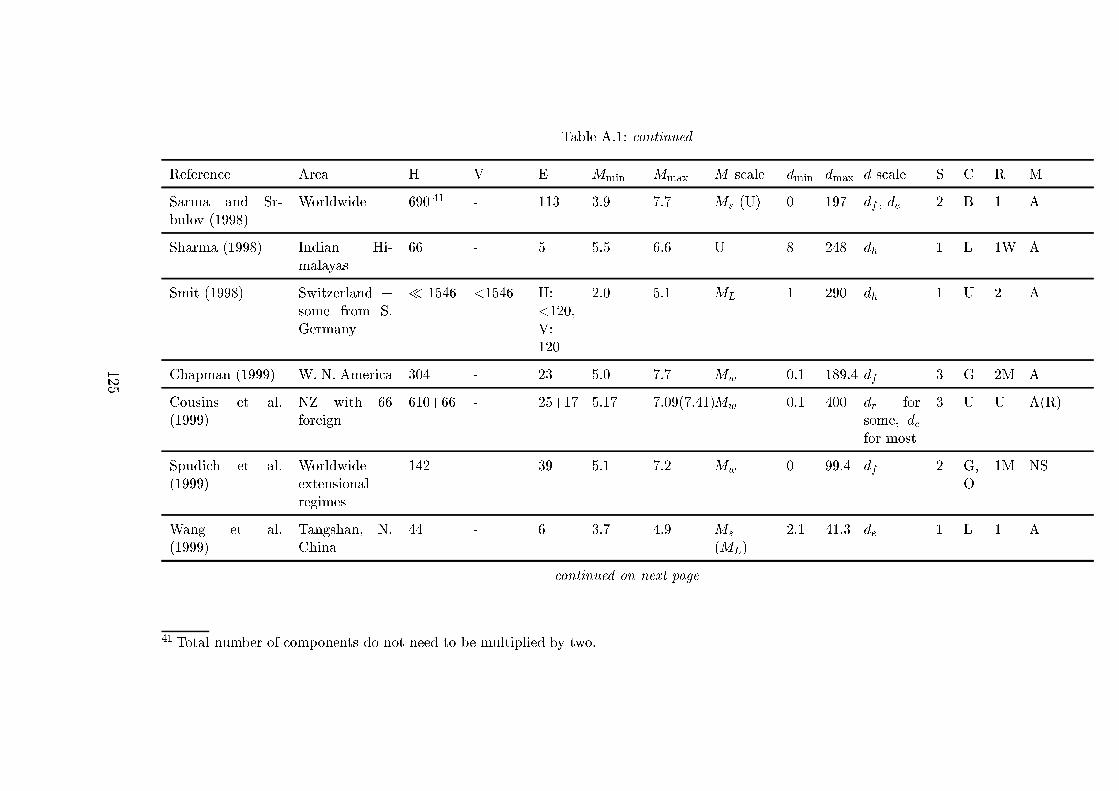
Table A.1: ontinued
Referen e Area H V E M
min
M
max
M s ale d
min
d
max
d s ale S C R M
Sarma and Sr-
bulov (1998)
Worldwide 690
41
- 113 3.9 7.7 M
s
(U) 0 197 d
f
, d
e
2 B 1 A
Sharma (1998) Indian Hi-
malayas
66 - 5 5.5 6.6 U 8 248 d
h
1 L 1W A
Smit (1998) Switzerland +
some from S.
Germany
� 1546 <1546 H:
<120,
V:
120
2.0 5.1 M
L
1 290 d
h
1 U 2 A
Chapman (1999) W. N. Ameri a 304 - 23 5.0 7.7 M
w
0.1 189.4 d
f
3 G 2M A
Cousins et al.
(1999)
NZ with 66
foreign
610+66 - 25+17 5.17 7.09(7.41)M
w
0.1 400 d
r
for
some, d
for most
3 U U A(R)
Spudi h et al.
(1999)
Worldwide
extensional
regimes
142 - 39 5.1 7.2 M
w
0 99.4 d
f
2 G,
O
1M NS
Wang et al.
(1999)
Tangshan, N.
China
44 - 6 3.7 4.9 M
s
(M
L
)
2.1 41.3 d
e
1 L 1 A
ontinued on next page
41
Total number of omponents do not need to be multiplied by two.
125
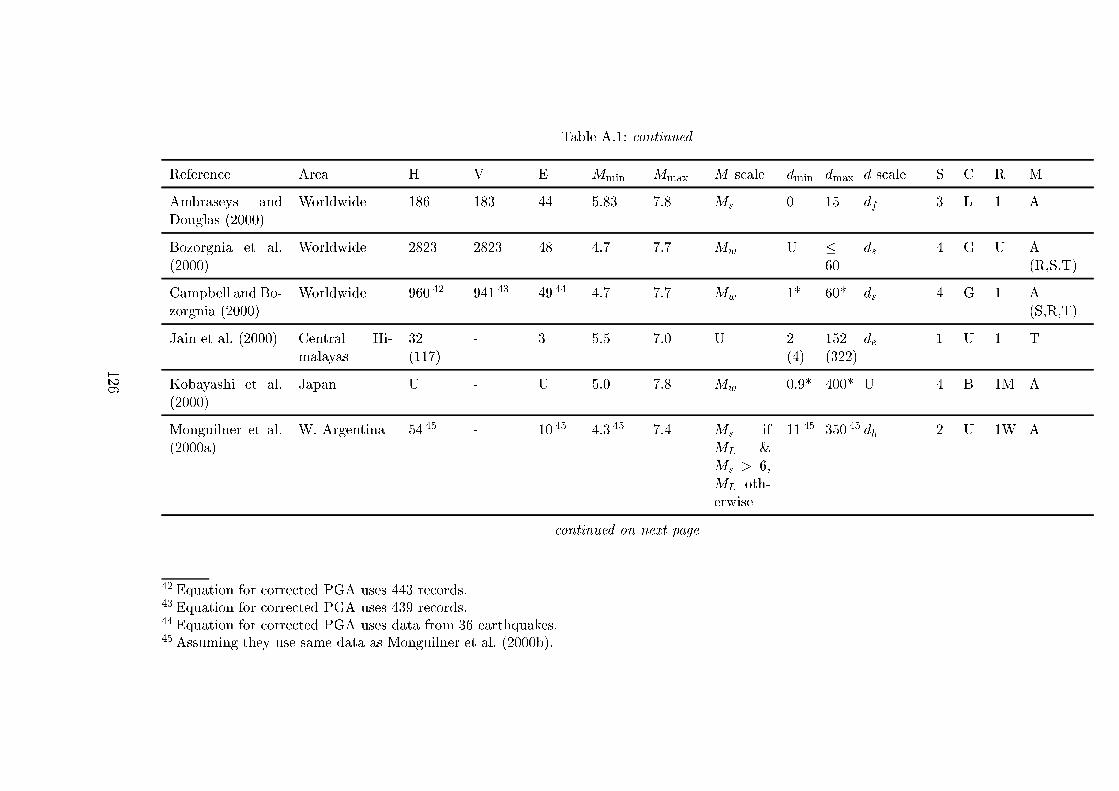
Table A.1: ontinued
Referen e Area H V E M
min
M
max
M s ale d
min
d
max
d s ale S C R M
Ambraseys and
Douglas (2000)
Worldwide 186 183 44 5.83 7.8 M
s
0 15 d
f
3 L 1 A
Bozorgnia et al.
(2000)
Worldwide 2823 2823 48 4.7 7.7 M
w
U �60
d
s
4 G U A(R,S,T)
Campbell and Bo-
zorgnia (2000)
Worldwide 960
42
941
43
49
44
4.7 7.7 M
w
1* 60* d
s
4 G 1 A(S,R,T)
Jain et al. (2000) Central Hi-
malayas
32
(117)
- 3 5.5 7.0 U 2(4)
152
(322)
d
e
1 U 1 T
Kobayashi et al.
(2000)
Japan U - U 5.0 7.8 M
w
0.9* 400* U 4 B 1M A
Monguilner et al.
(2000a)
W. Argentina 54
45
- 10
45
4.3
45
7.4 M
s
if
M
L
&
M
s
> 6,
M
L
oth-
erwise
11
45
350
45
d
h
2 U 1W A
ontinued on next page
42
Equation for orre ted PGA uses 443 re ords.
43
Equation for orre ted PGA uses 439 re ords.
44
Equation for orre ted PGA uses data from 36 earthquakes.
45
Assuming they use same data as Monguilner et al. (2000b).
126
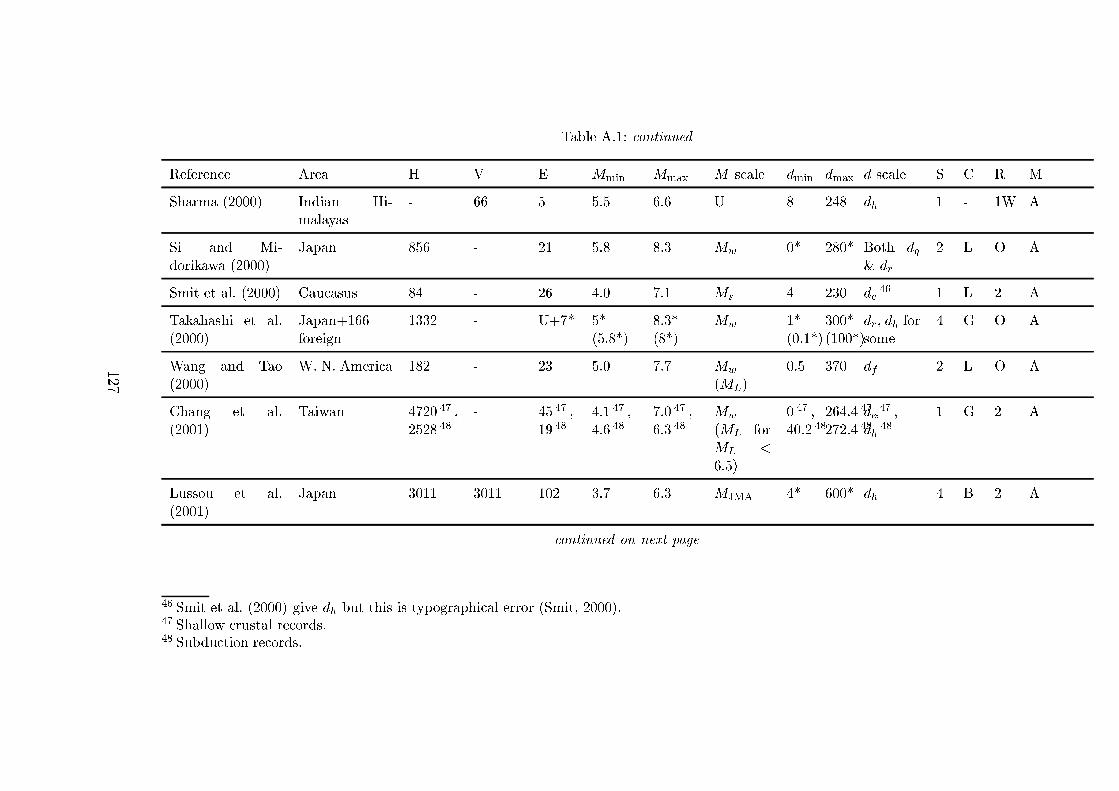
Table A.1: ontinued
Referen e Area H V E M
min
M
max
M s ale d
min
d
max
d s ale S C R M
Sharma (2000) Indian Hi-
malayas
- 66 5 5.5 6.6 U 8 248 d
h
1 - 1W A
Si and Mi-
dorikawa (2000)
Japan 856 - 21 5.8 8.3 M
w
0* 280* Both d
q
& d
r
2 L O A
Smit et al. (2000) Cau asus 84 - 26 4.0 7.1 M
s
4 230 d
e
46
1 L 2 A
Takahashi et al.
(2000)
Japan+166
foreign
1332 - U+7* 5*
(5.8*)
8.3*
(8*)
M
w
1*
(0.1*)
300*
(100*)
d
r
, d
h
for
some
4 G O A
Wang and Tao
(2000)
W. N. Ameri a 182 - 23 5.0 7.7 M
w
(M
L
)
0.5 370 d
f
2 L O A
Chang et al.
(2001)
Taiwan 4720
47
,
2528
48
- 45
47
,
19
48
4.1
47
,
4.6
48
7.0
47
,
6.3
48
M
w
(M
L
for
M
L
<
6:5)
0
47
,
40.2
48
264.4
47
,
272.4
48
d
e
47
,
d
h
48
1 G 2 A
Lussou et al.
(2001)
Japan 3011 3011 102 3.7 6.3 M
JMA
4* 600* d
h
4 B 2 A
ontinued on next page
46
Smit et al. (2000) give d
h
but this is typographi al error (Smit, 2000).
47
Shallow rustal re ords.
48
Subdu tion re ords.
127
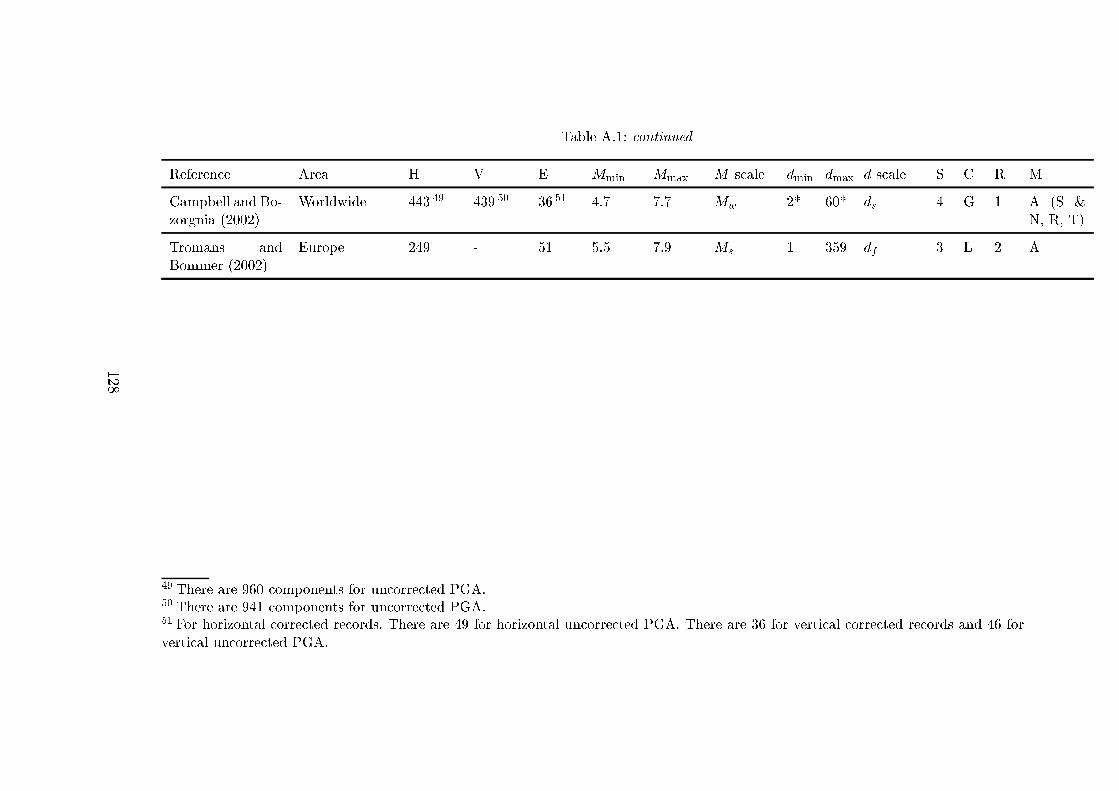
Table A.1: ontinued
Referen e Area H V E M
min
M
max
M s ale d
min
d
max
d s ale S C R M
Campbell and Bo-
zorgnia (2002)
Worldwide 443
49
439
50
36
51
4.7 7.7 M
w
2* 60* d
s
4 G 1 A (S &
N, R, T)
Tromans and
Bommer (2002)
Europe 249 - 51 5.5 7.9 M
s
1 359 d
f
3 L 2 A
49
There are 960 omponents for un orre ted PGA.
50
There are 941 omponents for un orre ted PGA.
51
For horizontal orre ted re ords. There are 49 for horizontal un orre ted PGA. There are 36 for verti al orre ted re ords and 46 for
verti al un orre ted PGA.
128
B General hara teristi s of published equations for estimating
spe tral ordinates
Table B.1 gives the general hara teristi s of published equations for estimat-
ing spe tral ordinates. The olumns are the same as in Table A.1 with three
extra olumns:
T s Number of periods for whi h attenuation equations are derived
T
min
Minimum period for whi h attenuation equation is derived
T
max
Maximum period for whi h attenuation equation is derived
129
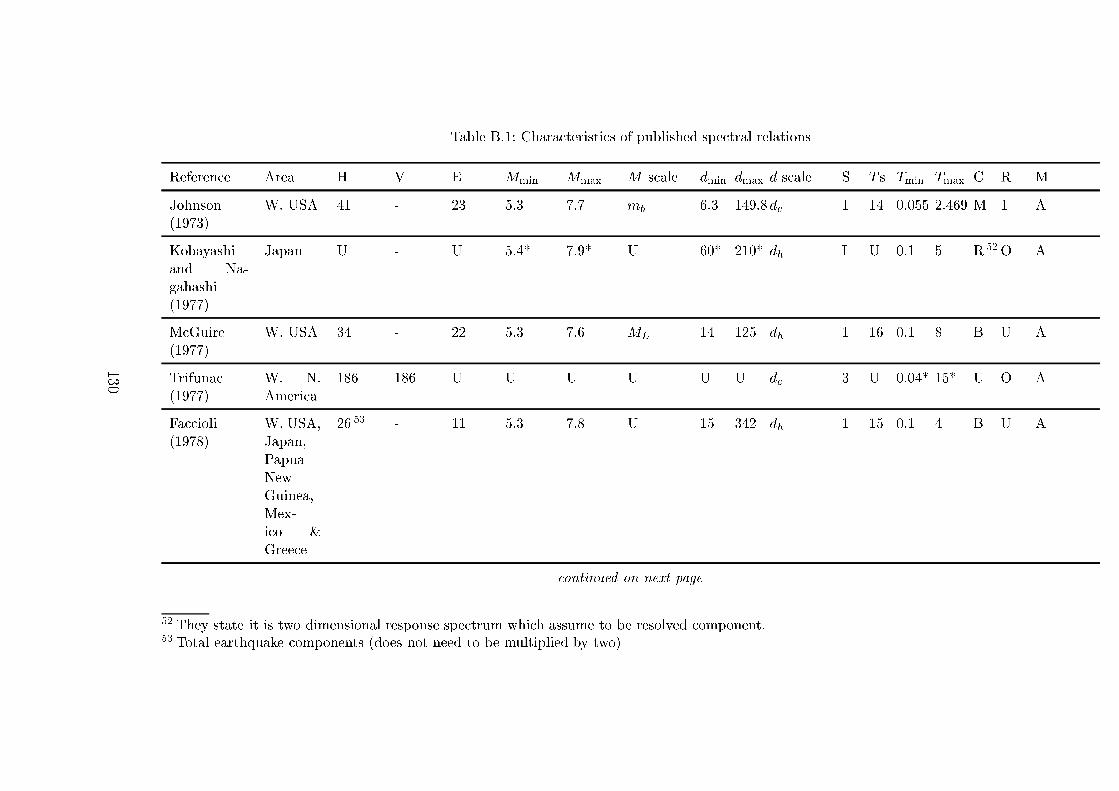
Table B.1: Chara teristi s of published spe tral relations
Referen e Area H V E M
min
M
max
M s ale d
min
d
max
d s ale S T s T
min
T
max
C R M
Johnson
(1973)
W. USA 41 - 23 5.3 7.7 m
b
6.3 149.8d
e
1 14 0.055 2.469 M 1 A
Kobayashi
and Na-
gahashi
(1977)
Japan U - U 5.4* 7.9* U 60* 210* d
h
I U 0.1 5 R
52
O A
M Guire
(1977)
W. USA 34 - 22 5.3 7.6 M
L
14 125 d
h
1 16 0.1 8 B U A
Trifuna
(1977)
W. N.
Ameri a
186 186 U U U U U U d
e
3 U 0.04* 15* U O A
Fa ioli
(1978)
W. USA,
Japan,
Papua
New
Guinea,
Mex-
i o &
Gree e
26
53
- 11 5.3 7.8 U 15 342 d
h
1 15 0.1 4 B U A
ontinued on next page
52
They state it is two dimensional response spe trum whi h assume to be resolved omponent.
53
Total earthquake omponents (does not need to be multiplied by two)
130
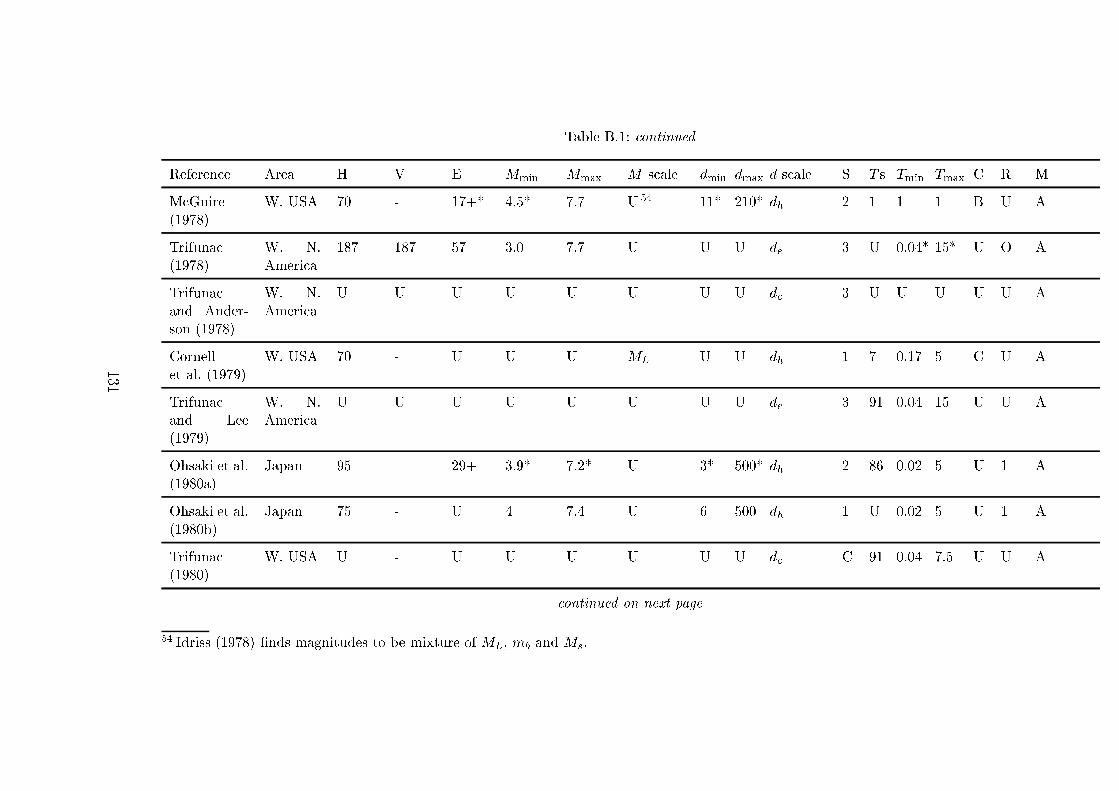
Table B.1: ontinued
Referen e Area H V E M
min
M
max
M s ale d
min
d
max
d s ale S T s T
min
T
max
C R M
M Guire
(1978)
W. USA 70 - 17+* 4.5* 7.7 U
54
11* 210* d
h
2 1 1 1 B U A
Trifuna
(1978)
W. N.
Ameri a
187 187 57 3.0 7.7 U U U d
e
3 U 0.04* 15* U O A
Trifuna
and Ander-
son (1978)
W. N.
Ameri a
U U U U U U U U d
e
3 U U U U U A
Cornell
et al. (1979)
W. USA 70 - U U U M
L
U U d
h
1 7 0.17 5 C U A
Trifuna
and Lee
(1979)
W. N.
Ameri a
U U U U U U U U d
e
3 91 0.04 15 U U A
Ohsaki et al.
(1980a)
Japan 95 - 29+ 3.9* 7.2* U 3* 500* d
h
2 86 0.02 5 U 1 A
Ohsaki et al.
(1980b)
Japan 75 - U 4 7.4 U 6 500 d
h
1 U 0.02 5 U 1 A
Trifuna
(1980)
W. USA U - U U U U U U d
e
C 91 0.04 7.5 U U A
ontinued on next page
54
Idriss (1978) �nds magnitudes to be mixture of M
L
, m
b
and M
s
.
131
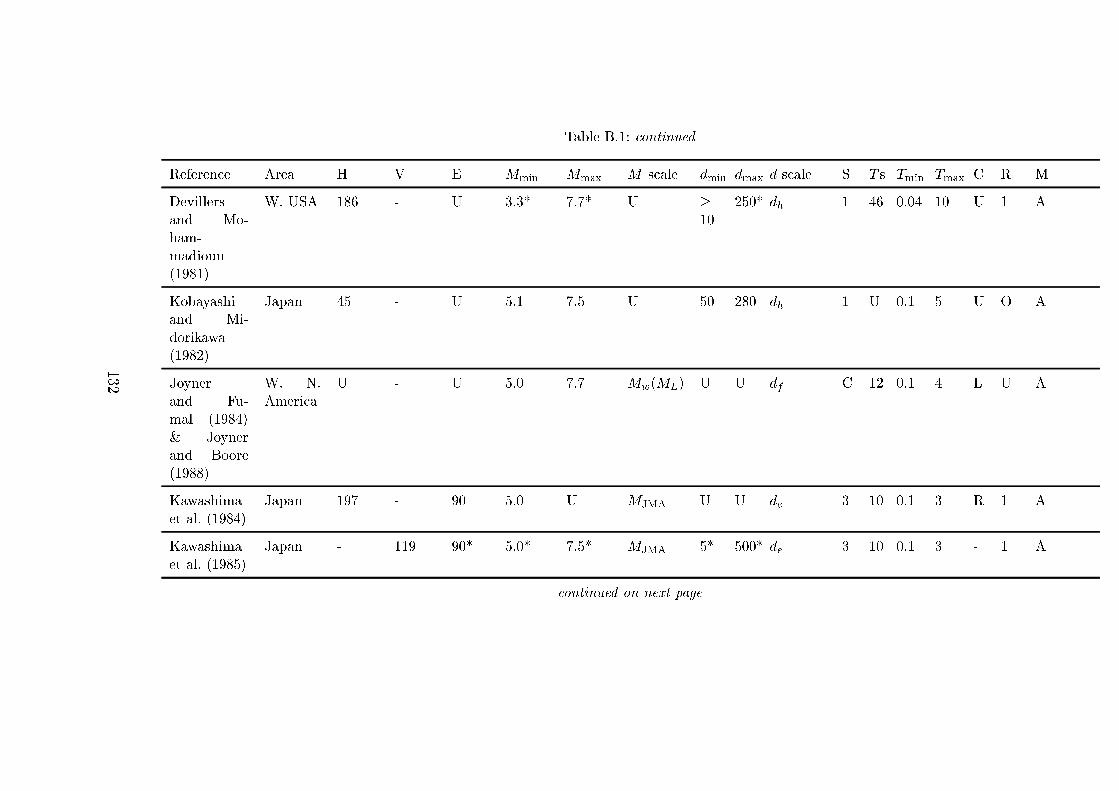
Table B.1: ontinued
Referen e Area H V E M
min
M
max
M s ale d
min
d
max
d s ale S T s T
min
T
max
C R M
Devillers
and Mo-
ham-
madioun
(1981)
W. USA 186 - U 3.3* 7.7* U �10
250* d
h
1 46 0.04 10 U 1 A
Kobayashi
and Mi-
dorikawa
(1982)
Japan 45 - U 5.1 7.5 U 50 280 d
h
1 U 0.1 5 U O A
Joyner
and Fu-
mal (1984)
& Joyner
and Boore
(1988)
W. N.
Ameri a
U - U 5.0 7.7 M
w
(M
L
) U U d
f
C 12 0.1 4 L U A
Kawashima
et al. (1984)
Japan 197 - 90 5.0 U M
JMA
U U d
e
3 10 0.1 3 R 1 A
Kawashima
et al. (1985)
Japan - 119 90* 5.0* 7.5* M
JMA
5* 500* d
e
3 10 0.1 3 - 1 A
ontinued on next page
132
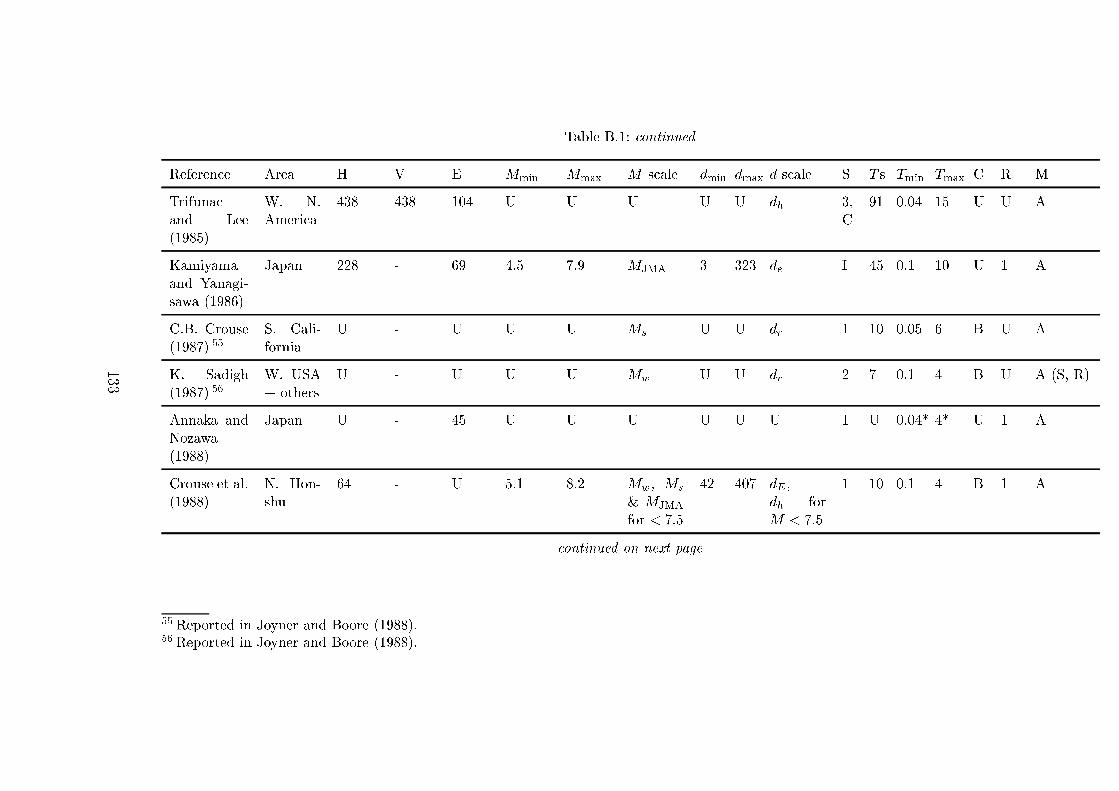
Table B.1: ontinued
Referen e Area H V E M
min
M
max
M s ale d
min
d
max
d s ale S T s T
min
T
max
C R M
Trifuna
and Lee
(1985)
W. N.
Ameri a
438 438 104 U U U U U d
h
3,
C
91 0.04 15 U U A
Kamiyama
and Yanagi-
sawa (1986)
Japan 228 - 69 4.5 7.9 M
JMA
3 323 d
e
I 45 0.1 10 U 1 A
C.B. Crouse
(1987)
55
S. Cali-
fornia
U - U U U M
s
U U d
r
1 10 0.05 6 B U A
K. Sadigh
(1987)
56
W. USA
+ others
U - U U U M
w
U U d
r
2 7 0.1 4 B U A (S, R)
Annaka and
Nozawa
(1988)
Japan U - 45 U U U U U U 1 U 0.04* 4* U 1 A
Crouse et al.
(1988)
N. Hon-
shu
64 - U 5.1 8.2 M
w
, M
s
& M
JMA
for < 7:5
42 407 d
E
,
d
h
for
M < 7:5
1 10 0.1 4 B 1 A
ontinued on next page
55
Reported in Joyner and Boore (1988).
56
Reported in Joyner and Boore (1988).
133
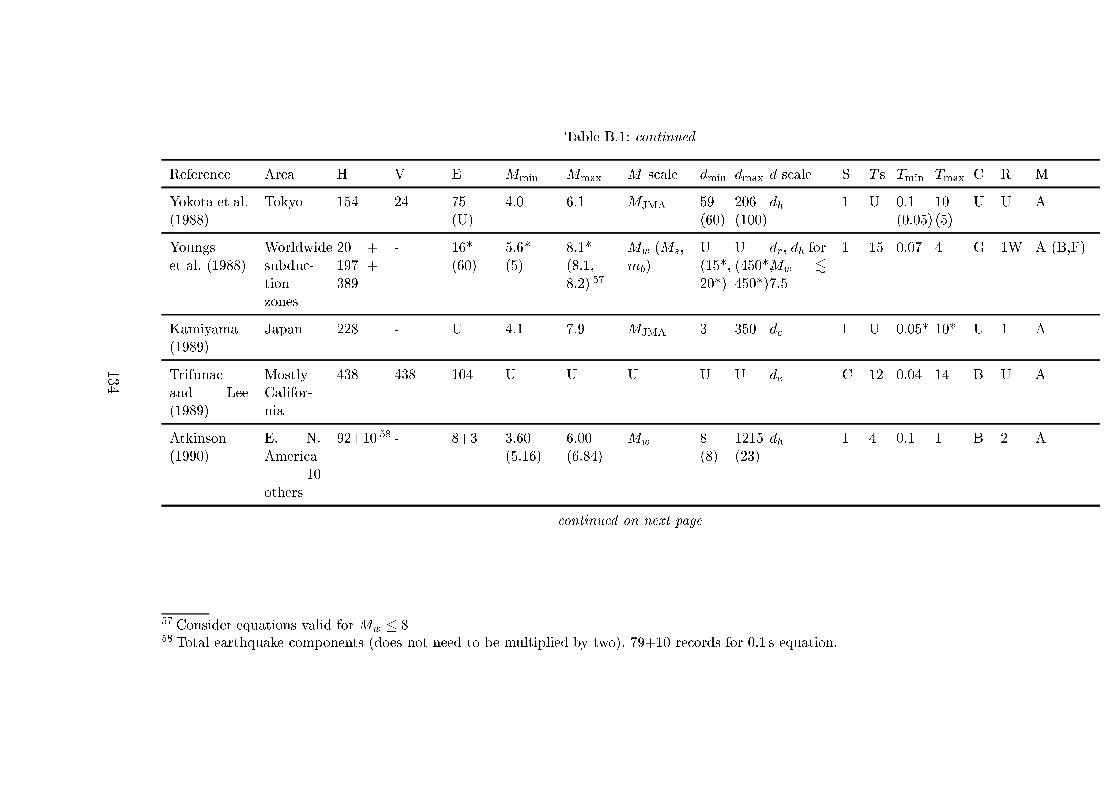
Table B.1: ontinued
Referen e Area H V E M
min
M
max
M s ale d
min
d
max
d s ale S T s T
min
T
max
C R M
Yokota et al.
(1988)
Tokyo 154 24 75
(U)
4.0 6.1 M
JMA
59
(60)
206
(100)
d
h
1 U 0.1
(0.05)
10
(5)
U U A
Youngs
et al. (1988)
Worldwide
subdu -
tion
zones
20 +
197 +
389
- 16*
(60)
5.6*
(5)
8.1*
(8.1,
8.2)
57
M
w
(M
s
,
m
b
)
U(15*,
20*)
U(450*,
450*)
d
r
, d
h
for
M
w
.
7:5
1 15 0.07 4 G 1W A (B,F)
Kamiyama
(1989)
Japan 228 - U 4.1 7.9 M
JMA
3 350 d
e
I U 0.05* 10* U 1 A
Trifuna
and Lee
(1989)
Mostly
Califor-
nia
438 438 104 U U U U U d
e
C 12 0.04 14 B U A
Atkinson
(1990)
E. N.
Ameri a
+ 10
others
92+10
58
- 8+3 3.60
(5.16)
6.00
(6.84)
M
w
8(8)
1215
(23)
d
h
1 4 0.1 1 B 2 A
ontinued on next page
57
Consider equations valid for M
w
� 8
58
Total earthquake omponents (does not need to be multiplied by two). 79+10 re ords for 0:1 s equation.
134
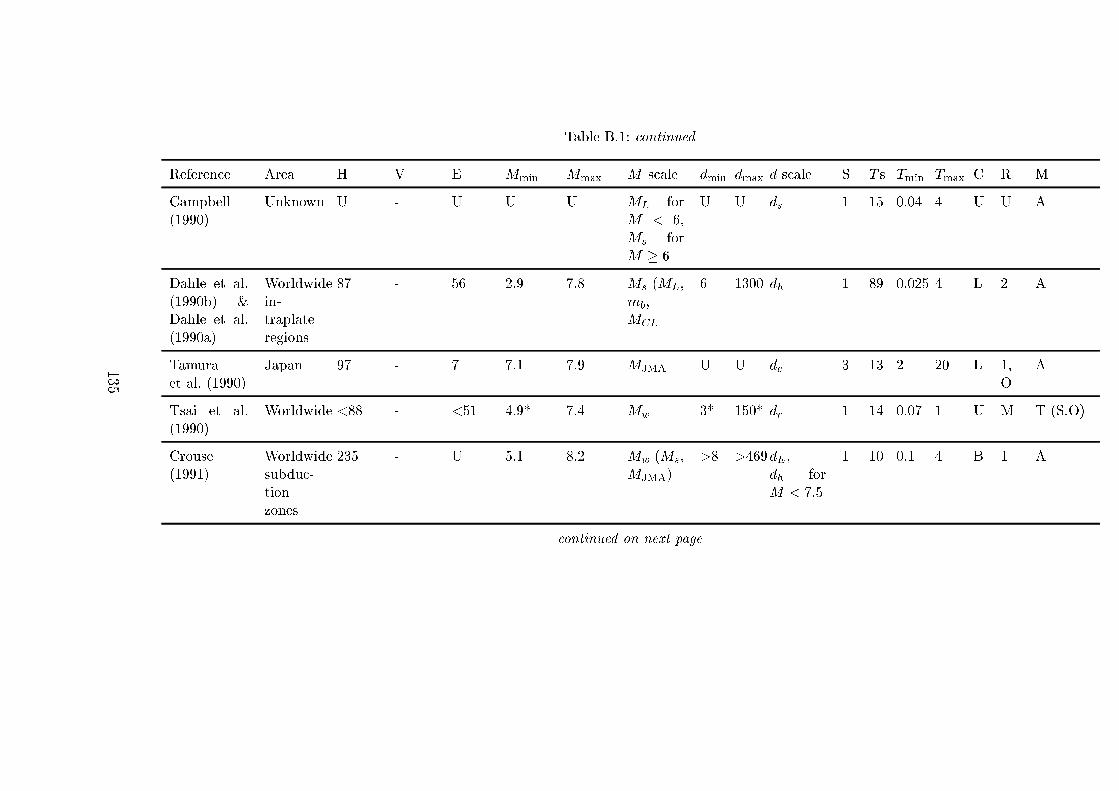
Table B.1: ontinued
Referen e Area H V E M
min
M
max
M s ale d
min
d
max
d s ale S T s T
min
T
max
C R M
Campbell
(1990)
Unknown U - U U U M
L
for
M < 6,
M
s
for
M � 6
U U d
s
1 15 0.04 4 U U A
Dahle et al.
(1990b) &
Dahle et al.
(1990a)
Worldwide
in-
traplate
regions
87 - 56 2.9 7.8 M
s
(M
L
,
m
b
,
M
CL
6 1300 d
h
1 89 0.025 4 L 2 A
Tamura
et al. (1990)
Japan 97 - 7 7.1 7.9 M
JMA
U U d
e
3 13 2 20 L 1,
O
A
Tsai et al.
(1990)
Worldwide <88 - <51 4.9* 7.4 M
w
3* 150* d
r
1 14 0.07 1 U M T (S,O)
Crouse
(1991)
Worldwide
subdu -
tion
zones
235 - U 5.1 8.2 M
w
(M
s
,
M
JMA
)
>8 >469d
E
,
d
h
for
M < 7:5
1 10 0.1 4 B 1 A
ontinued on next page
135
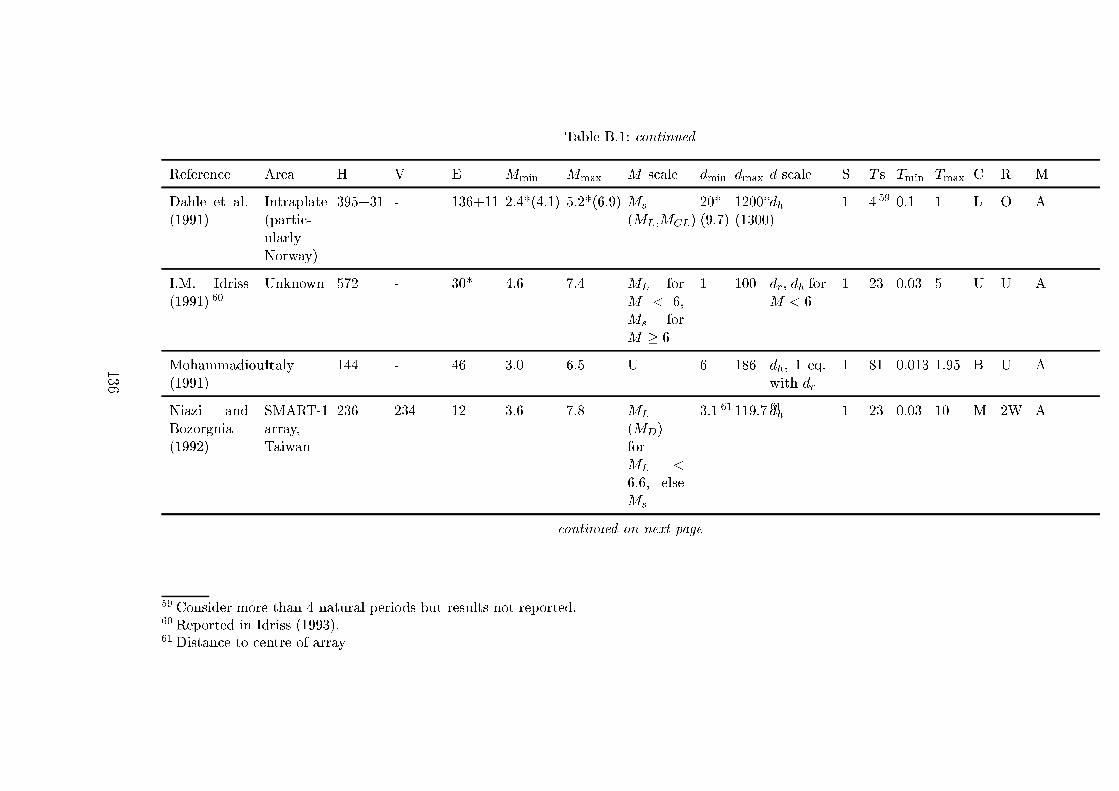
Table B.1: ontinued
Referen e Area H V E M
min
M
max
M s ale d
min
d
max
d s ale S T s T
min
T
max
C R M
Dahle et al.
(1991)
Intraplate
(parti -
ularly
Norway)
395+31 - 136+11 2.4*(4.1) 5.2*(6.9) M
s
(M
L
,M
CL
)
20*
(9.7)
1200*
(1300)
d
h
1 4
59
0.1 1 L O A
I.M. Idriss
(1991)
60
Unknown 572 - 30* 4.6 7.4 M
L
for
M < 6,
M
s
for
M � 6
1 100 d
r
, d
h
for
M < 6
1 23 0.03 5 U U A
Mohammadioun
(1991)
Italy 144 - 46 3.0 6.5 U 6 186 d
h
, 1 eq.
with d
r
1 81 0.013 1.95 B U A
Niazi and
Bozorgnia
(1992)
SMART-1
array,
Taiwan
236 234 12 3.6 7.8 M
L
(M
D
)
for
M
L
<
6:6, else
M
s
3.1
61
119.7
61
d
h
1 23 0.03 10 M 2W A
ontinued on next page
59
Consider more than 4 natural periods but results not reported.
60
Reported in Idriss (1993).
61
Distan e to entre of array
136
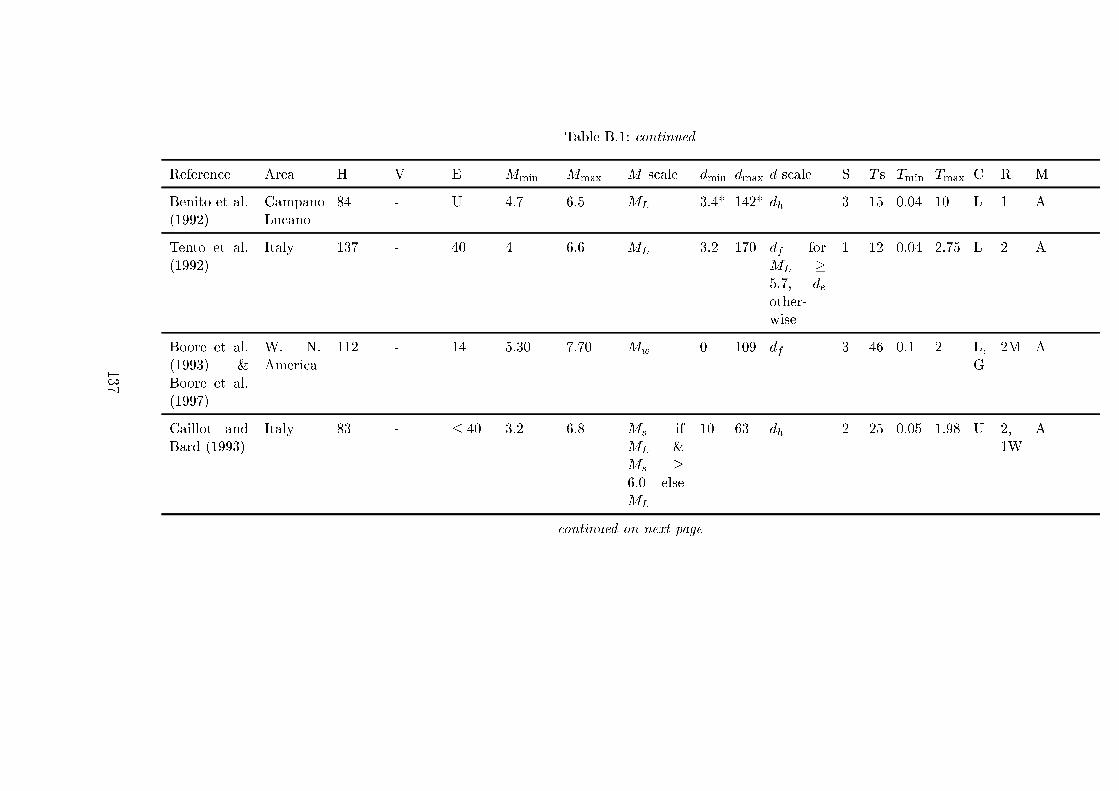
Table B.1: ontinued
Referen e Area H V E M
min
M
max
M s ale d
min
d
max
d s ale S T s T
min
T
max
C R M
Benito et al.
(1992)
Campano
Lu ano
84 - U 4.7 6.5 M
L
3.4* 142* d
h
3 15 0.04 10 L 1 A
Tento et al.
(1992)
Italy 137 - 40 4 6.6 M
L
3.2 170 d
f
for
M
L
�
5:7, d
e
other-
wise
1 12 0.04 2.75 L 2 A
Boore et al.
(1993) &
Boore et al.
(1997)
W. N.
Ameri a
112 - 14 5.30 7.70 M
w
0 109 d
f
3 46 0.1 2 L,
G
2M A
Caillot and
Bard (1993)
Italy 83 - � 40 3.2 6.8 M
s
if
M
L
&
M
s
�
6:0 else
M
L
10 63 d
h
2 25 0.05 1.98 U 2,
1W
A
ontinued on next page
137
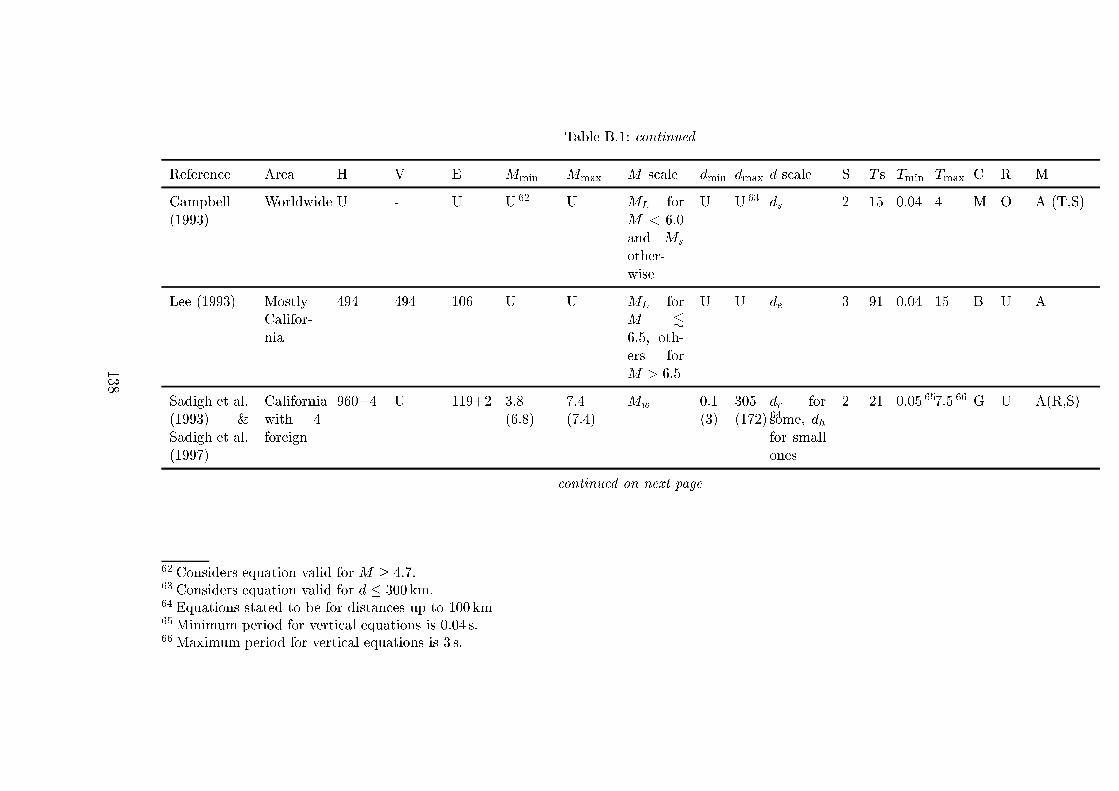
Table B.1: ontinued
Referen e Area H V E M
min
M
max
M s ale d
min
d
max
d s ale S T s T
min
T
max
C R M
Campbell
(1993)
Worldwide U - U U
62
U M
L
for
M < 6:0
and M
s
other-
wise
U U
63
d
s
2 15 0.04 4 M O A (T,S)
Lee (1993) Mostly
Califor-
nia
494 494 106 U U M
L
for
M .
6:5, oth-
ers for
M > 6:5
U U d
e
3 91 0.04 15 B U A
Sadigh et al.
(1993) &
Sadigh et al.
(1997)
California
with 4
foreign
960+4 U 119+2 3.8
(6.8)
7.4
(7.4)
M
w
0.1
(3)
305
(172)
64
d
r
for
some, d
h
for small
ones
2 21 0.05
65
7.5
66
G U A(R,S)
ontinued on next page
62
Considers equation valid for M � 4:7.
63
Considers equation valid for d � 300 km.
64
Equations stated to be for distan es up to 100 km
65
Minimum period for verti al equations is 0:04 s.
66
Maximum period for verti al equations is 3 s.
138
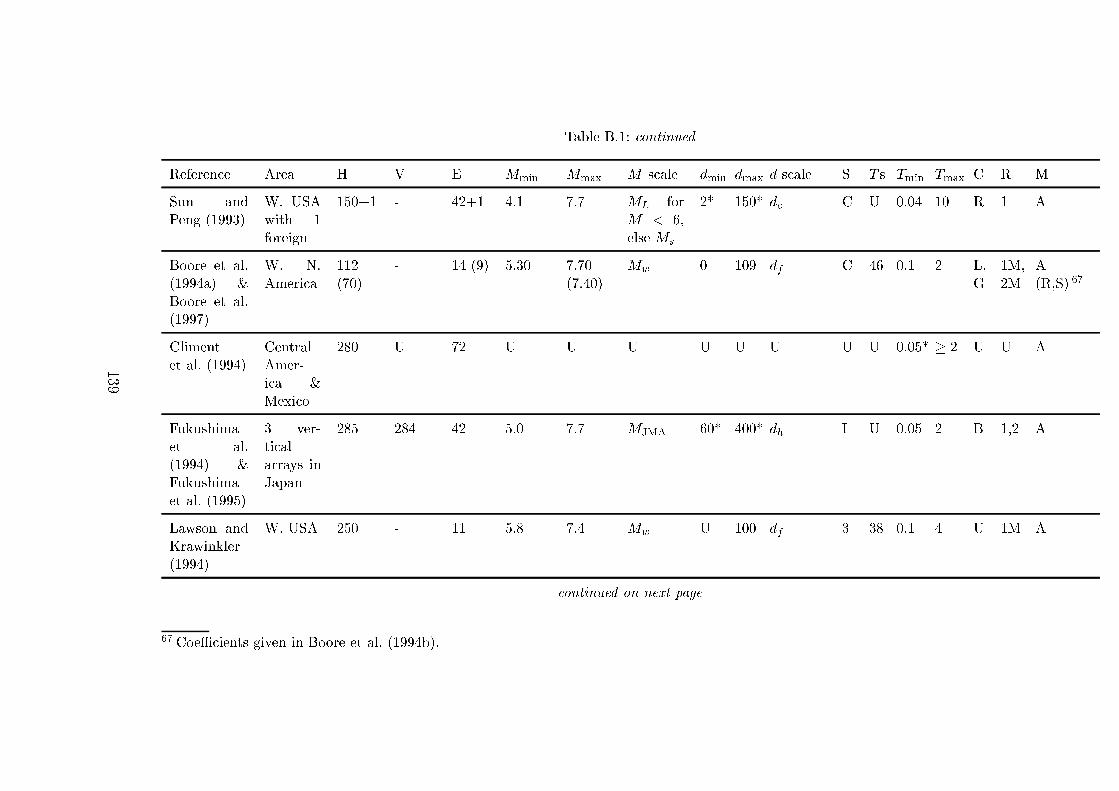
Table B.1: ontinued
Referen e Area H V E M
min
M
max
M s ale d
min
d
max
d s ale S T s T
min
T
max
C R M
Sun and
Peng (1993)
W. USA
with 1
foreign
150+1 - 42+1 4.1 7.7 M
L
for
M < 6,
else M
s
2* 150* d
e
C U 0.04 10 R 1 A
Boore et al.
(1994a) &
Boore et al.
(1997)
W. N.
Ameri a
112
(70)
- 14 (9) 5.30 7.70
(7.40)
M
w
0 109 d
f
C 46 0.1 2 L,
G
1M,
2M
A(R,S)
67
Climent
et al. (1994)
Central
Amer-
i a &
Mexi o
280 U 72 U U U U U U U U 0.05* � 2 U U A
Fukushima
et al.
(1994) &
Fukushima
et al. (1995)
3 ver-
ti al
arrays in
Japan
285 284 42 5.0 7.7 M
JMA
60* 400* d
h
I U 0.05 2 B 1,2 A
Lawson and
Krawinkler
(1994)
W. USA 250+ - 11 5.8 7.4 M
w
U 100 d
f
3 38 0.1 4 U 1M A
ontinued on next page
67
CoeÆ ients given in Boore et al. (1994b).
139
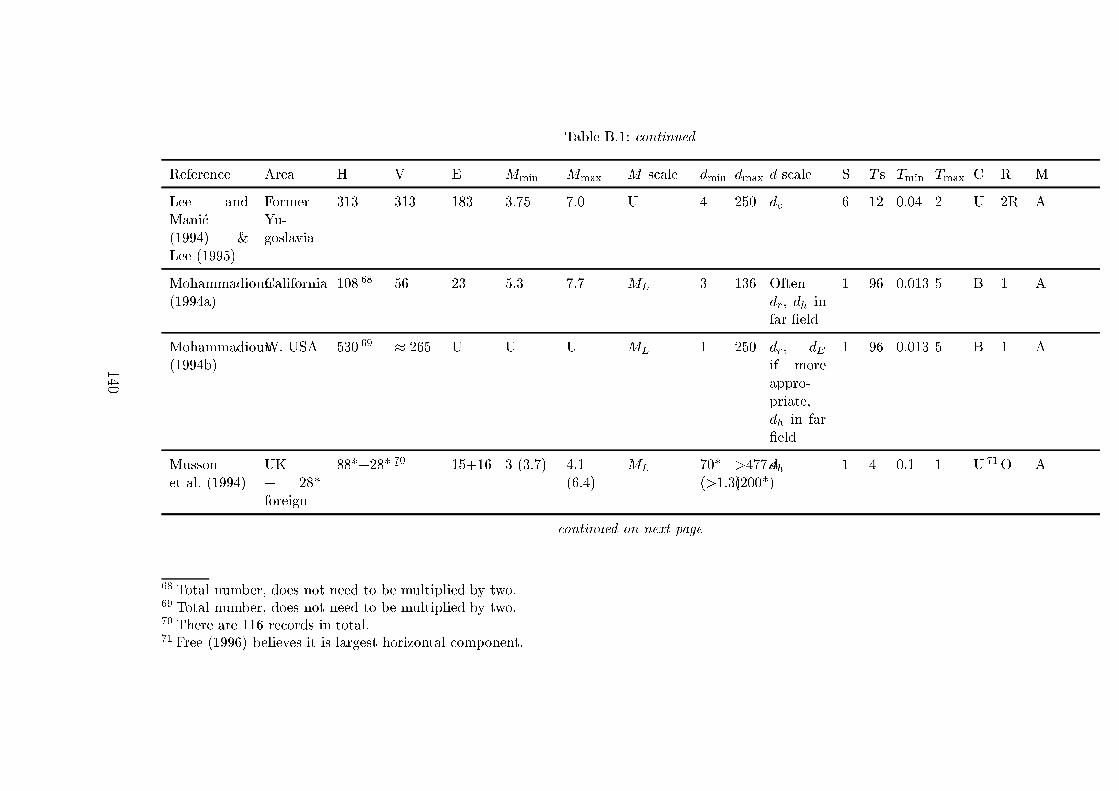
Table B.1: ontinued
Referen e Area H V E M
min
M
max
M s ale d
min
d
max
d s ale S T s T
min
T
max
C R M
Lee and
Mani�
(1994) &
Lee (1995)
Former
Yu-
goslavia
313 313 183 3.75 7.0 U 4 250 d
e
6 12 0.04 2 U 2R A
Mohammadioun
(1994a)
California 108
68
56 23 5.3 7.7 M
L
3 136 Often
d
r
, d
h
in
far �eld
1 96 0.013 5 B 1 A
Mohammadioun
(1994b)
W. USA 530
69
� 265 U U U M
L
1 250 d
r
, d
E
if more
appro-
priate,
d
h
in far
�eld
1 96 0.013 5 B 1 A
Musson
et al. (1994)
UK
+ 28*
foreign
88*+28*
70
- 15+16 3 (3.7) 4.1
(6.4)
M
L
70*
(>1.3)
>477.4
(200*)
d
h
1 4 0.1 1 U
71
O A
ontinued on next page
68
Total number, does not need to be multiplied by two.
69
Total number, does not need to be multiplied by two.
70
There are 116 re ords in total.
71
Free (1996) believes it is largest horizontal omponent.
140
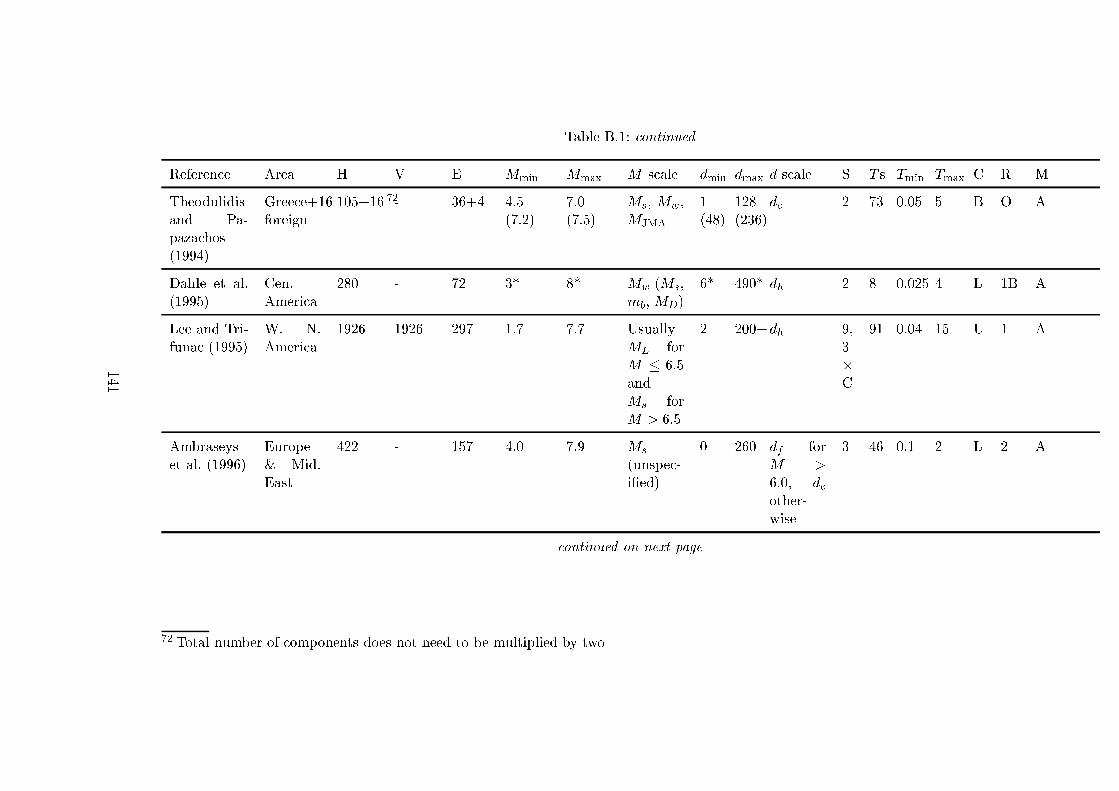
Table B.1: ontinued
Referen e Area H V E M
min
M
max
M s ale d
min
d
max
d s ale S T s T
min
T
max
C R M
Theodulidis
and Pa-
paza hos
(1994)
Gree e+16
foreign
105+16
72
- 36+4 4.5
(7.2)
7.0
(7.5)
M
s
, M
w
,
M
JMA
1(48)
128
(236)
d
e
2 73 0.05 5 B O A
Dahle et al.
(1995)
Cen.
Ameri a
280 - 72 3* 8* M
w
(M
s
,
m
b
, M
D
)
6* 490* d
h
2 8 0.025 4 L 1B A
Lee and Tri-
funa (1995)
W. N.
Ameri a
1926 1926 297 1.7 7.7 Usually
M
L
for
M � 6:5
and
M
s
for
M > 6:5
2 200+d
h
9,
3�
C
91 0.04 15 U 1 A
Ambraseys
et al. (1996)
Europe
& Mid.
East
422 - 157 4.0 7.9 M
s
(unspe -
i�ed)
0 260 d
f
for
M >
6:0, d
e
other-
wise
3 46 0.1 2 L 2 A
ontinued on next page
72
Total number of omponents does not need to be multiplied by two
141
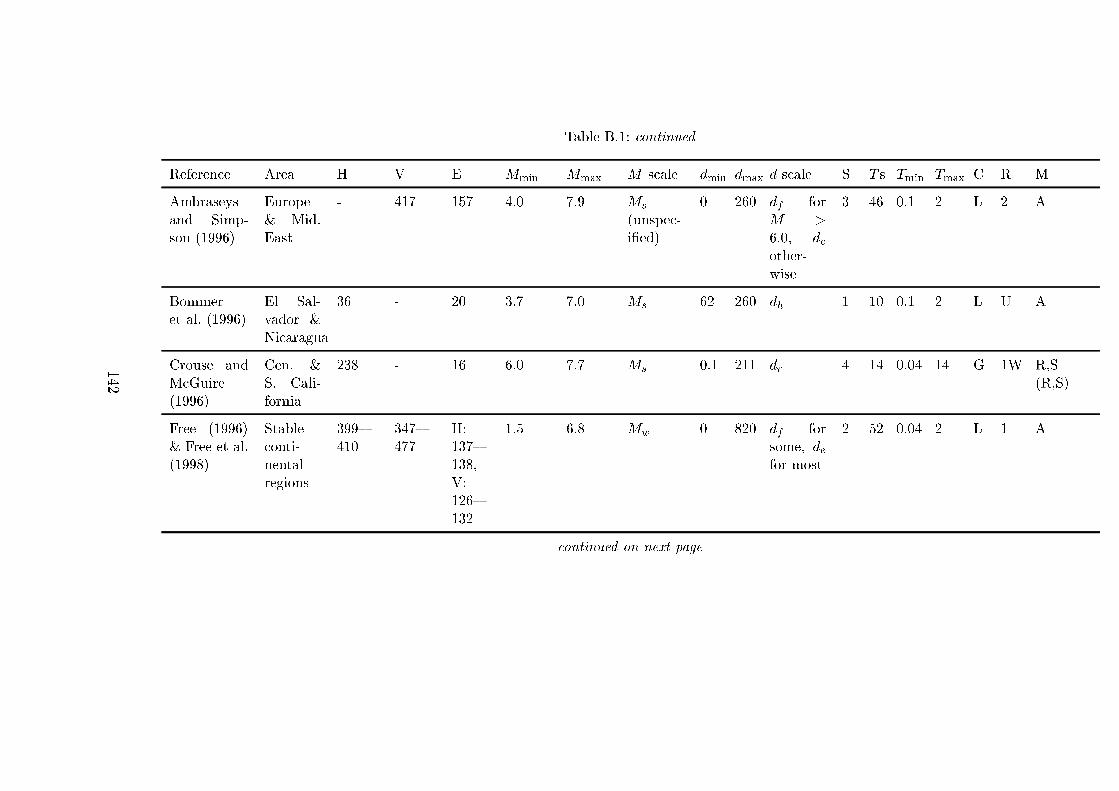
Table B.1: ontinued
Referen e Area H V E M
min
M
max
M s ale d
min
d
max
d s ale S T s T
min
T
max
C R M
Ambraseys
and Simp-
son (1996)
Europe
& Mid.
East
- 417 157 4.0 7.9 M
s
(unspe -
i�ed)
0 260 d
f
for
M >
6:0, d
e
other-
wise
3 46 0.1 2 L 2 A
Bommer
et al. (1996)
El Sal-
vador &
Ni aragua
36 - 20 3.7 7.0 M
s
62 260 d
h
1 10 0.1 2 L U A
Crouse and
M Guire
(1996)
Cen. &
S. Cali-
fornia
238 - 16 6.0 7.7 M
s
0.1 211 d
r
4 14 0.04 14 G 1W R,S
(R,S)
Free (1996)
& Free et al.
(1998)
Stable
onti-
nental
regions
399{
410
347{
477
H:
137{
138,
V:
126{
132
1.5 6.8 M
w
0 820 d
f
for
some, d
e
for most
2 52 0.04 2 L 1 A
ontinued on next page
142
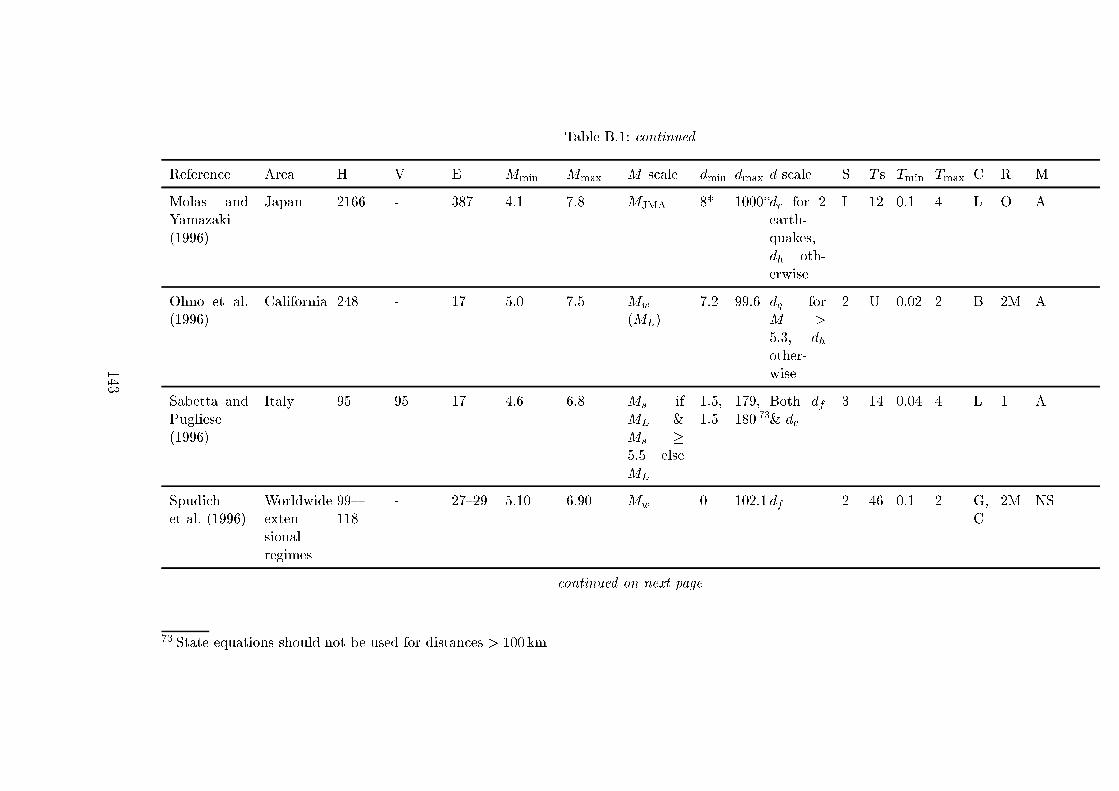
Table B.1: ontinued
Referen e Area H V E M
min
M
max
M s ale d
min
d
max
d s ale S T s T
min
T
max
C R M
Molas and
Yamazaki
(1996)
Japan 2166 - 387 4.1 7.8 M
JMA
8* 1000*d
r
for 2
earth-
quakes,
d
h
oth-
erwise
I 12 0.1 4 L O A
Ohno et al.
(1996)
California 248 - 17 5.0 7.5 M
w
(M
L
)
7.2 99.6 d
q
for
M >
5:3, d
h
other-
wise
2 U 0.02 2 B 2M A
Sabetta and
Pugliese
(1996)
Italy 95 95 17 4.6 6.8 M
s
if
M
L
&
M
s
�
5:5 else
M
L
1.5,
1.5
179,
180
73
Both d
f
& d
e
3 14 0.04 4 L 1 A
Spudi h
et al. (1996)
Worldwide
exten-
sional
regimes
99{
118
- 27{29 5.10 6.90 M
w
0 102.1d
f
2 46 0.1 2 G,
C
2M NS
ontinued on next page
73
State equations should not be used for distan es > 100 km
143
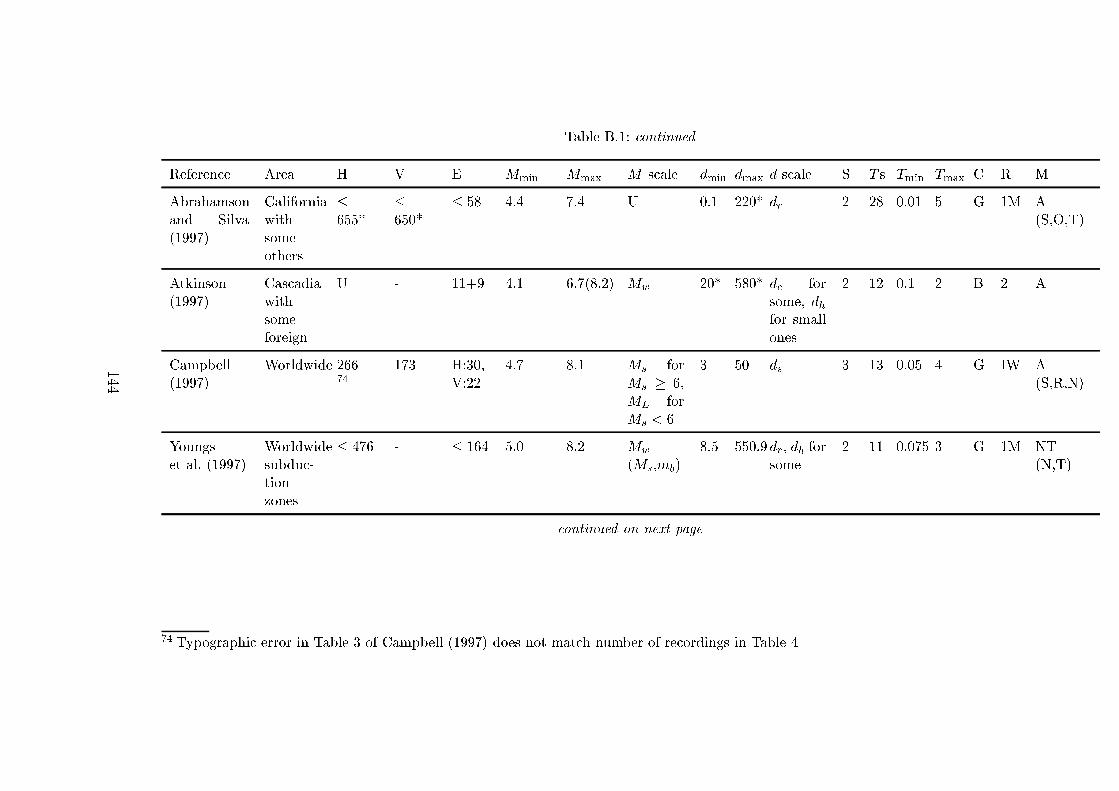
Table B.1: ontinued
Referen e Area H V E M
min
M
max
M s ale d
min
d
max
d s ale S T s T
min
T
max
C R M
Abrahamson
and Silva
(1997)
California
with
some
others
�655*
�650*
� 58 4.4 7.4 U 0.1 220* d
r
2 28 0.01 5 G 1M A(S,O,T)
Atkinson
(1997)
Cas adia
with
some
foreign
U - 11+9 4.1 6.7(8.2) M
w
20* 580* d
for
some, d
h
for small
ones
2 12 0.1 2 B 2 A
Campbell
(1997)
Worldwide 266
74
173 H:30,
V:22
4.7 8.1 M
s
for
M
s
� 6,
M
L
for
M
s
< 6
3 50 d
s
3 13 0.05 4 G IW A(S,R,N)
Youngs
et al. (1997)
Worldwide
subdu -
tion
zones
� 476 - � 164 5.0 8.2 M
w
(M
s
,m
b
)
8.5 550.9d
r
, d
h
for
some
2 11 0.075 3 G 1M NT
(N,T)
ontinued on next page
74
Typographi error in Table 3 of Campbell (1997) does not mat h number of re ordings in Table 4
144
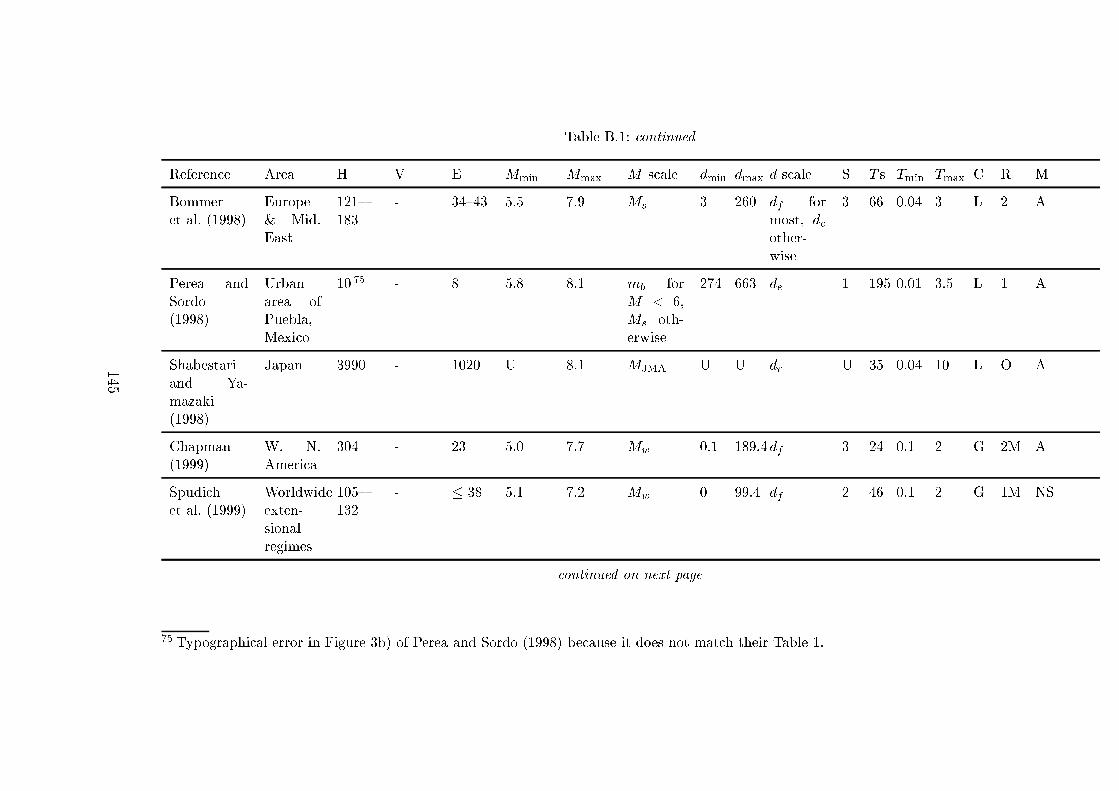
Table B.1: ontinued
Referen e Area H V E M
min
M
max
M s ale d
min
d
max
d s ale S T s T
min
T
max
C R M
Bommer
et al. (1998)
Europe
& Mid.
East
121{
183
- 34{43 5.5 7.9 M
s
3 260 d
f
for
most, d
e
other-
wise
3 66 0.04 3 L 2 A
Perea and
Sordo
(1998)
Urban
area of
Puebla,
Mexi o
10
75
- 8 5.8 8.1 m
b
for
M < 6,
M
s
oth-
erwise
274 663 d
e
1 195 0.01 3.5 L 1 A
Shabestari
and Ya-
mazaki
(1998)
Japan 3990 - 1020 U 8.1 M
JMA
U U d
r
U 35 0.04 10 L O A
Chapman
(1999)
W. N.
Ameri a
304 - 23 5.0 7.7 M
w
0.1 189.4d
f
3 24 0.1 2 G 2M A
Spudi h
et al. (1999)
Worldwide
exten-
sional
regimes
105{
132
- � 38 5.1 7.2 M
w
0 99.4 d
f
2 46 0.1 2 G 1M NS
ontinued on next page
75
Typographi al error in Figure 3b) of Perea and Sordo (1998) be ause it does not mat h their Table 1.
145
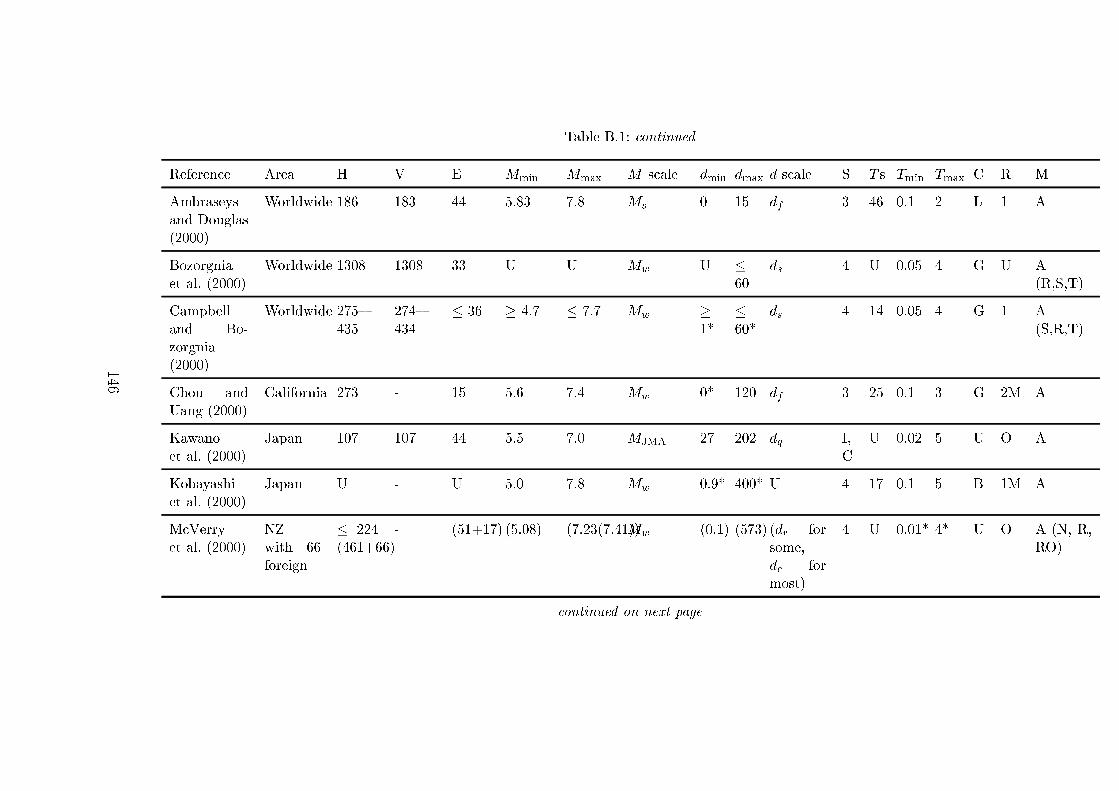
Table B.1: ontinued
Referen e Area H V E M
min
M
max
M s ale d
min
d
max
d s ale S T s T
min
T
max
C R M
Ambraseys
and Douglas
(2000)
Worldwide 186 183 44 5.83 7.8 M
s
0 15 d
f
3 46 0.1 2 L 1 A
Bozorgnia
et al. (2000)
Worldwide 1308 1308 33 U U M
w
U �60
d
s
4 U 0.05 4 G U A(R,S,T)
Campbell
and Bo-
zorgnia
(2000)
Worldwide 275{
435
274{
434
� 36 � 4.7 � 7.7 M
w
�1*
�60*
d
s
4 14 0.05 4 G 1 A(S,R,T)
Chou and
Uang (2000)
California 273 - 15 5.6 7.4 M
w
0* 120 d
f
3 25 0.1 3 G 2M A
Kawano
et al. (2000)
Japan 107 107 44 5.5 7.0 M
JMA
27 202 d
q
I,
C
U 0.02 5 U O A
Kobayashi
et al. (2000)
Japan U - U 5.0 7.8 M
w
0.9* 400* U 4 17 0.1 5 B 1M A
M Verry
et al. (2000)
NZ
with 66
foreign
� 224
(461+66)
- (51+17) (5.08) (7.23(7.41))M
w
(0.1) (573) (d
r
for
some,
d
for
most)
4 U 0.01* 4* U O A (N, R,
RO)
ontinued on next page
146
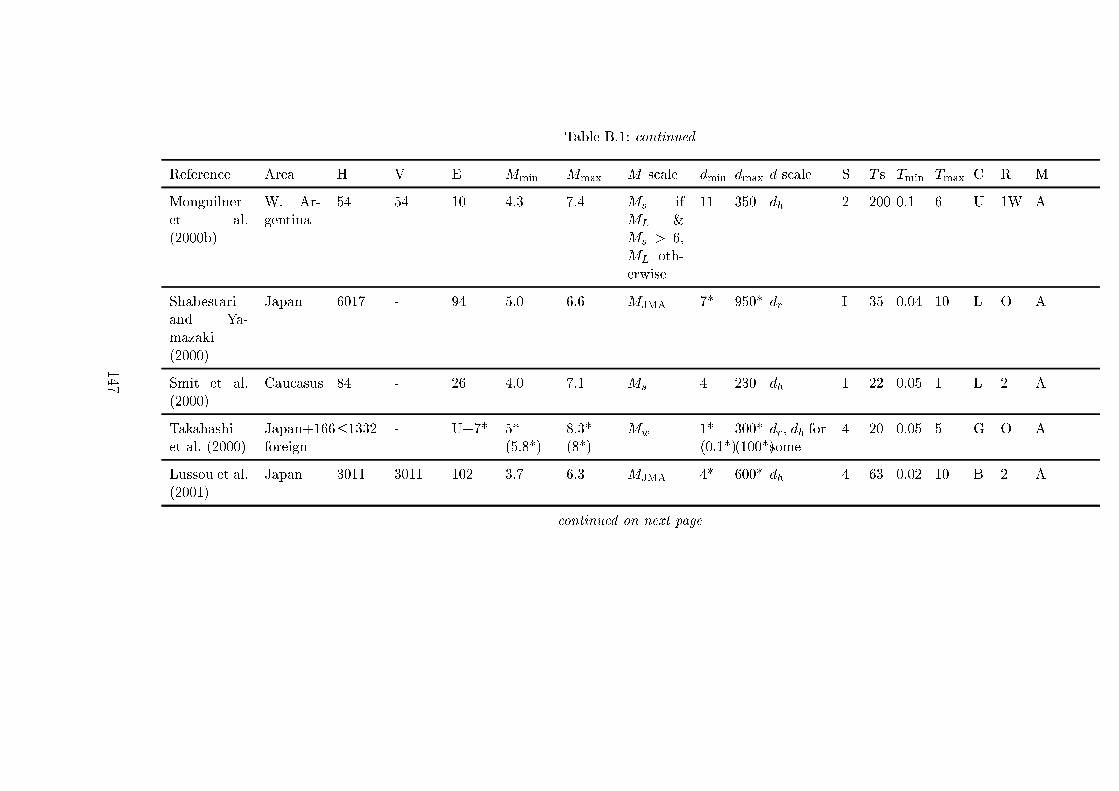
Table B.1: ontinued
Referen e Area H V E M
min
M
max
M s ale d
min
d
max
d s ale S T s T
min
T
max
C R M
Monguilner
et al.
(2000b)
W. Ar-
gentina
54 54 10 4.3 7.4 M
s
if
M
L
&
M
s
> 6,
M
L
oth-
erwise
11 350 d
h
2 200 0.1 6 U 1W A
Shabestari
and Ya-
mazaki
(2000)
Japan 6017 - 94 5.0 6.6 M
JMA
7* 950* d
r
I 35 0.04 10 L O A
Smit et al.
(2000)
Cau asus 84 - 26 4.0 7.1 M
s
4 230 d
h
1 22 0.05 1 L 2 A
Takahashi
et al. (2000)
Japan+166
foreign
�1332 - U+7* 5*
(5.8*)
8.3*
(8*)
M
w
1*
(0.1*)
300*
(100*)
d
r
, d
h
for
some
4 20 0.05 5 G O A
Lussou et al.
(2001)
Japan 3011 3011 102 3.7 6.3 M
JMA
4* 600* d
h
4 63 0.02 10 B 2 A
ontinued on next page
147
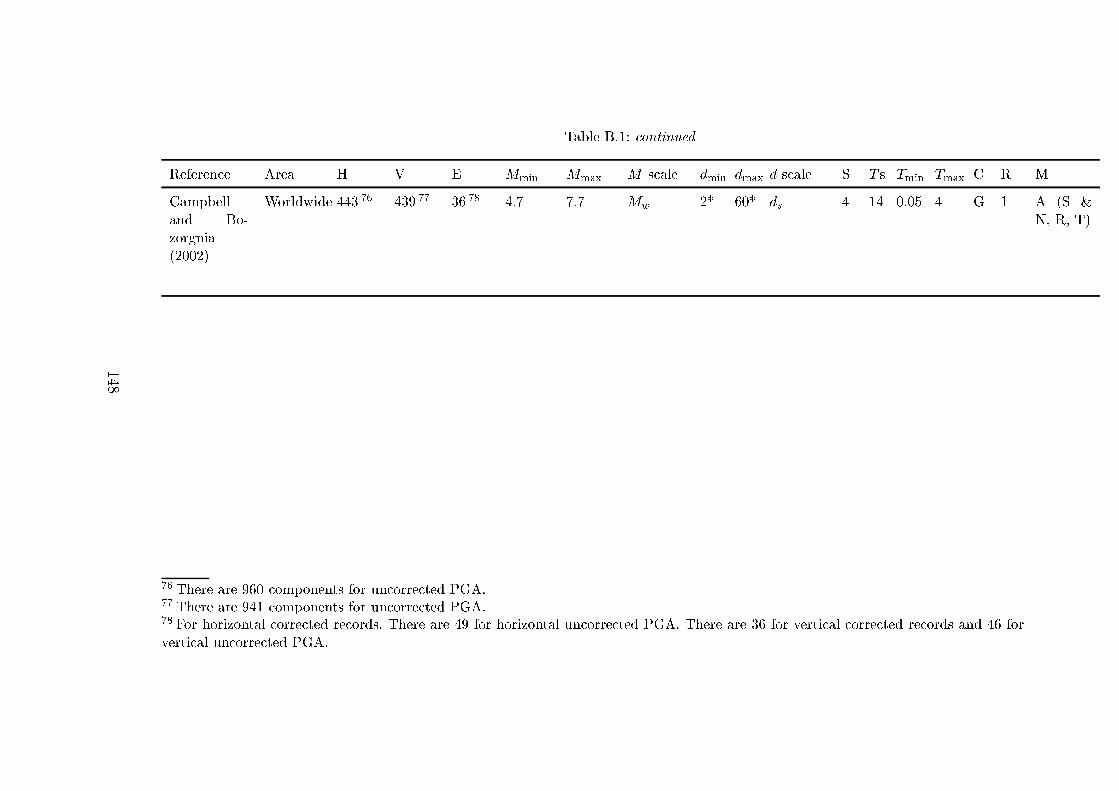
Table B.1: ontinued
Referen e Area H V E M
min
M
max
M s ale d
min
d
max
d s ale S T s T
min
T
max
C R M
Campbell
and Bo-
zorgnia
(2002)
Worldwide 443
76
439
77
36
78
4.7 7.7 M
w
2* 60* d
s
4 14 0.05 4 G 1 A (S &
N, R, T)
76
There are 960 omponents for un orre ted PGA.
77
There are 941 omponents for un orre ted PGA.
78
For horizontal orre ted re ords. There are 49 for horizontal un orre ted PGA. There are 36 for verti al orre ted re ords and 46 for
verti al un orre ted PGA.
148
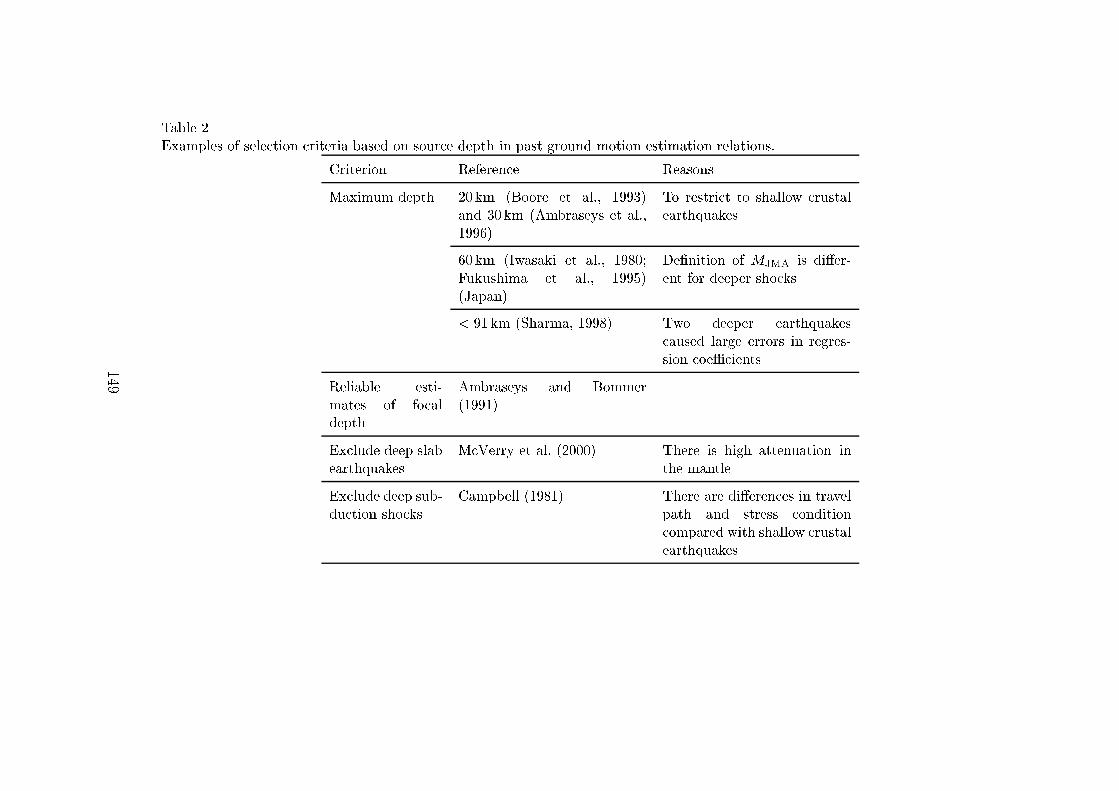
Table 2
Examples of sele tion riteria based on sour e depth in past ground motion estimation relations.
Criterion Referen e Reasons
Maximum depth 20 km (Boore et al., 1993)
and 30 km (Ambraseys et al.,
1996)
To restri t to shallow rustal
earthquakes
60 km (Iwasaki et al., 1980;
Fukushima et al., 1995)
(Japan)
De�nition of M
JMA
is di�er-
ent for deeper sho ks
< 91 km (Sharma, 1998) Two deeper earthquakes
aused large errors in regres-
sion oeÆ ients
Reliable esti-
mates of fo al
depth
Ambraseys and Bommer
(1991)
Ex lude deep slab
earthquakes
M Verry et al. (2000) There is high attenuation in
the mantle
Ex lude deep sub-
du tion sho ks
Campbell (1981) There are di�eren es in travel
path and stress ondition
ompared with shallow rustal
earthquakes
149
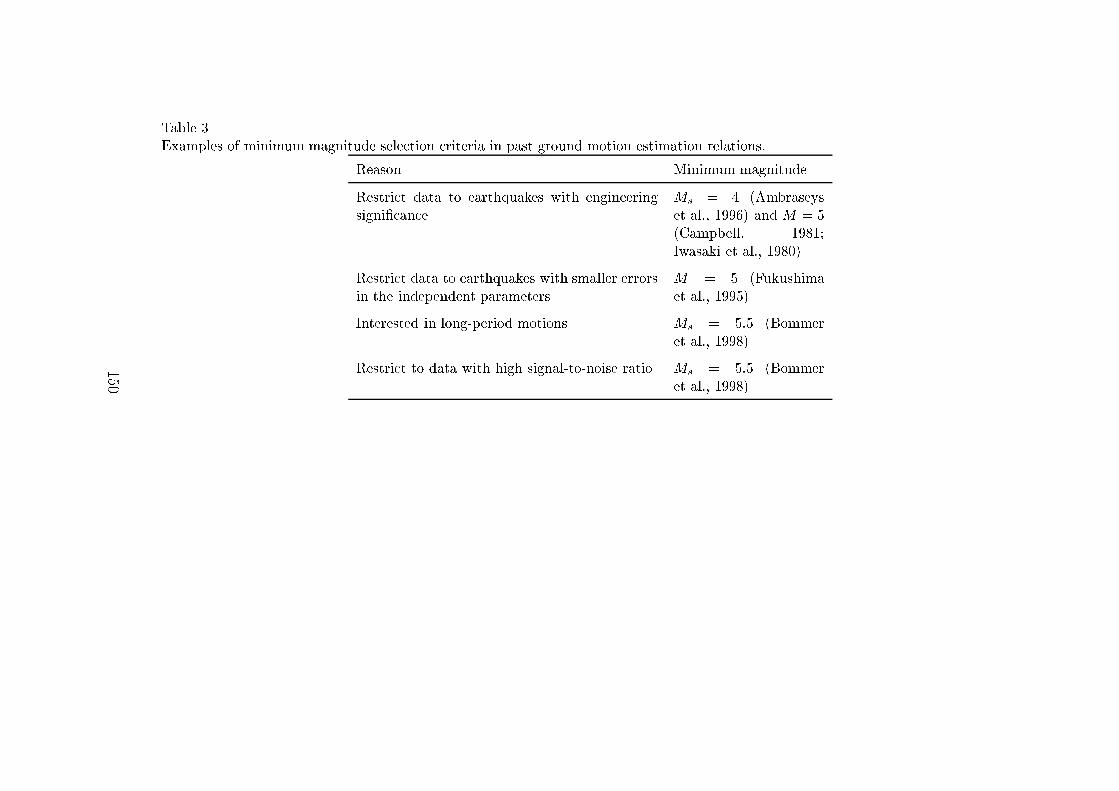
Table 3
Examples of minimum magnitude sele tion riteria in past ground motion estimation relations.
Reason Minimum magnitude
Restri t data to earthquakes with engineering
signi� an e
M
s
= 4 (Ambraseys
et al., 1996) and M = 5
(Campbell, 1981;
Iwasaki et al., 1980)
Restri t data to earthquakes with smaller errors
in the independent parameters
M = 5 (Fukushima
et al., 1995)
Interested in long-period motions M
s
= 5:5 (Bommer
et al., 1998)
Restri t to data with high signal-to-noise ratio M
s
= 5:5 (Bommer
et al., 1998)
150
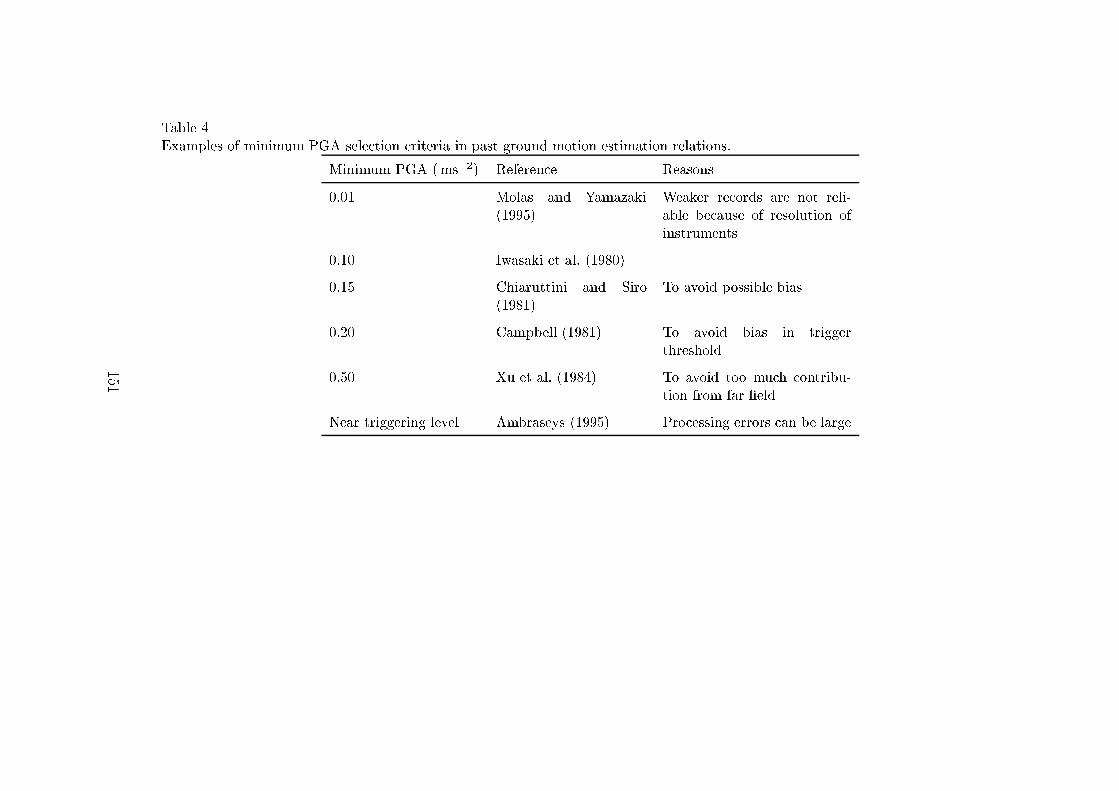
Table 4
Examples of minimum PGA sele tion riteria in past ground motion estimation relations.
Minimum PGA (ms
�2
) Referen e Reasons
0:01 Molas and Yamazaki
(1995)
Weaker re ords are not reli-
able be ause of resolution of
instruments
0:10 Iwasaki et al. (1980)
0:15 Chiaruttini and Siro
(1981)
To avoid possible bias
0:20 Campbell (1981) To avoid bias in trigger
threshold
0:50 Xu et al. (1984) To avoid too mu h ontribu-
tion from far �eld
Near triggering level Ambraseys (1995) Pro essing errors an be large
151
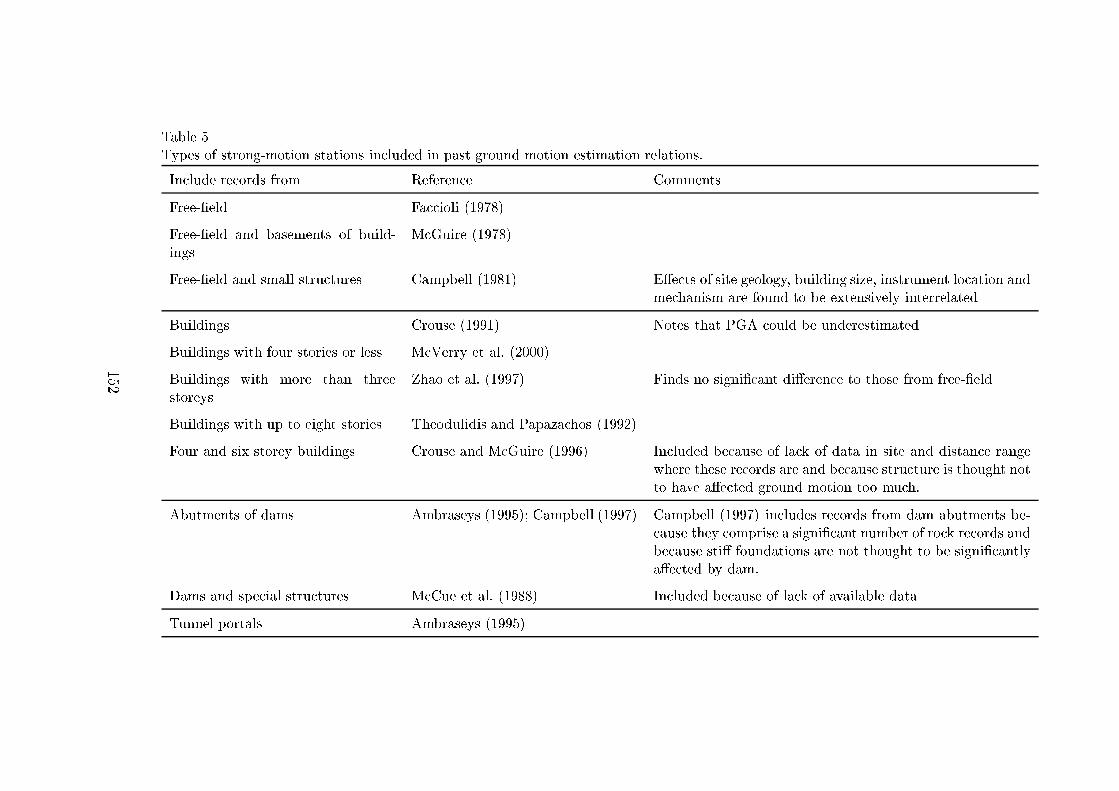
Table 5
Types of strong-motion stations in luded in past ground motion estimation relations.
In lude re ords from Referen e Comments
Free-�eld Fa ioli (1978)
Free-�eld and basements of build-
ings
M Guire (1978)
Free-�eld and small stru tures Campbell (1981) E�e ts of site geology, building size, instrument lo ation and
me hanism are found to be extensively interrelated
Buildings Crouse (1991) Notes that PGA ould be underestimated
Buildings with four stories or less M Verry et al. (2000)
Buildings with more than three
storeys
Zhao et al. (1997) Finds no signi� ant di�eren e to those from free-�eld
Buildings with up to eight stories Theodulidis and Papaza hos (1992)
Four and six storey buildings Crouse and M Guire (1996) In luded be ause of la k of data in site and distan e range
where these re ords are and be ause stru ture is thought not
to have a�e ted ground motion too mu h.
Abutments of dams Ambraseys (1995); Campbell (1997) Campbell (1997) in ludes re ords from dam abutments be-
ause they omprise a signi� ant number of ro k re ords and
be ause sti� foundations are not thought to be signi� antly
a�e ted by dam.
Dams and spe ial stru tures M Cue et al. (1988) In luded be ause of la k of available data
Tunnel portals Ambraseys (1995)
152
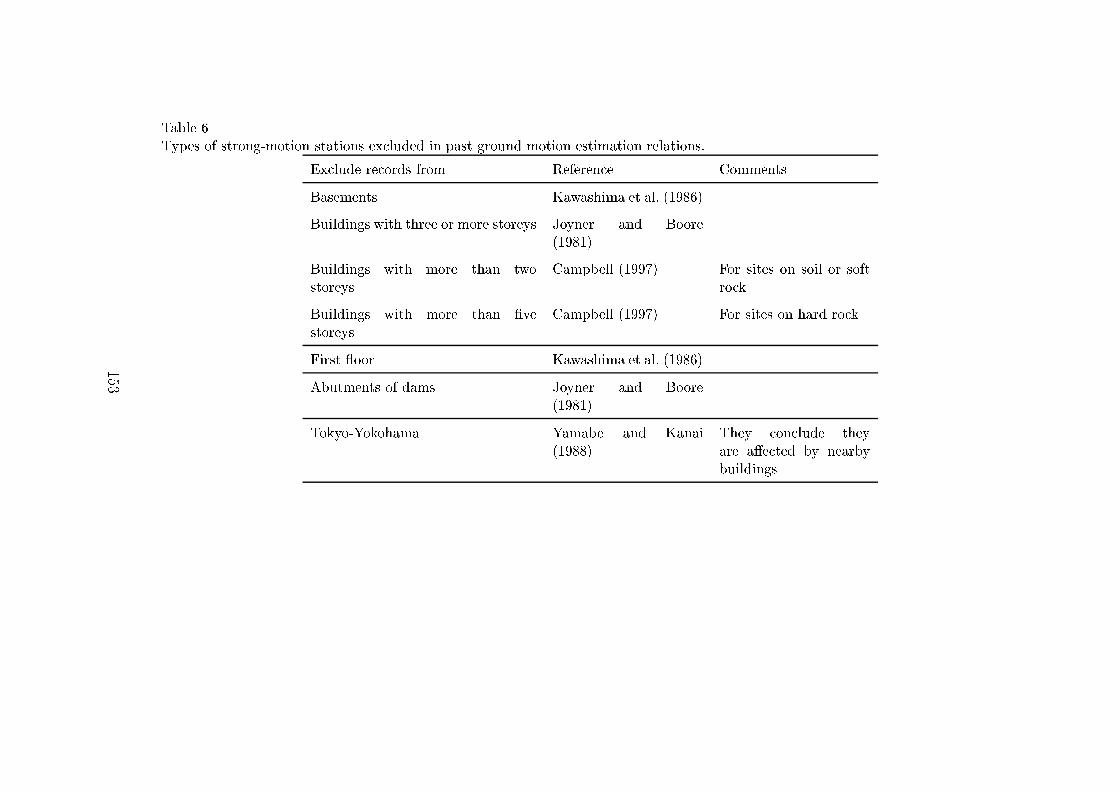
Table 6
Types of strong-motion stations ex luded in past ground motion estimation relations.
Ex lude re ords from Referen e Comments
Basements Kawashima et al. (1986)
Buildings with three or more storeys Joyner and Boore
(1981)
Buildings with more than two
storeys
Campbell (1997) For sites on soil or soft
ro k
Buildings with more than �ve
storeys
Campbell (1997) For sites on hard ro k
First oor Kawashima et al. (1986)
Abutments of dams Joyner and Boore
(1981)
Tokyo-Yokohama Yamabe and Kanai
(1988)
They on lude they
are a�e ted by nearby
buildings
153
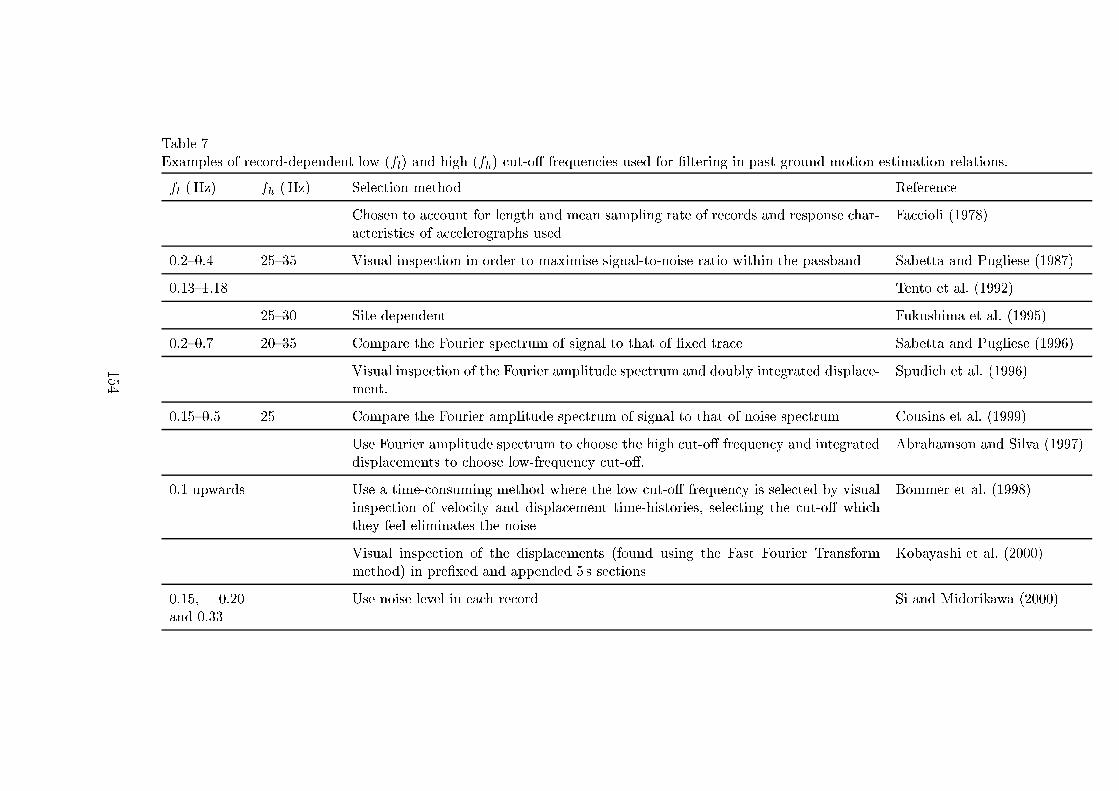
Table 7
Examples of re ord-dependent low (f
l
) and high (f
h
) ut-o� frequen ies used for �ltering in past ground motion estimation relations.
f
l
(Hz) f
h
(Hz) Sele tion method Referen e
Chosen to a ount for length and mean sampling rate of re ords and response har-
a teristi s of a elerographs used
Fa ioli (1978)
0:2{0:4 25{35 Visual inspe tion in order to maximise signal-to-noise ratio within the passband Sabetta and Pugliese (1987)
0:13{1:18 Tento et al. (1992)
25{30 Site dependent Fukushima et al. (1995)
0:2{0:7 20{35 Compare the Fourier spe trum of signal to that of �xed tra e Sabetta and Pugliese (1996)
Visual inspe tion of the Fourier amplitude spe trum and doubly integrated displa e-
ment.
Spudi h et al. (1996)
0:15{0:5 25 Compare the Fourier amplitude spe trum of signal to that of noise spe trum Cousins et al. (1999)
Use Fourier amplitude spe trum to hoose the high ut-o� frequen y and integrated
displa ements to hoose low-frequen y ut-o�.
Abrahamson and Silva (1997)
0:1 upwards Use a time- onsuming method where the low ut-o� frequen y is sele ted by visual
inspe tion of velo ity and displa ement time-histories, sele ting the ut-o� whi h
they feel eliminates the noise
Bommer et al. (1998)
Visual inspe tion of the displa ements (found using the Fast Fourier Transform
method) in pre�xed and appended 5 s se tions
Kobayashi et al. (2000)
0:15, 0:20
and 0:33
Use noise level in ea h re ord Si and Midorikawa (2000)
154
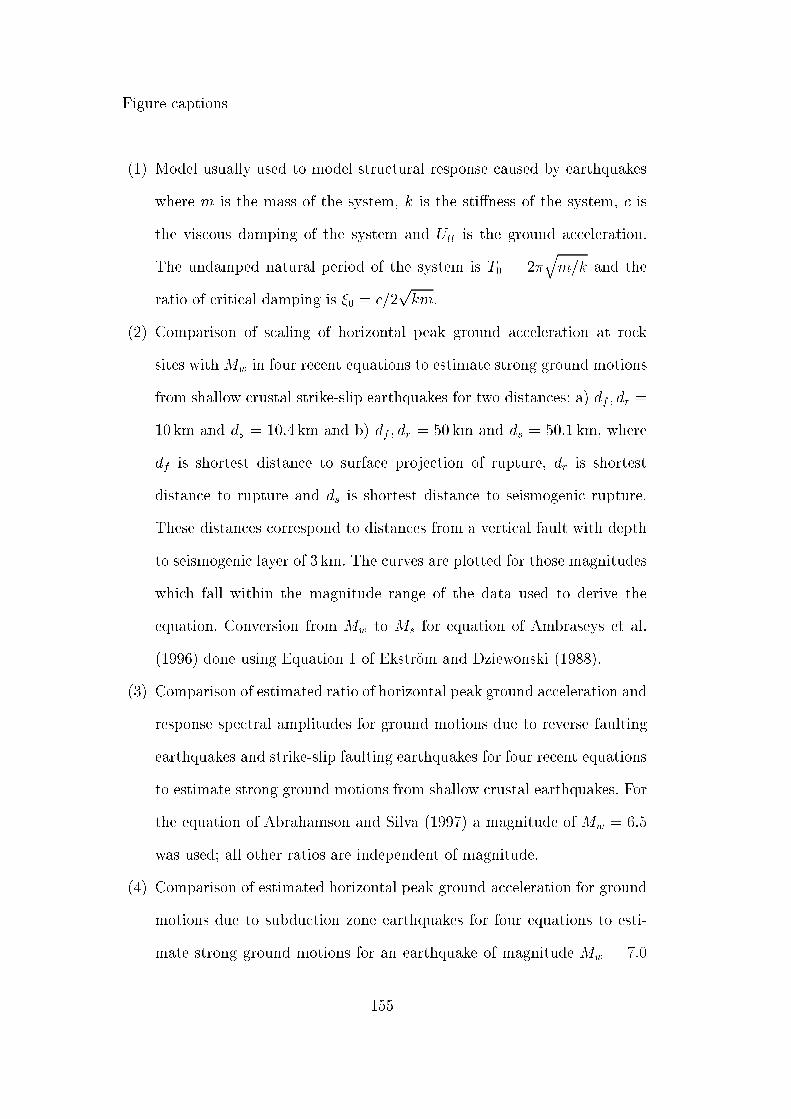
Figure aptions
(1) Model usually used to model stru tural response aused by earthquakes
where m is the mass of the system, k is the sti�ness of the system, is
the vis ous damping of the system and U
tt
is the ground a eleration.
The undamped natural period of the system is T
0
= 2�
q
m=k and the
ratio of riti al damping is �
0
= =2
p
km.
(2) Comparison of s aling of horizontal peak ground a eleration at ro k
sites withM
w
in four re ent equations to estimate strong ground motions
from shallow rustal strike-slip earthquakes for two distan es: a) d
f
; d
r
=
10 km and d
s
= 10:4 km and b) d
f
; d
r
= 50 km and d
s
= 50:1 km, where
d
f
is shortest distan e to surfa e proje tion of rupture, d
r
is shortest
distan e to rupture and d
s
is shortest distan e to seismogeni rupture.
These distan es orrespond to distan es from a verti al fault with depth
to seismogeni layer of 3 km. The urves are plotted for those magnitudes
whi h fall within the magnitude range of the data used to derive the
equation. Conversion from M
w
to M
s
for equation of Ambraseys et al.
(1996) done using Equation 1 of Ekstr�om and Dziewonski (1988).
(3) Comparison of estimated ratio of horizontal peak ground a eleration and
response spe tral amplitudes for ground motions due to reverse faulting
earthquakes and strike-slip faulting earthquakes for four re ent equations
to estimate strong ground motions from shallow rustal earthquakes. For
the equation of Abrahamson and Silva (1997) a magnitude of M
w
= 6:5
was used; all other ratios are independent of magnitude.
(4) Comparison of estimated horizontal peak ground a eleration for ground
motions due to subdu tion zone earthquakes for four equations to esti-
mate strong ground motions for an earthquake of magnitude M
w
= 7:0
155
and hypo entral distan e of 100 km. Equation of Crouse (1991) is plotted
for sti� soil site, equation of Molas and Yamazaki (1995) is plotted for
site oeÆ ient
i
= 0 (average site), equation of Cousins et al. (1999)
is plotted for soil site and a slab earthquake and equation of Takahashi
et al. (2000) is plotted for medium soil site. Assumed that all de�ni-
tions of depth used in the equations are equivalent to fo al depth for this
magnitude and distan e.
(5) Comparison of estimated ratio of horizontal peak ground a eleration and
response spe tral amplitudes for ground motions on: a) soft soil sites and
hard ro k sites and on: b) sti� soil sites and hard ro k sites, for four re ent
equations to estimate strong ground motions. Soft soil sites were assumed
to have an average shear-wave velo ity in the top 30m of 310ms
�1
and
hen e be within ategory S (180 < V
s;30
� 360ms
�1
) of Ambraseys et al.
(1996) and ategory C (200 < V
s;30
� 400ms
�1
) of Lussou et al. (2001);
for the equations of Boore et al. (1997) the a tual shear-wave velo ity was
used and for the equations of Campbell and Bozorgnia (2002) S
V FS
=
0:25, S
SR
= 0 and S
HR
= 0 as suggested by Table 5 of Campbell and
Bozorgnia (2002). Sti� soil sites were assumed to have an average shear-
wave velo ity in the top 30m of 420ms
�1
and hen e be within ategory
A (360 < V
s;30
� 750ms
�1
) of Ambraseys et al. (1996) and ategory
B (400 < V
s;30
� 800ms
�1
) of Lussou et al. (2001); for the equations
of Boore et al. (1997) the a tual shear-wave velo ity was used and for
the equations of Campbell and Bozorgnia (2002) S
V FS
= 0, S
SR
= 1 and
S
HR
= 0 as suggested by Table 5 of Campbell and Bozorgnia (2002). Hard
ro k sites were assumed to have an average shear-wave velo ity in the top
30m of 800ms
�1
and hen e be within ategory R (V
s;30
> 750ms
�1
) of
Ambraseys et al. (1996) and ategory A (V
s;30
> 800ms
�1
) of Lussou
156
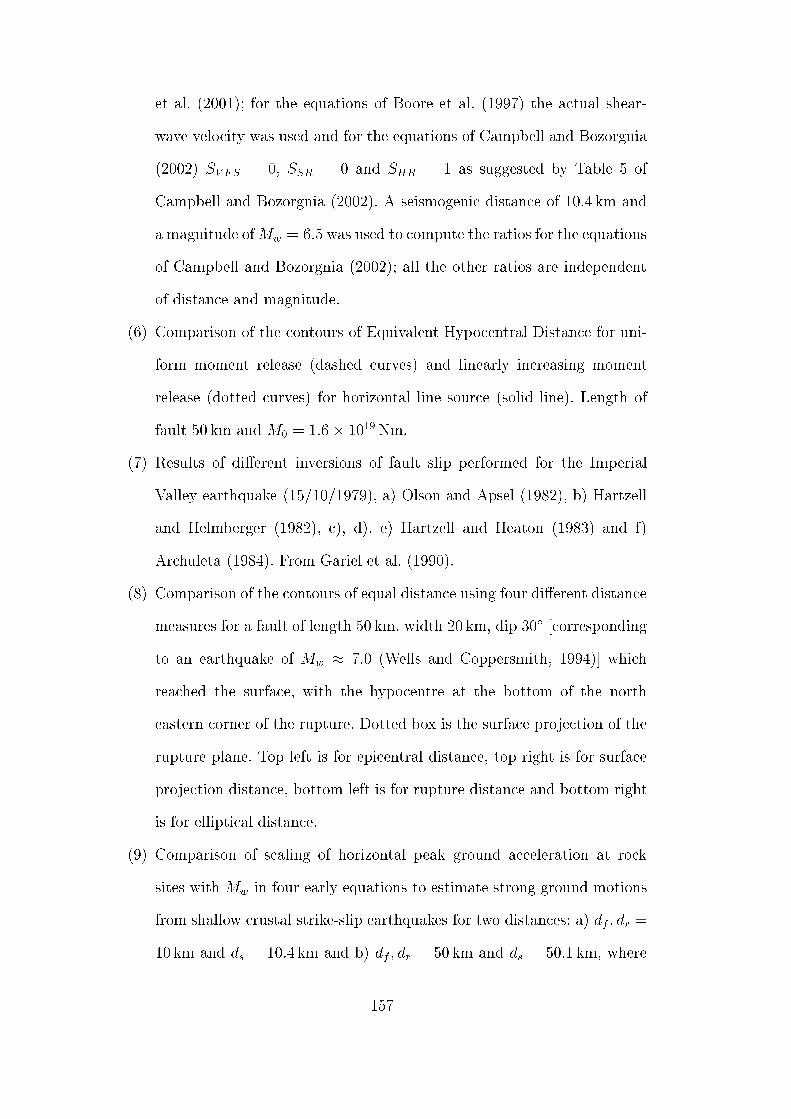
et al. (2001); for the equations of Boore et al. (1997) the a tual shear-
wave velo ity was used and for the equations of Campbell and Bozorgnia
(2002) S
V FS
= 0, S
SR
= 0 and S
HR
= 1 as suggested by Table 5 of
Campbell and Bozorgnia (2002). A seismogeni distan e of 10:4 km and
a magnitude ofM
w
= 6:5 was used to ompute the ratios for the equations
of Campbell and Bozorgnia (2002); all the other ratios are independent
of distan e and magnitude.
(6) Comparison of the ontours of Equivalent Hypo entral Distan e for uni-
form moment release (dashed urves) and linearly in reasing moment
release (dotted urves) for horizontal line sour e (solid line). Length of
fault 50 km and M
0
= 1:6� 10
19
Nm.
(7) Results of di�erent inversions of fault slip performed for the Imperial
Valley earthquake (15/10/1979), a) Olson and Apsel (1982), b) Hartzell
and Helmberger (1982), ), d), e) Hartzell and Heaton (1983) and f)
Ar huleta (1984). From Gariel et al. (1990).
(8) Comparison of the ontours of equal distan e using four di�erent distan e
measures for a fault of length 50 km, width 20 km, dip 30
Æ
[ orresponding
to an earthquake of M
w
� 7:0 (Wells and Coppersmith, 1994)℄ whi h
rea hed the surfa e, with the hypo entre at the bottom of the north
eastern orner of the rupture. Dotted box is the surfa e proje tion of the
rupture plane. Top left is for epi entral distan e, top right is for surfa e
proje tion distan e, bottom left is for rupture distan e and bottom right
is for ellipti al distan e.
(9) Comparison of s aling of horizontal peak ground a eleration at ro k
sites with M
w
in four early equations to estimate strong ground motions
from shallow rustal strike-slip earthquakes for two distan es: a) d
f
; d
r
=
10 km and d
s
= 10:4 km and b) d
f
; d
r
= 50 km and d
s
= 50:1 km, where
157
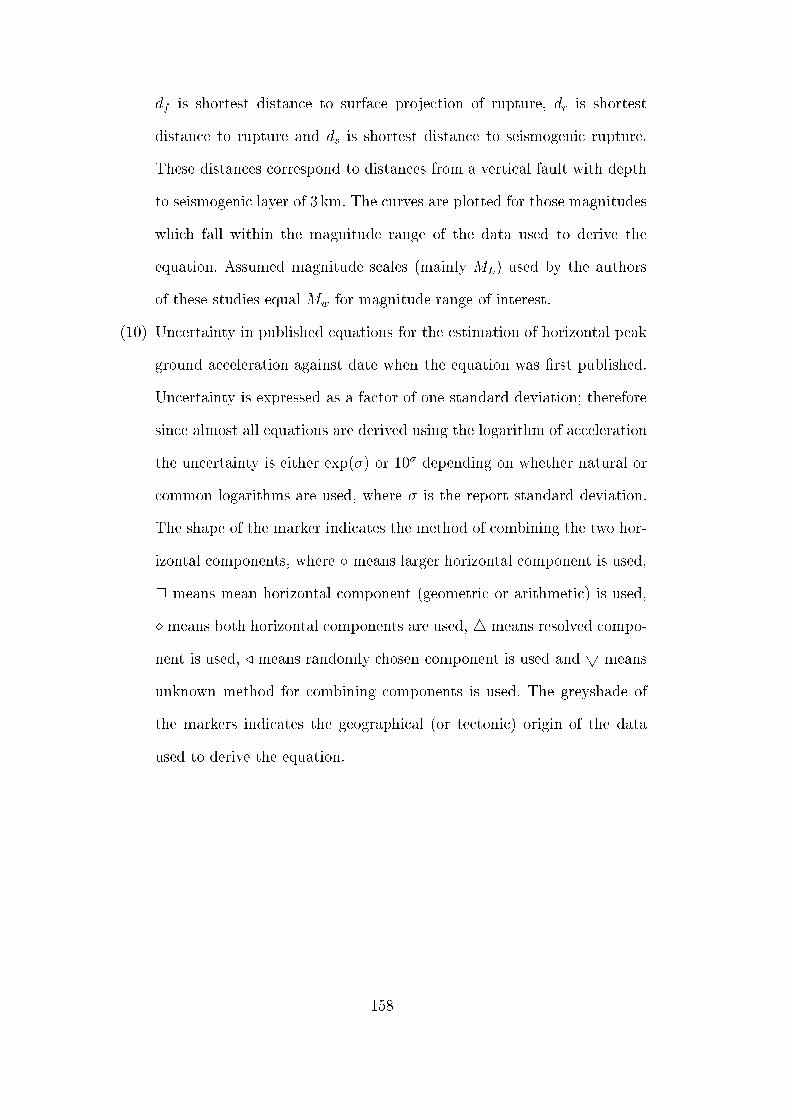
d
f
is shortest distan e to surfa e proje tion of rupture, d
r
is shortest
distan e to rupture and d
s
is shortest distan e to seismogeni rupture.
These distan es orrespond to distan es from a verti al fault with depth
to seismogeni layer of 3 km. The urves are plotted for those magnitudes
whi h fall within the magnitude range of the data used to derive the
equation. Assumed magnitude s ales (mainly M
L
) used by the authors
of these studies equal M
w
for magnitude range of interest.
(10) Un ertainty in published equations for the estimation of horizontal peak
ground a eleration against date when the equation was �rst published.
Un ertainty is expressed as a fa tor of one standard deviation; therefore
sin e almost all equations are derived using the logarithm of a eleration
the un ertainty is either exp(�) or 10
�
depending on whether natural or
ommon logarithms are used, where � is the report standard deviation.
The shape of the marker indi ates the method of ombining the two hor-
izontal omponents, where Æ means larger horizontal omponent is used,
2 means mean horizontal omponent (geometri or arithmeti ) is used,
� means both horizontal omponents are used, 4 means resolved ompo-
nent is used, / means randomly hosen omponent is used and 5 means
unknown method for ombining omponents is used. The greyshade of
the markers indi ates the geographi al (or te toni ) origin of the data
used to derive the equation.
158
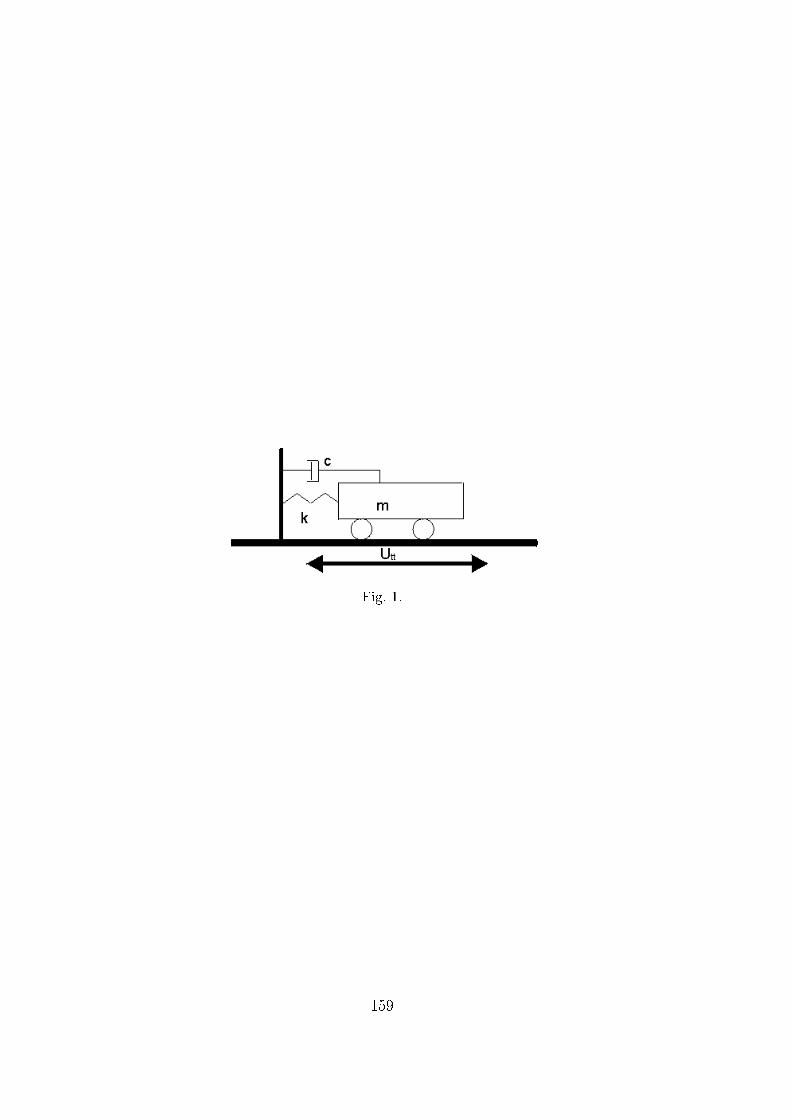
Fig. 1.
159

4.5 5 5.5 6 6.5 7 7.50.001
0.002
0.005
0.01
0.02
0.05
0.1
0.2
0.5
1
Mw
Pea
k gr
ound
acc
eler
atio
n (g
)
Ambraseys et al. (1996)Boore et al. (1997)Sadigh et al. (1997Campbell & Bozorgnia (2002)
(a) d
f
; d
r
= 10 km and d
s
= 10:4 km
4.5 5 5.5 6 6.5 7 7.50.001
0.002
0.005
0.01
0.02
0.05
0.1
0.2
0.5
1
Mw
Pea
k gr
ound
acc
eler
atio
n (g
)
Ambraseys et al. (1996)Boore et al. (1997)Sadigh et al. (1997Campbell & Bozorgnia (2002)
(b) d
f
; d
r
= 50 km and d
s
= 50:1 km
Fig. 2.
160
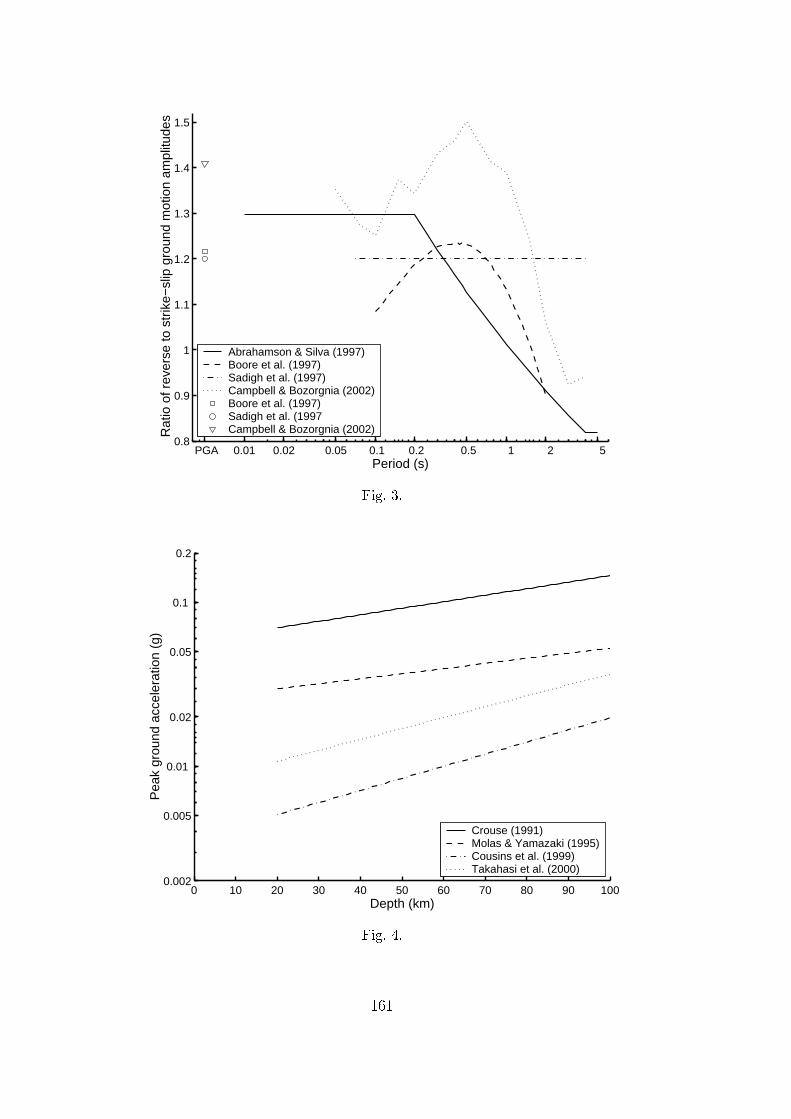
PGA 0.01 0.02 0.05 0.1 0.2 0.5 1 2 50.8
0.9
1
1.1
1.2
1.3
1.4
1.5
Period (s)
Rat
io o
f rev
erse
to s
trik
e−sl
ip g
roun
d m
otio
n am
plitu
des
Abrahamson & Silva (1997)Boore et al. (1997)Sadigh et al. (1997)Campbell & Bozorgnia (2002)Boore et al. (1997)Sadigh et al. (1997Campbell & Bozorgnia (2002)
Fig. 3.
0 10 20 30 40 50 60 70 80 90 1000.002
0.005
0.01
0.02
0.05
0.1
0.2
Depth (km)
Pea
k gr
ound
acc
eler
atio
n (g
)
Crouse (1991)Molas & Yamazaki (1995)Cousins et al. (1999)Takahasi et al. (2000)
Fig. 4.
161
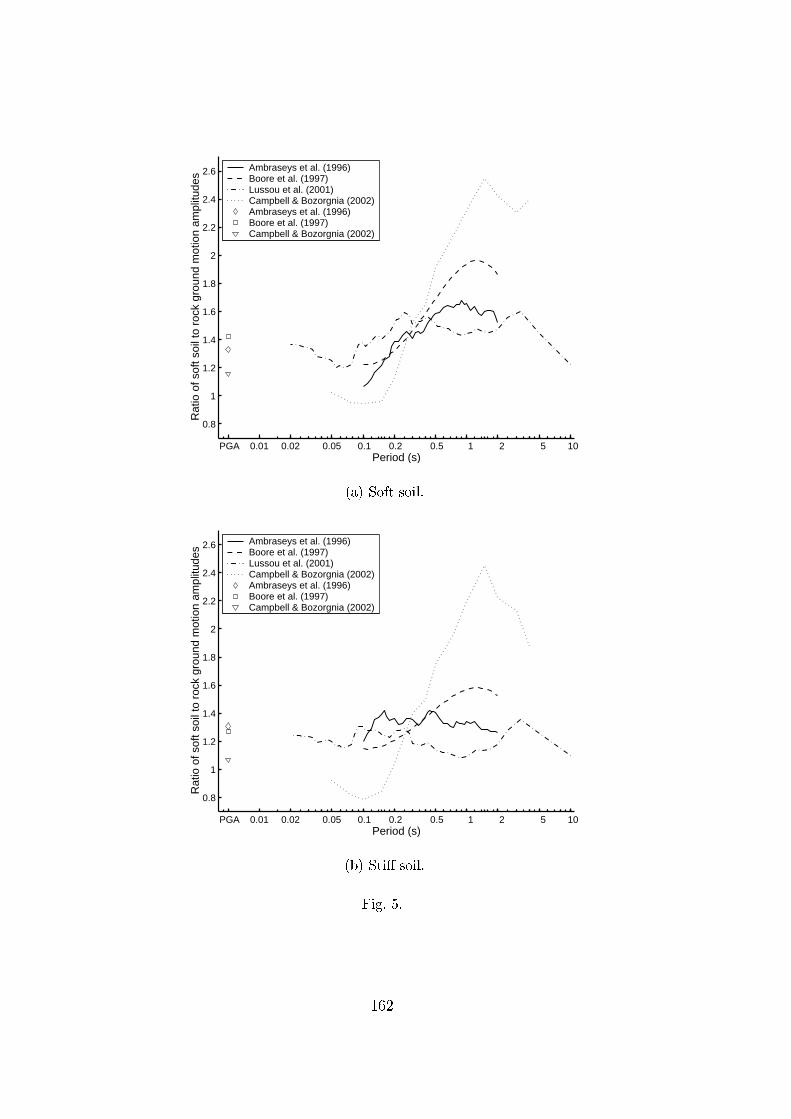
PGA 0.01 0.02 0.05 0.1 0.2 0.5 1 2 5 10
0.8
1
1.2
1.4
1.6
1.8
2
2.2
2.4
2.6
Period (s)
Rat
io o
f sof
t soi
l to
rock
gro
und
mot
ion
ampl
itude
s
Ambraseys et al. (1996)Boore et al. (1997)Lussou et al. (2001)Campbell & Bozorgnia (2002)Ambraseys et al. (1996)Boore et al. (1997)Campbell & Bozorgnia (2002)
(a) Soft soil.
PGA 0.01 0.02 0.05 0.1 0.2 0.5 1 2 5 10
0.8
1
1.2
1.4
1.6
1.8
2
2.2
2.4
2.6
Period (s)
Rat
io o
f sof
t soi
l to
rock
gro
und
mot
ion
ampl
itude
s
Ambraseys et al. (1996)Boore et al. (1997)Lussou et al. (2001)Campbell & Bozorgnia (2002)Ambraseys et al. (1996)Boore et al. (1997)Campbell & Bozorgnia (2002)
(b) Sti� soil.
Fig. 5.
162
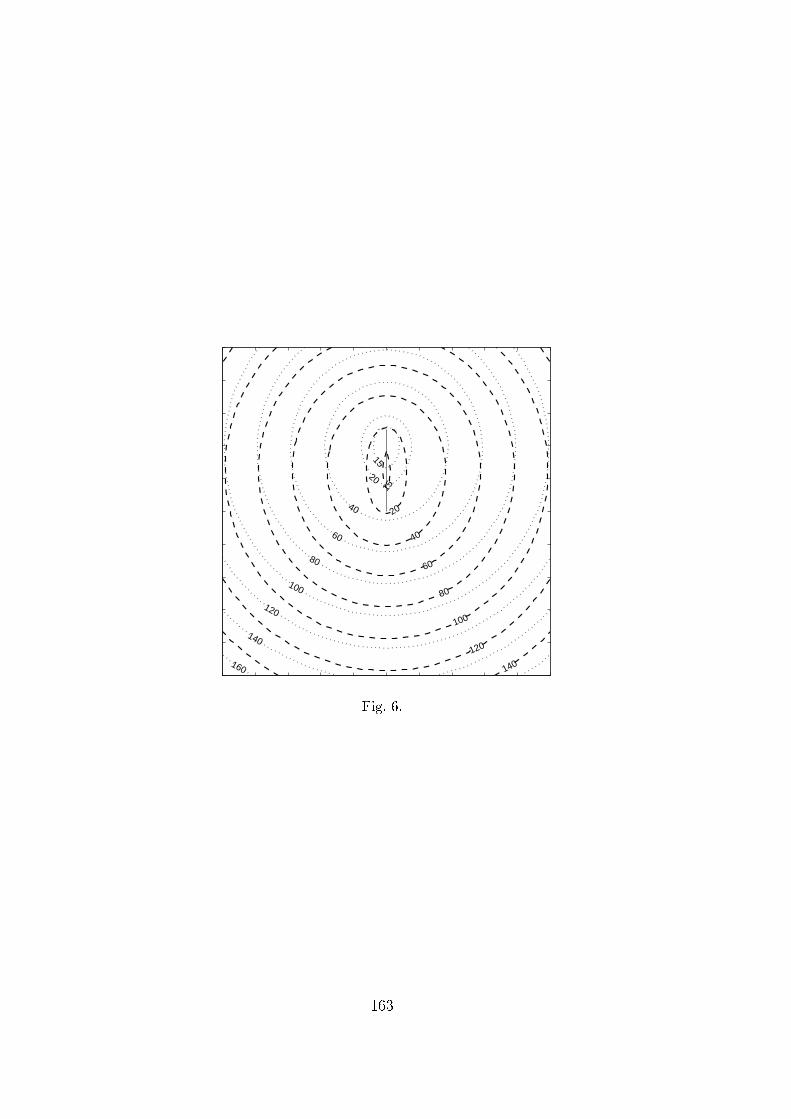
15
20
40
60
80
100
120
140
15
20
40
60
80
100
120
140
160
Fig. 6.
163
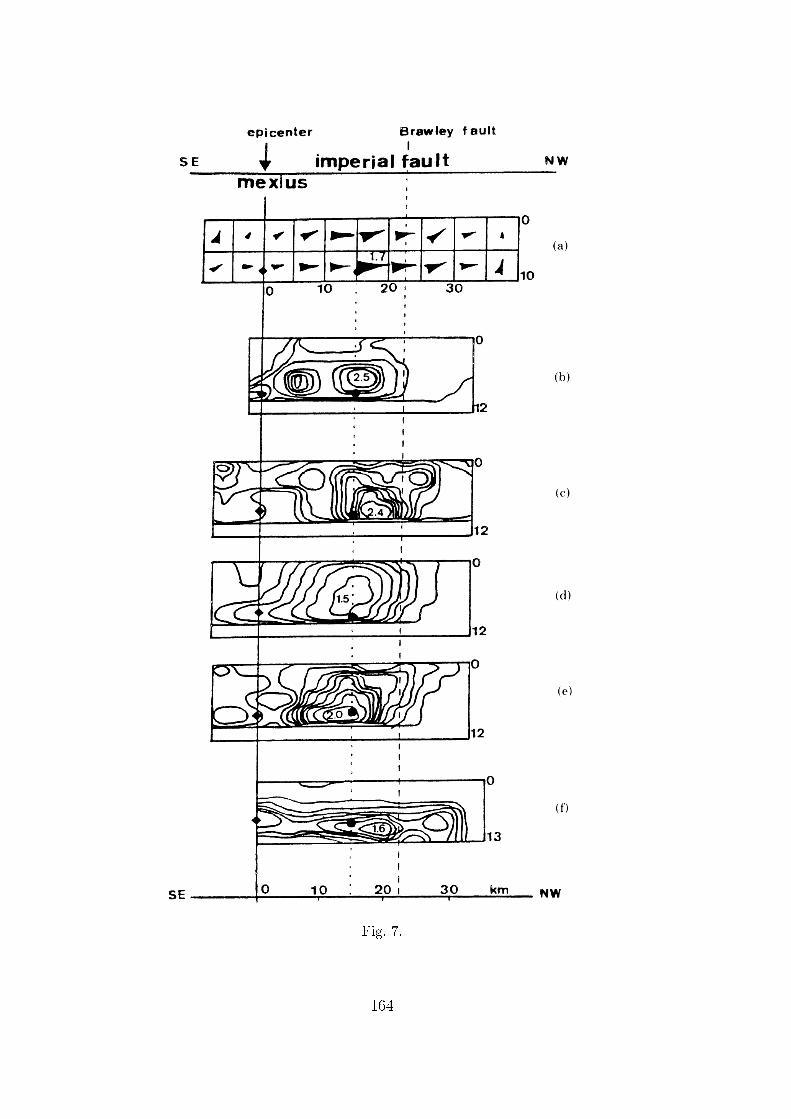
Fig. 7.
164
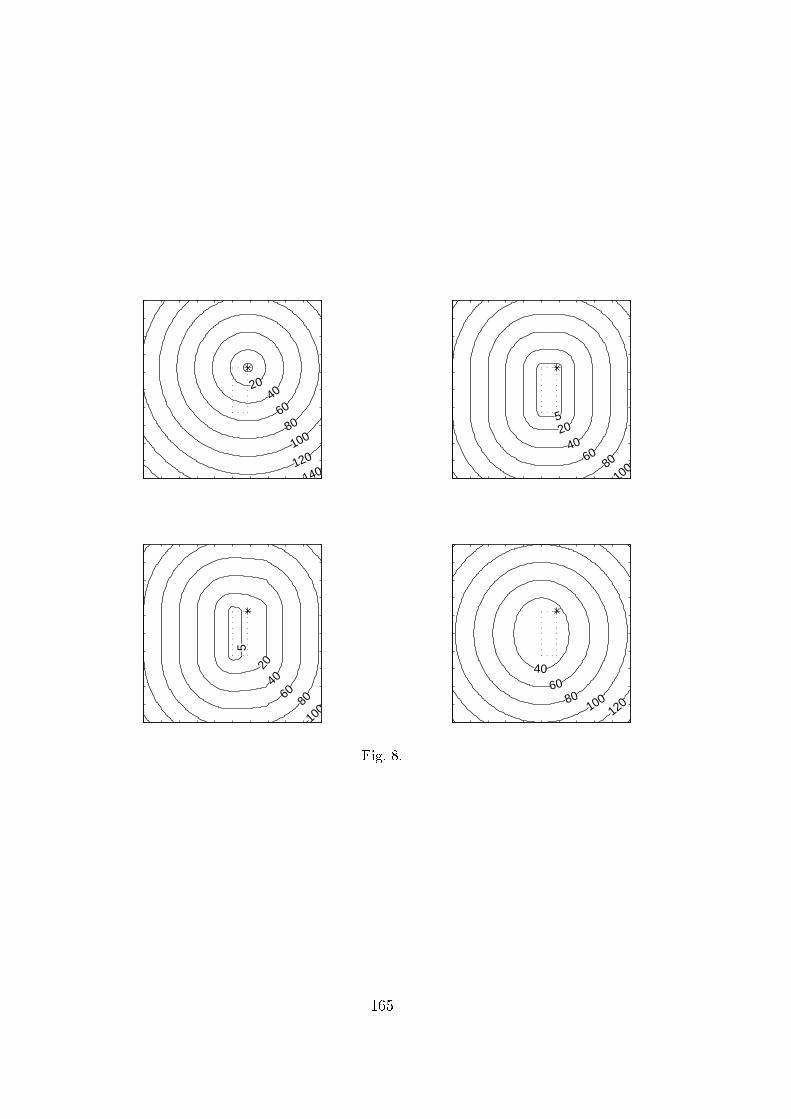
2040
60
80
100
120
140
520
4060
80
100
520
40
6080
100
4060
80100
120
Fig. 8.
165
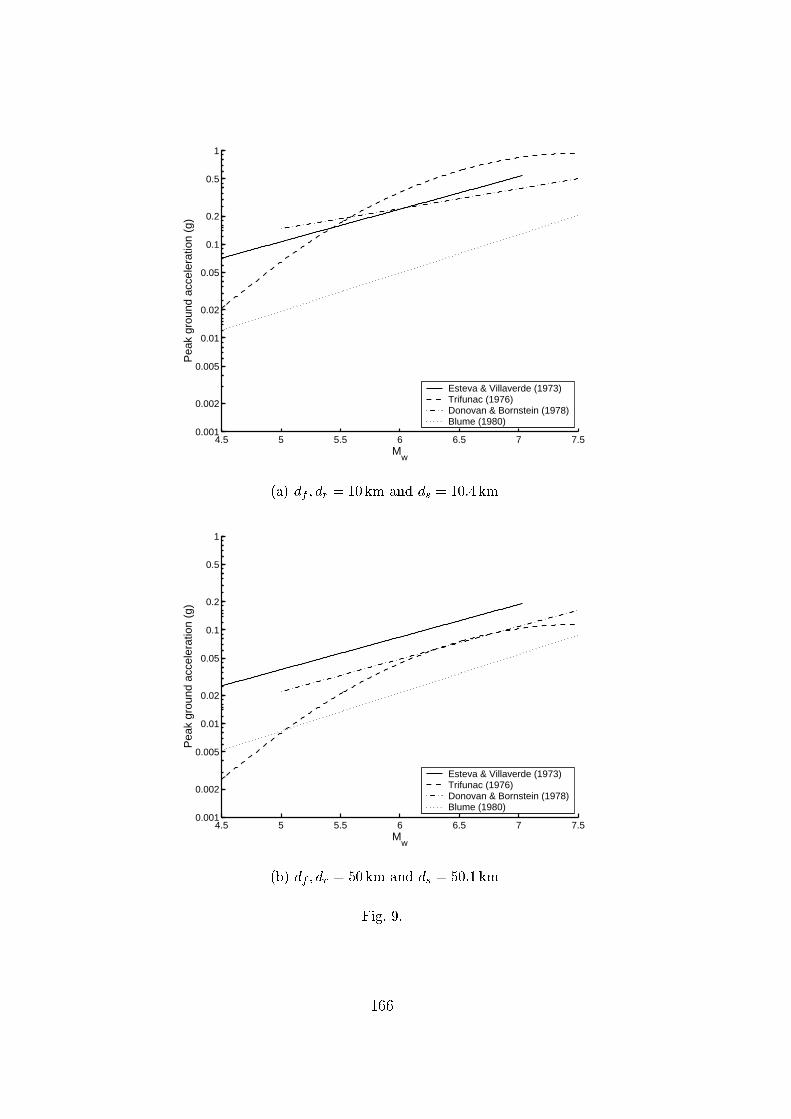
4.5 5 5.5 6 6.5 7 7.50.001
0.002
0.005
0.01
0.02
0.05
0.1
0.2
0.5
1
Mw
Pea
k gr
ound
acc
eler
atio
n (g
)
Esteva & Villaverde (1973)Trifunac (1976)Donovan & Bornstein (1978)Blume (1980)
(a) d
f
; d
r
= 10 km and d
s
= 10:4 km
4.5 5 5.5 6 6.5 7 7.50.001
0.002
0.005
0.01
0.02
0.05
0.1
0.2
0.5
1
Mw
Pea
k gr
ound
acc
eler
atio
n (g
)
Esteva & Villaverde (1973)Trifunac (1976)Donovan & Bornstein (1978)Blume (1980)
(b) d
f
; d
r
= 50 km and d
s
= 50:1 km
Fig. 9.
166
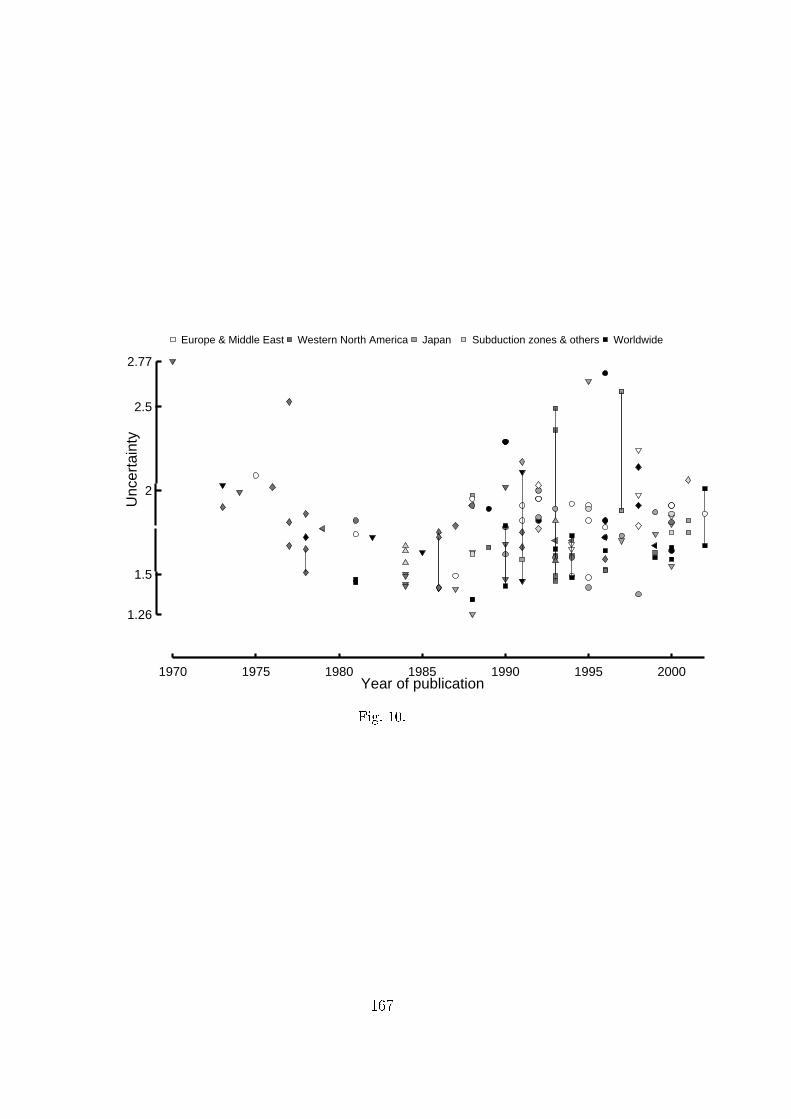
1.26
2.77
1.5
2
2.5
1970 1975 1980 1985 1990 1995 2000
Unc
erta
inty
Year of publication
Europe & Middle East Western North America Japan Subduction zones & others Worldwide
Fig. 10.
167