Embed Size (px)
Citation preview
Scientia Iranica B (2017) 24(3), 1069{1076
Sharif University of TechnologyScientia Iranica
Transactions B: Mechanical Engineeringwww.scientiairanica.com
E�ect of wind tunnel wall porosity on the ow aroundan oscillating airfoil at transonic speeds
A. Golestania;�, M.R. Soltanib and M. Masdaric
a. Department of Mechanical Engineering, University of Tabriz, Tabriz, Iran.b. Department of Aerospace Engineering, Sharif University of Technology, Tehran, Iran.c. Department of New Science and Technology, University of Tehran, Tehran, Iran.
Received 3 July 2015; received in revised form 6 April 2016; accepted 10 May 2016
KEYWORDSSupercritical;Oscillating;Porosity;Transonic;Experimental.
Abstract. The e�ect of porosity in oscillating situations (to the authors' knowledge, forthe �rst time) on a supercritical airfoil (SC0410) has been experimentally investigated.Tests have been carried out in an open circuit suction-type wind tunnel at a free streamMach number of M = 0:80. Both static and dynamic (pitching) tests have been carriedout on the mentioned airfoil. The oscillation frequency for the unsteady tests has been setto 3 and 6 Hz. The amplitude of frequency is �1 deg. The e�ect of porosity has beensurveyed on the magnitude of pressure uctuations, phase shift, and lift coe�cient loop.The investigations show that increasing porosity in the test section of transonic regime,contrary to the impression, does not necessarily improve results.© 2017 Sharif University of Technology. All rights reserved.
1. Introduction
Shock interaction between the model and the windtunnel walls is an important phenomenon that maycause choking in the test section. This di�culty wasone of the main obstacles to test programs for Machnumbers ranging from 0.8 up to 1.2. To overcome thisproblem, slotted walls were proposed and implemented�rst in NACA LANGLEY wind tunnel [1].
However, additional studies showed that slottedwalls do not give satisfactory results when the ow issubsonic. Hence, the perforated ones were introducedin the mid-1950s [2]. Further investigations during 60sand 70s showed that perforated walls provide betterresults for the subsonic and even for the transonic owregimes [3]. To improve ow quality, the perforationsare arranged in an inclined position. By inclined holes,the choked ow from the test section is sucked into
*. Corresponding author.E-mail addresses: Ali [email protected] (A. Golestani);[email protected] (M.R. Soltani); [email protected](M. Masdari)
the plenum chamber, eliminating choking problem andthe shock wave interactions between the model and thewalls as well [4].
It should be mentioned that for a test sectionwith perforated walls, the boundary layer growth isfaster than that of the solid ones with the same owconditions; thus, the blockage for these types of wallsincreases and the ow accelerates in the test sectionwhich in turn will a�ect the ow uniformity in thatregion. To overcome the aforementioned problems,suction must be implemented for the walls throughthe plenum chamber [5]. The suction controls theboundary layer thickness and eliminates the blockageand choking problems [6].
Over the past few years, many experimental [7-9]and numerical [10-12] studies have been devoted to wallinterferences of wind tunnel at transonic regime andtheir consequences. In addition, many research papershave been published about the e�ect of porosity basedon optimization [13,14]. However, almost all of theseinvestigations are related to the e�ect of porosity onthe static tests. For example, Rasuo [15] mentionedthat by increasing the porosity, the lift coe�cient for

1070 A. Golestani et al./Scientia Iranica, Transactions B: Mechanical Engineering 24 (2017) 1069{1076
Table 1. History of dynamic tests on supercritical airfoilsin transonic regime based on thickness.
Thickness Airfoils name Reference
16.5% NLR 7301 [19]
14% SC(2)-0714 [20]
14% DRA 2303 [21]
14% SC(2)-0414 [22]
11% BAC 3-11/RES/30/21 [23]
10% Present airfoil
the airfoil decreases. Werling [16] pointed out thatby decreasing the porosity, the Mach number in thetest section increases. Nevertheless, to the authors'knowledge, there is no information, either experimentalor theoretical, that deals with the e�ect of porosityon dynamic tests. The present experimental workinvestigates the e�ect of porosity on an oscillatingsupercritical airfoil in a transonic regime.
The airfoil under investigation is a supercriticalairfoil, SC(2)0410, where SC(2) indicates supercritical(phase 2); next two digits show the airfoil design liftcoe�cient in tenths (0.4); the last two digits specifythe airfoil maximum thickness in percent chord (10%).The development history of supercritical airfoils wasfully described by Harris [17].
Blackwell [18] studied the e�ect of porosity on thesupercritical airfoil in a static condition. The historyof dynamic tests on supercritical airfoils in transonicregime based on their thickness ratio is presented inTable 1.
Previous studies have shown that an importantparameter, which has signi�cant e�ects on the buf-fet, utter, ow separation, etc., is the airfoil thick-ness [24,25]. Based on the available information fromvarious sources shown in Table 1, the present airfoil isthe thinnest supercritical airfoil that has been testedin forced oscillating conditions up to now. (There aresome investigations about thinner supercritical airfoilsthat belong to blade helicopter airfoils [26].)
In all of these tests, the e�ect of porosity onvarious dynamic parameters, such as magnitude of uctuations, phase lag, shock location, aerodynamiccoe�cients, reduced frequency, and etc., has not beenstudied. In the present paper, the authors will try toanswer these questions.
2. Experimental facilities and instrumentation
2.1. Wind tunnelAll tests were conducted in a trisonic wind tunnel whichis functional within Mach number range of 0.4 to 2.7at atmospheric pressure and temperature. Maximumavailable Reynolds number is 9 million for unit chord.The free-stream turbulence level in the test section is
Figure 1. (a) Wind tunnel test section. (b) Sketch ofslider wall for changing porosity.
less than 0.4% for all Mach numbers tested. This is anopen circuit, suction-type wind tunnel and is equippedwith 2 turbofan engines that operate continuously. InFigure 1, the test section of the tunnel with the model isshown. Suction from the porous walls (top and bottom)with 60� diagonal holes is applied through a smallerturbofan engine. Porosity in this tunnel can vary from0 to 6 percent. The hole diameter of perforated wallsis 7 mm and test section dimensions are 60 cm (W)�60 cm (H) �150 cm (L).
As mentioned previously, to the authors' knowl-edge, there are no experimental data for the presentairfoil (based on Table 1). Therefore, to ensure theaccuracy of data acquisition as well as data reduction,correction, etc., a pretest on a NACA0012 was per-formed and the results were compared with results inother tunnels [27]. A sample of this comparison isshown in Figure 2 for M1 = 0:8 and �0 = 0�. Theresults agreed consistently with each other.
The uncertainty due to the bias and single sampleprecision is shown in Table 2. The maximum uncer-
Figure 2. Pressure distribution comparison on the uppersurface of NACA 0012 at M1 = 0:8 and �0 = 0�.

A. Golestani et al./Scientia Iranica, Transactions B: Mechanical Engineering 24 (2017) 1069{1076 1071
Table 2. Amount of uncertainty with con�dence level of95% [28].
Uncertainty Name of sensor
cp 3.15% Kulite & HoneywellM 0.68% Honeywell� 1.73% Gefran linear potentiometer
Figure 3. The model in the tunnel.
tainty calculated for the sensors, used in these tests,was less than �3:15% of the total cp values and isshown by the error bar in Figure 2. Based on accuracyof the system, uncertainty, and other parameters, thecomparison is good enough.
2.2. Model and oscillating mechanismThe model has a span of 60 cm and a chord of20 cm. Figure 3 shows the model with externalexcitation mechanism that is mounted in one sideof the test section which can oscillate the model inpitch for dynamic tests. The rotational motion of anelectrical motor transfers to a reciprocating motion bya hydraulic system which allows excitation frequenciesof up to 9 Hz and oscillation amplitude of up to 5�.Another electrical motor, integrated with the system,is used to adjust the mean angle of attack between -3 to10� with precision of �1 minute. The pitching motionis measured by two linear potentiometers on each sideof the test section. The design of the excitation systemand its assembly has been conducted in such a way thatallows using a shadowgraph visualization system for alldynamic test cases. The test conditions are presentedin Table 3.
2.3. Measuring instrumentA total of 42 pressure ori�ces have been consideredon the surfaces of the model which their locations areindicated in Table 4 for the upper and lower surfaces,respectively. These ports have been connected to the
Table 3. Test conditions.
Mach 0.8Porosity 2% and 6%Angle of attack 1� and 2�
Oscillation frequency 3-6 HzReduced frequency 0.0074 and 0.0148Oscillation amplitude �1�
Transition FreeReynolds number 2.2 e6
Figure 4. Pressure distribution comparison betweenexperimental results and CFD on present airfoil atM = 0:8 and �0 = 2�.
high-sensitive pressure transducers (Kulite-CCQ-093Series) inside the model by using short steel tubes toensure real-time measurement of the pressure signalsduring dynamic tests (the time lag has been 0.09 sec).The data of sensors are low-pass �ltered (cut o�frequency: 200 Hz) and sampled at 2 kHz. Time ofdata acquisition for each condition has been 5 sec.
A few computational runs were performed forfurther comparison of results. Figure 4 is a sampleat M1 = 0:8 and �0 = 2�. As seen from this�gure, the location of the shock in the numericalcalculations has good consistency with that obtainedfrom the experimental data. The slight di�erencesbetween the pressure distribution points, especiallyafter the shock location, are due to the free streamturbulence, model accuracy, roughness of the airfoil,etc. Note that in the CFD (Computational FluidDynamic) simulation, no roughness was used. Theturbulence model for numerical computations has beenK-Omega SST with y+ < 4 (a criterion for evaluatingthe mesh quality) [29].
3. De�nitions
For dynamic tests, some de�nitions are required. Onan airfoil with pitch oscillation under conditions:
� = �0 + �� cos!t; (1)

1072 A. Golestani et al./Scientia Iranica, Transactions B: Mechanical Engineering 24 (2017) 1069{1076
Table 4. The location of pressure ports on the airfoil.U
pp
ersu
rfac
e
Hole # 1 2 3 4 5 6 7 8x (mm) 0.00 2.60 6.15 9.85 13.85 18.95 24.30 30.05x=c 0.00 0.01300 0.03075 0.04925 0.06925 0.09475 0.12150 0.15025
Hole # 9 10 11 12 13 14 15 16x (mm) 36.10 42.10 48.25 54.80 62.45 70.55 78.65 86.85x=c 0.18050 0.21050 0.24125 0.27400 0.31225 0.35275 0.39325 0.43425
Hole # 17 18 20 21 22 23 24 25x (mm) 94.95 103.35 119.50 127.85 134.85 149.90 165.65 180.85x=c 0.47475 0.51675 0.59750 0.63925 0.67425 0.74950 0.82825 0.90425
Low
ersu
rfac
e Hole # 1 2 3 4 5 6 7 8 9x (mm) 2.60 6.35 21.95 37.60 54.25 70.45 81.95 94.85 103.00x=c 0.01300 0.03175 0.10975 0.18800 0.27125 0.35225 0.40975 0.47425 0.51500
Hole # 10 11 12 13 14 15 16 17x (mm) 111.20 119.25 127.10 142.45 159.30 175.10 189.35 199.90x=c 0.55600 0.59625 0.63550 0.71225 0.79650 0.87550 0.94675 0.99950
Figure 5. Descriptions of unsteady motion [19].
the measured surface pressure for a point is:
P = Ps + �P = Ps + P1 cos(!t+ '): (2)
When the mean angle of attack is �0, �� is the ampli-tude of oscillation, and ! is its oscillation frequency. Psis the static pressure, P1 is the magnitude of pressure uctuations, and ' is the phase angle that indicates thelead or lag of pressure variation for the correspondingpoint, i.e. point A. These de�nitions are further shownin Figure 5.
4. Discussion
Figure 6 shows that the magnitude of pressure uc-tuations in an empty test section changes as porosityincreases [3]. The magnitude of pressure uctuationsis almost constant for porosities from zero up to 2%.There is a jump, however, for porosity from 2% to 3%,and after that, the uctuations are almost constantagain. Therefore, based on the information, it wasdecided to study the porosity e�ects in dynamic teston only two situations (� = 2% and � = 6%).
Figure 6. Magnitude of pressure uctuations (RMS) inan empty test section wind tunnel for di�erentporosities [3].
4.1. First caseFigure 7 shows magnitude of the pressure uctuationson the upper surface of the present airfoil at M =0:80, �0 = 0�, �� = �1�, and f = 3 Hz for twodi�erent wall porosities. As seen from this �gure, wallporosity (�) has signi�cant in uence on the magnitude

A. Golestani et al./Scientia Iranica, Transactions B: Mechanical Engineering 24 (2017) 1069{1076 1073
Figure 7. E�ect of porosity on the magnitude of thepressure uctuation (M = 0:80, �0 = 0�, �� = �1�, andf = 3 Hz.)
Figure 8. E�ect of the porosity on the phase angle(M = 0:80, �0 = 0�, �� = �1�, and f = 3 Hz.)
of uctuations. It has increased as the wall porosityincreases from 2% to 6% like Figure 6.
By increasing the porosity, the boundary layer onthe test section walls is sucked better through appliedsuction by the motors. Consequently, the blockageand then the velocity decrease due to the increase ofthe e�ective area in the test section. By referring toreduced frequency formulation:
k =!c
2V1(sign of ow unsteadiness); (3)
it is obvious that decreasing velocity increases k andmagnitude of pressure uctuations.
Figure 8 shows the corresponding phase anglediagram of oscillating condition for the �rst case. Asindicated, there is a phase shift of about 360� in themiddle of the chord, x=c = 0:5, for � = 2% due to theshock; however, for � = 6%, the phase shift occurs nearthe trailing edge caused by the ow separation, not byshock.
The results for the oscillating condition are similarto those of the static condition. From Figure 9, it isobvious that for � = 2% in static condition, a relativelystrong shock wave appears around x=c = 50% � 60%over the model surface, while for � = 6%, the strengthof the shock wave has declined signi�cantly.
Figure 9. E�ect of porosity on the static pressuredistribution (M = 0:80 and �0 = 0�.)
Figure 10. Magnitude and phase angle of pressure uctuations for di�erent porosities and (M = 0:80,�0 = 0�, �� = �1�, and f = 6 Hz.)
4.2. Second case (e�ect of increasingfrequency)
In Figure 10, a similar trend is depicted for higheroscillation frequency, f = 6 Hz. Increasing frequencyincreases k; thus, the magnitude of pressure uctu-ation increases in the same porosity, compared withsimilar values for the lower oscillation frequency (f =3 Hz), but the corresponding phase shift (�') reduces.Therefore, it could be concluded that increasing theoscillation frequency will cause a decrease in �' in thesame porosity.
4.3. Third case (e�ect of increasing meanangle of attack)
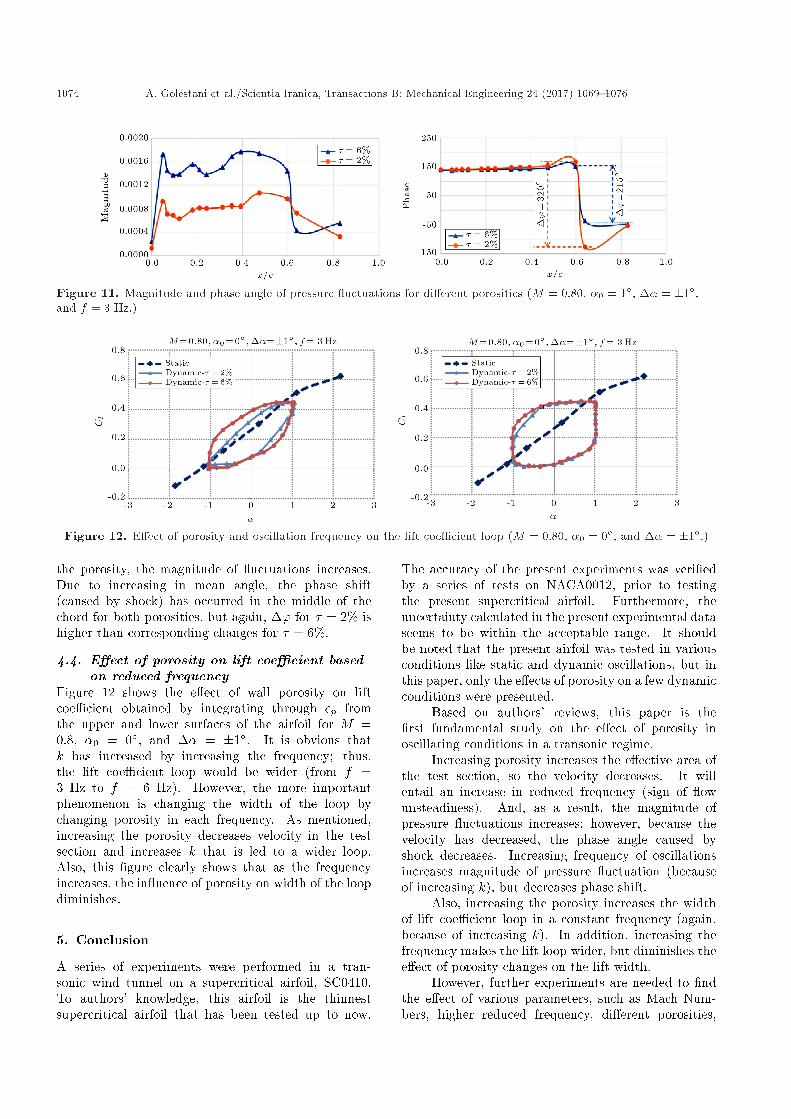
The results for increasing the mean angle of attack(�0 = 1�) are shown in Figure 11. Again, by increasing
1074 A. Golestani et al./Scientia Iranica, Transactions B: Mechanical Engineering 24 (2017) 1069{1076
Figure 11. Magnitude and phase angle of pressure uctuations for di�erent porosities (M = 0:80, �0 = 1�, �� = �1�,and f = 3 Hz.)
Figure 12. E�ect of porosity and oscillation frequency on the lift coe�cient loop (M = 0:80, �0 = 0�, and �� = �1�.)
the porosity, the magnitude of uctuations increases.Due to increasing in mean angle, the phase shift(caused by shock) has occurred in the middle of thechord for both porosities, but again, �' for � = 2% ishigher than corresponding changes for � = 6%.
4.4. E�ect of porosity on lift coe�cient basedon reduced frequency
Figure 12 shows the e�ect of wall porosity on liftcoe�cient obtained by integrating through cp fromthe upper and lower surfaces of the airfoil for M =0:8, �0 = 0�, and �� = �1�. It is obvious thatk has increased by increasing the frequency; thus,the lift coe�cient loop would be wider (from f =3 Hz to f = 6 Hz). However, the more importantphenomenon is changing the width of the loop bychanging porosity in each frequency. As mentioned,increasing the porosity decreases velocity in the testsection and increases k that is led to a wider loop.Also, this �gure clearly shows that as the frequencyincreases, the in uence of porosity on width of the loopdiminishes.
5. Conclusion
A series of experiments were performed in a tran-sonic wind tunnel on a supercritical airfoil, SC0410.To authors' knowledge, this airfoil is the thinnestsupercritical airfoil that has been tested up to now.
The accuracy of the present experiments was veri�edby a series of tests on NACA0012, prior to testingthe present supercritical airfoil. Furthermore, theuncertainty calculated in the present experimental dataseems to be within the acceptable range. It shouldbe noted that the present airfoil was tested in variousconditions like static and dynamic oscillations, but inthis paper, only the e�ects of porosity on a few dynamicconditions were presented.
Based on authors' reviews, this paper is the�rst fundamental study on the e�ect of porosity inoscillating conditions in a transonic regime.
Increasing porosity increases the e�ective area ofthe test section, so the velocity decreases. It willentail an increase in reduced frequency (sign of owunsteadiness). And, as a result, the magnitude ofpressure uctuations increases; however, because thevelocity has decreased, the phase angle caused byshock decreases. Increasing frequency of oscillationsincreases magnitude of pressure uctuation (becauseof increasing k), but decreases phase shift.
Also, increasing the porosity increases the widthof lift coe�cient loop in a constant frequency (again,because of increasing k). In addition, increasing thefrequency makes the lift loop wider, but diminishes thee�ect of porosity changes on the lift width.
However, further experiments are needed to �ndthe e�ect of various parameters, such as Mach Num-bers, higher reduced frequency, di�erent porosities,

A. Golestani et al./Scientia Iranica, Transactions B: Mechanical Engineering 24 (2017) 1069{1076 1075
etc., on the magnitude of pressure uctuation, phaseangle, and aerodynamic coe�cients loops.
Acknowledgement
The authors would like to show their gratitude to theMr. E. Vaziri for assistance in data preparation.
Nomenclature
c Chordcl Lift coe�cientcp Pressure coe�cient
f FrequencyH Heightk Reduced frequencyL LengthM Free stream Mach numberP PressureP1 Magnitude of pressurePs Static pressureV1 Free stream velocityW Width' Phase angle�' Phase shift due to the shock� Porosity ratio�0 Mean angle of attack�� Amplitude of oscillation! Angular velocity
References
1. Wright, R.N. and Ward, V.G. \NACA transonic wind-tunnel test sections", NACA, Virginia, Report 1231(1955).
2. Goodmant, R. \The porous wall wind tunnel part III,re ection and absorption of shock waves at supersonicspeeds", Cornell Aero. Lab., Bu�alo, AD-706-A-1(1950).
3. Mabey, D.G. \Flow unsteadiness and model vibrationin wind tunnels at subsonic and transonic speeds",Royal Aircraft Establishment, Bedford, C.P. No. 1155(I971).
4. Goethert, B.H., Physical Aspects of Three-Dimensional Wave Re ections in Transonic WindTunnels at Mach Number 1.2, Arnold EngineeringDevelopment Center, Tennessee, AEDC-TR-55-45(1956).
5. Goethert, B.H., Transonic Wind Tunnel Testing, W.C.Nelson, Ed., New York, Pergamon Press (1961).
6. Amiri, K., Soltani, M.R., Haghiri, A. and Mani,M. \An experimental investigation of e�ects of wallporosity and suction on the ow quality in a transonicwind tunnel", JAST, 6(2), pp. 63-70 (2009).
7. Grunnet, J.L. \Transonic wind tunnel wall interferenceminimization.", J. Aircraft, 21(9), pp. 694-699 (1984).
8. Medved, B.L. \An experimental investigation of thestatic pressure uctuation mechanism for porous tran-sonic wind tunnel wall con�gurations", Exp. Fluids,15(6), pp. 401-410 (1993).
9. Glazkov, S.A., Gorbushin, A., Ivanov, A.I. and Se-menov, A.V. \Recent experience in improving theaccuracy of wall interference corrections in TsAGI T-128 wind tunnel", Prog. Aerosp. Sci., 37(3), pp. 263-298 (2001).
10. Rasuo, B. \Numerical and experimental analysis oftransonic wind tunnel wall interference problem", In13th Australian Fluid Mechanic Conference, MonashUniversity, Melbourne, Australia (1998).
11. Doer�er, P.P. and Bohning, R. \Modelling of perfo-rated plate aerodynamics performance", Aerosp. Sci.Trchnol., 8(4), pp. 525-534 (2000).
12. Hashimoto, A., Kohza, M., Aoyama, T. and Mu-rayama, M. \Wall interference analysis of transonicwind tunnel with porous wall model", in 29th AIAAApplied Aerodynamics Conference, Honolulu, Hawaii(2011).
13. Davis, J.W. \Optimization of wave cancellation invariable porosity transonic wind tunnel ows", NASA,Alabama, TN D-7432 (1973).
14. Marino, A. and Bon�glioli, A. \Optimization of theporosity distribution in transonic wind tunnel", InASME, Rio Grande, pp. 35-45 (2012).
15. Rasuo, B. \On boundary layer control in two-dimensional transonic wind tunnels", In Int. Confer-ence on Boundary and Interior Layers, BAIL (2006).
16. Werling, M.G. \Static and dynamic calibration of amulti-component sidewall force balance for a transonicLudwieg tube wind tunnel", University of Texas,Arlington, M.Sc. Thesis (2011).
17. Harris, C.D. \NASA supercritical airfoils", NASALangley Research Center, Hampton, Technical PaperNASA TP-2969 (1990).
18. Blackwell Jr., J.A. and Pounds, G.A. \Wind-tunnelwall interference e�ects on a supercritical airfoil attransonic speeds", J. Aircraft, 14(10), pp. 929-935(1977).
19. Tijdeman, H. \Investigations of the transonic owaround oscillating airfoil", Delft University of Tech-nology, Delft, PhD Thesis, pp. 1181-1563 (1977).
20. Hess, R.W., Seidel, D.A., Igoe, W.B. and Lawing,P.L. \Transonic unsteady pressure measurements ona supercritical airfoil at high Reynolds numbers", J.Aircraft, 26(7), pp. 605-614 (1989).
1076 A. Golestani et al./Scientia Iranica, Transactions B: Mechanical Engineering 24 (2017) 1069{1076
21. Hartmann, A., Klaas, M. and Schr�oder, W. \Ex-perimental investigation of coupled heave/pitch os-cillations in transonic ow", in 29th AIAA AppliedAerodynamics Conference, Honolulu, Hawaii (June2011).
22. Piatak, D.J. and Cleckner, C.S. \Oscillating turntablefor the measurement of unsteady aerodynamic phe-nomena", J. Aircraft, 40(1), pp. 181-188 (2003).
23. Hillenherms, C., Schr�oder, W. and Limberg, W.\Experimental investigation of a pitching airfoil intransonic ow", Aerosp. Sci. Technol., 8(7), pp. 583-590 (2004).
24. Bland, S.R. and Edward, J.W. \Airfoil shape andthickness e�ects on transonic airloads and utter", J.Aircraft, 21(3), pp. 209-217 (1984).
25. Golestani, A., Ehghaghi, M.B. and Soltani, M.R. \Anexperimental study of bu�et detection on supercriticalairfoils in transonic regime", P I Mech. Eng. G-J Aer.,229, pp. 312-322 (2014).
26. Dadone, L.U. \Two-dimensional wind tunnel test of anoscillating rotor airfoil", NASA, Philadelphia, Pennsyl-vania, Contractor Report 2914 (1977).
27. McDevitt, J.B. and Okuno, A.F. \Static and dynamicpressure measurements on a NACA 0012 airfoil in theAmes high Reynolds number facility", NASA, Mo�ettField-California, Technical paper TP-2485 (1985).
28. The Expression of Uncertainty and Con�dence in
Measurement, 3rd Ed., Middlesex, United Kingdom:UKAS Publication M 3003 (2012).
29. Launder, B.E. and Spalding, D.B. \The numericalcomputation of turbulent ows", Comput. MethodAppl. M, 3, pp. 269-289 (1974).
Biographies
Ali Golestani is an Assistant Professor in the Uni-versity of Tabriz. He received his PhD degree inMechanical Engineering from University of Tabriz in2014. His research interests are wind tunnel testing,CFD, Turbo machinery, and Combustion.
Mohammad Reza Soltani is a Professor at theAerospace Engineering Department of Sharif Univer-sity of Technology, Tehran, Iran. He has a PhDdegree in aerodynamics from the University of Illinoisat Urbana-Champaign, USA. His research interestsinclude applied aerodynamics, unsteady aerodynamicswind tunnel testing, wind tunnel design, and dataprocessing.
Mehran Masdari is an Assistant Professor at theNew Sciences and Technologies Department in Univer-sity of Tehran. He has a PhD degree in AerospaceEngineering from the Sharif University of Technologyin 2011. His research interests are in applied aerody-namics, wind tunnel testing, neural network, and dataprocessing.