Embed Size (px)
Citation preview
Illumination Invariance and Object Model
in Content-Based Image and Video Retrieval
Ze-Nian Li Osmar R. Za��ane Zinovi Tauber
School of Computing Science
Simon Fraser University
Burnaby, B.C., Canada V5A 1S6
fli, zaiane, [email protected]
Abstract
With huge amounts of multimedia information connected to the global informationnetwork (Internet), e�cient and e�ective image retrieval from large image and videorepositories has become an imminent research issue. This article presents our researchin the C-BIRD (Content-Based Image Retrieval in Digital-libraries) project. In addi-tion to the use of common features such as color, texture, shape and their conjuncts,and the combined content-based and description-based techniques, it is shown that (a)color{channel{normalization enables Search by Illumination Invariance, and (b) featurelocalization and a three-step matching algorithm (color hypothesis, texture support,shape veri�cation) facilitate Search by Object Model in image and video databases.
Keywords: Color, Content-based retrieval, Digital library, Feature localization,Generalized Hough Transform, Image and video databases, Modeling and matching,Segmentation, Shape, Texture.
1 Introduction
Image and video indexing and retrieval has lately drawn the attention of many researchers in
the computer science community [1, 2, 3, 4, 5, 6, 7, 8, 9]. With the advent of the World-Wide
Web (WWW), research in computer vision, arti�cial intelligence, databases, etc. is taken
to a larger scale to address the problem of information retrieval from large repositories of
images. Previous pattern recognition and image analysis algorithms in the vision and AI
�elds dealt with small sets of still images and did not scale. With large collections of images
and video frames, scalability, speed and e�ciency are the essence for the success of an image
and video retrieval system.
1
There are two main families of image and video indexing and retrieval systems: those
based on the content of the images (content-based) like color, texture, shape, objects, etc.,
and those based on the description of the images (description-based) like keywords, size,
caption, etc. While description-based image retrieval systems are relatively easier to imple-
ment and to design user interface for, they su�er from the same problems as the information
retrieval systems in text databases or Web search engines. It has been demonstrated that
search engines using current methods based on simple keyword matching perform poorly.
The precision1 of these search engines is very low and their recall2 is inadequate. It has been
demonstrated in [10] that any single web search engine provides the user with only 15-42 %
of the relevant documents. Furnas, et al. [11] show that due to widespread synonymy and
polysemy in natural languages, indexing methods based on the occurrence of single words
do not perform adequately.
Content-based image retrieval systems use visual features to index images. These systems
di�er mainly in the way they extract the visual features and index images, and the way they
are queried. Some systems are queried by providing an image sample. These systems search
for similar images in the database by comparing the feature vector (or signature) extracted
from the sample with the available feature vectors. The image retrieval system Image Surfer
provided by Yahoo, for example, is based on this type of search. Other systems are queried
by specifying or sketching image features like color, shape or texture, which are translated
into a feature vector to be matched with the known feature vectors in the database. QBIC
[2] and WebSeek [7], for example, provide both sample-based queries and the image feature
speci�cation queries. WebSeer [12] on the other hand, combines image descriptions, like
keywords, and image content, like specifying the number of faces in an image, and uses
image content to distinguish between photographs and �gures. However, the visual features
extracted are very limited. Another major di�erence between image retrieval systems is in the
domain they index. While Virage [4] indexes solely image databases, using COIR (Content-
Oriented Image Retrieval) [13], AMORE (Advanced Multimedia Oriented Retrieval Engine)
[9] indexes images from the World-Wide Web. Content-based systems give a relatively
satisfactory result with regard to the visual clues, however, their precision and recall are still
not optimized.
1Precision|the ratio of relevant documents to the total number of documents retrieved.2Recall|the percentage of relevant documents among all possible relevant documents.
2
E�ective strategies for image retrieval will bene�t from exploiting both content-based
and description-based retrieval techniques, and will combine conjunctions and disjunctions
of image features and descriptions in the queries, as well as providing users with adequate
and e�cient user interfaces for both querying and browsing.
We have been developing the C-BIRD (Content-Based Image Retrieval in Digital-libraries)
system, which combines automatically generated keywords and visual descriptors like color,
texture, shape, and feature localization, to index images and videos in the World-Wide Web.
This paper presents our new results of Search by Illumination invariance, Search by Object
Model and the discussion of feature localization vs. image segmentation.
Swain and Ballard's work on color object recognition by means of a fast matching of
color histograms [14] began an interest in the use of simple color{based features for image
and video database retrieval. In this method, a database of coarse histograms indexed by
three color values is built up. A very simple and fast histogram matching strategy can often
identify the correct match for a new image, or a near{match, by using an L1 metric of
histogram di�erences[14]. It was soon realized that, along with confounding factors such as
object pose, noise, occlusion, shadows, clutter, specularities, and pixel saturation, a major
problem arose because of the e�ect of changing illumination on images of color objects [15].
After all, it would be quite natural for an object in a database to be presented as it appears
imaged under some other lighting.
Several color object recognition schemes exist that purport to take illumination change
into account in an invariant fashion. In [16], we address the problem of illumination change
by extending the original Swain and Ballard method to include illumination invariance in a
natural and simpler way than heretofore. First, it is argued that a normalization on each
color channel of the images is really all that is required to deal properly with illumination
invariance. Second, with an aim of reducing the dimensionality of the feature space involved,
a full{color (3D) representation is replaced by 2D chromaticity histograms. It is shown
that the essential illumination{invariant color information is maintained across this data
reduction. The normalization step has the e�ect of undoing a changing{illumination induced
shift in pixel color{space position and in chromaticity space.
Histograms in chromaticity space are indexed by two values, and are treated as though
they were images. In order to greatly improve the e�ciency in searching large image and
video databases, the chromaticity histogram-images are compressed and then indexed into
3
a database with a small feature vector based on the compressed histogram. In the current
implementation the chromaticity histogram-image is �rst reduced by using a wavelet scaling
function. Then, the Discrete Cosine Transform (DCT) is applied, followed with a zonal cod-
ing [17] of the DCT image. This results in an e�ective low{pass �ltering of the chromaticity
histogram. The resulting indexing scheme is very e�cient in that it uses a DCT-chromaticity
vector of only 36 values. We have also applied this technique to video segmentation [18].
Since it is much more frequent that illumination changes due to camera motions and object
motions in video, our color-channel-normalization method is shown to clearly outperform
other cut-detection methods that only rely on color histograms.
Most existing techniques for content-based image retrieval rely on global image features
such as color and texture. These global methods are based on simple statistics extracted from
the entire images. They are easy to obtain and to store in a database, and their matching
takes little time. Inevitably, the global methods lack the power of locating speci�c objects
and identifying their details (size, position, orientation, etc.). Some extensions to the global
method include search by color layout [2], by sketch [6, 9], and by color regions according to
their spatial arrangements [7, 8].
It has long been argued that segmentation plays an important role in human vision [19].
Ever since the 60s and 70s, image segmentation has been one of the most persistent research
areas in computer vision. It is hoped that recognition would become much easier after
segmentation. However, it is well-known that a good image segmentation is often impossible
to attain. Commonly, images are either \over-segmented" or \under-segmented". As Marr
[20] pointed out, \... the di�culties in trying to formulate what should be recovered as a
region from an image are so great as to amount almost to philosophical problems." In [21] it
is argued that like many vision problems, the problem of image segmentation is \ill-de�ned".
Realizing the inadequacy of global features and methods such as the color histogram
(or texture) for content-based image retrieval, more and more researchers have proposed
image segmentation (based on color, texture, and shape) [7, 8, 22] as a main step toward
an e�ective content-based image retrieval. Apparently, as long as a good segmentation is
obtained, powerful constraints such as spatial relationships can be enforced. To overcome
the di�culties in achieving a sound segmentation, heuristics such as size-of-the-region and
maximum-number-of-the-regions are naturally developed to avoid over-segmentation; also,
motion in the spatiotemporal domain is exploited to improve image segmentation in video
4
[8].
This paper argues that, in spite of its popularity, the traditional image segmentation is
not a good image preprocessing tool for the content-based retrieval from image and video
databases. Instead, a new approach of feature localization is proposed. Based on the locales
extracted from the feature localization, a three-step algorithm that employs color hypothesis,
texture support, and shape veri�cation is developed. Since the �rst two steps enable the
estimation of the size, orientation, and location of the object, the use of the Generalized
Hough Transform (GHT) in the last step becomes very e�cient and viable.
In contrast to most existing approaches, our work has the following characteristics: (a)
the use of color{channel{normalization for illuminant-invariant image and video retrieval,
(b) the exploitation of intrinsic and compact feature vectors and the three-step matching
algorithm for search by object model, and (c) the exploration of feature localization in
content-based image and video retrieval.
The remainder of this paper is organized as follows. In Section 2, we describe the
illumination-invariant color indexing technology based on chromaticity of the normalized
images. The discussion of feature localization vs. image segmentation is in Section 3. Sec-
tion 4 presents the modeling and matching techniques. Section 5 describes the experimental
results. Section 6 summarizes our conclusions and future enhancements.
2 Illumination-Invariant Color Indexing
In this section it is shown that a simple color indexing method that is e�cient and invariant
under illuminant change can be derived for Search by Illumination Invariance if we store a
representation of a chromaticity histogram for each image that is �rst normalized, reduced
in size by a wavelet transformation, and then further reduced by going to the frequency
domain and discarding higher{frequency DCT coe�cients.
2.1 Chromaticity histogram of color{channel{normalized image
De�ne the chromaticity (r; g) for each pixel by [23]
r = R=(R +G +B) ; g = G=(R +G+B) (1)
The chromaticity is the projection of an RGB triple onto the planar triangle joining unit
distance along each of the color axes. It is important to note that, although the de�nition
5
of the chromaticity immediately provides some normalization, i.e., r + g + b = 1 if b is
de�ned accordingly, and it provides invariance to the intensity of the light by dividing by the
sum of the three color bands, the usage of chromaticity itself is insu�cient for illumination
invariance when the color (chrominance) of the light changes.
A color{channel-normalization method was proposed in [16]. Given an image of size
m� n, each of the RGB channels is treated as a long vector of length m � n. It is shown in
[16] that by employing an L2 normalization on each of the three RGB vectors, the e�ect of
any illumination change is approximately compensated. The color{channel{normalization
step e�ectively accomplishes illumination invariance. The usage of chromaticity provides two
additional advantages: (a) the color space is reduced from 3D (e.g., RGB, HSV, etc.) to 2D,
hence less computations, (b) the chromaticity value is indeed guaranteed to be in the range
of [0, 1.0]; this helps the formation of a small (well-bounded) 2D histogram space later.
From the chromaticity image, a chromaticity histogram can be obtained. This histogram
itself is viewed as a histogram-image, i.e., each bin value is viewed as a pixel value. Some
image compression techniques will then be applied to this histogram image. Note that since
r + g � 1, the chromaticity entries must lie below the main diagonal, thus only half of the
pixels in the histogram-image are used.
2.2 Histogram intersection
In [14], a very useful histogram metric is developed, which we adopt in C-BIRD for both the
usual color histogram matching and the uncompressed chromaticity histogram matching.
Adapting Swain and Ballard's de�nition to the present situation, we de�ne the intersec-
tion of chromaticity histograms Ha and Hb as:
� �Xi;j
minfHa(i; j);Hb(i; j)g (2)
Swain and Ballard normalize intersection (or match) values by the number of pixels in the
model histogram, and thus matches are between 0 and 1. Alternatively, one can make the
volume under each histogram equal to unity, e�ectively making each image have the same
number of pixels and turning the histogram into a probability density. Time for histogram
intersection is proportional to the number of histogram bins, and so is very fast.
It can be shown that histogram intersection is equivalent to 1 minus an L1 distance, and
so (1 � �) forms a metric �, with � = 1 � � = (1=n)PjHa �Hbj, where n is the number
6
of histogram bins. The utility of this metric is that it helps to alleviate the e�ects of noise
in the following way. suppose an image has signi�cant noise and it does not occur in the
particular model image chromaticity histogram being compared to, then such noise values
might tend to dominate, in an L2, squared{di�erences norm. Instead, here, zero occurrences
in the model histogram are counted and such e�ects do not contribute to the metric.
Content-based retrieval proceeds by intersecting the chromaticity histogram of an un-
known object with similar histograms precomputed and stored in a database. The highest
value of �, or in other words the smallest distance value (1��) indicates the database image
that matches best.
2.3 Chromaticity histogram{image compression
Chromaticity histogram matching without compression could be computationally intensive.
We would like to recover an accurate approximation of histogram{images without sacri�cing
e�ciency. As a guiding principle it would also be sensible to maintain a linear relation-
ship between the histogram{image and its compressed representation. We can adhere to
this principle by applying only linear operations while compressing the histogram{images.
Therefore, here we �rst apply a linear low{pass �lter to both histogram{images, resulting in
new histogramsH and H 0. To best approximate the chromaticity histograms, the low{pass
�ltered histogram{images should approximate the original ones as closely as possible, yet
be of lower resolution. The scaling function of bi-orthonormal wavelets, as a symmetrical
low{pass �lter, can be exploited to that end. Basically, scaling functions with more \taps"
use polynomials of higher order to approximate the original function (the number of taps is
the number of nonzero coe�cients) [24]. Our main concern is to capture the most detail but
in lower resolution. In [16], a good balance is achieved between e�ciency and precision by
using the symmetrical 9{tap �lter.
After applying the scaling function several times to the original histogram{images, as-
suming for simplicity square histogram{images with resolution 2n�2n, the size 16�16 lower
resolution histogram{images are obtained.
Now consider the DCT: if we denote the result of H transformed via a DCT by cH, then
since the DCT is linear we could con�dently index on cH.
Since the lower frequencies in the DCT capture most of the energy of an image, after
applying the DCT we can retain just the lower frequency coe�cients for histogram{image
7
database indexing with fairly good accuracy | a very e�ective and e�cient way of realizing
a further low{pass �ltering. By experiment [16] it is found that using only 36 coe�cients
worked well, these being those in the �rst 36 numbers in the upper left corner of the DCT
coe�cient matrix3.
Denote by Hd 36 values derived from the �rst 36 DCT coe�cients. We index on the L2
distance betweenHd for the model histogram{image and that for the test histogram{image.
Populating the database, then, consists of calculating o�-line the 36 values Hd, viewed
as indices for each model image. For image query, �rst the 36 values for the query image are
computed, thus obtainingH 0
d; then for every model image, the L2 distance [P(H 0
d�Hd)2]1=2
is calculated. The model image minimizing the distance is taken to be a match for the query
image.
Note that in this method only reduced, DCT transformed, quantized histogram{images
are used | no inverse transforms are necessary and the indexing process is carried out
entirely in the compressed domain.
The choice that the reduced resolution of the wavelet chromaticity histogram{images be
16 � 16 and that the number of DCT coe�cients retained be 36 is made quite empirically.
Detailed analysis and some variation of the choice of the DCT coe�cients are provided in
[16].
3 Feature Localization vs. Image Segmentation
3.1 De�nition of region revisited
Image segmentation is a process to segment an entire image into disjoint regions. A region
consists of a set of pixels that share certain properties, e.g., similar color (or gray-level
intensity), similar texture, etc. As in [25], if R is a region,
1. R is connected, i� all pixels in R are connected 4,
2. Ri \Rj = �; i 6= j,
3Instead of using a conventional 8� 8 window for the DCT, a 16� 16 window is adopted. As a result, a�ner resolution (twice as high as with 8� 8 ) in the spatial frequency domain is realized. Since the low{pass�ltering after DCT can only retain a limited number of coe�cients for e�ciency, the net e�ect of having alarger (16�16 ) window is that a more detailed parameterized description at the lower end of the spectrum isfacilitated. This is bene�cial when very low{resolution wavelet images are used for matching in our method.
4Either 4-connected or 8-connected. See [25] for more details.
8
L1
red
L1
blue
L2
red
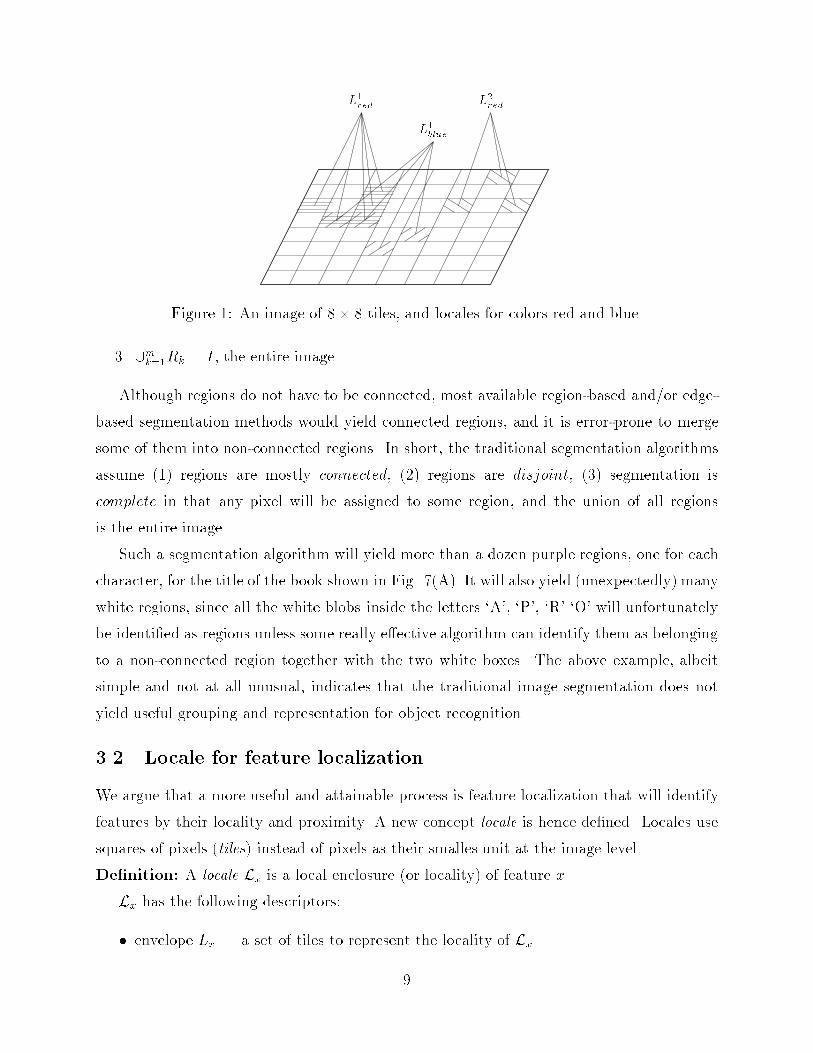
Figure 1: An image of 8� 8 tiles, and locales for colors red and blue.
3. [mk=1Rk = I, the entire image.
Although regions do not have to be connected, most available region-based and/or edge-
based segmentation methods would yield connected regions, and it is error-prone to merge
some of them into non-connected regions. In short, the traditional segmentation algorithms
assume (1) regions are mostly connected, (2) regions are disjoint, (3) segmentation is
complete in that any pixel will be assigned to some region, and the union of all regions
is the entire image.
Such a segmentation algorithm will yield more than a dozen purple regions, one for each
character, for the title of the book shown in Fig. 7(A). It will also yield (unexpectedly) many
white regions, since all the white blobs inside the letters `A', `P', `R' `O' will unfortunately
be identi�ed as regions unless some really e�ective algorithm can identify them as belonging
to a non-connected region together with the two white boxes. The above example, albeit
simple and not at all unusual, indicates that the traditional image segmentation does not
yield useful grouping and representation for object recognition.
3.2 Locale for feature localization
We argue that a more useful and attainable process is feature localization that will identify
features by their locality and proximity. A new concept locale is hence de�ned. Locales use
squares of pixels (tiles) instead of pixels as their smalles unit at the image level.
De�nition: A locale Lx is a local enclosure (or locality) of feature x.
Lx has the following descriptors:
� envelope Lx | a set of tiles to represent the locality of Lx.
9
� geometric parameters | mass M(Lx), centroid C(Lx), eccentricity E(Lx), and shape
parameters for the locale, etc.
A tile is a square area in an image, its size is chosen as 16 � 16 pixels in this paper.
Tile is the building-unit for envelopes. A tile is `red' if a su�cient number of pixels (e.g.,
10%) within the tile are red. It follows that a tile can be both `red' and `blue' if some of its
pixels are red and some are blue. While pixel is the building-block for image segmentation,
tile is the building-block for feature localization. Tiles are grouped into an envelope, if they
are geometrically close. The closeness will be measured by eccentricity and distance to be
discussed below.
Fig. 1 shows a square image that has 8� 8 tiles, two locales for color red, and one locale
for color blue. The envelope L1red in Fig. 1, for example, consists of 5 tiles.
M(Lx) is the number of pixels in Lx that actually have feature x, e.g., the number of
pixels that are red. M(Lx) is usually less than the Area of Lx, although it could be equal
to it. C(Lx) is simply the centroid of the mass. E(Lx) is a measure of the average distance
from pixels in Lx to the centroid, it measures the eccentricity of Lx. Note,M , C, E, etc. are
measured in unit of pixels, not in tiles. This guarantees the granularity. Hence the feature
localization is not merely a low-resolution variation of image segmentation.
The procedure for generating the locales basically uses merge. First, simple statistics (M ,
C, E) is gathered within each tile. Afterwards, a method similar to \pyramid-linking" [26]
is used to merge the tiles into locales. In terms of the parent-child relation, the overlapped
pyramid is used.
Working bottom-up, all tiles having feature x are linked to their parent and merged into
Lx if the merged locale will have E(Lx) < � , where � is a threshold normalized against
M(Lx). Otherwise, they will be linked to two di�erent parents belonging to di�erent en-
velopes Lix and L
jx. During the merge,M(Lx), C(Lx), and E(Lx) are updated accordingly.
From the above de�nition, it is important to note that in the most cases the following
are true:
1. (9x)Lx is not connected,
2. (9x)(9y)Lx \ Ly 6= �; x 6= y,
3. [xLx 6= I, the entire image.
10
Namely, (1) pixels inside a locale for some feature are not necessarily connected, (2)
locales are not always disjoint, their envelopes can be overlapped, (3) not all pixels in an
image must be assigned to some locale in the feature localization process.
Locale is not simply a variant of non-connected region, the main di�erence between locale
and non-connected region is illustrated by the above property (2). In the proposed feature
localization, it is the approximate location that is identi�ed, not the precise membership as
which pixel belongs to which region. The di�erence is not a philosophical one. If indeed only
some simple process is to be applied, e.g., template matching, then the precise membership
of the region is important. In the domain of content-based image retrieval where a very
large amount of image and video data are processed, such simple and precise matches are
not feasible. Instead, a more heuristic (evidential) process is going to be adopted which
usually involves multiple features and their spatial relationships. For this purpose, it should
be evident that the `blobby' locales are easier to extract, and more appropriate than regions
formed by (connected) pixels.
Property (3) indicates that, unlike the image segmentation, the feature localization is
incomplete. Use color localization as an example, we will likely not be interested in all colors
or all color spots in an image, at least not some tiny noise spots. When only the locales of
the few prominent colors are identi�ed, the union of them is not the whole image.
3.3 Speci�cs for extracting locales
The tasks involved in extracting Locales are (1) Image tile generation and (2) envelope
growing. The following is a detailed description of the tasks for identifying color locales:
3.3.1 Image tile generation
Tile size was chosen to be 16�16, because it is large enough to generate meaningful statistics
for the underlying features, but also small enough to guarantee the granularity5. The choice
of the tile size will of course be dependent on the image resolution. If a lower-resolution
image is chosen, the tile size can readily be reduced to e.g., 8 � 8.
Color pixels in a tile are classi�ed as of dominant color or transitional color. The tran-
sitional color often occurs between two color regions, simply because of the smooth color
5The size 16�16 happens to be the size of the macroblocks for the MPEG motion vectors. Although notaddressed in this paper, this has been proven convenient in our current work when motion parameters arebrought in consideration for retrieving the MPEG videos.
11
transition in the sensory data. It could also be due to the anti-aliasing e�ect or noise.
The dominant color is identi�ed by comparing the intensity value of the current pixel
to its 8 immediate neighbors. The criterion is that it is not on a slope of rising/declining
intensity values (with a chosen threshold 10).
While identifying dominant pixels, their geometry data are also gathered in the same
pass. At this initial stage, each tile is considered as a Locale.
� M(Lf ) = count of the pixels having feature f.
� C(Lf ) =PM(Lf )
i=1 P
M(Lf), where P is the point coordinate.
� E(Lf ) =PM(Lf )
i=1 ((Px�Cx(Lf))2+(Py�Cy(Lf ))
2)
M(Lf )=PM(Lf )
i=1 (P 2x+P
2y )
M(Lf )�Cx(Lf )2�Cy(Lf )2, where
Cx; Cy; Px; Py are the x and y coordinates for C and P respectively.
As shown above, the intermediate data generated is justPM(Lf)
i=1 (P 2x + P 2
y ) which can
be calculated e�ciently in a progressive manner.
Dominant colors and associated geometric statistics are added to a tile color list. Dom-
inant pixel geometry data is added to the �rst element with similar color to it in the color
list, and a weighted color average is performed on the list element to obtain a better color
de�nition. If no element with similar color exists, then a new element is created in the list for
that pixel containing only its color and geometry information. Similar colors are contained
in the same volume set of a 32 � 32 � 32 box in a 256 � 256 � 256 RGB space.
After all the dominant colors have been added to the color list, the list is sorted by
M(Lf ) in descending order, so that transitional colors have a chance to match �rst to the
most frequent dominant color.
Next, the pixels with transitional colors are being added to the tile color list. We compare
every transitional pixel i against its neighborhood of 5 � 5 pixels. If any of the neighbors
have dominant colors then the neighbor pixel chosen is that which has a color of minimum
Euclidean distance in RGB space from pixel i. The geometry statistics of pixel i are added
to the color list element with the closest color to the chosen pixel, but the color information
of pixel i is ignored, rather than being averaged with the list element color. If none of the
neighbors of pixel i has dominant colors then the pixel i will be added to a transitional color
list.
12
Finally, both color lists are checked for elements with similar color to other elements in
the same list, which is possible because after performing the color averaging, the color can
gradually change to be similar to other colors in the list. All similar elements are merged
together. However, there cannot be any similar elements between the two lists, so to merge
the two color lists we only need to append the transition colors list to the end of the dominant
colors list.
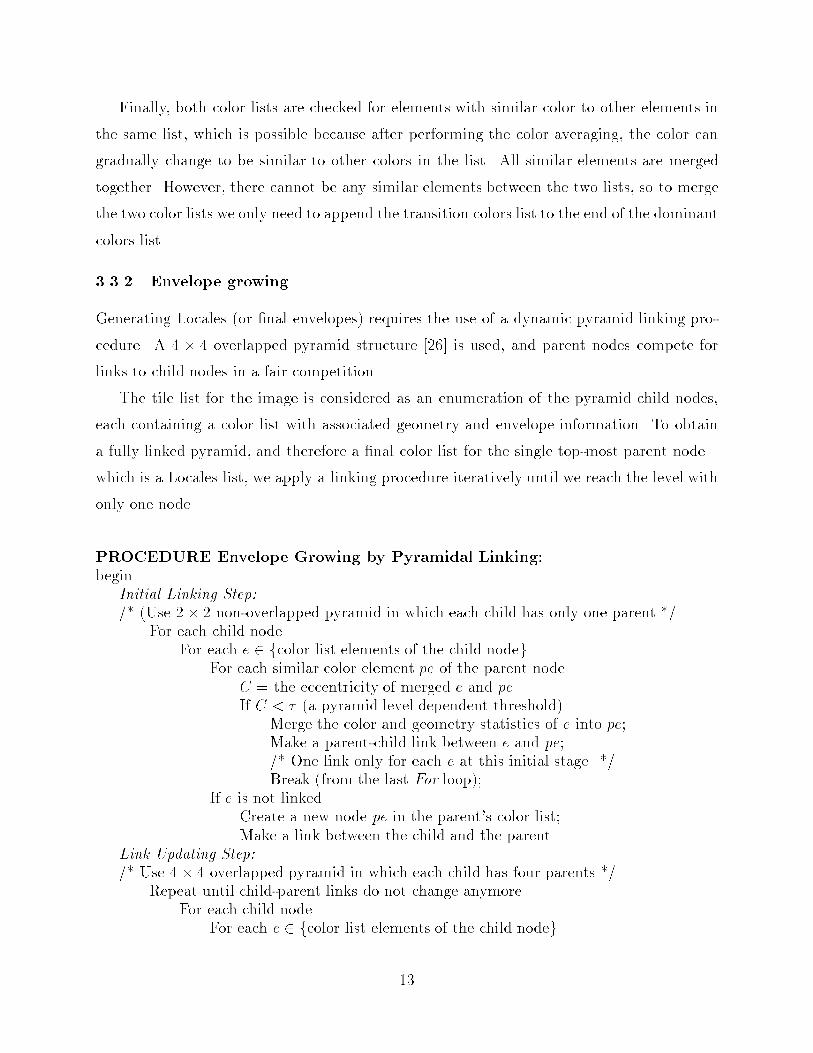
3.3.2 Envelope growing
Generating Locales (or �nal envelopes) requires the use of a dynamic pyramid linking pro-
cedure. A 4 � 4 overlapped pyramid structure [26] is used, and parent nodes compete for
links to child nodes in a fair competition.
The tile list for the image is considered as an enumeration of the pyramid child nodes,
each containing a color list with associated geometry and envelope information. To obtain
a fully linked pyramid, and therefore a �nal color list for the single top-most parent node {
which is a Locales list, we apply a linking procedure iteratively until we reach the level with
only one node.
PROCEDURE Envelope Growing by Pyramidal Linking:begin
Initial Linking Step:
/* (Use 2� 2 non-overlapped pyramid in which each child has only one parent */For each child node
For each e 2 fcolor list elements of the child nodegFor each similar color element pe of the parent node
C = the eccentricity of merged e and peIf C < � (a pyramid level dependent threshold)
Merge the color and geometry statistics of e into pe;Make a parent-child link between e and pe;/* One link only for each e at this initial stage. */Break (from the last For loop);
If e is not linkedCreate a new node pe in the parent's color list;Make a link between the child and the parent.
Link Updating Step:
/* Use 4� 4 overlapped pyramid in which each child has four parents */Repeat until child-parent links do not change anymore
For each child nodeFor each e 2 fcolor list elements of the child nodeg
13
Find all similar color elements pe's from 4 parent nodes;If merging with one of the pe's yields a more compact localethan the currently linked pe
Switch e's parent to the new pe and update the statistics.Finalization Step:
Merge similar colors and remove empty entries from parent list.Go up one more level in the pyramid and repeat the above.
end
During each iteration in the link updating step, the parent list nodes must remain con-
stant, so that the linking procedure is consistent in each iteration. Updating of the geometry
statistics is done on an additional tentative parent list, and after the iteration the parent list
is updated.
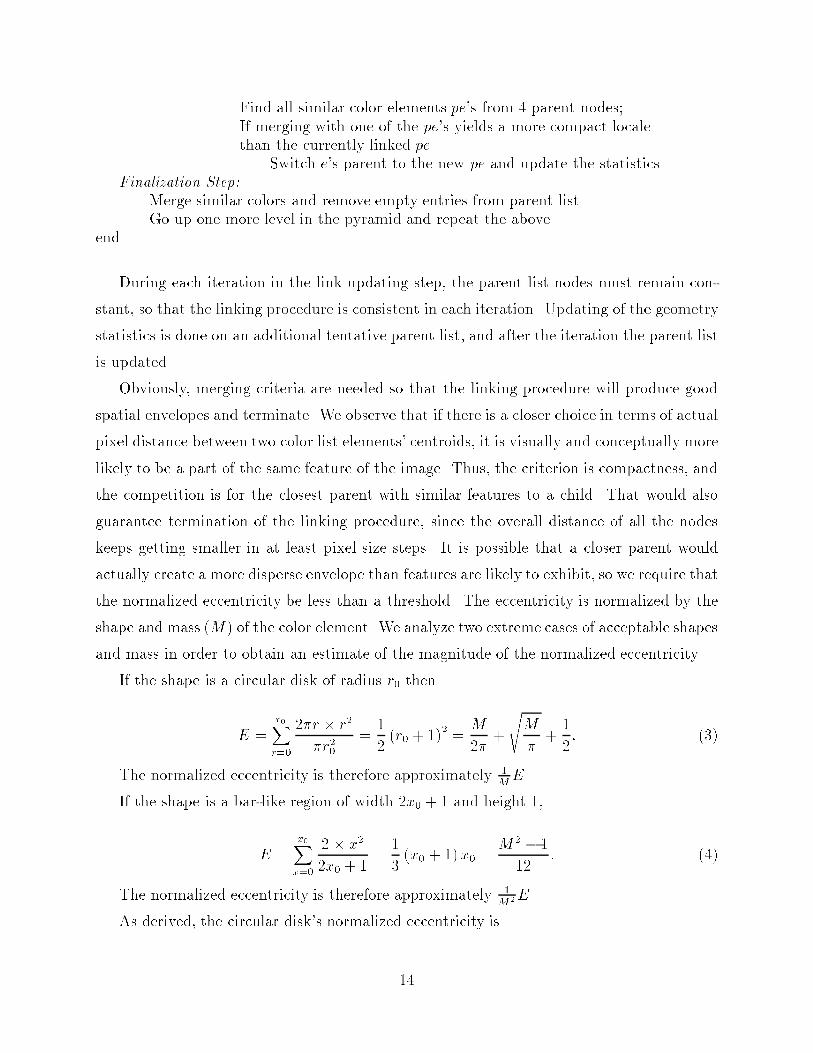
Obviously, merging criteria are needed so that the linking procedure will produce good
spatial envelopes and terminate. We observe that if there is a closer choice in terms of actual
pixel distance between two color list elements' centroids, it is visually and conceptually more
likely to be a part of the same feature of the image. Thus, the criterion is compactness, and
the competition is for the closest parent with similar features to a child. That would also
guarantee termination of the linking procedure, since the overall distance of all the nodes
keeps getting smaller in at least pixel size steps. It is possible that a closer parent would
actually create a more disperse envelope than features are likely to exhibit, so we require that
the normalized eccentricity be less than a threshold. The eccentricity is normalized by the
shape and mass (M) of the color element. We analyze two extreme cases of acceptable shapes
and mass in order to obtain an estimate of the magnitude of the normalized eccentricity.
If the shape is a circular disk of radius r0 then
E =r0Xr=0
2�r � r2
�r20=
1
2(r0 + 1)2 =
M
2�+
sM
�+1
2: (3)
The normalized eccentricity is therefore approximately 1ME.
If the shape is a bar-like region of width 2x0 + 1 and height 1,
E =x0Xx=0
2 � x2
2x0 + 1=
1
3(x0 + 1)x0 =
M2 � 1
12: (4)
The normalized eccentricity is therefore approximately 1M2E.
As derived, the circular disk's normalized eccentricity is
14
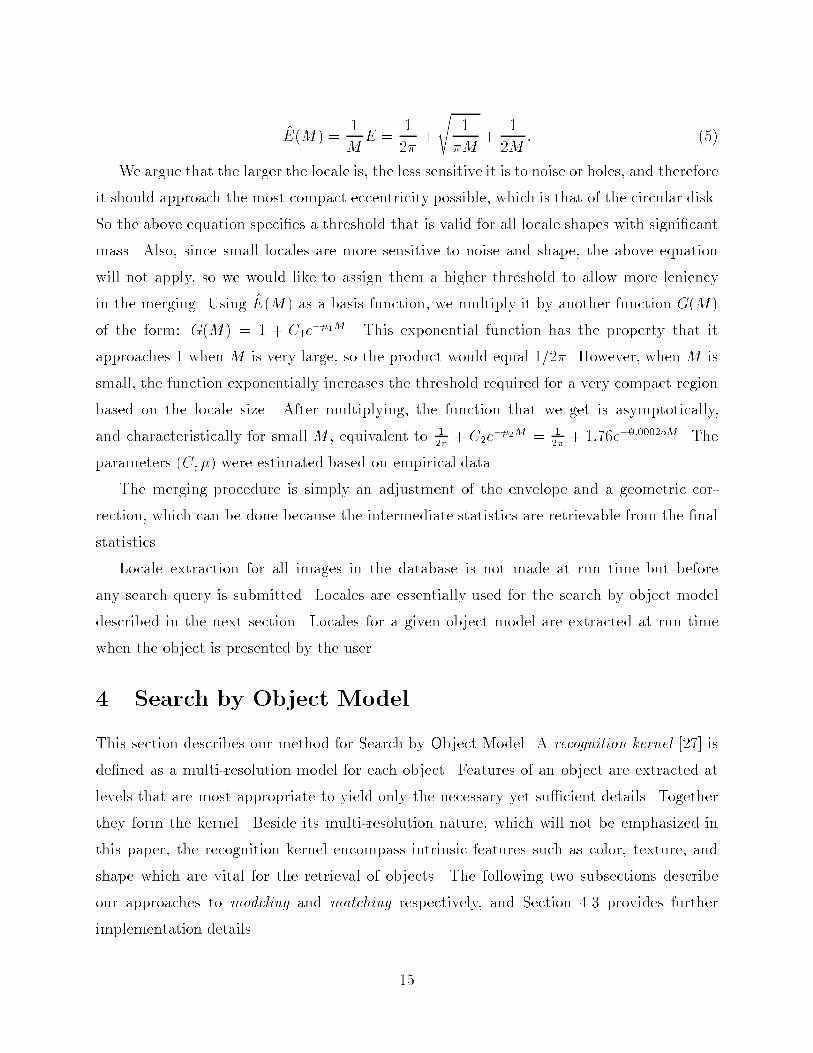
E(M) =1
ME =
1
2�+
s1
�M+
1
2M: (5)
We argue that the larger the locale is, the less sensitive it is to noise or holes, and therefore
it should approach the most compact eccentricity possible, which is that of the circular disk.
So the above equation speci�es a threshold that is valid for all locale shapes with signi�cant
mass. Also, since small locales are more sensitive to noise and shape, the above equation
will not apply, so we would like to assign them a higher threshold to allow more leniency
in the merging. Using E(M) as a basis function, we multiply it by another function G(M)
of the form: G(M) = 1 + C1e��1M . This exponential function has the property that it
approaches 1 when M is very large, so the product would equal 1=2�. However, when M is
small, the function exponentially increases the threshold required for a very compact region
based on the locale size. After multiplying, the function that we get is asymptotically,
and characteristically for small M , equivalent to 12�
+ C2e��2M = 1
2�+ 1:76e�0:00025M. The
parameters (C;�) were estimated based on empirical data.
The merging procedure is simply an adjustment of the envelope and a geometric cor-
rection, which can be done because the intermediate statistics are retrievable from the �nal
statistics.
Locale extraction for all images in the database is not made at run time but before
any search query is submitted. Locales are essentially used for the search by object model
described in the next section. Locales for a given object model are extracted at run time
when the object is presented by the user.
4 Search by Object Model
This section describes our method for Search by Object Model. A recognition kernel [27] is
de�ned as a multi-resolution model for each object. Features of an object are extracted at
levels that are most appropriate to yield only the necessary yet su�cient details. Together
they form the kernel. Beside its multi-resolution nature, which will not be emphasized in
this paper, the recognition kernel encompass intrinsic features such as color, texture, and
shape which are vital for the retrieval of objects. The following two subsections describe
our approaches to modeling and matching respectively, and Section 4.3 provides further
implementation details.
15
4.1 Color, texture, shape in object modeling
1. Color: Colors in a model image are sorted according to their frequency (number of
pixels) in the RGB color histogram. The �rst few (e.g., �ve) are called Most Frequent
Colors (MFCs). When color is extracted from relatively low resolution images where
only very few prominent colors are preserved, the MFCs become especially dominant.
Locale(s) for each MFC in the object model will be extracted �rst. Each pair of the
centroids for two of the MFC locales can be connected to produce an MFC vector. The
length of the MFC vectors and the angles between them characterize the color distri-
bution, size, and orientation of the object. To reduce the total number of MFC vectors,
only the vectors that connect the �rst MFC centroid to the other MFC centroids are
used. Hence, for k (k � 2) MFCs, the total number of MFC vectors is k � 1.
For simplicity, the RGB color model is adopted. It su�ces for the purpose of the
content-based retrieval in C-BIRD. Alternatively, some luminance-chrominance color
models (e.g., YUV, LUV) can be used which would reduce the representational redun-
dancy present in the RGB model.
2. Texture: As the color histogram can be de�ned in a 3D space (RGB, LUV, etc.),
texture histogram can also be de�ned in a 3D or 2D space. Two of the Tamura texture
measures are coarseness and directionality [28]. Recent studies [29, 30] also suggest
that they are among the few most e�ective perceptual dimensions in discriminating
texture patterns.
In our edge-based approach, the directionality is simply measured by the gradient
direction � of the edge pixels. It is especially useful in handling rotations. When an
object is rotated on a 2-D plane (e.g., a book is placed on the desk with a di�erent
orientation), all the edge orientations are simply incremented (or decremented) by
a �. The coarseness can be characterized by edge separation which is measured by
the distance of the nearest edge pixel along the direction of �. Apparently, the edge
separation is sensitive to the scale/resolution of the images.
The current C-BIRD implementation uses a 2D texture space which is composed of S
(edge separation) and � (directionality). The texture statistics are extracted for each
locale; in other words, they are locale-based. They are derived from the edge image of
16
the luminance image Y, where Y = 0:299R + 0:587G + 0:114B.
3. Shape: The Generalized Hough Transform (GHT) [31] is adopted to represent the
shape of the object. Brie y, each edge point in the object model is represented by a
vector ri( i; ri) connecting the edge point to a chosen reference point for the object.
All ri's are stored in an R-table which serves as an object model. The R-table is
indexed by the edge orientation �i of the edge point. At the matching time, each edge
point in the database image uses the R-table to cast its vote to an accumulate array.
As a result, a peak will be formed at the location of the corresponding reference point
in the accumulate array if the object indeed appears in the database image.
The major advantage of the GHT (and its variants) over other shape representations
[32] is its insensitivity to noise and occlusion [33, 34]. It can also be applied hierarchi-
cally to describe the object (or a portion of the object) at multiple resolutions. It is
known that the discriminative power of the GHT diminishes when the aim is to recog-
nize the object at all possible scales and orientations, because then the GHT matching
will have to be attempted at numerous iterations and the decision often becomes non-
attainable. We will hence propose the following three-step matching algorithm in which
the GHT will only be applied after the �rst two steps when a certain hypothesis of a
possible object size, orientation, and location is made.
4.2 The three-step matching algorithm
A three-step matching algorithm for searching by object models in image and video databases
is developed, i.e., (1) color hypothesis, (2) texture support, (3) shape veri�cation. It is
generally accepted that color is fairly invariant to scaling and rotation, hence the feature
color is used in the �rst step of the matching. After color localization, a hypothesis of the
existence of an object at a certain location, size and orientation can be made. If there is a
su�cient similarity in their texture between the object model and the image at the vicinity
of the hypothesized enclosure, then a shape veri�cation procedure based on the GHT will
be invoked.
For both color and shape, there is an issue of similarity. It is dealt with e�ectively using
the MFC vectors and the geometric and texture parameters of the locales. First, if the model
object appears in the image with exactly the same size and orientation, then the mass M ,
17
eccentricity E of each locale, the length �i and orientation �i of each MFC vector, and the
angles �j between the pairs of the MFC vectors are all identical, whether they are extracted
from the model or from the object in the image. Second, if the object in the image has
a di�erent size and/or orientation, then M and �i should be scaled according to the size
ratio, �i should be incremented by a rotational angle �, whereas �j would remain the same.
Certain tolerance for error is implemented to support the similarity.
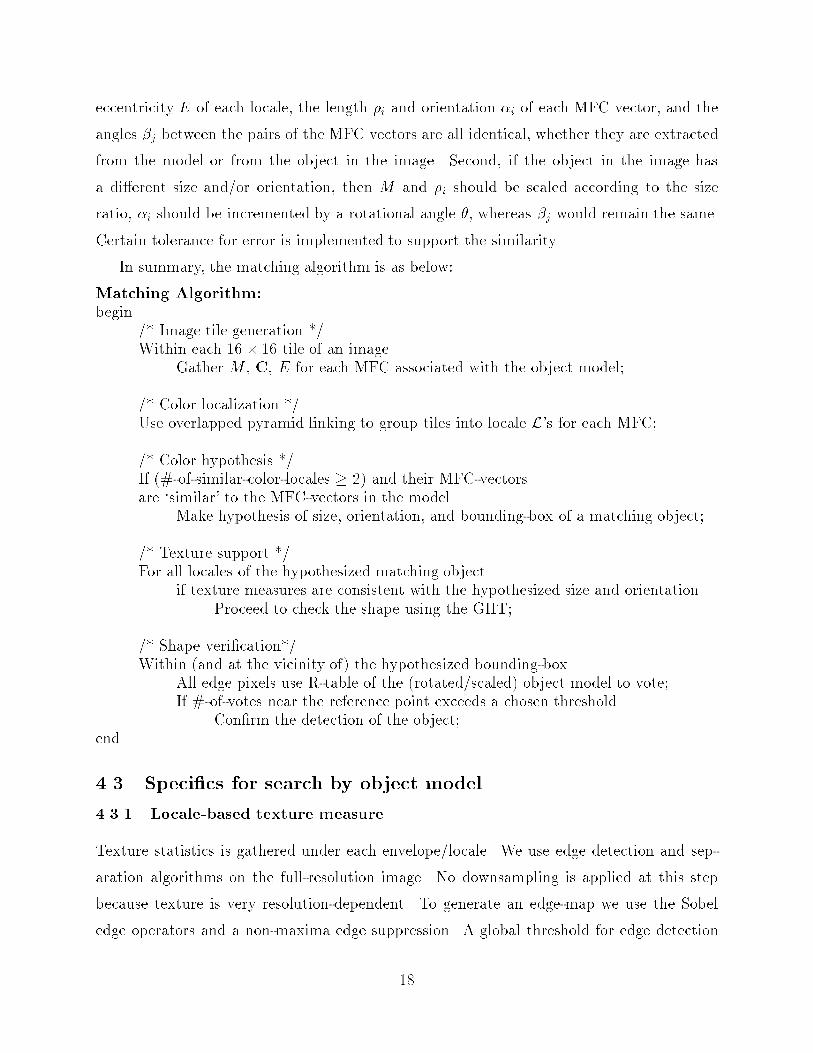
In summary, the matching algorithm is as below:
Matching Algorithm:begin
/* Image tile generation */Within each 16 � 16 tile of an image
Gather M , C, E for each MFC associated with the object model;
/* Color localization */Use overlapped pyramid linking to group tiles into locale L's for each MFC;
/* Color hypothesis */If (#-of-similar-color-locales � 2) and their MFC-vectorsare `similar' to the MFC-vectors in the model
Make hypothesis of size, orientation, and bounding-box of a matching object;
/* Texture support */For all locales of the hypothesized matching object
if texture measures are consistent with the hypothesized size and orientationProceed to check the shape using the GHT;
/* Shape veri�cation*/Within (and at the vicinity of) the hypothesized bounding-box
All edge pixels use R-table of the (rotated/scaled) object model to vote;If #-of-votes near the reference point exceeds a chosen threshold
Con�rm the detection of the object;end
4.3 Speci�cs for search by object model
4.3.1 Locale-based texture measure
Texture statistics is gathered under each envelope/locale. We use edge detection and sep-
aration algorithms on the full-resolution image. No downsampling is applied at this step
because texture is very resolution-dependent. To generate an edge-map we use the Sobel
edge operators and a non-maxima edge suppression. A global threshold for edge detection
18
applying to the entire image often yields poor results. In particular, the amount of edges
for the object model could be severely a�ected by the possibly varying background, which
will directly a�ect the texture measures. In C-BIRD, edge detection is conducted within
individual locales (and their immediately surrounding areas to detect the possible boundary
edge pixels of the locales). We threshold the edge-map using the median of the intensity
values of the edge pixels inside each envelope. The Application of the local threshold for each
locale improves the consistency of the edge detection and hence the quality of the texture
measure.
To generate the S (edge separation) information, for every edge pixel in an envelope we
measure the pixel distance from it along its gradient line to the closest edge pixel inside the
same envelope that has a similar gradient angle within a threshold of 15�. The distances
from both sides of the pixel (along � and � + 180�) are taken into account. If there is no
other edge pixel along the gradient line, then the separation distance is `in�nity'. Also, if
the separation is larger than a speci�ed maximum (192 pixels for 640� 480 images), then S
is considered to be `in�nity'.
A histogram of S (edge separation) vs. � (edge gradient angle / directionality) is created
for the texture measure of each locale. The texture histograms is normalized by simply using
percentage values. Initially, the size of the histograms is 193 � 180, where S = 193 refers to
in�nity. For e�ciency, the histograms are later greatly subsampled. To reduce the impact
of noises and the inevitable deviations between the model and the object in the database,
the texture histograms are also smoothed by applying a Gaussian operator. The resulting
histogram is quantized at 9 � 8, where S axis is divided into 8 cells plus the ninth cell for
the in�nity, and the � axis is divided into 8 cells.
4.3.2 Estimation of scale and rotation & execution of the GHT
The database images are screened by considering only the images that have all the locale
colors of the model image. Let M(LmMFC1
), M(LmMFCi
), M(LdbMFC1
), and M(LdbMFCi
) denote
the mass of the �rst and ith MFCs from the model image and the database image respectively,
MFV mi�1 and MFV db
i�1 the (i� 1)th vectors that connect the centroids of these MFC locales.
For each pair of the MFC vectors from the model image and the database image, the following
are checked to determine whether a hypothesis of the existence of an object with a certain
scale and orientation is warranted:
19
IfqM(Ldb
MFC1)=M(Lm
MFC1) = k , thenq
M(LdbMFCi
)=M(LmMFCi
) � k and���MFV db
i�1
��� = ���MFV mi�1
��� � k;
and if �(MFV db1 )� �(MFV m
1 ) = � then
�(MFV dbi�1)� �(MFV m
i�1) � � .
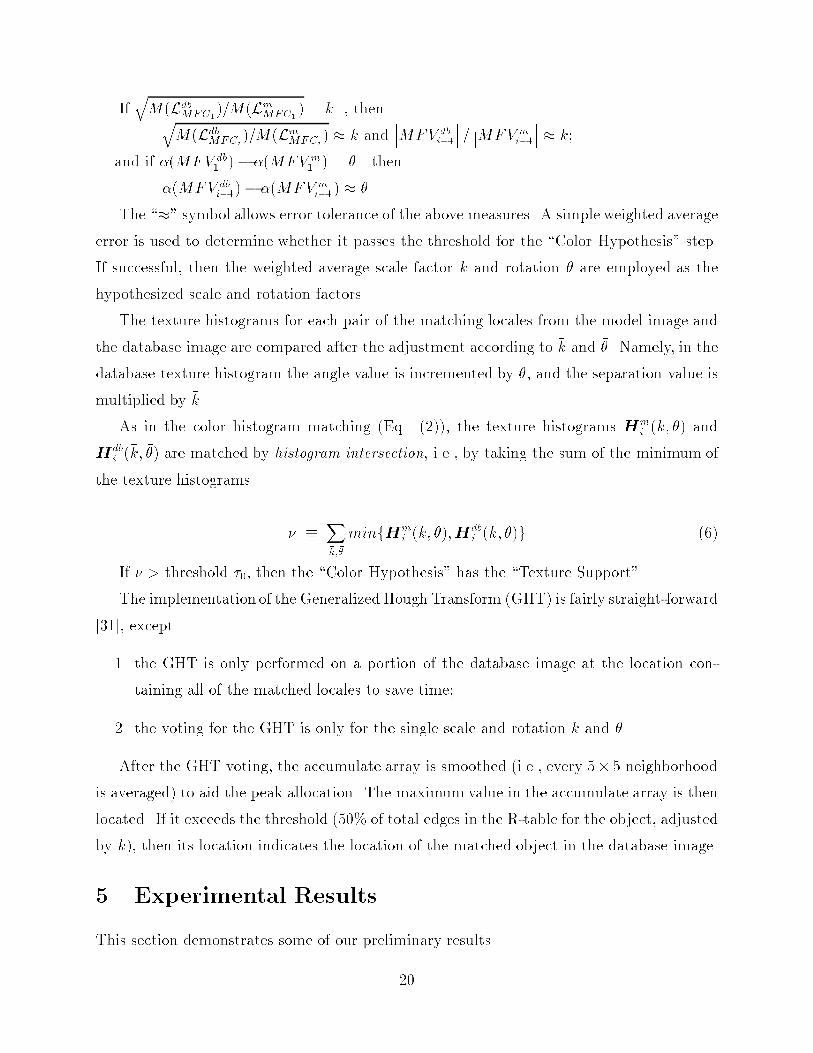
The \�" symbol allows error tolerance of the above measures. A simple weighted average
error is used to determine whether it passes the threshold for the \Color Hypothesis" step.
If successful, then the weighted average scale factor �k and rotation �� are employed as the
hypothesized scale and rotation factors.
The texture histograms for each pair of the matching locales from the model image and
the database image are compared after the adjustment according to �k and ��. Namely, in the
database texture histogram the angle value is incremented by ��, and the separation value is
multiplied by �k.
As in the color histogram matching (Eq. (2)), the texture histograms Hmi (�k; ��) and
Hdbi (
�k; ��) are matched by histogram intersection, i.e., by taking the sum of the minimum of
the texture histograms.
� �X�k;��
minfHmi (�k; ��);Hdb
i (�k; ��)g (6)
If � > threshold �0, then the \Color Hypothesis" has the \Texture Support".
The implementation of the Generalized Hough Transform (GHT) is fairly straight-forward
[31], except
1. the GHT is only performed on a portion of the database image at the location con-
taining all of the matched locales to save time;
2. the voting for the GHT is only for the single scale and rotation �k and ��.
After the GHT voting, the accumulate array is smoothed (i.e., every 5� 5 neighborhood
is averaged) to aid the peak allocation. The maximum value in the accumulate array is then
located. If it exceeds the threshold (50% of total edges in the R-table for the object, adjusted
by �k), then its location indicates the location of the matched object in the database image.
5 Experimental Results
This section demonstrates some of our preliminary results.
20
Image
Excavator
C-BIRD
Pre-processor
C-BIRD
Search Engine
C-BIRD
User
Interface
Image Repository (ex: WWW)
C-BIRD Database
Image
C-BIRD
Pre-processor
Excavator
Pages to visit
Pages not to visit
Visited pages
New links
title + headers
image neighbourhood
hypertext
Images
URL Description
Thumbnails
Content
Current
Web page
Ln
Lr
LvColour histogram
Colour Chromaticity
Edge distribution
Locales
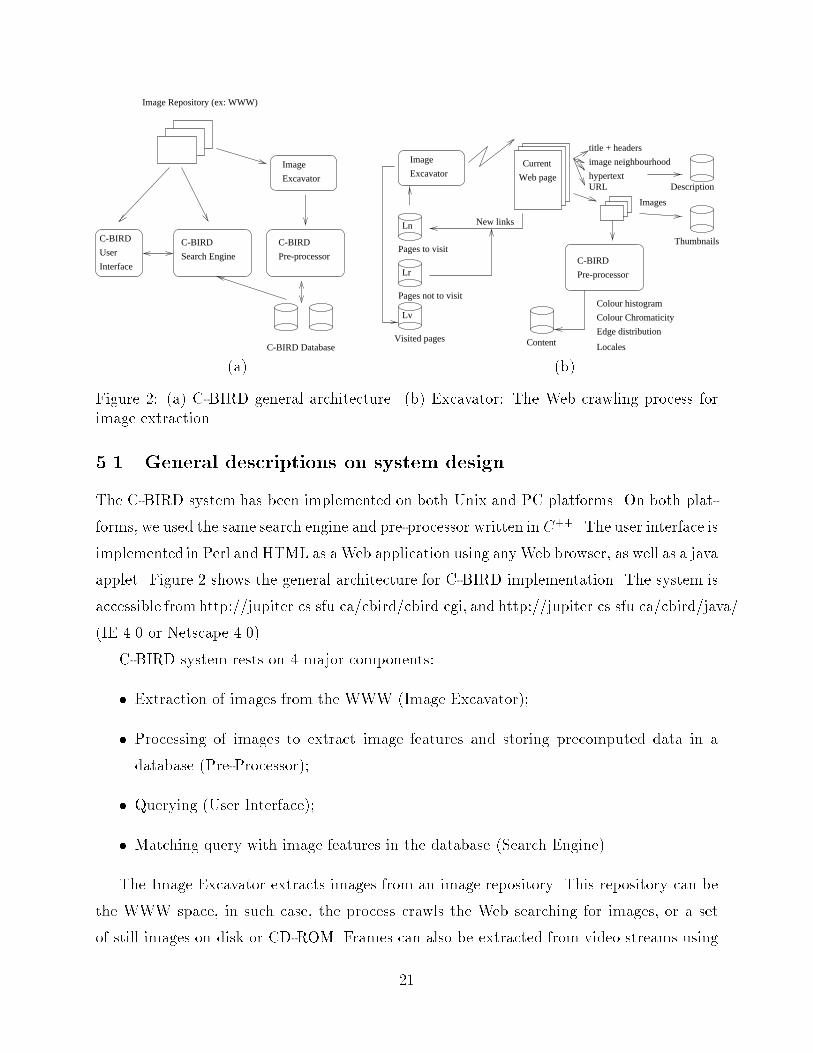
(a) (b)
Figure 2: (a) C-BIRD general architecture. (b) Excavator: The Web crawling process forimage extraction.
5.1 General descriptions on system design
The C-BIRD system has been implemented on both Unix and PC platforms. On both plat-
forms, we used the same search engine and pre-processor written in C++. The user interface is
implemented in Perl and HTML as aWeb application using anyWeb browser, as well as a java
applet. Figure 2 shows the general architecture for C-BIRD implementation. The system is
accessible from http://jupiter.cs.sfu.ca/cbird/cbird.cgi, and http://jupiter.cs.sfu.ca/cbird/java/
(IE 4.0 or Netscape 4.0).
C-BIRD system rests on 4 major components:
� Extraction of images from the WWW (Image Excavator);
� Processing of images to extract image features and storing precomputed data in a
database (Pre-Processor);
� Querying (User Interface);
� Matching query with image features in the database (Search Engine).
The Image Excavator extracts images from an image repository. This repository can be
the WWW space, in such case, the process crawls the Web searching for images, or a set
of still images on disk or CD-ROM. Frames can also be extracted from video streams using
21
cut-detection algorithms [35, 18, 6] and processed as still images. Once images are extracted
from the repository, they are given as input to the image analyzer (C-BIRD pre-processor)
that extracts visual content features like color and edge characteristics. These visual features,
along with the context feature like image URL, parent URL, keywords, etc., extracted with
the Image Excavator, are stored in a database. The collection of images and the extraction
of image features are processes that are done o�-line before queries are submitted. When
a query is submitted, accessing the original data in the image repository is not necessary.
Only the precomputed data stored in the database is used for image feature matching. This
makes C-BIRD more scalable and allows fast query responses for a large number of users
and a huge set of images.
We have implemented several types of searches and any combinations of them in C-BIRD:
1. Search by conjunctions and disjunctions of keywords;
2. Search by color histogram: similarity with color histogram in a sample image. Color
can also be speci�ed in percentage within the image or layout in a 1 � 1. 2� 2, 4 � 4
or 8� 8 grid;
3. Search by texture: texture here is characterized by edge density and orientation, its
layout can also be speci�ed;
4. Search by illumination invariance: similaritywith color chromaticityusing color-channel-
normalized images;
5. Search by object model: speci�cation of an object to look for in images.
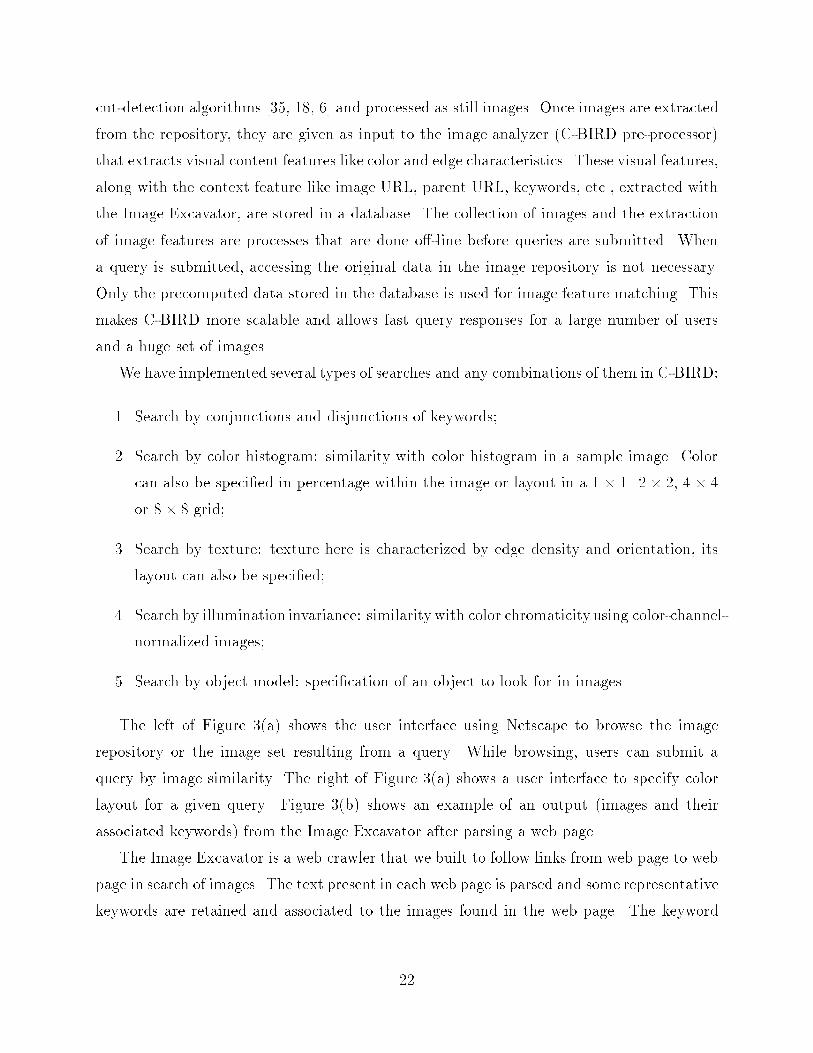
The left of Figure 3(a) shows the user interface using Netscape to browse the image
repository or the image set resulting from a query. While browsing, users can submit a
query by image similarity. The right of Figure 3(a) shows a user interface to specify color
layout for a given query. Figure 3(b) shows an example of an output (images and their
associated keywords) from the Image Excavator after parsing a web page.
The Image Excavator is a web crawler that we built to follow links from web page to web
page in search of images. The text present in each web page is parsed and some representative
keywords are retained and associated to the images found in the web page. The keyword
22
(a) (b)
Figure 3: (a) C-BIRD Web user interface. (b) Output from the Image Excavator
extraction process uses a semantic network of English words and builds concept hierarchies
with the selected words. The process of keyword extraction is explained in [36, 37].
The database used by C-BIRD contains mainly meta-data extracted by the pre-processor
and the Image Excavator. As explained above, only features collected in this database at pre-
processing time, are used by the search engine for image or image feature matching. During
run time, minimal processing is done. For each image collected, the database contains some
description information, a feature descriptor, and a layout descriptor, as well as a set of multi-
resolution sub-images (i.e. search windows) feature descriptors. Neither the original image
nor the sub-images are directly stored in the database but only their feature descriptors.
We use our illuminance invariant method to detect cuts in videos, and segment a video
into clips (frame sequences). The starting time and duration of the image sequence are
stored with the meta-data. While the thumbnail is generated from the middle frame of the
clip, color and texture features are extracted from all frames.
The current test database has over 1,300 images. The meta-data is stored in a SQL
server running on a Pentium-II 333 MHz PC with 128 MB of RAM. Search times are in the
order of 0.1 to 2 seconds depending upon the type of search, except for the search by object,
which may take up to 10 seconds.
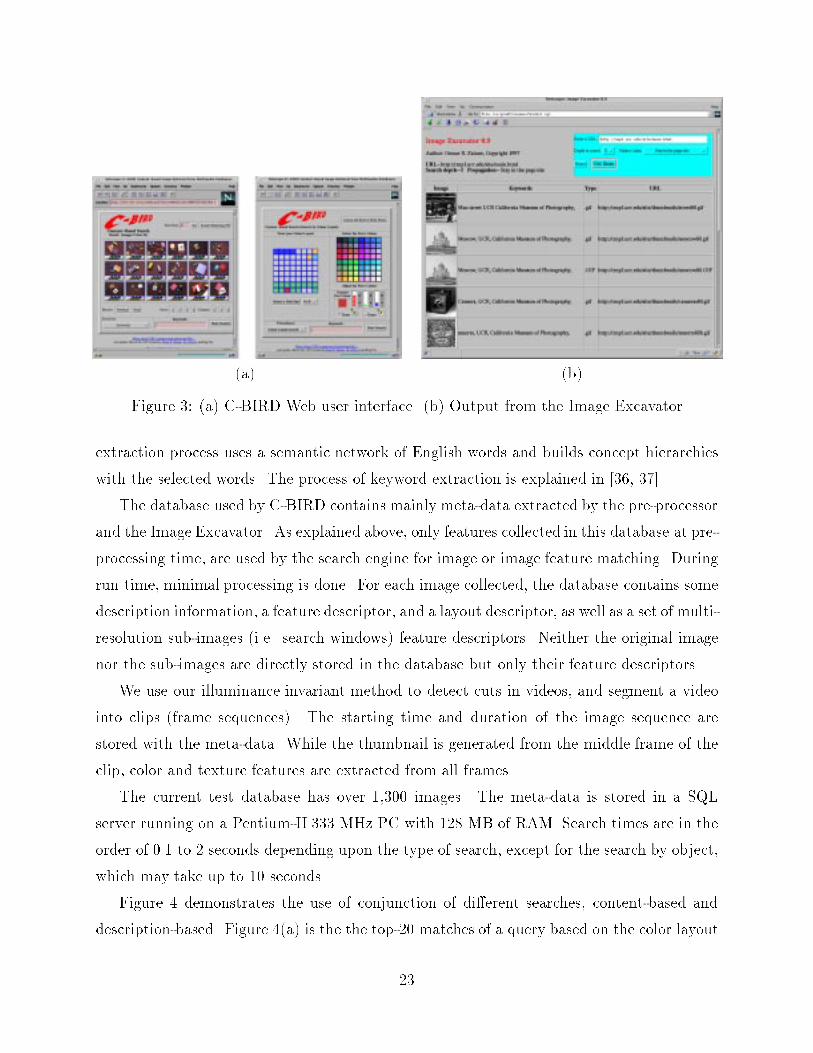
Figure 4 demonstrates the use of conjunction of di�erent searches, content-based and
description-based. Figure 4(a) is the the top-20 matches of a query based on the color layout
23
(a) (b) (c)
Figure 4: Conjuction of searches.
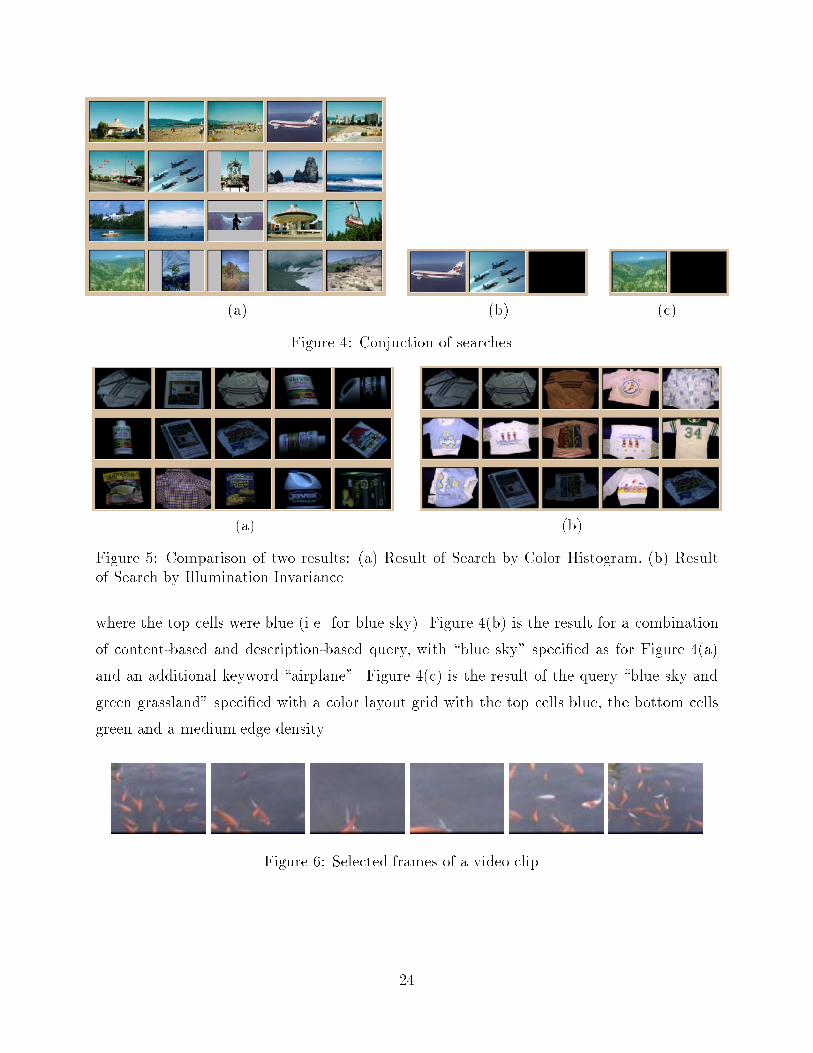
(a) (b)
Figure 5: Comparison of two results: (a) Result of Search by Color Histogram, (b) Resultof Search by Illumination Invariance.
where the top cells were blue (i.e. for blue sky). Figure 4(b) is the result for a combination
of content-based and description-based query, with \blue sky" speci�ed as for Figure 4(a)
and an additional keyword \airplane". Figure 4(c) is the result of the query \blue sky and
green grassland" speci�ed with a color layout grid with the top cells blue, the bottom cells
green and a medium edge density.
Figure 6: Selected frames of a video clip.
24
5.2 Search by illumination invariance
The experimental results for Search by Illumination Invariance are very promising. Figure
5 provides a comparison between the ordinary Search by Color Histogram and our Search
by Illumination Invariance. The image sample selected for both searches is the �rst T-shirt
image which is taken under a dim bluish light. The entire database is searched and the
�rst 15 matches (sometimes mismatches) are shown in descending order of their matching
scores. As expected, the by-color-histogram method (Figure 5(a)) is only capable of turning
out many dark images, of which the third image happens to be a correct match (the same
T-shirt being folded slightly di�erently and rotated). However, its matching score ranks
behind a book. The result of by-illumination-invariance shown in Figure 5(b) is far better.
All three occurrences of the sample T-shirt, the third one under a redish light, are found.
Notably, it also �nds many T-shirts under various illuminations. Since the sample T-shirt
has basically two colors (dark stripes on white cloth), the matches are mostly correct in
terms of their chromaticities, albeit unexpected.
Figure 6 depicts some selected frames from a clip of `gold�sh' scene in a 3-minute video
that contains 22 cuts/clips. Because the camera was chasing the �sh, the re ectance changes
signi�cantly. By selecting the threshold very carefully, the color histogram method still
missed one cut and mistakenly added three more cuts (one of them at the third frame in the
gold�sh clip shown). As shown in [18] the color histogram is simply not able to satisfy both
the precision and recall in video segmentation. Our illumination invariant method, however,
detects all cuts correctly using a �xed threshold which works for other test videos as well.
5.3 Search by object model
5.3.1 Locale construction
The Locale construction algorithm is implemented in the C-BIRD system. Its threshold
parameters are chosen to be optimized for the average object size, although they also work
well for objects up to 5 times the magnitude scale. The execution speed of the method is
fairly fast (less than a second for each 640 � 480 image). In all images tested, most of the
Locales correctly enveloped features, and separated similar features of di�erent objects from
each other or background noise. We present here the results from each step in the Locale
construction method as applied to a sample image.
25
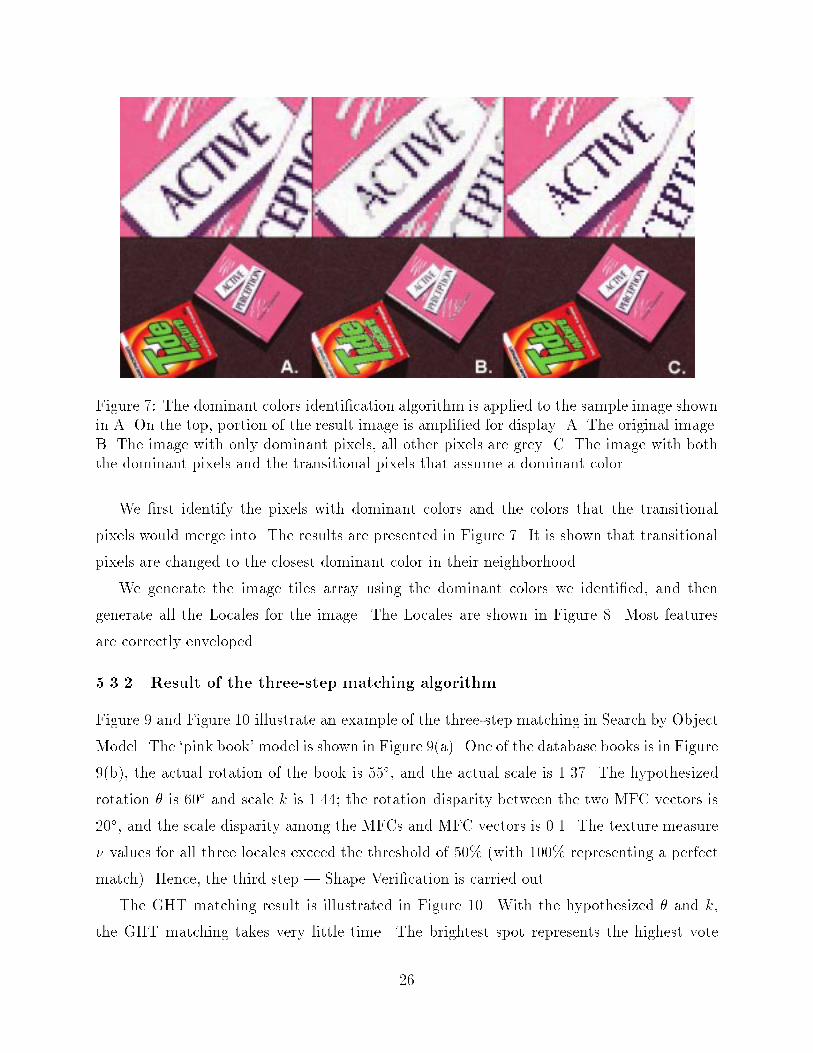
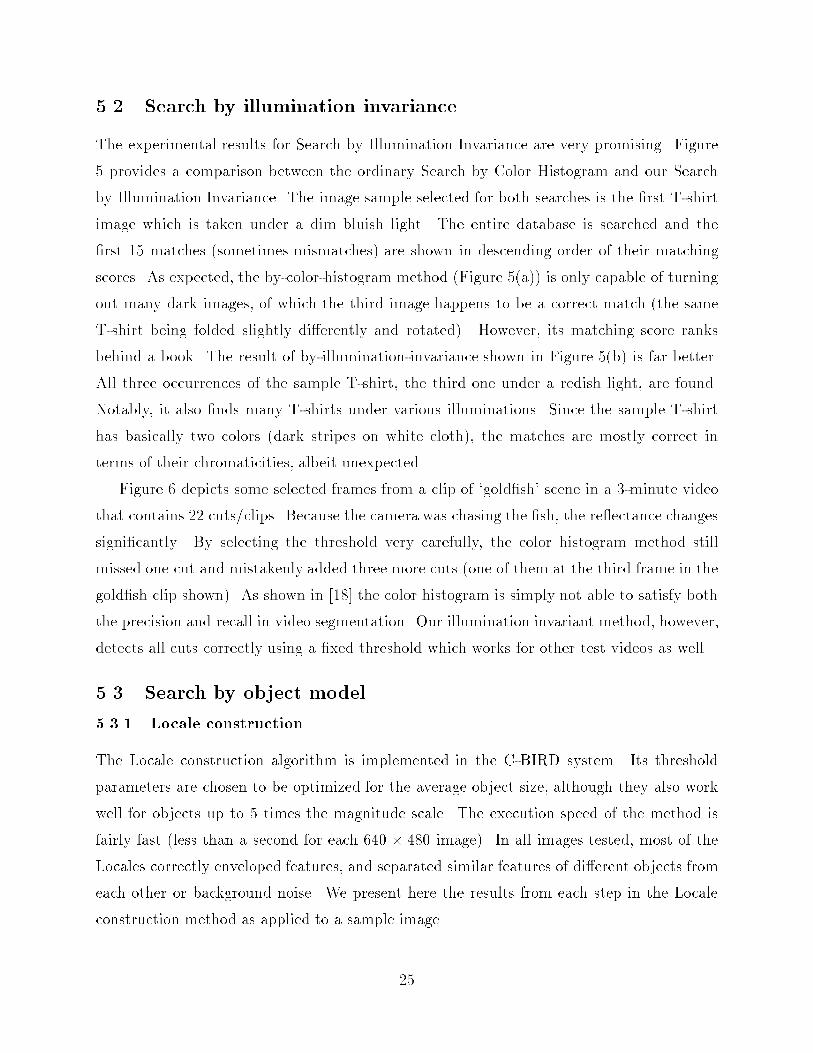
Figure 7: The dominant colors identi�cation algorithm is applied to the sample image shownin A. On the top, portion of the result image is ampli�ed for display. A. The original image.B. The image with only dominant pixels, all other pixels are grey. C. The image with boththe dominant pixels and the transitional pixels that assume a dominant color.
We �rst identify the pixels with dominant colors and the colors that the transitional
pixels would merge into. The results are presented in Figure 7. It is shown that transitional
pixels are changed to the closest dominant color in their neighborhood.
We generate the image tiles array using the dominant colors we identi�ed, and then
generate all the Locales for the image. The Locales are shown in Figure 8. Most features
are correctly enveloped.
5.3.2 Result of the three-step matching algorithm
Figure 9 and Figure 10 illustrate an example of the three-step matching in Search by Object
Model. The `pink book' model is shown in Figure 9(a). One of the database books is in Figure
9(b), the actual rotation of the book is 55�, and the actual scale is 1.37. The hypothesized
rotation �� is 60� and scale �k is 1.44; the rotation disparity between the two MFC vectors is
20�, and the scale disparity among the MFCs and MFC vectors is 0.1. The texture measure
� values for all three locales exceed the threshold of 50% (with 100% representing a perfect
match). Hence, the third step | Shape Veri�cation is carried out.
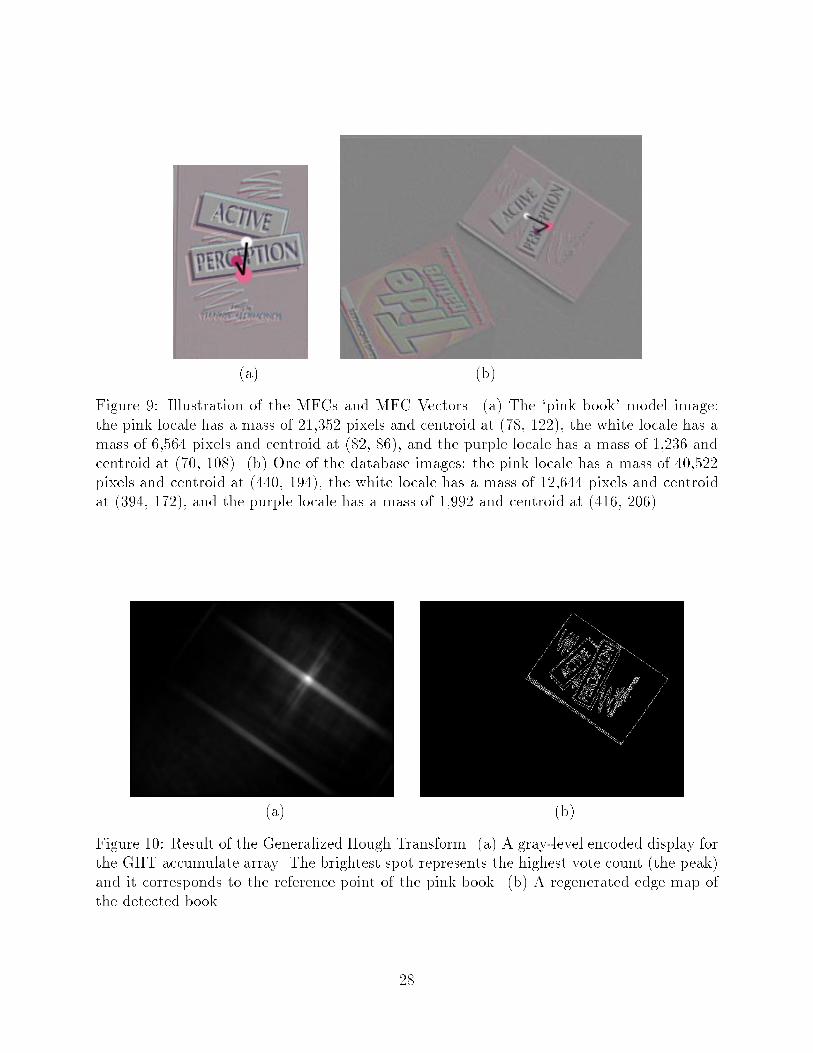
The GHT matching result is illustrated in Figure 10. With the hypothesized �� and �k,
the GHT matching takes very little time. The brightest spot represents the highest vote
26
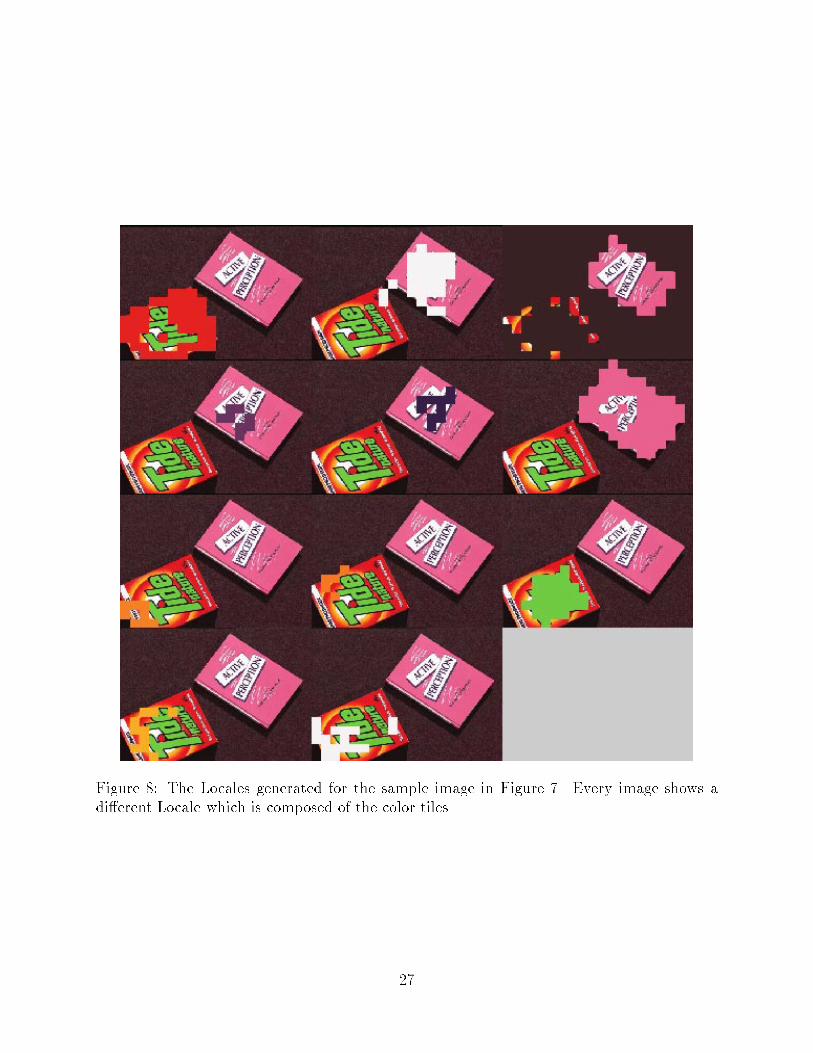
Figure 8: The Locales generated for the sample image in Figure 7. Every image shows adi�erent Locale which is composed of the color tiles.
27
(a) (b)
Figure 9: Illustration of the MFCs and MFC Vectors. (a) The `pink book' model image:the pink locale has a mass of 21,352 pixels and centroid at (78, 122), the white locale has amass of 6,564 pixels and centroid at (82, 86), and the purple locale has a mass of 1,236 andcentroid at (70, 108). (b) One of the database images: the pink locale has a mass of 40,522pixels and centroid at (440, 194), the white locale has a mass of 12,644 pixels and centroidat (394, 172), and the purple locale has a mass of 1,992 and centroid at (416, 206).
(a) (b)
Figure 10: Result of the Generalized Hough Transform. (a) A gray-level encoded display forthe GHT accumulate array. The brightest spot represents the highest vote count (the peak)and it corresponds to the reference point of the pink book. (b) A regenerated edge map ofthe detected book.
28
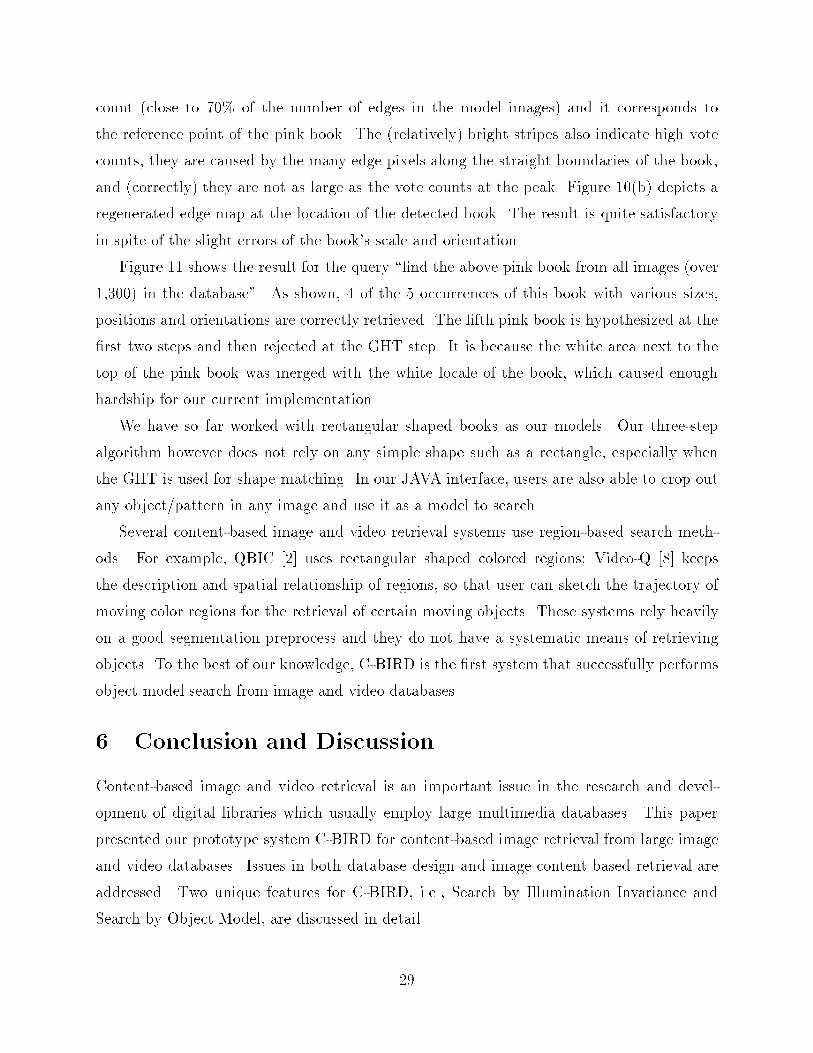
count (close to 70% of the number of edges in the model images) and it corresponds to
the reference point of the pink book. The (relatively) bright stripes also indicate high vote
counts, they are caused by the many edge pixels along the straight boundaries of the book,
and (correctly) they are not as large as the vote counts at the peak. Figure 10(b) depicts a
regenerated edge map at the location of the detected book. The result is quite satisfactory
in spite of the slight errors of the book's scale and orientation.
Figure 11 shows the result for the query \�nd the above pink book from all images (over
1,300) in the database". As shown, 4 of the 5 occurrences of this book with various sizes,
positions and orientations are correctly retrieved. The �fth pink book is hypothesized at the
�rst two steps and then rejected at the GHT step. It is because the white area next to the
top of the pink book was merged with the white locale of the book, which caused enough
hardship for our current implementation.
We have so far worked with rectangular shaped books as our models. Our three-step
algorithm however does not rely on any simple shape such as a rectangle, especially when
the GHT is used for shape matching. In our JAVA interface, users are also able to crop out
any object/pattern in any image and use it as a model to search.
Several content-based image and video retrieval systems use region-based search meth-
ods. For example, QBIC [2] uses rectangular shaped colored regions; Video-Q [8] keeps
the description and spatial relationship of regions, so that user can sketch the trajectory of
moving color regions for the retrieval of certain moving objects. These systems rely heavily
on a good segmentation preprocess and they do not have a systematic means of retrieving
objects. To the best of our knowledge, C-BIRD is the �rst system that successfully performs
object model search from image and video databases.
6 Conclusion and Discussion
Content-based image and video retrieval is an important issue in the research and devel-
opment of digital libraries which usually employ large multimedia databases. This paper
presented our prototype system C-BIRD for content-based image retrieval from large image
and video databases. Issues in both database design and image content based retrieval are
addressed. Two unique features for C-BIRD, i.e., Search by Illumination Invariance and
Search by Object Model, are discussed in detail.
29
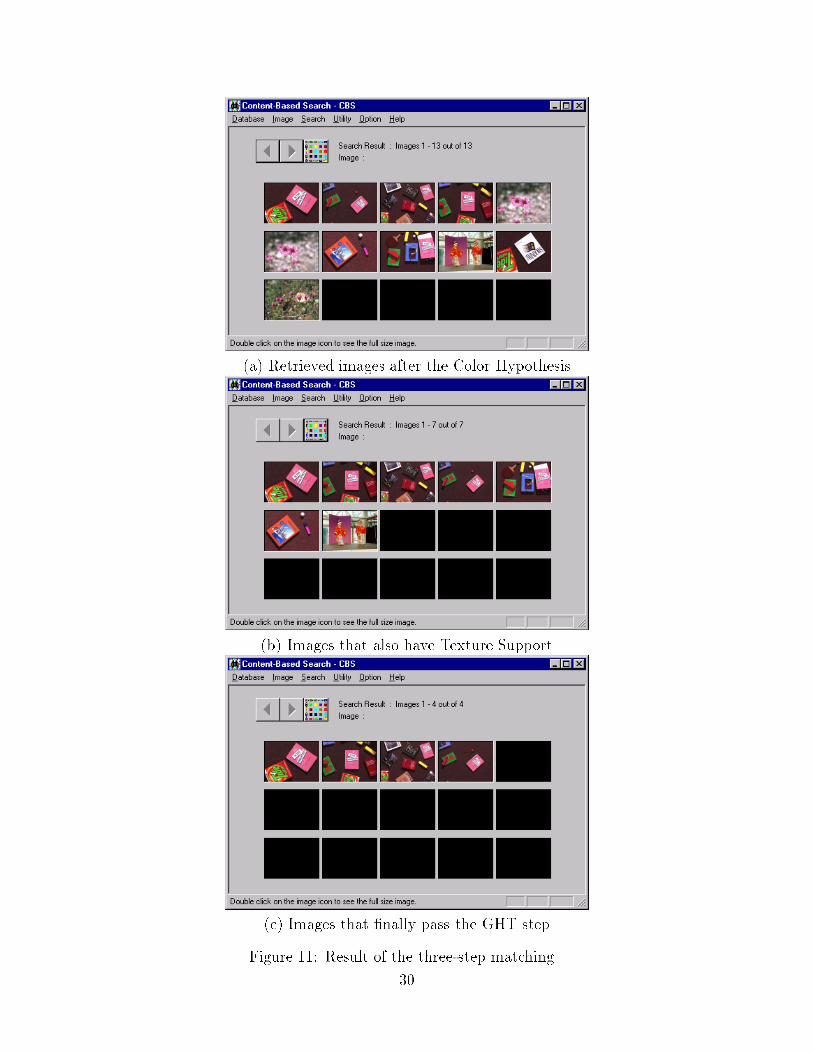
(a) Retrieved images after the Color Hypothesis
(b) Images that also have Texture Support
(c) Images that �nally pass the GHT step
Figure 11: Result of the three-step matching.
30
First, the simple idea of normalizing color images separately in each band is adopted
as a reasonable approach to color constancy preprocessing in the context of indexing in
image and video databases. We transform to a 2D representation by using histograms of
chromaticity. Viewing these 2D feature space histograms as images, we apply a wavelet{
based image reduction transformation for low{pass �ltering, followed by DCT and truncation.
The resulting indexing scheme uses only 36 integers as feature vectors to index into the
image database and hence is very e�cient. Experiments show good results because of the
illuminant-invariance.
Second, feature localization and a three-step matching algorithm are presented to support
Search by Object Model. Unlike most existing systems which use only features (color, tex-
ture, sketch, etc.) to retrieve similar images, the modeling and matching methods described
are capable of retrieving a range of di�erent sizes, 2-D rotations, and multiple occurrences
of speci�ed objects in the images. It is shown that instead of image segmentation, feature
localization should be used as a preprocessing step before matching.
We are currently expanding our database to include more images and videos, especially
to automate the Web crawling process. The precision and recall of the C-BIRD system
from our current database are satisfactory. A more comprehensive analysis on them will
be undertaken with the expanded database. At present, only models of 2D objects are
supported. Further study on 3D modeling and matching will be a major challenge as it has
been for the last few decades to the computer vision research community.
Acknowledgments: This work was supported in part by the Canadian National Sci-
ence and Engineering Research Council under the grant OGP-36727, and the grant for
Telelearning Research Project in the Canadian Network of Centres of Excellence.
References
[1] A. Pentland, R.W. Picard, and S. Sclaro�. Photobook: Tools for content-based manipulation
of image databases. In SPIE Storage and Retrieval for Image and Video Databases II, volume
2, 185, pages 34{47, San Jose, CA, 1994.
[2] M. Flickner, H. Sawhney, W. Niblack, and et al. Query by image and video content: The
QBIC system. IEEE Computer, pages 23{32, September 1 1995.
[3] H.J. Zhang, et al. Automatic parsing and indexing of new video. Multimedia Systems, 2(6):256{
266, 1995.
31
[4] J.R. Bach, C. Fuller, A. Gupta, and et al. The Virage image search engine: An open framework
for image management. In SPIE Storage and Retrieval for Image and Video Databases IV,
February 1996.
[5] C. Frankel, M. J. Swain, and V. Athitsos. Webseer: An image search engine for the world wide
web. Technical Report 96-14, University of Chicago, Computer Science Department, August
1996.
[6] P. Aigrain, H. Zhang, and D. Petkovic. Content-based representation and retrieval of vi-
sual media: A state-of-the-art review. Int. J. Multimedia Tools and Applications, 3:179{202,
November 1996.
[7] J.R. Smith and S.F. Chang. Visually searching the web for content. IEEE Multimedia, 4(3):12{
20, 1997.
[8] S.F. Chang, et al. VideoQ: an automated content based video search system using visual cues.
In Proc. ACM Multimedia 97, pages 313{324, 1997.
[9] S. Mukherjea, K. Hirata, and Y. Hara. Toward a multimedia world wideweb information
retrieval engine. In Sixth Int. Worl-Wide Web Conf., Santa Clara, CA, 1997.
[10] E. Selberg and O. Etzioni. Multi-service search and comparison using the metacrawler. In 4th
International World Wide Web Conference, 1996.
[11] G. Furnas, T.K. Landauer, L.M. Gomez, and S. Dumais. The vocabulary problem in human-
system communications. Communications of the ACM, 30:964{971, 1987.
[12] C. Frankel, M. Swain, and V. Athitsos. Webseer: An image search engine for the World Wide
Web. Technical Report TR-96-14, CS Department, Univ. of Chicago, 1996.
[13] K. Hirata, Y. Hara, N. Shibata, and F. Hirabayashi. Media-based navigation for hypermedia
systems. In Proceedings of ACM Hupertext'93 Conf., pages 159{173, Seattle, WA, 1993.
[14] M.J. Swain and D.H. Ballard. Color indexing. Int. J. Computer Vision, 7(1):11{32, 1991.
[15] B.V. Funt and G.D. Finlayson. Color constant color indexing. IEEE Trans. Patt. Anal. and
Mach. Intell., 17:522{529, 1995.
[16] M.S. Drew, J. Wei, and Z.N. Li. Illumination{invariant color object recognition via compressed
chromaticity histograms of color{channel{normalized images. In Proc. Int. Conf. on Computer
Vision (ICCV '98), pages 533{540, 1998.
[17] A.M. Tekalp. Digital video processing. Prentice Hall PTR, 1995.
[18] J. Wei, M.S. Drew, and Z.N. Li. Illumination invariant video segmentation by hierarchical ro-
bust thresholding. In Proc. IS&T/SPIE Symp. on Electronic Imaging '98, Storage & Retrieval
for Image and Video Databases VI, SPIE Vol. 3312, pages 188{201, 1998.
[19] R.L. Gregory. The Intelligent Eye. Weidenfeld & Nicholson, 1970.
[20] D. Marr. Vision. W. H. Freeman, 1982.
32
[21] R. Chellappa and A. Rosenfeld. Computer vision: attitude, barriers, counseling. In Proc.
Vision Interface '92, pages 1{7, 1992.
[22] W.Y. Ma and B.S. Manjunath. Edge ow: a framework of boundary detection and image
segmentation. In Proc. IEEE Conf. on Computer Vision and Pattern Recognition, pages 744{
749, 1997.
[23] G. Wyszecki and W.S. Stiles. Color Science: Concepts and Methods, Quantitative Data and
Formulas, 2nd ed. Wiley, New York, 1982.
[24] M. Antonini, et al. Image coding using wavelet transform. IEEE Trans. on Image Processing,
1(2):205{221, 1992.
[25] D.H. Ballard and C.M. Brown. Computer Vision. Prentice Hall, 1982.
[26] T.H. Hong and A. Rosenfeld. Compact region extraction using weighted pixel linking in a
pyramid. IEEE Trans. on Pattern Analysis and Machine Intelligence, PAMI-6(2):222{229,
1984.
[27] Z.N. Li and B. Yan. Recognition kernel for content-based search. In Proc. IEEE Conf. on
Systems, Man, and Cybernetics, pages 472{477, 1996.
[28] H. Tamura, S. Mori, and T. Yamawaki. Texture features corresponding to visual perception.
IEEE Trans. on Systems, Man, and Cybernetics, 8(6):460{473, 1978.
[29] A.R. Rao and G.L. Lohse. Towards a texture naming system: identifying relevant dimensions
of texture. In Proc. IEEE Conf. on Visualization, pages 220{227, San Jose, 1993.
[30] F. Liu and R.W. Picard. Periodicity, directionality, and randomness: Wold features for image
modeling and retrieval. IEEE Trans. on Pattern Analysis and Machine Intelligence, 18(7):722{
733, 1996.
[31] D. Ballard. Generalizing the Hough transform to detect arbitrary shapes. Pattern Recognition,
13(2):111{122, 1981.
[32] J. Ostermann, E.S. Jang, J. Shin, and T. Chen. Coding of arbitrarily shaped video objects in
MPEG-4. In Proc. Int. Conf. on Image Processing (ICIP '97), pages 496{499, 1997.
[33] Z.N. Li, B.G. Yao, and F. Tong. Linear generalized Hough transform and its parallelization.
Image and Vision Computing, 11(1):11{24, 1993.
[34] P. Gvozdjak and Z.N. Li. From nomad to explorer: Active object recognition on mobile robots.
Pattern Recognition, 31(6):773{790, 1998.
[35] N. Hirzalla and A. Karmouch. Detecting cuts by understanding camera operations for video
indexing. Journal of Visual Languages and Computing, 6:385{404, 1995.
[36] O. R. Za��ane, A. Fall, S. Rochefort, V. Dahl, and P. Tarau. On-line resource discovery using
natural language. In Proceedings, RIAO'97, Montreal, Canada, June 1997.
[37] O. R. Za��ane, J. Han, Z-N. Li, J. Hou, and G. Liu. Mining multimedia data. In CASCON'98:
Meeting of Minds, Toronto, Canada, November 1998. submitted for review.
33