Embed Size (px)
Citation preview
This is a n Op e n Acces s doc u m e n t dow nloa d e d fro m ORCA, Ca r diff U nive r si ty 's
ins ti t u tion al r e posi to ry: h t t p s://o rc a.c a r diff.ac.uk/143 8 5 0/
This is t h e a u t ho r’s ve r sion of a wo rk t h a t w as s u b mi t t e d to / a c c e p t e d for
p u blica tion.
Cit a tion for final p u blish e d ve r sion:
M a h er, Kevin, H u a n g, Zeyu a n, So n g, Jianc h e n g, De n g, Xiao ming, Lai, Yukun,
M a, Cuixia, Wang, H ao, Liu, Yong-Jin a n d Wang, H o n g a n 2 0 2 1. E-ffec tive: a
visu al a n alytic sys t e m for explo rin g t h e e m o tion a n d effec tiven e ss of
ins pi r a tion al s p e e c h e s . IEEE Tr a ns a c tions on Visu aliza tion a n d Co m p u t e r
Gr a p hics 1 0.11 0 9/TVCG.202 1.31 1 4 7 8 9 file
P u blish e r s p a g e: h t t p://dx.doi.or g/10.11 0 9/TVCG.202 1.31 1 4 7 8 9
< h t t p://dx.doi.o rg/10.11 0 9/TVCG.202 1.31 1 4 7 8 9 >
Ple a s e no t e:
Ch a n g e s m a d e a s a r e s ul t of p u blishing p roc e s s e s s uc h a s copy-e di ting,
for m a t ting a n d p a g e n u m b e r s m ay no t b e r eflec t e d in t his ve r sion. For t h e
d efini tive ve r sion of t his p u blica tion, ple a s e r ef e r to t h e p u blish e d sou rc e. You
a r e a dvise d to cons ul t t h e p u blish e r’s ve r sion if you wish to ci t e t his p a p er.
This ve r sion is b ein g m a d e av ailable in a cco r d a n c e wit h p u blish e r policie s.
S e e
h t t p://o rc a .cf.ac.uk/policies.h t ml for u s a g e policies. Copyrigh t a n d m o r al r i gh t s
for p u blica tions m a d e available in ORCA a r e r e t ain e d by t h e copyrig h t
hold e r s .
E-ffective: A Visual Analytic System for Exploring the Emotion and
Effectiveness of Inspirational Speeches
Kevin Maher, Zeyuan Huang, Jiancheng Song, Xiaoming Deng, Member, IEEE, Yu-Kun Lai, Member, IEEE,
Cuixia Ma, Hao Wang, Yong-Jin Liu, Senior Member, IEEE, Hongan Wang, Member, IEEE
Abstract—What makes speeches effective has long been a subject for debate, and until today there is broad controversy among publicspeaking experts about what factors make a speech effective as well as the roles of these factors in speeches. Moreover, there is alack of quantitative analysis methods to help understand effective speaking strategies. In this paper, we propose E-ffective, a visualanalytic system allowing speaking experts and novices to analyze both the role of speech factors and their contribution in effectivespeeches. From interviews with domain experts and investigating existing literature, we identified important factors to consider ininspirational speeches. We obtained the generated factors from multi-modal data that were then related to effectiveness data. Oursystem supports rapid understanding of critical factors in inspirational speeches, including the influence of emotions by means ofnovel visualization methods and interaction. Two novel visualizations include E-spiral (that shows the emotional shifts in speeches in avisually compact way) and E-script (that connects speech content with key speech delivery information). In our evaluation we studiedthe influence of our system on experts’ domain knowledge about speech factors. We further studied the usability of the system byspeaking novices and experts on assisting analysis of inspirational speech effectiveness.
Index Terms—Affective visualization, multimodal analysis, speech effectiveness
1 INTRODUCTION
Effectiveness in speeches has long been a controversial subject. Aristo-tle began his work Rhetoric by criticizing contemporary experts in thefield “the framers of the current treatises on rhetoric have constructedbut a small portion of that art” [1]. While Aristotle focused on per-suasive speaking, the effectiveness of other kinds of public speakingremains to be understood on a large scale. Today organizations andpublic speaking experts train and coach people to improve their publicspeaking ability in various contexts. However, many principles of pub-lic speaking are yet to be agreed upon, even in specific contexts suchas speech contests. In certain contexts, a clear metric of success canbe given, and with automated annotation of speech factors, in theory asystem could allow users to systematically understand the influence ofmany factors on the effectiveness of speeches at a large scale.
Currently, while there is support from academic literature that dif-ferent speaking strategies have important impacts in a variety of fields,there is controversy among public speaking experts about the signif-icance and role of different strategies. Recently published works inanalytical systems have focused on describing speaking strategies ofhigh level speeches. However, there is a lack of analytical systems thatsupport evaluation of the effectiveness of speaking strategies. Addition-ally, existing works cannot determine what strategies are effective andwhat are not, since they lack a clear metric of effectiveness.
We propose E-ffective, a visual analytic system for speech expertsand novices to evaluate the effectiveness of speaking strategies. Our
• K. Maher is with Institute of Software, Chinese Academy of Sciences and
Tsinghua University. E-mail: [email protected].
• Z.Y. Huang, J.C. Song, X.M. Deng, C.X. Ma, and H.A. Wang are with State
Key Laboratory of Computer Science and Beijing Key Lab of
Human-Computer Interaction, Institute of Software, Chinese Academy of
Sciences and University of Chinese Academy of Sciences. E-mail:
{zeyuan2020, jiancheng2019, xiaoming, cuixia, hongan}@iscas.ac.cn.
• Y.-K. Lai is with Cardiff University. E-mail: [email protected].
• H. Wang is with Alibaba Group. E-mail: [email protected].
• Y.-J. Liu is with Tsinghua University. E-mail: [email protected].
• K. Maher and Z.Y. Huang contribute equally to this work. C.X. Ma, H.
Wang, Y.-J. Liu are corresponding authors.
Manuscript received xx xxx. 201x; accepted xx xxx. 201x. Date of Publication
xx xxx. 201x; date of current version xx xxx. 201x. For information on
obtaining reprints of this article, please send e-mail to: [email protected].
Digital Object Identifier: xx.xxxx/TVCG.201x.xxxxxxx
system supports analysis of speech factors that takes into account therelative success of speeches. The system was designed to provideintuitive and understandable visualizations for speaking experts andnovices to understand factors in an inspirational speech contest. Inour work we seek to investigate speech effectiveness in a user centeredapproach. The contributions of E-ffective include:
• A visual analysis system supporting analysis of speech effec-tiveness. The system allows public speaking experts and novicesto explore speech effectiveness in a systematic way that fits withmainstream theory on public speaking. The system was designedto support understanding given moderate visualization literacy ofspeaking experts and novices. Verification of the understandingof effective speaking patterns as well as the utility of our systemwas tested in user trials.
• Novel techniques of expressive visualization. New visualiza-tion methods were developed to assist users to further understandcritical factor data. These include a spiral-like graph for indicat-ing emotional fluctuations, as well as a method for displaying keyinformation in speech texts.
• Analytical insights based on an inspirational speech dataset.We utilize algorithms and visualization methods to identify whatfactors are indicative of effectiveness. From the evaluation, wereveal the ability of the system to assist users to examine theirexisting hypothesis about speech factors as well as to generatenew hypothesis based on large scale data.
2 RELATED WORK
2.1 Effectiveness of Speeches
There is disagreement from public speaking experts and academicsabout what techniques and theories support effective speeches. Inthe 20th century various scholars sought to better understand effectivecommunication combining manual annotation of speech metrics andquantitative analysis [3,13,20]. Speech effectiveness has been measuredin a number of ways that include recall-comprehension, attitude change,and the perceived credibility of the speaker [11].
Many of the public speaking principles in common use today origi-nated from these studies, even if they are misapplied. Possibly the mostfamous statistic related to communication is Mehrabian’s research [19]that states “7% of communication comes from spoken word, 38%
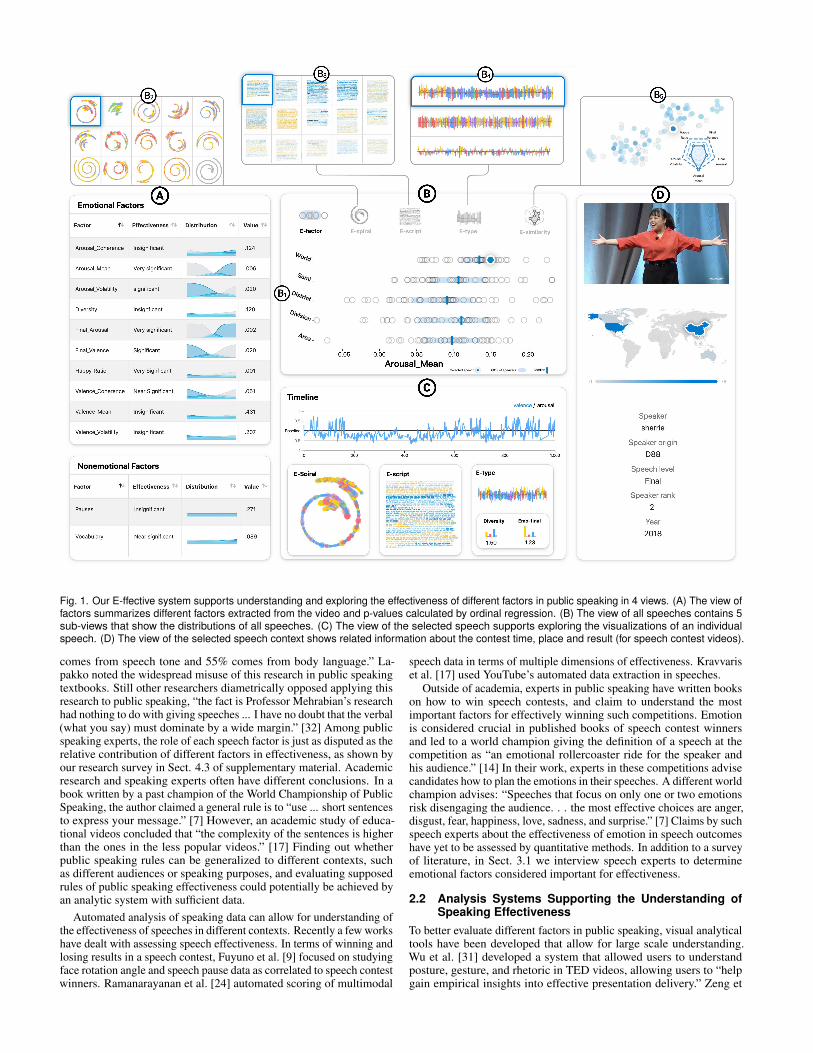
Fig. 1. Our E-ffective system supports understanding and exploring the effectiveness of different factors in public speaking in 4 views. (A) The view offactors summarizes different factors extracted from the video and p-values calculated by ordinal regression. (B) The view of all speeches contains 5sub-views that show the distributions of all speeches. (C) The view of the selected speech supports exploring the visualizations of an individualspeech. (D) The view of the selected speech context shows related information about the contest time, place and result (for speech contest videos).
comes from speech tone and 55% comes from body language.” La-pakko noted the widespread misuse of this research in public speakingtextbooks. Still other researchers diametrically opposed applying thisresearch to public speaking, “the fact is Professor Mehrabian’s researchhad nothing to do with giving speeches ... I have no doubt that the verbal(what you say) must dominate by a wide margin.” [32] Among publicspeaking experts, the role of each speech factor is just as disputed as therelative contribution of different factors in effectiveness, as shown byour research survey in Sect. 4.3 of supplementary material. Academicresearch and speaking experts often have different conclusions. In abook written by a past champion of the World Championship of PublicSpeaking, the author claimed a general rule is to “use ... short sentencesto express your message.” [7] However, an academic study of educa-tional videos concluded that “the complexity of the sentences is higherthan the ones in the less popular videos.” [17] Finding out whetherpublic speaking rules can be generalized to different contexts, suchas different audiences or speaking purposes, and evaluating supposedrules of public speaking effectiveness could potentially be achieved byan analytic system with sufficient data.
Automated analysis of speaking data can allow for understanding ofthe effectiveness of speeches in different contexts. Recently a few workshave dealt with assessing speech effectiveness. In terms of winning andlosing results in a speech contest, Fuyuno et al. [9] focused on studyingface rotation angle and speech pause data as correlated to speech contestwinners. Ramanarayanan et al. [24] automated scoring of multimodal
speech data in terms of multiple dimensions of effectiveness. Kravvariset al. [17] used YouTube’s automated data extraction in speeches.
Outside of academia, experts in public speaking have written bookson how to win speech contests, and claim to understand the mostimportant factors for effectively winning such competitions. Emotionis considered crucial in published books of speech contest winnersand led to a world champion giving the definition of a speech at thecompetition as “an emotional rollercoaster ride for the speaker andhis audience.” [14] In their work, experts in these competitions advisecandidates how to plan the emotions in their speeches. A different worldchampion advises: “Speeches that focus on only one or two emotionsrisk disengaging the audience. . . the most effective choices are anger,disgust, fear, happiness, love, sadness, and surprise.” [7] Claims by suchspeech experts about the effectiveness of emotion in speech outcomeshave yet to be assessed by quantitative methods. In addition to a surveyof literature, in Sect. 3.1 we interview speech experts to determineemotional factors considered important for effectiveness.
2.2 Analysis Systems Supporting the Understanding ofSpeaking Effectiveness
To better evaluate different factors in public speaking, visual analyticaltools have been developed that allow for large scale understanding.Wu et al. [31] developed a system that allowed users to understandposture, gesture, and rhetoric in TED videos, allowing users to “helpgain empirical insights into effective presentation delivery.” Zeng et
al. [34] developed a system that explores emotional coherence whichhas a case study where experts help teach how to “express emotionsmore effectively.” These systems focus on describing different patternsof emotions in speakers considered to be high level. However there is alack of analytical systems that focus on a clear metric for measuringsuccess, and thus give insight into what differentiates more successfulspeeches. Claims by speech experts outside of academia as well aspredicted patterns made by speech experts in our user survey can beempirically evaluated with our system. In the past, much work was doneby small scale manual annotation to understand speech effectivenessdata. Our system extends insights from large scale analysis to publicspeaking novices and experts.
2.3 Emotion Visualization
Visual analysis has been shown to provide valuable insights into emo-tional speech data. Recently several works have created novel visualanalysis techniques aiming for presenting emotional data that providemeaningful insights. New visual forms were developed to show chang-ing group emotion [33] and emotional coherence [34] in an intuitiveway.
As we will later show, emotional data is critical to the effectivenessin the speeches we study. We created visualizations to express severalcritical metrics in a way designed to be intuitively understandable to anon-expert audience.
3 DOMAIN-CENTERED DESIGN
We adopted a domain-centered design procedure to investigate thecomprehension of effective strategies in the domain of public speaking.In this section, we first introduce how we conducted interviews amongpublic speaking experts. Next, we summarize their opinions into overallgoals, and the design tasks of the system.
3.1 In-Depth Interviews
We conducted initial in-depth interviews with public speaking expertsin order to analyze what factors they thought were critical to speecheffectiveness, as well as to establish design requirements for an interfacethat supports their comprehension. We focused our studies on the WorldChampionship of Public Speaking, which in some years has claimed tobe the world’s most popular speech contest.
The seven experts we interviewed were all professional public speak-ing trainers that deliver courses for preparing for speech contests. Sixof the seven had participated multiple times in the World Championshipof Public Speaking. The interview was semi-structured, with all par-ticipants asked to list possible critical factors to study. They were alsoprompted with factors surveyed from literature, to obtain their opinionon the importance and role of the factors on contest effectiveness. Con-sistent with literature, all experts thought that the emotion of speakerswould have important impact on the outcome of the contest. Amongthe factors they listed, there are factors that we did not include in ourresearch that are likely to have influence on speech effectiveness, suchas gestures and voice pitch. However, in this contest, emotion is viewedas critical, with entire books about how to plan one’s emotion [14]. Wesaw that addressing the lack of quantitative methods to evaluate suchemotion as a contribution to domain knowledge.
The emotional factors are listed in Table 1. The modality of eachfactor is indicated by V (voice), F (facial), or T (text). Some of thefactors to be studied were determined by a survey of literature. Ourlater pre-survey in Sect. 7.4 confirmed that experts view these factorsas significant in speakers in the competition.
We also established non-emotional factors that would be criticalto assess speech effectiveness. For example, in the interviews, un-prompted, three experts suggested that cross-cultural influences wouldbe important for the outcome of the contest, and that the effect ofculture on factors in the contest would be prominent. In Table 1, twoadditional non-emotional factors for comparison, namely pauses andvocabulary, were included that were estimated by the experts to havesignificant impact on effectiveness.
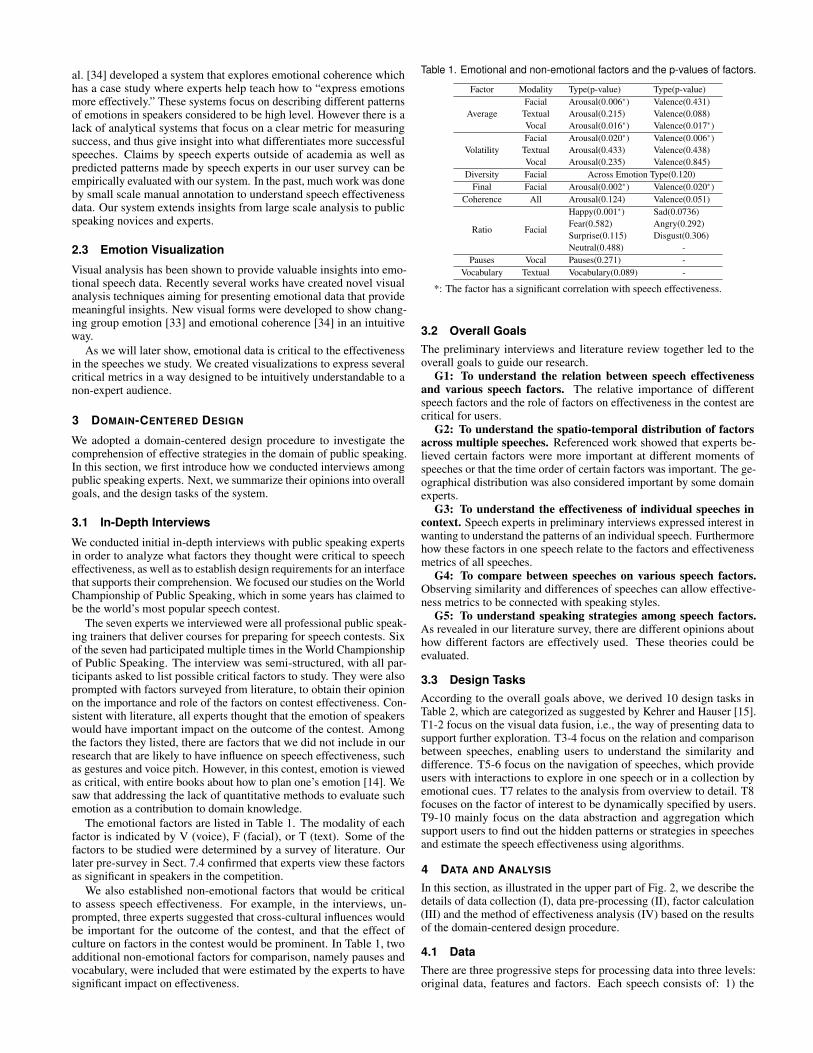
Table 1. Emotional and non-emotional factors and the p-values of factors.
Factor Modality Type(p-value) Type(p-value)
Average
Facial Arousal(0.006∗) Valence(0.431)
Textual Arousal(0.215) Valence(0.088)
Vocal Arousal(0.016∗) Valence(0.017∗)
Volatility
Facial Arousal(0.020∗) Valence(0.006∗)
Textual Arousal(0.433) Valence(0.438)
Vocal Arousal(0.235) Valence(0.845)
Diversity Facial Across Emotion Type(0.120)
Final Facial Arousal(0.002∗) Valence(0.020∗)
Coherence All Arousal(0.124) Valence(0.051)
Ratio Facial
Happy(0.001∗) Sad(0.0736)
Fear(0.582) Angry(0.292)
Surprise(0.115) Disgust(0.306)
Neutral(0.488) -
Pauses Vocal Pauses(0.271) -
Vocabulary Textual Vocabulary(0.089) -
*: The factor has a significant correlation with speech effectiveness.
3.2 Overall Goals
The preliminary interviews and literature review together led to theoverall goals to guide our research.
G1: To understand the relation between speech effectivenessand various speech factors. The relative importance of differentspeech factors and the role of factors on effectiveness in the contest arecritical for users.
G2: To understand the spatio-temporal distribution of factorsacross multiple speeches. Referenced work showed that experts be-lieved certain factors were more important at different moments ofspeeches or that the time order of certain factors was important. The ge-ographical distribution was also considered important by some domainexperts.
G3: To understand the effectiveness of individual speeches incontext. Speech experts in preliminary interviews expressed interest inwanting to understand the patterns of an individual speech. Furthermorehow these factors in one speech relate to the factors and effectivenessmetrics of all speeches.
G4: To compare between speeches on various speech factors.Observing similarity and differences of speeches can allow effective-ness metrics to be connected with speaking styles.
G5: To understand speaking strategies among speech factors.As revealed in our literature survey, there are different opinions abouthow different factors are effectively used. These theories could beevaluated.
3.3 Design Tasks
According to the overall goals above, we derived 10 design tasks inTable 2, which are categorized as suggested by Kehrer and Hauser [15].T1-2 focus on the visual data fusion, i.e., the way of presenting data tosupport further exploration. T3-4 focus on the relation and comparisonbetween speeches, enabling users to understand the similarity anddifference. T5-6 focus on the navigation of speeches, which provideusers with interactions to explore in one speech or in a collection byemotional cues. T7 relates to the analysis from overview to detail. T8focuses on the factor of interest to be dynamically specified by users.T9-10 mainly focus on the data abstraction and aggregation whichsupport users to find out the hidden patterns or strategies in speechesand estimate the speech effectiveness using algorithms.
4 DATA AND ANALYSIS
In this section, as illustrated in the upper part of Fig. 2, we describe thedetails of data collection (I), data pre-processing (II), factor calculation(III) and the method of effectiveness analysis (IV) based on the resultsof the domain-centered design procedure.
4.1 Data
There are three progressive steps for processing data into three levels:original data, features and factors. Each speech consists of: 1) the
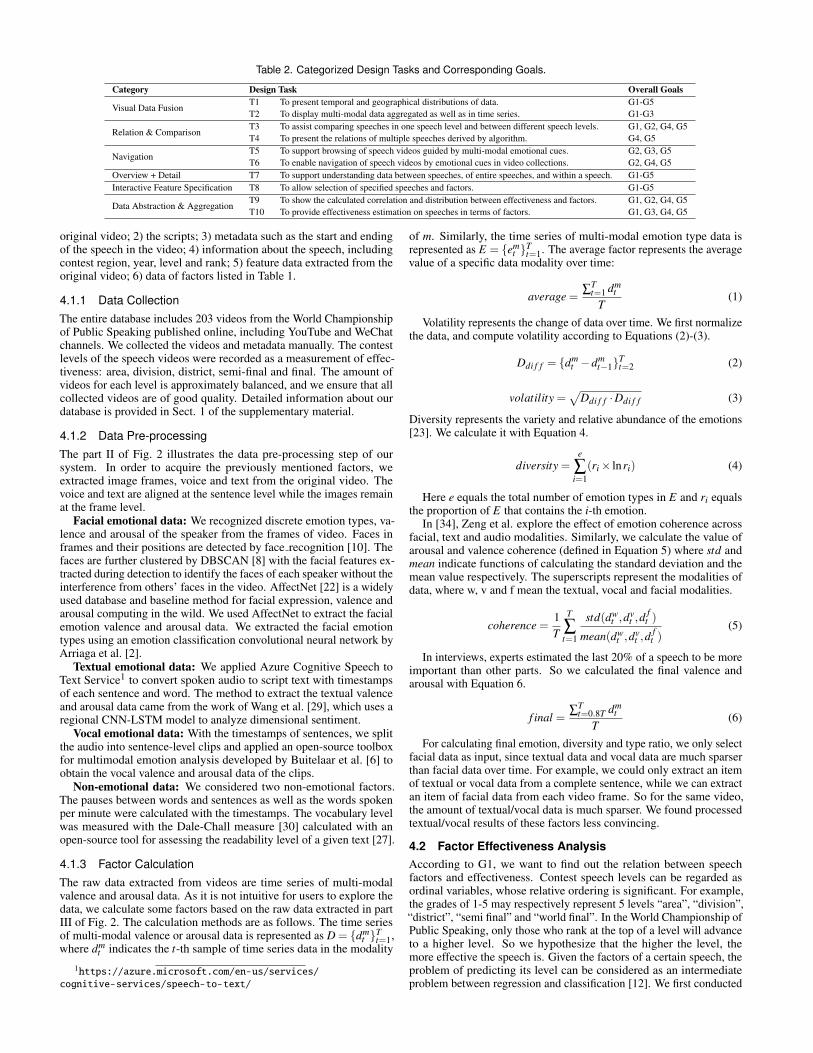
Table 2. Categorized Design Tasks and Corresponding Goals.
Category Design Task Overall Goals
Visual Data FusionT1 To present temporal and geographical distributions of data. G1-G5
T2 To display multi-modal data aggregated as well as in time series. G1-G3
Relation & ComparisonT3 To assist comparing speeches in one speech level and between different speech levels. G1, G2, G4, G5
T4 To present the relations of multiple speeches derived by algorithm. G4, G5
NavigationT5 To support browsing of speech videos guided by multi-modal emotional cues. G2, G3, G5
T6 To enable navigation of speech videos by emotional cues in video collections. G2, G4, G5
Overview + Detail T7 To support understanding data between speeches, of entire speeches, and within a speech. G1-G5
Interactive Feature Specification T8 To allow selection of specified speeches and factors. G1-G5
Data Abstraction & AggregationT9 To show the calculated correlation and distribution between effectiveness and factors. G1, G2, G4, G5
T10 To provide effectiveness estimation on speeches in terms of factors. G1, G3, G4, G5
original video; 2) the scripts; 3) metadata such as the start and endingof the speech in the video; 4) information about the speech, includingcontest region, year, level and rank; 5) feature data extracted from theoriginal video; 6) data of factors listed in Table 1.
4.1.1 Data Collection
The entire database includes 203 videos from the World Championshipof Public Speaking published online, including YouTube and WeChatchannels. We collected the videos and metadata manually. The contestlevels of the speech videos were recorded as a measurement of effec-tiveness: area, division, district, semi-final and final. The amount ofvideos for each level is approximately balanced, and we ensure that allcollected videos are of good quality. Detailed information about ourdatabase is provided in Sect. 1 of the supplementary material.
4.1.2 Data Pre-processing
The part II of Fig. 2 illustrates the data pre-processing step of oursystem. In order to acquire the previously mentioned factors, weextracted image frames, voice and text from the original video. Thevoice and text are aligned at the sentence level while the images remainat the frame level.
Facial emotional data: We recognized discrete emotion types, va-lence and arousal of the speaker from the frames of video. Faces inframes and their positions are detected by face recognition [10]. Thefaces are further clustered by DBSCAN [8] with the facial features ex-tracted during detection to identify the faces of each speaker without theinterference from others’ faces in the video. AffectNet [22] is a widelyused database and baseline method for facial expression, valence andarousal computing in the wild. We used AffectNet to extract the facialemotion valence and arousal data. We extracted the facial emotiontypes using an emotion classification convolutional neural network byArriaga et al. [2].
Textual emotional data: We applied Azure Cognitive Speech toText Service1 to convert spoken audio to script text with timestampsof each sentence and word. The method to extract the textual valenceand arousal data came from the work of Wang et al. [29], which uses aregional CNN-LSTM model to analyze dimensional sentiment.
Vocal emotional data: With the timestamps of sentences, we splitthe audio into sentence-level clips and applied an open-source toolboxfor multimodal emotion analysis developed by Buitelaar et al. [6] toobtain the vocal valence and arousal data of the clips.
Non-emotional data: We considered two non-emotional factors.The pauses between words and sentences as well as the words spokenper minute were calculated with the timestamps. The vocabulary levelwas measured with the Dale-Chall measure [30] calculated with anopen-source tool for assessing the readability level of a given text [27].
4.1.3 Factor Calculation
The raw data extracted from videos are time series of multi-modalvalence and arousal data. As it is not intuitive for users to explore thedata, we calculate some factors based on the raw data extracted in partIII of Fig. 2. The calculation methods are as follows. The time seriesof multi-modal valence or arousal data is represented as D = {dm
t }Tt=1,
where dmt indicates the t-th sample of time series data in the modality
1https://azure.microsoft.com/en-us/services/
cognitive-services/speech-to-text/
of m. Similarly, the time series of multi-modal emotion type data isrepresented as E = {em
t }Tt=1. The average factor represents the average
value of a specific data modality over time:
average =∑
Tt=1 dm
t
T(1)
Volatility represents the change of data over time. We first normalizethe data, and compute volatility according to Equations (2)-(3).
Ddi f f = {dmt −dm
t−1}Tt=2 (2)
volatility =√
Ddi f f ·Ddi f f (3)
Diversity represents the variety and relative abundance of the emotions[23]. We calculate it with Equation 4.
diversity =e
∑i=1
(ri × lnri) (4)
Here e equals the total number of emotion types in E and ri equalsthe proportion of E that contains the i-th emotion.
In [34], Zeng et al. explore the effect of emotion coherence acrossfacial, text and audio modalities. Similarly, we calculate the value ofarousal and valence coherence (defined in Equation 5) where std andmean indicate functions of calculating the standard deviation and themean value respectively. The superscripts represent the modalities ofdata, where w, v and f mean the textual, vocal and facial modalities.
coherence =1
T
T
∑t=1
std(dwt ,d
vt ,d
ft )
mean(dwt ,d
vt ,d
ft )
(5)
In interviews, experts estimated the last 20% of a speech to be moreimportant than other parts. So we calculated the final valence andarousal with Equation 6.
f inal =∑
Tt=0.8T dm
t
T(6)
For calculating final emotion, diversity and type ratio, we only selectfacial data as input, since textual data and vocal data are much sparserthan facial data over time. For example, we could only extract an itemof textual or vocal data from a complete sentence, while we can extractan item of facial data from each video frame. So for the same video,the amount of textual/vocal data is much sparser. We found processedtextual/vocal results of these factors less convincing.
4.2 Factor Effectiveness Analysis
According to G1, we want to find out the relation between speechfactors and effectiveness. Contest speech levels can be regarded asordinal variables, whose relative ordering is significant. For example,the grades of 1-5 may respectively represent 5 levels “area”, “division”,“district”, “semi final” and “world final”. In the World Championship ofPublic Speaking, only those who rank at the top of a level will advanceto a higher level. So we hypothesize that the higher the level, themore effective the speech is. Given the factors of a certain speech, theproblem of predicting its level can be considered as an intermediateproblem between regression and classification [12]. We first conducted
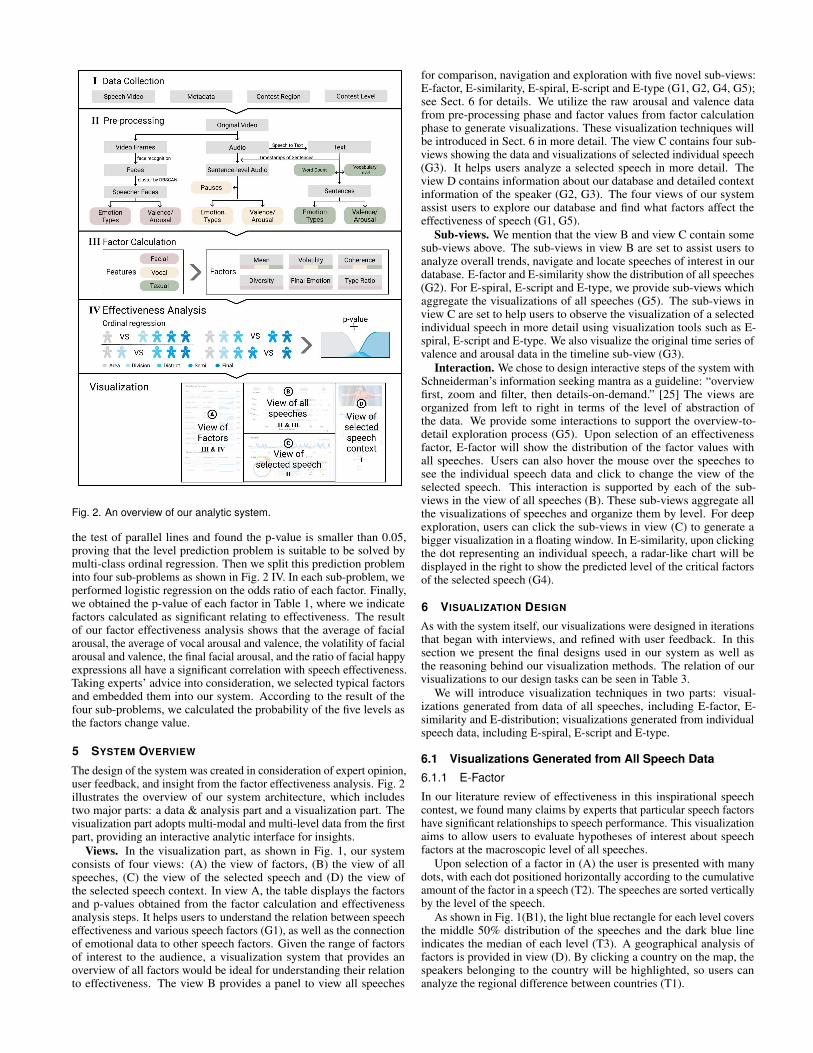
Fig. 2. An overview of our analytic system.
the test of parallel lines and found the p-value is smaller than 0.05,proving that the level prediction problem is suitable to be solved bymulti-class ordinal regression. Then we split this prediction probleminto four sub-problems as shown in Fig. 2 IV. In each sub-problem, weperformed logistic regression on the odds ratio of each factor. Finally,we obtained the p-value of each factor in Table 1, where we indicatefactors calculated as significant relating to effectiveness. The resultof our factor effectiveness analysis shows that the average of facialarousal, the average of vocal arousal and valence, the volatility of facialarousal and valence, the final facial arousal, and the ratio of facial happyexpressions all have a significant correlation with speech effectiveness.Taking experts’ advice into consideration, we selected typical factorsand embedded them into our system. According to the result of thefour sub-problems, we calculated the probability of the five levels asthe factors change value.
5 SYSTEM OVERVIEW
The design of the system was created in consideration of expert opinion,user feedback, and insight from the factor effectiveness analysis. Fig. 2illustrates the overview of our system architecture, which includestwo major parts: a data & analysis part and a visualization part. Thevisualization part adopts multi-modal and multi-level data from the firstpart, providing an interactive analytic interface for insights.
Views. In the visualization part, as shown in Fig. 1, our systemconsists of four views: (A) the view of factors, (B) the view of allspeeches, (C) the view of the selected speech and (D) the view ofthe selected speech context. In view A, the table displays the factorsand p-values obtained from the factor calculation and effectivenessanalysis steps. It helps users to understand the relation between speecheffectiveness and various speech factors (G1), as well as the connectionof emotional data to other speech factors. Given the range of factorsof interest to the audience, a visualization system that provides anoverview of all factors would be ideal for understanding their relationto effectiveness. The view B provides a panel to view all speeches
for comparison, navigation and exploration with five novel sub-views:E-factor, E-similarity, E-spiral, E-script and E-type (G1, G2, G4, G5);see Sect. 6 for details. We utilize the raw arousal and valence datafrom pre-processing phase and factor values from factor calculationphase to generate visualizations. These visualization techniques willbe introduced in Sect. 6 in more detail. The view C contains four sub-views showing the data and visualizations of selected individual speech(G3). It helps users analyze a selected speech in more detail. Theview D contains information about our database and detailed contextinformation of the speaker (G2, G3). The four views of our systemassist users to explore our database and find what factors affect theeffectiveness of speech (G1, G5).
Sub-views. We mention that the view B and view C contain somesub-views above. The sub-views in view B are set to assist users toanalyze overall trends, navigate and locate speeches of interest in ourdatabase. E-factor and E-similarity show the distribution of all speeches(G2). For E-spiral, E-script and E-type, we provide sub-views whichaggregate the visualizations of all speeches (G5). The sub-views inview C are set to help users to observe the visualization of a selectedindividual speech in more detail using visualization tools such as E-spiral, E-script and E-type. We also visualize the original time series ofvalence and arousal data in the timeline sub-view (G3).
Interaction. We chose to design interactive steps of the system withSchneiderman’s information seeking mantra as a guideline: “overviewfirst, zoom and filter, then details-on-demand.” [25] The views areorganized from left to right in terms of the level of abstraction ofthe data. We provide some interactions to support the overview-to-detail exploration process (G5). Upon selection of an effectivenessfactor, E-factor will show the distribution of the factor values withall speeches. Users can also hover the mouse over the speeches tosee the individual speech data and click to change the view of theselected speech. This interaction is supported by each of the sub-views in the view of all speeches (B). These sub-views aggregate allthe visualizations of speeches and organize them by level. For deepexploration, users can click the sub-views in view (C) to generate abigger visualization in a floating window. In E-similarity, upon clickingthe dot representing an individual speech, a radar-like chart will bedisplayed in the right to show the predicted level of the critical factorsof the selected speech (G4).
6 VISUALIZATION DESIGN
As with the system itself, our visualizations were designed in iterationsthat began with interviews, and refined with user feedback. In thissection we present the final designs used in our system as well asthe reasoning behind our visualization methods. The relation of ourvisualizations to our design tasks can be seen in Table 3.
We will introduce visualization techniques in two parts: visual-izations generated from data of all speeches, including E-factor, E-similarity and E-distribution; visualizations generated from individualspeech data, including E-spiral, E-script and E-type.
6.1 Visualizations Generated from All Speech Data
6.1.1 E-Factor
In our literature review of effectiveness in this inspirational speechcontest, we found many claims by experts that particular speech factorshave significant relationships to speech performance. This visualizationaims to allow users to evaluate hypotheses of interest about speechfactors at the macroscopic level of all speeches.
Upon selection of a factor in (A) the user is presented with manydots, with each dot positioned horizontally according to the cumulativeamount of the factor in a speech (T2). The speeches are sorted verticallyby the level of the speech.
As shown in Fig. 1(B1), the light blue rectangle for each level coversthe middle 50% distribution of the speeches and the dark blue lineindicates the median of each level (T3). A geographical analysis offactors is provided in view (D). By clicking a country on the map, thespeakers belonging to the country will be highlighted, so users cananalyze the regional difference between countries (T1).
Table 3. Visualization Methods and Corresponding Tasks.
Module Description Task
E-factor To evaluate hypotheses of interest about speech factors using the cumulative data of all speeches. T1-T3, T6-T8E-type To understand discrete emotional data contained in emotional types, as well as their distribution over time. T1, T3, T5, T7
E-script To understand the emotion in speech scripts. T1, T3, T6-T7E-spiral To provide an intuitive way of understanding the emotional shifts within speeches. T1, T3, T6-T7
E-similarity To understand the similarity and the effectiveness estimation of speech factors in speeches. T3, T4, T7, T10E-distribution To understand distribution of factor effectiveness among speech levels. T2, T3, T7-T9
Fig. 3. E-spiral: a novel spiral-type visualization of time-series emotiondata. A comparison is given: (a) Spiral without turning points. (b)Spiral with turning points. Emotion shifts during speeches are intuitivelypresented with an interaction showing the detailed data.
6.1.2 E-Similarity
According to the experts’ feedback, we found that they desired to com-pare the similarity between speeches (T4). To allow this comparison wechose the five most significant factors as the speech’s feature vectors,and used t-SNE [28] to reduce the dimensionality of feature vectorsto display all speeches on a two-dimensional map. The closer twospeeches are to each other, the more similar the two speeches are.
In order to better understand this relation, a radar chart displays thefive most significant factors, and a given speech’s estimated level basedon the amount of each of the factors (T10). In Sect. 4.2, the result ofordinal regression contains the probability of the contest levels at acertain value of the factor. For a particular speech, we use the valueof a certain factor to predict its level and use the radial coordinate ofthe radar chart to represent the predicted level. The larger the area ofthe polygon in the radar chart, the higher the predicted effectiveness ofthe speech is. As shown in Fig. 1 (B5), clicking a dot representing anindividual speech in the scatter plot brings up a radar chart. Dots arecolor-encoded, allowing for rapid comparison of a speech’s estimatedlevel with its true value (T3).
6.1.3 E-Distribution
We designed E-distribution in order to show how the effect of eachfactor changes the calculated probability of each level, which can beinterpreted as a metric of effectiveness (T10). In Sect. 4.2, we obtainedthe probability of the five levels with respect to each factor. Thefive lines in the graph represent the distribution of probability of thefive levels of the contest, with the same color encoding used as inE-Similarity. We can observe E-Distribution in Fig. 1 (A). For examplefor the factor arousal mean we can observe larger values to the right ofE-distribution result in higher probabilities of the darker line, or finallevel of the contest.
6.2 Visualizations Generated from Individual Speech Data
6.2.1 E-Spiral
In our preliminary interview experts had suggested that emotionaltwists and turns may be important to consider in contest speeches.Preliminary data analysis early in our collection of speeches confirmedthis hypothesis, as we found that there was significant statistical resultsfor shifts in arousal (p-value 0.020) and valence (p-value 0.006). Wesought to create a visualization that would present a compact viewof these emotional shifts so that speeches could be rapidly compared.One option is spirals. According to a survey of timeline visualizations,spirals have advantages for displaying certain kinds of information, andtheir potential may not have been exhausted. Brehmer et al. foundthat spirals are “appropriate for presenting many events within a single
dense display.” [5]. We therefore created a new form of spiral that showsthe emotional twists and turns in a visually dramatic way. Clockwiseand counterclockwise turns in the spiral indicate shifting negative andpositive emotions, with sharp angles of the visualization showing theemotional turning points. Due to the compact structure, large scalecomparison is possible, supporting comparison and navigation betweenspeeches and within a speech (T7), as shown in Fig. 1(B2).
Based on the results extracted from the speech video, we identi-fied the speaker’s valence and arousal at regular intervals. Each circleappears in chronological order, starting at the center of the spiral. Sig-nificant shifts in the valence of speeches are reflected in the change ofdirection. As comparison of the emotional diversity of speeches wasstated to be a priority in our pre-survey of experts, we further indicatedthe emotional type of the interval as the color of the circle. The circleradius represents the arousal of emotions and transparency representsthe probability of the emotion being labeled correctly.
E-Spiral is generated in polar coordinates with θn = θn−1 +2π∆r pi.θn is the polar angle of the center of the n-th circle and ∆r = rn − rn−1
is the variation of the polar radius between the n-th circle and the(n−1)-th circle, which is a constant value since the spiral expands at aconstant variation of radius.
The emotional turning points are generated based on the positiveand negative changes of accumulated emotions in intervals. Ei = Σan
is the accumulative emotion in an interval of 5 seconds, in which an isone of the valence data in interval i. The spiral turns clockwise whenp = 1, while it turns counterclockwise when p =−1. The changing ofp decides the emotional turning points in spirals, which is calculated inEquation 8. The initial value of p is defined by the emotion in the firstinterval, shown in Equation 7.
p0 =
{
1, E0 > 0,
−1, E0 < 0.(7)
pi>1 =
{
−pi−1, Ei ∗Ei−1 < 0 and |Ei −Ei−1|> 10,
pi−1, otherwise.(8)
With the help of E-spiral, as shown in Fig. 3, we can clearly see thechanges of emotion during the speech via the turning spiral. Interactionof rapidly skipping to the video frame of the selected speech by clickingthe circle on the spiral supports rapid browsing with emotional cues(T5).
6.2.2 E-Script
How speech script content relates to key speech delivery informationis the subject of much literature on speech giving. E-script allows finegrained understanding of how multi-modal speech emotion (T5), wordspeed, and pauses relate to the timing of each word of a speech (T1).
As experts advised that effective use of pauses and word speed wasimportant to the emotional delivery of script content, we sought toindicate these factors in an intuitive way. We indicated the word speedby the tracking between letters in a word and pauses as the spacesbetween words.
In a novel approach, E-script aims to provide an audience with or-dinary visualization literacy with an intuitive way of understandingscript emotional data by changing letter shape to encode quantitativeinformation (quantitative glyphs). E-script highlights emotionally in-tense, high arousal moments. Sievers et al. [26] found that the shapeof lines can visually encode emotion and is closely related to arousal,
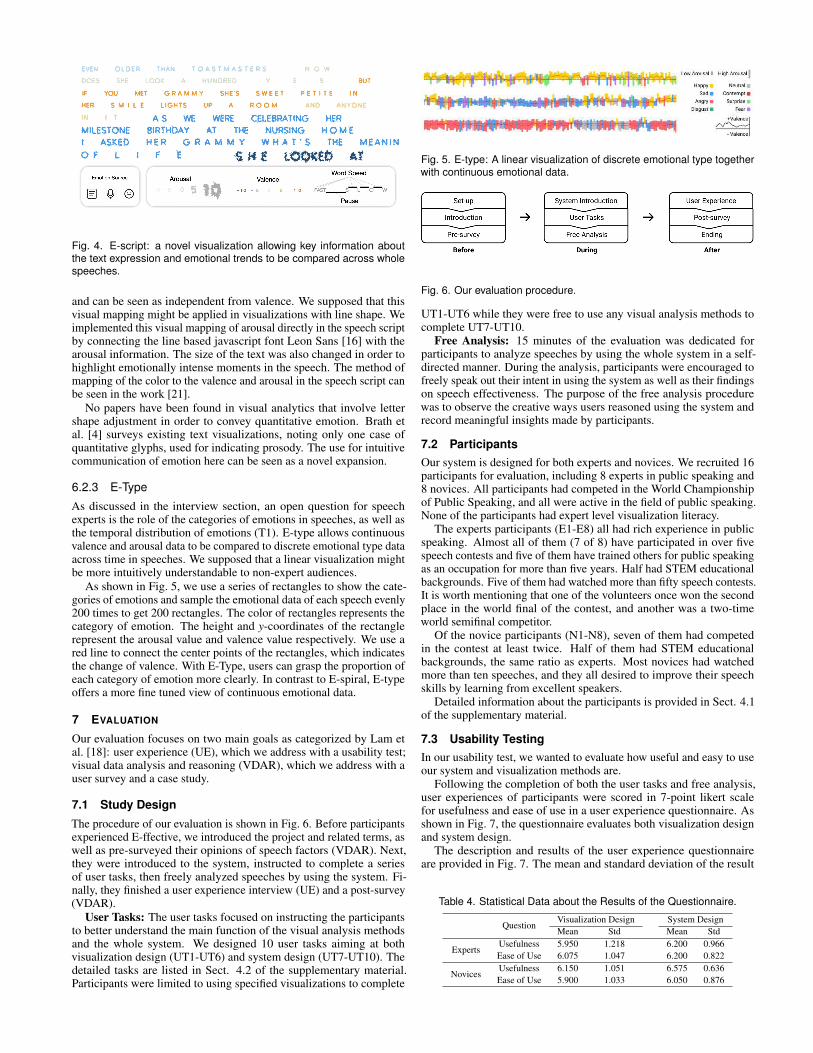
Fig. 4. E-script: a novel visualization allowing key information aboutthe text expression and emotional trends to be compared across wholespeeches.
and can be seen as independent from valence. We supposed that thisvisual mapping might be applied in visualizations with line shape. Weimplemented this visual mapping of arousal directly in the speech scriptby connecting the line based javascript font Leon Sans [16] with thearousal information. The size of the text was also changed in order tohighlight emotionally intense moments in the speech. The method ofmapping of the color to the valence and arousal in the speech script canbe seen in the work [21].
No papers have been found in visual analytics that involve lettershape adjustment in order to convey quantitative emotion. Brath etal. [4] surveys existing text visualizations, noting only one case ofquantitative glyphs, used for indicating prosody. The use for intuitivecommunication of emotion here can be seen as a novel expansion.
6.2.3 E-Type
As discussed in the interview section, an open question for speechexperts is the role of the categories of emotions in speeches, as well asthe temporal distribution of emotions (T1). E-type allows continuousvalence and arousal data to be compared to discrete emotional type dataacross time in speeches. We supposed that a linear visualization mightbe more intuitively understandable to non-expert audiences.
As shown in Fig. 5, we use a series of rectangles to show the cate-gories of emotions and sample the emotional data of each speech evenly200 times to get 200 rectangles. The color of rectangles represents thecategory of emotion. The height and y-coordinates of the rectanglerepresent the arousal value and valence value respectively. We use ared line to connect the center points of the rectangles, which indicatesthe change of valence. With E-Type, users can grasp the proportion ofeach category of emotion more clearly. In contrast to E-spiral, E-typeoffers a more fine tuned view of continuous emotional data.
7 EVALUATION
Our evaluation focuses on two main goals as categorized by Lam etal. [18]: user experience (UE), which we address with a usability test;visual data analysis and reasoning (VDAR), which we address with auser survey and a case study.
7.1 Study Design
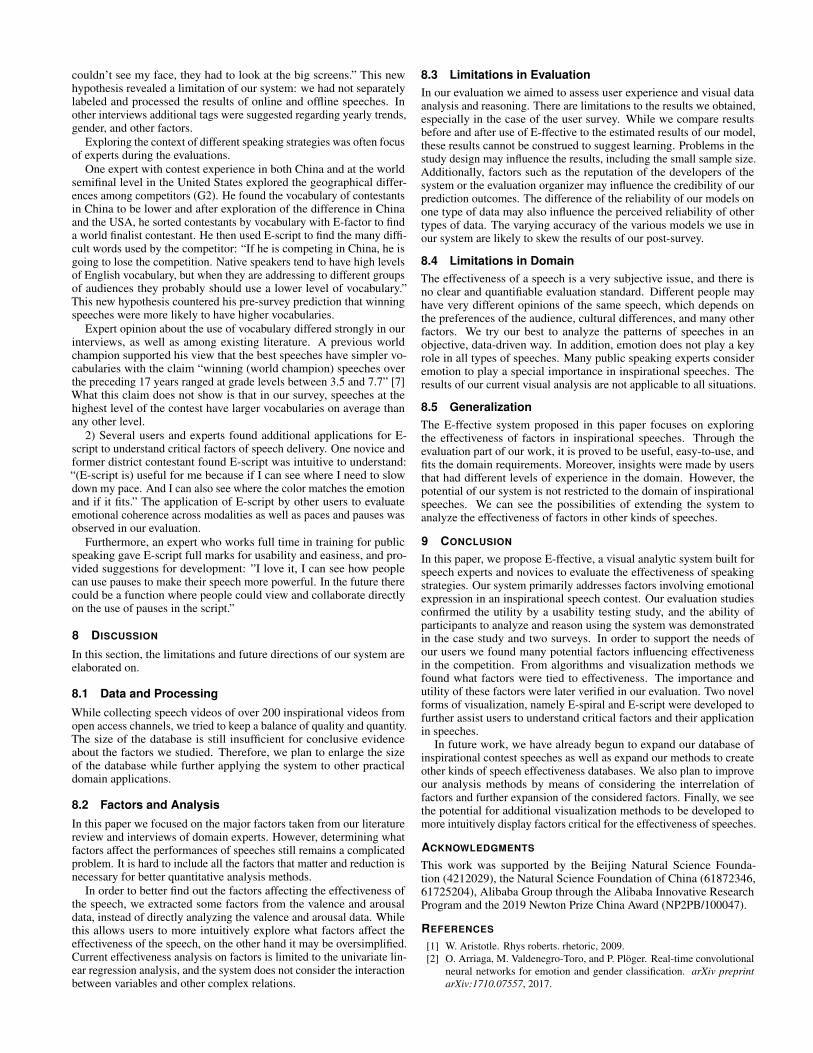
The procedure of our evaluation is shown in Fig. 6. Before participantsexperienced E-ffective, we introduced the project and related terms, aswell as pre-surveyed their opinions of speech factors (VDAR). Next,they were introduced to the system, instructed to complete a seriesof user tasks, then freely analyzed speeches by using the system. Fi-nally, they finished a user experience interview (UE) and a post-survey(VDAR).
User Tasks: The user tasks focused on instructing the participantsto better understand the main function of the visual analysis methodsand the whole system. We designed 10 user tasks aiming at bothvisualization design (UT1-UT6) and system design (UT7-UT10). Thedetailed tasks are listed in Sect. 4.2 of the supplementary material.Participants were limited to using specified visualizations to complete
Fig. 5. E-type: A linear visualization of discrete emotional type togetherwith continuous emotional data.
Fig. 6. Our evaluation procedure.
UT1-UT6 while they were free to use any visual analysis methods tocomplete UT7-UT10.
Free Analysis: 15 minutes of the evaluation was dedicated forparticipants to analyze speeches by using the whole system in a self-directed manner. During the analysis, participants were encouraged tofreely speak out their intent in using the system as well as their findingson speech effectiveness. The purpose of the free analysis procedurewas to observe the creative ways users reasoned using the system andrecord meaningful insights made by participants.
7.2 Participants
Our system is designed for both experts and novices. We recruited 16participants for evaluation, including 8 experts in public speaking and8 novices. All participants had competed in the World Championshipof Public Speaking, and all were active in the field of public speaking.None of the participants had expert level visualization literacy.
The experts participants (E1-E8) all had rich experience in publicspeaking. Almost all of them (7 of 8) have participated in over fivespeech contests and five of them have trained others for public speakingas an occupation for more than five years. Half had STEM educationalbackgrounds. Five of them had watched more than fifty speech contests.It is worth mentioning that one of the volunteers once won the secondplace in the world final of the contest, and another was a two-timeworld semifinal competitor.
Of the novice participants (N1-N8), seven of them had competedin the contest at least twice. Half of them had STEM educationalbackgrounds, the same ratio as experts. Most novices had watchedmore than ten speeches, and they all desired to improve their speechskills by learning from excellent speakers.
Detailed information about the participants is provided in Sect. 4.1of the supplementary material.
7.3 Usability Testing
In our usability test, we wanted to evaluate how useful and easy to useour system and visualization methods are.
Following the completion of both the user tasks and free analysis,user experiences of participants were scored in 7-point likert scalefor usefulness and ease of use in a user experience questionnaire. Asshown in Fig. 7, the questionnaire evaluates both visualization designand system design.
The description and results of the user experience questionnaireare provided in Fig. 7. The mean and standard deviation of the result
Table 4. Statistical Data about the Results of the Questionnaire.
QuestionVisualization Design System Design
Mean Std Mean Std
ExpertsUsefulness 5.950 1.218 6.200 0.966
Ease of Use 6.075 1.047 6.200 0.822
NovicesUsefulness 6.150 1.051 6.575 0.636
Ease of Use 5.900 1.033 6.050 0.876
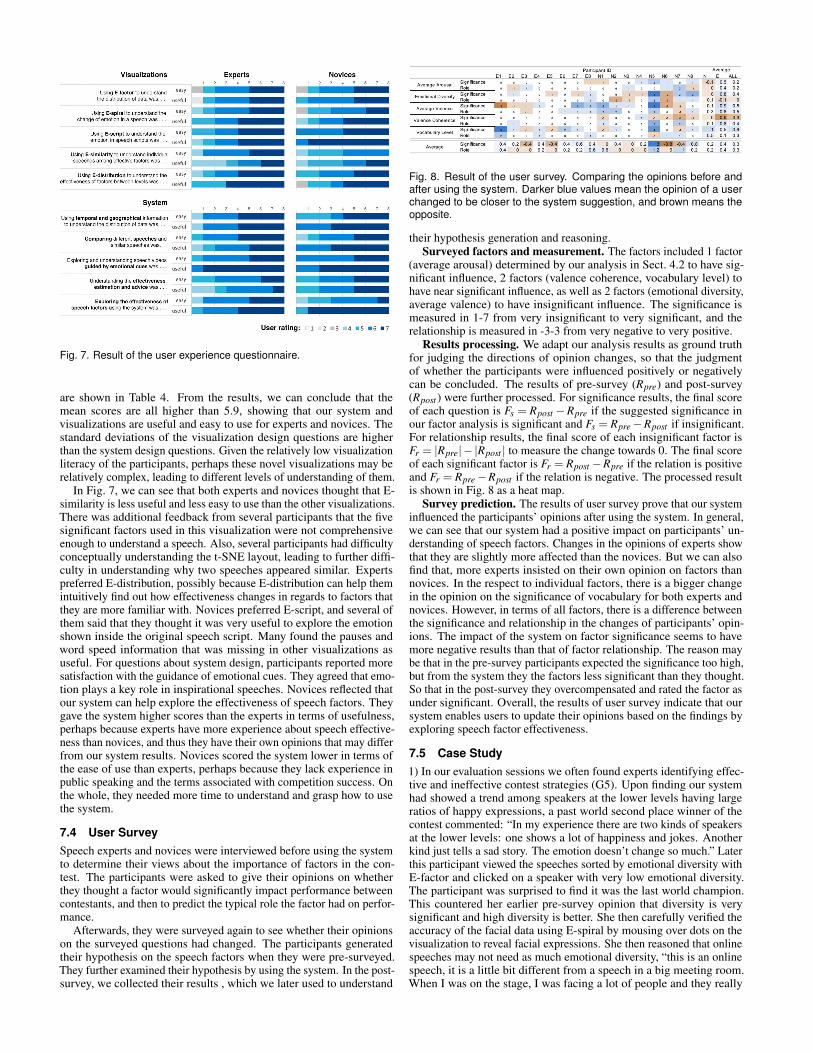
Fig. 7. Result of the user experience questionnaire.
are shown in Table 4. From the results, we can conclude that themean scores are all higher than 5.9, showing that our system andvisualizations are useful and easy to use for experts and novices. Thestandard deviations of the visualization design questions are higherthan the system design questions. Given the relatively low visualizationliteracy of the participants, perhaps these novel visualizations may berelatively complex, leading to different levels of understanding of them.
In Fig. 7, we can see that both experts and novices thought that E-similarity is less useful and less easy to use than the other visualizations.There was additional feedback from several participants that the fivesignificant factors used in this visualization were not comprehensiveenough to understand a speech. Also, several participants had difficultyconceptually understanding the t-SNE layout, leading to further diffi-culty in understanding why two speeches appeared similar. Expertspreferred E-distribution, possibly because E-distribution can help themintuitively find out how effectiveness changes in regards to factors thatthey are more familiar with. Novices preferred E-script, and several ofthem said that they thought it was very useful to explore the emotionshown inside the original speech script. Many found the pauses andword speed information that was missing in other visualizations asuseful. For questions about system design, participants reported moresatisfaction with the guidance of emotional cues. They agreed that emo-tion plays a key role in inspirational speeches. Novices reflected thatour system can help explore the effectiveness of speech factors. Theygave the system higher scores than the experts in terms of usefulness,perhaps because experts have more experience about speech effective-ness than novices, and thus they have their own opinions that may differfrom our system results. Novices scored the system lower in terms ofthe ease of use than experts, perhaps because they lack experience inpublic speaking and the terms associated with competition success. Onthe whole, they needed more time to understand and grasp how to usethe system.
7.4 User Survey
Speech experts and novices were interviewed before using the systemto determine their views about the importance of factors in the con-test. The participants were asked to give their opinions on whetherthey thought a factor would significantly impact performance betweencontestants, and then to predict the typical role the factor had on perfor-mance.
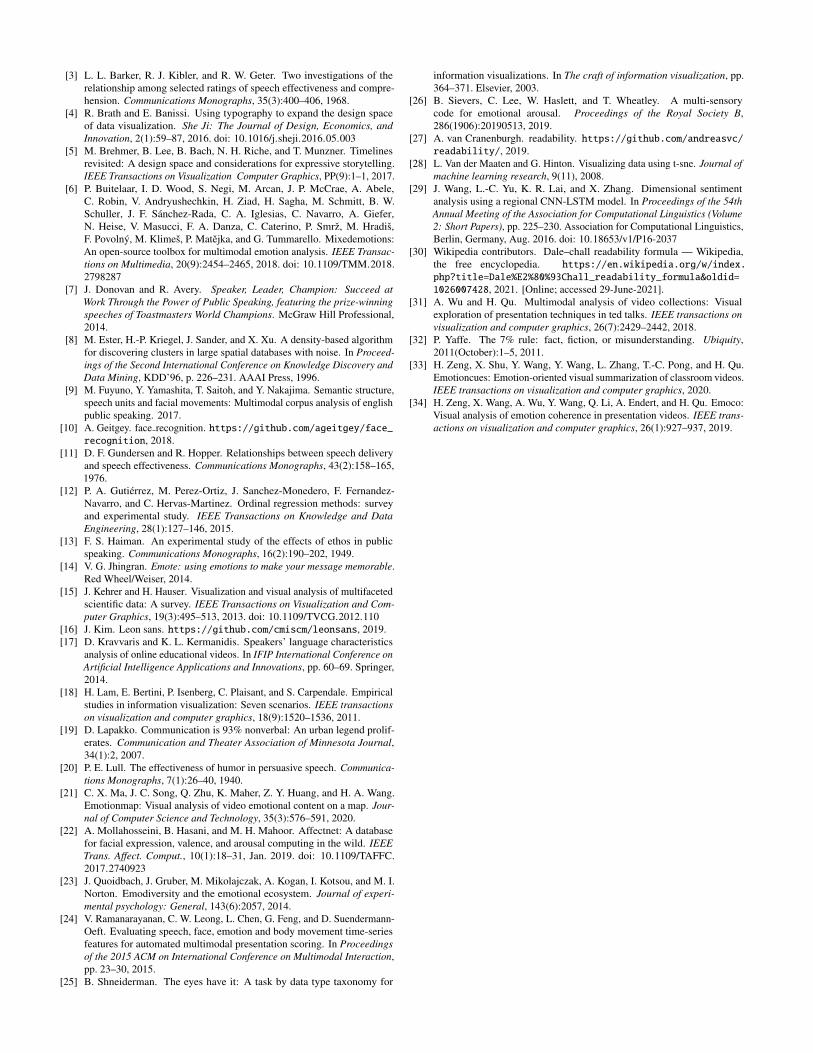
Afterwards, they were surveyed again to see whether their opinionson the surveyed questions had changed. The participants generatedtheir hypothesis on the speech factors when they were pre-surveyed.They further examined their hypothesis by using the system. In the post-survey, we collected their results , which we later used to understand
Fig. 8. Result of the user survey. Comparing the opinions before andafter using the system. Darker blue values mean the opinion of a userchanged to be closer to the system suggestion, and brown means theopposite.
their hypothesis generation and reasoning.
Surveyed factors and measurement. The factors included 1 factor(average arousal) determined by our analysis in Sect. 4.2 to have sig-nificant influence, 2 factors (valence coherence, vocabulary level) tohave near significant influence, as well as 2 factors (emotional diversity,average valence) to have insignificant influence. The significance ismeasured in 1-7 from very insignificant to very significant, and therelationship is measured in -3-3 from very negative to very positive.
Results processing. We adapt our analysis results as ground truthfor judging the directions of opinion changes, so that the judgmentof whether the participants were influenced positively or negativelycan be concluded. The results of pre-survey (Rpre) and post-survey(Rpost ) were further processed. For significance results, the final scoreof each question is Fs = Rpost −Rpre if the suggested significance inour factor analysis is significant and Fs = Rpre −Rpost if insignificant.For relationship results, the final score of each insignificant factor isFr = |Rpre|− |Rpost | to measure the change towards 0. The final scoreof each significant factor is Fr = Rpost −Rpre if the relation is positiveand Fr = Rpre −Rpost if the relation is negative. The processed resultis shown in Fig. 8 as a heat map.
Survey prediction. The results of user survey prove that our systeminfluenced the participants’ opinions after using the system. In general,we can see that our system had a positive impact on participants’ un-derstanding of speech factors. Changes in the opinions of experts showthat they are slightly more affected than the novices. But we can alsofind that, more experts insisted on their own opinion on factors thannovices. In the respect to individual factors, there is a bigger changein the opinion on the significance of vocabulary for both experts andnovices. However, in terms of all factors, there is a difference betweenthe significance and relationship in the changes of participants’ opin-ions. The impact of the system on factor significance seems to havemore negative results than that of factor relationship. The reason maybe that in the pre-survey participants expected the significance too high,but from the system they the factors less significant than they thought.So that in the post-survey they overcompensated and rated the factor asunder significant. Overall, the results of user survey indicate that oursystem enables users to update their opinions based on the findings byexploring speech factor effectiveness.
7.5 Case Study
1) In our evaluation sessions we often found experts identifying effec-tive and ineffective contest strategies (G5). Upon finding our systemhad showed a trend among speakers at the lower levels having largeratios of happy expressions, a past world second place winner of thecontest commented: “In my experience there are two kinds of speakersat the lower levels: one shows a lot of happiness and jokes. Anotherkind just tells a sad story. The emotion doesn’t change so much.” Laterthis participant viewed the speeches sorted by emotional diversity withE-factor and clicked on a speaker with very low emotional diversity.The participant was surprised to find it was the last world champion.This countered her earlier pre-survey opinion that diversity is verysignificant and high diversity is better. She then carefully verified theaccuracy of the facial data using E-spiral by mousing over dots on thevisualization to reveal facial expressions. She then reasoned that onlinespeeches may not need as much emotional diversity, “this is an onlinespeech, it is a little bit different from a speech in a big meeting room.When I was on the stage, I was facing a lot of people and they really
couldn’t see my face, they had to look at the big screens.” This newhypothesis revealed a limitation of our system: we had not separatelylabeled and processed the results of online and offline speeches. Inother interviews additional tags were suggested regarding yearly trends,gender, and other factors.
Exploring the context of different speaking strategies was often focusof experts during the evaluations.
One expert with contest experience in both China and at the worldsemifinal level in the United States explored the geographical differ-ences among competitors (G2). He found the vocabulary of contestantsin China to be lower and after exploration of the difference in Chinaand the USA, he sorted contestants by vocabulary with E-factor to finda world finalist contestant. He then used E-script to find the many diffi-cult words used by the competitor: “If he is competing in China, he isgoing to lose the competition. Native speakers tend to have high levelsof English vocabulary, but when they are addressing to different groupsof audiences they probably should use a lower level of vocabulary.”This new hypothesis countered his pre-survey prediction that winningspeeches were more likely to have higher vocabularies.
Expert opinion about the use of vocabulary differed strongly in ourinterviews, as well as among existing literature. A previous worldchampion supported his view that the best speeches have simpler vo-cabularies with the claim “winning (world champion) speeches overthe preceding 17 years ranged at grade levels between 3.5 and 7.7” [7]What this claim does not show is that in our survey, speeches at thehighest level of the contest have larger vocabularies on average thanany other level.
2) Several users and experts found additional applications for E-script to understand critical factors of speech delivery. One novice andformer district contestant found E-script was intuitive to understand:“(E-script is) useful for me because if I can see where I need to slowdown my pace. And I can also see where the color matches the emotionand if it fits.” The application of E-script by other users to evaluateemotional coherence across modalities as well as paces and pauses wasobserved in our evaluation.
Furthermore, an expert who works full time in training for publicspeaking gave E-script full marks for usability and easiness, and pro-vided suggestions for development: ”I love it, I can see how peoplecan use pauses to make their speech more powerful. In the future therecould be a function where people could view and collaborate directlyon the use of pauses in the script.”
8 DISCUSSION
In this section, the limitations and future directions of our system areelaborated on.
8.1 Data and Processing
While collecting speech videos of over 200 inspirational videos fromopen access channels, we tried to keep a balance of quality and quantity.The size of the database is still insufficient for conclusive evidenceabout the factors we studied. Therefore, we plan to enlarge the sizeof the database while further applying the system to other practicaldomain applications.
8.2 Factors and Analysis
In this paper we focused on the major factors taken from our literaturereview and interviews of domain experts. However, determining whatfactors affect the performances of speeches still remains a complicatedproblem. It is hard to include all the factors that matter and reduction isnecessary for better quantitative analysis methods.
In order to better find out the factors affecting the effectiveness ofthe speech, we extracted some factors from the valence and arousaldata, instead of directly analyzing the valence and arousal data. Whilethis allows users to more intuitively explore what factors affect theeffectiveness of the speech, on the other hand it may be oversimplified.Current effectiveness analysis on factors is limited to the univariate lin-ear regression analysis, and the system does not consider the interactionbetween variables and other complex relations.
8.3 Limitations in Evaluation
In our evaluation we aimed to assess user experience and visual dataanalysis and reasoning. There are limitations to the results we obtained,especially in the case of the user survey. While we compare resultsbefore and after use of E-ffective to the estimated results of our model,these results cannot be construed to suggest learning. Problems in thestudy design may influence the results, including the small sample size.Additionally, factors such as the reputation of the developers of thesystem or the evaluation organizer may influence the credibility of ourprediction outcomes. The difference of the reliability of our models onone type of data may also influence the perceived reliability of othertypes of data. The varying accuracy of the various models we use inour system are likely to skew the results of our post-survey.
8.4 Limitations in Domain
The effectiveness of a speech is a very subjective issue, and there isno clear and quantifiable evaluation standard. Different people mayhave very different opinions of the same speech, which depends onthe preferences of the audience, cultural differences, and many otherfactors. We try our best to analyze the patterns of speeches in anobjective, data-driven way. In addition, emotion does not play a keyrole in all types of speeches. Many public speaking experts consideremotion to play a special importance in inspirational speeches. Theresults of our current visual analysis are not applicable to all situations.
8.5 Generalization
The E-ffective system proposed in this paper focuses on exploringthe effectiveness of factors in inspirational speeches. Through theevaluation part of our work, it is proved to be useful, easy-to-use, andfits the domain requirements. Moreover, insights were made by usersthat had different levels of experience in the domain. However, thepotential of our system is not restricted to the domain of inspirationalspeeches. We can see the possibilities of extending the system toanalyze the effectiveness of factors in other kinds of speeches.
9 CONCLUSION
In this paper, we propose E-ffective, a visual analytic system built forspeech experts and novices to evaluate the effectiveness of speakingstrategies. Our system primarily addresses factors involving emotionalexpression in an inspirational speech contest. Our evaluation studiesconfirmed the utility by a usability testing study, and the ability ofparticipants to analyze and reason using the system was demonstratedin the case study and two surveys. In order to support the needs ofour users we found many potential factors influencing effectivenessin the competition. From algorithms and visualization methods wefound what factors were tied to effectiveness. The importance andutility of these factors were later verified in our evaluation. Two novelforms of visualization, namely E-spiral and E-script were developed tofurther assist users to understand critical factors and their applicationin speeches.
In future work, we have already begun to expand our database ofinspirational contest speeches as well as expand our methods to createother kinds of speech effectiveness databases. We also plan to improveour analysis methods by means of considering the interrelation offactors and further expansion of the considered factors. Finally, we seethe potential for additional visualization methods to be developed tomore intuitively display factors critical for the effectiveness of speeches.
ACKNOWLEDGMENTS
This work was supported by the Beijing Natural Science Founda-tion (4212029), the Natural Science Foundation of China (61872346,61725204), Alibaba Group through the Alibaba Innovative ResearchProgram and the 2019 Newton Prize China Award (NP2PB/100047).
REFERENCES
[1] W. Aristotle. Rhys roberts. rhetoric, 2009.
[2] O. Arriaga, M. Valdenegro-Toro, and P. Ploger. Real-time convolutional
neural networks for emotion and gender classification. arXiv preprint
arXiv:1710.07557, 2017.
[3] L. L. Barker, R. J. Kibler, and R. W. Geter. Two investigations of the
relationship among selected ratings of speech effectiveness and compre-
hension. Communications Monographs, 35(3):400–406, 1968.
[4] R. Brath and E. Banissi. Using typography to expand the design space
of data visualization. She Ji: The Journal of Design, Economics, and
Innovation, 2(1):59–87, 2016. doi: 10.1016/j.sheji.2016.05.003
[5] M. Brehmer, B. Lee, B. Bach, N. H. Riche, and T. Munzner. Timelines
revisited: A design space and considerations for expressive storytelling.
IEEE Transactions on Visualization Computer Graphics, PP(9):1–1, 2017.
[6] P. Buitelaar, I. D. Wood, S. Negi, M. Arcan, J. P. McCrae, A. Abele,
C. Robin, V. Andryushechkin, H. Ziad, H. Sagha, M. Schmitt, B. W.
Schuller, J. F. Sanchez-Rada, C. A. Iglesias, C. Navarro, A. Giefer,
N. Heise, V. Masucci, F. A. Danza, C. Caterino, P. Smrz, M. Hradis,
F. Povolny, M. Klimes, P. Matejka, and G. Tummarello. Mixedemotions:
An open-source toolbox for multimodal emotion analysis. IEEE Transac-
tions on Multimedia, 20(9):2454–2465, 2018. doi: 10.1109/TMM.2018.
2798287
[7] J. Donovan and R. Avery. Speaker, Leader, Champion: Succeed at
Work Through the Power of Public Speaking, featuring the prize-winning
speeches of Toastmasters World Champions. McGraw Hill Professional,
2014.
[8] M. Ester, H.-P. Kriegel, J. Sander, and X. Xu. A density-based algorithm
for discovering clusters in large spatial databases with noise. In Proceed-
ings of the Second International Conference on Knowledge Discovery and
Data Mining, KDD’96, p. 226–231. AAAI Press, 1996.
[9] M. Fuyuno, Y. Yamashita, T. Saitoh, and Y. Nakajima. Semantic structure,
speech units and facial movements: Multimodal corpus analysis of english
public speaking. 2017.
[10] A. Geitgey. face recognition. https://github.com/ageitgey/face_
recognition, 2018.
[11] D. F. Gundersen and R. Hopper. Relationships between speech delivery
and speech effectiveness. Communications Monographs, 43(2):158–165,
1976.
[12] P. A. Gutierrez, M. Perez-Ortiz, J. Sanchez-Monedero, F. Fernandez-
Navarro, and C. Hervas-Martinez. Ordinal regression methods: survey
and experimental study. IEEE Transactions on Knowledge and Data
Engineering, 28(1):127–146, 2015.
[13] F. S. Haiman. An experimental study of the effects of ethos in public
speaking. Communications Monographs, 16(2):190–202, 1949.
[14] V. G. Jhingran. Emote: using emotions to make your message memorable.
Red Wheel/Weiser, 2014.
[15] J. Kehrer and H. Hauser. Visualization and visual analysis of multifaceted
scientific data: A survey. IEEE Transactions on Visualization and Com-
puter Graphics, 19(3):495–513, 2013. doi: 10.1109/TVCG.2012.110
[16] J. Kim. Leon sans. https://github.com/cmiscm/leonsans, 2019.
[17] D. Kravvaris and K. L. Kermanidis. Speakers’ language characteristics
analysis of online educational videos. In IFIP International Conference on
Artificial Intelligence Applications and Innovations, pp. 60–69. Springer,
2014.
[18] H. Lam, E. Bertini, P. Isenberg, C. Plaisant, and S. Carpendale. Empirical
studies in information visualization: Seven scenarios. IEEE transactions
on visualization and computer graphics, 18(9):1520–1536, 2011.
[19] D. Lapakko. Communication is 93% nonverbal: An urban legend prolif-
erates. Communication and Theater Association of Minnesota Journal,
34(1):2, 2007.
[20] P. E. Lull. The effectiveness of humor in persuasive speech. Communica-
tions Monographs, 7(1):26–40, 1940.
[21] C. X. Ma, J. C. Song, Q. Zhu, K. Maher, Z. Y. Huang, and H. A. Wang.
Emotionmap: Visual analysis of video emotional content on a map. Jour-
nal of Computer Science and Technology, 35(3):576–591, 2020.
[22] A. Mollahosseini, B. Hasani, and M. H. Mahoor. Affectnet: A database
for facial expression, valence, and arousal computing in the wild. IEEE
Trans. Affect. Comput., 10(1):18–31, Jan. 2019. doi: 10.1109/TAFFC.
2017.2740923
[23] J. Quoidbach, J. Gruber, M. Mikolajczak, A. Kogan, I. Kotsou, and M. I.
Norton. Emodiversity and the emotional ecosystem. Journal of experi-
mental psychology: General, 143(6):2057, 2014.
[24] V. Ramanarayanan, C. W. Leong, L. Chen, G. Feng, and D. Suendermann-
Oeft. Evaluating speech, face, emotion and body movement time-series
features for automated multimodal presentation scoring. In Proceedings
of the 2015 ACM on International Conference on Multimodal Interaction,
pp. 23–30, 2015.
[25] B. Shneiderman. The eyes have it: A task by data type taxonomy for
information visualizations. In The craft of information visualization, pp.
364–371. Elsevier, 2003.
[26] B. Sievers, C. Lee, W. Haslett, and T. Wheatley. A multi-sensory
code for emotional arousal. Proceedings of the Royal Society B,
286(1906):20190513, 2019.
[27] A. van Cranenburgh. readability. https://github.com/andreasvc/
readability/, 2019.
[28] L. Van der Maaten and G. Hinton. Visualizing data using t-sne. Journal of
machine learning research, 9(11), 2008.
[29] J. Wang, L.-C. Yu, K. R. Lai, and X. Zhang. Dimensional sentiment
analysis using a regional CNN-LSTM model. In Proceedings of the 54th
Annual Meeting of the Association for Computational Linguistics (Volume
2: Short Papers), pp. 225–230. Association for Computational Linguistics,
Berlin, Germany, Aug. 2016. doi: 10.18653/v1/P16-2037
[30] Wikipedia contributors. Dale–chall readability formula — Wikipedia,
the free encyclopedia. https://en.wikipedia.org/w/index.
php?title=Dale%E2%80%93Chall_readability_formula&oldid=
1026007428, 2021. [Online; accessed 29-June-2021].
[31] A. Wu and H. Qu. Multimodal analysis of video collections: Visual
exploration of presentation techniques in ted talks. IEEE transactions on
visualization and computer graphics, 26(7):2429–2442, 2018.
[32] P. Yaffe. The 7% rule: fact, fiction, or misunderstanding. Ubiquity,
2011(October):1–5, 2011.
[33] H. Zeng, X. Shu, Y. Wang, Y. Wang, L. Zhang, T.-C. Pong, and H. Qu.
Emotioncues: Emotion-oriented visual summarization of classroom videos.
IEEE transactions on visualization and computer graphics, 2020.
[34] H. Zeng, X. Wang, A. Wu, Y. Wang, Q. Li, A. Endert, and H. Qu. Emoco:
Visual analysis of emotion coherence in presentation videos. IEEE trans-
actions on visualization and computer graphics, 26(1):927–937, 2019.