Embed Size (px)
Citation preview

E INK
HO
LDIN
GS IN
C. 2013 A
nnual Report
E INK HOLDINGS INC.2013 Annual Report
EIH: 8069*Taiwan Stock Exchang Market Observation Post System: http://mops.tse.com.tw*EIH annual report is available at http://www.einkgroup.com Printed on April 20, 2014
No.3, Lixing 1st Rd., Hsinchu Science Park, Hsinchu 300, TaiwanTel: 886 3 5798599 Fax: 886 3 5788339http://www.einkgroup.com
Copyrights of some images used in this report belong to Yota Devices、Amazon、Vanguard ID、PocketBook、Deutsche Telekom Group、Twelve24、Central Standard Timing. " YotaPhone " is a registered trademark of Yota Devices." Kindle Paperwhite " is a registered trademark of Amazon.com, Inc. "Tolino Shine" is a registered trademark of Deutsche Telekom Group. " View Tag " is a registered trademark of Vanguard ID. " CAD Reader" is a registered trademark of PocketBook. " Tolino Shine " is a registered trademark of Deutsche Telekom Group. " ClockOne" is a registered trademark of Twelve24. " CST-01" is a registered trademark of Central Standard Timing.
E INK HOLDINGS INC.

SPOKEPERSON / DEPUTY SPOKEPERSON:
Eddie Chen / Chief Financial Officer (Finance & Admin. Center) T. 886 3 5798599 [email protected]
C.H. Chiu / Chief of Operating Officer T. 886 3 5798599 [email protected]
OFFICE / FACTORY:
E INK HOLDINGS INC. 3, Li-Hsin Road One, HsinChu Science Park, HsinChu, Taiwan 300, R.O.C. T. 886 3 5798599 F. 886 3 5788339 http:// www.einkgroup.com
STOCK LISTING:
The company‘s common stock is list on the Taiwan’s Gretai Securities Market : 8069 Common Share Transfer Agent & Registrar: SinoPac Securities 3F, 17 Po Ai Rd., Taipei, Taiwan, R.O.C. T. 886 2 2381-6288 http://www.sinotrade.com.tw
INDEPENDENT CERTIFIED PUBLIC ACCOUNTANT:
Deloitte & Touche 12F, 156 Min Sheng E Road, Sec. 3, Taipei, Taiwan, R.O.C. T. 886 2 2545-9988 http://www.deloitte.co.tw
NAME OF INTERNATIONAL PUBLIC SECURITIES EXCHANGES AND HOW TO GET INFORMATION ABOUT SECURITIES TRADED THERE:
Trading house: Luxembourg Stock Exchange Inquiry method: bloomberg website http://www.bourse.lu/
CONTENTS 01 Company Milestones
02 Letter To The Shareholders
06 Financial Highlights
13 Company Introduction
14 Affiliate and Subsidiaries
15 Company Organization
19 Review of Operations
28 Financial Statements
35 Consolidated Financial Statements

01
COMPANY MILESTONESDate of Establishment : June 16th, 1992
Milestones in the Company’s History:
Sept 2000 Monthly production capacity reached 18,000 substratesOct 2000 Securities & Futures Information Center issued authorization for public offeringSept 2001 Expanded its monthly production capacity to 36,000 substratesOct 2001 Acquired ISO 9001 certificationApr 2002 Taiwan’s Investment Commission approved the company’s plan to set up a PRC
subsidiary, Transcend Optronics (Yangzhou) Co Ltd, through a third region investment entityJul 2002 Acquired QS-9000 Certification for product quality, ISO 14001 Certification for environmental standards, and OHSAS 1800 Certification for
occupational health and safety management systemsFeb 2003 Listed its shares on Taiwan’s Emerging Stock MarketOct 2003 Applied for its shares to be listed on Taiwan’s GreTai Securities Market (GTSM)Jan 2004 GTSM approved the company’s application for its shares to be listedMar 2004 Commenced trading on the GTSM on March 30, 2004Nov 2004 Taiwan’s Investment Commission approved the company’s application for indirect investment in Rich Optronics (Yangzhou) Co Ltd in PRC
through a third region investment entityMay 2005 Partnered with Philips in EPD (Electronic Paper Display) businessMay 2006 Executed the 1st treasury stock repurchase and retired 296,000 issued sharesOct 2006 Established US subsidiary to expand sales network in the AmericaNov 2007 Signed a merger memorandum with BOE Hydis Technology of South KoreaJul 2008 Officially acquired share ownership of Hydis TechnologiesJun 2009 Signed agreement to acquire 100% share ownership of E Ink Corporation (EIC) USASept 2009 Signed amended agreement for the 100% share transfer with EIC and shareholder representatives to obtain 100% share ownership of EIC,
effective December 23rd, 2009Dec 2009 Hydis Technologies signed corporate bond purchase agreement, guarantee agreement, investment agreement and cross-licensing
agreement with LG Display of KoreaMay 2010 Taiwan’s Investment Commission approved the company’s application to establish Transyang Electronics (Yangzhou) Ltd through a third
region investment entityNov 2010 The company’s latest EPD product, E Ink PearlTM , won the Popular Science award for “Best of What’s New 2010”Dec 2010 Won Printed Electronics Awards at The 4th IDTechEx, USAMar 2011 The company’s Board of Directors passed a resolution for a second treasury stock repurchase to be used for employee motivation programsJun 2010 Changed English name of the company to “E Ink Holdings Inc.”.Jan 2011 Approved by the Investment Commission to invest in the Chuanyuan Electronics (Yangzhou) Co., Ltd. in Mainland China through a third-
location investment vehicle.May 2011 The E Ink Triton™ EPD was awarded by the SID as the Best Display Component of Year 2011.Jul 2011 Partnered with Chunghwa Picture Tubes Ltd.by subscribing to the unsecured convertible bonds from its non-public offering after approved
by the board of directors.Oct 2011 The E Ink Triton™ EPD won 2011 Technology Innovation Award issued by Wall Street Journal, USA.Nov 2011 The E Ink Pearl™ EPD won 2011 Innovation Awards for Electronics issued by IET, UK.Nov 2011 Terminated the joint investment in Hydis with LG Display under a mutual agreement. Hydis redeemed its corporate bonds held by LG Display
and relieved all the guarantee contracts related with said bonds.Jun 2012 The next generation E Ink high performance EPD won the Fifteenth Excellent Optical Product Prize from the Photonics Industry &
Technology Association.Jun 2012 The high contrast E Ink Pearl™ EPD won the Eleventh Surface Display Component Product Technology Prize’s Excellent Component from the
Image Display Industry Advancement Office, Industrial Development Bureau of the Ministry of Economic Affairs.Jul 2012 E Ink Holdings Inc. and its Korean subsidiary, Hydis Technologies Co., Ltd entered patents cross-licensing agreement with Sharp Corporation.Oct 2012 E Ink Holdings Inc. and its Korean subsidiary, Hydis Technologies Co., Ltd entered patents cross-licensing agreement with AU Optronics
Corp. Nov 2012 E Ink Holdings Inc completed the purchase of SiPix Technology, Inc. and its wholly owned subsidiary SiPix Imaging, Inc. (USA)Dec 2012 E Ink Holdings Inc. and its Korean subsidiary, Hydis Technologies Co., Ltd entered patents cross-licensing agreement with Chunghwa Picture
Tubes Ltd.Jan 2013 E Ink Holdings Inc. bought facilities and equipments from its subsidiary, Sipix at Linkou, to integrate production capacity in Taiwan and to
improve assets utilization.May 2013 E Ink Holdings won the Best in Show award for 2013 from the Society of Information Display (SID) of the United States.May 2013 E Ink Spectra released. Spectra is the world’s only electronic paper display capable of displaying three colors of red, black, and white.June 2013 E Ink Triton, the all-functional color EPD, received the 16th Outstanding Optical Electronic Product Award from the Photonics Industry and
Technology Development Association (PIDA).Nov 2013 Our company’s Korean subsidiary Hydis Technologies Co., Ltd. signed a patent exchange authorization agreement with Innolux Corporation.April 2014 Our company’s Korean subsidiary Hydis Technologies Co., Ltd. signed a patent exchange authorization agreement with BOE Technology
Group Co., Ltd.
02
>> Letter to Shareholders
Dear Shareholders,
E Ink Holdings Inc. has been devoted to the development of electronic paper industry with its technological edge, expanded patent strategies
and innovative concepts. After a complete integration with SiPix in the areas of talents, technologies and resources, the Company is equipped
with even more comprehensive strategies in the e-paper business. On the solid basis of our existing e-Reader markets, the Company continues its
transformation towards a diversified application and development of the electronic paper displays (EPD).
2013 Business Report
For E Ink Holdings Inc., 2013 was a year full of challenges and a transition period during which the Company was adjusting the way we do
business. Overall speaking, thanks to the concerted efforts and hard work of all our staff, we have made some rewarding accomplishments for
the year. In 2013, E Ink had a combined revenue of NT$ 18.9 billion, a gross profit of NT$ 3 billion with a gross profit margin at 16% and a
net income after tax of NT$ 29 million. The earnings per share (EPS) for 2013 are NT$ 0.03. Compared to 2012, we have strived for improving
our product portfolio and improve efficiency by eliminating certain poorly performed products. This led to our healthier revenue income and an
improved gross profit margin.

03
For the EPD business, we are facing a more difficult manufacturing and production environment due to the market demand and clients’
repeated requests for new product specifications and designs. Despite these challenges, the hard work of our staff pushed up the overall
shipment of eReader devices in 2012, contrary to previous pessimistic expectations. On the other hand, the electronic shelf label (ESL)
business continues to grow. We have received new purchase orders from a good number of retailers in Europe and the US, which are likely
to grow in the future. As to the use of EPD in applications such as mobile phones and wrist watches, we expect to see more mature markets
for new applications in several years to come, which will bring more business to the Company. In terms of TFT LCD, E Ink chose to shun away
from the price-cutting competition in the consumer market and focused on our niche markets. We are developing as well the licensing for
fringe field switching (FFS) technology to maintain a more profitable operating strategy.
Inspired by our quest for excellence and a bold and daring spirit, we are undergoing an organizational reengineering plan by changing
our business model of running subsidiaries to a globally integrated company. Through the establishment of functional organizations and
business units, we are gradually moving toward our goal of global integration. We hope doing so will successfully integrate front and back
offices, and design and materials of electronic mechanisms, in order to effectively support the development of new products and business
activities with an ultimate goal of a diversified portfolio in the EPD market.
2013 was also a year of a vibrant emergence of e-paper technologies within E Ink. We subsequently launched different EPD technologies
including Carta, Spectra, Aurora, Mobius and Fina, each focusing on a different product or market sector. E Ink CartaTM, utilizes a brand new
e-paper technology that greatly improves display contrast and reflectivity and creates an enviable visual and reading experience comparable
to or better than that of paper books. Carta has been first used in Kindle Paperwhite, the latest eReader device from Amazon. E Ink
SpectraTM, the first production epaper product with red, black and white color pigments, works best for ESL systems in the retail marketplace
and enables real-time transmission of valuable information such as new product launches or promotions to consumers. This technology can
also be used in the electronic identification systems for the industrial, smart cards and medical applications. E Ink AuroraTM operates perfectly
in low temperature as cold as minus 25°C, giving more flexibility to retailing, medical and logistic service providers when using displays for
ESL and smart cards. E Ink Mobius replaces the traditional glass substrate of a TFT with plastic material, creating a display which lightweight
and rugged. For example a 13.3” Mobius display. weighs only 60 grams. This is great news for large-size mobile device manufacturers. E
Ink Fina EPD uses a TFT technology employing a thin glass substrate to deliver a display product that is extra light and thin. This especially
important for larger size mobile devices.
In R&D, E Ink’s accomplishments can hardly be ignored with several major recognitions from local and international awards. At its first
launch at the Society for Information Display (SID) in 2013, Spectra became an instant sensation for its brilliant
red-black-white display and received the Best in Show award. Another recognition worth noting is the next
generation Triton color e-paper that received the Outstanding Photonics award at 2013 Display Taiwan due to
its excelled product performance enabled by a successful integration of a front light module.
Operation Highlights in 2014
With the increasing popularity of EPD in various applications such as ESL, mobile phones, wrist watches and
electronic billboards, together with a comprehensive eco-system we have created with our business
partners, and driven by the growth of eReader devices in Europe, Japan and other emerging markets,
we are convinced the EPD markets will continue to grow in 2014. To achieve our performance
objectives, we will implement the following operation strategies in 2014:
(1) Strengthen the integration of production and R&D to decrease the defect rate
With the spirit of “developing forward-looking technologies”, E Ink continues our quest and R&D
efforts for critical technologies in EPD. We have had breakthroughs in areas such as front light,
touch, flexible and color EPD, which have been introduced for various market applications. As
the product applications continue to diversify, our clients have more diversified product designs
and specifications requirements, which translates into more challenges in our production. In
response, E Ink will strive to strengthen our organizational integration through organizational
reengineering and bring the manufacturing and R&D units closer to each other so as to overcome
the difficulties we may encounter in the production process, effectively reduce the defect rate in a
meaningful sense, and meet the client’s products requirements.
Vice Chairman: Felix Ho

04
(2) Optimize environmental, manufacturing process and improve labor force efficiency
E Ink continues to optimize our manufacturing process and the environment of our factory campus, while working hard to improve our labor
efficiency. Starting in 2013 we have significantly committed to the optimization and automation of our production lines to improve product
quality, shorten manufacturing time, and cut down the labor force required per unit output. Meanwhile, we are taking various measures to
improve the working environment and quality of life to strengthen our employees’ loyalty to the Company. We have seen encouraging results
and this endeavor will continue this year.
(3) Actively establish the EPD ecosystem
While striving to develop EPD, E Ink is also working hard to form a strategic alliance with suppliers in the upstream, downstream and peripheral
sectors, and engage in technology cooperation with our major component suppliers to build a complete EPD market with an ultimate goal of
pushing up our revenues and profits. Also, E Ink is collaborating with chip suppliers in a joint effort to develop new chip designs to make our EPD
products more price competitive and functionally more powerful.
(4) Provide diversified tailor-made services
E Ink has broad and in-depth technologies for e-paper devices. We have also had a number of advances in the development of new technologies
and new applications. In the future, E Ink will continue to offer clients more options with better product and technology choices and diversified
tailored-made services to further advance our operation performance.
(5) Continue to promote the TFT LCD niche markets
With regard to TFT LCD, E Ink will continue our strategy of a smaller production scale and OEM to reduce costs and strengthen competitiveness.
In addition, E Ink will carefully select our customers and application markets to avoid price wars on low profit products by developing our niche
markets in sectors such as aviation, vessels, automobiles, agricultural machinery, industrial control, medical services and entertainment.
(6) Continue patent cross licensing to expand the TFT LCD market based on our FFS technology
E Ink has entered into patent cross licensing agreements with well known display manufacturers including Japan’s Sharp, AU Optronics,
Chunghwa Picture Tubes, and Innolux Display. On the basis of equal treatment and mutual benefits, we are expanding the basis of our
cooperation with other display manufacturers to jointly expand the TFT LCD market based on the FFS technology.
Prospect
We have seen some preliminary accomplishments since our transformation efforts starting in 2012. With the ever growing popularity of the
Internet of Things and portable devices, energy saving and lightweight/thinness/high efficiency have become an unstoppable trend into the
future. We are optimistic about the broad applications of E Ink’s e-paper products in sectors other than eReader devices, such as ESL, mobile
phones and wrist watches for their characteristics such as paper-like, extra-low power consumption, durability, lightweight/thinness and sunlight
readability. This will eventually turn a lot of conceptual product designs into real end-user products. We expect in the near future the new
applications will continue to become more popular, which in turn will bring more advantages to our business operation.
We are sincerely thankful for our staff’s long-term contribution to the Company, and all the support and recognition from our clients, partners,
suppliers, shareholders and the public. We will do everything we can to lead all our staff to move along the set track and pragmatically
implement the growth strategies we created to accomplish our goals.
E Ink Holding Inc.
Felix Ho
Vice Chairman

05

>> Financial Highlights
06

07
Condensed Balance Sheet
Unconsolidated
Unit:NT$ thousands
Item 2009 2010 2011 2012 2013 31/03/2014
Current Assets
Not applicable
13,944,015 12,999,748
Not applicable
Property, plant and equipment 1,498,249 2,064,620
Intangible assets 49,790 45,038
Other Assets 29,132,178 27,551,124
Total Assets 44,624,232 42,660,530
CurrentLiabilities
BeforeDistribution
16,235,979 12,957,305
AfterDistribution
16,235,979 (Note)
Noncurrent Liabilities 4,545,900 3,934,138
Total Liabilities
BeforeDistribution
20,781,879 16,891,443
AfterDistribution
20,781,879 (Note)
Equity Attributable to Shareholders of the Parent
23,842,353 25,769,087
Capital Stock 10,809,897 11,409,897
Capital Surplus 9,686,700 10,073,700
Retained Earnings
BeforeDistribution
3,855,157 3,669,033
AfterDistribution
3,855,157 (Note)
Other equity (483,507) 642,351
Treasury shares (25,894) (25,894)
Total Equity
BeforeDistribution
23,842,353 25,769,087
AfterDistribution
23,842,353 (Note)
Note: Pending for shareholders’ meeting resolution

08
Consolidated
Unit:NT$ thousands
Item 2009 2010 2011 2012 2013 31/03/2014
Current Assets
Not applicable
18,520,690 14,216,444 12,998,251
Property, plant and equipment 10,194,178 9,835,142 9,612,495
Intangible assets 10,267,299 9,797,804 9,757,885
Other Assets 6,933,453 6,235,705 6,367,957
Total Assets 45,915,620 40,085,095 38,736,588
CurrentLiabilities
BeforeDistribution
14,945,285 8,561,571 7,882,317
AfterDistribution
14,945,285 (Note) (Note)
Noncurrent Liabilities 7,187,691 5,971,409 5,948,306
Total Liabilities
BeforeDistribution
22,132,976 14,532,980 13,830,623
AfterDistribution
22,132,976 (Note) (Note)
Equity Attributable to Shareholders of the Parent
23,842,353 25,769,087 25,084,497
Capital Stock 10,809,897 11,409,897 11,409,897
Capital Surplus 9,686,700 10,073,700 10,073,700
Retained Earnings
BeforeDistribution
3,855,157 3,669,033 2,622,961
AfterDistribution
3,855,157 (Note) (Note)
Other equity (483,507) 642,351 1,003,833
Treasury shares (25,894) (25,894) (25,894)
Non-Controlling Interests (59,709) (216,972) (178,532)
Total Equity
BeforeDistribution
23,782,644 25,552,115 24,905,965
AfterDistribution
23,782,644 (Note) -
Note:Pending for shareholders’ meeting resolution

09
Condensed Statement of Income
Unconsolidated
Unit: NT$ thousands (Except EPS: NT$)
Item 2009 2010 2011 2012 2013For the Year Ended
31/03/2014
Net Sales
Not applicable
13,359,855 14,427,628
Not applicable
Gross Profit 1,124,952 1,293,885
Income from Operations 1,489 59,302
Non-operating Income and Expenses
(568,143) (16,413)
Profit (Loss) Before Income Tax (566,654) 42,889
Net Income (Loss) (748,222) 29,303
Other comprehensive income (loss), net of income tax
(143,924) 1,131,137
Total Comprehensive Income (Loss) (892,146) 1,160,440
Earnings (Loss) Per Share(Note) (0.69) 0.03
Note:Based on weighted average shares outstanding in each year
Consolidated
Unit: NT$ thousands (Except EPS: NT$)
Item 2009 2010 2011 2012 2013For the Year Ended
31/03/2014
Net Sales
Not applicable
26,704,782 18,905,129 2,961,823
Gross Profit 2,819,788 3,018,681 (47,177)
Income from Operations (1,448,408) (1,648,317) (1,209,449)
Non-operating Income and Expenses
813,411 1,436,827 326,109
Profit (Loss) Before Income Tax (634,997) (211,490) (883,340)
Net Income (Loss) (1,082,407) (36,009) (979,988)
Other comprehensive income (loss) ,net of income tax
(140,248) 1,117,883 359,256
Total Comprehensive Income (Loss) (1,222,655) 1,081,874 (620,732)
Total Net Income Attributable to Shareholders of the Parent
(748,222) 29,303 (964,785)
Total Net Income Attributable to Shareholders of the non-controlling interests
(334,185) (65,312) (15,203)
Total Comprehensive Income Attributable to Shareholdersof the Parent
(892,146) 1,160,440 (603,303)
Total Comprehensive Income Attributable to Shareholdersof the non-controlling interests
(330,509) (78,566) (17,429)
Earnings (Loss) Per Share(Note) (0.69) 0.03 (0.85)
Note:Based on weighted average shares outstanding in each year

10
Auditors’ Opinions from 2009 to 2013
Year CPA Firm CPA Audit Opinon
2009 Deloitte & Touche Chih-Ming Shao, Shu-Wan Lin A Modified Unqualified Opinions
2010 Deloitte & Touche Chih-Ming Shao, Shu-Wan Lin A Modified Unqualified Opinions
2011 Deloitte & Touche Chih-Ming Shao, Shu-Wan Lin A Modified Unqualified Opinions
2012 Deloitte & Touche Shu-Wan Lin, Cheng Hung Kuo A Modified Unqualified Opinions
2013 Deloitte & Touche Shu-Wan Lin, Ya Ling Wong A Modified Unqualified Opinions
Financial Analysis
Unconsolidated
Item 2009 2010 2011 2012 2013 31/03/2014
Capital StructureAnalysis(%)
Debt Ratio
Not applicable
46.57 39.60
Not applicable
Long-term Fund to Fixed Assets Ratio
1,894.76 1,438.68
Liquidity Analysis (%)
Current Ratio 85.88 100.33
Quick Ratio 81.22 88.60
Times Interest Earned (5.37) 1.33
Operating PerformanceAnalysis
Average Collection Turnover 1.84 1.90
Days Sales Outstanding 198 191
Average Inventory Turnover 10.00 12.41
Average Inventory Turnover Days
1.14 1.16
Average Payment Turnover 36 29
Property, Plant and Equipment Turnover
8.92 6.99
Total Assets Turnover 0.30 0.33
ProfitabilityAnalysis
Return on Total Assets (1.53) 0.26
Return on Equity Attributable to Shareholders of the Parent
(2.89) 0.12
Pre-tax Income to Paid-in Capital Ratio
(5.24) 0.38
Net Margin (5.60) 0.20
Earnings Per Share (0.69) 0.03
Cash Flow (%)
Cash Flow Ratio 18.79 (14.58)
Cash Flow Adequacy Ratio 139.38 103.84
Cash Flow Reinvestment Ratio (0.51) (4.91)
LeverageOperating Leverage 197.27 5.91
Financial Leverage (0.02) (1.50)
11
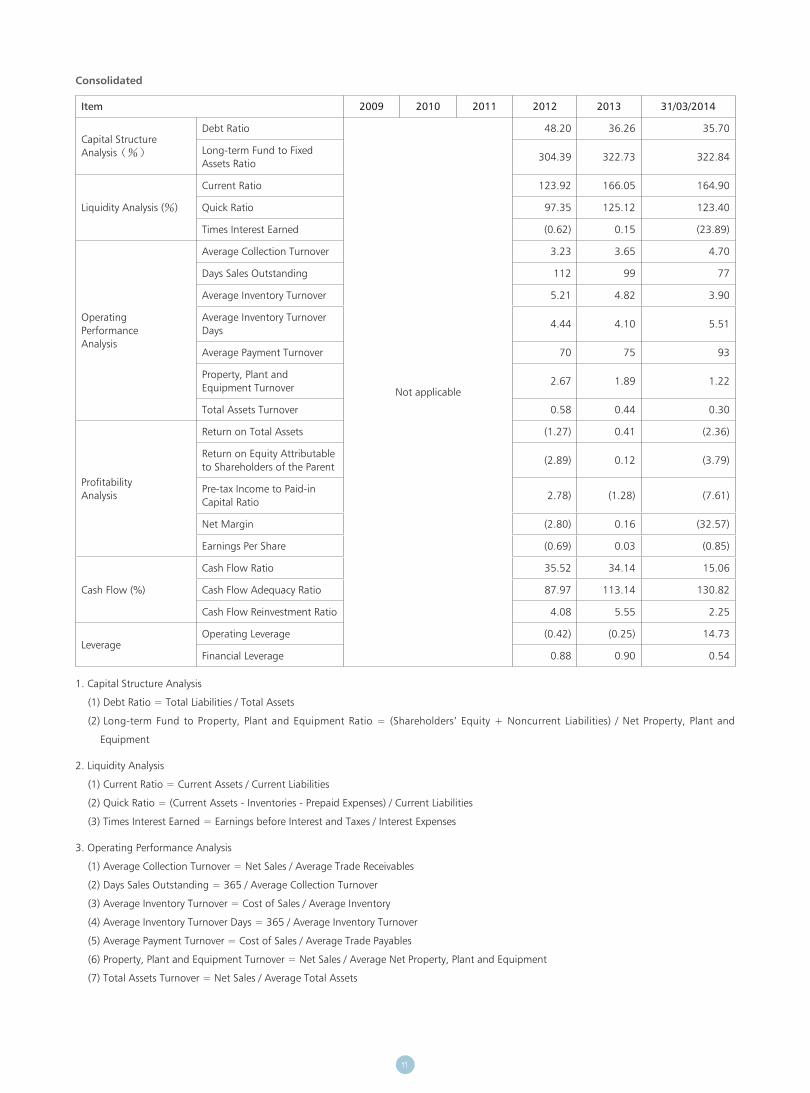
Consolidated
Item 2009 2010 2011 2012 2013 31/03/2014
Capital StructureAnalysis(%)
Debt Ratio
Not applicable
48.20 36.26 35.70
Long-term Fund to Fixed Assets Ratio
304.39 322.73 322.84
Liquidity Analysis (%)
Current Ratio 123.92 166.05 164.90
Quick Ratio 97.35 125.12 123.40
Times Interest Earned (0.62) 0.15 (23.89)
OperatingPerformanceAnalysis
Average Collection Turnover 3.23 3.65 4.70
Days Sales Outstanding 112 99 77
Average Inventory Turnover 5.21 4.82 3.90
Average Inventory Turnover Days
4.44 4.10 5.51
Average Payment Turnover 70 75 93
Property, Plant and Equipment Turnover
2.67 1.89 1.22
Total Assets Turnover 0.58 0.44 0.30
ProfitabilityAnalysis
Return on Total Assets (1.27) 0.41 (2.36)
Return on Equity Attributable to Shareholders of the Parent
(2.89) 0.12 (3.79)
Pre-tax Income to Paid-in Capital Ratio
2.78) (1.28) (7.61)
Net Margin (2.80) 0.16 (32.57)
Earnings Per Share (0.69) 0.03 (0.85)
Cash Flow (%)
Cash Flow Ratio 35.52 34.14 15.06
Cash Flow Adequacy Ratio 87.97 113.14 130.82
Cash Flow Reinvestment Ratio 4.08 5.55 2.25
LeverageOperating Leverage (0.42) (0.25) 14.73
Financial Leverage 0.88 0.90 0.54
1. Capital Structure Analysis
(1) Debt Ratio = Total Liabilities / Total Assets
(2) Long-term Fund to Property, Plant and Equipment Ratio = (Shareholders’ Equity + Noncurrent Liabilities) / Net Property, Plant and
Equipment
2. Liquidity Analysis
(1) Current Ratio = Current Assets / Current Liabilities
(2) Quick Ratio = (Current Assets - Inventories - Prepaid Expenses) / Current Liabilities
(3) Times Interest Earned = Earnings before Interest and Taxes / Interest Expenses
3. Operating Performance Analysis
(1) Average Collection Turnover = Net Sales / Average Trade Receivables
(2) Days Sales Outstanding = 365 / Average Collection Turnover
(3) Average Inventory Turnover = Cost of Sales / Average Inventory
(4) Average Inventory Turnover Days = 365 / Average Inventory Turnover
(5) Average Payment Turnover = Cost of Sales / Average Trade Payables
(6) Property, Plant and Equipment Turnover = Net Sales / Average Net Property, Plant and Equipment
(7) Total Assets Turnover = Net Sales / Average Total Assets
12
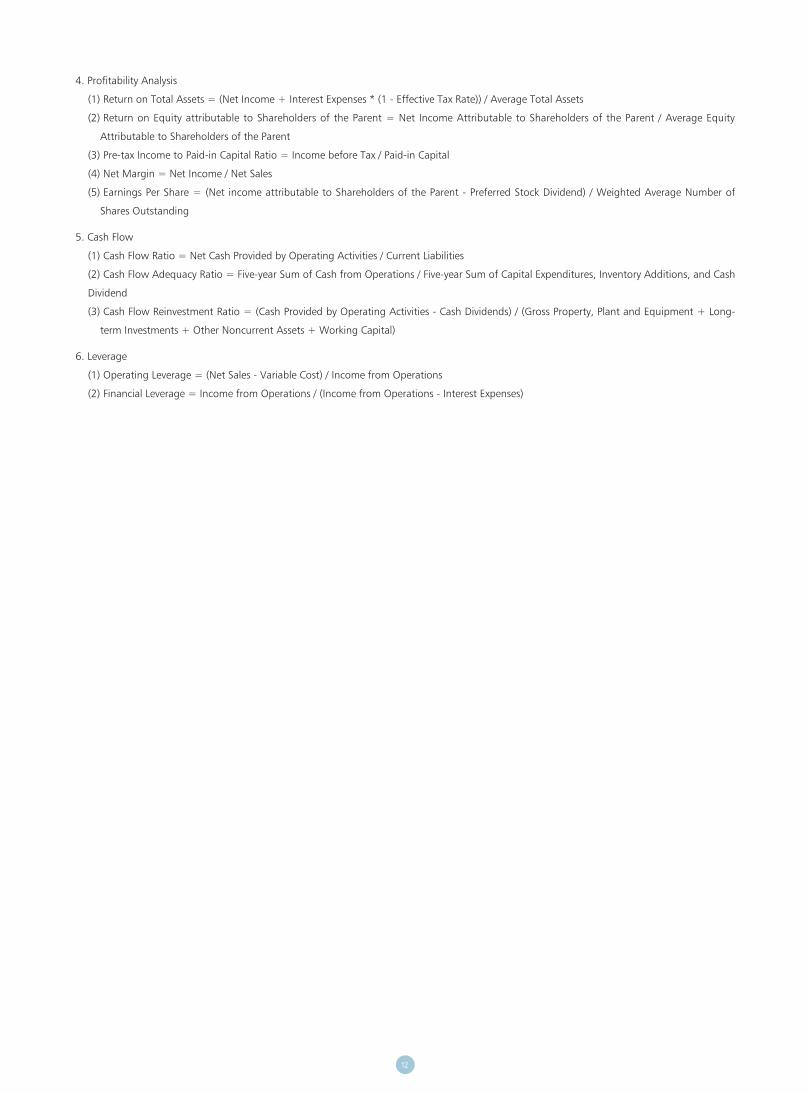
4. Profitability Analysis
(1) Return on Total Assets = (Net Income + Interest Expenses * (1 - Effective Tax Rate)) / Average Total Assets
(2) Return on Equity attributable to Shareholders of the Parent = Net Income Attributable to Shareholders of the Parent / Average Equity
Attributable to Shareholders of the Parent
(3) Pre-tax Income to Paid-in Capital Ratio = Income before Tax / Paid-in Capital
(4) Net Margin = Net Income / Net Sales
(5) Earnings Per Share = (Net income attributable to Shareholders of the Parent - Preferred Stock Dividend) / Weighted Average Number of
Shares Outstanding
5. Cash Flow
(1) Cash Flow Ratio = Net Cash Provided by Operating Activities / Current Liabilities
(2) Cash Flow Adequacy Ratio = Five-year Sum of Cash from Operations / Five-year Sum of Capital Expenditures, Inventory Additions, and Cash
Dividend
(3) Cash Flow Reinvestment Ratio = (Cash Provided by Operating Activities - Cash Dividends) / (Gross Property, Plant and Equipment + Long-
term Investments + Other Noncurrent Assets + Working Capital)
6. Leverage
(1) Operating Leverage = (Net Sales - Variable Cost) / Income from Operations
(2) Financial Leverage = Income from Operations / (Income from Operations - Interest Expenses)
13
COMPANY INTRODUCTIONE Ink Holdings Inc. started in 1992 and manufactures Electronic Paper (ePaper based on Electrophoretic technology) and TFT LCD (Thin Film
Transistor based Liquid Crystal Display). E Ink is the world leader in the global ePaper industry and one of the High-Tech Subsidiaries of the YFY
Group.
The YFY Group includes the largest professional paper manufacturing company in Taiwan, and was the first in the Greater China region to
establish an R&D center for paper manufacturing.
The founding of E Ink Holdings began with the YFY Group’s rich history in paper manufacturing and the ancient Chinese history of paper
inventions. In the early 1990’s, Mr. SC Ho, the founder of YFY group, realized that digital publishing was an inevitable trend and that paper and
printing might eventually be replaced by paperless electronic devices. He tasked his team to find new technologies to bridge the gap between the
printed page and digital content and delivery methods. This led to investments by the YFY Group in LCD technology and the continued research
into future display technologies that could realize this vision.
In 1992 E Ink Holdings Inc. (formerly Prime View International) was established as the first TFT LCD company in Taiwan, focusing on high quality
small-to-medium-sized TFT LCDs. In 2002 E Ink Holdings established Transcend Optronics in YangZhou, China in order to match the increasing
demand in the TFT LCD industry.
In 1997, E Ink Corporation was spun out of the MIT Media Lab to commercialize electronic ink and ePaper technology using TFTs from Philips
Electronics. Seeing the potential of this new display medium, in 2005 E Ink Holdings acquired the ePaper business unit from Philips, and together
with E Ink Corporation, launched the first EPD eBooks into the market. To increase capacity as the eReader market expanded, E Ink Holdings
merged with the Korean TFT LCD company, Hydis Technologies, in 2008. In 2009, YFY Group authorized the acquisition of E Ink Corporation by
E Ink Holdings to further integrate and expand the ePaper supply chain.
The demand for ePaper has increased dramatically thanks to the booming eReader industry. With the leading ePaper technology, high quality
products and outstanding supply chain, E Ink Holdings is now the world’s leading supplier of ePaper modules to global top tier eReader brand
names like Amazon, Sony, Hanvon, Barnes & Noble, and has a global market share of 90+%.
E Ink Holdings’corporate philosophy aims to deliver revolutionary products, excellent user experiences, and environmental benefits through
advanced technology development.
With new products like color, flexible, and touch-enabled ePaper, E Ink Holdings will lead the ePaper industry into a new era.
14
Yangzhou Qifu Electronics
Corp.
Transmart Electronics (Yangzhou)
Transyork Technology
Yangzhou Ltd
Yangzhou Qidi Electronics
Corp.
Effect Media International Investment
Corp
Yangzhou Aurac-tech Co.,
Limited
Rich Optronics (Yangzhou)
Co., Ltd.
Transcend Optronics
(Yangzhou) Co., Ltd.
PVI (America), Inc. Front Gate
Interational Corp.
Kai Yu Investment Co., Ltd.
SiPix Technology,
Inc.
SiPix Imaging Inc.
Ruby Lustre Ltd.
PVIInternational
Corp.
Dream PacificInternational
Corp.
Hydis Technologies
Co., Ltd.
Ultraview Technology
limited
Global SuccessInternationalHoldings Ltd.
Lucky JoyHoldings Ltd.
LeadingConceptLimited
MobilioLimited
Hydis JapanCo., Ltd.
HydisShenzhen Ltd.
Hydis Taiwan Inc.
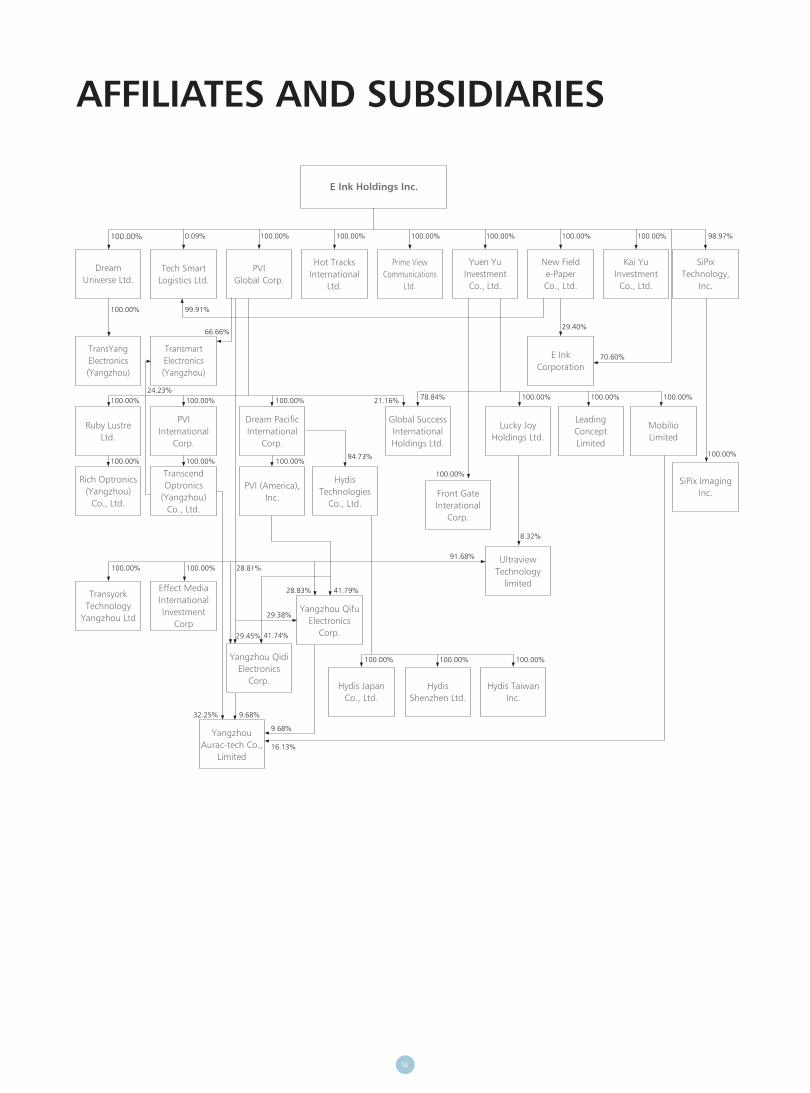
Tech Smart Logistics Ltd.
PVIGlobal Corp.
Hot Tracks International
Ltd.
Prime View Communications
Ltd.
Yuen Yu Investment Co., Ltd.
New Field e-Paper Co., Ltd.
E Ink Corporation
DreamUniverse Ltd.
TransYang Electronics (Yangzhou)
E Ink Holdings Inc.
100.00%
100.00%
100.00%
100.00% 100.00%
100.00%
100.00%
100.00% 100.00% 100.00%
100.00%100.00%
100.00%
41.79%
29.38%
41.74%29.45%
28.81%
28.83%
9.68%32.25%
9.68%
16.13%
100.00%
100.00%
100.00%
91.68%
94.73%
100.00%78.84%21.16%24.23%
0.09%
99.91%
66.66%
100.00% 100.00% 100.00% 100.00% 100.00%
29.40%
8.32%
100.00%
70.60%
100.00% 98.97%
AFFILIATES AND SUBSIDIARIES

15
>> COMPANY ORGANIZATION
2013.12.31
Legal Div.
Board of Directors
ESL, SDC &Industrial
BU
NoveltyBU
LCD BUE-Reader
BUOperations
Center
Strategy Integration
Center
Finance & Admin.Center
Business Dev.
Center
R&D Center
Corporate Marketing
Center
Chairman / Vice Chairman
Chief Executive Officer
President
Audit Office

16
OFFICE AND FUNCTIONS
● GM Office
Corporate strategies planning and execution, internal operation control, public safety and environmental protection as well as patent strategies
management.
● Legal Affairs Div.
Corporate legal affairs and documentation management and compliance.
● Finance Center
Human resources, public affairs management and services, finance, accounting, technology system integration and management, operation
management planning and execution.
●Operating Center
Purchasing for material of products, equipment and construction projects, material requirement planning, bonded warehouse and logistics
management, quality and reliability management, marketing, public relations and manufacturing plans coordination and integration.
● eReader BU
In charge of sales to eReader customer, customer business development and operation supervision, support customers’ new product
development, integrate, execute and communicate business plans for eReader market.
● R&D Center
Patent portfolio planning, R&D of product technology, release products to masss production, feedback and analysis of product and technology
issues, manage and advance E Ink technology, product design and development of EPD system products.
● Corporate Marketing Center
Plan, integrate and execute corporate marketing strategy related the Company, E Ink products and partners, and manage external public
communications.
● Commercial Development Center
Develop mid- and long-term forward looking products, create new business to improve overall company products competitiveness.
● LCD BU
In charge of LCD product sales, customer business development and operation supervision, support customer new product mass production
verification and product development.
● ESI BU
Development, design, manufacturing and sales of E Ink products for ESL, segmented and industrial markets and applications.
● Novelty BU
Development, design, manufacturing and sales of ePaper application products.
● Strategy Integration Center
In charge of certifying new product specifications, planning product management, and setting up the product management platform.

17
MANAGEMENT TEAM
TITLE / OFFICE NAME On-board Date (Note)
Interim CEO Felix Ho 16-03-2012
Executive Advisor Scott Liu 07-01-2003
President C. C. Tsai 30-07-2010
Chief Operating Officer C.H. Chiu 05-05-2008
Deputy Chief Business Development Officer Johnson Lee 16-02-2006
Chief Financial Officer (Finance & Admin. Center) Eddie Chen 01-08-2012
Chief Strategy Officer Frank Ko 02-12-2013
Vice President (R&D Center) James Hong 15-03-2010
Vice President (R&D Center) Yung-Sheng Chang 01-02-1996
Vice President (Audit office) Mico Yu 06-02-2012
Assistant Vice President (Novelty BU) Wayne Huang 24-08-1998
Assistant Vice President (Operating Center) Jui-Pin Wu 17-07-2001
Assistant Vice President (Operating Center) Shaun Chen 16-11-2009
Assistant Vice President (Product Development Div.) Tung-Liang Lin 25-05-1995
General Counsel (Legal Div.) Suzanne Chou 11-10-2010
Assistant Vice President (Oversea Project) Jason Lin 07-10-2009
Assistant Vice President (Oversea Project) Luke Chen 01-10-2010
Assistant Vice President (Oversea Project) Lloyd Chen 15-01-2010
Assistant Vice President (LCD BU) Jeff Chang 07-06-2011
Assistant Vice President (Operating Center) Mano Lo 09-12-2013
Lead Of Accounting (Finance & Admin. Center) Jason CC Lin 26-03-2012
Note: On-board date means the official date joining EIH.
DIRECTORS AND SUPERVISORS
TITLE NAME Date Elected
Vice Chairman Representatives of Cheng-Yu Co., Ltd.Felix Ho
24-06-2011
Director Representatives of Cheng-Yu Co., Ltd.Scott Liu
24-06-2011
Director Representatives of YFY Inc.Chuang-Chuang Tsai
24-06-2011
Director Representatives of Cheng-Yu Co., Ltd.Shou-Chung Ho
24-06-2011
Director Representatives of Cheng-Yu Co., Ltd.Johnson Lee
24-06-2011
Director Representatives of YFY Inc.Ta-Shau Shih
24-06-2011
Director Representatives of YFY Inc.Chun-Chieh Huang
24-06-2011
Independent Director Ten-Chung Chen 24-06-2011
Supervisor Representatives of Yuen Foong Paper Co., Ltd.Li-Chun Hsiao
24-06-2011
Supervisor Representatives of Yuen Foong Paper Co., Ltd..Ching-Yuan Chang
24-06-2011
Supervisor Ching-I Wang 24-06-2011
18
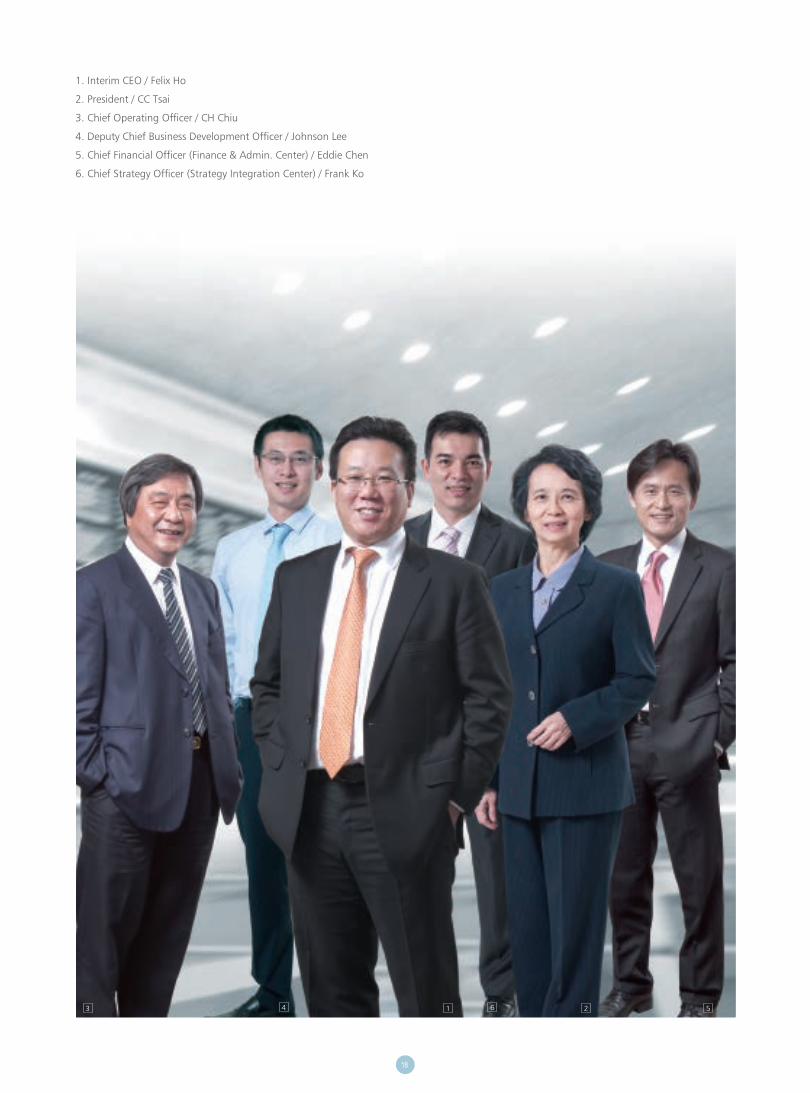
1. Interim CEO / Felix Ho
2. President / CC Tsai
3. Chief Operating Officer / CH Chiu
4. Deputy Chief Business Development Officer / Johnson Lee
5. Chief Financial Officer (Finance & Admin. Center) / Eddie Chen
6. Chief Strategy Officer (Strategy Integration Center) / Frank Ko
14 63 2 5

19
>> REVIEW OF OPERATIONS
BUSINESS DESCRIPTION
Main Business
E Ink Holdings’ main business is the research,
development, manufacture and sale of electronic
displays using thin film transistors systems, and all processes associated with TFTs, particularly electronic paper displays (ePaper display, EPD), and
the Thin Film Transistor Liquid Crystal Displays (TFT-LCD).
Sales from display product sales accounted for 94.65% of company revenue in 2013, with ESL and other products accounting for 5.35% of
revenue.
Main Products
E Ink Holdings has two main product categories. One category is ePaper display products which are mainly used for eReaders, electronic shelf
labels (ESL), mobile phones, and watches. The second category is small and medium size TFT-LCD panels and modules under 12.1 inches. Main
usages for TFT-LCDs are for niche market applications, such as vehicles and entertainment systems, ship and air navigation, security monitoring
systems, medical instruments, video phones, cameras, portable DVDs, digital photo frames, pachinko, industrial instruments and POS.

20
New Product Development
E Ink Holdings is focusing on four main areas of R&D:
(1) Development of new EPD and TFT-LCD modules aimed at meeting customer requirements in existing markets and required to expand into
new market applications.
(2) Product development for special market applications such as industrial, marine, and automotive displays.
(3) Development of new manufacturing processes and use of new materials to improve the features of existing products to satisfy market trends
and enhance product competitiveness.
(4) Strengthening of international cooperation in manufacturing, resources and technology to develop a new generation of low-cost, low-power
display technologies in order to lay the basis for sustainable development.
E Ink Holdings will continue to supply new products to customers in the existing market, and will use integrated marketing, design and
manufacturing capabilities to develop technologies to enter new markets.
E Ink Holdings is committed to provide on-site technology services in major markets, such as America, China, Japan and Europe. This enables
us to provide a higher level of customer satisfaction by responding more effectively and quickly and to assist customers in developing new
applications. This also allows E Ink to evaluate market requirements across regions and develop new product solutions through keen observation,
innovative strategic thinking, and suitable product developments.
INDUSTRY OVERVIEW
Electronic Paper Display (EPD) Industry
Electronic paper was developed in the early 1970s. The basic electrophoretic technology, now known as electronic ink, was established at the
Massachusetts Institute of Technology in 1969 when tackling the dying particle condensation problem with “micro capsulation technology”.
E Ink Corporation was founded in 1997 to commercialize electrophoretic ink. After several years of R&D, sample development and small scale
production, electronic paper technology entered mass production in 2008. Further developments in electronic paper manufacturing technologies
have led to an electronic paper portfolio that includes color, flexible, large-format and high resolution displays which include writable and
touchable screens. These rich features enable development of products for different market applications such as eReaders, smart cards, electronic
tags, clocks, phone button display, advertising billboards and a diverse range of applications.
Commercialization of ePaper displays began in 2000 when the TFT-LCD panel industry was experiencing rapid growth. In spite of EPD’s benefits
of thinness (as paper), super low power consumption, wide viewing angle, and no need for backlighting, far fewer manufacturers entered this
market when compared with those interested in TFT-LCD and AMOLED display technologies. In addition, E Ink Corporation had mastered the
complex process for making electrophoretic ink and their technology is under IP protection, Consequently, E Ink Holdings became the world’s
leading supplier of EPD products for years. However, after Amazon introduced its Kindle eReader, the market trend changed drastically and
expanded EPD’s potential. Its future became even more attractive when AUO, the top leader of TFT-LCD industry, announced its entry into the
EPD market with its acquisition of SiPix Technologies. Bridgestone decided to exit the market before bringing their product to mass production.
In 2012, E ink Holdings acquired a controlling interest in SiPix maintaining its position as a leading supplier of epaper displays and giving it the
capability to expand into more markets. This also makes Taiwan the leader in global electronic paper industry.
Status and development of the small and medium sized TFT LCD product
Global demand for small and medium sized LCDs is still mainly driven by cell phones and tablet computers. The total shipment volume for cell
phone displays continues to grow by 4.2% compared to that of year 2012. For tablet computers, dimensions have started to shift towards larger
sizes in 2014. With the exception of Apple, which may be releasing a 12.85-inch tablet computer, both Samsung and Asus are moving towards
12-inch products. Google started off by releasing the 8.9-inch Nexus, and the main competition would be Kindle Fire HDX 8.9 with very similar
specifications. In addition to similar tablet dimensions, both of these products also have high resolutions that exceed 2K. The need for wide
viewing angle technologies means that IPS and FFS will become more common.
21
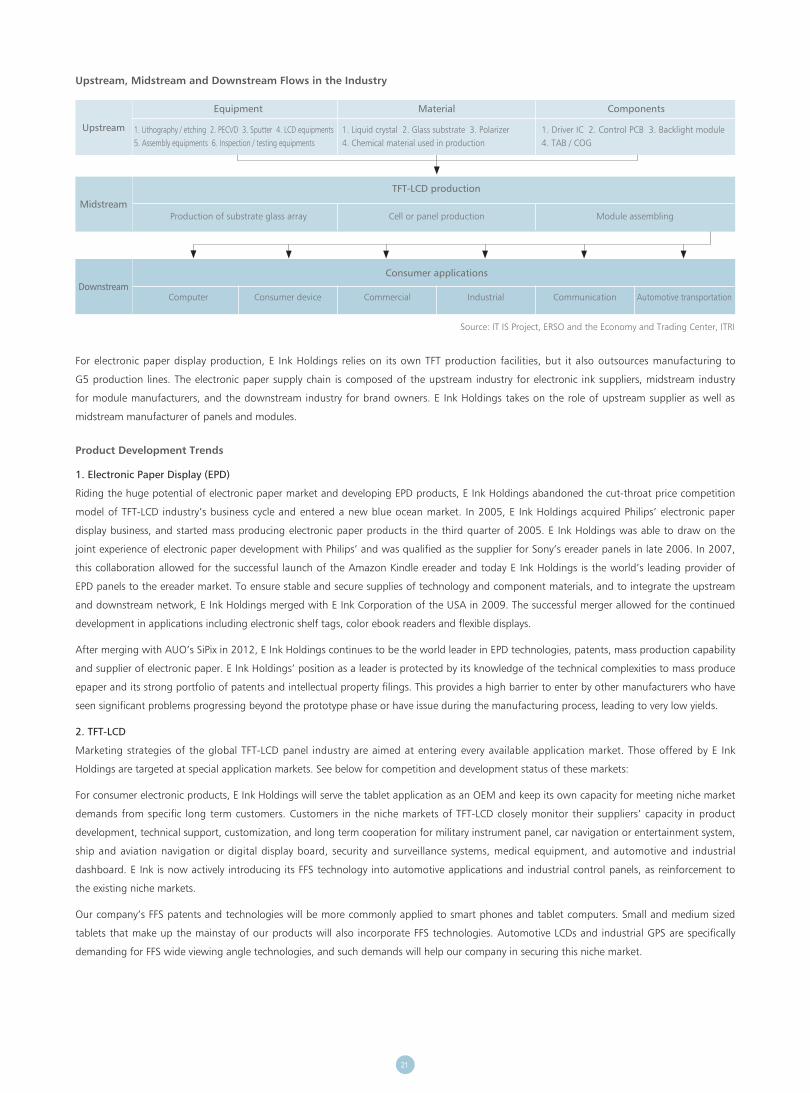
Upstream
Equipment Material Components
1. Lithography / etching 2. PECVD 3. Sputter 4. LCD equipments 5. Assembly equipments 6. Inspection / testing equipments
1. Liquid crystal 2. Glass substrate 3. Polarizer 4. Chemical material used in production
1. Driver IC 2. Control PCB 3. Backlight module 4. TAB / COG
Midstream
TFT-LCD production
Production of substrate glass array Cell or panel production Module assembling
Source: IT IS Project, ERSO and the Economy and Trading Center, ITRI
DownstreamConsumer applications
Computer Consumer device IndustrialCommercial Communication Automotive transportation
Upstream, Midstream and Downstream Flows in the Industry
For electronic paper display production, E Ink Holdings relies on its own TFT production facilities, but it also outsources manufacturing to
G5 production lines. The electronic paper supply chain is composed of the upstream industry for electronic ink suppliers, midstream industry
for module manufacturers, and the downstream industry for brand owners. E Ink Holdings takes on the role of upstream supplier as well as
midstream manufacturer of panels and modules.
Product Development Trends
1. Electronic Paper Display (EPD)
Riding the huge potential of electronic paper market and developing EPD products, E Ink Holdings abandoned the cut-throat price competition
model of TFT-LCD industry’s business cycle and entered a new blue ocean market. In 2005, E Ink Holdings acquired Philips’ electronic paper
display business, and started mass producing electronic paper products in the third quarter of 2005. E Ink Holdings was able to draw on the
joint experience of electronic paper development with Philips’ and was qualified as the supplier for Sony’s ereader panels in late 2006. In 2007,
this collaboration allowed for the successful launch of the Amazon Kindle ereader and today E Ink Holdings is the world’s leading provider of
EPD panels to the ereader market. To ensure stable and secure supplies of technology and component materials, and to integrate the upstream
and downstream network, E Ink Holdings merged with E Ink Corporation of the USA in 2009. The successful merger allowed for the continued
development in applications including electronic shelf tags, color ebook readers and flexible displays.
After merging with AUO’s SiPix in 2012, E Ink Holdings continues to be the world leader in EPD technologies, patents, mass production capability
and supplier of electronic paper. E Ink Holdings’ position as a leader is protected by its knowledge of the technical complexities to mass produce
epaper and its strong portfolio of patents and intellectual property filings. This provides a high barrier to enter by other manufacturers who have
seen significant problems progressing beyond the prototype phase or have issue during the manufacturing process, leading to very low yields.
2. TFT-LCD
Marketing strategies of the global TFT-LCD panel industry are aimed at entering every available application market. Those offered by E Ink
Holdings are targeted at special application markets. See below for competition and development status of these markets:
For consumer electronic products, E Ink Holdings will serve the tablet application as an OEM and keep its own capacity for meeting niche market
demands from specific long term customers. Customers in the niche markets of TFT-LCD closely monitor their suppliers’ capacity in product
development, technical support, customization, and long term cooperation for military instrument panel, car navigation or entertainment system,
ship and aviation navigation or digital display board, security and surveillance systems, medical equipment, and automotive and industrial
dashboard. E Ink is now actively introducing its FFS technology into automotive applications and industrial control panels, as reinforcement to
the existing niche markets.
Our company’s FFS patents and technologies will be more commonly applied to smart phones and tablet computers. Small and medium sized
tablets that make up the mainstay of our products will also incorporate FFS technologies. Automotive LCDs and industrial GPS are specifically
demanding for FFS wide viewing angle technologies, and such demands will help our company in securing this niche market.

22
3. Electronic Shelf Label
Shelf labels made using electronic paper are lightweight and energy saving. These labels provide usability features matching that of ordinary
paper, while allowing users to dynamically update prices from any location in a retail store. Through the use of a computer network, users
are able to accurately update pricing instantaneously. The use of electronic paper labels also corresponds to the trend of goods management
automation in large supermarkets and warehouses. Using electronic paper in labels will reduce the risks of wrong pricing and labeling, allow the
store managers to instantly respond and update the promotion prices right from the floor, and facilitate price tag replacement over the network.
In this highly competitive market, electronic labels effectively cut down the labor cost from manual label management. The use of computer
networks for pricing updates can also reduce the amount of manpower required for manual updates. The ability to quickly update pricing
provides brick and mortar stores to more effectively compete with online retailers by being able to rapidly respond to price changes and different
merchandizing techniques used by online retailers. Bistability, one of the most important characteristics of electronic paper displays, means that
electronic paper displays (EPDs) only consume electricity when reading and writing data. So long as the information on the EPD is unchanged,
no energy is consumed. This helps satisfy the current trend for energy saving and greatly decrease the cost for electronic labels in supermarkets.
Additionally, when compared to other displays, data on EPDs can still be seen at viewing angles that approach 180-degrees, allowing information
to be seen further away or at slanted viewing angles. At the current stage, several supermarkets in Europe, including TESCO, have successively
introduced the electronic shelf labeling system into their floor operations. In order to meet the demand for electronic labels, we have also
developed low temperature electronic paper for goods stored in fridges or freezers as well as black, white and red electronic paper that can be
used demarcate special pricing or sales promotions in addition to conventional black and white labels.
4. Smart Display Card
Electronic paper includes numerous pioneering and innovative technologies such as bistability, where data can be displayed without consuming
electricity as well as the unique feature of flexibility. EPDs are also resistant to pressure, unlike LCDs which may crack or break when pressed.
When used in IC cards, EPDs may be used to show the balance or bonus points accumulated in the card, and provide functions such as
dynamic passwords. IC chips can also be embedded in cards for data security and provide features such as memory, verification, encryption
and decryption, and data transfers. Smart Display Cards have now become a major trend for the modern financial IC card industry. We are now
working with SinoPac Bank to launch OTP credit card. The system offers enhanced transaction security. We are also working with Kaohsiung MRT
to launch the Smart Store-Value Card, which offers the users an easy way to check the balance.
Competition and Positioning
In 2013, E Ink Holdings continued to research and develop electronic paper products and technologies. In addition to continuous development
of the existing black- and-white electronic paper modules and products, we have also released other electronic paper products that integrate
for electronic labeling, flexibility, color, and touch-control. We have also continued to actively expand our production capacities to solidify our
leading position in the electronic paper market. For TFT-LCD products, we will continue to focus on the development of touch technologies,
FFS wide-angle technologies, and high-quality displays (military or automotive standards). To maintain its lead in the highly competitive market
of display technology and ensure sustainable development of the Company, we focus on the special product needs of our niche customers, and
invested a total of NT$ 1.57 billion and NT$ 422 million in 2013 and the first quarter of 2014.
As the new 6th, 7th and 8th generation production lines continue to expand, the older facilities will convert to the production of small-and
medium-sized TFT-LCDs, thus increasing the total production capacity of small and medium sized products. This will lead to increased capacity
and competition in small-and medium-sized TFT-LCD. In addition to being used in consumer electronics applications, small- and medium-
sized TFT-LCD are also used for many special applications; these applications require higher level of integration and are often produced in
small quantities and high variety. In these special application markets, E Ink Holdings keeps on providing its small-and medium-sized TFT-LCD
products for customers with special requirements based on its accumulated experiences and long term relations. In spite of its limited production
capacities, E Ink Holdings still maintains strong competitiveness in these special application markets offering our customers on-demand
customization services.
RESEARCH AND DEVELOPMENT OVERVIEW
In 2013, E Ink Holdings continued to research and develop electronic paper products and technologies. In addition to the continuous
development of the existing black and white electronic paper modules and products, we have also released other electronic paper products
that integrate for electronic labeling, flexibility, color, and touch-control. We have also continued to actively expand our production capacities
to solidify our leading position in the electronic paper market. For TFT-LCD products, we will continue to focus on the development of touch
23
technologies, FFS wide-angle viewing technologies, and high-quality displays (military or automotive standards). To maintain our lead in the
highly competitive display technology market and ensure the sustained development of the Company, we focused on the special product needs
of our niche customers, and invested a total of NT$ 1.57 billion and NT$ 422 million in 2013 and the first quarter of 2014.
Electronic Ink Technology
E Ink CartaTM is the newest generation of mass produced electronic ink products, and has the highest surface reflection to date with a 50%
improvement in contrast ratio and 22% improvement in reflection when compared with the last generation of E Ink products. Texts and images
are displayed in a crisp and detailed manner, allowing users to peruse the contents as comfortably as they would reading off printed paper.
Carta is lightweight, environmentally friendly, and may be comfortably read for extended periods of time, making it suitable for eReaders, digital
dictionaries, reference books, magazines and other future products to replace printed paper. Carta allows readers to enjoy the convenience of
digital products without sacrificing the comfort provided by printed materials.
Color Electronic Paper - E Ink TritonTM
Electronic paper displays are not limited to black and white with gray scale. E Ink’s Triton display merges all the benefits found in the black and
white product with a color filter array to offers a color EPD product with 4096 colors and 16 levels of gray scale. Triton EPD can support the color
requirements for graphs, maps, photos, comics, and advertisements. In addition, the use of touch and pen input allows color EPD products to
meet consumers’ needs for browsing web pages, clicking menu items, making notations, and viewing simple animations. Triton also has market
applications for large area signage and industrial applications. To improve the contrast of Triton displays, E Ink Holdings also offers a front light
option.
Three-color E Ink technology
E Ink SpectraTM is the newest generation of mass produced multi-colored E Ink product. In addition to black and white color pigments, Spectra
includes an additional red color pigment that makes it suitable for electronic labels and advertising panels. Retailers can easily make use of
electronic labels to accurately replace product pricing and draw the attention of potential customers. Electronic labels with red backgrounds can
draw consumer attention to achieve sales objectives and greatly improve product marketability.
Flexible electronic paper
Plastic-based TFTs allow the end product to be substantially lighter and thinner than products using glass-based TFTs. Glass-based TFTs can be
fragile while plastic-based TFTs can result in a more rugged end product with less breakage in the electronics due to drops or stress tension.
We have developed flexible electronic paper, E Ink MobiusTM, that has similar applications to glass backed electronic paper for mobile devices and
consumer electronics.
The weight savings with plastic TFTs can make a significant difference in an end products’ specifications: a product with a 10.7” LCD-based
display weighs an average of 1.44 pounds; a product with an 11.4” E Ink display with a plastic TFT and similar internal components can weigh
only 17 ounces. As product designers consider utilizing larger displays for eTextbooks and eNewspapers, this weight savings can allow for larger
devices to be held easily in one hand and will make a big difference in the weight of a student’s backpack.
E Ink Holdings is now providing flexible electronic paper display modules to a leading brand for development of a large size electronic reader
product. E Ink Holdings is now working extensively with multinational companies in plastic backed flexible electronic paper displays and modules
for the development and mass production of larger electronic readers. Since its release, E Ink is now working closely with several renowned
multinational companies to develop and manufacture plastic-backed Mobius electronic paper display modules, and this product has been
received with overwhelming responses in the market.
Touchable Electronic Paper Display
In addition to commonly adopted capacitive touch control technology, E Ink Holdings is actively working with other technology companies to
develop e-touch for electronic paper displays. These new modules not only maintain the visual benefits of EPD but also offer many other design
benefits to facilitate more possibilities in new product developments. E Ink Holdings continues to fund research and development in this area.
Super High Resolution EPD products
The resolution of commercially available e-readers typically falls in the range of 150 ~ 200 ppi (pixel per inch). While this is adequate for text
based leisure devices, some business settings requiring the use of complex charting and image rending, and customers may need a resolution of

24
300 ppi or even higher. In 2011, E Ink launched 9.7-inch and 11.5-inch high-definition black-and-white electronic paper modules with 300 ppi,
which have been offered to several customers for designing-in applications.
Fringe Field Switching (FFS) technology
FFS offers the widest viewing angle available currently for LCD technologies. Its bright and wide viewing angle characteristics are made possible
by rotating the interior electrode surface of almost uniformly aligned liquid crystal molecules with boundary electric fields. It combines features of
horizontal and vertical wide viewing angles to offer up to 180 degrees viewing angle. Reflection components in the array create a bright display
even under strong ambient lighting. This makes our FFS technology a perfect combination of low power consumption, high transmittance rate,
high brightness, fast response, and high color reproduction. FFS LCDs are now the main display panels for smartphones. FFS is currently used in
smartphones, tablets, and automotive electronics. With continuous improvements, it may be adopted in the industrial applications as well.
BUSINESS DEVELOPMENT OBJECTIVES
Short-Term Business Development Objectives
1. Follow product trends to provide customers with upgraded new products, support customers during their product design life cycle, effectively
share initial development costs, and diversify the applications using E Ink displays.
2. Improve product quality for adoption and acceptance by more leading global companies.
3. Enhance manufacturing yield and production capacity at panel and module plants.
4. Establish local support services for the United States, Europe, China and Japan, and strengthen distribution channels in these markets.
5. Continue to penetrate new application markets.
Long-Term Business Development Objectives
1. Seek international cooperation to develop advanced display technologies and associated applications. Continued development and
improvement of advanced technology to ensure E Ink’s leading role in the technology supply chain.
2. Develop long term and effective marketing channels for smooth interactions between production and technology units to effectively
support overall and individual growth and to create win-win developments.
3. Maintain a leading position in product development.
MARKET OVERIVEW
Market and supply-demand Analysis
1. Analysis of the electronic paper market
The market for electronic paper is currently growing. The applications of electronic paper applications are slowly expanding to other products
in addition to electronic readers. This trend is especially significant in 2013. In the past, E Ink Holdings has been regarded by outsiders as a
company that manufactures electronic readers. We are now a company capable of transforming innovative designs and products into numerous
possibilities. Electronic paper provides many advantages such as low energy consumption, comfortable reading, and flexibility. It can be widely
applied for many different products and meet various customer special requirements.
(1) Market for the electronic readers
The market for e-books and electronic readers is stable as the debate on the replacement of electronic readers by tablets has gradually
subsided. In 2013, our customers began to release new electronic readers, and information provided by market surveillance institutions
provides additional proof. Firstly, E Ink Holdings customers have continuously released electronic readers, including Kobo Aura HD by Rakuten,
Tolino Shine by Deutschen Telekom, and Kindle Paperwhite by Amazon, which utilizes the newest Carta electronic paper technology.
Additionally, information from market surveillance firms also supports this argument. According to the Pew Research Center, electronic
readers are still the most popular e-book readers and are also becoming more ubiquitous. Currently, over one-third of American adults own
an electronic reader. With the release of various new products for commercial applications, the market for electronic readers has also begun
to diversify.

25
SONY announced in the second quarter of 2013 that it would begin to market DPS-T1 commercial e-reader in the 4th quarter of 2013.
DPS-T1 will utilize a large 13.3” electronic paper display and target business markets such as legal, medical, and real estate industries that
require the processing of large amounts of documents and information. The first batch was sold out within a couple of days. Hence, E Ink
Holdings remains optimistic for the market of electronic readers in 2014. According to the study from IHS market surveillance institution, the
market for electronic readers will range from 12-15 million units.
(2) Electronic shelf labels
After successfully securing the market of electronic readers, E Ink launched several investment projects for development of other applications.
Currently, only a small portion of the retail market is using electronic shelf labels. Most are still using paper labels to display product
information. This situation is undergoing subtle changes as the applications for electronic shelf labels are expanding rapidly. Currently, the
biggest users are retailers in the European Union, followed closely by those in the Asian and North American regions. This growth is partly
driven by laws that require accurate pricing as well as market competition. In order to compete with online shops, retailers are forced to adapt
to rapid price changes in response to market conditions. By using electronic shelf labels, retailers can ensure the accuracy and correctness of
their prices and change prices as quickly as their online competitors.
(3) Other markets
Since 2012, E Ink Holdings has been committed to expanding beyond the market of electronic readers. In 2013, we saw E Ink electronic paper
displays being adopted in new products and in new markets.
A. Mobile devices
E Ink EPD displays can be widely used for smartphones. The first electronic paper phone, Yota Phone, was regarded as the biggest
innovation in cellular phones since the release of the iPhone series, and has received a lot of media attention. The first generation
YotaPhone was released to mass production in 2013, and has been sold in 5 countries in Eastern and Western Europe. The new generation
of YotaPhone was formally announced in the Mobile World Congress (MWC) in February 2014 and continues to receive attention from the
media.
In 2013, E Ink electronic paper received a lot of media attention because it was incorporated into the release of YotaPhone.. We expect
sales volume to keep increasing with the announcement of the 2nd generation of YotaPhone in 2014. Additionally, more and more cellular
phone designers have contacted E Ink Holdings to inquire about possible collaborative projects with electronic paper applications.
B. Transport and logistics
Vanguard ID integrated E Ink EPDs into electronic baggage tags in 2013, drawing attention from many airlines. Electronic baggage
tags are poised to replace printed baggage labels and allow airlines to track passenger luggage to reduce the possibility and cost of lost
baggage.
C. Health, medication, sports, and recreation
E Ink EPDs are also being used in the newest blood glucose meters produced by famous international pharmaceutical companies. This
device was announced in Europe in the 4th quarter of 2013. IHS and other market surveillance firms believe that the healthcare and
pharmaceutical market is poised for tremendous growth in the future in terms of number of devices and value of the products.
D. Large dimension advertisement panels
This applications market is growing slowly. E Ink EPDs have the advantages of low energy consumption, lightweight, and visibility
under strong sunlight, making them suitable for large dimension advertisement panels. A large electronic paper digital display has been
installed in the North Delegate Lounge within New York’s UN headquarters. The display measures 6 meters wide and 1 meter high, and is
composed of 231 pieces of display panels arranged together. Electronic paper digital displays have great market potential and are suitable
for various information booths, bulletin boards, and advertisement panels. Although this market has just taken off, related products can
take up a large portion of the production capacity.
E. Summary
Market diversification strategies have started generating positive effects for E Ink Holdings. Product design projects integrating electronic
paper technologies will continue to grow in terms of production capacity in 2014 and in the following years. More importantly, the
development of diverse product applications can prevent the risk of over-reliance on a single consumer product or market and help
establish a good foundation for future growth.
26
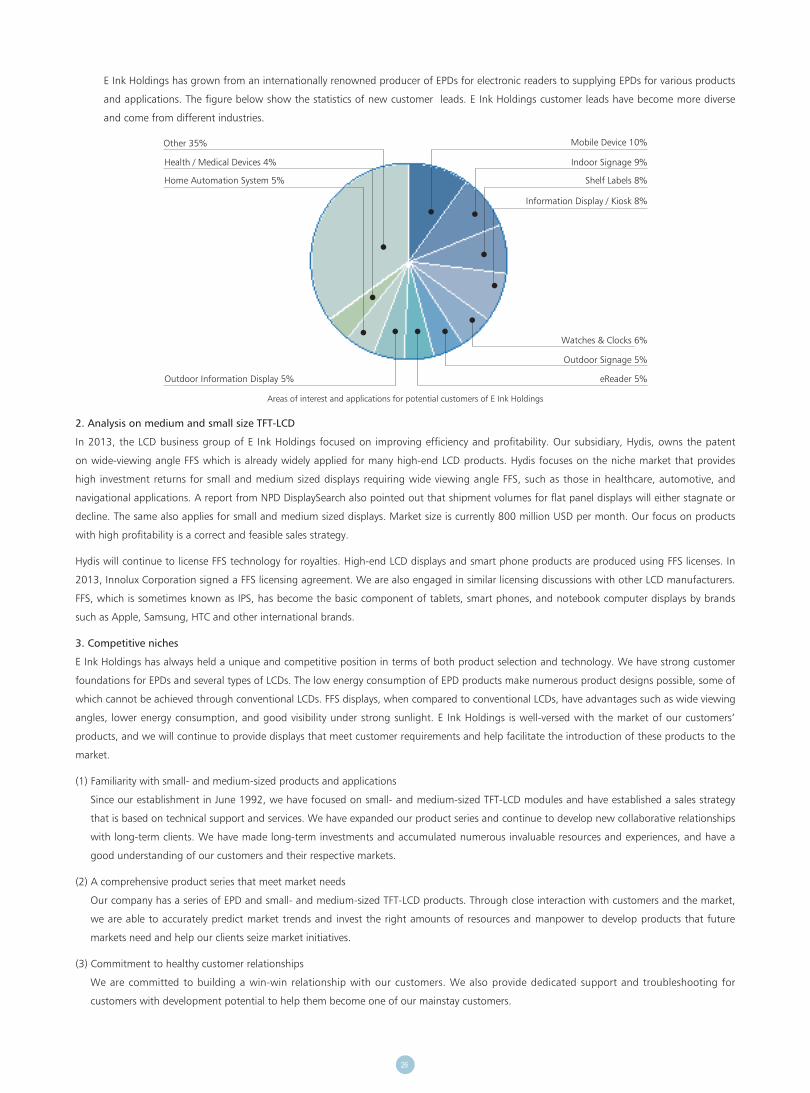
E Ink Holdings has grown from an internationally renowned producer of EPDs for electronic readers to supplying EPDs for various products
and applications. The figure below show the statistics of new customer leads. E Ink Holdings customer leads have become more diverse
and come from different industries.
2. Analysis on medium and small size TFT-LCD
In 2013, the LCD business group of E Ink Holdings focused on improving efficiency and profitability. Our subsidiary, Hydis, owns the patent
on wide-viewing angle FFS which is already widely applied for many high-end LCD products. Hydis focuses on the niche market that provides
high investment returns for small and medium sized displays requiring wide viewing angle FFS, such as those in healthcare, automotive, and
navigational applications. A report from NPD DisplaySearch also pointed out that shipment volumes for flat panel displays will either stagnate or
decline. The same also applies for small and medium sized displays. Market size is currently 800 million USD per month. Our focus on products
with high profitability is a correct and feasible sales strategy.
Hydis will continue to license FFS technology for royalties. High-end LCD displays and smart phone products are produced using FFS licenses. In
2013, Innolux Corporation signed a FFS licensing agreement. We are also engaged in similar licensing discussions with other LCD manufacturers.
FFS, which is sometimes known as IPS, has become the basic component of tablets, smart phones, and notebook computer displays by brands
such as Apple, Samsung, HTC and other international brands.
3. Competitive niches
E Ink Holdings has always held a unique and competitive position in terms of both product selection and technology. We have strong customer
foundations for EPDs and several types of LCDs. The low energy consumption of EPD products make numerous product designs possible, some of
which cannot be achieved through conventional LCDs. FFS displays, when compared to conventional LCDs, have advantages such as wide viewing
angles, lower energy consumption, and good visibility under strong sunlight. E Ink Holdings is well-versed with the market of our customers’
products, and we will continue to provide displays that meet customer requirements and help facilitate the introduction of these products to the
market.
(1) Familiarity with small- and medium-sized products and applications
Since our establishment in June 1992, we have focused on small- and medium-sized TFT-LCD modules and have established a sales strategy
that is based on technical support and services. We have expanded our product series and continue to develop new collaborative relationships
with long-term clients. We have made long-term investments and accumulated numerous invaluable resources and experiences, and have a
good understanding of our customers and their respective markets.
(2) A comprehensive product series that meet market needs
Our company has a series of EPD and small- and medium-sized TFT-LCD products. Through close interaction with customers and the market,
we are able to accurately predict market trends and invest the right amounts of resources and manpower to develop products that future
markets need and help our clients seize market initiatives.
(3) Commitment to healthy customer relationships
We are committed to building a win-win relationship with our customers. We also provide dedicated support and troubleshooting for
customers with development potential to help them become one of our mainstay customers.
Areas of interest and applications for potential customers of E Ink Holdings
Mobile Device 10%Other 35%
Indoor Signage 9%
Shelf Labels 8%
Information Display / Kiosk 8%
Watches & Clocks 6%
Outdoor Signage 5%
eReader 5%Outdoor Information Display 5%
Home Automation System 5%
Health / Medical Devices 4%

27
(4) Rapid product development
Whether its product development in response to market requirements or customized projects, E Ink Holdings fully utilizes our exclusive
process and R&D core technologies as well as experiences in long-term technology development and market projects to release products
needed by the market (Time to Market).
(5) Lowest product development costs
In order to achieve a competitive advantage, E Ink Holdings is committed to cost control to provide economic pricing and satisfy requirements
for product trials during preliminary stages of market introduction for new small and medium sized products. For customers who want to
develop customized products, our economic product development packages are less cost-inhibitive.
(6) Command over sales channels and regional markets
US: Provides sufficient R&D resources and market information for developing mainstay products that meet our customer or consumer
requirements. In order to achieve initiatives in product development, E Ink Holdings has introduced design services in the early stages
of product development at our end market and R&D resources in the US. This allows us to interact with our sales channels and various
international brands for increasing the proportion of direct and indirect sales in the US. We also improved pre- and post-sales services for our
sales networks to ensure growing sales in the US region.
Europe: A good industrial base and traditional culture have generated a creative environment that is perfect for coming up with a new
generation of electronic products. E Ink Holdings has established a European market and provides support for our customers to develop creative
products that are more capable of meeting market demands and seize market initiatives during the early phases of the product life cycle.
China and major supply chains: China is the world’s manufacturing base and mainly provides consumer goods to the rest of the world.
Manufacturers of electronic paper displays and TFT-LCD consumer goods are also concentrated in the Asia-Pacific Region. E Ink Holdings has
taken advantage of this trend and has established sales locations in China, Hong Kong, and Korea. By providing rapid technical support and
services to our clients, especially through the advantages of sharing common languages and cultures with China and Hong Kong, we are able
to build customer trust and obtain large production orders
4. Factors for and against development and coping strategies
(1) Favorable factors
A. In terms of the technical perspective, we have acquired Hydis Technologies of Korea in 2008, E Ink in December 2009, and SiPix
Technologies in 2012, allowing E Ink Holdings to secure patent protection for FFS LCD and electrophoretic EPD technologies. We have
further integrated upstream and midstream supply chain elements for LCD and EPD products to reduce cost and maintain our leading
position in the industry.
B. For production capacity utilization, we have achieved strategic partnerships with our partners and flexibly adjusted TFT-LCD production
capacity for the Korean Hydis facility to satisfy market demands, increase production capacity utilization, and reduce costs for improved
profitability.
C. For LCD and EPD product business strategies, in addition to our focus on cellular phones, tablets and electronic readers, we have also
began to concentrate on developing other product applications, working extensively with our clients to develop new niche markets to
expand the number of new projects and market coverage.
(2) Unfavorable factors and coping strategies
A. Various display manufacturers have begun producing small- and medium-sized displays. Market supply has grown, which would strain the
market prices for E Ink Holdings products.
Response: E Ink Holdings has established win-win systems with other display manufacturers to flexibly allocate production capacities with
our strategic partners and help maintain our competitiveness.
B. The market for electronic readers is under competitive pressure from tablet computers, which may further restrict shipping volume and
profitability for E Ink Holdings products.
Response: work with customer from other fields to develop EPDs for different applications and expand the market for EPDs.
28
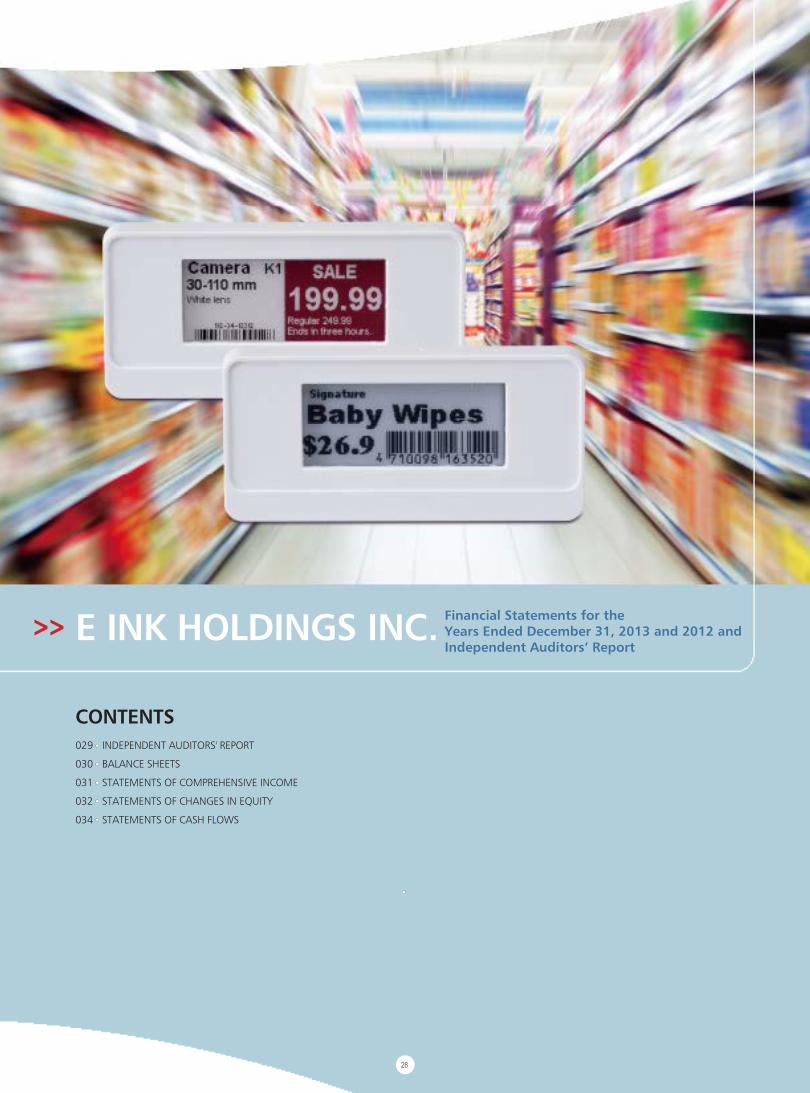
>> E INK HOLDINGS INC. Financial Statements for theYears Ended December 31, 2013 and 2012 andIndependent Auditors’ Report
CONTENTS029 INDEPENDENT AUDITORS' REPORT
030 BALANCE SHEETS
031 STATEMENTS OF COMPREHENSIVE INCOME
032 STATEMENTS OF CHANGES IN EQUITY
034 STATEMENTS OF CASH FLOWS

29
Financial Statements for theYears Ended December 31, 2013 and 2012 andIndependent Auditors’ Report
INDEPENDENT AUDITORS’ REPORT
The Board of Directors and the Shareholders
E Ink Holdings Inc.
We have audited the accompanying balance sheets of E Ink Holdings Inc. (the “Corporation”) as of December 31, 2013, December 31, 2012 and
January 1, 2012, and the related statements of comprehensive income, changes in equity and cash flows for the years ended December 31, 2013
and 2012. These financial statements are the responsibility of the Corporation’s management. Our responsibility is to express an opinion on these
financial statements based on our audits. We did not audit the financial statements of BOE Mobile Display Technology Co., Ltd., as of December
31, 2013 and 2012, the investments in which the Corporation had equity-method investments by Hydis Technologies Co., Ltd. The investments
amounted to NT$175,316 thousand, NT$188,713 thousand and NT$176,378 thousand as of December 31, 2013, December 31, 2012 and
January 1, 2012, respectively, which accounted for about 0.4% of the Corporation’s total assets as of the above date. The Corporation’s equity
of NT$12,577 thousand and NT$12,335 thousand in their comprehensive income in 2013 and 2012 were about 1.1% and 1.4%, respectively,
of the Corporation’s total comprehensive income (loss). The investee’s financial statements were audited by other auditors whose reports have
been furnished to us, and, our opinion, insofar as it relates to the amounts included for the investee, is based solely on the reports of the other
auditors.
We conducted our audits in accordance with the Rules Governing the Audit of Financial Statements by Certified Public Accountants and
auditing standards generally accepted in the Republic of China. Those rules and standards require that we plan and perform the audit to obtain
reasonable assurance about whether the financial statements are free of material misstatement. An audit includes examining, on a test basis,
evidence supporting the amounts and disclosures in the financial statements. An audit also includes assessing the accounting principles used and
significant estimates made by management, as well as evaluating the overall financial statement presentation. We believe that our audits and the
reports of the other auditors provide a reasonable basis for our opinion.
In our opinion, based on our audits and the reports of the other auditors, the financial statements referred to above present fairly, in all material
respects, the financial position of E Ink Holdings Inc. as of December 31, 2013, December 31, 2012 and January 1, 2012, and its financial
performance and its cash flows for the years ended December 31, 2013 and 2012, in conformity with the Regulations Governing the Preparation
of Financial Reports by Securities Issuers.
March 20, 2014
Notice to Readers
The accompanying financial statements are intended only to present the financial position, financial performance and cash flows in accordance
with accounting principles and practices generally accepted in the Republic of China and not those of any other jurisdictions. The standards,
procedures and practices to audit such financial statements are those generally applied in the Republic of China.
For the convenience of readers, the independent auditors’ report and the accompanying financial statements have been translated into English
from the original Chinese version prepared and used in the Republic of China. If there is any conflict between the English version and the original
Chinese version or any difference in the interpretation of the two versions, the Chinese-language independent auditors’ report and financial
statements shall prevail.

30
E INK HOLDINGS INC.
BALANCE SHEETS(In Thousands of New Taiwan Dollars)
December 31, 2013 December 31, 2012 January 1, 2012
ASSETS Amount % Amount % Amount %
CURRENT ASSETSCash and cash equivalents (Notes 4 and 6) $ 1,767,590 4 $ 3,255,645 7 $ 2,140,525 5Financial assets at fair value through profit or loss (Notes 4 and 7) 1,498,361 4 - - 238 -Accounts receivable (Note 4) 205,661 - 412,437 1 448,217 1Accounts receivable from related parties (Notes 4 and 22) 7,108,474 17 7,446,498 17 6,204,429 14Other receivables from related parties (Note 22) 825,473 2 2,028,376 5 1,186,480 3Inventories (Notes 4 and 10) 1,434,873 3 682,359 1 1,765,059 4Prepayments 84,267 - 74,855 - 695,209 2Other current assets 75,049 - 43,845 - 32,586 -
Total current assets 12,999,748 30 13,944,015 31 12,472,743 29
NON-CURRENT ASSETSFinancial assets at fair value through profit or loss (Notes 4 and 7) - - 1,431,150 3 1,411,950 3Available-for-sale financial assets (Note 4 ) 766,310 2 614,444 2 331,247 1Financial assets measured at cost (Notes 4 and 8) 77,601 - 77,601 - 77,601 -Debt investment with no active market (Notes 4 and 9) - - 885,720 2 923,388 2Investments accounted for using equity method (Notes 4 and 11) 26,453,736 62 25,911,497 58 26,065,964 61Property, plant and equipment (Notes 4, 12 and 22) 2,064,620 5 1,498,249 3 1,575,086 4Other intangible assets (Note 4 ) 45,038 - 49,790 - 67,403 -Deferred tax assets (Notes 4 and 17) 209,144 1 176,970 1 141,780 -Other non-current assets (Notes 4 and 14) 44,333 - 34,796 - 65,405 -
Total non-current assets 29,660,782 70 30,680,217 69 30,659,824 71
TOTAL $ 42,660,530 100 $ 44,624,232 100 $ 43,132,567 100
LIABILITIES AND EQUITYCURRENT LIABILITIES
Short-term borrowings (Note 13) $ 149,025 1 $ 1,390,000 3 $ - -Accounts payable 1,257,374 3 2,476,402 6 822,580 2Accounts payable to related parties (Note 22) 9,045,728 21 9,855,565 22 8,341,365 19Other payables 412,017 1 491,308 1 780,179 2Current tax liabilities (Notes 4 and 17) 32,429 - 187,504 1 142,682 -Receipts in advance (Note 22) 248,031 1 56,148 - 31,336 -Current portion of long-term borrowings (Note 13) 1,780,629 4 1,771,886 4 - -Other current liabilities (Note 22) 32,072 - 7,166 - 4,599 -
Total current liabilities 12,957,305 31 16,235,979 37 10,122,741 23
NON-CURRENT LIABILITIESLong-term borrowings (Note 13) 3,870,943 9 4,429,714 10 5,061,000 12Other non-current liabilities (Notes 4, 11, 14, 17 and 22) 63,195 - 116,186 - 128 -
Total non-current liabilities 3,934,138 9 4,545,900 10 5,061,128 12
Total liabilities 16,891,443 40 20,781,879 47 15,183,869 35
EQUITY (Notes 14, 15 and 19)Share capital 11,409,897 27 10,809,897 24 10,801,778 25Capital surplus 10,073,700 24 9,686,700 22 9,669,721 23Retain earnings
Legal reserve 1,055,476 2 1,055,476 2 402,798 1Special reserve 483,507 1 271,435 - 704,456 2Unappropriated earnings 2,130,050 5 2,528,246 6 6,737,952 15
Total retain earnings 3,669,033 8 3,855,157 8 7,845,206 18Other equity 642,351 1 (483,507) (1) (342,113) (1)Treasury shares (25,894) - (25,894) - (25,894) -
Total equity 25,769,087 60 23,842,353 53 27,948,698 65
TOTAL $ 42,660,530 100 $ 44,624,232 100 $ 43,132,567 100
The accompanying notes are an integral part of the financial statements.(With Deloitte & Touche audit report dated March 20, 2014)
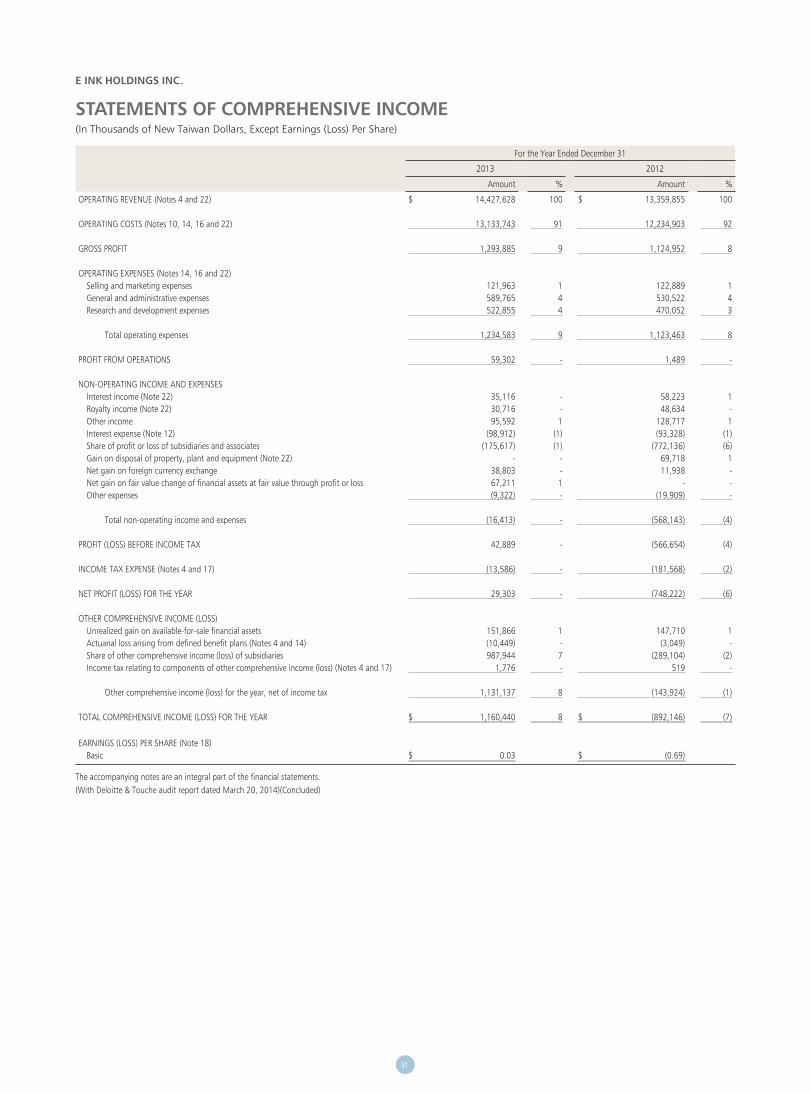
31
E INK HOLDINGS INC.
STATEMENTS OF COMPREHENSIVE INCOME(In Thousands of New Taiwan Dollars, Except Earnings (Loss) Per Share)
For the Year Ended December 31
2013 2012
Amount % Amount %
OPERATING REVENUE (Notes 4 and 22) $ 14,427,628 100 $ 13,359,855 100
OPERATING COSTS (Notes 10, 14, 16 and 22) 13,133,743 91 12,234,903 92
GROSS PROFIT 1,293,885 9 1,124,952 8
OPERATING EXPENSES (Notes 14, 16 and 22)Selling and marketing expenses 121,963 1 122,889 1General and administrative expenses 589,765 4 530,522 4Research and development expenses 522,855 4 470,052 3
Total operating expenses 1,234,583 9 1,123,463 8
PROFIT FROM OPERATIONS 59,302 - 1,489 -
NON-OPERATING INCOME AND EXPENSESInterest income (Note 22) 35,116 - 58,223 1Royalty income (Note 22) 30,716 - 48,634 -Other income 95,592 1 128,717 1Interest expense (Note 12) (98,912) (1) (93,328) (1)Share of profit or loss of subsidiaries and associates (175,617) (1) (772,136) (6)Gain on disposal of property, plant and equipment (Note 22) - - 69,718 1Net gain on foreign currency exchange 38,803 - 11,938 -Net gain on fair value change of financial assets at fair value through profit or loss 67,211 1 - -Other expenses (9,322) - (19,909) -
Total non-operating income and expenses (16,413) - (568,143) (4)
PROFIT (LOSS) BEFORE INCOME TAX 42,889 - (566,654) (4)
INCOME TAX EXPENSE (Notes 4 and 17) (13,586) - (181,568) (2)
NET PROFIT (LOSS) FOR THE YEAR 29,303 - (748,222) (6)
OTHER COMPREHENSIVE INCOME (LOSS)Unrealized gain on available-for-sale financial assets 151,866 1 147,710 1Actuarial loss arising from defined benefit plans (Notes 4 and 14) (10,449) - (3,049) -Share of other comprehensive income (loss) of subsidiaries 987,944 7 (289,104) (2)Income tax relating to components of other comprehensive income (loss) (Notes 4 and 17) 1,776 - 519 -
Other comprehensive income (loss) for the year, net of income tax 1,131,137 8 (143,924) (1)
TOTAL COMPREHENSIVE INCOME (LOSS) FOR THE YEAR $ 1,160,440 8 $ (892,146) (7)
EARNINGS (LOSS) PER SHARE (Note 18)Basic $ 0.03 $ (0.69)
The accompanying notes are an integral part of the financial statements.(With Deloitte & Touche audit report dated March 20, 2014)(Concluded)

32
E INK HOLDINGS INC.
STATEMENTS OF CHANGES IN EQUITY(In Thousands of New Taiwan Dollars, Except Dividends Per Share)
Share Capital Retained Earnings Other Equity
Shares (Thousands) Amount Capital Surplus Legal Reserve Special ReserveUnappropriated
Earnings
Exchange Differences on Translating Foreign
Operations
Unrealized Gain (Loss) on Available-for-sale Financial
Assets Treasury Shares Total Equity
BALANCE AT JANUARY 1, 2012 1,080,173 10,801,778 $ 9,669,721 $ 402,798 $ 704,456 $ 6,737,952 $ - $ (342,113) $ (25,894) $ 27,948,698
Appropriation of 2011 earningsReversal of special reserve - - - - (433,021) 433,021 - - - -Legal reserve - - - 652,678 - (652,678) - - - -Cash dividends - $3 per share - - - - - (3,239,278) - - - (3,239,278)
Net loss for the year ended December 31, 2012 - - - - - (748,222) - - - (748,222)
Other comprehensive income (loss) for the year ended December 31, 2012, net of income tax - - - - - (2,530) (559,205) 417,811 - (143,924)
Total comprehensive income (loss) for the year ended December 31, 2012 - - - - - (750,752) (559,205) 417,811 - (892,146)
Partial acquisition of interests in subsidiaries - - - - - (19) - - - (19)
Change in capital surplus form investments in subsidiaries accounted for by using equity method - - 8,190 - - - - - - 8,190
Conversion of employee share options 817 8,119 8,789 - - - - - - 16,908
BALANCE AT DECEMBER 31, 2012 1,080,990 10,809,897 9,686,700 1,055,476 271,435 2,528,246 (559,205) 75,698 (25,894) 23,842,353
Special reserve under Rule No. 1010012865 issued by the FSC - - - - 70,678 (70,678) - - - -
Special reserve - - - - 141,394 (141,394) - - - -
Net profit for the year ended December 31, 2013 - - - - - 29,303 - - - 29,303
Other comprehensive income for the year ended December 31, 2013, net of income tax - - - - - 5,279 620,774 505,084 - 1,131,137
Total comprehensive income for the year ended December 31, 2013 - - - - - 34,582 620,774 505,084 - 1,160,440
Private issue of ordinary shares for cash - July 60,000 600,000 387,000 - - - - - - 987,000
Change in equity from investments in associates accounted for by using equity method - - - - - (25,705) - - - (25,705)
Partial acquisition of interests in subsidiaries - - - - - (195,001) - - - (195,001)
BALANCE AT DECEMBER 31, 2013 1,140,990 11,409,897 $ 10,073,700 $ 1,055,476 $ 483,507 $ 2,130,050 $ 61,569 $ 580,782 $ (25,894) $ 25,769,087
The accompanying notes are an integral part of the financial statements.(With Deloitte & Touche audit report dated March 20, 2014)

33
E INK HOLDINGS INC.
STATEMENTS OF CHANGES IN EQUITY(In Thousands of New Taiwan Dollars, Except Dividends Per Share)
Share Capital Retained Earnings Other Equity
Shares (Thousands) Amount Capital Surplus Legal Reserve Special ReserveUnappropriated
Earnings
Exchange Differences on Translating Foreign
Operations
Unrealized Gain (Loss) on Available-for-sale Financial
Assets Treasury Shares Total Equity
BALANCE AT JANUARY 1, 2012 1,080,173 10,801,778 $ 9,669,721 $ 402,798 $ 704,456 $ 6,737,952 $ - $ (342,113) $ (25,894) $ 27,948,698
Appropriation of 2011 earningsReversal of special reserve - - - - (433,021) 433,021 - - - -Legal reserve - - - 652,678 - (652,678) - - - -Cash dividends - $3 per share - - - - - (3,239,278) - - - (3,239,278)
Net loss for the year ended December 31, 2012 - - - - - (748,222) - - - (748,222)
Other comprehensive income (loss) for the year ended December 31, 2012, net of income tax - - - - - (2,530) (559,205) 417,811 - (143,924)
Total comprehensive income (loss) for the year ended December 31, 2012 - - - - - (750,752) (559,205) 417,811 - (892,146)
Partial acquisition of interests in subsidiaries - - - - - (19) - - - (19)
Change in capital surplus form investments in subsidiaries accounted for by using equity method - - 8,190 - - - - - - 8,190
Conversion of employee share options 817 8,119 8,789 - - - - - - 16,908
BALANCE AT DECEMBER 31, 2012 1,080,990 10,809,897 9,686,700 1,055,476 271,435 2,528,246 (559,205) 75,698 (25,894) 23,842,353
Special reserve under Rule No. 1010012865 issued by the FSC - - - - 70,678 (70,678) - - - -
Special reserve - - - - 141,394 (141,394) - - - -
Net profit for the year ended December 31, 2013 - - - - - 29,303 - - - 29,303
Other comprehensive income for the year ended December 31, 2013, net of income tax - - - - - 5,279 620,774 505,084 - 1,131,137
Total comprehensive income for the year ended December 31, 2013 - - - - - 34,582 620,774 505,084 - 1,160,440
Private issue of ordinary shares for cash - July 60,000 600,000 387,000 - - - - - - 987,000
Change in equity from investments in associates accounted for by using equity method - - - - - (25,705) - - - (25,705)
Partial acquisition of interests in subsidiaries - - - - - (195,001) - - - (195,001)
BALANCE AT DECEMBER 31, 2013 1,140,990 11,409,897 $ 10,073,700 $ 1,055,476 $ 483,507 $ 2,130,050 $ 61,569 $ 580,782 $ (25,894) $ 25,769,087
The accompanying notes are an integral part of the financial statements.(With Deloitte & Touche audit report dated March 20, 2014)

34
E INK HOLDINGS INC.
STATEMENTS OF CASH FLOWS(In Thousands of New Taiwan Dollars)
For the Year Ended December 31
2013 2012
CASH FLOWS FROM OPERATING ACTIVITIESIncome (loss) before income tax $ 42,889 $ (566,654)Adjustments for:
Depreciation expenses 257,580 229,362Amortization expenses 33,744 62,879Net loss (gain) on fair value change of financial assets at fair value through profit or loss (67,211) 18,706Interest expense 98,912 93,328Interest income (35,116) (58,223)Dividend income (16,639) (11,574)Share of loss of subsidiaries and associates 175,617 772,136Net gain on disposal of property, plant and equipment - (69,718)Impairment loss recognized on non-financial assets 9,322 -Write-down of inventories 77,000 100,000Unrealized net loss (gain) on foreign currency exchange 80,359 (40,254)Royalty income (30,716) (48,634)
Changes in operating assets and liabilitiesAccounts receivable 209,299 33,559Accounts receivable from related parties 406,482 (1,287,734)Inventories (829,514) 982,700Prepayments (32,106) 57,166Other current assets (31,077) (11,263)Accounts payable (1,246,661) 1,669,297Accounts payable to related parties (943,015) 1,606,452Other payables (61,942) (353,109)Receipts in advance 200,969 34,724Other current liabilities 16,176 3,774
Cash generated from (used in) operations (1,685,648) 3,216,920Income tax paid (203,992) (166,484)
Net cash generated from (used in) operating activities (1,889,640) 3,050,436
CASH FLOWS FROM INVESTING ACTIVITIESPurchase of available-for-sale financial assets - (135,487)Proceeds on sale of debt investments with no active market 885,720 -Acquisition of subsidiaries - (1,339,066)Payments for property, plant and equipment (823,913) (163,411)Decrease in other receivables from related parties 1,234,133 414,353Payments for intangible assets (22,888) (21,981)Increase in other non-current assets (1,953) (5,703)Interest received 34,989 58,227Dividends received 33,368 20,070
Net cash generated from (used in) investing activities 1,339,456 (1,172,998)
CASH FLOWS FROM FINANCING ACTIVITIESIncrease (decrease) in short-term borrowings (1,242,000) 1,390,000Proceeds from long-term borrowings 1,200,000 1,190,000Repayments of long-term borrowings (1,769,542) -Increase (decrease) in other non-current liabilities (2) 122,761Cash dividends paid - (3,239,278)Proceeds from issue of ordinary shares 987,000 -Conversion of employee share options - 16,908Payments for partial acquisition of interests in subsidiaries (7,024) (154,542)Interest paid (106,303) (88,167)
Net cash used in financing activities (937,871) (762,318)
NET INCREASE (DECREASE) IN CASH AND CASH EQUIVALENTS (1,488,055) 1,115,120
CASH AND CASH EQUIVALENTS AT THE BEGINNING OF THE YEAR 3,255,645 2,140,525
CASH AND CASH EQUIVALENTS AT THE END OF THE YEAR $ 1,767,590 $ 3,255,645
The accompanying notes are an integral part of the financial statements.(With Deloitte & Touche audit report dated March 20, 2014)(Concluded)

35
E INK HOLDINGS INC. AND SUBSIDIARIESConsolidated Financial Statements for the Years Ended December 31, 2013 and 2012 and Independent Auditors’ Report
036 INDEPENDENT AUDITORS' REPORT
037 CONSOLIDATED BALANCE SHEETS
039 CONSOLIDATED STATEMENTS OF COMPREHENSIVE INCOME
040 CONSOLIDATED STATEMENTS OF CHANGES IN EQUITY
042 CONSOLIDATED STATEMENTS OF CASH FLOWS
CONTENTS

36
INDEPENDENT AUDITORS’ REPORT
The Board of Directors and the Shareholders
E Ink Holdings Inc.
We have audited the accompanying consolidated balance sheets of E Ink Holdings Inc. and its subsidiaries (the “Corporation”) as of December
31, 2013, December 31, 2012 and January 1, 2012, and the related consolidated statements of comprehensive income, changes in equity and
cash flows for the years ended December 31, 2013 and 2012. These consolidated financial statements are the responsibility of the Corporation’s
management. Our responsibility is to express an opinion on these consolidated financial statements based on our audits. We did not audit the
financial statements of BOE Mobile Display Technology Co., Ltd., as of December 31, 2013 and 2012, respectively. The investments amounted
to NT$175,316 thousand, NT$188,713 thousand and NT$176,378 thousand as of December 31, 2013, December 31, 2012 and January
1, 2012, respectively, which accounted for about 0.4% of the Corporation’s total assets as of the above date. The Corporation’s equity of
NT$12,577 thousand and NT$12,335 thousand in their comprehensive income in 2013 and 2012 were about 1.2% and 1.0%, respectively,
of the Corporation’s total comprehensive income (loss). The investee’s financial statements were audited by other auditors whose reports have
been furnished to us, and, our opinion, insofar as it relates to the amounts included for the investee, is based solely on the reports of the other
auditors.
We conducted our audits in accordance with the Rules Governing the Audit of Financial Statements by Certified Public Accountants and
auditing standards generally accepted in the Republic of China. Those rules and standards require that we plan and perform the audit to obtain
reasonable assurance about whether the consolidated financial statements are free of material misstatement. An audit includes examining, on
a test basis, evidence supporting the amounts and disclosures in the consolidated financial statements. An audit also includes assessing the
accounting principles used and significant estimates made by management, as well as evaluating the overall consolidated financial statement
presentation. We believe that our audits and the reports of the other auditors provide a reasonable basis for our opinion.
In our opinion, based on our audits and the reports of the other auditors, the consolidated financial statements referred to above present
fairly, in all material respects, the consolidated financial position of the Corporation as of December 31, 2013, December 31, 2012 and January
1, 2012, and their consolidated financial performance and their consolidated cash flows for the years ended December 31, 2013 and 2012,
in conformity with the Regulations Governing the Preparation of Financial Reports by Securities Issuers and International Financial Reporting
Standards (IFRS), International Accounting Standards (IAS), IFRIC Interpretations (IFRIC), and SIC Interpretations (SIC) endorsed by the Financial
Supervisory Commission of the Republic of China.
We have also audited the parent company only financial statements of E Ink Holdings Inc. as of and for the years ended December 31, 2013 and
2012 on which we have issued a modified unqualified report.
March 20, 2014
Notice to Readers
The accompanying consolidated financial statements are intended only to present the financial position, financial performance and cash flows
in accordance with accounting principles and practices generally accepted in the Republic of China and not those of any other jurisdictions. The
standards, procedures and practices to audit such consolidated financial statements are those generally accepted and applied in the Republic of
China.
For the convenience of readers, the auditors’ report and the accompanying consolidated financial statements have been translated into English
from the original Chinese version prepared and used in the Republic of China. If there is any conflict between the English version and the original
Chinese version or any difference in the interpretation of the two versions, the Chinese-language auditors’ report and consolidated financial
statements shall prevail.

37
E INK HOLDINGS INC. AND SUBSIDIARIES
CONSOLIDATED BALANCE SHEETS(In Thousands of New Taiwan Dollars)
December 31, 2013 December 31, 2012 January 1, 2012
ASSETS Amount % Amount % Amount %
CURRENT ASSETSCash and cash equivalents (Notes 4 and 6) $ 4,664,263 11 $ 6,890,362 15 $ 4,373,327 9Financial assets at fair value through profit or loss (Notes 4 and 7) 1,586,260 4 168,260 - 238 -Notes and accounts receivable (Notes 4 and 10) 3,499,785 9 6,775,984 15 9,432,609 20Accounts receivable from related parties (Notes 4 and 27) 27,776 - 43,454 - 272,372 1Inventories (Notes 4 and 11) 3,197,831 8 3,399,110 7 5,773,028 13Prepayments (Note 27) 306,778 1 572,535 1 451,668 1Other current assets (Notes 4, 19 and 28) 933,751 2 670,985 2 349,643 1
Total current assets 14,216,444 35 18,520,690 40 20,652,885 45
NON-CURRENT ASSETSFinancial assets at fair value through profit or loss (Notes 4 and 7) 259,929 1 1,682,655 4 1,672,015 4Available-for-sale financial assets (Notes 4 and 8) 2,044,551 5 1,539,466 3 985,957 2Financial assets measured at cost (Notes 4 and 9) 2,833,107 7 2,730,367 6 2,635,442 6Investments accounted for using equity method (Note 4) 237,271 1 271,748 1 282,542 -Property, plant and equipment (Notes 4, 12 and 28) 9,835,142 24 10,194,178 22 9,821,881 21Goodwill (Notes 4, 13 and 22) 6,761,078 17 6,732,067 15 6,062,358 13Other intangible assets (Notes 4 and 13) 3,036,726 8 3,535,232 8 3,179,627 7Deferred tax assets (Notes 4 and 19) 604,725 1 471,877 1 537,771 1Other non-current assets (Notes 4, 16, 27 and 28) 256,122 1 237,340 - 413,864 1
Total non-current assets 25,868,651 65 27,394,930 60 25,591,457 55
TOTAL $ 40,085,095 100 $ 45,915,620 100 $ 46,244,342 100
LIABILITIES AND EQUITY
CURRENT LIABILITIESShort-term borrowings (Note 14) $ 894,150 2 $ 3,878,689 9 $ 909,069 2Accounts payable 2,478,235 6 5,176,708 11 5,533,246 12Accounts payable to related parties (Note 27) 66,420 - 23,928 - 33,896 -Other payables (Note 22) 1,416,847 4 1,712,376 4 1,921,174 4Current tax liabilities (Notes 4 and 19) 38,074 - 188,907 - 159,470 -Receipts in advance 992,165 3 656,469 1 189,226 -Current portion of long-term borrowings and bonds payable
(Notes 14 and 28) 2,419,308 6 3,116,320 7 30,275 -Current portion of long-term payables to related parties
(Notes 15 and 27) 118,171 - - - - -Other current liabilities 138,201 - 191,888 - 196,256 1
Total current liabilities 8,561,571 21 14,945,285 32 8,972,612 19
NON-CURRENT LIABILITIESBonds payable (Note 15) - - - - 601,973 1Long-term borrowings (Notes 14 and 28) 4,877,848 12 6,135,908 13 7,425,079 16Accrued pension liabilities (Notes 4 and 16) 397,056 1 769,321 2 683,612 2Long-term payables to related parties (Notes 15 and 27) 452,360 1 - - - -Other non-current liabilities (Notes 4, 15 and 19) 244,145 1 282,462 1 444,515 1
Total non-current liabilities 5,971,409 15 7,187,691 16 9,155,179 20
Total liabilities 14,532,980 36 22,132,976 48 18,127,791 39
(Continued)
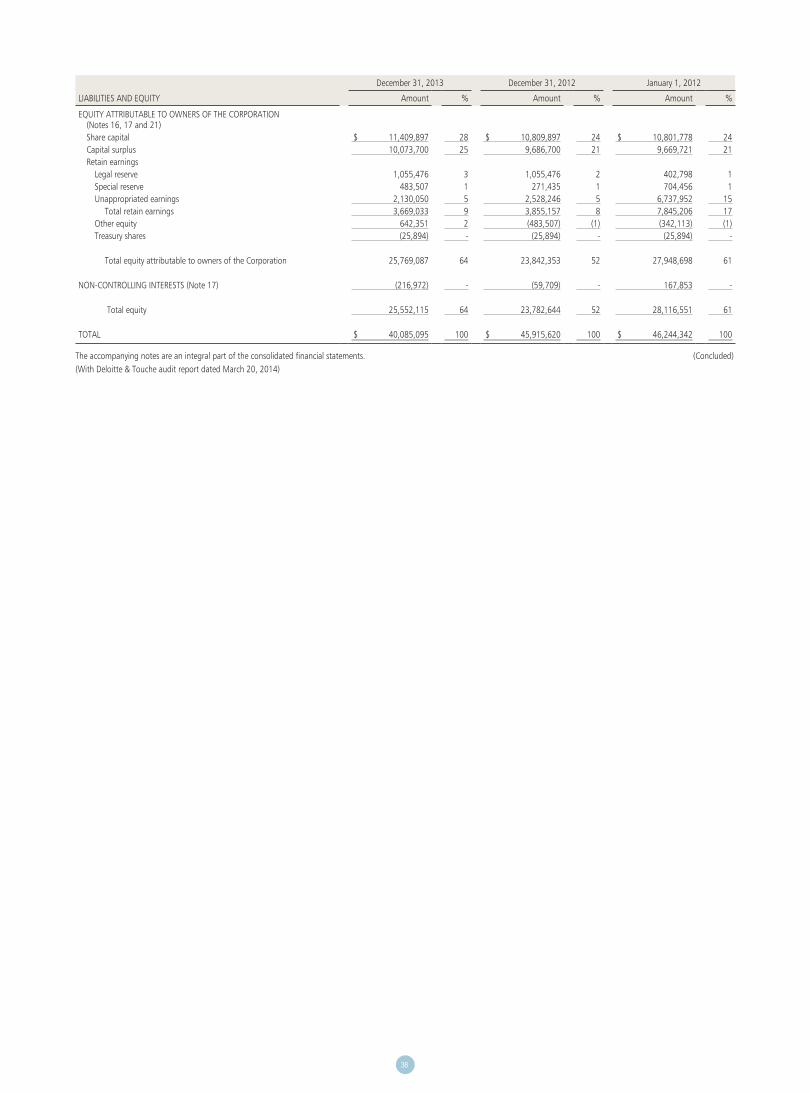
38
December 31, 2013 December 31, 2012 January 1, 2012
LIABILITIES AND EQUITY Amount % Amount % Amount %
EQUITY ATTRIBUTABLE TO OWNERS OF THE CORPORATION (Notes 16, 17 and 21)Share capital $ 11,409,897 28 $ 10,809,897 24 $ 10,801,778 24Capital surplus 10,073,700 25 9,686,700 21 9,669,721 21Retain earnings
Legal reserve 1,055,476 3 1,055,476 2 402,798 1Special reserve 483,507 1 271,435 1 704,456 1Unappropriated earnings 2,130,050 5 2,528,246 5 6,737,952 15
Total retain earnings 3,669,033 9 3,855,157 8 7,845,206 17Other equity 642,351 2 (483,507) (1) (342,113) (1)Treasury shares (25,894) - (25,894) - (25,894) -
Total equity attributable to owners of the Corporation 25,769,087 64 23,842,353 52 27,948,698 61
NON-CONTROLLING INTERESTS (Note 17) (216,972) - (59,709) - 167,853 -
Total equity 25,552,115 64 23,782,644 52 28,116,551 61
TOTAL $ 40,085,095 100 $ 45,915,620 100 $ 46,244,342 100
The accompanying notes are an integral part of the consolidated financial statements. (Concluded)(With Deloitte & Touche audit report dated March 20, 2014)

39
E INK HOLDINGS INC. AND SUBSIDIARIES
CONSOLIDATED STATEMENTS OF COMPREHENSIVE INCOME(In Thousands of New Taiwan Dollars, Except Earnings (Loss) Per Share)
For the Year Ended December 31
2013 2012
Amount % Amount %
OPERATING REVENUE (Notes 4 and 27) $ 18,905,129 100 $ 26,704,782 100
OPERATING COSTS (Notes 11, 16, 18 and 27) 15,886,448 84 23,884,994 89
GROSS PROFIT 3,018,681 16 2,819,788 11
OPERATING EXPENSES (Notes 16, 18 and 27)Selling and marketing expenses 453,723 3 419,716 2General and administrative expenses 2,641,962 14 2,154,987 8Research and development expenses 1,571,313 8 1,693,493 6
Total operating expenses 4,666,998 25 4,268,196 16
LOSS FROM OPERATIONS (1,648,317) (9) (1,448,408) (5)
NON-OPERATING INCOME AND EXPENSESInterest income 152,255 1 157,154 1Royalty income 1,610,262 9 491,229 2Dividend income 62,161 - 31,301 -Other income (Note 27) 255,609 1 270,434 1Interest expense (Note 12) (176,668) (1) (195,965) (1)Net gain on foreign currency exchange 142,446 1 257,408 1Impairment loss (Notes 5, 12 and 13) (59,212) - (144,528) (1)Other expenses (Notes 16 and 27) (550,026) (3) (53,622) -
Total non-operating income and expenses 1,436,827 8 813,411 3
LOSS BEFORE INCOME TAX (211,490) (1) (634,997) (2)
INCOME TAX EXPENSE (BENEFIT) (Notes 4 and 19) 175,481 1 (447,410) (2)
NET LOSS FOR THE YEAR (36,009) - (1,082,407) (4)
OTHER COMPREHENSIVE INCOME (LOSS)Exchange differences on translating foreign operations 607,206 3 (540,130) (2)Unrealized gain on available-for-sale financial assets 505,084 3 417,811 1Actuarial gain and loss arising from defined benefit plans (Notes 4 and 16) 8,405 - (3,049) -Share of other comprehensive loss of associates $ (4,588) - $ (15,399) -Income tax relating to components of other comprehensive income (loss)
(Notes 4, 16 and 19) 1,776 - 519 -
Other comprehensive income (loss) for the year, net of income tax 1,117,883 6 (140,248) (1)
TOTAL COMPREHENSIVE INCOME (LOSS) FOR THE YEAR $ 1,081,874 6 $ (1,222,655) (5)
NET PROFIT (LOSS) ATTRIBUTABLE TO:Owner of the Corporation $ 29,303 - $ (748,222) (3)Non-controlling interests (65,312) - (334,185) (1)
$ (36,009) - $ (1,082,407) (4)
TOTAL COMPREHENSIVE INCOME (LOSS) ATTRIBUTABLE TO:Owner of the Corporation $ 1,160,440 6 $ (892,146) (4)Non-controlling interests (78,566) - (330,509) (1)
$ 1,081,874 6 $ (1,222,655) (5)
EARNINGS (LOSS) PER SHARE (Note 20)Basic $ 0.03 $ (0.69)
The accompanying notes are an integral part of the consolidated financial statements.(With Deloitte & Touche audit report dated March 20, 2014)
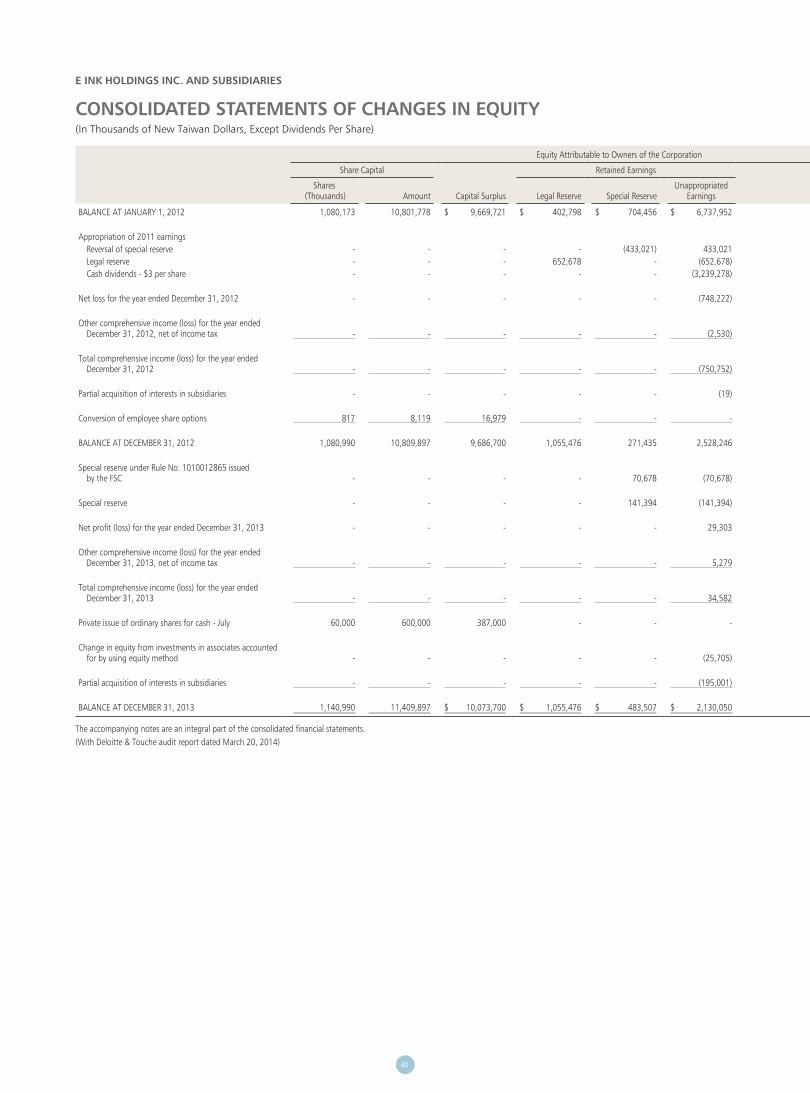
40
E INK HOLDINGS INC. AND SUBSIDIARIES
CONSOLIDATED STATEMENTS OF CHANGES IN EQUITY(In Thousands of New Taiwan Dollars, Except Dividends Per Share)
Equity Attributable to Owners of the Corporation
Non-controlling Interests Total Equity
Share Capital
Capital Surplus
Retained Earnings Other Equity
Treasury Shares TotalShares
(Thousands) Amount Legal Reserve Special ReserveUnappropriated
EarningsExchange Differences on
Translating Foreign OperationsUnrealized Gain (Loss) on
Available-for-sale Financial Assets
BALANCE AT JANUARY 1, 2012 1,080,173 10,801,778 $ 9,669,721 $ 402,798 $ 704,456 $ 6,737,952 $ - $ (342,113) $ (25,894) $ 27,948,698 $ 167,853 $ 28,116,551
Appropriation of 2011 earningsReversal of special reserve - - - - (433,021) 433,021 - - - - - -Legal reserve - - - 652,678 - (652,678) - - - - - -Cash dividends - $3 per share - - - - - (3,239,278) - - - (3,239,278) - (3,239,278)
Net loss for the year ended December 31, 2012 - - - - - (748,222) - - - (748,222) (334,185) (1,082,407)
Other comprehensive income (loss) for the year endedDecember 31, 2012, net of income tax - - - - - (2,530) (559,205) 417,811 - (143,924) 3,676 (140,248)
Total comprehensive income (loss) for the year endedDecember 31, 2012 - - - - - (750,752) (559,205) 417,811 - (892,146) (330,509) (1,222,655)
Partial acquisition of interests in subsidiaries - - - - - (19) - - - (19) 102,947 102,928
Conversion of employee share options 817 8,119 16,979 - - - - - - 25,098 - 25,098
BALANCE AT DECEMBER 31, 2012 1,080,990 10,809,897 9,686,700 1,055,476 271,435 2,528,246 (559,205) 75,698 (25,894) 23,842,353 (59,709) 23,782,644
Special reserve under Rule No. 1010012865 issued by the FSC - - - - 70,678 (70,678) - - - -
Special reserve - - - - 141,394 (141,394) - - - -
Net profit (loss) for the year ended December 31, 2013 - - - - - 29,303 - - - 29,303 (65,312) (36,009)
Other comprehensive income (loss) for the year endedDecember 31, 2013, net of income tax - - - - - 5,279 620,774 505,084 - 1,131,137 (13,254) 1,117,883
Total comprehensive income (loss) for the year endedDecember 31, 2013 - - - - - 34,582 620,774 505,084 - 1,160,440 (78,566) 1,081,874
Private issue of ordinary shares for cash - July 60,000 600,000 387,000 - - - - - - 987,000 - 987,000
Change in equity from investments in associates accountedfor by using equity method - - - - - (25,705) - - - (25,705) - (25,705)
Partial acquisition of interests in subsidiaries - - - - - (195,001) - - - (195,001) (78,697) (273,698)
BALANCE AT DECEMBER 31, 2013 1,140,990 11,409,897 $ 10,073,700 $ 1,055,476 $ 483,507 $ 2,130,050 $ 61,569 $ 580,782 $ (25,894) $ 25,769,087 $ (216,972) $ 25,552,115
The accompanying notes are an integral part of the consolidated financial statements.(With Deloitte & Touche audit report dated March 20, 2014)
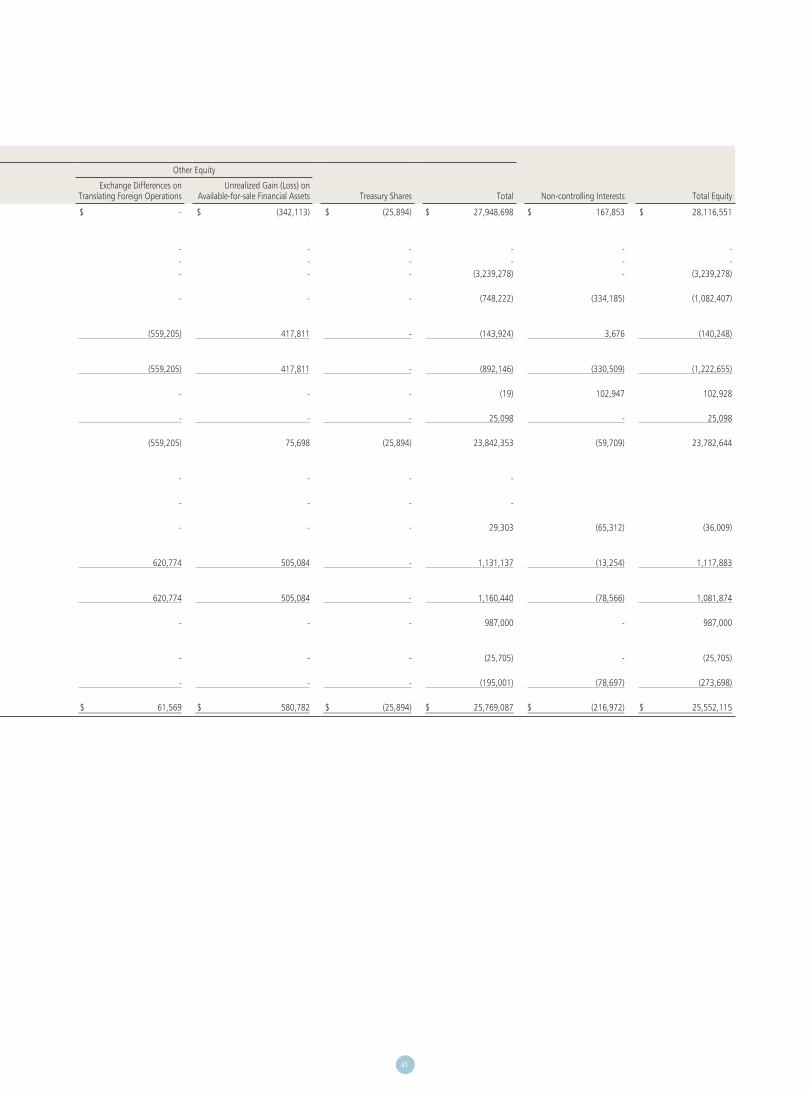
41
E INK HOLDINGS INC. AND SUBSIDIARIES
CONSOLIDATED STATEMENTS OF CHANGES IN EQUITY(In Thousands of New Taiwan Dollars, Except Dividends Per Share)
Equity Attributable to Owners of the Corporation
Non-controlling Interests Total Equity
Share Capital
Capital Surplus
Retained Earnings Other Equity
Treasury Shares TotalShares
(Thousands) Amount Legal Reserve Special ReserveUnappropriated
EarningsExchange Differences on
Translating Foreign OperationsUnrealized Gain (Loss) on
Available-for-sale Financial Assets
BALANCE AT JANUARY 1, 2012 1,080,173 10,801,778 $ 9,669,721 $ 402,798 $ 704,456 $ 6,737,952 $ - $ (342,113) $ (25,894) $ 27,948,698 $ 167,853 $ 28,116,551
Appropriation of 2011 earningsReversal of special reserve - - - - (433,021) 433,021 - - - - - -Legal reserve - - - 652,678 - (652,678) - - - - - -Cash dividends - $3 per share - - - - - (3,239,278) - - - (3,239,278) - (3,239,278)
Net loss for the year ended December 31, 2012 - - - - - (748,222) - - - (748,222) (334,185) (1,082,407)
Other comprehensive income (loss) for the year endedDecember 31, 2012, net of income tax - - - - - (2,530) (559,205) 417,811 - (143,924) 3,676 (140,248)
Total comprehensive income (loss) for the year endedDecember 31, 2012 - - - - - (750,752) (559,205) 417,811 - (892,146) (330,509) (1,222,655)
Partial acquisition of interests in subsidiaries - - - - - (19) - - - (19) 102,947 102,928
Conversion of employee share options 817 8,119 16,979 - - - - - - 25,098 - 25,098
BALANCE AT DECEMBER 31, 2012 1,080,990 10,809,897 9,686,700 1,055,476 271,435 2,528,246 (559,205) 75,698 (25,894) 23,842,353 (59,709) 23,782,644
Special reserve under Rule No. 1010012865 issued by the FSC - - - - 70,678 (70,678) - - - -
Special reserve - - - - 141,394 (141,394) - - - -
Net profit (loss) for the year ended December 31, 2013 - - - - - 29,303 - - - 29,303 (65,312) (36,009)
Other comprehensive income (loss) for the year endedDecember 31, 2013, net of income tax - - - - - 5,279 620,774 505,084 - 1,131,137 (13,254) 1,117,883
Total comprehensive income (loss) for the year endedDecember 31, 2013 - - - - - 34,582 620,774 505,084 - 1,160,440 (78,566) 1,081,874
Private issue of ordinary shares for cash - July 60,000 600,000 387,000 - - - - - - 987,000 - 987,000
Change in equity from investments in associates accountedfor by using equity method - - - - - (25,705) - - - (25,705) - (25,705)
Partial acquisition of interests in subsidiaries - - - - - (195,001) - - - (195,001) (78,697) (273,698)
BALANCE AT DECEMBER 31, 2013 1,140,990 11,409,897 $ 10,073,700 $ 1,055,476 $ 483,507 $ 2,130,050 $ 61,569 $ 580,782 $ (25,894) $ 25,769,087 $ (216,972) $ 25,552,115
The accompanying notes are an integral part of the consolidated financial statements.(With Deloitte & Touche audit report dated March 20, 2014)

42
E INK HOLDINGS INC. AND SUBSIDIARIES
CONSOLIDATED STATEMENTS OF CASH FLOWS(In Thousands of New Taiwan Dollars)
For the Year Ended December 31
2013 2012
CASH FLOWS FROM OPERATING ACTIVITIESLoss before income tax $ (211,490) $ (634,997)Adjustments for:Depreciation expenses 1,597,401 1,554,630Amortization expenses 460,916 505,238Net gain on fair value change of financial assets at fair value through profit or loss (69,337) (21,548)Interest expense 176,668 195,965Interest income (152,255) (157,154)Dividend income (62,161) (31,301)Compensation cost of employee share options - 8,190Share of profit of associates (1,105) (7,063)Net loss on disposal of property, plant and equipment 13,428 18,470Gain on disposal of investments (10,312) -Impairment loss recognized on non-financial assets 59,212 144,528Write-down (reversal) of inventories (779,069) 566,863Unrealized net loss (gain) on foreign currency exchange 27,317 (41,298)
Changes in operating assets and liabilitiesFinancial assets held for trading 81,000 (167,762)Notes and accounts receivable 3,393,023 2,442,330Accounts receivable from related parties 15,678 347,285Inventories 1,101,181 1,652,564Prepayments 221,374 (152,839)Other current assets 127,650 (110,468)Accounts payable (2,743,718) (308,806)Accounts payable to related parties 42,492 (10,593)Other payables (168,102) (292,015)Receipts in advance 258,976 490,209Other current liabilities 6,314 (340,397)Accrued pension liabilities (377,044) 55,351
Cash generated from operations 3,008,037 5,705,382Income tax paid (85,250) (397,317)
Net cash generated from operating activities 2,922,787 5,308,065
CASH FLOWS FROM INVESTING ACTIVITIESPurchase of available-for-sale financial assets - (135,697)Acquisition of associates (4,302) -Acquisition of subsidiaries - (1,269,527)Payments for property, plant and equipment (1,095,298) (1,470,805)Proceeds from disposal of property, plant and equipment 15,946 57,361Payments for intangible assets (32,273) (30,651)Decrease (increase) in other financial assets 45,752 (45,752)Decrease in other non-current assets 38,737 135,322Interest received 154,262 176,712Dividends received 62,161 31,301
Net cash used in investing activities (815,015) (2,551,736)
(Continued)
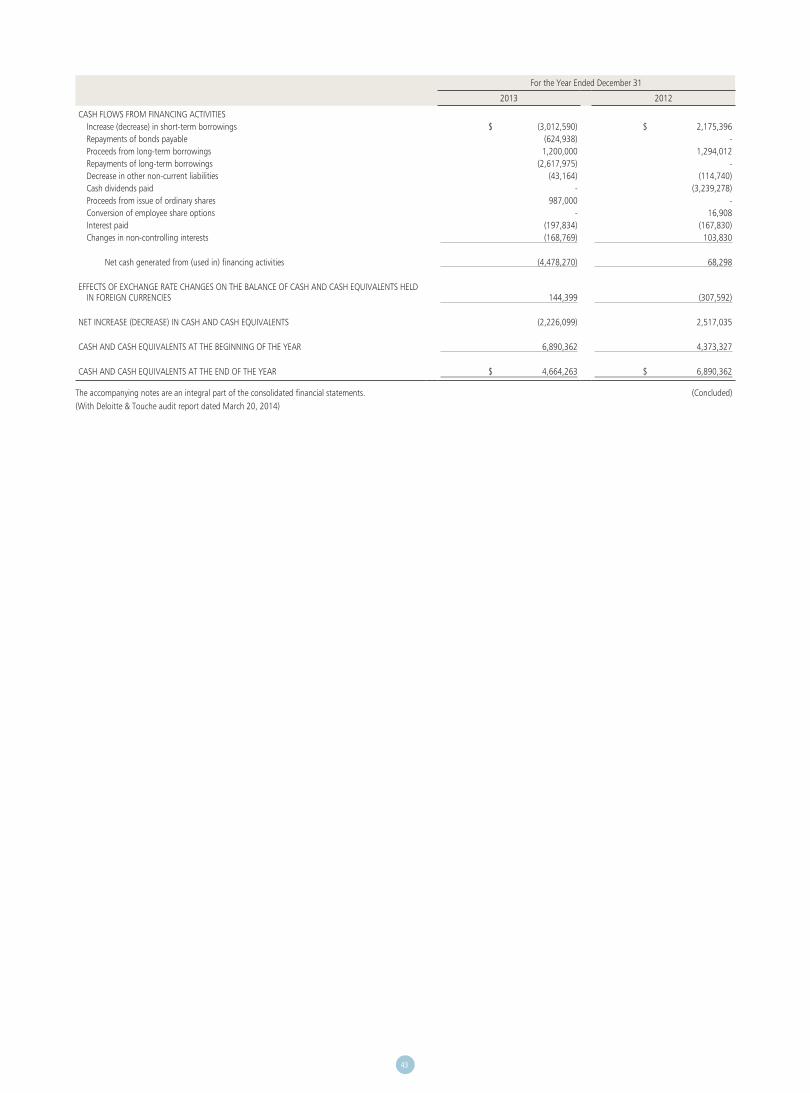
43
For the Year Ended December 31
2013 2012
CASH FLOWS FROM FINANCING ACTIVITIESIncrease (decrease) in short-term borrowings $ (3,012,590) $ 2,175,396Repayments of bonds payable (624,938) -Proceeds from long-term borrowings 1,200,000 1,294,012Repayments of long-term borrowings (2,617,975) -Decrease in other non-current liabilities (43,164) (114,740)Cash dividends paid - (3,239,278)Proceeds from issue of ordinary shares 987,000 -Conversion of employee share options - 16,908Interest paid (197,834) (167,830)Changes in non-controlling interests (168,769) 103,830
Net cash generated from (used in) financing activities (4,478,270) 68,298
EFFECTS OF EXCHANGE RATE CHANGES ON THE BALANCE OF CASH AND CASH EQUIVALENTS HELDIN FOREIGN CURRENCIES 144,399 (307,592)
NET INCREASE (DECREASE) IN CASH AND CASH EQUIVALENTS (2,226,099) 2,517,035
CASH AND CASH EQUIVALENTS AT THE BEGINNING OF THE YEAR 6,890,362 4,373,327
CASH AND CASH EQUIVALENTS AT THE END OF THE YEAR $ 4,664,263 $ 6,890,362
The accompanying notes are an integral part of the consolidated financial statements. (Concluded)(With Deloitte & Touche audit report dated March 20, 2014)

E INK
HO
LDIN
GS IN
C. 2013 A
nnual Report
E INK HOLDINGS INC.2013 Annual Report
EIH: 8069*Taiwan Stock Exchang Market Observation Post System: http://mops.tse.com.tw*EIH annual report is available at http://www.einkgroup.com Printed on April 20, 2014
No.3, Lixing 1st Rd., Hsinchu Science Park, Hsinchu 300, TaiwanTel: 886 3 5798599 Fax: 886 3 5788339http://www.einkgroup.com
Copyrights of some images used in this report belong to Yota Devices、Amazon、Vanguard ID、PocketBook、Deutsche Telekom Group、Twelve24、Central Standard Timing." YotaPhone " is a registered trademark of Yota Devices." Kindle Paperwhite " is a registered trademark of Amazon.com, Inc. " View Tag " is a registered trademark of Vanguard ID. " CAD Reader" is a registered trademark of PocketBook. "Tolino Shine" is a registered trademark of Deutsche Telekom Group. " Tolino Shine " is a registered trademark of Deutsche Telekom Group. " ClockOne" is a registered trademark of Twelve24. " CST-01" is a registered trademark of Central Standard Timing.
E INK HOLDINGS INC.