Embed Size (px)
Citation preview
E-Invoice Adoption in Organizations
Markku Lahtinen
Department of Marketing
Hanken School of Economics
Supervisor prof. Veronica Liljander
Helsinki
2012
1
HANKEN SCHOOL OF ECONOMICS
Department of: Marketing
Type of work: Thesis
Author: Markku Lahtinen Date: 2012
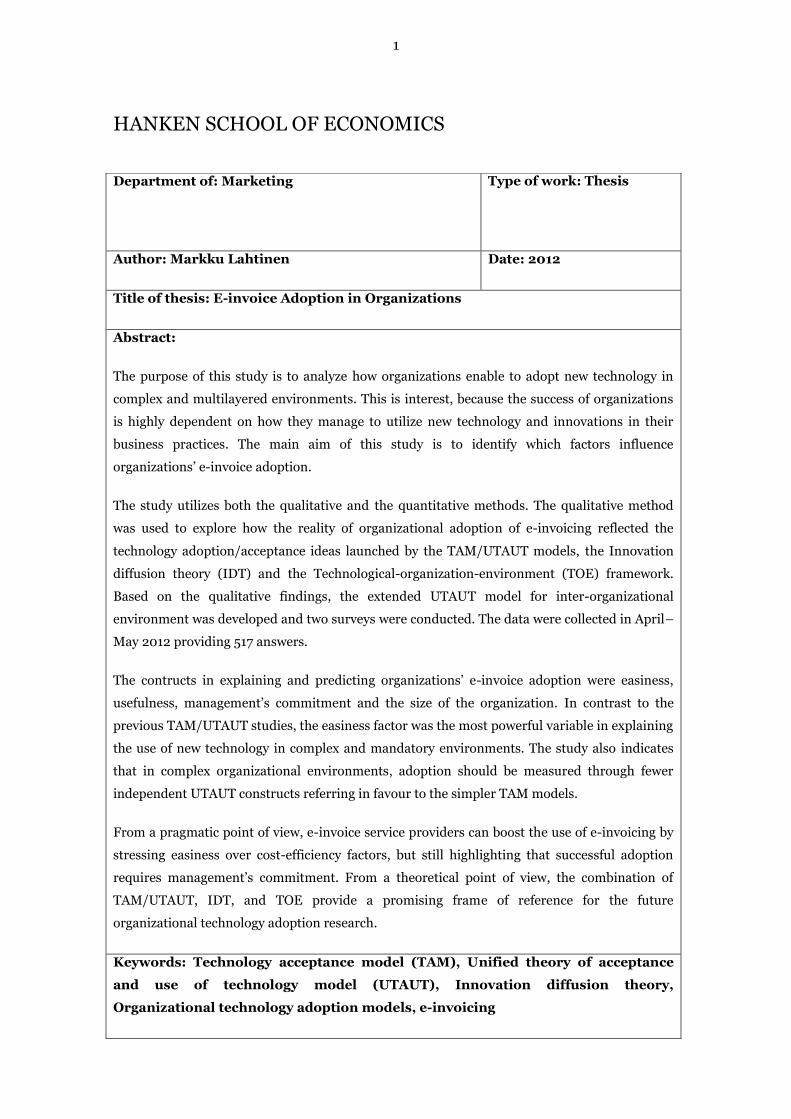
Title of thesis: E-invoice Adoption in Organizations
Abstract:
The purpose of this study is to analyze how organizations enable to adopt new technology in
complex and multilayered environments. This is interest, because the success of organizations
is highly dependent on how they manage to utilize new technology and innovations in their
business practices. The main aim of this study is to identify which factors influence
organizations’ e-invoice adoption.
The study utilizes both the qualitative and the quantitative methods. The qualitative method
was used to explore how the reality of organizational adoption of e-invoicing reflected the
technology adoption/acceptance ideas launched by the TAM/UTAUT models, the Innovation
diffusion theory (IDT) and the Technological-organization-environment (TOE) framework.
Based on the qualitative findings, the extended UTAUT model for inter-organizational
environment was developed and two surveys were conducted. The data were collected in April–
May 2012 providing 517 answers.
The contructs in explaining and predicting organizations’ e-invoice adoption were easiness,
usefulness, management’s commitment and the size of the organization. In contrast to the
previous TAM/UTAUT studies, the easiness factor was the most powerful variable in explaining
the use of new technology in complex and mandatory environments. The study also indicates
that in complex organizational environments, adoption should be measured through fewer
independent UTAUT constructs referring in favour to the simpler TAM models.
From a pragmatic point of view, e-invoice service providers can boost the use of e-invoicing by
stressing easiness over cost-efficiency factors, but still highlighting that successful adoption
requires management’s commitment. From a theoretical point of view, the combination of
TAM/UTAUT, IDT, and TOE provide a promising frame of reference for the future
organizational technology adoption research.
Keywords: Technology acceptance model (TAM), Unified theory of acceptance
and use of technology model (UTAUT), Innovation diffusion theory,
Organizational technology adoption models, e-invoicing
2
CONTENTS
1 INTRODUCTION...................................................................................... 6
1.1. Background ......................................................................................................... 6
1.2. Research Problem ............................................................................................... 9
1.3. Aim of the Study ................................................................................................ 13
1.4. Structure of the Study ....................................................................................... 13
2 ORGANIZATIONAL TECHNOLOGY ADOPTIONS MODELS ............. 16
2.1. Technology Adoption and Innovation Diffusion Research ............................... 16
2.2. Technology Acceptance Model (TAM) .............................................................. 17
2.3. Unified Theory of Acceptance and Use of Technology Model (UTAUT) ......... 20
2.4. Innovation Diffusion Approach ........................................................................24
2.4.1. Innovation Diffusion Theory (IDT) ...........................................................24
2.4.2. The Technology-Organization-Environment (TOE) Framework ..............29
2.5. Summary of the Combined Adoption and Innovation Diffusion Research ...... 31
2.6. Proposed UTAUT Model for the Empirical E-invoice Survey .......................... 34
2.6.1. Adjustments of the Constructs .................................................................. 35
2.6.2. From individual to Organizational Perspective ......................................... 36
2.6.3. Defining the Dependent Variable .............................................................. 37
3 METHOD ................................................................................................ 38
3.1. Research Design ............................................................................................... 38
3.2. Qualitative Research Method ............................................................................ 39
3.2.1. Access to Qualitative Data ......................................................................... 39
3.2.2. Sampling of the Qualitative Interviews ..................................................... 39
3.2.3. Interview Guide Design and Interviews ................................................... 40
3.3. Analysis of the Qualitative Interviews ...............................................................42
3.3.1. E-invoice as an Innovation Type .............................................................. 43
3.3.2. Adopter Categorization .............................................................................. 43
3.3.3. Resources Available Directing Adoption and Use ................................... 44
3.3.4. Management’s Impact on Technology Adoption ...................................... 46
3.3.5. Organizations’ Plans regarding the Direct Debit Replacement ................ 47
3.3.6. Summary of the Qualitative Findings ....................................................... 49
3.4. Hypotheses for the Survey Study ..................................................................... 49
3.5. Quantitative Research Method ......................................................................... 52
3
3.5.1. Sampling of the Quantitative Data ............................................................ 54
3.5.2. Descriptive Statistics of E-invoice Survey ................................................. 54
3.5.3. Descriptive Statistic of Finnish Direct Debit (FDD) Survey ...................... 56
3.6. Quantitative Analysis Methods ......................................................................... 57
3.6.1. Factor Analysis........................................................................................... 57
3.6.2. Logistic Regression Analysis......................................................................58
3.6.3. Independent-Samples T-Test ....................................................................58
3.7. Quality of the Research ..................................................................................... 59
4 RESULTS ................................................................................................ 61
4.1. Analysis of Quantitative E-invoice Survey ........................................................ 61
4.1.1. Basic Assumptions ..................................................................................... 61
4.1.2. Factor Analysis...........................................................................................62
4.1.3. Logistic Regression Analysis of the Proposed UTAUT Model ................. 69
4.2. Hypotheses Testing ........................................................................................... 71
4.3. The Summary of Hypotheses Testing ............................................................... 77
5 DISCUSSION .......................................................................................... 79
5.1. Constructs Affecting to E-invoice Adoption ...................................................... 79
5.2. Theoretical Implications ................................................................................... 81
5.2.1. Model for E-invoice Adoption Research .................................................... 81
5.2.2. Applicability of the Proposed UTAUT Model ............................................ 81
5.3. Managerial Implications .................................................................................. 82
5.4. Finnish Direct Debit Payment Scheme (FDD) ................................................. 84
5.5. Limitations and Further Research ....................................................................85
5.6. Concluding Remarks ........................................................................................ 86
REFERENCES ............................................................................................ 88
4
APPENDICES
TABLES
Table 1 The Core Constructs of the UTAUT Model (Venkatesh et al. 2003, 466–467) ................................................................................................................. 22
Table 2 Independent Variables Related to Organizational Innovativeness (Rogers 2003) ..............................................................................................................26
Table 3 Adopter Types According to S-Shape Curve (Rogers 2003, 282–297) ......... 28
Table 4 The Fundamental Constructs of the UTAUT, IDT, and TOE ......................... 32
Table 5 Data Sources of the Qualitative Interviews .................................................. 40
Table 6 Interview Guide for the Qualitative Interviews .............................................. 41
Table 7 The Adoption Type of the Interviewed Organizations .................................. 44
Table 8 The Research Hypotheses .............................................................................. 51
Table 9 The Adjusted UTAUT Questionnaire for the E-invoice Survey...................... 53
Table 10 The Organizations by Size (E-invoice Survey) ............................................... 55
Table 11 The Organizations by Industry (E-invoice Survey) ........................................ 55
Table 12 The Organizations’ Capability of Sending and Receiving E-invoices ............ 56
Table 13 The Organizations by Size (the FDD Survey) ................................................. 57
Table 14 Items and their Abbreviations Used in the Model and the Questionnaire ....62
Table 15 Summated Scales and Communalities of Factor Analysis ........................... 65
Table 16 Reliability of Scale ......................................................................................... 68
Table 17 Pearson Correlations between the Factors .................................................... 69
Table 18 Regression Prediction Likelihood of an Organization Adopting E-invoice ... 71
Table 19 The Summary of Hypotheses Testing............................................................. 78
5
FIGURES
Figure 1 The Invoicing Process (e-invoice part adapted from Caluawaerts 2010, 233) .................................................................................................................. 8
Figure 2 The Main Alternative Payment Modes for the Expiring Finnish Direct Debit (FDD) .................................................................................................... 12
Figure 3 Reader’s Structure Navigator ........................................................................ 15
Figure 4 The Basic Idea of the Technology Adoption Model (Venkatesh and Davis 2000) .............................................................................................................. 18
Figure 5 The Original UTAUT model (Venkatesh 2003) .............................................. 21
Figure 6 Proposed UTAUT Model for E-invoice Adoption in Organizations ............... 35
Figure 7 The Results of Factor Analysis........................................................................ 67
Figure 8 Alternatives for the FDD Payment Scheme .................................................... 76
6
1 INTRODUCTION
1.1. Background
New technology has revolutionized companies’ competitive landscape in many ways.
New economy, e-commerce, e-service, e-marketing, e-procurement, and e-payment
among other concepts reflect well the dramatic evolution from fairly predictable brick-
and-mortar business to quickly changing and often more unpredictable environment.
Today all companies are in practice capable of investing state-of-the-art information
technology due to the decreasing cost of technology. Thus, technology as such rarely is
the only competitive edge for any company, but it works as an antecedent for a
competitive way of doing business. In general, organizations that are forerunners in
adopting new technology are also often in a favourable position to find new options for
decreasing operational and opportunity cost, increasing the amount of transactions and
improving service quality (Ozdemir et al. 2008, 213). The organization-wide
information systems help to eliminate data silos by creating single business database,
enable better measurement of goal and results, and enhance strategic planning in
organizations (Fillion et al. 2010, 13). In addition, the technological intensive solutions
enable to create wide informational networks that increase the value of data and
knowledge among companies and other actors (Gowrisankaran and Stavins 2004,
260).
The bank and finance industry is an illustrative example on the business sector which
has intensively utilized information and communication technology (Ozdemir et al.
2008, 212). Undoubtedly, Finland is a forerunner in e-banking and e-invoicing1
compared to the world and the other European countries. Approximately 90% of
Finnish consumers have the online banking service at their disposal. In similar vein,
the share of electronic credit transfer transactions is very close to 100%. However, the
actual penetration rate regarding to an e-invoice is still slow related to Finland’s
favourable infrastructural environment and advanced e-payment servicescape. In
business-to-business (B2B), the e-invoice penetration is 60%, and in business-to-
1 An e-invoice is an electronic invoice constructed according to a generally used message format, whose
data can be processed and interpreted automatically. E-invoices are transmitted via a telecommunications
service provider or a bank (Statistic Finland 2012). In principle, once the invoice data is transformed into
an electronic form, the data can be utilized through the whole business value network without re-entering
the data into an organization’s information systems.
7
consumer (B2C) e-invoicing the penetration rate is about 10-20 %. At the European
level, the penetration rate is 5–10% (Expert group on e-invoicing 2009).
The evolution of the electronic payment platforms has made the processes of financial
administration and accounting more transparent and comparable with other business
costs. As a result, the management has increasingly realized that in financial
administration might lay hidden costs and opportunities to improve operational
efficiency.
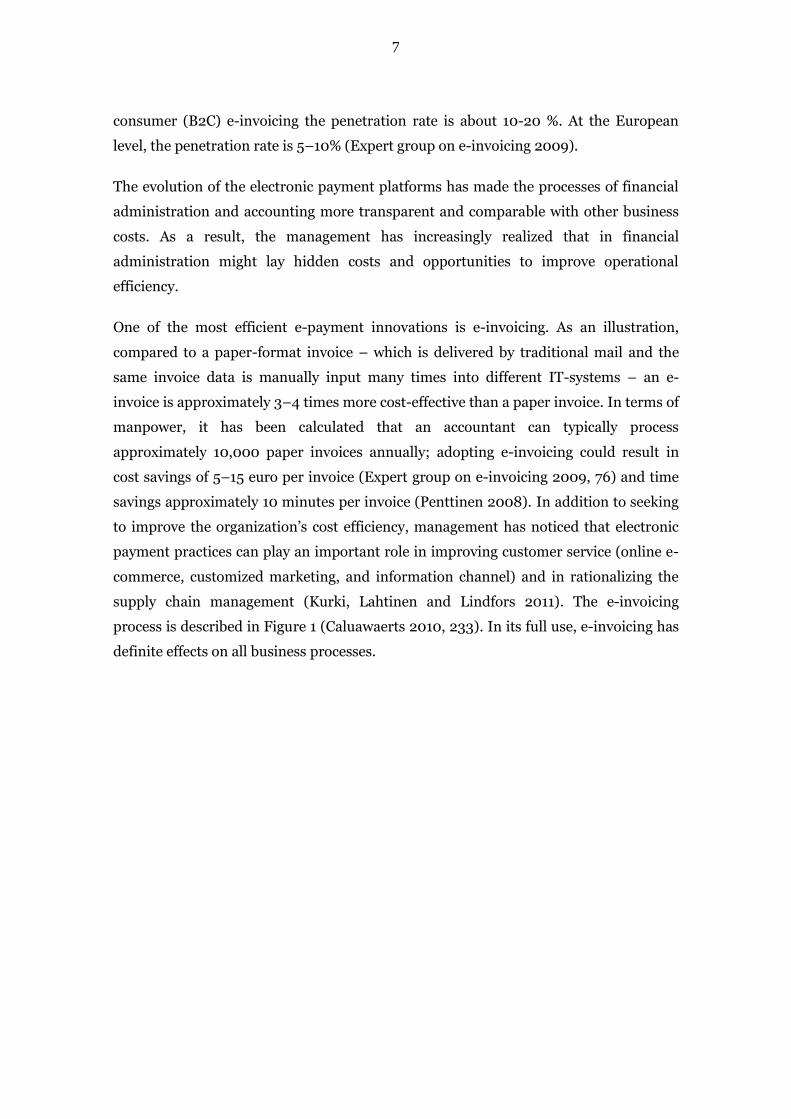
One of the most efficient e-payment innovations is e-invoicing. As an illustration,
compared to a paper-format invoice – which is delivered by traditional mail and the
same invoice data is manually input many times into different IT-systems – an e-
invoice is approximately 3–4 times more cost-effective than a paper invoice. In terms of
manpower, it has been calculated that an accountant can typically process
approximately 10,000 paper invoices annually; adopting e-invoicing could result in
cost savings of 5–15 euro per invoice (Expert group on e-invoicing 2009, 76) and time
savings approximately 10 minutes per invoice (Penttinen 2008). In addition to seeking
to improve the organization’s cost efficiency, management has noticed that electronic
payment practices can play an important role in improving customer service (online e-
commerce, customized marketing, and information channel) and in rationalizing the
supply chain management (Kurki, Lahtinen and Lindfors 2011). The e-invoicing
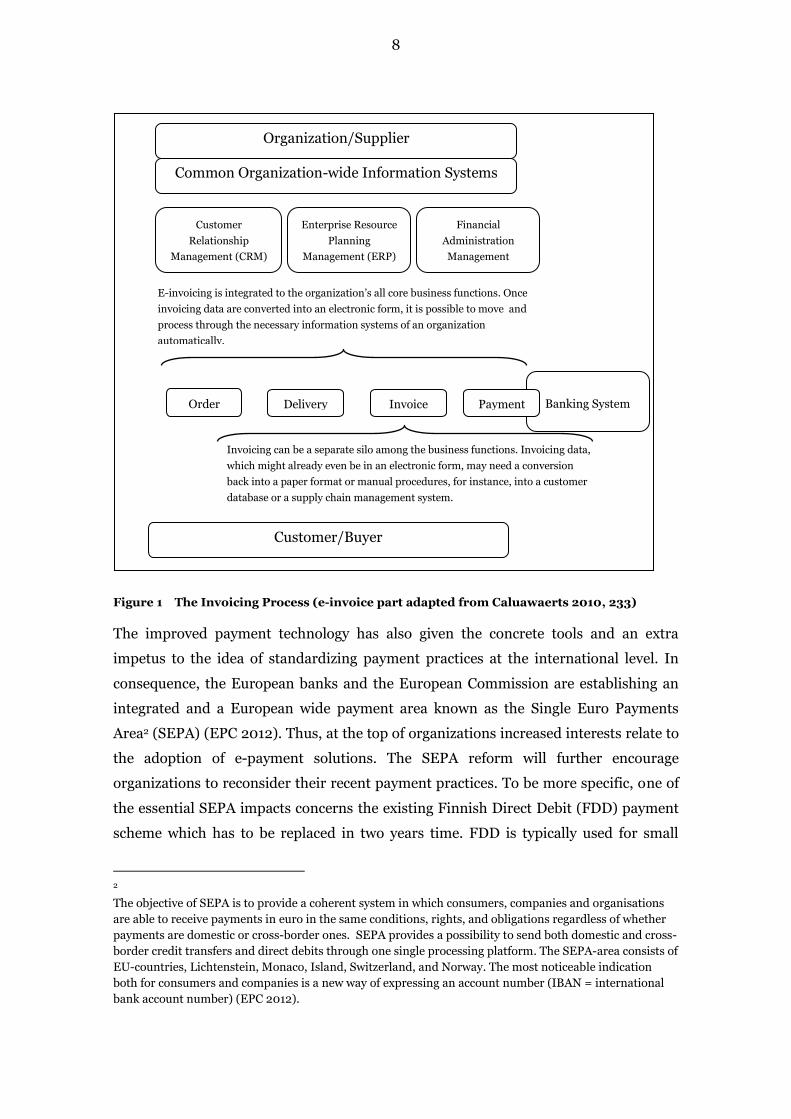
process is described in Figure 1 (Caluawaerts 2010, 233). In its full use, e-invoicing has
definite effects on all business processes.
8
Figure 1 The Invoicing Process (e-invoice part adapted from Caluawaerts 2010, 233)
The improved payment technology has also given the concrete tools and an extra
impetus to the idea of standardizing payment practices at the international level. In
consequence, the European banks and the European Commission are establishing an
integrated and a European wide payment area known as the Single Euro Payments
Area2 (SEPA) (EPC 2012). Thus, at the top of organizations increased interests relate to
the adoption of e-payment solutions. The SEPA reform will further encourage
organizations to reconsider their recent payment practices. To be more specific, one of
the essential SEPA impacts concerns the existing Finnish Direct Debit (FDD) payment
scheme which has to be replaced in two years time. FDD is typically used for small
2
The objective of SEPA is to provide a coherent system in which consumers, companies and organisations
are able to receive payments in euro in the same conditions, rights, and obligations regardless of whether
payments are domestic or cross-border ones. SEPA provides a possibility to send both domestic and cross-
border credit transfers and direct debits through one single processing platform. The SEPA-area consists of
EU-countries, Lichtenstein, Monaco, Island, Switzerland, and Norway. The most noticeable indication
both for consumers and companies is a new way of expressing an account number (IBAN = international
bank account number) (EPC 2012).
Organization/Supplier
Customer/Buyer
E-invoicing is integrated to the organization’s all core business functions. Once
invoicing data are converted into an electronic form, it is possible to move and
process through the necessary information systems of an organization
automatically.
Invoicing can be a separate silo among the business functions. Invoicing data,
which might already even be in an electronic form, may need a conversion
back into a paper format or manual procedures, for instance, into a customer
database or a supply chain management system.
Order Delivery Invoice
Banking System Payment
Common Organization-wide Information Systems
Customer
Relationship
Management (CRM)
Enterprise Resource
Planning
Management (ERP)
Financial
Administration
Management
9
recurring payments such as mortgage deductions, maintenance charges, and magazine
subscriptions. Among the FDD users there are a great deal of potential for new e-
invoice adopters which is especially an attractive option for invoicing organizations due
to the cost-efficiency of e-invoice compared to the other invoicing alternatives.
1.2. Research Problem
The purpose of this study is to analyze a type of innovation and technology adoption
that has strong effects and tide bonds in its mature use both to the organization’s
internal business processes and the external competitive environment. This study
focuses on the adoption of e-invoicing in organizations.
The study contributes to the conceptual level what are the affecting factors
influencing to decision-making and adoption of an electronic service, in this case
invoicing. The technology adoption or acceptance models and the innovation diffusion
approaches will be utilized in this study. The disciplines have a long tradition in the
field of marketing research (Roger 2003) whether it is a question of the studies
concerning the consumers’ or organizations’ technology adoption.
To my knowledge, e-invoicing as an e-payment innovation has not been
comprehensively studied from the point of view in which organizations are linked at the
same time both to internal – intra-organizational – and the external competitive
context. This gap in knowledge may contain a hidden theoretical wisdom how the
innovations similar to e-invoicing – which are closely interlinked with many internal
and external business operations at the same time – can be effectively adopted in
organizations. In sum, the conceptual knowledge is needed in order to find
prerequisites for successful innovation adoption.
However, the electronic payment technology has to some extent caught the interest of
academic research. There are a few recent studies on the value creation of e-invoicing
(e.g. Korkman, Storbacka and Harald 2010), on the benefits of e-invoice (e.g.
Caluwaerts 2010), on consumers’ technology adoption (e.g. Juntumaa 2011), and on the
wider perspective of e-business and e-procurement (e.g. Lin and Lin 2008,
Gowrisankaran and Stavins 2004). In addition, the business interest organizations (e.g.
Chamber of Commerce, Federation of Finnish Financial Services) survey the
development of the e-invoice at the descriptive level. Nevertheless, previous studies
10
have their credits, but they fail to find an answer why the electronic payment
technology adoption lags and progress is slow.
The low innovation penetration rate is usually a serious burden for organizations and
business actors that aim to benefit from the use of any new technology which is strongly
dependent on external actors and factors (Gowrisankaran and Stavins 2004, 260). This
question is vital, because the investments related to information and communication
technology cover already about 50% of all investment in companies (Venkatesh et al.
2003, 426). It has also been stated that the adoption of enterprise-wide information
technologies cover already a third of all major change activities in companies (Fillion et
al. 2010, 12–13). Nevertheless, to be prepared for the use of a new technology, the
organization needs to make necessary investments, but returns of investments in the
form of decreased costs or the other benefits will not result in if the innovation
penetration rate does not expand widely through the organization’s cooperation
network (Gowrisankaran and Stavins 2004, 260–261). In other words, all innovations
that remain underutilized endanger the organizations’ competitiveness. Therefore, e-
invoicing as an underutilized innovation is a rewarding research target, because it is
intensively related in its full potential to enterprise-wide information systems and
affects on nearly all of organization’s business processes.
A side of above referred conceptual research motives, there are also many pragmatic
reasons originated from business why e-invoice adoption is worth studying. Firstly,
the essential electronic invoice service providers – banks, software companies, and e-
invoice operators – supported by governmental promotional aid have been boosting the
use of e-invoices for a long time with the marketing slogans such as electronic invoicing
“saves costs”, “accelerates money circulation”, and “improves the efficiency of a value
chain”. The key benefits of invoicing are also mentioned to enhance competitiveness,
improve cash flow, improve the efficiency of IT systems, and to sustain the earth’s
environmental value (Expert group on e-invoicing 2009, 4). Notwithstanding of these
indisputable benefits, the e-invoice adoption rate has not accelerated as smoothly the
experts have been forecasting nearly a decade. In fact, the amount of e-invoices from all
invoices is still only 5% of all invoices at the European level (Caluwaerts 2010), and
about 15% at the Finnish level (Helsinki Region Chamber of Commerce 2010). In other
words, e-invoicing is an example on an innovation which stumbles though there should
not be any serious technological, infrastructural, administrational, and regulative
obstacles to the use of e-invoice.
11
Secondly, there are still a lot of untapped potential for improving cost burden. For
example, in Finland annually there are 500 million invoices sent; 200 million are
business-to consumer (B2C) invoices from which approximately only 10 million
invoices are in the format of an e-invoice. Thus, merely increasing the amount of B2C-
e-invoing to 50 million new e-invoices would lead cautiously estimating to 200 million
euro cost savings. Unfortunately, the consumers’ e-invoice adoption rate has been
unexpectedly moderate: the annual e-invoice adoption rate among consumers has been
a modest 3–4% in 2009–2011 (Federation of Finnish Financial Services 2011). One
reason for the low adoption rate is the invoicing organizations’ immature e-payment
capabilities which seem to differ greatly between large and small organizations.
Thirdly, from a management point of view, the fast development of technology
simultaneously results in complex and fast evolving systems (Turban et al. 2010, 69). It
is widely recognized that despite of many advantages connected to new technologies
(Asare et al. 2011, 193), the adoption and implementation is both challenging and costly
for companies (Lippert and Davis 2006). Some empirical studies have even revealed
that only one-half of large scale IT project initiatives achieve the anticipated results
(Neufeld et al. 2007, 494). Similarly, when adopting B2B technology, a quarter of the
organisations have reported at least the temporarily drop in revenues (Asare et al. 2011,
193). To summarize, organizations’ success in competition is highly dependent on how
they manage to adopt and diffuse new technology and innovations in their business
practices.
Finally, the invoicing organizations need to solve how they replace the disappearing
FDD invoicing practices due to SEPA reform. At the moment, there are approximately 3
million consumers and at least 60,000 invoicing organizations that have FDD invoicing
at their disposal (Federation of Finnish Financial Services 2011).This sets a huge
marketing challenge for the banks and the organizations on how they succeed to
communicate to their customer about the changing payment practices and preferably to
move them into e-invoice users.
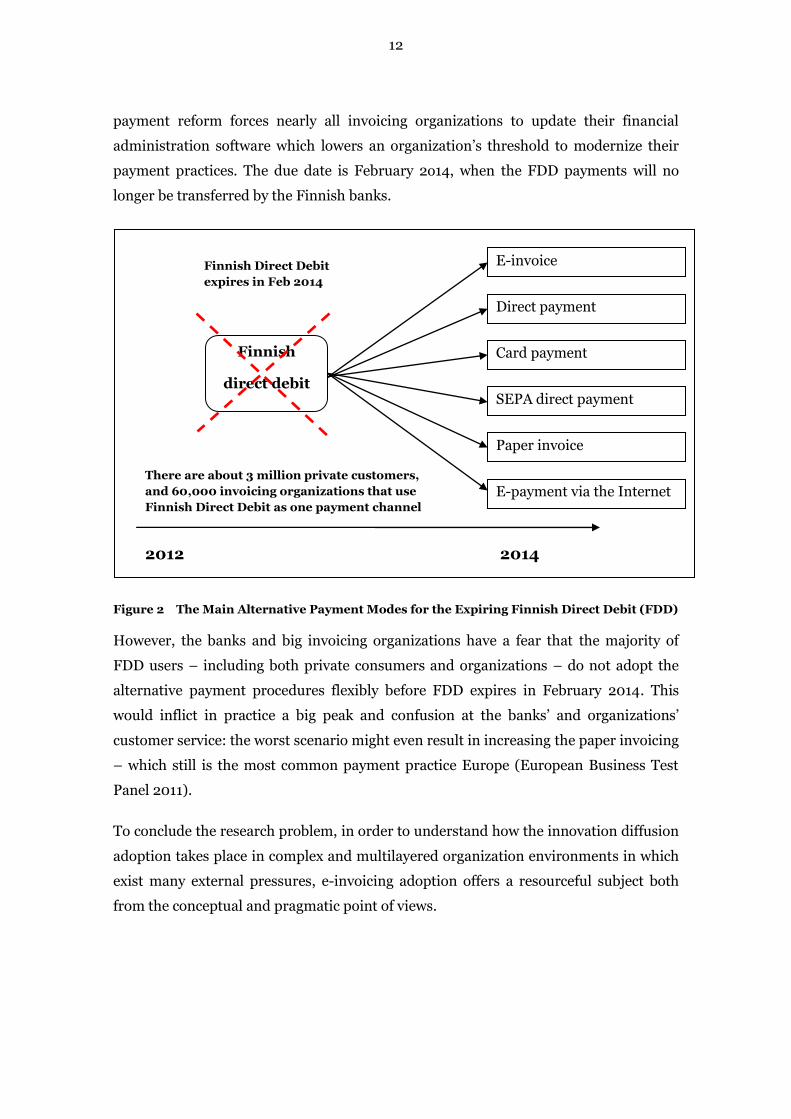
As it has been presented in Figure 1, the state-of-the-art e-invoicing is inherently
related to organizations’ information systems such as customer relationship
management (CRM) and enterprise resource planning (ERP). SEPA reform accelerates
organizations’ interest to consider moving users to e-invoicing. The potential payment
options are presented in Figure 2 (different invoice modes are explained in detail in
Appendix 4) from which e-invoicing is the Banks’ primary target. The European-wide
12
payment reform forces nearly all invoicing organizations to update their financial
administration software which lowers an organization’s threshold to modernize their
payment practices. The due date is February 2o14, when the FDD payments will no
longer be transferred by the Finnish banks.
Figure 2 The Main Alternative Payment Modes for the Expiring Finnish Direct Debit (FDD)
However, the banks and big invoicing organizations have a fear that the majority of
FDD users – including both private consumers and organizations – do not adopt the
alternative payment procedures flexibly before FDD expires in February 2014. This
would inflict in practice a big peak and confusion at the banks’ and organizations’
customer service: the worst scenario might even result in increasing the paper invoicing
– which still is the most common payment practice Europe (European Business Test
Panel 2011).
To conclude the research problem, in order to understand how the innovation diffusion
adoption takes place in complex and multilayered organization environments in which
exist many external pressures, e-invoicing adoption offers a resourceful subject both
from the conceptual and pragmatic point of views.
E-invoice
2012
2014
Finnish
direct debit
Direct payment
Card payment
SEPA direct payment
Paper invoice
Finnish Direct Debit
expires in Feb 2014
E-payment via the Internet There are about 3 million private customers,
and 60,000 invoicing organizations that use
Finnish Direct Debit as one payment channel
13
1.3. Aim of the Study
The main aim of this study is to identify which factors influence the organizations
adoption of e-invoicing. In addition, the study explores what kind of alternatives the
invoicing organizations will adopt to replace the Finnish direct debit (FDD) payment
scheme that expires due to the Single Euro Payment Area (SEPA). This is of interest
because e-invoicing is one of the main alternatives for FDD. The study contributes to
the theoretical development of the UTAUT model applied in complex and multilayered
organization environments.
1.4. Structure of the Study
In Chapter 2, the relevant technology adoption and innovation diffusion research is
discussed. Firstly, the technology acceptance model (TAM) is presented in order to get
a general overview of the research tradition, and the fundamental ideas and the results
achieved. The TAM model is one of the most commonly used models for studying
adoption behaviour. However, it has also been criticized for not explaining how the
external factors outside of the organization affect the adoption process. Secondly, the
Unified theory of acceptance and use of technology model (UTAUT) – which is selected
to the main model of this study – is described and the key constructs are explained.
Then the two main approaches of innovation diffusion – the Innovation diffusion
theory3 (IDT) and the Technology-organization-environment framework (TOE) are
described (Oliveira and Martins 2011, 110). IDT and TOE approaches enrich the
UTAUT model by deepening the understanding of how the external conditions and the
organizational level aspects influence on technology adoption. Theory of planned
behaviour (TPB) – which is also a regularly used model – is excluded, since it has been
included into the UTAUT model. Finally, the theoretical discussion is summarized and
justified into the aim of study and the applied UTAUT model proposed.
In Chapter 3, the research method will be described. The study uses a mixed-method
approach, meaning that it utilizes both qualitative and quantitative methods. First, in
the qualitative research design is developed, and the access to data, sampling, interview
guide are described. The purpose of the qualitative study is to understand the reasons
to adopt, or not to adopt, e-invoicing. The results of qualitative interviews are presented
already in this chapter, because it affects on the formulation of quantitative research
3 In the literature, innovation diffusion theory (IDT) is also written in a form of diffusion of innovation
(DOI).
14
design. The UTAUT model is adjusted to the context of this study, the sample is
described, the statistical methods utilized in the study are presented, and the
hypotheses are constructed based on the model. The purpose of the survey is designed
to answer the created hypotheses. Finally, quality of research is discussed.
In Chapter 4, the research results are reported starting from the findings of the e-
invoice and the Finnish direct debit (FDD) survey. At the end of the chapter, the
hypothesis testing is accomplished.
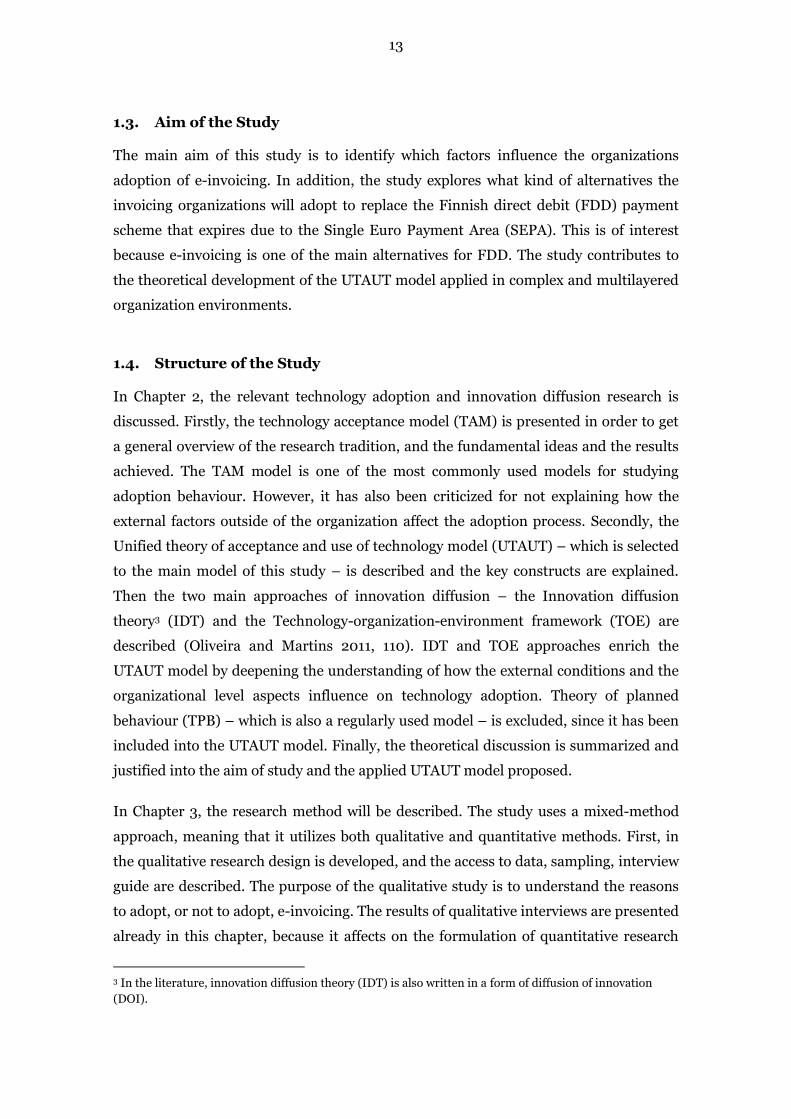
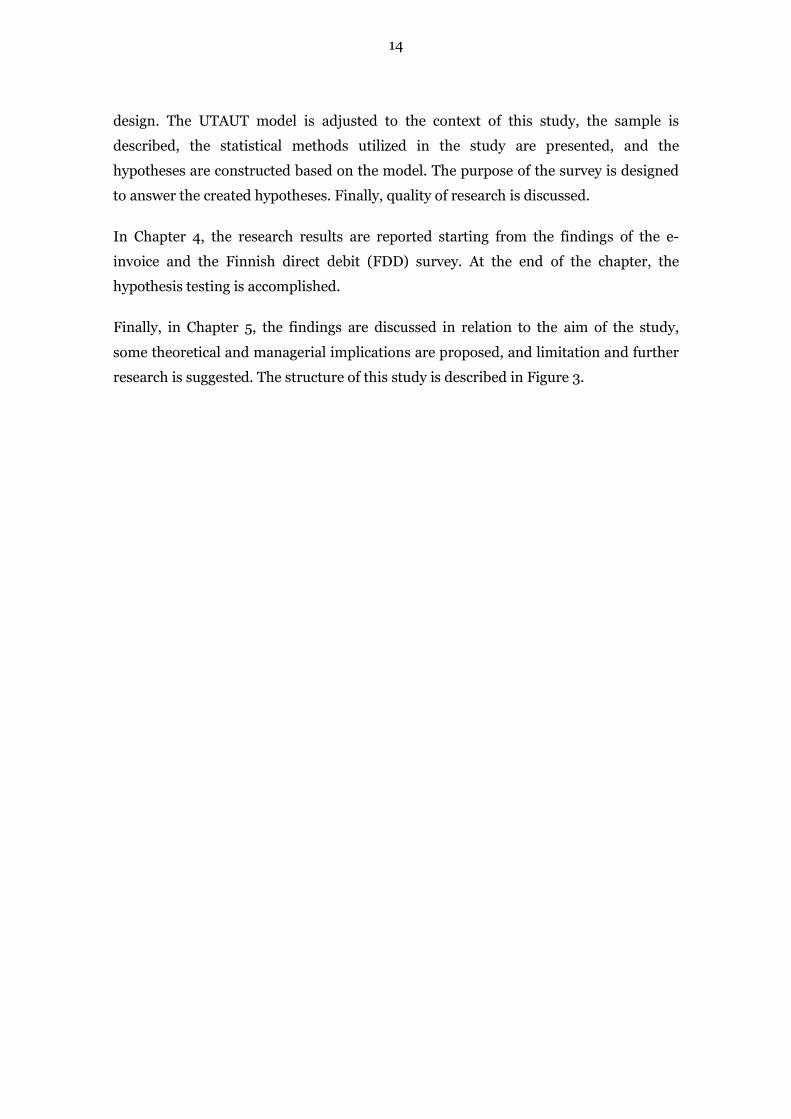
Finally, in Chapter 5, the findings are discussed in relation to the aim of the study,
some theoretical and managerial implications are proposed, and limitation and further
research is suggested. The structure of this study is described in Figure 3.
15
Figure 3 Reader’s Structure Navigator
Introduction
Technology adoption models
Method
Results
Discussion
-Qualitative research method -Analysis of the qualitative interviews -Revision of the proposed model -Hypotheses creation -Quantitative research method -Defining the measures for the UTAUT constructs -Statistical methods applied -Quality of research
-Technology acceptance model (TAM) -Unified theory of acceptance and use of technology (UTAUT) -Innovation diffusion approaches (IDT, TOE) -Applied UTAUT model developed for e-invoice study
-Research problem -Aim of the study
-Analysis of e-invoice survey -Analysis of Finnish direct debit (FDD) survey -Hypotheses testing
-Theoretical implications -Managerial implications -Limitations and further research -Conclusions
CHAPTER ESSENTIAL CONTENT
16
2 ORGANIZATIONAL TECHNOLOGY ADOPTIONS MODELS
This chapter discusses technology adoption and innovation diffusion approaches that
are both essential in explaining why and how the new technologies are adopted. Firstly,
the Technology acceptance model (TAM) is presented in order to get a general overview
about the research tradition and the fundamental ideas and the results achieved.
Secondly, the Unified theory of acceptance and use of technology model (UTAUT) –
which is selected as the main model of this study – is described and the key constructs
are explained. Then the two other main approaches of innovation diffusion – the
Innovation diffusion theory4 (IDT) and the Technology-organization-environment
framework (TOE) are described (Oliveira and Martins 2011, 110). Finally, theoretical
discussion is summarized and justified into the aim of study and the UTAUT model of
frame of reference.
2.1. Technology Adoption and Innovation Diffusion Research
Technology adoption research is an illustrative example on interdisciplinary approach
with many theoretical models. Many of the core theoretical constructs, concepts and
principal knowledge are drawn from social psychology, psychology, theory of human
behaviour sociology, social cognitive theory, and information systems (IS) (Venkatesh
et al. 2003, 428–432; Chiu et al. 2010, 445). Due to its cross-disciplinary nature,
adoption research has generated various applications on the research field. This
development has slightly undermined the effort of building a coherent technology
adoption theory (Venkatesh et al. 2003; Juntumaa 2011, 7). Furthermore, these models
have been living rather independent lifes (Oliveira and Martins 2011, 110) resulting in
constructs which are overlapping (Chiu et al. 2010, 446). Finally, the model variety has
resulted in mixed findings (Davis et al. 1989, 983).
Most of the adoption literature states that the decisions to adopt and use innovations in
organizations are determined by technological, adopter specific and contextual factors
(Fuchs et al. 2010, 49). The points of interest have covered technology adoption
ranging from intrinsic user characteristics, organizational characteristics, technology-
product related characteristics to environmental influence factors (Chiu et al. 2010,
445)
4 In the literature, innovation diffusion theory (IDT) is also written in a form of diffusion of innovation
(DOI).
17
However, the original TAM model introduced by Davis (1989) has both inspired and
preserved its relevance in technology adoption research whether the focus has been on
innovation, e-business or new technological application (Yi et al. 2005, 351).
Technology adoption research has been widely applied in marketing contexts,
management, and information systems studies (Rogers 2003, 82–83; Venkatesh 2006,
498). Therefore, TAM – and its evolved version UTAUT – is selected to the main
theoretical approach for this study.
2.2. Technology Acceptance Model (TAM)
TAM was first introduced by Davis (1989). The goal of TAM is to provide an
explanation of the constructs of computer acceptance at working environments. TAM
stresses decision-maker attitudes and intentions to use new technology. In other words,
TAM research focuses on individual behavioural aspects of the adoption and it can
provide also micro level results that can be utilized in consumer adoption research
(Fuchs et al. 2010, 49). However, TAM has its dominant focus on business-to-business
(B2B) research in the working environments (Asare 2011, 194). One of the biggest
advantages of TAM is its generalizability across a wide variety of technologies. TAM has
been applied in simple standalone software adoption settings (e.g. a word processing),
in collaboration tools studies (e.g. e-mail system), but also at complex and multilayered
working environments (Venkatesh 2006, 498).
The TAM model was created to be utilized both for predictive purposes and for
explorative reasoning (Davis et al. 1989, 985; Chiu et al. 2010, 445). In other words,
besides exposing which constructs explain the adoption, TAM aims to answer also
questions on why a certain new technology or applications are not adopted. However,
researchers have raised doubts that TAM and also the UTAUT models are not
particularly useful in giving explanations that can be used in improving adoption
implementation efforts. One reason for this is that the TAM model is a general adoption
model that is not able to catch all technology and context-specific antecedent of
adoption (Brown et al. 2010, 11).
The TAM research tradition has evolved over time resulting in numerous extensions:
TAM2, TAM3, and UTAUT (Unified theory of acceptance and use of technology) and
over 20 external explaining independent variables have been added over the years.
However, the core constructs, easy to use (easiness) and usefulness of
technology in their different forms, have kept their relevance as the reliable
18
antecedents of technology adoption behaviour or action (Juntumaa 2010, 6–7). These
factors are defined as the antecedents determining and predicting how the technology
diffusion advances at organizational and individual levels (Davis 1989; Davis, Bagozzi
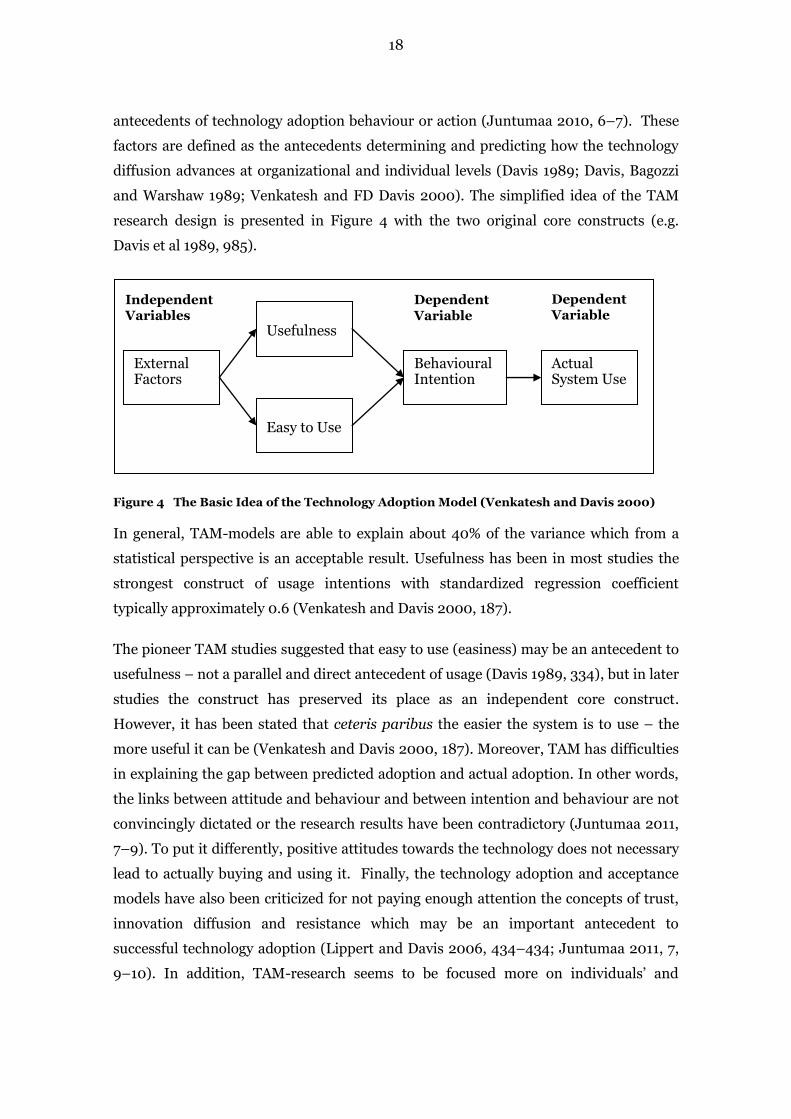
and Warshaw 1989; Venkatesh and FD Davis 2000). The simplified idea of the TAM
research design is presented in Figure 4 with the two original core constructs (e.g.
Davis et al 1989, 985).
Figure 4 The Basic Idea of the Technology Adoption Model (Venkatesh and Davis 2000)
In general, TAM-models are able to explain about 40% of the variance which from a
statistical perspective is an acceptable result. Usefulness has been in most studies the
strongest construct of usage intentions with standardized regression coefficient
typically approximately 0.6 (Venkatesh and Davis 2000, 187).
The pioneer TAM studies suggested that easy to use (easiness) may be an antecedent to
usefulness – not a parallel and direct antecedent of usage (Davis 1989, 334), but in later
studies the construct has preserved its place as an independent core construct.
However, it has been stated that ceteris paribus the easier the system is to use – the
more useful it can be (Venkatesh and Davis 2000, 187). Moreover, TAM has difficulties
in explaining the gap between predicted adoption and actual adoption. In other words,
the links between attitude and behaviour and between intention and behaviour are not
convincingly dictated or the research results have been contradictory (Juntumaa 2011,
7–9). To put it differently, positive attitudes towards the technology does not necessary
lead to actually buying and using it. Finally, the technology adoption and acceptance
models have also been criticized for not paying enough attention the concepts of trust,
innovation diffusion and resistance which may be an important antecedent to
successful technology adoption (Lippert and Davis 2006, 434–434; Juntumaa 2011, 7,
9–10). In addition, TAM-research seems to be focused more on individuals’ and
External Factors
Easy to Use
Usefulness
Behavioural Intention
Actual System Use
Dependent Variable
Independent Variables
Dependent Variable
19
consumers’ technology adoption intentions than on company-level commitments and
adoption behaviour at the organizational level.
Technology adoption can be a voluntary or mandatory option. Thus, it is important to
recognize whether a research design is carried out in a voluntary or mandatory setting,
because it has implications both for the theoretical development and the interpretation
of study results (Henning et al. 2009, 224). In this study’s empirical setting it is
interpreted that invoicing organizations are in practice in a mandatory setting in
relation to e-invoice or other developing payment choices. Of course, it is in principle
possible that invoicing organizations could carry out new payment demands and
regulations without updating the existing company IT-system or not providing new
payment choices for their customers and business partners. However, it would
seriously undermine the company’s competitive edge since the large majority of the
other companies would surely adopt the new efficient payment systems. For instance, if
a customer wants to move into e-invoicing, and the organization does not offer that
option, there is an incentive that the customer might seek other service providers who
can provide an appropriate e-invoice payment option.
Many of the studies focus on a consumer level, for instance; how consumers adopt
online tax filing (Carter et al. 2011), SMS-services (Venkatesh 2006), Internet-banking
(Ozdemir et al. 2008) and e-commerce platforms which are often based on self-service
technologies (SSTs) (Meuter 1999). There are also many studies in which technology
adoption is investigated from a company view, for example, the use of ERP systems
(Fillion et al. 2010), using an electronic medical record system (Hennington et al.
2009), and distant learning (Wang et al. 2010). In these company focused research
designs the company view is presented through the employees i.e. how the members of
the work-place have adopted the new technology. Although the individual adoption
behaviour signals the company’s overall technology adoption rate, it is not necessarily
the same as the company’s opinion.
Surprisingly, it is hard to find studies in which technology adoption is examined and
interpreted at the inter-organizational level, at the same time among many companies.
In other words, adoption in the frame of reference of TAM is overwhelmingly individual
and company-context-dependent which makes it difficult to compare the group of
companies in relation to some general IS innovation or reform.
20
2.3. Unified Theory of Acceptance and Use of Technology Model (UTAUT)
Due to technology adoption research diversity and complexity, and the failure of TAM
to consider the organization’s external factors that influence adoption (Wells et al.
2010, 814), Venkatesh and his associates (Venkatesh et al. 2003) launched a merged
information technology model; namely, the Unified theory of acceptance and use of
technology (UTAUT). The original UTAUT framework focused on the mandatory use of
technologies in a work environment, but it has been utilized to some extent also in
voluntary settings (Chiu et al. 2010, 449).
UTAUT condenses eight technology adoption models5 resulting in four core
determinants of intention and usage. It is noteworthy to mention already in this
connection that in UTAUT attitude toward using technology, self-efficacy, and anxiety
determinants – which are stressed in many models – are not included due to their
indirect influence on intention to use or actual use. In addition to the core constructs,
Venkatesh et al. (2003) posit four moderating variables which are gender, age,
experience, and voluntariness of use (Venkatesh et al. 2003). The model with its key
constructs and moderating variables and their relations are presented in Figure 5
(Venkatesh et al. 2003, 447).
5 The theory of reasoned action (TRA), TAM, the motivational model, the theory of planned behavior
(TPB), a model combining the TAM and TPB, the model of PC utilization, the innovation diffusion theory
(IDT), and the soc§§ial cognitive theory (Venkatesh et al. 2003; Carter et al. 2011, 305)
21
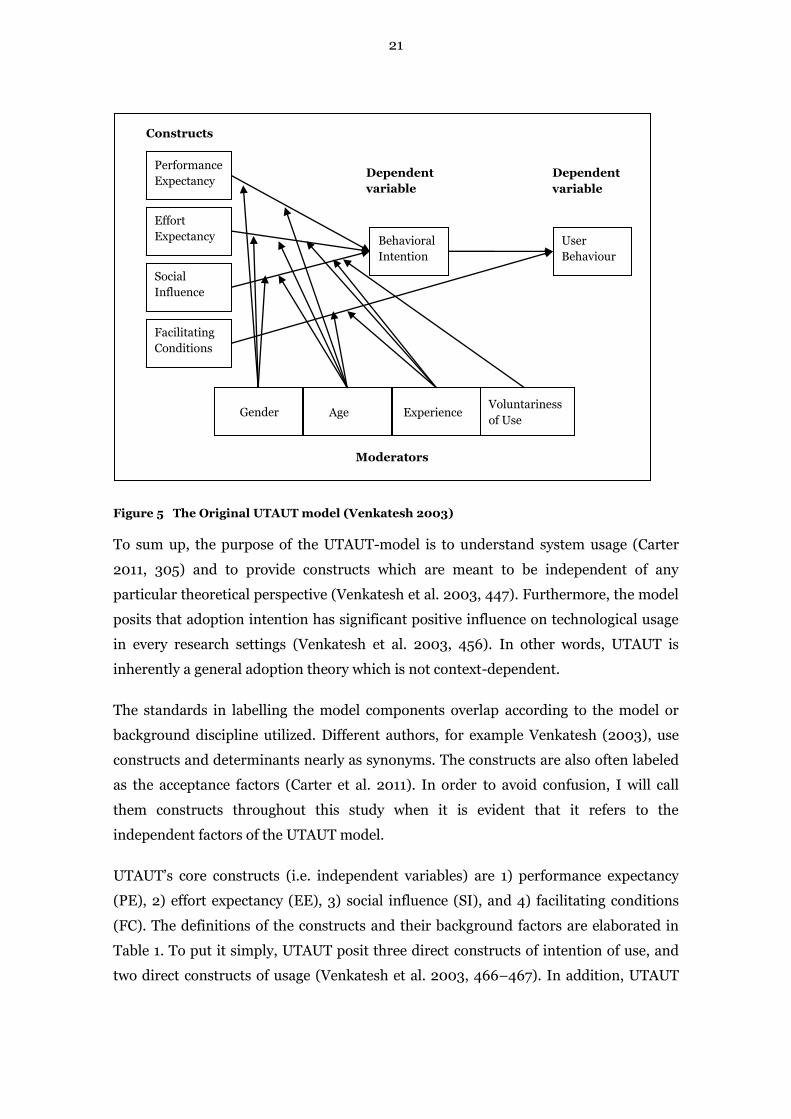
Figure 5 The Original UTAUT model (Venkatesh 2003)
To sum up, the purpose of the UTAUT-model is to understand system usage (Carter
2011, 305) and to provide constructs which are meant to be independent of any
particular theoretical perspective (Venkatesh et al. 2003, 447). Furthermore, the model
posits that adoption intention has significant positive influence on technological usage
in every research settings (Venkatesh et al. 2003, 456). In other words, UTAUT is
inherently a general adoption theory which is not context-dependent.
The standards in labelling the model components overlap according to the model or
background discipline utilized. Different authors, for example Venkatesh (2003), use
constructs and determinants nearly as synonyms. The constructs are also often labeled
as the acceptance factors (Carter et al. 2011). In order to avoid confusion, I will call
them constructs throughout this study when it is evident that it refers to the
independent factors of the UTAUT model.
UTAUT’s core constructs (i.e. independent variables) are 1) performance expectancy
(PE), 2) effort expectancy (EE), 3) social influence (SI), and 4) facilitating conditions
(FC). The definitions of the constructs and their background factors are elaborated in
Table 1. To put it simply, UTAUT posit three direct constructs of intention of use, and
two direct constructs of usage (Venkatesh et al. 2003, 466–467). In addition, UTAUT
Performance
Expectancy
Effort
Expectancy
Social
Influence
Facilitating
Conditions
Behavioral
Intention
User
Behaviour
Voluntariness
of Use Age Gender Experience
Moderators
Constructs
Dependent
variable
Dependent
variable
22
can provide information on how the constructs evolve over time, for instance, in
organizational contexts.
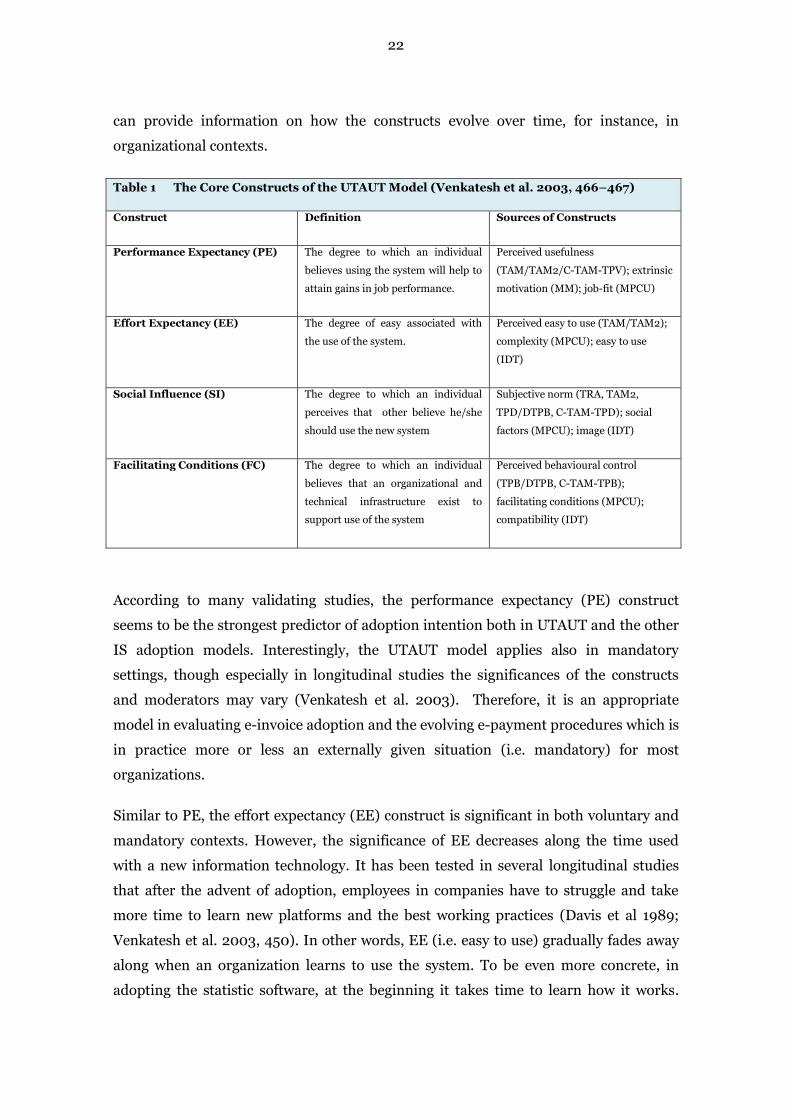
Table 1 The Core Constructs of the UTAUT Model (Venkatesh et al. 2003, 466–467)
Construct Definition Sources of Constructs
Performance Expectancy (PE) The degree to which an individual
believes using the system will help to
attain gains in job performance.
Perceived usefulness
(TAM/TAM2/C-TAM-TPV); extrinsic
motivation (MM); job-fit (MPCU)
Effort Expectancy (EE) The degree of easy associated with
the use of the system.
Perceived easy to use (TAM/TAM2);
complexity (MPCU); easy to use
(IDT)
Social Influence (SI) The degree to which an individual
perceives that other believe he/she
should use the new system
Subjective norm (TRA, TAM2,
TPD/DTPB, C-TAM-TPD); social
factors (MPCU); image (IDT)
Facilitating Conditions (FC) The degree to which an individual
believes that an organizational and
technical infrastructure exist to
support use of the system
Perceived behavioural control
(TPB/DTPB, C-TAM-TPB);
facilitating conditions (MPCU);
compatibility (IDT)
According to many validating studies, the performance expectancy (PE) construct
seems to be the strongest predictor of adoption intention both in UTAUT and the other
IS adoption models. Interestingly, the UTAUT model applies also in mandatory
settings, though especially in longitudinal studies the significances of the constructs
and moderators may vary (Venkatesh et al. 2003). Therefore, it is an appropriate
model in evaluating e-invoice adoption and the evolving e-payment procedures which is
in practice more or less an externally given situation (i.e. mandatory) for most
organizations.
Similar to PE, the effort expectancy (EE) construct is significant in both voluntary and
mandatory contexts. However, the significance of EE decreases along the time used
with a new information technology. It has been tested in several longitudinal studies
that after the advent of adoption, employees in companies have to struggle and take
more time to learn new platforms and the best working practices (Davis et al 1989;
Venkatesh et al. 2003, 450). In other words, EE (i.e. easy to use) gradually fades away
along when an organization learns to use the system. To be even more concrete, in
adopting the statistic software, at the beginning it takes time to learn how it works.
23
When the use becomes a routine, the user hardly pays any attention to basic functions
during the use.
The social influence (SI) construct also measure the same kind of effects in each IS
adoption model. However, SI construct are not significant in voluntary settings. On the
contrary, in mandatory settings SI appears to be significant especially in early stages of
adoption process. The effect, however, becomes weaker or even non-significant over the
time and usage, as it happens with EE determinant (Venkatesh et al. 2003, 451–453).
In the UTAUT model facilitating conditions (FC) has as the only determinant a direct
predicting effect on usage and user’s behaviour. In addition, FC is significant both in
voluntary and mandatory settings, but significance decreases after the training period.
However, moderated by user age and experience, the influence of FC is expected to
increase with empowered and more confident users who develop in helping and
supporting each other in adoption process. (Venkatesh et al. 2003, 453–455)
To conclude, UTAUT is considered a robust theoretical model. It has been successfully
tested both in the workplace and the consumer adoption contexts. Moreover, the
studies have covered a wide variety of different kind of technologies and innovations
from Internet banking, e-learning, and use of enterprise resource planning system to
distance learning. Remarkably, UTAUT has usually been able to explain over 70% of
variance in intention to use different technologies and adjusted operational functions
(Brown et al. 2010, 13). The TAM model, as referred previously, has regularly
succeeded in explaining average 40% of variance (Davis et al. 1989, Venkatesh and
Davis 2000, Venkatesh et al. 2003; 426). The differences in the explanatory power
between TAM and UTAUT stem from the constructs of social influence (SI) and
facilitating conditions (FC) that take into consideration organization’s external factors
such as competition and the demands of customers (Brown et al. 2010, 13). Therefore,
UTAUT applies well to a research setting in which adoption affects customer
relationships as it does in the case of an organization’s e-invoice adoption.
Next, having presented the TAM technology adoption research tradition and its evolved
UTAUT model, I will discuss how the innovation adoption approach could be utilized in
this study. The main innovation diffusion approaches, the Innovation diffusion theory
(IDT) and the Technology-organizational-environmental framework (TOE), are widely
used in the field of organizational technology adoption research. Actually,
TAM/UTAUT, IDT, and TOE are often utilized in parallel in organizational adoption
24
research (e.g. Yi et al. 2006, 351). The UTAUT model expands the scope of the TAM
tradition by adding two constructs related to organization’s external environment, i.e.
social influence (SI), facilitating conditions (FC) (Venkatesh 2003), but IDT and TOE
offer even more insight especially related to adoption process and external
environment.
2.4. Innovation Diffusion Approach
Marketing research has studied innovation diffusion since the beginning of the 1960s
when Bass (1969) developed his prediction model which was used to estimate the rate
of adoption for a new product. The Bass model has also been tested in various
environments and is still used among researchers. According to Rogers (2003, 83),
marketing tradition is one of the most productive disciplines in the field of innovation
diffusion research.
The innovation diffusion approach states that significant factors which affect the
adoption are strongly related to the perceived attributes of an innovation (Rogers 1983)
or the adoption is basically determined due to the contextual factors (Fuchs et al. 2010,
49). The most influential innovation diffusion approaches are the innovation diffusion
theory (IDT) and the technology-organization-environment (TOE) framework.
Similarly to the TAM origin models, both are the general adoption models which have
been utilized in countless environments and research settings (Yi et al. 2006, 351).
2.4.1. Innovation Diffusion Theory (IDT)
The innovation diffusion theory (IDT) was originally created by Rogers (1995, 2003).
IDT concentrates on the certain innovation characteristics that are important for
innovation adopters. Thus, IDT focuses predominantly on the pre-adoption phase – not
the actual use of the innovation or new applications (Ozdemir et al. 2008, 216). Theory
defines diffusion as a process in which (1) an innovation is (2) communicated through
certain channels (3) over time (4) among the members of a social system. An
innovation is an idea, practice, or object that is perceived as new by an individual or
another unit of adoption. (Rogers 2003, 11–12). In sort, IDT focuses studying how
much better the technology under adoption is contrasted to the technology it
supersedes (relative advantage), how well the technology meets the needs
(compability), and how easy the technology is to adopt (simplicity) (Azadegan and
Teich 2010, 474) .
25
The organizational innovativeness studies were carried out in 1970s focusing on
developing models which were applied to individuals. However, most of pioneering
organizational studies failed to find a significant relationship between qualities of an
organization and the dependent variables of innovativeness. It has been argued that
these cross-sectional studies did not succeed to catch the organization’s innovation
process over time and over the different business functions. Moreover, the data were
regularly gathered through one representative of the firm – a typical respondent was an
executive manager – who did not truly present the opinion of the whole organization in
every respect especially in pre-adoption cases (Rogers 2003, 408–409, 413). In other
words, the organization’s decision to adopt an innovation and to implement it, were not
simultaneously measured.
Today, innovation diffusion research aims to cover a wider scope by concentrating on
the innovation process, which gives better opportunities to study pre-adoption, actual
use, and post-adoption phases. However, the primary goal of IDT is to explain how a
new technology moves from pioneer users to wider use among adopters (Chiu et al.
2010, 445). Rogers discusses the adoption decision initiation (information gathering,
conceptualizing, planning) and the implementation (redefining, clarifying, routinizing).
(Rogers 2003, 433–434). This development has also opened new possibilities utilizing
innovation diffusion concepts and methods in marketing research which is strongly
linked into all business processes, and operates actively in the field of applied science.
Innovation diffusion research recognizes that organizations are usually places where
the technology adoption occurs in its most complex and challenging forms, compared
to individuals adoptions process (Rogers 2003, 402–403).
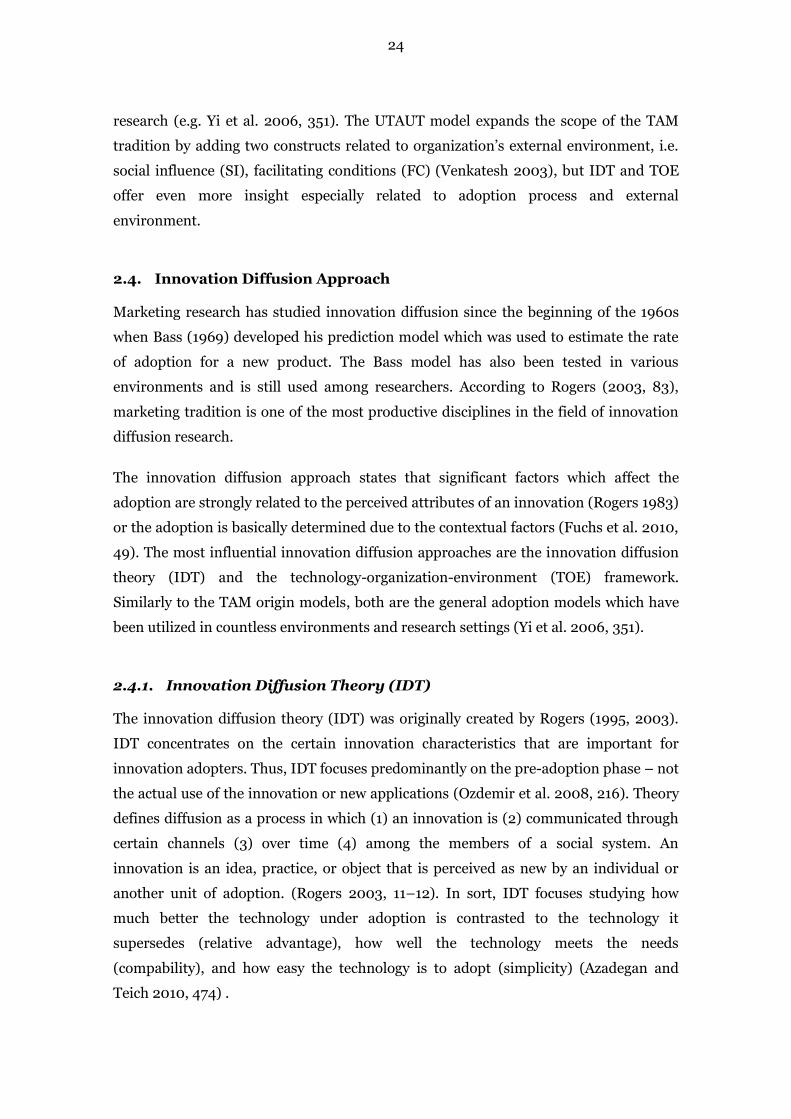
The organization’s innovativeness is usually measured with the help of the following
variables: 1) individual (leader) characteristics, 2) Internal characteristics of
organizational structure, and 3) External characteristics of the organization. The
variables, their definitions and influence on adoption are presented in Table 2 (Rogers
2003, 402–403).
26
Table 2 Independent Variables Related to Organizational Innovativeness (Rogers 2003)
Variable Definition Influence on
innovativeness
Individual
(Leader)
characteristics
1.Attitude toward change Positive
Internal
characteristics of
organizational
structure
2. Centralization: The degree to which power and control in a system
are concentrated
3. Complexity: The degree to which an organization’s members
possess a relatively high level of knowledge
4. Formalization: The degree to which an organization emphasizes its
members’ following rules and procedures
5. Interconnectedness: The degree to which the units in a social
system are linked by interpersonal networks.
6. Organizational slack: The degree to which uncommitted resources
are available to the organization
7. Size
Negative
Positive
Negative
Positive
Positive
Positive
External
characteristics of
the organization
8. System openness
The degree to which intertwined with partners, customers and other
networks
Positive
Despite the modest success in the early organization innovation diffusion studies, IDT
has validated many robust variables explaining the technology adoption. Next, a few of
them are discussed more in detail. Namely, leadership and management, size, and the
adopter types that are related to how fast and organizations adopt technology
innovations within a certain time period or adoption stage.
The Influence of the Leadership on Innovation Diffusion
Roger states that the management’s attitude and the presence of an innovation
champion (a person who support the new idea despite of the existing resistance) are
positively related to organization innovative intentions (Rogers 2003, 410–413).
Though the champion can be anyone in the organization, it is probable that in
launching a new idea overlaps with the roles of a management and a champion. The
importance of leadership and the support of management are recognized to be an
essential factor for technology adoption in organizations (Neufeld 2007, 496). In the
UTAUT model leadership is usually included directly or indirectly into the facilitating
conditions (FC) and social influence (SI) as their own items within the constructs (e.g.
Venkatesh 2003, 460). In addition, some researchers have tested the explaining power
27
of their own independent management construct (charismatic leadership). As a result,
the constructs have had a significant effect on adoption (Neufeld et al. 2007, 503). To
sum, it is likely that the role of management has a positive influence on e-invoice
adoption process in organizations.
The Influence of the Organization’s Size on Innovation Diffusion
The larger the organization, the more innovative it is. Some may consider this finding
also contradictory since it has been often posited that small organizations can adopt
efficiently innovative solutions due to their flexibility (e.g. Zhu and Kraemer 2005, 77).
However, the size is one of the most commonly cited factors in the organizations’
adoption research (Zhu and Kraemer 2005, 68). Therefore, it has assumed to have a
positive effect also to e-invoice adoption in organizations.
The S-shaped Innovation Adopter Curve and the Adopter Types
It has been stated that the most innovation adoptions follow an S-shaped curve.
Though the S-curve is case specific, the successful adoptions are usually normally
distributed (Rogers 2003, 274–275). In other words, some adoptions advance fast: the
S-curve is then steep (e.g. mobile phone); some adoptions mature longer: the S-shape is
gradual (e.g. e-invoice) (Rogers 2003, 23). At the beginning the adoption rate is slow,
and then it accelerates until the half of adopters are included and the adoption rate
decreases again, because there are less new adopters left (Rogers 2003, 272). At the
beginning of the S-curve, companies seek information, for instance, on infrastructural
preconditions. After having more information, organizations are able to get more
experiences and confidence about usage of various technological systems and platforms
(Fuchs et al. 2010, 167).
Both individuals and the other units of adoption (i.e. an organization, italics added)
can be categorized according to their innovativeness. The S-shape curve is
approximately normally distributed over time due to the fact that the individuals or
organizations possess different degrees of willingness to adopt innovations (Oliveira
and Martins 2011, 111). It is noticeable that innovativeness is regarded as a relative
dimension and as a continuous variable. Therefore, the adoptions categories are only
conceptual devices in order to make comparisons possible. Roger divides adopters into
the five categories: 1) innovators, 2) early adopters, 3) early majority, 4) late majority,
28
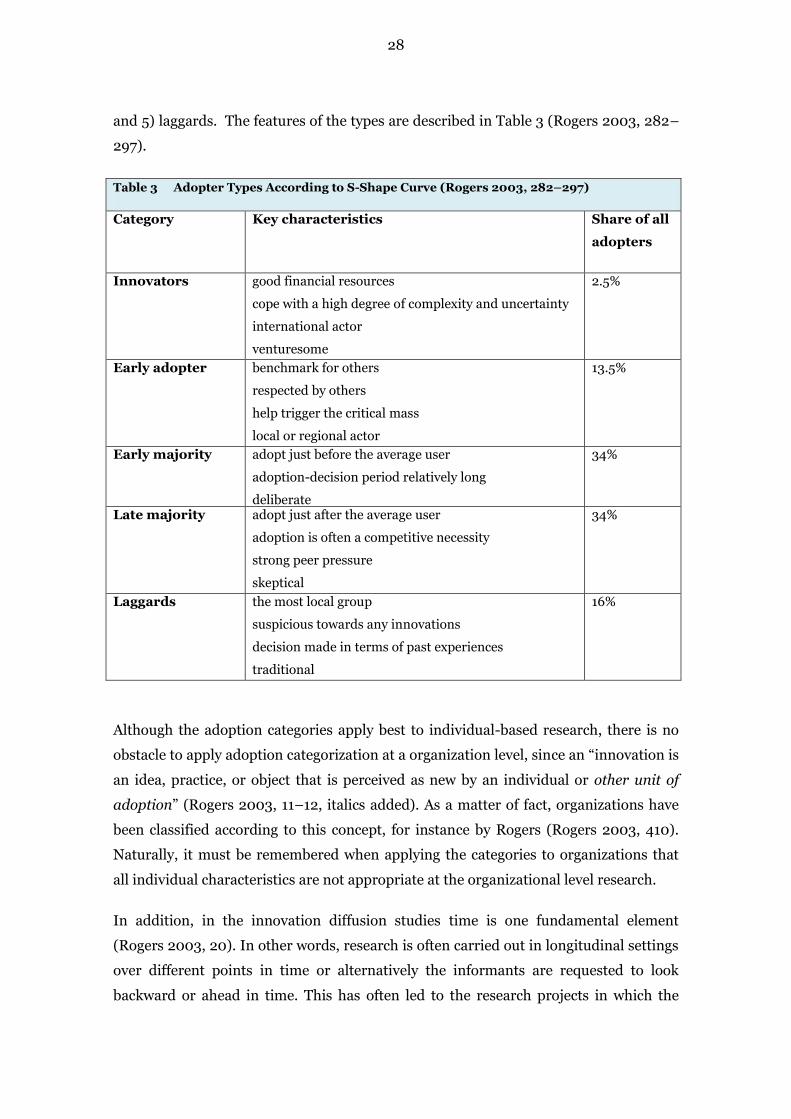
and 5) laggards. The features of the types are described in Table 3 (Rogers 2003, 282–
297).
Table 3 Adopter Types According to S-Shape Curve (Rogers 2003, 282–297)
Category Key characteristics Share of all
adopters
Innovators good financial resources
cope with a high degree of complexity and uncertainty
international actor
venturesome
2.5%
Early adopter benchmark for others
respected by others
help trigger the critical mass
local or regional actor
13.5%
Early majority adopt just before the average user
adoption-decision period relatively long
deliberate
34%
Late majority adopt just after the average user
adoption is often a competitive necessity
strong peer pressure
skeptical
34%
Laggards the most local group
suspicious towards any innovations
decision made in terms of past experiences
traditional
16%
Although the adoption categories apply best to individual-based research, there is no
obstacle to apply adoption categorization at a organization level, since an “innovation is
an idea, practice, or object that is perceived as new by an individual or other unit of
adoption” (Rogers 2003, 11–12, italics added). As a matter of fact, organizations have
been classified according to this concept, for instance by Rogers (Rogers 2003, 410).
Naturally, it must be remembered when applying the categories to organizations that
all individual characteristics are not appropriate at the organizational level research.
In addition, in the innovation diffusion studies time is one fundamental element
(Rogers 2003, 20). In other words, research is often carried out in longitudinal settings
over different points in time or alternatively the informants are requested to look
backward or ahead in time. This has often led to the research projects in which the
29
adoption takes place in a short period of time and the adoption has been also successful
(Rogers 2003, 109–111). Consequently, with these degrees of freedom, it should be a
fairly acceptable option to collect data by asking the informant to look forward in time
when evaluating the adoption process. Actually, innovation diffusion research has been
criticized for not managing to grasp so convincingly the unsuccessful adoption
processes (Rogers 2003, 126–127). Hence, the looking forward option would make it
possible to focus adoption in a more multifaceted way.
2.4.2. The Technology-Organization-Environment (TOE) Framework
One of the seminal innovation diffusion models is the Technology-organization-
environment framework (TOE) is created by Tornantzy and Fleicher (1990). The TOE
framework is consistent with IDT, but researchers have considered that the
environmental context construct enables better to explain inter-firm innovation
diffusion (Oliveira and Martins 2011, 112) and the actual use and post-adoption of
technology (Zhu and Kraemer 2005, 64–64). TOE contributes and deepens the
adoption research by examining various network-based factors (Azadegan and Teich
2010, 476). To summarize, TOE represents a generic theory of technology diffusion as
do TAM/UTAUT and IDT. Therefore it can be applied to different contexts and types of
innovations (Zhu and Kramer 2005, 63), which are described below.
The Contextual Factors of TOE
TOE states that contextual factors determine the management’s adoption behaviour to
adopt or not to adopt technological innovations (Fuchs et al 2010, 49). TOE posits that
an organization decides how it adopts and uses new technologies and applications in
relation to 1) technological context (the existing technology in use, new relevant
technologies to the firm) 2) organizational context (firm’s scope, size, and the
amount of slack resources available), and 3) environmental context (competitive
environment in which the firm operates; e.g. industry, competitors, and partner
relationships) (Zhu et Kramer 2005, 63). The typical environmental factors are, for
instance; turnover, the amount of employees and offices, customer’s expectations,
financial resources available, and IT-readiness (Zhu and Kramer 2005, 63). Also the
competitive characteristics of the industry sector are considered to be relevant aspects
in innovation aspects (Azadegan and Teich 2010, 476).
30
Interestingly, the TOE framework has been applied also to e-payment and e-
procurement studies, which makes it interesting for the purpose of this study. Namely,
EDI6 (electronic data exchange) which is the point-to-point supply chain standard, and
at some extent also the predecessor of more open standards such as an e-invoice
(Turban et al. 2010, 291). In the EDI studies, the researchers found a positive
relationship between relative advantage (e.g. competition) and the EDI adoption.
However, the relationship between external influences (e.g. technological support from
services providers) and EDI adoption was not confirmed (Asare et al. 2011, 194).
The Types of Innovations
The TOE framework recognizes the different types of innovations. Some innovations
and new applications do not generate large-scale adoption processes in organizations.
In opposite, at the other side of innovation continuum, some innovations may force
companies to reconsider the viability of core business or the sustainability of a business
model. Thus, it is evident that from a management perspective, the more complex
innovation adoption is, the more critical it if for an organization’s success – or failure.
In the TOE studies the innovation categorization or typology created by Swanson
(1994) has been often discussed and utilized. Swanson proposes three types of
innovations: Type 1 consists of technical innovations restricted to the information
systems functional tasks (e.g. updating basic software into newer version). Type 2
covers applying technology to support the business (e.g. reforming enterprise-wide
information system, ERP, accounting system). Lastly, Type 3 innovation is embedded
in a company’s business strategy and competitive advantage (e.g. traditional banking
vs. e-banking) (Zhu and Kraemer 2005, 63–64). Type 2 and Type 3 innovations are
considered to have influences at an organizational level. As an illustration, Type 2 is
often linked to accounting and payment systems; and Type 3 to services and
coordination with the organization’s suppliers, distributors, and customers (e.g. EDI,
supply chain management) (Wu 2004, 362–363). To summarize, the subject of this
study – how the invoicing organizations adopt e-invoice and automated payment
practices – belongs most likely to the category Type 2 since it forces to update
6 (Electronic Data Interchange) The electronic communication of business transactions, such as orders,
confirmations and invoices, between organizations. EDI implies direct – point-to-point - computer-to-
computer transactions into vendors' databases and ordering systems. Internet has decreased the need for
point-point connections due to new data formats such as XML using the HTTP Web protocol (PC Magazine
Encyclopaedia). This enables organizations to adopt, for instance, e-invoicing, without any deadly IT-
projects.
31
accounting software, reorganize invoicing practices, and devote efforts both to internal
and external communication among personnel, customers and partners. Therefore, the
e-invoice adoption has influences at the organizational level.
2.5. Summary of the Combined Adoption and Innovation Diffusion
Research
The main theoretical frameworks relating to technology adoption and innovation
diffusion in organization are technology acceptance models (TAM/UTAUT), Innovation
diffusion theory (IDT), and the Technology-organization-environment (TOE)
framework (Rogers 2003; Venkatesh et al. 2003; Yi et al. 2006). UTAUT, IDT, and
TOE are all general theories which have been applied successfully in a wide range of
contexts: marketing has been one important discipline. In general, in all frameworks
presented in this study, technology adoption is understood as the dependent variable
which can be predicted with help of independent variables (Venkatesh et al. 2003, 427).
Due to its interdisciplinary nature, the technology adoption domain has created a rich
research tradition with many overlapping constructs, models, and methods which has
not always led to robust research findings. Nevertheless, this development has not
hindered the frameworks to learn from each other. As a result, very often TAM
tradition has been referred in the connection with IDT or TOE research settings either
utilizing each other’s concepts or to reconfirm each other findings (Yi et al. 2006, 351).
Therefore, it is well-founded to utilize UTAUT model as a main theoretical framework
for this study supported by IDT and TOE. The fundamental constructs of UTAUT, IDT,
and TOE are presented in Table 4.
32
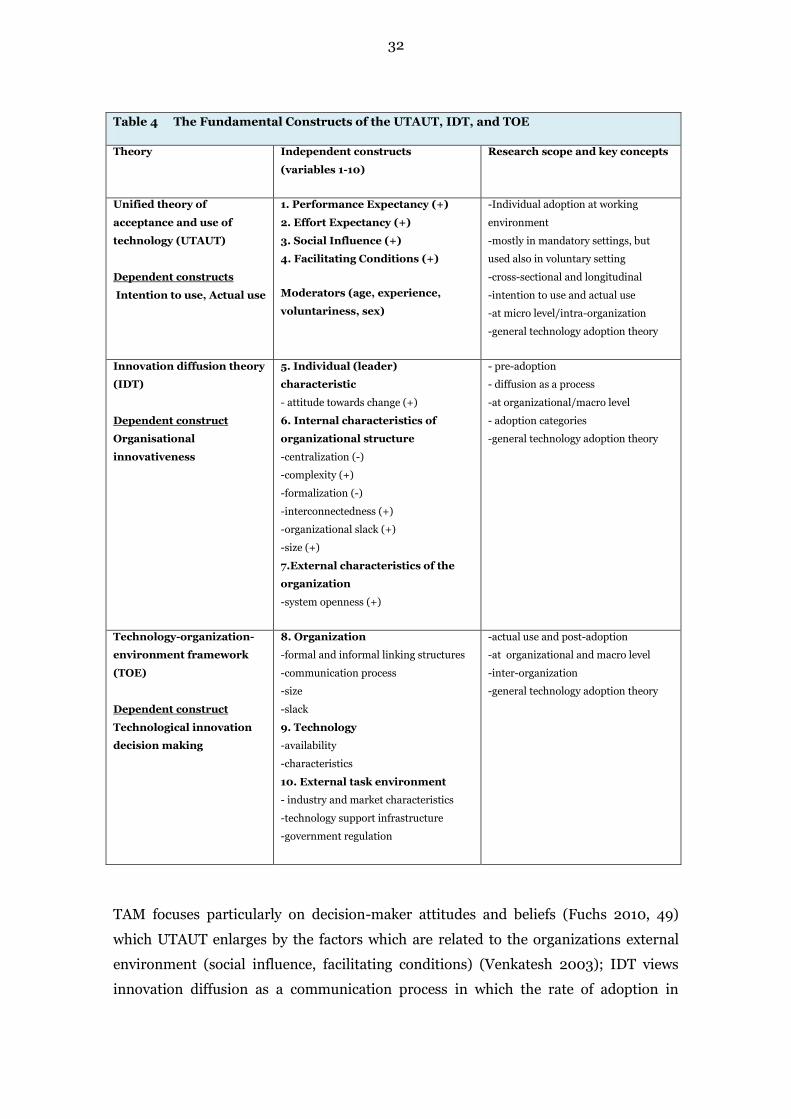
Table 4 The Fundamental Constructs of the UTAUT, IDT, and TOE
Theory Independent constructs
(variables 1-10)
Research scope and key concepts
Unified theory of
acceptance and use of
technology (UTAUT)
Dependent constructs
Intention to use, Actual use
1. Performance Expectancy (+)
2. Effort Expectancy (+)
3. Social Influence (+)
4. Facilitating Conditions (+)
Moderators (age, experience,
voluntariness, sex)
-Individual adoption at working
environment
-mostly in mandatory settings, but
used also in voluntary setting
-cross-sectional and longitudinal
-intention to use and actual use
-at micro level/intra-organization
-general technology adoption theory
Innovation diffusion theory
(IDT)
Dependent construct
Organisational
innovativeness
5. Individual (leader)
characteristic
- attitude towards change (+)
6. Internal characteristics of
organizational structure
-centralization (-)
-complexity (+)
-formalization (-)
-interconnectedness (+)
-organizational slack (+)
-size (+)
7.External characteristics of the
organization
-system openness (+)
- pre-adoption
- diffusion as a process
-at organizational/macro level
- adoption categories
-general technology adoption theory
Technology-organization-
environment framework
(TOE)
Dependent construct
Technological innovation
decision making
8. Organization
-formal and informal linking structures
-communication process
-size
-slack
9. Technology
-availability
-characteristics
10. External task environment
- industry and market characteristics
-technology support infrastructure
-government regulation
-actual use and post-adoption
-at organizational and macro level
-inter-organization
-general technology adoption theory
TAM focuses particularly on decision-maker attitudes and beliefs (Fuchs 2010, 49)
which UTAUT enlarges by the factors which are related to the organizations external
environment (social influence, facilitating conditions) (Venkatesh 2003); IDT views
innovation diffusion as a communication process in which the rate of adoption in
33
organizations is determined by the attributes of organizational innovativeness (Roger
2003; Yi 2006, 351); and TOE posit that contextual factors determine decision-makers’
adoption behavior (Fuchs 2010, 49).
Related to the study purpose – learning which factors affect e-invoice adoption in
organizations – the versatile theoretical approach is a justified option: e-invoice is still
emerging innovation which some organizations capitalize effective, and some
organizations are just at the beginning of the e-invoice roadmap. The combination of
UTAUT, IDT, and TOE can, for example; provide insight about pre-adoption, actual-
use or post-adoption of adopting e-invoicing. In addition, UTAUT concentrates more to
intra-organizational aspects whereas IDT and TOE understand more the influence of
external and inter-organizational factors. The independent variables contributed by
UTAUT, IDT, and TOE are at some extent overlapping, but it only ensures that all
relevant factors are taken into consideration. The most of independent variables are
adapted to the UTAUT model and its items that measure the use of e-invoicing (see
later 3.3.4, Table 10). At the construct level, PE, EE and MC measures more the intra-
organizational factors, and SI and FC bring more insights for external factors that
concern the most of organization at the same; i.e. they are inter-organizational
variables.
To summarize, e-invoice adoption in organizations does not emerge in isolation: its
success is highly dependent on the adoption of all organizations and related networks.
Hence, multi-faceted approach is needed in order to understand the complexity of e-
invoice adoption. In this study, e-invoicing adoption is defined to be Type 2 innovation
(Zhu and Kraemer 2005, 63–64) that takes place in a mandatory setting from an
organizational perspective.
In the following section, the preliminary UTAUT model is presented based on the
technology adoption models (TAM, UTAUT), the Innovation diffusion theory (IDT),
and the Technology-organization-environment (TOE) framework.
34
2.6. Proposed UTAUT Model for the Empirical E-invoice Survey
The purpose of the UTAUT model is to understand system usage and the technology
adoption behaviour of individual (i.e. employees and management) at working
environments (Venkatesh 2003; Carter 2001, 305). In addition to intra-organizational
studies, the UTAUT model has been utilized to some extent in consumer technology
adoption studies (e.g. Venkatesh et al. 2006; Ozdemir et al. 2008; Yang 2010).
However, related to the main aim of this study – to identify which factors affect
organizations’ adoption of e-invoicing among organizations – the UTAUT model as
such is highly unlikely to provide enough data about the technology adoption that need
to be understand both from the organizational perspective and provide the eligible data
for reliable organizational comparisons. This gap can be covered by redeveloping the
UTAUT model.
The scope of technology adoption and innovation diffusion research is wide (Venkatesh
2003), and it is clear that all constructs and findings discussed in the literature review
cannot be included to the proposed UTAUT model. Nevertheless, TAM/UTAUT, IDT,
and TOE are all general technology adoption theories that enable to choose the most
appropriate constructs related to the aim of the study. In this study, the essential
independent constructs affecting to the UTAUT model development are the original
UTAUT variables performance expectancy (PE), effort expectancy (EE), social influence
(SI), and facilitating conditions (FC). Moreover, the constructs related to individual
leader characteristics, internal characteristics of organizational structure, size, and
external task environment have a strong influence on the creation of the proposed
UTAUT model.
The UTAUT model adjustments appropriate for the purpose of this study are reasoned
and explained in the following part. The proposed UTAUT model is presented in Figure
6.
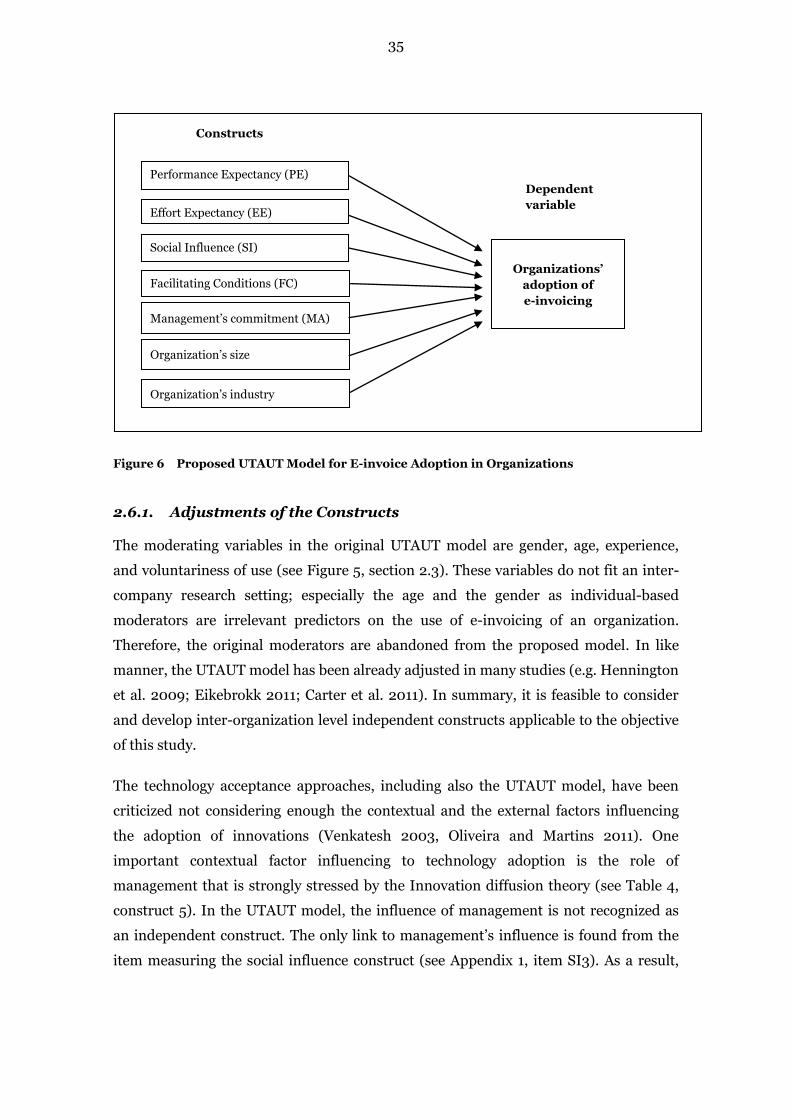
35
Figure 6 Proposed UTAUT Model for E-invoice Adoption in Organizations
2.6.1. Adjustments of the Constructs
The moderating variables in the original UTAUT model are gender, age, experience,
and voluntariness of use (see Figure 5, section 2.3). These variables do not fit an inter-
company research setting; especially the age and the gender as individual-based
moderators are irrelevant predictors on the use of e-invoicing of an organization.
Therefore, the original moderators are abandoned from the proposed model. In like
manner, the UTAUT model has been already adjusted in many studies (e.g. Hennington
et al. 2009; Eikebrokk 2011; Carter et al. 2011). In summary, it is feasible to consider
and develop inter-organization level independent constructs applicable to the objective
of this study.
The technology acceptance approaches, including also the UTAUT model, have been
criticized not considering enough the contextual and the external factors influencing
the adoption of innovations (Venkatesh 2003, Oliveira and Martins 2011). One
important contextual factor influencing to technology adoption is the role of
management that is strongly stressed by the Innovation diffusion theory (see Table 4,
construct 5). In the UTAUT model, the influence of management is not recognized as
an independent construct. The only link to management’s influence is found from the
item measuring the social influence construct (see Appendix 1, item SI3). As a result,
Performance Expectancy (PE)
Effort Expectancy (EE)
Social Influence (SI)
Facilitating Conditions (FC)
Organizations’
adoption of
e-invoicing
Management’s commitment (MA)
Constructs
Dependent
variable
Organization’s size
Organization’s industry
36
the construct the management’s commitment is added into the proposed UTAUT
model.
Comparable to the influence of management, the size of an organization is stated to be
in direct relation to the organization’s innovativeness. Also the industry of an
organization affects innovation adoption as it has been reported in some TOE studies
(Zhu and Kramer 2005). Therefore, the organization size and industry variables are
added in order to find the most resourceful discriminating independent variables
among e-invoice adopters.
The original constructs of the UTAUT model (performance expectancy, effort
expectancy, social influence, and facilitating conditions) are supposed to be positively
related to the use of an innovation. In similar vein, all independent constructs proposed
for this study are considered to be positively related to the use of e-invoicing.
2.6.2. From individual to Organizational Perspective
The research perspectives in the previous organizational UTAUT studies have
dominantly been intra-organizational. In other words, the data have been collected
from the employees and the representatives of management related to one
organization. This has made possible to increase understanding per one particular
organization, but it has not enabled to compare technology adoption and innovation
diffusion among many organizations and companies. Thus, the UTAUT model has to
be reconsidered and adapted to the intra-organizational level in a manner that one
representative of an organization is able to provide the requested data.
In consequence, the constructs and the items measuring the use of e-invoicing are
presented in the following format: “<innovation> improves the organizations’
efficiency” instead of asking “<innovation> improves my efficiency”. The item creation
is explained more detail in the method chapter (section 3.5). There is a strong
possibility that this model transformation is justified since there is no reason to doubt
why the selected informants are not able to provide the valid answers related to the e-
invoicing adoption and use of their organization. To my knowledge, the UTAUT model
has not been capitalized in a similar fashion in the previous studies.
37
2.6.3. Defining the Dependent Variable
The essential decision in technology adoption studies is whether to study the intention
of use or the actual use of innovation – or both. The innovation adoption and diffusion
evolve in the course of time which affects to the time horizon of the research setting.
The use of e-invoicing is proposed to the dependent variable, because it reveals better
than intention what variables affect to the adoption of e-invoicing. The idea of selecting
one dependent variable applies also well to research projects in which the data
collection takes place within the limited time period.
The design of the empirical study will be discussed in more detail in the following
method chapter.
38
3 METHOD
In this chapter the research method will be described. To begin, the research design is
presented (3.1). The study utilizes both the qualitative and quantitative methods.
Secondly, access to data, sampling, and the interview guide of the qualitative method is
presented (3.2). The results of qualitative interviews are presented already in this
chapter, because they affect on the formulation of the quantitative research design
(3.3). Then the hypothesis creation is presented (3.4) and the quantitative research
method is developed (3.5–3.6). Finally, the chapter ends with discussion about the
quality of the research (3.7).
The aim of this study is to identify which factors affect the organizations’ adopting e-
invoicing. In addition, the study explores why organizations utilize the e-invoice and
what kind of alternatives the invoicing organizations will carry out in order to replace
the expiring Finnish direct debit (FDD) payment scheme.
3.1. Research Design
The time-horizon was cross-sectional and mixed methods were utilized. The data were
collected by semi-structured interviews (qualitative, inductive) and two surveys
(quantitative, deductive). The data collection – related to e-invoicing and the Finnish
direct debit (FDD) payment scheme – was primarily aimed to be achieved through one
survey. However, the initial survey targeted to the Bank’s customers did not succeed to
provide enough data for the e-invoice research. Hence a second survey, which became
the main survey, was conducted on the customer base of the Chamber of Commerce. In
this sample, the factors affecting the adoption of e-invoice were investigated.
The interviews were conducted first. The findings of the interviews were compared with
UTAUT, IDT, and TOE approaches, and the survey was constructed based on the
findings. This inductive approach was used in order to explore which moderators of
UTAUT were appropriate in analyzing the adoption and implementation of e-invoicing
in organizations. The interviews also enabled to identify relevant IDT and TOE
variables related to study e-invoicing adoption. The data from the main e-invoice
survey were deductively tested in order to generalize the findings.
Each method is described in the following sections.
39
3.2. Qualitative Research Method
The purpose of the qualitative method was to explore how the reality of organizational
adoption of e-invoicing reflected the technology adoption/acceptance ideas launched by
the TAM/UTAUT models, Innovation diffusion theory and Technological-organization-
environment framework.
3.2.1. Access to Qualitative Data
The study was implemented in cooperation with one of Finland’s largest banks
(hereafter called the Bank). In terms of gaining access to primary data, the research
cooperation guaranteed entry to the potential target group related both qualitative
method and quantitative research. Interviewing the experts in the subject is one of the
principal ways of conducting exploratory research (Saunders et al. 2007, 133). The
research cooperation enabled to have primary data from the service provider point of
view when focusing on for instance the purpose of study and the questionnaire designs
It was clear from the beginning after having in-depth discussions with Bank experts
and familiarizing with the SEPA background material (e.g. EU commission, Federation
of Finnish Financial Services, European Payment Council) that gaining access to
primary data was vital. This is due to the fact that there was not reliable secondary data
available at company level due to the immatureness of FDD servicescape for invoicing
organizations. In other words, the best sources were the invoicing companies and
organizations that were making developing e-invoice measures and preparations for the
implementation of the FDD scheme related to their consumer customers.
3.2.2. Sampling of the Qualitative Interviews
The sample for the qualitative part was selected according to the three main criteria: 1)
the informants were in the central operational position in planning and implementing
e-invoicing and payment practices in their organization, 2) among the sample were big
and small organizations, 3) the organizations operate in industries that had a large
direct debit invoicing. The sample is presented in Table 5.
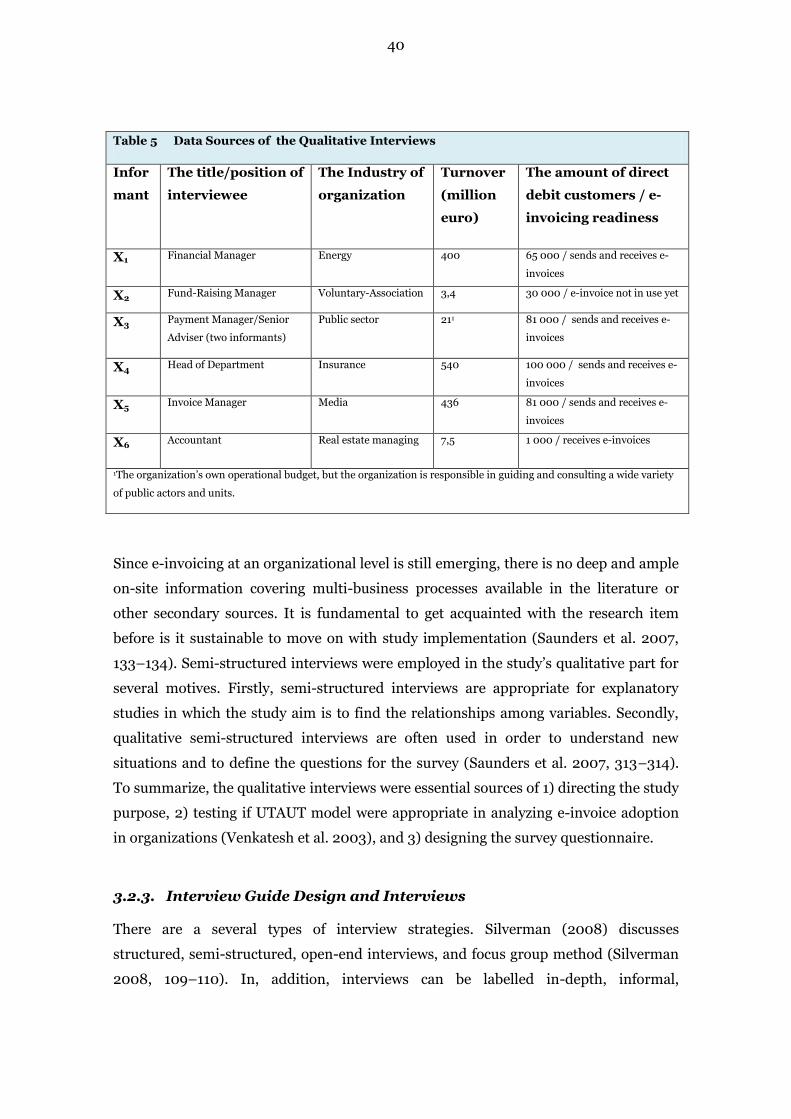
40
Since e-invoicing at an organizational level is still emerging, there is no deep and ample
on-site information covering multi-business processes available in the literature or
other secondary sources. It is fundamental to get acquainted with the research item
before is it sustainable to move on with study implementation (Saunders et al. 2007,
133–134). Semi-structured interviews were employed in the study’s qualitative part for
several motives. Firstly, semi-structured interviews are appropriate for explanatory
studies in which the study aim is to find the relationships among variables. Secondly,
qualitative semi-structured interviews are often used in order to understand new
situations and to define the questions for the survey (Saunders et al. 2007, 313–314).
To summarize, the qualitative interviews were essential sources of 1) directing the study
purpose, 2) testing if UTAUT model were appropriate in analyzing e-invoice adoption
in organizations (Venkatesh et al. 2003), and 3) designing the survey questionnaire.
3.2.3. Interview Guide Design and Interviews
There are a several types of interview strategies. Silverman (2008) discusses
structured, semi-structured, open-end interviews, and focus group method (Silverman
2008, 109–110). In, addition, interviews can be labelled in-depth, informal,
Table 5 Data Sources of the Qualitative Interviews
Infor
mant
The title/position of
interviewee
The Industry of
organization
Turnover
(million
euro)
The amount of direct
debit customers / e-
invoicing readiness
X1 Financial Manager Energy 400 65 000 / sends and receives e-
invoices
X2 Fund-Raising Manager Voluntary-Association 3,4 30 000 / e-invoice not in use yet
X3 Payment Manager/Senior
Adviser (two informants)
Public sector 211 81 000 / sends and receives e-
invoices
X4 Head of Department Insurance 540 100 000 / sends and receives e-
invoices
X5 Invoice Manager Media 436 81 000 / sends and receives e-
invoices
X6 Accountant Real estate managing 7,5 1 000 / receives e-invoices
1The organization’s own operational budget, but the organization is responsible in guiding and consulting a wide variety
of public actors and units.
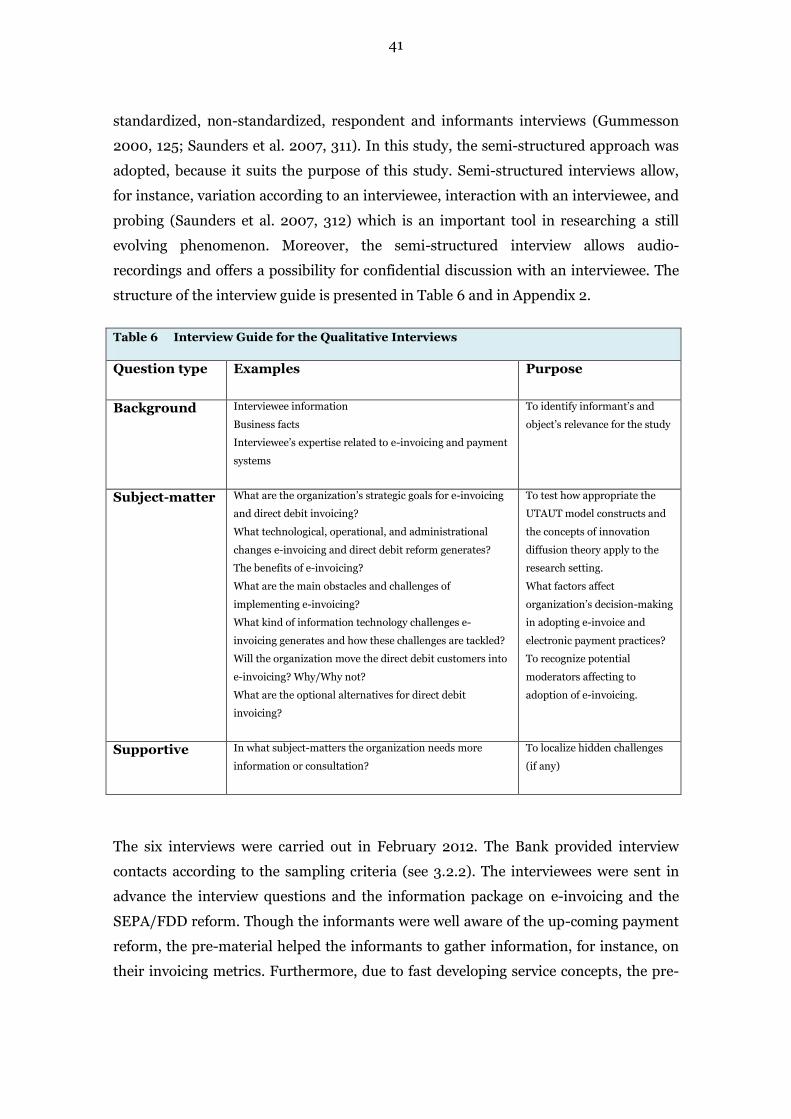
41
standardized, non-standardized, respondent and informants interviews (Gummesson
2000, 125; Saunders et al. 2007, 311). In this study, the semi-structured approach was
adopted, because it suits the purpose of this study. Semi-structured interviews allow,
for instance, variation according to an interviewee, interaction with an interviewee, and
probing (Saunders et al. 2007, 312) which is an important tool in researching a still
evolving phenomenon. Moreover, the semi-structured interview allows audio-
recordings and offers a possibility for confidential discussion with an interviewee. The
structure of the interview guide is presented in Table 6 and in Appendix 2.
Table 6 Interview Guide for the Qualitative Interviews
Question type Examples Purpose
Background Interviewee information
Business facts
Interviewee’s expertise related to e-invoicing and payment
systems
To identify informant’s and
object’s relevance for the study
Subject-matter What are the organization’s strategic goals for e-invoicing
and direct debit invoicing?
What technological, operational, and administrational
changes e-invoicing and direct debit reform generates?
The benefits of e-invoicing?
What are the main obstacles and challenges of
implementing e-invoicing?
What kind of information technology challenges e-
invoicing generates and how these challenges are tackled?
Will the organization move the direct debit customers into
e-invoicing? Why/Why not?
What are the optional alternatives for direct debit
invoicing?
To test how appropriate the
UTAUT model constructs and
the concepts of innovation
diffusion theory apply to the
research setting.
What factors affect
organization’s decision-making
in adopting e-invoice and
electronic payment practices?
To recognize potential
moderators affecting to
adoption of e-invoicing.
Supportive In what subject-matters the organization needs more
information or consultation?
To localize hidden challenges
(if any)
The six interviews were carried out in February 2012. The Bank provided interview
contacts according to the sampling criteria (see 3.2.2). The interviewees were sent in
advance the interview questions and the information package on e-invoicing and the
SEPA/FDD reform. Though the informants were well aware of the up-coming payment
reform, the pre-material helped the informants to gather information, for instance, on
their invoicing metrics. Furthermore, due to fast developing service concepts, the pre-
42
package also presented the state-of-the-art information from the service provider
perspective.
Five of the interviews were face-to-face encounters, and one was performed on the
phone (X4). In the interview of public sector (X3), there were present two informants.
In some interviews the Bank’s Key Account Manager was present (X1, X3, X5). The
interviews took place at the informant’s workplace. The interview-time ranged from 35
to 50 minutes, and the discussions were recorded and noted. After the interview, the
interviewer transcribed a summary (2–3 pages) which was sent to the informant for
additional comments and approval. The informants confirmed the content of the
summaries as such or with minor additional comments.
To summarize the goals of the qualitative method, the main purpose of the interviews
was to analyze whether the UTAUT model and the innovation diffusion approach were
appropriate for analyzing the adoption of e-invoicing in organizations. In addition, the
interviews provided information how the decision makers regard e-invoicing in relation
to the organizations business processes and their competitive environment, and which
factors might affect and explain companies’ e-invoice adoption. In the following section
the adjusted UTAUT model will be reasoned based on the results from the interviews.
3.3. Analysis of the Qualitative Interviews
The decision to explain the qualitative findings in the method chapter differ slightly
from the traditional study report structure. Different structures were explored, but
finally it was decided to adopt this structure, because it helps the reader to get a
coherent understanding how the hypotheses that were constructed and tested in the
quantitative part of the empirical study.
The goals of the qualitative interviews were to explore whether the UTAUT model and
the innovation diffusion approaches are appropriate for analyzing the adoption of e-
invoicing in organizations. Without the interview data collection, defining the study
purpose, creating hypotheses and building a survey questionnaire would have been
much more difficult due to the many-layered complexity of e-invoicing. Moreover, the
interviews were necessary to grasp how organization are prepared to e-invoice
exploitation and new payment practices related to vanishing Finnish direct debit
scheme from February 2014 onwards.
43
The following structure in reporting the qualitative interviews is reflected on the
literature review. First, e-invoicing as an innovation is defined in organizational
environment and how Roger’s adopter categorization applies to cases selected to the
qualitative study. Then the important variables – size, resources, management –
affecting to technology adoption in organizations are elaborated. Finally, the plans of
the organizations regarding of the Finnish direct debit (FDD) scheme are discussed.
The citations of the interviews are presented along the text with indentions.
3.3.1. E-invoice as an Innovation Type
Adopting and developing the use of electronic payment procedures is very close to Type
2 innovation (see 2.4.2). These innovation types are usually aligned with enterprise-
wide information systems (Zhu and Kraemer 2005, 63–64). Hence, e-invoice adoption
will stumble if it is not examined from an intra-organizational point of view over the
different business functions.
Adopting e-invoicing and the new SEPA related payment practices do not require
a comprehensive information system reshaping. However, due to
interconnectness of the organization’s ICT-systems, it takes in big organizations
about a year to complete all necessary coding, testing and building user interfaces
(X4 insurance).
The demanded technical requirements are a punch of smaller updates that do not
concern us. We are more worried will these updates be implemented exactly the
same fashion including in every invoicing unit. If not, we will lose the uniformity
of the payment system which is the ultimate objective under the state
administration. For this reason it is extremely important that the service
providers follow standardized code of conduct in launching their supportive
services (X3 public sector).
3.3.2. Adopter Categorization
The interviews exposed as expected that big organizations are far more familiar with
upcoming new payment services related to e-invoicing and the direct debit reform.
Thus, the interviewed organizations could be divided roughly into two groups: 1)
organizations whose e-invoicing capabilities, readiness, and resources were at high
standards: they could be called innovators, early adopters or early majority; and 2)
small and middle-size companies whose own capabilities, resources, and awareness
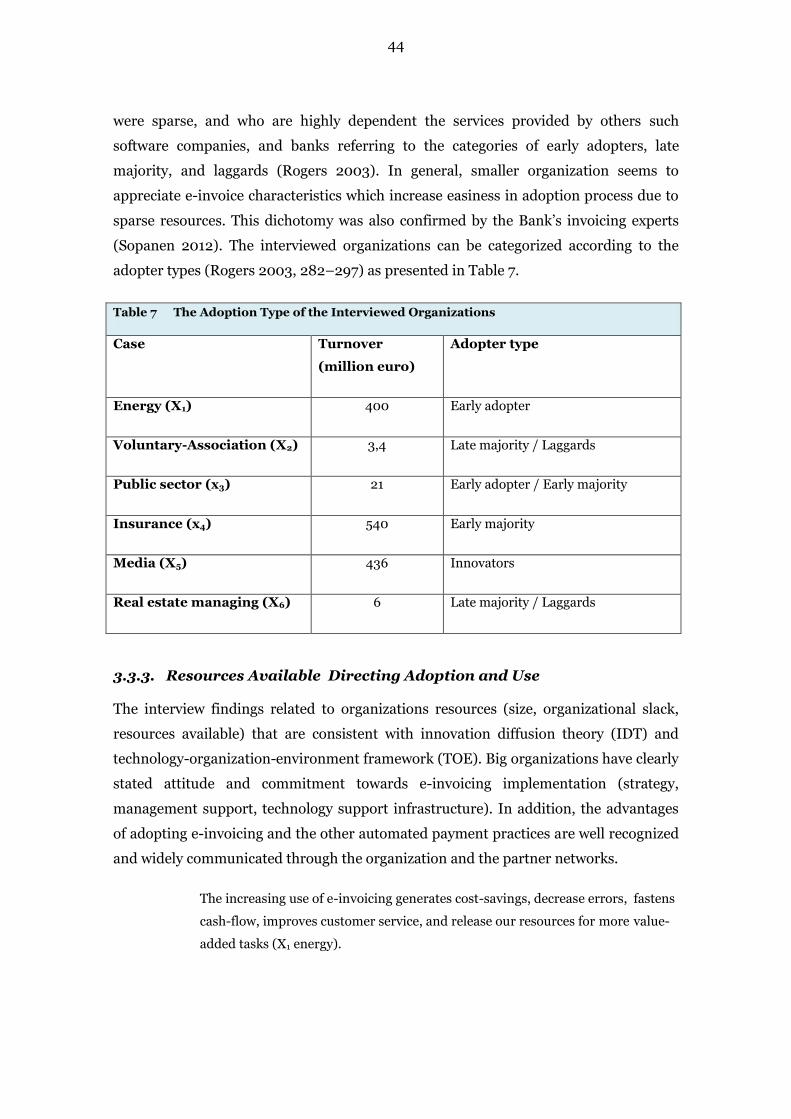
44
were sparse, and who are highly dependent the services provided by others such
software companies, and banks referring to the categories of early adopters, late
majority, and laggards (Rogers 2003). In general, smaller organization seems to
appreciate e-invoice characteristics which increase easiness in adoption process due to
sparse resources. This dichotomy was also confirmed by the Bank’s invoicing experts
(Sopanen 2012). The interviewed organizations can be categorized according to the
adopter types (Rogers 2003, 282–297) as presented in Table 7.
Table 7 The Adoption Type of the Interviewed Organizations
Case Turnover
(million euro)
Adopter type
Energy (X1) 400 Early adopter
Voluntary-Association (X2) 3,4 Late majority / Laggards
Public sector (x3) 21 Early adopter / Early majority
Insurance (x4) 540 Early majority
Media (X5) 436 Innovators
Real estate managing (X6) 6 Late majority / Laggards
3.3.3. Resources Available Directing Adoption and Use
The interview findings related to organizations resources (size, organizational slack,
resources available) that are consistent with innovation diffusion theory (IDT) and
technology-organization-environment framework (TOE). Big organizations have clearly
stated attitude and commitment towards e-invoicing implementation (strategy,
management support, technology support infrastructure). In addition, the advantages
of adopting e-invoicing and the other automated payment practices are well recognized
and widely communicated through the organization and the partner networks.
The increasing use of e-invoicing generates cost-savings, decrease errors, fastens
cash-flow, improves customer service, and release our resources for more value-
added tasks (X1 energy).
45
It is a fact that e-invoices guarantee quicker cash-flow. Moreover, regarding e-
invoicing we need to send a demand note for 4% of customers, in paper format
invoicing the degree is 15% (X5 media).
We can just wait how the bank and software houses develop their offering and
when they communicated the new services possibilities to us. I am afraid that
though we had all e-invoicing capabilities at our disposal, our customers do not
adopt, for instance, e-invoice if it is not obligatory to do so. I think that this
opinion is shared in most of companies operating in real estate house managing
business. (X6 real estate managing).
These statements are equivalent with the IDT and the TOE constructs progressing
technology adoption development such as attitude towards change, complexity,
interconnectedness, system openness, and communication process (Rogers 2003, 402–
433; Zhu and Kraemer 2005). In similar vein, the performance expectancy of the
UTAUT model resembles a pretty much same kind of reasoning (Venkatesh 2003).
In the study sample, X2 (voluntary-association) and X6 (real estate managing)
presented small organizations. The differences of small and big organizations were also
referred nearly in all interviews. For instance, X1 (energy) and X3 (public sector) stated
that small companies cannot progress properly in e-invoicing until the offering is
transparent and there is guidance available also for small actors. It is probable that
small organization put more value on easiness and clarity in e-invoice adoption than
big organizations which are usually very self-satisfied in technical issues. In summary,
small organizations most likely emphasize the factors related to the effort expectancy
(EE) of the UTAUT construct.
The TOE framework related to EDI adoption studies has found that there is no strong
relationship between the increased use of EDI and the technological support from
service providers (Asare et al. 2011, 194). Interestingly, all cases determinately stated
that the necessary prerequisite for successful e-invoice adoption and the other payment
services replacing the vanishing Finnish direct debit (FDD) scheme are strongly
dependent on how services providers are able to establish a uniform service platform
and procedures for invoicing organizations. Thus, the influence of external
environment and inter-contextual conditions seem to be fundamental. One plausible
interpretation for this is that the progress of e-invoicing is possible only if it spreads
widely among the organizations and other users, and these users get enough support,
46
guidance and consulting from the service providers and invoicing organizations. In
comparable, owning a telephone is in wane if there is no-one to call upon.
We expect that the banks will launch their new payment services and options at
the same time and the all banks have pretty much comparable offering. Only
then we can direct and guide our customers to adopt new payment practices.
Otherwise the adoption process in invoicing organizations will be cumbersome
and slow (X4 Insurance).
We are open-minded for all kinds of new payment concepts, but not at any cost.
We are irritated that certain payment options offered to us by the banks without
properly explaining reasons why these payment practices should be are preferred.
As a responsible of our customer invoicing process, I like to compare all options
before we are ready to adopt new payment solutions, and now there is too little
information available to do that (X2 voluntary association).
3.3.4. Management’s Impact on Technology Adoption
In general, the attitude toward e-invoicing appeared to be highly dependent on how the
top-management is committed to the implementation of e-invoicing adoption.
Interestingly, the informants discussed the management’s role implicitly, but definitely
at least in big organizations e-invoicing is categorized as a strategic – not tactical –
business operation.
We implement e-invoicing according to our strategy during the upcoming year,
and after then the executive board will decide how we will progress with direct
debit reform (X4 insurance).
Big organizations are confident that they are able to tackle challenges related to project
management and technical infrastructure. In other words, in TOE language,
technology-organization framework does not worry big organizations, because they
seem to have necessary resources available due to management’s commitment and the
size of the organization.
However, big organizations see uncertainties in their external environment framework.
Big organizations are widely and deeply interconnected to their external environment
compared to small organizations. The question is how an organization receives
consulting from e-invoice service providers. How their competitors progress in e-
invoice adoption, and how their partner and customers adopt new payment practices.
47
These are perspectives that most likely have to interest of the top-management. In
UTAUT language, big organizations stress more on social influence (SI) and facilitating
conditions (FC).
In contrast, small organizations are more concerned about the technical challenges
which usually are not the top-priority of the management, and decisions made at a
lower level if the investments are modest as it is often case regarding e-invoice.
The updates of the accounting and financial administration software are critical
to us. As a small company, we do not have possibilities to demand a lot from
service providers or influence in what period of time updates take place. In
addition, our own technical capabilities are sparse as it is often a case in small
businesses. Therefore, we are highly dependent on how offering evolves and we
forced to reach accordingly, but of course we wish that new e-payment solutions
are easy to adopt and use (X6 real estate managing).
Innovation diffusion theory (IDT) posit that centralization (the degree to which power
and control in a system/organization are concentrated) and formalization (the degree
to which an organization emphasizes its members’ following rules and procedures)
hinder implementation were not convincingly confirmed. Especially case X4
(insurance) had centralized decision-making and problem-solving processes, but also a
little bit at lesser extent cases X1 (Energy) and X3 (public sector) and X5 (media) had
created unilateral code of conduct across the business units and divisions.
Our management stress that the state organizations must follow the same
procedures through whole invoicing implementation. This principle concerns
also the fact how the new payment options are communicated to our customers
(X3 public sector).
3.3.5. Organizations’ Plans regarding the Direct Debit Replacement
The main alternatives for direct debit are 1) e-invoicing, 2) direct payment (a new
service provided by the banks), 3) SEPA direct payment, 4) card payments, 5) e-bank
payment in the internet, and 6) paper invoicing (see Figure 1 and Appendix 4).
The interviewed organizations are well aware that Finnish Direct Debit scheme expires
in the two year time. However, there are big differences between big and small
organizations how far-fetching preparations efforts have been, and what a general
attitude for the new situation is.
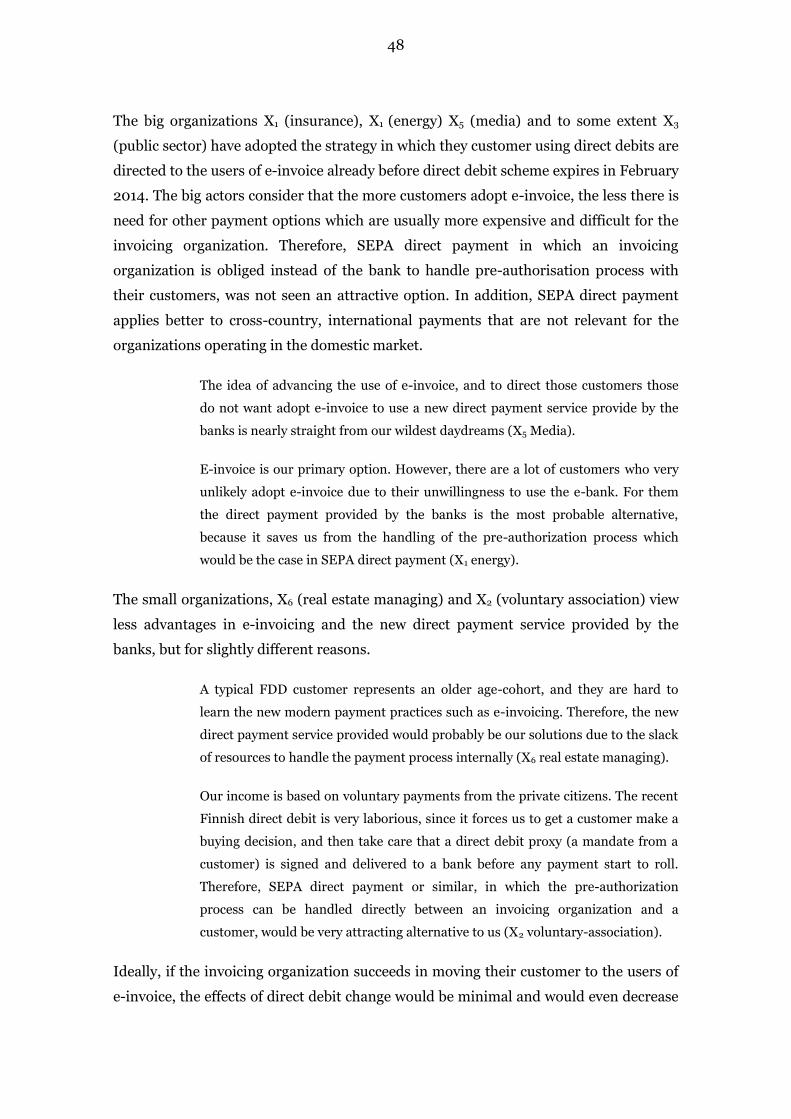
48
The big organizations X1 (insurance), X1 (energy) X5 (media) and to some extent X3
(public sector) have adopted the strategy in which they customer using direct debits are
directed to the users of e-invoice already before direct debit scheme expires in February
2014. The big actors consider that the more customers adopt e-invoice, the less there is
need for other payment options which are usually more expensive and difficult for the
invoicing organization. Therefore, SEPA direct payment in which an invoicing
organization is obliged instead of the bank to handle pre-authorisation process with
their customers, was not seen an attractive option. In addition, SEPA direct payment
applies better to cross-country, international payments that are not relevant for the
organizations operating in the domestic market.
The idea of advancing the use of e-invoice, and to direct those customers those
do not want adopt e-invoice to use a new direct payment service provide by the
banks is nearly straight from our wildest daydreams (X5 Media).
E-invoice is our primary option. However, there are a lot of customers who very
unlikely adopt e-invoice due to their unwillingness to use the e-bank. For them
the direct payment provided by the banks is the most probable alternative,
because it saves us from the handling of the pre-authorization process which
would be the case in SEPA direct payment (X1 energy).
The small organizations, X6 (real estate managing) and X2 (voluntary association) view
less advantages in e-invoicing and the new direct payment service provided by the
banks, but for slightly different reasons.
A typical FDD customer represents an older age-cohort, and they are hard to
learn the new modern payment practices such as e-invoicing. Therefore, the new
direct payment service provided would probably be our solutions due to the slack
of resources to handle the payment process internally (X6 real estate managing).
Our income is based on voluntary payments from the private citizens. The recent
Finnish direct debit is very laborious, since it forces us to get a customer make a
buying decision, and then take care that a direct debit proxy (a mandate from a
customer) is signed and delivered to a bank before any payment start to roll.
Therefore, SEPA direct payment or similar, in which the pre-authorization
process can be handled directly between an invoicing organization and a
customer, would be very attracting alternative to us (X2 voluntary-association).
Ideally, if the invoicing organization succeeds in moving their customer to the users of
e-invoice, the effects of direct debit change would be minimal and would even decrease
49
invoicing costs and improve efficiency. In reality, to achieve 100% e-invoice penetration
among customers is illusory. Big organizations must adopt other payment options
which the direct payment provided by the Finnish banks is the most wanted alternative.
3.3.6. Summary of the Qualitative Findings
The qualitative part had an important influence on the elaboration of the focus of study
and the hypothesis creation. First of all, the interviews revealed that the e-invoice is
current and they often experienced complex-natured development targets relating to
organizations’ internal processes and external competitive environment. In addition,
the informants strengthened the pre-understanding that adopting e-invoicing should
beneficially lead to developing many organizational business processes such as
customer service and e-procurement. The e-invoice adoption was rated by the
informants as Type 2 innovation (Zhu and Kraemer 2005).
Secondly, in the UTAUT model, the influence of management is taken into
consideration faintly. However, in the interviews the role of management appeared to
be significant especially in bigger organizations. Furthermore, the size of an
organization seemed to be in close relation to the adoption capability. This observation
is consistent with IDT and TOE prerequisites. As a result, the management’s
commitment (MA) was preserved in the analysis according to the proposed UTAUT
model (see section 2.6). In similar vein, the influence of the organization size and the
industry were also kept in the model.
Finally, the organizations were well aware about upcoming SEPA reform and its
demands for renewing the Finnish direct debit (FDD) payment practices. The majority
of informants expressed that their primary alternatives for FDD were e-invoice or new
direct payment provided by the banks. Clearly, the higher degree of e-invoice adoption
is, the positive way the organizations see the SEPA reform and its consequences.
Therefore, five out of six cases had already started to adopt e-invoicing in order to
smooth out the effects of the SEPA reform.
3.4. Hypotheses for the Survey Study
The hypotheses for the quantitative part were created by utilizing the findings of the
interviews, the guidance of the UTAUT model, and the innovation diffusion literature.
50
In addition, current e-invoice surveys and the information related to SEPA (Single Euro
Payments Area) were utilized in the process of the hypotheses reasoning.
In consequence, 10 hypotheses are proposed and described in Table 8. The hypotheses
H1–H4 have been systematically tested and validated in UTAUT studies; H5–H8 focus
on organizations’ size, industry, and the influence of management that are commonly
identified in the technology adoption research. Finally, H9–H10 shed light on how
invoicing organizations are meeting the Finnish direct debit (FDD) reform in terms of
B2C customers and the implementation of the organizations’ information system
adjustments.
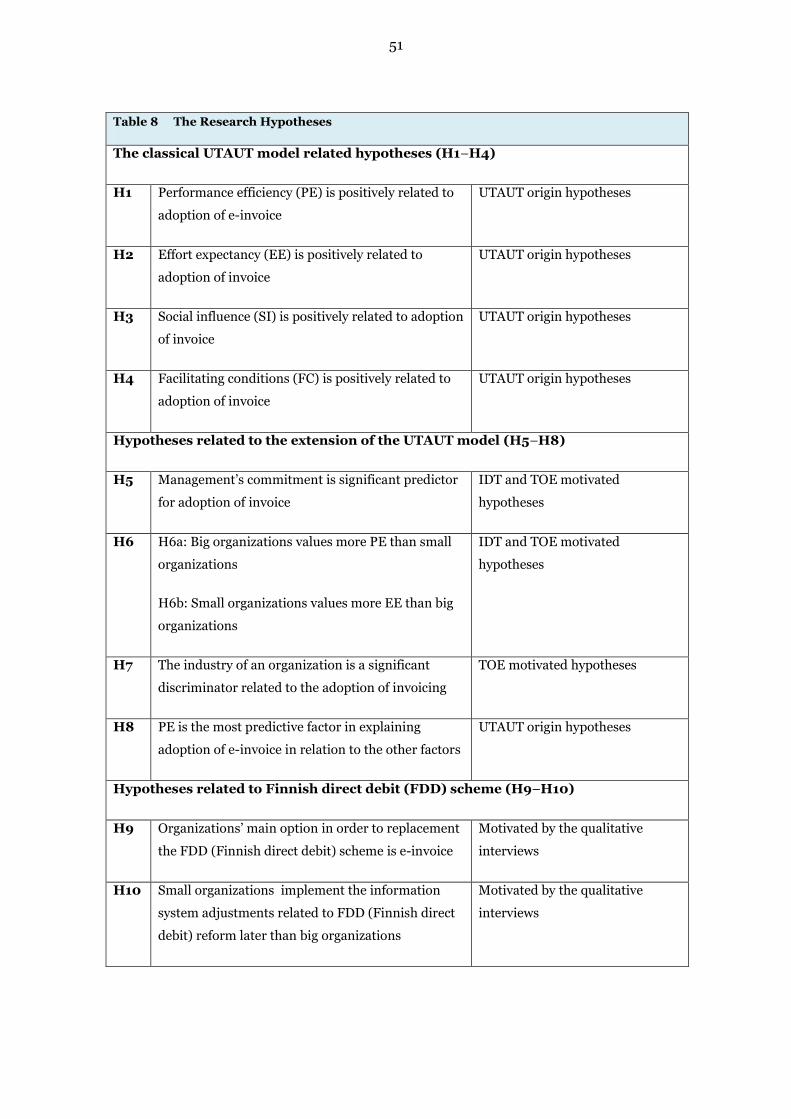
51
Table 8 The Research Hypotheses
The classical UTAUT model related hypotheses (H1–H4)
H1 Performance efficiency (PE) is positively related to
adoption of e-invoice
UTAUT origin hypotheses
H2 Effort expectancy (EE) is positively related to
adoption of invoice
UTAUT origin hypotheses
H3 Social influence (SI) is positively related to adoption
of invoice
UTAUT origin hypotheses
H4 Facilitating conditions (FC) is positively related to
adoption of invoice
UTAUT origin hypotheses
Hypotheses related to the extension of the UTAUT model (H5–H8)
H5 Management’s commitment is significant predictor
for adoption of invoice
IDT and TOE motivated
hypotheses
H6 H6a: Big organizations values more PE than small
organizations
H6b: Small organizations values more EE than big
organizations
IDT and TOE motivated
hypotheses
H7 The industry of an organization is a significant
discriminator related to the adoption of invoicing
TOE motivated hypotheses
H8 PE is the most predictive factor in explaining
adoption of e-invoice in relation to the other factors
UTAUT origin hypotheses
Hypotheses related to Finnish direct debit (FDD) scheme (H9–H10)
H9 Organizations’ main option in order to replacement
the FDD (Finnish direct debit) scheme is e-invoice
Motivated by the qualitative
interviews
H10 Small organizations implement the information
system adjustments related to FDD (Finnish direct
debit) reform later than big organizations
Motivated by the qualitative
interviews
52
3.5. Quantitative Research Method
Design for the E-invoice Survey Having defined the adjusted UTAUT model, the survey questionnaire with references to
the literature review is presented in Table 9. As previously mentioned, the items are
based on the UTAUT literature, but they are converted from the level of individual at
workplace to covering the organizational level. The reference is mentioned in
connection to items in order to validate the selection. Furthermore, the original items
related to the core constructs are described in Appendix 1 (Venkatesh et al. 2003, 260).
The most important inductive finding of the interviews regarding the moderators was
the impact of management (MA) and the strategic e-invoice commitment of the
organization. The size was also stressed in the interviews i.e. big organizations were
much more prepared to implement e-invoicing. This supports the fact that the size is
one of the most commonly cited factors in the organizations’ adoption research (Zhu
and Kraemer 2005, 68). Therefore, the size variable was included into the model
together with industry variable.
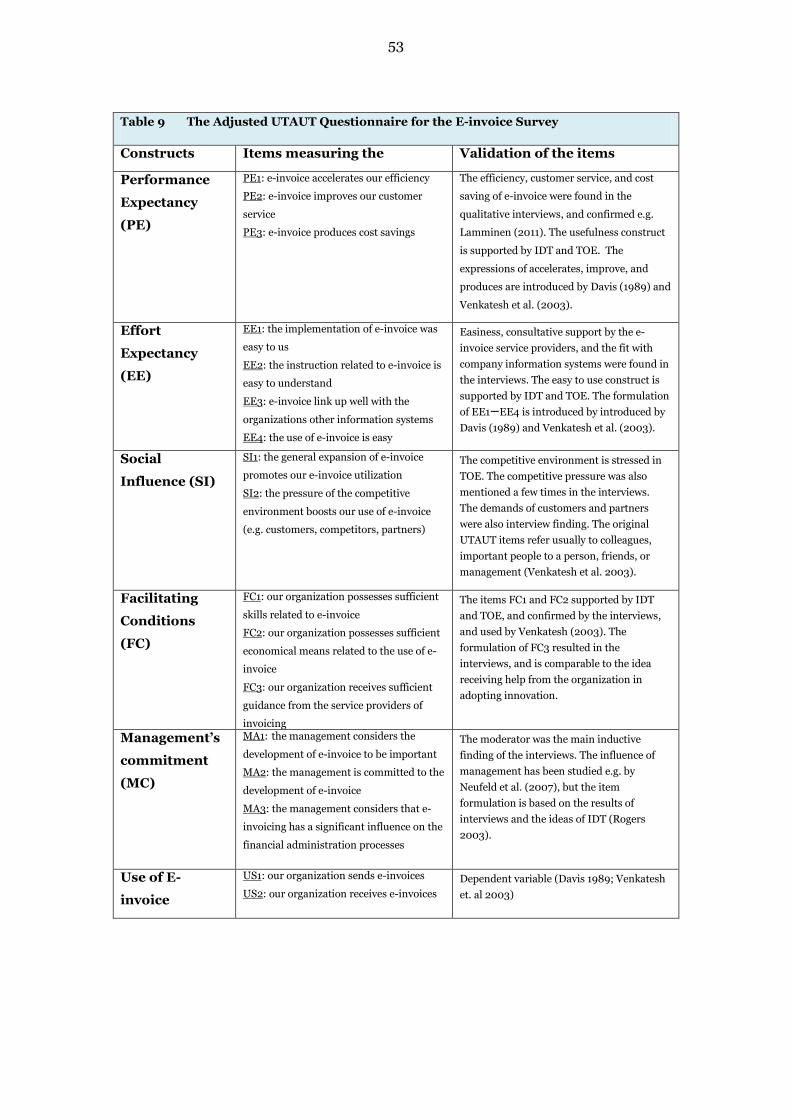
53
Table 9 The Adjusted UTAUT Questionnaire for the E-invoice Survey
Constructs Items measuring the
constructs
Validation of the items
Performance
Expectancy
(PE)
PE1: e-invoice accelerates our efficiency
PE2: e-invoice improves our customer
service
PE3: e-invoice produces cost savings
The efficiency, customer service, and cost
saving of e-invoice were found in the
qualitative interviews, and confirmed e.g.
Lamminen (2011). The usefulness construct
is supported by IDT and TOE. The
expressions of accelerates, improve, and
produces are introduced by Davis (1989) and
Venkatesh et al. (2003).
Effort
Expectancy
(EE)
EE1: the implementation of e-invoice was
easy to us
EE2: the instruction related to e-invoice is
easy to understand
EE3: e-invoice link up well with the
organizations other information systems
EE4: the use of e-invoice is easy
Easiness, consultative support by the e-
invoice service providers, and the fit with
company information systems were found in
the interviews. The easy to use construct is
supported by IDT and TOE. The formulation
of EE1–EE4 is introduced by introduced by
Davis (1989) and Venkatesh et al. (2003).
Social
Influence (SI)
SI1: the general expansion of e-invoice
promotes our e-invoice utilization
SI2: the pressure of the competitive
environment boosts our use of e-invoice
(e.g. customers, competitors, partners)
The competitive environment is stressed in
TOE. The competitive pressure was also
mentioned a few times in the interviews.
The demands of customers and partners
were also interview finding. The original
UTAUT items refer usually to colleagues,
important people to a person, friends, or
management (Venkatesh et al. 2003).
Facilitating
Conditions
(FC)
FC1: our organization possesses sufficient
skills related to e-invoice
FC2: our organization possesses sufficient
economical means related to the use of e-
invoice
FC3: our organization receives sufficient
guidance from the service providers of
invoicing
The items FC1 and FC2 supported by IDT
and TOE, and confirmed by the interviews,
and used by Venkatesh (2003). The
formulation of FC3 resulted in the
interviews, and is comparable to the idea
receiving help from the organization in
adopting innovation.
Management’s
commitment
(MC)
MA1: the management considers the
development of e-invoice to be important
MA2: the management is committed to the
development of e-invoice
MA3: the management considers that e-
invoicing has a significant influence on the
financial administration processes
The moderator was the main inductive
finding of the interviews. The influence of
management has been studied e.g. by
Neufeld et al. (2007), but the item
formulation is based on the results of
interviews and the ideas of IDT (Rogers
2003).
Use of E-
invoice
US1: our organization sends e-invoices
US2: our organization receives e-invoices
Dependent variable (Davis 1989; Venkatesh
et. al 2003)
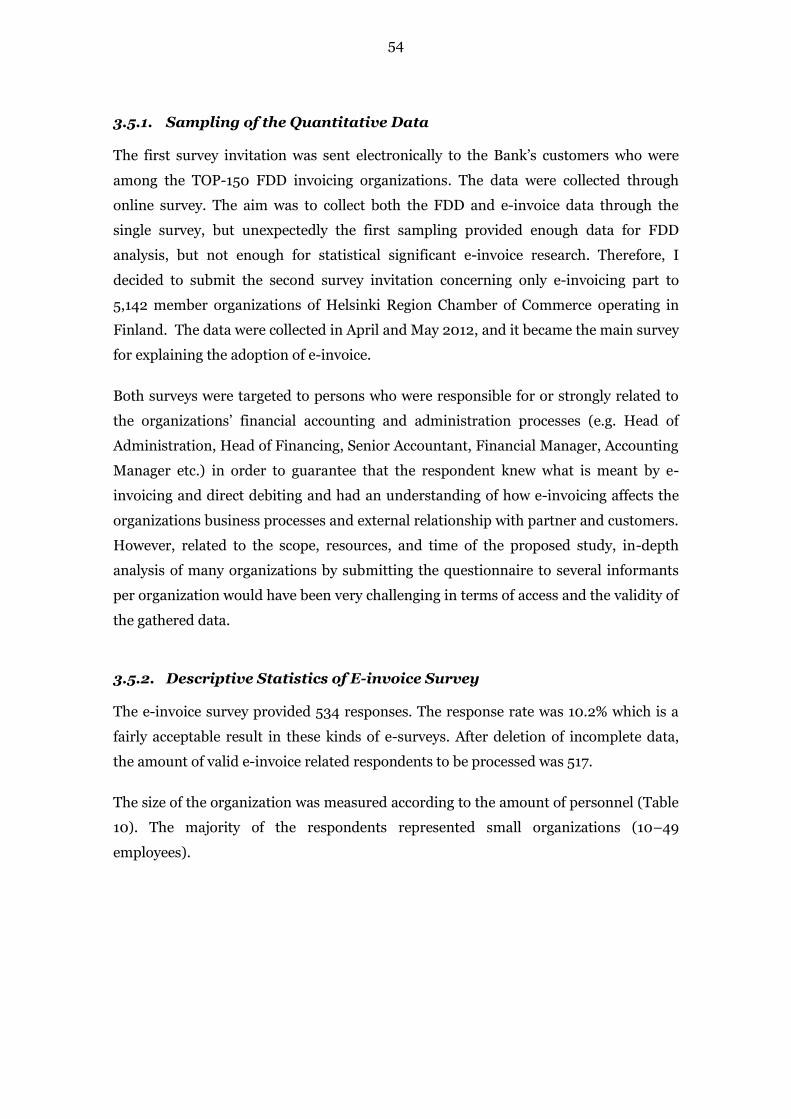
54
3.5.1. Sampling of the Quantitative Data
The first survey invitation was sent electronically to the Bank’s customers who were
among the TOP-150 FDD invoicing organizations. The data were collected through
online survey. The aim was to collect both the FDD and e-invoice data through the
single survey, but unexpectedly the first sampling provided enough data for FDD
analysis, but not enough for statistical significant e-invoice research. Therefore, I
decided to submit the second survey invitation concerning only e-invoicing part to
5,142 member organizations of Helsinki Region Chamber of Commerce operating in
Finland. The data were collected in April and May 2012, and it became the main survey
for explaining the adoption of e-invoice.
Both surveys were targeted to persons who were responsible for or strongly related to
the organizations’ financial accounting and administration processes (e.g. Head of
Administration, Head of Financing, Senior Accountant, Financial Manager, Accounting
Manager etc.) in order to guarantee that the respondent knew what is meant by e-
invoicing and direct debiting and had an understanding of how e-invoicing affects the
organizations business processes and external relationship with partner and customers.
However, related to the scope, resources, and time of the proposed study, in-depth
analysis of many organizations by submitting the questionnaire to several informants
per organization would have been very challenging in terms of access and the validity of
the gathered data.
3.5.2. Descriptive Statistics of E-invoice Survey
The e-invoice survey provided 534 responses. The response rate was 10.2% which is a
fairly acceptable result in these kinds of e-surveys. After deletion of incomplete data,
the amount of valid e-invoice related respondents to be processed was 517.
The size of the organization was measured according to the amount of personnel (Table
10). The majority of the respondents represented small organizations (10–49
employees).
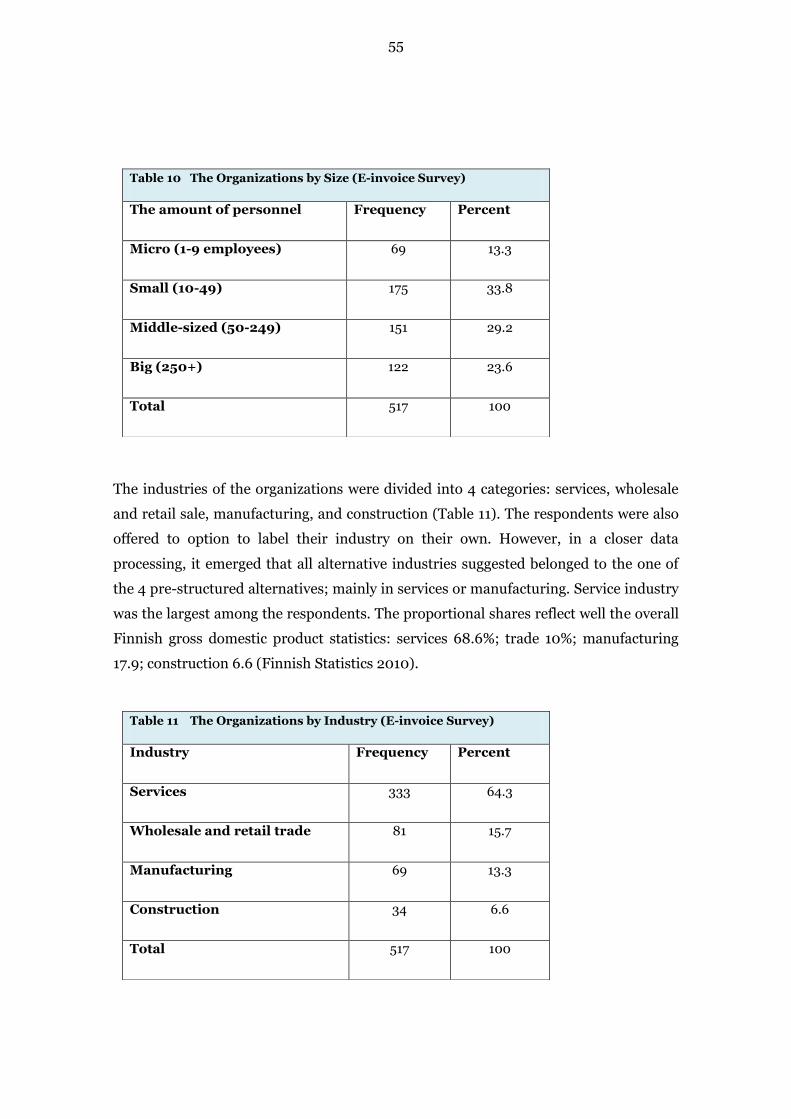
55
The industries of the organizations were divided into 4 categories: services, wholesale
and retail sale, manufacturing, and construction (Table 11). The respondents were also
offered to option to label their industry on their own. However, in a closer data
processing, it emerged that all alternative industries suggested belonged to the one of
the 4 pre-structured alternatives; mainly in services or manufacturing. Service industry
was the largest among the respondents. The proportional shares reflect well the overall
Finnish gross domestic product statistics: services 68.6%; trade 10%; manufacturing
17.9; construction 6.6 (Finnish Statistics 2010).
Table 10 The Organizations by Size (E-invoice Survey)
The amount of personnel Frequency Percent
Micro (1-9 employees) 69 13.3
Small (10-49) 175 33.8
Middle-sized (50-249) 151 29.2
Big (250+) 122 23.6
Total 517 100
Table 11 The Organizations by Industry (E-invoice Survey)
Industry Frequency Percent
Services 333 64.3
Wholesale and retail trade 81 15.7
Manufacturing 69 13.3
Construction 34 6.6
Total 517 100
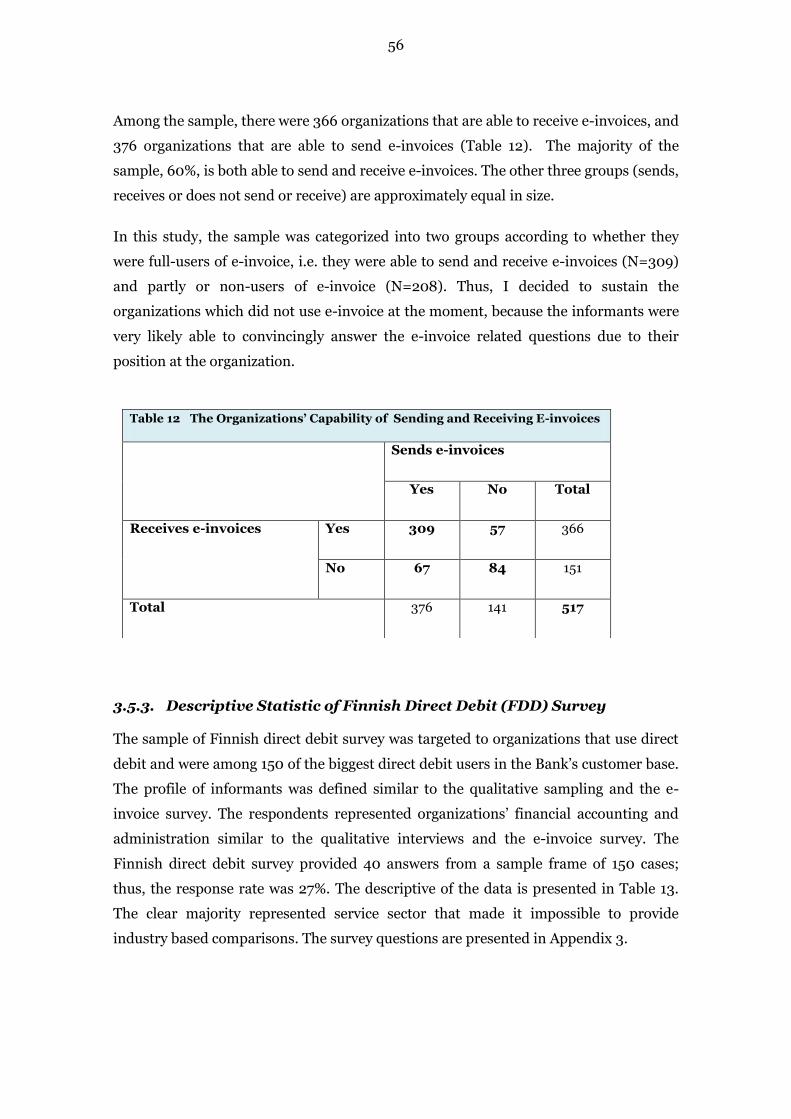
56
Among the sample, there were 366 organizations that are able to receive e-invoices, and
376 organizations that are able to send e-invoices (Table 12). The majority of the
sample, 60%, is both able to send and receive e-invoices. The other three groups (sends,
receives or does not send or receive) are approximately equal in size.
In this study, the sample was categorized into two groups according to whether they
were full-users of e-invoice, i.e. they were able to send and receive e-invoices (N=309)
and partly or non-users of e-invoice (N=208). Thus, I decided to sustain the
organizations which did not use e-invoice at the moment, because the informants were
very likely able to convincingly answer the e-invoice related questions due to their
position at the organization.
3.5.3. Descriptive Statistic of Finnish Direct Debit (FDD) Survey
The sample of Finnish direct debit survey was targeted to organizations that use direct
debit and were among 150 of the biggest direct debit users in the Bank’s customer base.
The profile of informants was defined similar to the qualitative sampling and the e-
invoice survey. The respondents represented organizations’ financial accounting and
administration similar to the qualitative interviews and the e-invoice survey. The
Finnish direct debit survey provided 40 answers from a sample frame of 150 cases;
thus, the response rate was 27%. The descriptive of the data is presented in Table 13.
The clear majority represented service sector that made it impossible to provide
industry based comparisons. The survey questions are presented in Appendix 3.
Table 12 The Organizations’ Capability of Sending and Receiving E-invoices
Sends e-invoices
Yes No Total
Receives e-invoices Yes 309 57 366
No 67 84 151
Total 376 141 517
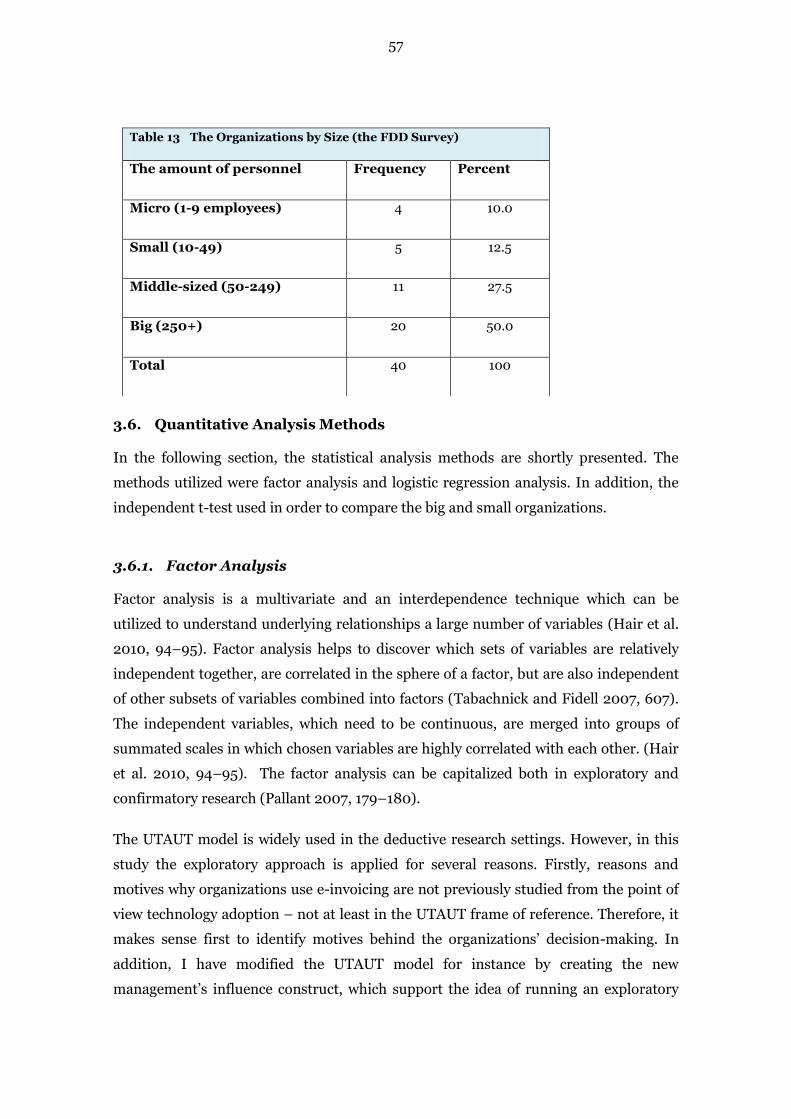
57
3.6. Quantitative Analysis Methods
In the following section, the statistical analysis methods are shortly presented. The
methods utilized were factor analysis and logistic regression analysis. In addition, the
independent t-test used in order to compare the big and small organizations.
3.6.1. Factor Analysis
Factor analysis is a multivariate and an interdependence technique which can be
utilized to understand underlying relationships a large number of variables (Hair et al.
2010, 94–95). Factor analysis helps to discover which sets of variables are relatively
independent together, are correlated in the sphere of a factor, but are also independent
of other subsets of variables combined into factors (Tabachnick and Fidell 2007, 607).
The independent variables, which need to be continuous, are merged into groups of
summated scales in which chosen variables are highly correlated with each other. (Hair
et al. 2010, 94–95). The factor analysis can be capitalized both in exploratory and
confirmatory research (Pallant 2007, 179–180).
The UTAUT model is widely used in the deductive research settings. However, in this
study the exploratory approach is applied for several reasons. Firstly, reasons and
motives why organizations use e-invoicing are not previously studied from the point of
view technology adoption – not at least in the UTAUT frame of reference. Therefore, it
makes sense first to identify motives behind the organizations’ decision-making. In
addition, I have modified the UTAUT model for instance by creating the new
management’s influence construct, which support the idea of running an exploratory
Table 13 The Organizations by Size (the FDD Survey)
The amount of personnel Frequency Percent
Micro (1-9 employees) 4 10.0
Small (10-49) 5 12.5
Middle-sized (50-249) 11 27.5
Big (250+) 20 50.0
Total 40 100
58
approach. Finally, technology adoption models overwhelmingly focus on the individual
adoption behaviour, but in this study inter-organizational view is adopted.
In summary, due to model extensions and the lack of previous studies, the exploratory
factor analysis is an appropriate solution to explaining interrelationships between the
15 independent variables that measured the adoption of e-invoice in organizations. The
items were created to measure the core UTAUT model constructs (PE, EE, SI, FC), and
the influence of management’s commitment towards the adoption of thee-invoice.
3.6.2. Logistic Regression Analysis
Due to the fact that the use of e-invoice as a dependent variable is a dichotomy
categorical variable (invoice user vs. partly or non-user), and which are mutually
exclusive, the logistic regression analysis applicable to analysis (Pallant 2007, 166). In
logistic regression the independent variable can be continuous, discrete, or
dichotomous. In addition, regression analysis allows that the independent and
dependent variables not need to be normally distributed or not to have the equal
variance within each group (Tabachnick and Fidell 2007, 437). Logistic regression
analysis aims to find the best mix of variables that explain the phenomenon under the
interest. The method is utilized both to the model building and to the prediction of
group membership; for instance, a highly investing company is likely to more
successful than a company that invest only moderately (Metsämuuronen 2006, 670–
761.).
In conclusion, in this study logistic regression was applied in order to test the model
created by the findings of the UTAUT model and factor analysis. The use of e-invoicing
was tested with the two groups on e-invoice full users (i.e. organization receives and
sends e-invoices) versus partly and non-users (either receives or sends or does not use
e-invoicing yet). Also, the effect of an organization size and an industry were analyzed.
3.6.3. Independent-Samples T-Test
An independent-samples t-test is utilized when one needs to compare the means for
two different groups of subjects (Pallant 2007, 232). The T-test assesses the statistical
significance of the difference between these two groups for a single dependent variable
(Hair et al. 201o, 442). The prerequisite for the t-test is to have one independent
categorical variable, and one continuous, dependent variable (Pallant 2007, 233). In
59
this study, the t-test was applied to evaluate whether big organizations implement the
Finnish Direct Debit (FDD) in relation updates earlier than the small invoicing
organizations (see section 3.4. Hypotheses Creation).
3.7. Quality of the Research
The researcher must always evaluate how well the results achieved reflect on reality and
how well findings can be generalized across larger population. In quantitative research,
the sources of the possible degree of measurement errors, validity and reliability, are
usually evaluated. Validity is the degree to which measure accurately measures what is
meant to; and reliability is the degree to which observed variable measures genuine
value consistently in similar contexts (Hair et al. 2010, 6–8).
The constructs used and defined for this study were based on the findings of
Technology acceptance models (TAM/UTAUT), the Innovation diffusion theory (IDT),
and the Technology-organizational-environmental framework (TOE). These
approaches have been widely and successfully used in many organizational technology
adoptions research settings (e.g. Davis et al. 1989; Venkatesh et al. 2003). The
constructs were validated through the qualitative interviews before the quantitative
survey was implemented. All informants had a long experience on e-invoicing and
payment practices in organizational settings that also increased trustworthiness of the
data. Thus, the constructs used in this study are based on the largely used and accepted
theoretical approaches which improve the validity and reliability of the study. However,
the item modification from the individual to organizational level may have violated the
validity of my study since individuals may have had difficulties to provide data on every
item required from the organizational point of view.
The items measuring five selected constructs (effort performance, effort expectancy,
social influence, facilitating conditions, management’s committed) were all valid for
factor analysis (i.e. communalities exceeded the level of o.5). Furthermore, the data
applied well to factor analysis resulting in the excellent sample adequacy. Finally, the
internal consistency of the factors (constructs) was measured with Cronbach’s alpha
resulted in very good internal consistency reliability of scale (more in the section 4.1.2).
The sample size affects the reliability of research (e.g. Hair et al. 2010, Niles 2006).
There are in Finland about 350,000 organizations operating in the public and the
private sector that are potential e-invoice users. The e-invoice sample consisted of 5,142
60
cases which provided 517 answers. The response rate is usual for studies on
organizations. Since the responding organizations represent different size, industries,
and use of e-invoice, it can be assumed that the sample is representative. Moreover, the
distribution of answered organization according to the industries followed very closely
the existing industry profile in Finland. It has also been acknowledged that the
organization profile according to size emphasized slightly big organization. However,
this is a not big issue, because there are enough answers in every size category. To
summarize, the data collected can be fairly confidently be generalized in relation to the
aim of the study.
61
4 RESULTS
In this chapter the results will be presented. In the first section, the adjusted UTAUT
model is exploratory tested in order to generalize the findings. In consequence, the
quantitative section (4.1) consists of the descriptive statistics; analyzing reliability of
scale and the correlations between factors; and testing the predictive power of the
adjusted UTAUT model with logistical regression. The results section is completed with
the hypotheses testing (4.2–4.3). Both surveys are used to the hypotheses, when
appropriate.
4.1. Analysis of Quantitative E-invoice Survey
4.1.1. Basic Assumptions
The quality of the data affects strongly on how the results can be generalized to the
larger population. All continuous variables measuring the use of e-invoicing were
unevenly distributed meaning that items resulted in negative skewness values
(abbreviations are explained in Table 13). In other words, the informants considered
the advantages of e-invoicing bigger than disadvantages (Likert-scale 1–7). In a similar
vein, the majority of items generated positive kurtosis values that were close to zero,
which shows that the distribution is relatively peak (Pallant 2007, 56); the negative
kurtosis values were found from EE1, EE3, EE4, FC3, MA1, MA2, and MA3 which
might indicate some cases positioning in extremes (Pallant 2007, 56). However, this is
not a problem in relation to statistic analysis. The normality of the distribution was
evaluated with Kolmogorov-Smirnov test which showed that the data is not normally
distributed (p < 0.05); however, this is quite common and acceptable in large samples
(Pallant 2007, 62).
Despite the values of skewness, kurtosis and the test of normality assumptions violated
the normality assumptions it is usual in social sciences that samples are rarely normally
distributed. Furthermore, in large samples (N>200), it has been considered that
departures from normality do not need necessarily distort the results (Hair et al. 2010,
72).
The abbreviations of the measured items will be used in the analysis and the
presentation of the results. The abbreviations are presented in Table 14 below and
repeated in connection of Table 15.

62
Table 14 Items and their Abbreviations Used in the Model and the Questionnaire
PE1: e-invoice accelerates our efficiency
PE2: e-invoice improves our customer service
PE3: e-invoice produces cost savings
EE1: the implementation of e-invoice was easy to us
EE2: the instruction related to e-invoice is understandable
EE3: e-invoice link up well with the organizations other information systems
EE4: the use of e-invoice is easy
SI1: the general expansion of e-invoice promotes our e-invoice utilization
SI2: the pressure of the competitive environment boosts our use of e-invoice (e.g. customers, competitors, partners)
FC1: our organization possesses sufficient skills related to e-invoice
FC2: our organization possesses sufficient economical means related to the use of e-invoice
FC3: our organization receives sufficiently guidance from the service providers of invoicing
MA1: the management considers the development of e-invoice to be important
MA2: the management is committed to the development of e-invoice MA3: the management considers that e-invoicing has a significant influence on the financial administration processes
The Data were investigated for outliers by using the histogram and the Boxplot. The
histogram showed to be the expected distribution. However, the Boxplot spotlighted a
few potential outliers with extreme values. In a closer look of data, most outliers
reflected the lower extremes of Likert-scale, but the responses could have been
reflected by the reality and to fall within the ordinary range of values (Hair et al. 2010,
65). Moreover, the 5% Trimmed value, which removes the top and bottom 5 per cent
and calculates a new mean value, showed that extremes values did not have a strong
impact on the mean (Pallant 2007, 59). Finally, the observed values do not emergently
differ from the expected normal values either in the Normal Q-Q Plots or the histogram
graphic. Therefore, the potential outliers were included for the factor analysis
understanding that the further logistic regression analysis might be disturbed by
extreme cases. However, these outlying cases can be detected by examining residuals
(Tabachnick and Fidell 2006, 433).
4.1.2. Factor Analysis
The suitability of data was analyzed in SPSS-program with the Kaiser-Olkin measure of
sampling adequacy (KMO), and Bartlett’s test of sphericity. The KMO measure of the
sample was 0.931, and Bartlett’s test of sphericity p=.000. The KMO index ranges from
0 to 1 and 0.6 is suggested as the minimum value for good factor analysis (Tabachnick
and Fidell 2006, 614). Bartlett’s test should be significant (p<.05). In consequence, the
63
data applies well to factor analysis, since there are excellent sample adequacy (0.931;
the items have 93.1% of their variance in common), and there are significant
correlations between the variables. Finally, correlations in residual matrix (the
difference between observed and reproduced correlation matrices) are small that also
indicates good base for a good factor analysis (Tabachnick and Fidell 2006, 609).
It is suggested that in good factor analysis there should be at least 300 cases. The
sample consists of 517 cases, which is considered to be a very good sample size for
factor analysis (Tabachnick and Fidell 2006, 613) and there are over 10 cases per item
(Pallant 2007). To summarize, the data fits well to factor analysis.
By setting Kaiser’s criterion to an eigenvalue of 1, 3 components were extracted
(constructs). The communalities of the 15 variables varied from 0.560 t0 0.905 which
indicates that the items have much in common with the factors (see Table 12, column
Extraction). In other words, all items exceeded the loading of the 0.5 which is
considered as a critical value for exclusion from the further analysis. However, in large
samples (N > 150) the smaller loadings might be also accepted (Hair et al. 2010, 116–
117), but now there was no need to reconsideration, since all variables were valid for
further analysis. In addition, Varimax rotation shows that there are 26 (28%) non-
redundant residual with absolute values greater than 0.05. Since the proposition is
clearly below 50%, the model fits the data well.
The research model created and reasoned in the method section (see section 3.4; Table
7) was based on five constructs: performance expectancy (PE), effort expectancy (EE),
social influence (SI), and facilitating conditions (FC) were adapted from the UTAUT
model, and the influence of management was generated from the ideas of innovation
diffusion theory and technology-organization-environment infrastructure and the
qualitative interviews. However, the results of factor analysis suggested that the items
loaded strongly on three factors (Table 15). This is consistent with the usual outcome of
factor analysis: as a rule of thumb, 15 variables should generate from 3 to 5 factors with
eigenvalues bigger than 1 (Tabachnick and Fidell 2006, 644). There was minor
indication about some cross-loadings (EE2 -> Factor2; FC2-> Factor 3; SI1-> Factor 1),
the loading values did not exceed the critical value of 0.5 (Hair et al 2010, 104), so the
factor results did not cause any further justifications.

64
All in all, the solution of three factors is able to explain a total of 71.7% of the variance.
This outcome is a promising result, since in social science research a solution that
accounts for 60% of the total variance is acceptable (Hair 2010 et al., 109).
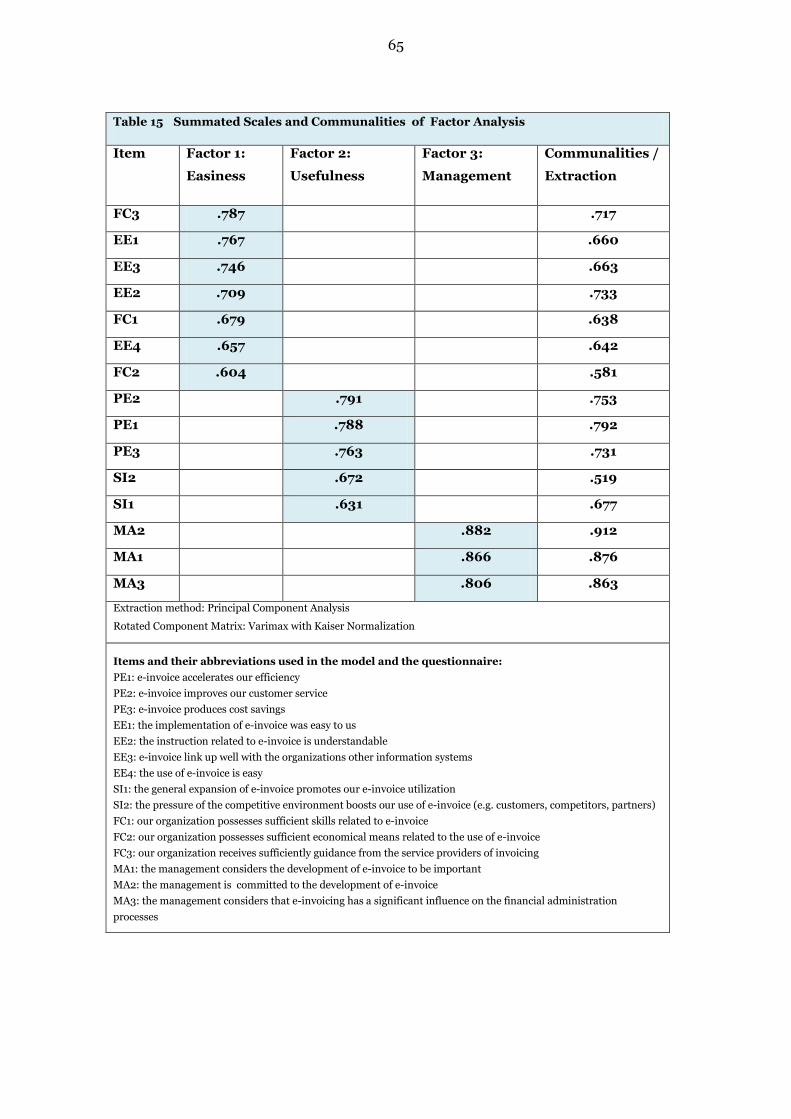
65
Table 15 Summated Scales and Communalities of Factor Analysis
Item Factor 1:
Easiness
Factor 2:
Usefulness
Factor 3:
Management
Communalities /
Extraction
FC3 .787 .717
EE1 .767 .660
EE3 .746 .663
EE2 .709 .733
FC1 .679 .638
EE4 .657 .642
FC2 .604 .581
PE2 .791 .753
PE1 .788 .792
PE3 .763 .731
SI2 .672 .519
SI1 .631 .677
MA2 .882 .912
MA1 .866 .876
MA3 .806 .863
Extraction method: Principal Component Analysis
Rotated Component Matrix: Varimax with Kaiser Normalization
Items and their abbreviations used in the model and the questionnaire:
PE1: e-invoice accelerates our efficiency
PE2: e-invoice improves our customer service
PE3: e-invoice produces cost savings
EE1: the implementation of e-invoice was easy to us
EE2: the instruction related to e-invoice is understandable
EE3: e-invoice link up well with the organizations other information systems
EE4: the use of e-invoice is easy
SI1: the general expansion of e-invoice promotes our e-invoice utilization
SI2: the pressure of the competitive environment boosts our use of e-invoice (e.g. customers, competitors, partners)
FC1: our organization possesses sufficient skills related to e-invoice
FC2: our organization possesses sufficient economical means related to the use of e-invoice
FC3: our organization receives sufficiently guidance from the service providers of invoicing
MA1: the management considers the development of e-invoice to be important
MA2: the management is committed to the development of e-invoice
MA3: the management considers that e-invoicing has a significant influence on the financial administration
processes
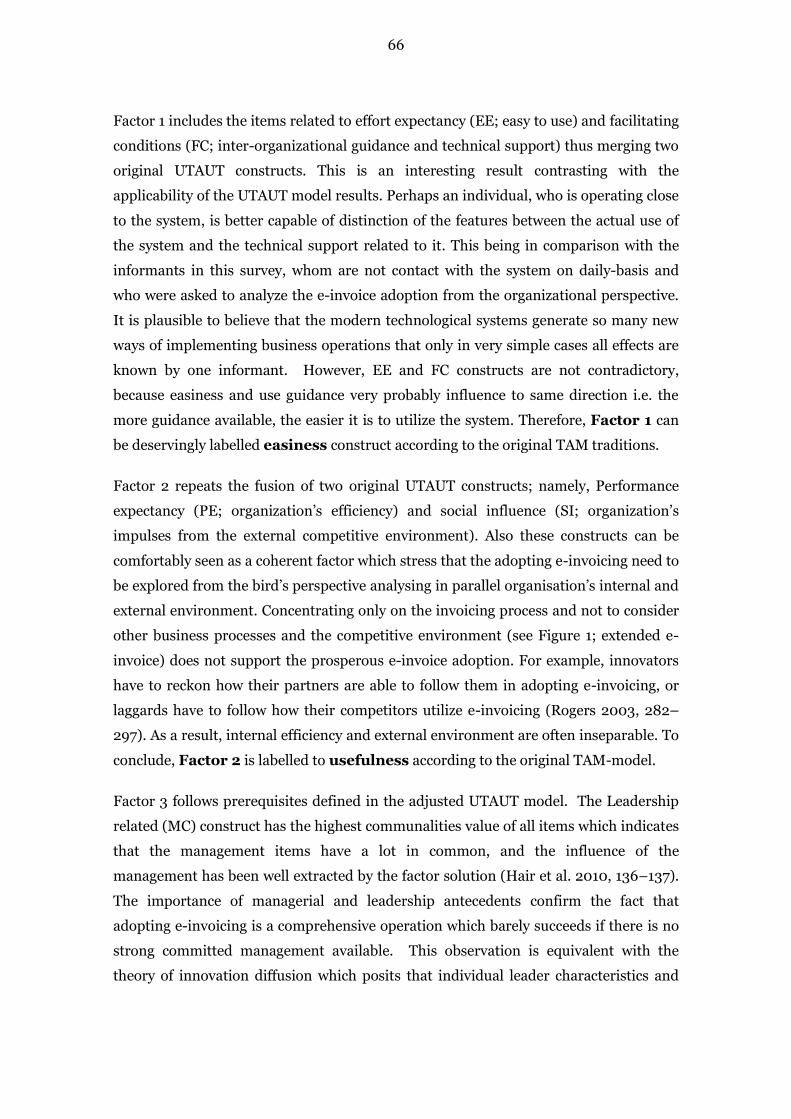
66
Factor 1 includes the items related to effort expectancy (EE; easy to use) and facilitating
conditions (FC; inter-organizational guidance and technical support) thus merging two
original UTAUT constructs. This is an interesting result contrasting with the
applicability of the UTAUT model results. Perhaps an individual, who is operating close
to the system, is better capable of distinction of the features between the actual use of
the system and the technical support related to it. This being in comparison with the
informants in this survey, whom are not contact with the system on daily-basis and
who were asked to analyze the e-invoice adoption from the organizational perspective.
It is plausible to believe that the modern technological systems generate so many new
ways of implementing business operations that only in very simple cases all effects are
known by one informant. However, EE and FC constructs are not contradictory,
because easiness and use guidance very probably influence to same direction i.e. the
more guidance available, the easier it is to utilize the system. Therefore, Factor 1 can
be deservingly labelled easiness construct according to the original TAM traditions.
Factor 2 repeats the fusion of two original UTAUT constructs; namely, Performance
expectancy (PE; organization’s efficiency) and social influence (SI; organization’s
impulses from the external competitive environment). Also these constructs can be
comfortably seen as a coherent factor which stress that the adopting e-invoicing need to
be explored from the bird’s perspective analysing in parallel organisation’s internal and
external environment. Concentrating only on the invoicing process and not to consider
other business processes and the competitive environment (see Figure 1; extended e-
invoice) does not support the prosperous e-invoice adoption. For example, innovators
have to reckon how their partners are able to follow them in adopting e-invoicing, or
laggards have to follow how their competitors utilize e-invoicing (Rogers 2003, 282–
297). As a result, internal efficiency and external environment are often inseparable. To
conclude, Factor 2 is labelled to usefulness according to the original TAM-model.
Factor 3 follows prerequisites defined in the adjusted UTAUT model. The Leadership
related (MC) construct has the highest communalities value of all items which indicates
that the management items have a lot in common, and the influence of the
management has been well extracted by the factor solution (Hair et al. 2010, 136–137).
The importance of managerial and leadership antecedents confirm the fact that
adopting e-invoicing is a comprehensive operation which barely succeeds if there is no
strong committed management available. This observation is equivalent with the
theory of innovation diffusion which posits that individual leader characteristics and
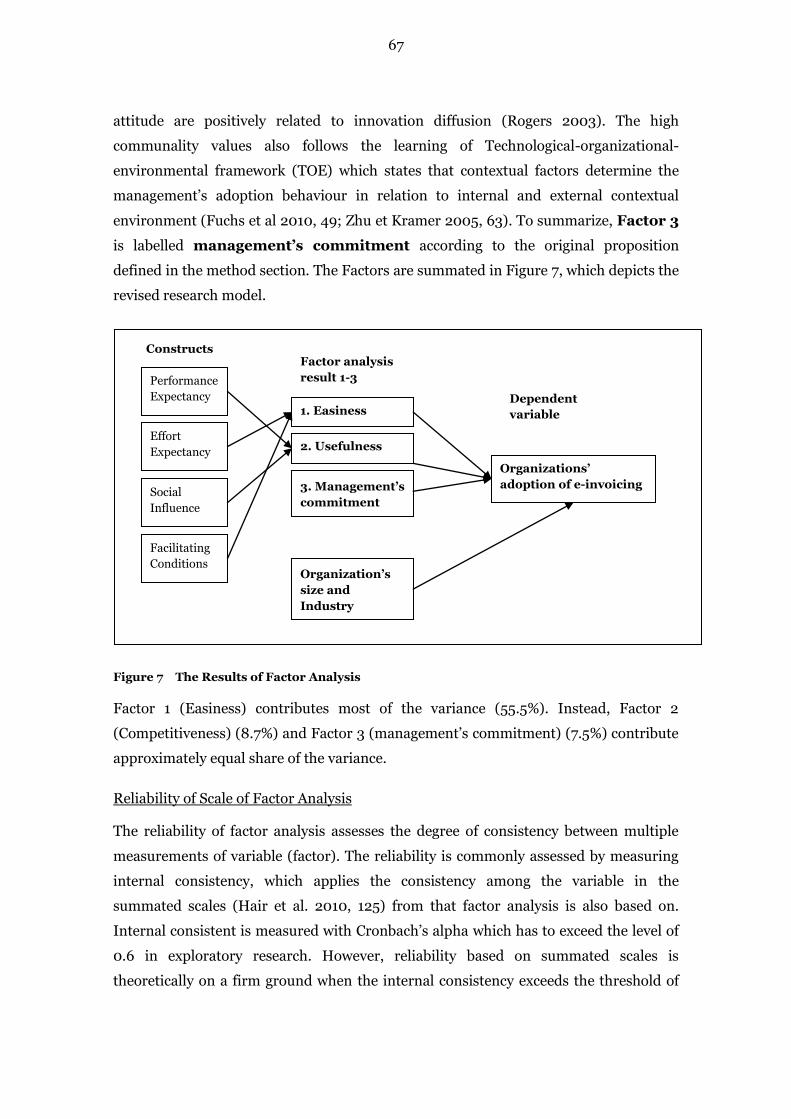
67
attitude are positively related to innovation diffusion (Rogers 2003). The high
communality values also follows the learning of Technological-organizational-
environmental framework (TOE) which states that contextual factors determine the
management’s adoption behaviour in relation to internal and external contextual
environment (Fuchs et al 2010, 49; Zhu et Kramer 2005, 63). To summarize, Factor 3
is labelled management’s commitment according to the original proposition
defined in the method section. The Factors are summated in Figure 7, which depicts the
revised research model.
Figure 7 The Results of Factor Analysis
Factor 1 (Easiness) contributes most of the variance (55.5%). Instead, Factor 2
(Competitiveness) (8.7%) and Factor 3 (management’s commitment) (7.5%) contribute
approximately equal share of the variance.
Reliability of Scale of Factor Analysis The reliability of factor analysis assesses the degree of consistency between multiple
measurements of variable (factor). The reliability is commonly assessed by measuring
internal consistency, which applies the consistency among the variable in the
summated scales (Hair et al. 2010, 125) from that factor analysis is also based on.
Internal consistent is measured with Cronbach’s alpha which has to exceed the level of
0.6 in exploratory research. However, reliability based on summated scales is
theoretically on a firm ground when the internal consistency exceeds the threshold of
Performance
Expectancy
Effort
Expectancy
Social
Influence
Facilitating
Conditions
Organizations’
adoption of e-invoicing 3. Management’s
commitment
Constructs
Dependent
variable
Organization’s
size and
Industry
1. Easiness
2. Usefulness
Factor analysis
result 1-3
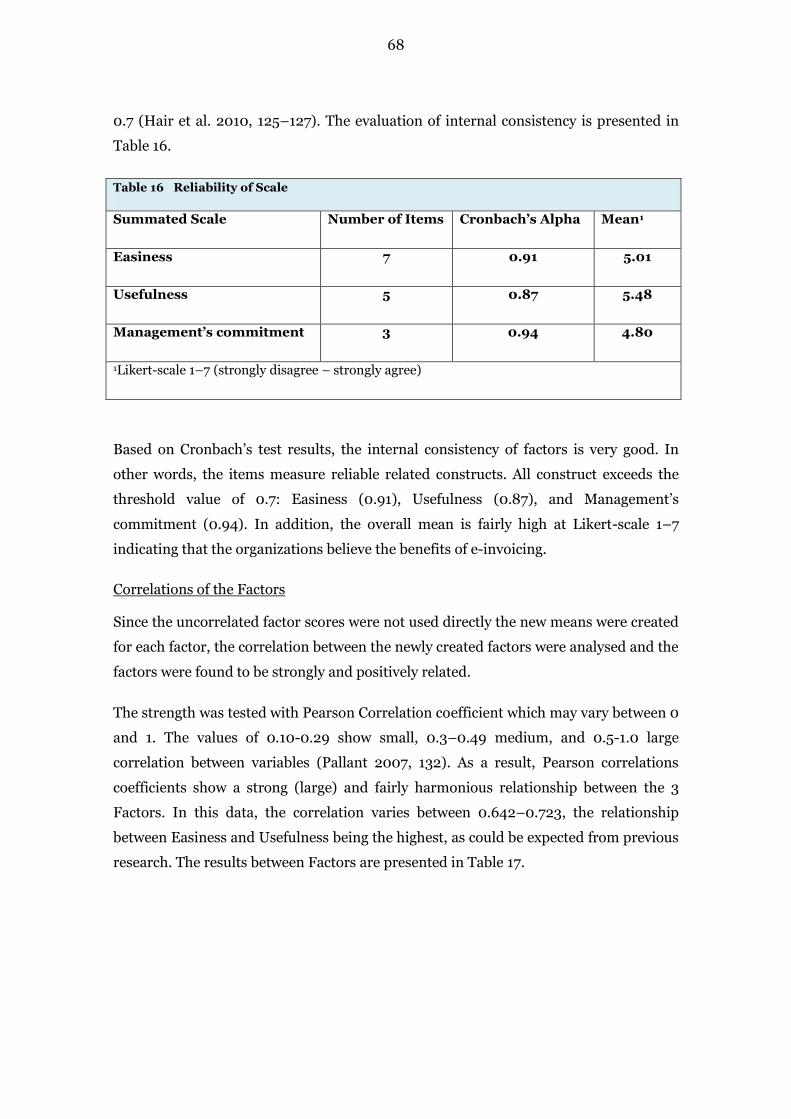
68
0.7 (Hair et al. 2010, 125–127). The evaluation of internal consistency is presented in
Table 16.
Table 16 Reliability of Scale
Summated Scale Number of Items Cronbach’s Alpha Mean1
Easiness 7 0.91 5.01
Usefulness 5 0.87 5.48
Management’s commitment 3 0.94 4.80
1Likert-scale 1–7 (strongly disagree – strongly agree)
Based on Cronbach’s test results, the internal consistency of factors is very good. In
other words, the items measure reliable related constructs. All construct exceeds the
threshold value of 0.7: Easiness (0.91), Usefulness (0.87), and Management’s
commitment (0.94). In addition, the overall mean is fairly high at Likert-scale 1–7
indicating that the organizations believe the benefits of e-invoicing.
Correlations of the Factors Since the uncorrelated factor scores were not used directly the new means were created
for each factor, the correlation between the newly created factors were analysed and the
factors were found to be strongly and positively related.
The strength was tested with Pearson Correlation coefficient which may vary between 0
and 1. The values of 0.10-0.29 show small, 0.3–0.49 medium, and 0.5-1.0 large
correlation between variables (Pallant 2007, 132). As a result, Pearson correlations
coefficients show a strong (large) and fairly harmonious relationship between the 3
Factors. In this data, the correlation varies between 0.642–0.723, the relationship
between Easiness and Usefulness being the highest, as could be expected from previous
research. The results between Factors are presented in Table 17.
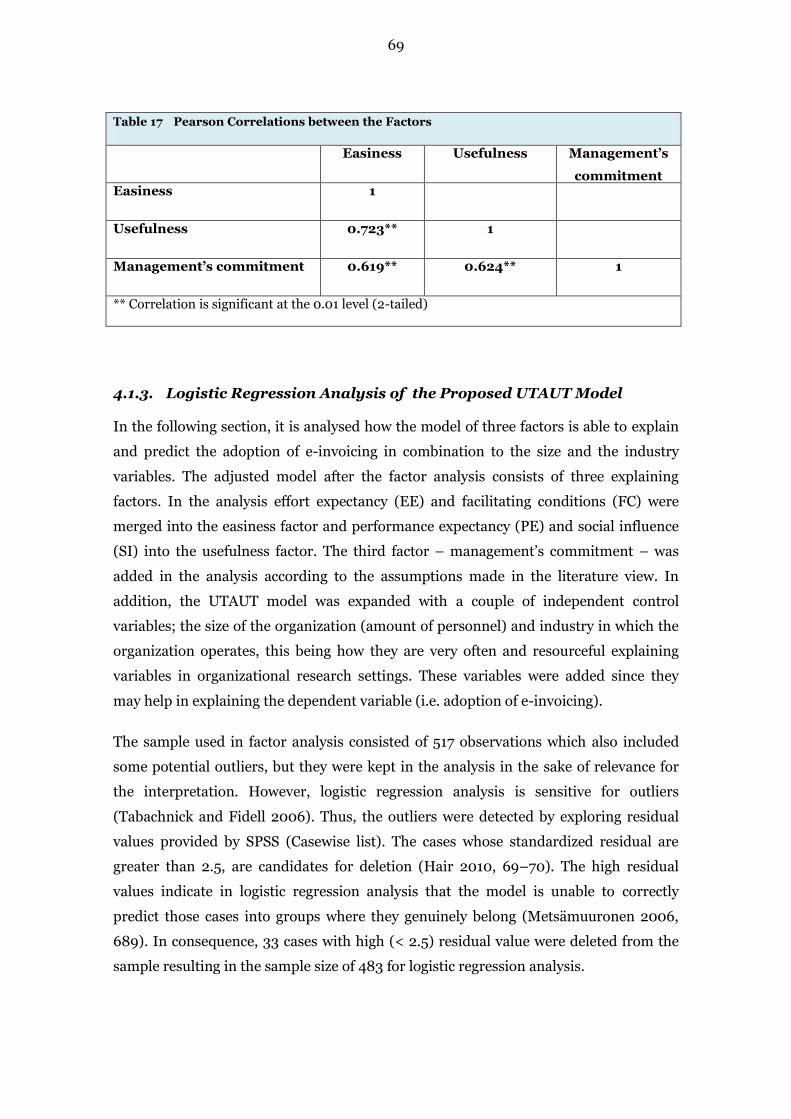
69
Table 17 Pearson Correlations between the Factors
Easiness Usefulness Management’s
commitment Easiness 1
Usefulness 0.723** 1
Management’s commitment 0.619** 0.624** 1
** Correlation is significant at the 0.01 level (2-tailed)
4.1.3. Logistic Regression Analysis of the Proposed UTAUT Model
In the following section, it is analysed how the model of three factors is able to explain
and predict the adoption of e-invoicing in combination to the size and the industry
variables. The adjusted model after the factor analysis consists of three explaining
factors. In the analysis effort expectancy (EE) and facilitating conditions (FC) were
merged into the easiness factor and performance expectancy (PE) and social influence
(SI) into the usefulness factor. The third factor – management’s commitment – was
added in the analysis according to the assumptions made in the literature view. In
addition, the UTAUT model was expanded with a couple of independent control
variables; the size of the organization (amount of personnel) and industry in which the
organization operates, this being how they are very often and resourceful explaining
variables in organizational research settings. These variables were added since they
may help in explaining the dependent variable (i.e. adoption of e-invoicing).
The sample used in factor analysis consisted of 517 observations which also included
some potential outliers, but they were kept in the analysis in the sake of relevance for
the interpretation. However, logistic regression analysis is sensitive for outliers
(Tabachnick and Fidell 2006). Thus, the outliers were detected by exploring residual
values provided by SPSS (Casewise list). The cases whose standardized residual are
greater than 2.5, are candidates for deletion (Hair 2010, 69–70). The high residual
values indicate in logistic regression analysis that the model is unable to correctly
predict those cases into groups where they genuinely belong (Metsämuuronen 2006,
689). In consequence, 33 cases with high (< 2.5) residual value were deleted from the
sample resulting in the sample size of 483 for logistic regression analysis.
70
Logistic regression analysis was performed by 3 continuous independent variables
(factors) verified in factor analysis. In addition, the categorical independent variables of
organization size and industry were added into model testing process coded as the
dummy variables with 4 categories in each (Size; micro 1–9 employees, small 10–49,
middle 50–249, big 250+; and Industry; services, trade, manufacturing, and
construction). As a reference category in terms of size was selected for big organisations
in terms of industry services. Thus, the model included all in all three continuous and
two dummy variables with 3 categories in each.
First, forced entry was applied. It is a logistic regression method in which all variables
are inserted simultaneously into the model (see Appendix 6). According to Wald test,
all industry related variables did not significantly contribute the predictive power of the
model since significance level exceeded clearly the critical level of 0.05 (Pallant 2007,
175). In the frame of reference of this study and the model created, the use of e-invoice
in organization cannot be explained and predicted in terms of organization’s industry
sector.
In the following phase in the industry related variables were excluded from the model
simultaneously (descending order method) due to very high p-values (ptrade = 0.46,
pmanufacturing = 0.71, pconstruction = 0.46) leaving into the model testing 3 factors and the size
variable with 3 size-categories resulting in 6 independent explaining variables for the
use of e-invoicing. Utilizing more than one method – in this case the forced entry
method and the descending order method – aids to find the best explaining model in
logistic regression analysis (Metsämuuronen 2006, 675–677).
The final model created with the remaining independent variables (easiness,
usefulness, management, sizemicro, sizesmall, and sizemiddle) were statistically significant
according to Hosmer and Lemeshow Test (chi-square = 221.85, df=6, p < 0.001)
indicating that the model is capable of distinguishing organizations that are either full
users or partly/non-users of e-invoice as presented in Table 18. The model explains
50.1% (Nagelkerke R squared) of the variance in e-invoice using in organizations (see
Appendix 7). Hence, the explaining power of the model could better that but it is
practically significant (Hair et al. 2010, 431). In addition, the model correctly classified
78.5% of cases (full users 82.3%, partly/non-users 72.3%) which is acceptable
classification accuracy (Hair et al. 2010, 431) in terms of both groups. Compared to the
model only with the constant (Block 0), 61.9% of cases was correctly classified, so the
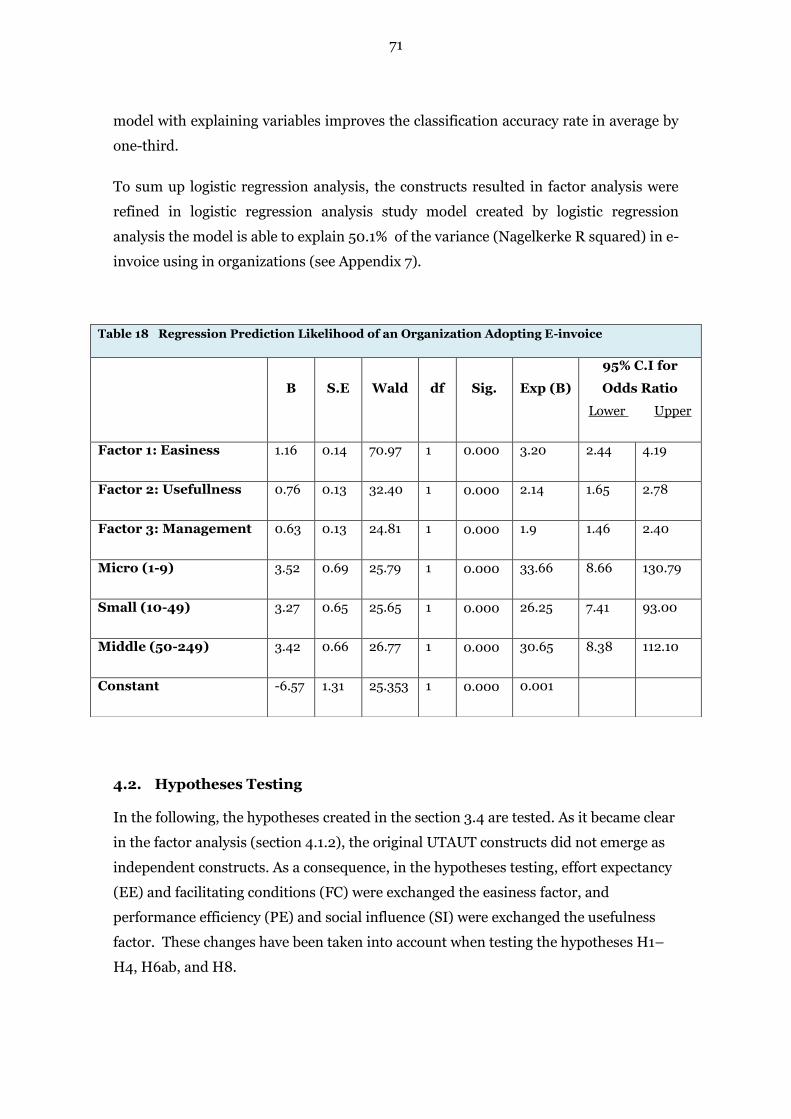
71
model with explaining variables improves the classification accuracy rate in average by
one-third.
To sum up logistic regression analysis, the constructs resulted in factor analysis were
refined in logistic regression analysis study model created by logistic regression
analysis the model is able to explain 50.1% of the variance (Nagelkerke R squared) in e-
invoice using in organizations (see Appendix 7).
4.2. Hypotheses Testing
In the following, the hypotheses created in the section 3.4 are tested. As it became clear
in the factor analysis (section 4.1.2), the original UTAUT constructs did not emerge as
independent constructs. As a consequence, in the hypotheses testing, effort expectancy
(EE) and facilitating conditions (FC) were exchanged the easiness factor, and
performance efficiency (PE) and social influence (SI) were exchanged the usefulness
factor. These changes have been taken into account when testing the hypotheses H1–
H4, H6ab, and H8.
Table 18 Regression Prediction Likelihood of an Organization Adopting E-invoice
B S.E Wald df Sig. Exp (B)
95% C.I for
Odds Ratio
Lower Upper
Factor 1: Easiness 1.16 0.14 70.97 1 0.000 3.20 2.44 4.19
Factor 2: Usefullness 0.76 0.13 32.40 1 0.000 2.14 1.65 2.78
Factor 3: Management 0.63 0.13 24.81 1 0.000 1.9 1.46 2.40
Micro (1-9) 3.52 0.69 25.79 1 0.000 33.66 8.66 130.79
Small (10-49) 3.27 0.65 25.65 1 0.000 26.25 7.41 93.00
Middle (50-249) 3.42 0.66 26.77 1 0.000 30.65 8.38 112.10
Constant -6.57 1.31 25.353 1 0.000 0.001
72
The Classical UTAUT Model Related Hypotheses (H1–H4)
H1: Effort expectancy (EE) is positively related to adoption of invoice
H2: Performance efficiency (PE) is positively related to adoption of e-invoice
H3: Social influence (SI) is positively related to adoption of invoice
H4: Facilitating conditions (FC) is positively related to adoption of invoice
The UTAUT approach is a general technology adoption theory (Venkatesh et. al. 2003,
447), and therefore it should be a valid frame of reference for e-invoice adoption
research. However, the factor analysis did not succeed in identifying the original
UTAUT-constructs as independent factors. Instead, effort expectancy (EE) and
facilitating conditions (FC) resulted in one summary independent factor, and as did
performance expectancy (PE) and social influence (SI) constructs. Interestingly, the
merged constructs are pretty much similar to the original TAM constructs usefulness
and easiness.
To conclude the evaluation of H1–H4, it can be stated that although the hypotheses
were not supported as such, the two new factors (easiness, usefulness) that were based
on the four original constructs did have a positive effect on e-invoice adoption. As
evidenced in Table 18, the easiness of using the technology had the strongest impact,
followed by the usefulness factor. Although the original hypotheses were rejected, the
factors did have the expected effect through the new summary factors.
Hypotheses Related to the Extension of the UTAUT Model
H5: Management’s commitment is a significant predictor related to e-invoice
adoption
The logistic regression analysis showed that the influence of management in adopting
e-invoice is a significant explaining variable. This corroborates the results of the
qualitative interviews and the arguments of the Innovation diffusion theory (Rogers
2003; Neufeld et al. 2007). As a result, this outcome, as presented in Table 18,
supports H5; organizations experiencing that e-invoicing improve their competitive
edge and the management is committed to e-invoice adoption, are more likely turn into
the users of e-invoicing.
H6: Usefulness (PE+SI) and Easiness (EE+FC) appreciation among big and small
organizations
73
Factor analysis provided three independent constructs measuring the adoption and use
of e-invoice. Therefore the hypotheses testing with the original PE and EE constructs
was not possible, because SI and FC were merged into PE and EE factors (more in
detail in section 4.2.1). However, the new merged constructs, usefulness and easiness,
are interpreted here to present the core content of PE and EE.
The original hypotheses H6a and H6b on size were as follows:
H6a: Big organizations values more PE than small organizations
H6b: Small organizations values more EE than big organizations
Due to newly formed factors, the original hypotheses had to be rejected. Instead the
following new hypotheses were formulated.
The revised H6a: Big organizations value more usefulness than small organizations
Next, an independent samples t-tests was conducted in order to compare usefulness
(former PE) and easiness (former EE) constructs among big (N = 105) and small (N =
378) organization.
The revised usefulness (PE+SI) factor was tested instead of PE. There was a significant
difference in relation to usefulness in scores for big (M = 6.05, SD = 1.13) and small (M
= 5.35, SD = 1.30) organizations; t (188) = -5.40, p = 0.00 (two-tailed). The detailed
values of t-test are presented in Appendix 8). As a result, H6a is supported; big
organization values usefulness more than small organizations, although the mean in
both groups are rather high at a Likert-scale 1–7.
The revised H6b: Small organizations values more easiness than big organizations
The revised usefulness (EE+FC) factor was tested instead of EE. There was a significant
difference in relation to easiness in scores for big (M = 5.60, SD = 1.20) and small (M =
4.87, SD = 1.31) organizations; t (176) = -5.64, p = 0.00 (two-tailed). The detailed
values of t-test are presented in Appendix 8. Surprisingly, big organizations consider
that the e-invoice is easier to use than small organizations, thus rejecting H6b. The
outcome did not change even though small and middle-sized organizations were
excluded from the analysis, and it was compared with only micro (1–9 employees)
organization with big organizations.
74
The effect of an organization size can be evaluated by utilizing logistic regression
analysis. In logistic regression analysis big organizations (employees > 250) were
selected to the reference group which showed that bigger organizations are more
positive toward e-invoice adoption than smaller organization.
The size related predictors result in approximately equal Wald values and the odds
ratios: Sizemicro: Wald = 25.79, (Exp(B))=33.67, Sizemiddle: Wald = 26.77, (Exp(B)) =
30.65, and Sizesmall: Wald = 25.65, (Exp(B))= 26.25. This result show that size in
general is plausible predictor in terms of the adopting of e-invoice; bigger organization
adopt e-invoice in all forms more likely than small ones. In average, the organizations
smaller than 250, employees are 30 times more likely than big organizations not to
adopt e-invoice into full use, controlling for other independent variables (easiness,
usefulness, management, sizebig) in the model.
H7: The industry of an organization is a significant discriminator related to the
adoption of invoicing
The industry related variables were not found to be significant variables in explaining
the adoption of e-invoicing according to the logistic regression analysis as it can be seen
in Appendix 6. That is, the industry variable had no effect on the dependent variable,
i.e. the adoption of e-invoicing.
The original H8 hypothesis was as follows:
H8: PE is the most predictive factor in explaining adoption of e-invoice in relation to
the other factors
Due to newly formed factors, the original hypothesis had to be rejected. Instead the
following new hypothesis was formulated.
The revised H8: Usefulness is the most predictive factor in explaining adoption of e-
invoice in relation to the other factors
Ranking the predictive power of different independent variables in logistic regression is
to some extent a controversial issue. Often utilized measures in ranking are, for
instance, standardized coefficients (B), p-values of Wald chi-square statistics (Sig.),
adequacy (interpreting -2*log likelyhood for each independent variable individually),
and the Wald value (Thompson 2009). In this study, the Wald value was selected to the
ranking measure suggested by Pallant (Pallant 2007, 178).
75
According to the Wald value, the predictive power the most influential predictor among
the independent variables was factor 1 (easiness) recording the Wald value 70.97 and
the odd ratio 3.20. The result contradicts with the most previous studies under the
TAM and UTAUT models (e.g. Davis 1989, Venkatesh and Davis 2000) in which
usefulness (TAM) or performance expectancy (UTAUT) have been the most important
factors. The other factors resulted in approximately comparable relative importance
with each other: factor 2 (usefulness; 32.40 and 2.14) and factor 3 (management; 24.81
and 1.90). In conclusion, H8 cannot be confirmed under this study.
Hypotheses Related to the Finnish Direct Debit (FDD) Scheme (H9–H10)
The organizations were asked which option or options they prefer in order to replace
the existing Finnish direct debit payments (question 5 in Appendix 3). The informants
were allowed to tick more than one option.
H9: Organizations’ main option is e-invoice in order to replacement the FDD (Finnish
direct debit) scheme
As it is shown in Figure 8, the majority of the informants, 70%, flagged for adopting e-
invoice confirming H9. The SEPA Direct Debit, different cards payment applications
and e-payment in e-shop got also some support, but clearly at a lesser extent than e-
invoice option. In the sample there were two organizations that did not know about that
the Finnish Direct Debit payment scheme expires in January 2014 (Question 4 in
Appendix 5).
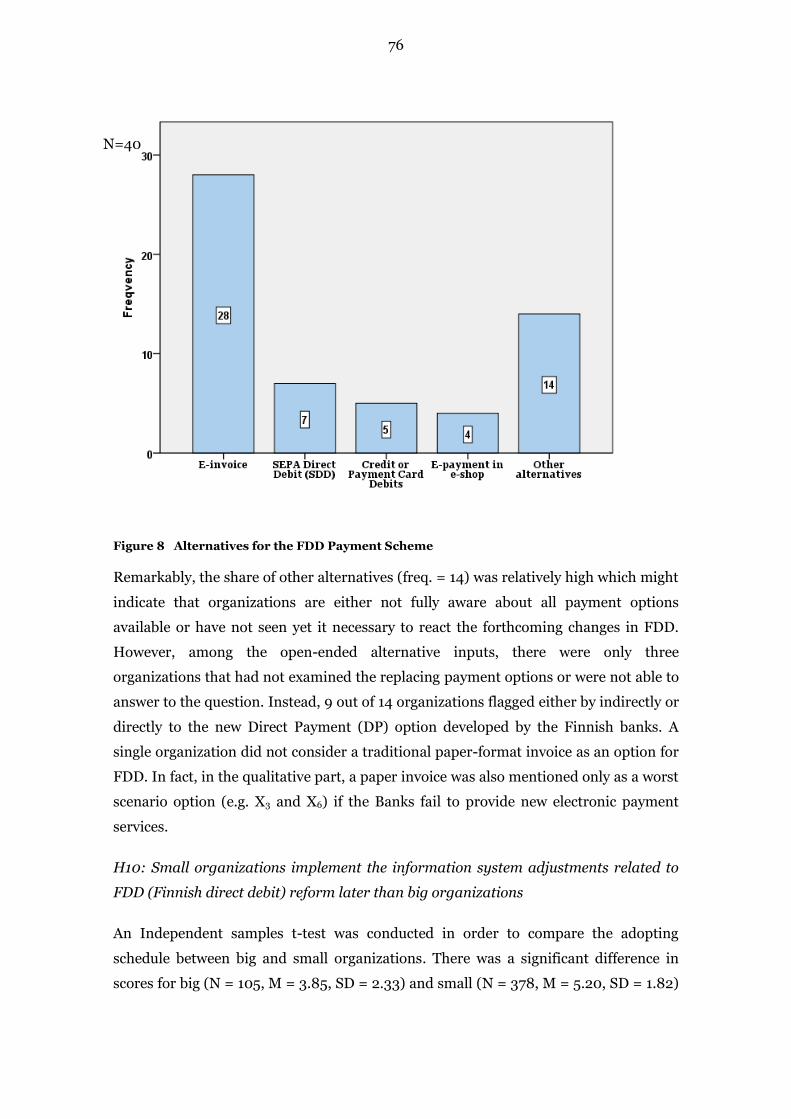
76
Figure 8 Alternatives for the FDD Payment Scheme
Remarkably, the share of other alternatives (freq. = 14) was relatively high which might
indicate that organizations are either not fully aware about all payment options
available or have not seen yet it necessary to react the forthcoming changes in FDD.
However, among the open-ended alternative inputs, there were only three
organizations that had not examined the replacing payment options or were not able to
answer to the question. Instead, 9 out of 14 organizations flagged either by indirectly or
directly to the new Direct Payment (DP) option developed by the Finnish banks. A
single organization did not consider a traditional paper-format invoice as an option for
FDD. In fact, in the qualitative part, a paper invoice was also mentioned only as a worst
scenario option (e.g. X3 and X6) if the Banks fail to provide new electronic payment
services.
H10: Small organizations implement the information system adjustments related to
FDD (Finnish direct debit) reform later than big organizations
An Independent samples t-test was conducted in order to compare the adopting
schedule between big and small organizations. There was a significant difference in
scores for big (N = 105, M = 3.85, SD = 2.33) and small (N = 378, M = 5.20, SD = 1.82)
N=40
77
organizations; t (38) = -2.10, p = 0.04 (two-tailed). The detailed values of t-test are
presented in Appendix 9. Big organizations can be preferably labelled according to
Roger’s innovation adoption typology to innovator or early adopters as small
organization more likely are early majority or late adopters. This result was adjacent
with the results of the qualitative interviews (see Table 7 in section 3.3.2). In
conclusion, the big organizations implement the necessary software reforms earlier
compared to the small organizations thus confirming H10.
4.3. The Summary of Hypotheses Testing
The study succeeded in supporting 3 original hypotheses out of 10; namely, H5, H9,
and H10. The H1–H4 and H6a were confirmed in their revised form. The hypotheses
H6b, H7, H8 were rejected. The results of the hypotheses testing are summarized in
Table 19.
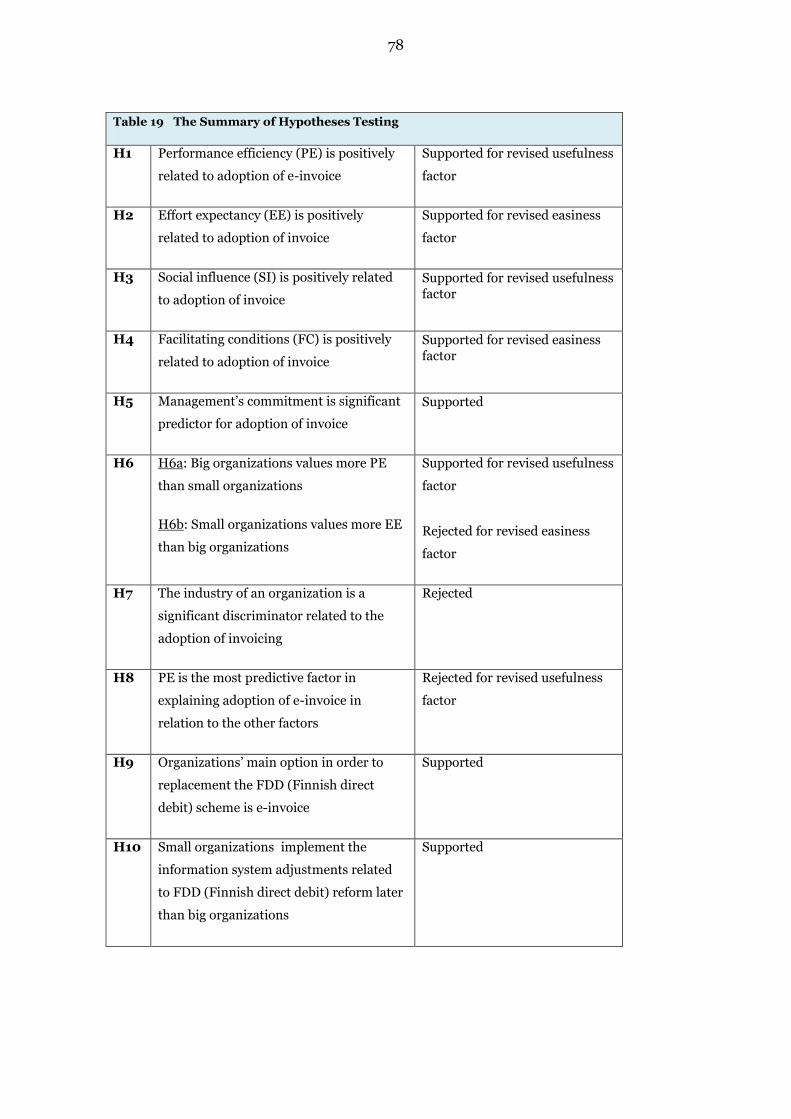
78
Table 19 The Summary of Hypotheses Testing
H1 Performance efficiency (PE) is positively
related to adoption of e-invoice
Supported for revised usefulness
factor
H2 Effort expectancy (EE) is positively
related to adoption of invoice
Supported for revised easiness
factor
H3 Social influence (SI) is positively related
to adoption of invoice
Supported for revised usefulness factor
H4 Facilitating conditions (FC) is positively
related to adoption of invoice
Supported for revised easiness factor
H5 Management’s commitment is significant
predictor for adoption of invoice
Supported
H6 H6a: Big organizations values more PE
than small organizations
H6b: Small organizations values more EE
than big organizations
Supported for revised usefulness
factor
Rejected for revised easiness
factor
H7 The industry of an organization is a
significant discriminator related to the
adoption of invoicing
Rejected
H8 PE is the most predictive factor in
explaining adoption of e-invoice in
relation to the other factors
Rejected for revised usefulness
factor
H9 Organizations’ main option in order to
replacement the FDD (Finnish direct
debit) scheme is e-invoice
Supported
H10 Small organizations implement the
information system adjustments related
to FDD (Finnish direct debit) reform later
than big organizations
Supported
79
5 DISCUSSION
In this chapter, the most important findings related to organizations’ e-invoice
adoption are reflected upon, the theoretical contribution is discussed, and the
managerial implications are suggested. Moreover, some further research is proposed
and the study limitations deliberated.
5.1. Constructs Affecting to E-invoice Adoption
The main aim of this study was to identify which factors influence organizations’
adoption of e-invoicing.
The most important independent variable in explaining and predicting organizations’
e-invoice adoption was the easiness construct (i.e. easy to use) that has been previously
identified by the TAM research. The other explaining variables with approximately
equal predictive power were usefulness (i.e. efficiency), management’s commitment
(MA) stemming from the Innovation diffusion theory and the Technological-
organizational-environment (TOE) framework, and as a moderating variable the size of
the organization. Finally, the industry variable proved to be non-significant in
explaining the use of e-invoicing.
First, the easiness construct measures how easy it is to adopt and to use e-invoicing,
and how well e-invoicing is linked up with an organization’s information systems.
Contrasting to the previous UTAUT research, the easiness construct found in this study
also gathers also the items of the facilitating condition (FC) construct. Therefore, the
easiness construct measures that does the organization possesses sufficient skills and
financial recourses, and does the organization receive guidance from service providers
in relation to e-invoice adoption.
Second, the usefulness construct measures how an organization accelerates efficiency,
improves the quality of customer service, and generates cost savings by adopting e-
invoicing. These are the core items presented both in the TAM (i.e. usefulness) and
UTAUT models (i.e. performance expectancy). However, the usefulness construct in
this study also contradicts with the previous UTAUT studies, because the items of the
social influence (SI) were merged into it. SI takes account how the competitive
environment has adopted an innovation, in this case e-invoicing.
80
It was not expected to find that the easiness construct contributes over the half of
variance (see section 4.2.2 Factor analysis). In the previous TAM and UTAUT studies,
the usefulness (TAM) or performance expectancy constructs (UTAUT, PE) have been
the most dominant independent factors (e.g. Venkatesh et al. 2003). It is also
interesting that the original UTAUT constructs (EE+FC = easiness and PE+SI =
usefulness) were merged in this study. This indicates that in complex adoption
environments it is difficult to differentiate, for instance, the use and guidance or
internal efficiency from external competitive environment, because they are so
intertwined, and therefore experienced in a continuous dialog with each other.
Third, the influence of management was strong construct throughout the qualitative
and quantitative analysis. The Innovation diffusion theory posits that leadership and
internal characteristics are important antecedents of technology adoption. In summary,
management’s commitment is a significant construct in explaining and predicting the
adoption of e-invoicing supporting the findings of the Innovation diffusion theory
(IDT) (e.g. Rogers 2003; Neufeld et al. 2007).
Fourth, the size variable as an independent variable was also an important explaining
variable. It might be that the organizational slack (Rogers 2003, Table 2 in section
2.4.1), the degree to which uncommitted resources are available to the organization
stated by Innovation diffusion theory (IDT), is needed for effective adoption especially
in multilayered environments. As a rule of thumb, small organizations are less capable
of releasing extra resources needed for technology adoption than are bigger
organizations referring also to the results of the qualitative interviews.
Finally, the industry variable (i.e. a branch in which an organization operates) did not
appear to have a significant impact on e-invoice adoption in the proposed UTAUT
model. It is interesting that industry is such a weak predictor in relation to e-invoice
adoption. It may be simply so that different industry sectors are deeply dependent on
each other, and it directs invoicing and other forms of payment evenly across all
industries through intertwined value-chains. Moreover, in this study I classified
organizations into only 4 categories; services, trade, manufacturing, and construction.
It is possible that using a wider classification could have resulted in at least some
industries which might be significant predictors in e-invoice adoption.
81
5.2. Theoretical Implications
5.2.1. Model for E-invoice Adoption Research
Compared to the rate of explaining a total variance in the technology acceptance
models, my proposed UTAUT model positions itself between the TAM and UTAUT
regular results with the explaining variance of 50.1% (Nagelkerke R squared, see
Appendix 7). The most of TAM studies are able to explain approximately 40% of a
variance, and the UTAUT studies about 70% (Davis et al 1989; Venkatesh et Davis
2000; Venkatesh et al. 2003, 426).
The explaining power of the proposed UTAUT model has to be considered in
comparison with past research. The explaining accuracy of the model based on the
UTAUT model, the Innovation diffusion theory (IDT), the Technological-
organizational-environmental (TOE) framework, and the qualitative interviews is
practically significant (Hair et al. 2010, 431). To summarize, the model created and
tested in this study is a reliable tool for e-invoice adoption and similar innovation
adoption studies which are focused on complex and multilayered environments. These
environments can be defined to be close to Type 2 (requires usually reforming
enterprise-wide information systems and influences many business processes) or even
Type 3 (adoption is embedded in a company’s business strategy and competitive
advantage) according to Zhu and Kramer (2005).
5.2.2. Applicability of the Proposed UTAUT Model
Factor analysis based on my adjusted UTAUT model validated only three constructs:
easiness (EE+FC), usefulness (PE+SI), and management’s commitment (MA) leading
to overriding the constructs of social influence (SI) and facilitating conditions (FC).
This outcome is a surprise, since UTAUT and its extended modifications have been
widely tested in simpler and more complex organizational environments with success.
Hence, it has to be analysed why the UTAUT model does not function as expected in e-
invoice adoption environment.
Firstly, it may be that the measures did not fully correspond to the original measures
due to the modification from an individual level to an organizational level. From an
individual point of view, the previous items used are rather unambiguous and easy to
answer. The same measures modified into an organizational level might have generated
82
some lost of accuracy (see 3.4, Table 9). This change of perspective may be too
ambitious in order to sustain all 4 constructs as the independent factors. It is inevitable
that the change from the individual perspective to the organizational level forces an
informant to generalize subject-matters: this might also reinforce the tendency to
simplify the reality which favours a fewer construct development. My findings may
indicate that – when collecting data from one informant per an organization – the
UTAUT model is not able to discriminate the different constructs well from each other
especially in complex technological innovation and multi-layered environments as e-
invoice is in its full use (see Figure 1, section 1.1). To sum up, in order to be able to
detect all four UTAUT constructs especially in complex innovation adoption
environment, it would be worth collecting data from more than one informant per
organization preferably also conducting longitudinal research.
Lastly, in complex organizational technology adoption environments, such as Type 2
and Type 3 innovations (Zhu and Kraemer 2005), the TAM origin constructs usefulness
and easy to use (e.g. Venkatesh and Davis 2000) might be more robust explaining
constructs than the more complex UTAUT constructs. However, limiting the
independent constructs into the two constructs need not to denote that some issues or
theoretical findings of TAM/UTAUT, IDT, and TOE affecting the adoption of
technology are excluded from the research. In opposite, by developing the items
measuring the constructs enable to collect data that needed for the analysis. To
summarize, it may be that a simple model is better representation of reality. This
requires some further research.
5.3. Managerial Implications
The results of this study calls for proposing some recommendations for e-invoice
marketers and management.
Firstly, due to the fact that easiness is the most important explaining variable regarding
the full e-invoice adoption, marketers should highlight the easiness qualities over, for
instance, cost-efficiency factors along the e-invoice adoption process. Thus, marketers
should provide a strong message and brand promise how these obstacles can be solved
efficiently and confidently. Although e-invoice adoption is in its full potential a fairly
complicated and multilayered process, it is not definitely insuperable operation for
organizations that really are committed to its implementation. This commitment could
be boosted when organizations feel confident that problems arising during the adoption
83
can be comfortably solved and service providers are ready to provide enough support
and consulting for e-invoice users. Therefore, marketing messages have to be based on
reality and service providers have to be able to provide supportive and consultative
services. In fact, fulfilling the marketing promises should not be impossible: it is not
far-fetched to assume that assistance and support needed in adopting organizations are
not so different, since e-invoice technical solutions are pretty standard. To summarize,
marketing determinately the significance of easiness and services related easiness
would be beneficial according to the findings of this study. Actually, in terms of scales,
one point of improvement (Likert-scale 1–7) in the easiness factor indicates that an
organization is 3 times more likely to become a full user of e-invoicing. Of course,
marketers cannot put aside the other influencing constructs (usefulness, management’s
commitment), but by stressing more easiness in relation to the other variables would
efficiently promote e-invoice adoption.
Secondly, the positive effects of improving e-invoice efficiency are likely to take place
when an organization’s financial administration is integrated to the other relevant
information systems, such as a customer management system (CRM) and e-
procurement. This close relation among the information systems requires careful, time-
consuming and often complex preparations inside and outside of an organization
before e-invoicing can reach its full potential. Therefore, it is fundamental that the
management’s involvement is not limited only to the decision to adopt e-invoice, but to
the actual implementation process in order to ensure and facilitate that the cooperation
over the all business functions and with external partners succeeds. To summarize,
without the management’s commitment a full potential e-invoice adoption is
challenging, and it is hardly possible to exploit all advantages of e-invoicing if it is left a
headache to financial administration.
The findings of the qualitative study suggest that new services which include innovative
features (i.e. e-invoice and new direct payment), drive organization away from their
normal convenience area. When an organization gets puzzled about the uniformity of
service offerings, it complicates the adoption process or even hinders the planning
totally. Therefore, it is essential for service providers and marketers to find a common
agreement on how the innovation is communicated to the target group. This agreement
could contain, for instance, deciding the terminology used, deadlines for when the core
services are available to customers, and how the coordination between the service
providers is organized from the point of view of customers.
84
One could argue that innovations which do not directly target to an organization’s core
competences are very hard to implement, when there is no external pressure to adopt
innovations, although the benefits would be self-evident. In fact, invoicing and financial
administration are rarely seen as other than supportive business functions. In other
words, although e-invoicing has been technically available at least a decade by now, in
order to succeed e-invoicing needs a strong external environmental pressure or
motivation before the benefits are fully realized in organizations. From a marketer’s
point of view, this could mean the following recommendable approach: the more an
innovation is targeted to a supportive business function, the more external motives and
consequences have to be stressed in marketing.
5.4. Finnish Direct Debit Payment Scheme (FDD)
The majority of organizations using the FDD plan to move or attempt to direct their
customers primarily to users of e-invoicing (70%), and supplementary to users of the
new direct payment (DP) services. Nearly all organizations were well aware that the
FDD reform is approaching and it needs some actions to be implemented. The size of
an organization follows rather closely Roger’s adoption type categorization and the S-
shaped curve (Rogers 2003, 282–297). The bigger the organization, the more
innovative it is in adopting new payment options.
Roger discusses innovation diffusion as a process in which (1) an innovation is (2)
communicated through certain channels (3) over time (4) among the members of a
social system (Rogers 2003, 11–12). The interviewees strongly pointed out that the
quality and the amount of communication provided by the innovation service providers
is fundamental how well an organization succeeds in the adoption process. When a
service is available, the technical requirements need to communicated, as well as, what
kind of support will be available in the implementation phase. If this phase fails, in this
case the FDD, an adopter organization not only fails to start internal adoption, but also
fails to communicate and prepare their customers and external environment for the
change. In the UTAUT model, facilitating conditions (FC) measures this
communication element (Venkatesh 2003). In the current study, this factor was
merged into the easiness factor of adopting the innovation. In conclusion, this calls for
some UTAUT model justification in order to get more precise information on
communication between users and service providers.
85
The qualitative interviews categorized the FDD reform as belonging to category of the
category Type 2 innovations as it was indicated in the literature section. The
innovation Type 2 usually requires reforming enterprise-wide information systems
(Zhu and Kraemer 2005, 63–64). This finding should encourage organizations to invest
enough time, resources and expertise from different business functions to the
implementation process. Otherwise there is a big danger that new payment technology
touches only part of organizations operations such as financial administration and the
benefits achieved remain limited.
The FDD reform and related software updates and modification are illustrative
examples of an innovation whose success is dependent both on the organization’s
internal adoption capability and the external environment. All interviewed
organizations were spending a lot of effort on considering how all their customers could
be motivated to use the new payment options. This is a clear signal that in technology
adoption research external circumstances are important factors even in smaller
technology adoption projects. The influence of external factors have been recognized by
developing TAM to UTAUT (Venkatesh 2003; Wells et. al 2010, 814) and utilizing IDT
and TOE, but there is room for further development of the research model.
Interestingly, the European wide SEPA reform seems to be a powerful external trigger
for boosting e-invoicing. Although e-invoicing should have been boosting about a
decade for now, it has not succeeded to take over the dominant mode of payment yet: a
traditional paper format invoice is still the most common invoicing mode today – the
amount of whole invoicing, e-invoicing covers about 5–10%. By and large, even the
mature innovation or technology seems to need a strong external impetus, in this case
e-invoicing, in order to flourish.
5.5. Limitations and Further Research
This study has both strengths and possible weaknesses that affect the results. The
strength is the use of multiple methods. The qualitative interviews provided insight into
the factors that might affect e-invoice adoption. Based on these results, two surveys
were conducted, one small and one large survey. The main survey included a large
sample of organizations of different size and organizations. These are clear strengths of
the study. Nevertheless, all studies have limitations as well.
86
First, it is a rather common procedure that organization’s opinions about a wide variety
of business interests are collected through one informant representing the whole
organization. The illustrative examples of these kinds of surveys are, for instance, how
an organization sees the future investment possibilities or is an organization going to
recruit more employees in the forthcoming months. However, it is in doubt that one
informant per organization – whether s/he is a CEO or a head of certain business area
– is credibly to express an organization’s genuine opinion or de facto course of action.
Especially in cases in which the organization is large or the study-subject is
multilayered.
Second, the data collection was conducted by a cross-sectional method. Besides
including more informants per an organization into a research design, the longitudinal
data collection could better expose also the SI and FC constructs. After all, the core
constructs evolve over time depending on whether it a decision about technology
adoption or the implementation of innovation.
Finally, the exploratory factor analysis was utilized in this study due to many new
elements (management’s commitment, modification from the individual level to the
organizational level) brought into the UTAUT model. As a result, the created extended
UTAUT model deserved its value; thus, the model is ready for the confirmatory factor
analysis (CFA) which is widely capitalized in deductive studies, but which requires
highly advanced statistical knowledge, capabilities, and software programs. Comparing
the results could bring novel insight to e-invoice adoption in organizations. By further
developing the independent explaining variables, using the dependent variables
according to the actual intensity (volume) of e-invoicing, and solving how the data can
be collected through all relevant business functions in an organization more accurately
would result in more robust outcomes in the forthcoming studies
5.6. Concluding Remarks
I will present some final remarks regarding the research process and evaluate how well
the aims of the study were achieved.
First, applying both qualitative and quantitative research methods generated some
additional degree of difficulty. It was a challenge to find a logical thesis structure, that
is, to decide in which order all parts and results (interviews vs. quantitative findings)
should be reported and presented. As a result, I believe that I succeeded to create the
87
structure that logically tells a coherent story from the introduction to the literature view
and from the method to the discussion part.
Second, though I knew the study topic rather well, I encountered some difficulties at
the beginning of the study process on how to formulate the research problem.
Afterwards it is possible to say that studying e-invoice adoption and the Finnish direct
debit payment (FDD) scheme in the same frame of reference was not perhaps an ideal
decision. However, in the end, e-invoicing and FDD were good sparring partners to
each other: together they make it possible to get into deeper to organizations’ way of
encountering multi-layered adoption challenge.
Third, the extended UTAUT model created by merging the ideas of UTAUT, the
Innovation diffusion theory (IDT) and the Technology-organization-environment
(TOE) framework seem to be a promising approach for an organizational technology
adoption research. Of course, my model is not complete, but it succeeded to provide the
answers to the study aims. In consequence, this study results in four independent
variables that explain and predict organizations’ adoption of e-invoicing: easiness (easy
to use), usefulness (efficiency), management’s commitment (MA), and the size of an
organization. The qualitative interviews helped to conclude that the adoption of
network-aligned electronic services, such as e-invoicing, is strongly related to both
including strong intra-organizational bonds and the external competitive environment.
This is also an important observation that should be strongly utilized in forthcoming
organizational technology adoption studies such as e-invoicing, e-procurement and
even customer relationship management.
Finally, I hope that my research encourages other students and researchers to
understand organizational technology adoption a bit better, promotes companies to
adopt e-invoicing, and helps service providers of e-invoicing to develop their offering
and marketing more suitable for companies and other users of e-invoicing.
88
REFERENCES
Azadegan, Arash and Teich, Jeffrey (2010). Effective benchmarking of innovation adoptions: a theoretical framework for e-procurement technologies. Benchmarking: An International Journal, Vol. 17, No 4, pp. 472-490.
Bass, Frank M. (1969). A New Product Growth Model for Consumer Durables. Management Science, Vol. 13, No. 5, pp. 215–227.
Brown, Susan A.,Dennis, Alan R. and Venkatesh, Viswanath (2010). Predicting Collaboration Technology Use: Integrating Technology Adoption and collaboration Research. Journal of Management Information Systems, Vol. 27, No. 2, pp. 9–53.
Caluwaets, Philippe (2010). Towards a European electronic invoicing framework: Why businesses, service providers and consumers should switch to e-invoicing. Journal of Payments Strategy & Systems, Vol. 4, No. 3.
Carter, Lemuria, Shaupp, Ludwig Christian, Hobbs, Jeffrey and Campbell, Ronald (2011). The role of security and trust in the adoption of online tax filing. Transforming government: People, Process and Policy, Vol. 5, No. 4.
Chiu, Yen-Ting Helena, Fang, Shih-Chieh and Tseng, Chuan-Chuan (2010). Early versus potential adopters: Exploring the antecedents of use intentions in the context of retail service innovations. International Journal of Retail and Distribution Management, Vol. 38 No. 6, pp. 443–459.
The European Payments Council (EPC). Internet. www.europeanpaymentscouncil.eu.
Davis, Fred (1989). Perceived Usefulness, Perceived Easy to Use, and User Acceptance of Information Technology. MIS Quarterly September 1989.
Davis, Fred D. (1989). User Acceptance of Computer Technology: a Comparison of Two Theoretical Models. Management Science Vol. 35, No. 8, August 1989.
Eikebrokk, Tom R., Iden, John, Olsen, Dag H. and Opdahl, Andreas l. (2011). Understanding the determinants of business process modelling in organisations. Business Process Management Journal, Vol. 17 No. 4, pp. 639–662.
Federation of Finnish Financial Services. The presentation of CEO Piia-Noora Kauppi 22.9.2011. Retrieved Jan 10, 2012, from http://www.fkl.fi/tiedotteet/Liitteet/Tiedotustilaisuus_Kauppi_22092011.pdf
Fillion, Gérard, Braham, Hassen and Ekinoea, Jean-Pierre Booto (2010). Testing UTAUT on the Use of ERP Systems By middle managers and End-Users of Medium To Large-sized Canadian Enterprises. Proceedings of the Academy of Information and Management Sciences, vol. 14, No. 2. Las Vegas 2010.
89
Final Report of the Expert Group on e-Invoicing (2009). European Commission. DG Internal Market and Services, DG Enterprise and Industry.
Fichman, Robert G. (2001). The Role of Aggregation in the Measurement of IT-Related Organizational Innovation. MIS Quarterly Vol. 25 no. 4, pp. 427–455.
Fuchs, Matthias, Höpken, Wolfram, Föger, Andreas and Kunz, Martin (2010). E-Business readiness, Intensity, and Impact: An Austrian Destination Management Organization Study. Journal of Travel Research 49(2) 165–178.
Goosse, Etienne (2012). SEPA Migration: Facts and Figures. The state-of-play in January. The European Payments Council (EPC).
Gowrisankaran, Gautan and Stavins, Joanna (2004). Network externalities and technology adoption: lessons from electronic payments. RAND Journal of Economics, Vol. 35, No.2, Summer 2004, pp. 260–276.
Gummesson, Evert (2000). Qualitative Methods in Management Research. Second edition. Sage Publications ltd.
Hair, Joseph F., Black, William C., Babin, Barry J. and Anderson, Rolph E. (2010). Multivariate Data Analysis (7th Edition). Pearson.
Helsinki Region Chamber of Commerce (2010). Pk-yritysten tietotekniikan ja sähköisen liiketoiminnan tarpeet.
Juntumaa, Miira (2011). Putting consumers’ IT adoption in context: failed link between attitudes and behaviour. Aalto University publications series. Doctoral Dissertions 14/2011.
Korkman, Oskar, Storbacka, Kaj and Bo, Harald (2010). Practices as markets: Value co-creation in e-invoicing. Australian Marketing Journal, Vol. 18, pp. 236–247.
Kurki, Markku, Lahtinen, Markku and Lindfors, Hannele (2011). Verkkolasku käyttöön! Helsingin Kamari Oy.
Lamminen, Katariina (2011). Finanssipalvelujen käyttö pk-sektorilla. Tampereen teknillinen yliopisto.
Lin, Hsiu and Lin, Szu-Mei (2008). Determinants of e-business diffusion: A test of the technology diffusion perspective. Technovation, Vol. 28, pp. 135–145.
Lippert, Susan K and Davis, Miles (2006). A conceptual model integrating trust into planned change activities to enhance technology adoption behaviour. Journal of Information Science, 32 (5) 2006, pp. 434–448.
90
Metsämuuronen, Jari (2006). Tutkimuksen tekemisen perusteet ihmistieteissä. International Methelp ky.
Meuter, Matthew Lane (1999). Consumer Adoption of Innovative Self-Service Technologies: a Multi-Method Investigation. A Dissertion Presented in Partial Fullfillment of the Requirements for the Degree Doctor of Philosophy. Arizona State University.
Neufeld, Derrick J., Dong, Linying and Higgins, Chris (2007). Charismatic leadership and user acceptance of information technology. European Journal of Information Systems, Vol. 16, pp. 494–510.
Niles, Robert (2006). Sample Size: How Many Survey Participants Do I Need? Retrieved August 31, 2012 from http://www.robertniles.com/stats/
Oliveira, Tiago and Martins, Maria Fraga (2011). Literature Review of information Technology Adoprion Models at Firm Level. The Electronic Journal Information Systems Evaluation, Vol. 14, No. 1, pp. 110–121.
Ozdemir S., Trott P. and Hoecht A. (2008). Segmenting internet banking adopter and non-adopters in the Turkish retail banking sector. International Journal of Bank, Vol. 26 No. 4.
Pallant, Julie (2007). SPPS Survival Manual (3rd Edition). Open University Press.
The Pan-European Automated Clearing House of EBA CLEARING. Press release 31 Jan, 2012.
PC Magazine/Online-Encyclopaedia. Retrieved May 8, 2012 from http://www.pcmag.com/encyclopedia_term/0,1237,t=EDI&i=42367,00.asp
Penttinen, E. (Ed.) (2008). Electronic Invoicing Initiatives in Finland and in the European Union – Taking the Steps towards the Real-Time Economy. Helsinki School of Economics series B-95.
Rampersad, Giselle, Plewa, Carolin and Troshani, Indrid (2012). Investigating the use of information technology in managing innovation: A case study from a university technology transfer office. Journal of Engineer and Technology Management, Vol. 29, pp. 3–21.
Realisation of the Single Euro Payments Area in Finland (2010): SEPA implementation and Migration Plan in Finland. Version 4. Federation of Finnish Financial Services.
Rogers, Everett M (2003). Diffusion of Innovations. 5th Edition. Free Press.
Saunders, Mark, Lewis, Philip and Thornhill, Adrian (2007). Research Methods for Business Students. Fourth Edition. Pearson Education Limited.
91
SEPA Survey (2011). How do you pay? How would you like to pay? The European Central Bank (ECB) and the European Commission.
Silverman, David (2008). Interpreting Qualitative Data. Methods for Analyzing Talk, Text and Interaction. Third Edition. Sage Publications Ltd.
Sopanen, Henna (2011). Interview 25 Jan, 2012. Nordea.
Statistic Finland (2010). Retrieved May 1, 2012 from http://www.stat.fi/tup/suoluk/suoluk_kansantalous_en.html
Statistic Finland (2012). Retrieved May 6, 2012 from http://www.stat.fi/meta/kas/verkkolasku_en.html
Swanson, Burton E. (1994). Information Systems Innovation Among Organizations. Management Science, Vol. 40, No. 9, pp. 1069-1092.
Tabachnick, Barbara G. and Fidell, Linda S. (2007). Using Multivariate Statistics. Sixth Edition. Pearson.
Thompson, Doug (2009). Ranking Predictors in Logistic Regression. MidWest SAS® Users Group (MWSUG) 2009 Conference Proceeding, October 2009, Ohio.
Turban, E., King, D. and Lee, J. (2010): Electronic Commerce. A managerial perspective. 6th Edition. Pearson Prentice Hall.
Venkatesh, Viswanath and Davis, Fred D. (2000). A Theoretical Extension of the Technology Acceptance Model: Four Longitudinal Field Studies. Management Science, Vol. 46, No. 2, pp. 186–204.
Venkatesh, Viswanath, Morris, Michael G., Davis, Gordon B. and Davis, Fred D. (2003). User Acceptance of Information Technology toward a unified View. MIS Quarterly Vol. No. 3 (Sep., 2003), pp. 425–478.
Venkatesh, Viswanath (2006). Where to go from Here? Thoughts on Future Directions for Research on Individual-Level Technology Adoption with a Focus on Decision Making. Decision Sciences, Vol. 37, No. 4., pp. 497–518.
Venkatesh, Viswanath, Thong, James Y. and Xu, Xin (2012). Consumer Acceptance and Use of Information Technology: Extending the Unified Theory of acceptance and Use of technology. MIS Quarterly, Vol. 36, No. 1, pp. 157–178.
Wang, Chih-Hsing, Liu, Wen-Liang, Tseng, Meng-Chun and Tsai, Hung-Sung (2010). A Study of Taiwanese College Teachers' Acceptance of Distance Learning.
92
International Journal of Organizational Innovation (Online), vol. 3, no. 2 (Fall 2010), p. 243.
Wu, Kewen, Zhao, Yuxiang, Zhu, Qinghua, Tan, Xiaojie and Zheng, Hua (2011). A meta-analyses of the trust on technology acceptance model: Investigation of moderating influence of the subject and context type. International Journal of Information Management 31 (2011) 572–581.
Wu, Chenhui (2004). A readiness model for adopting Web services. Journal of Enterprise Information management, Vol. 17, No 5, pp. 361–371.
Wells, John, Campbell, Damon, Valacich, Joseph and Featherman, Mauricio (2010). The Effect of Perceived Novelty on the Adoption of Information Technology Innovations : A Risk/Reward Perspective. Decision Science, Vol. 41, No. 4, November, pp. 813–843.
Yi, Mun Y.,Jackson, Joyce D., Park, Jae S. and Probst, Janice C. (2006). Understanding information technology acceptance by individual professionals: Towards an integrative view. Information & Management, Vol. 42, pp. 350–363.
Zhu, Kevin and Kraemer, Kenneth L. (2005). Post-adoption Variations in Usage and Value of E-Business by Organizations: Cross-Country Evidence from the Retail Industry. Information Systems Research Vol. 16, No. 1, March, pp. 61–84.
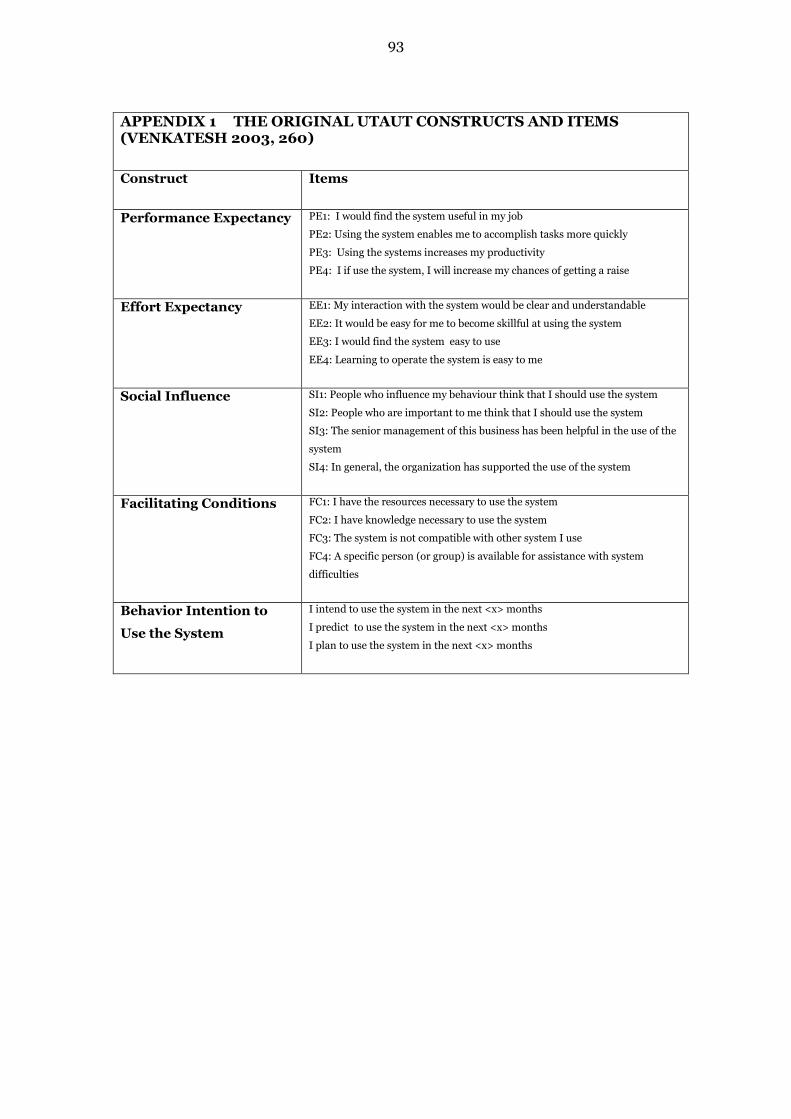
93
APPENDIX 1 THE ORIGINAL UTAUT CONSTRUCTS AND ITEMS (VENKATESH 2003, 260)
Construct Items
Performance Expectancy PE1: I would find the system useful in my job
PE2: Using the system enables me to accomplish tasks more quickly
PE3: Using the systems increases my productivity
PE4: I if use the system, I will increase my chances of getting a raise
Effort Expectancy EE1: My interaction with the system would be clear and understandable
EE2: It would be easy for me to become skillful at using the system
EE3: I would find the system easy to use
EE4: Learning to operate the system is easy to me
Social Influence SI1: People who influence my behaviour think that I should use the system
SI2: People who are important to me think that I should use the system
SI3: The senior management of this business has been helpful in the use of the
system
SI4: In general, the organization has supported the use of the system
Facilitating Conditions FC1: I have the resources necessary to use the system
FC2: I have knowledge necessary to use the system
FC3: The system is not compatible with other system I use
FC4: A specific person (or group) is available for assistance with system
difficulties
Behavior Intention to
Use the System
I intend to use the system in the next <x> months
I predict to use the system in the next <x> months
I plan to use the system in the next <x> months
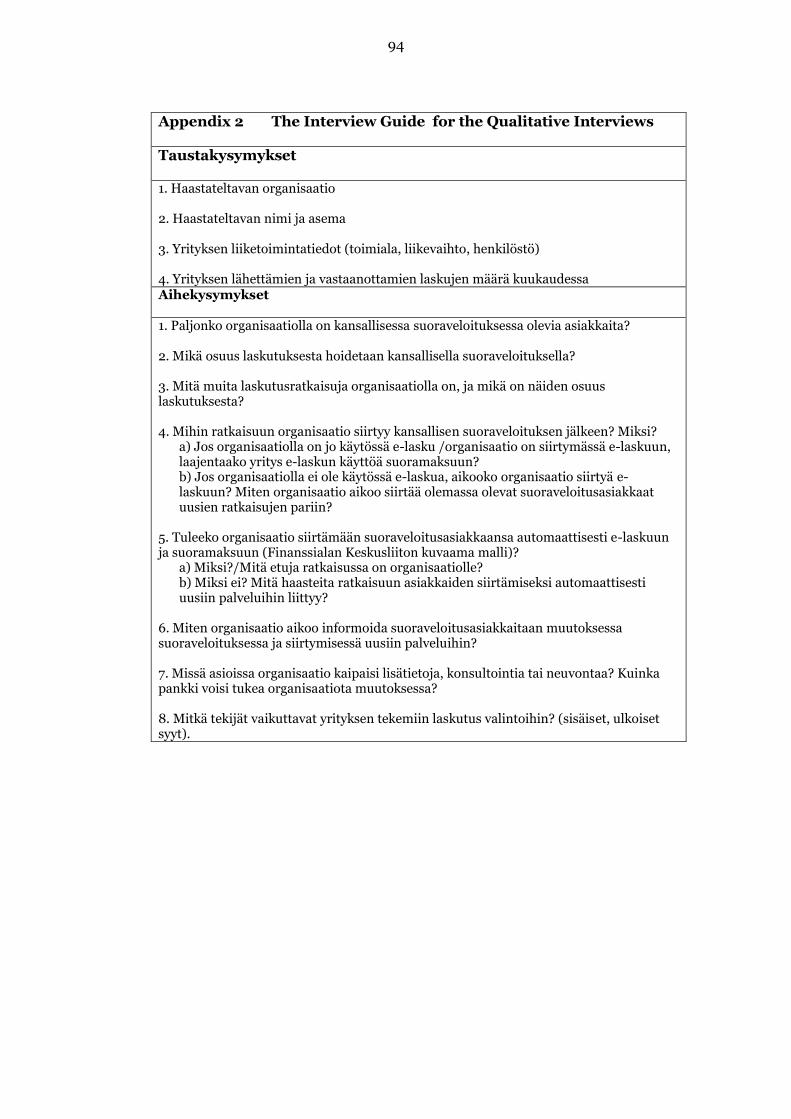
94
Appendix 2 The Interview Guide for the Qualitative Interviews Taustakysymykset 1. Haastateltavan organisaatio 2. Haastateltavan nimi ja asema 3. Yrityksen liiketoimintatiedot (toimiala, liikevaihto, henkilöstö) 4. Yrityksen lähettämien ja vastaanottamien laskujen määrä kuukaudessa Aihekysymykset 1. Paljonko organisaatiolla on kansallisessa suoraveloituksessa olevia asiakkaita? 2. Mikä osuus laskutuksesta hoidetaan kansallisella suoraveloituksella? 3. Mitä muita laskutusratkaisuja organisaatiolla on, ja mikä on näiden osuus laskutuksesta? 4. Mihin ratkaisuun organisaatio siirtyy kansallisen suoraveloituksen jälkeen? Miksi?
a) Jos organisaatiolla on jo käytössä e-lasku /organisaatio on siirtymässä e-laskuun, laajentaako yritys e-laskun käyttöä suoramaksuun? b) Jos organisaatiolla ei ole käytössä e-laskua, aikooko organisaatio siirtyä e-laskuun? Miten organisaatio aikoo siirtää olemassa olevat suoraveloitusasiakkaat uusien ratkaisujen pariin?
5. Tuleeko organisaatio siirtämään suoraveloitusasiakkaansa automaattisesti e-laskuun ja suoramaksuun (Finanssialan Keskusliiton kuvaama malli)?
a) Miksi?/Mitä etuja ratkaisussa on organisaatiolle? b) Miksi ei? Mitä haasteita ratkaisuun asiakkaiden siirtämiseksi automaattisesti uusiin palveluihin liittyy?
6. Miten organisaatio aikoo informoida suoraveloitusasiakkaitaan muutoksessa suoraveloituksessa ja siirtymisessä uusiin palveluihin? 7. Missä asioissa organisaatio kaipaisi lisätietoja, konsultointia tai neuvontaa? Kuinka pankki voisi tukea organisaatiota muutoksessa? 8. Mitkä tekijät vaikuttavat yrityksen tekemiin laskutus valintoihin? (sisäiset, ulkoiset syyt).
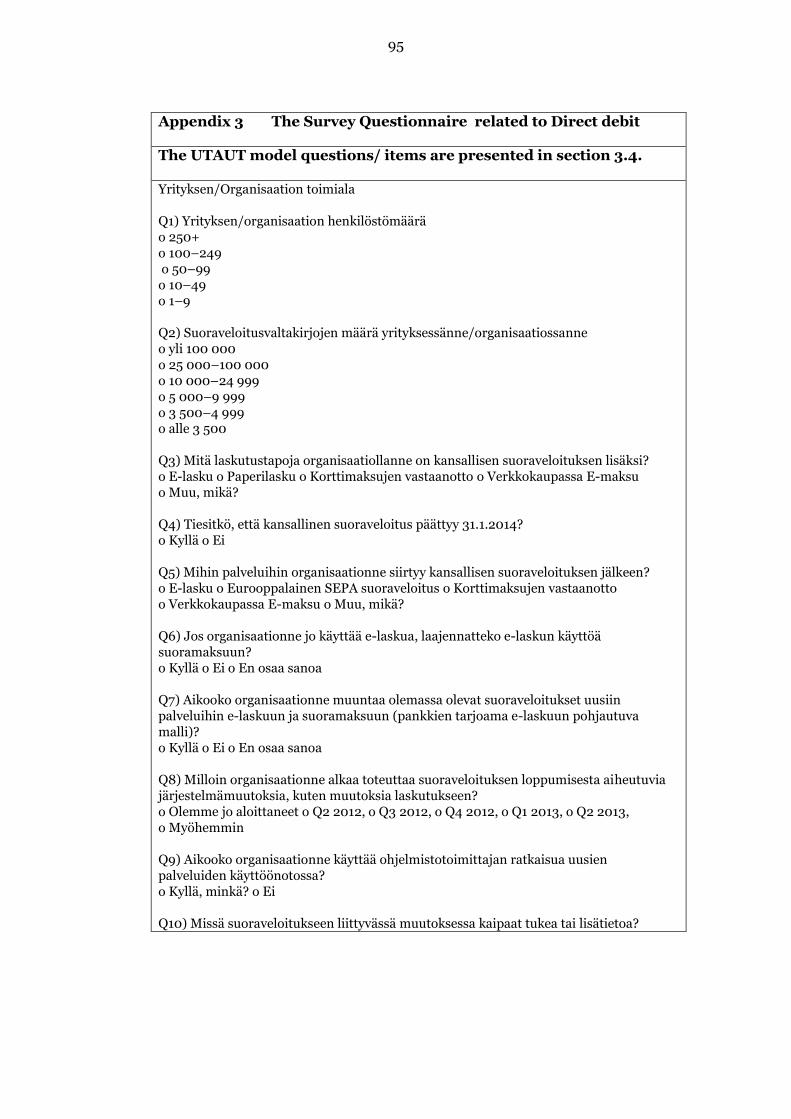
95
Appendix 3 The Survey Questionnaire related to Direct debit The UTAUT model questions/ items are presented in section 3.4. Yrityksen/Organisaation toimiala Q1) Yrityksen/organisaation henkilöstömäärä o 250+ o 100–249 o 50–99 o 10–49 o 1–9 Q2) Suoraveloitusvaltakirjojen määrä yrityksessänne/organisaatiossanne o yli 100 000 o 25 000–100 000 o 10 000–24 999 o 5 000–9 999 o 3 500–4 999 o alle 3 500 Q3) Mitä laskutustapoja organisaatiollanne on kansallisen suoraveloituksen lisäksi? o E-lasku o Paperilasku o Korttimaksujen vastaanotto o Verkkokaupassa E-maksu o Muu, mikä? Q4) Tiesitkö, että kansallinen suoraveloitus päättyy 31.1.2014? o Kyllä o Ei Q5) Mihin palveluihin organisaationne siirtyy kansallisen suoraveloituksen jälkeen? o E-lasku o Eurooppalainen SEPA suoraveloitus o Korttimaksujen vastaanotto o Verkkokaupassa E-maksu o Muu, mikä? Q6) Jos organisaationne jo käyttää e-laskua, laajennatteko e-laskun käyttöä suoramaksuun? o Kyllä o Ei o En osaa sanoa Q7) Aikooko organisaationne muuntaa olemassa olevat suoraveloitukset uusiin palveluihin e-laskuun ja suoramaksuun (pankkien tarjoama e-laskuun pohjautuva malli)? o Kyllä o Ei o En osaa sanoa Q8) Milloin organisaationne alkaa toteuttaa suoraveloituksen loppumisesta aiheutuvia järjestelmämuutoksia, kuten muutoksia laskutukseen? o Olemme jo aloittaneet o Q2 2012, o Q3 2012, o Q4 2012, o Q1 2013, o Q2 2013, o Myöhemmin Q9) Aikooko organisaationne käyttää ohjelmistotoimittajan ratkaisua uusien palveluiden käyttöönotossa? o Kyllä, minkä? o Ei Q10) Missä suoraveloitukseen liittyvässä muutoksessa kaipaat tukea tai lisätietoa?
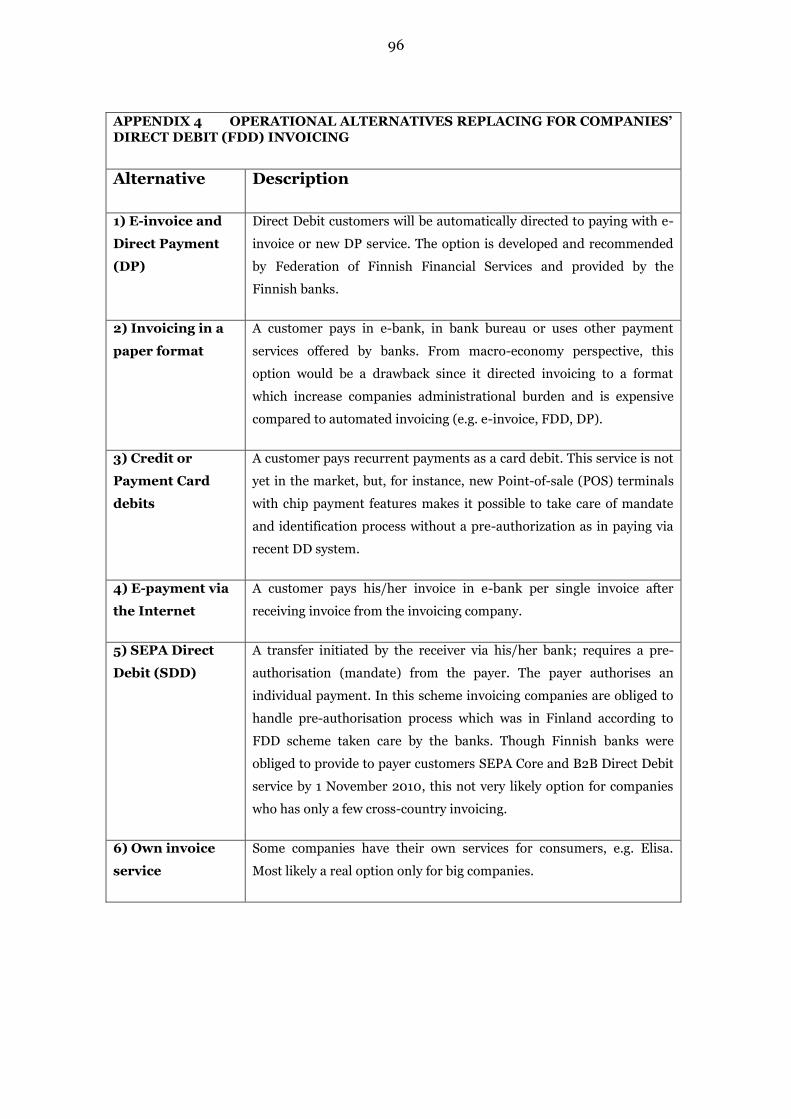
96
APPENDIX 4 OPERATIONAL ALTERNATIVES REPLACING FOR COMPANIES’ DIRECT DEBIT (FDD) INVOICING
Alternative Description
1) E-invoice and
Direct Payment
(DP)
Direct Debit customers will be automatically directed to paying with e-
invoice or new DP service. The option is developed and recommended
by Federation of Finnish Financial Services and provided by the
Finnish banks.
2) Invoicing in a
paper format
A customer pays in e-bank, in bank bureau or uses other payment
services offered by banks. From macro-economy perspective, this
option would be a drawback since it directed invoicing to a format
which increase companies administrational burden and is expensive
compared to automated invoicing (e.g. e-invoice, FDD, DP).
3) Credit or
Payment Card
debits
A customer pays recurrent payments as a card debit. This service is not
yet in the market, but, for instance, new Point-of-sale (POS) terminals
with chip payment features makes it possible to take care of mandate
and identification process without a pre-authorization as in paying via
recent DD system.
4) E-payment via
the Internet
A customer pays his/her invoice in e-bank per single invoice after
receiving invoice from the invoicing company.
5) SEPA Direct
Debit (SDD)
A transfer initiated by the receiver via his/her bank; requires a pre-
authorisation (mandate) from the payer. The payer authorises an
individual payment. In this scheme invoicing companies are obliged to
handle pre-authorisation process which was in Finland according to
FDD scheme taken care by the banks. Though Finnish banks were
obliged to provide to payer customers SEPA Core and B2B Direct Debit
service by 1 November 2010, this not very likely option for companies
who has only a few cross-country invoicing.
6) Own invoice
service
Some companies have their own services for consumers, e.g. Elisa.
Most likely a real option only for big companies.
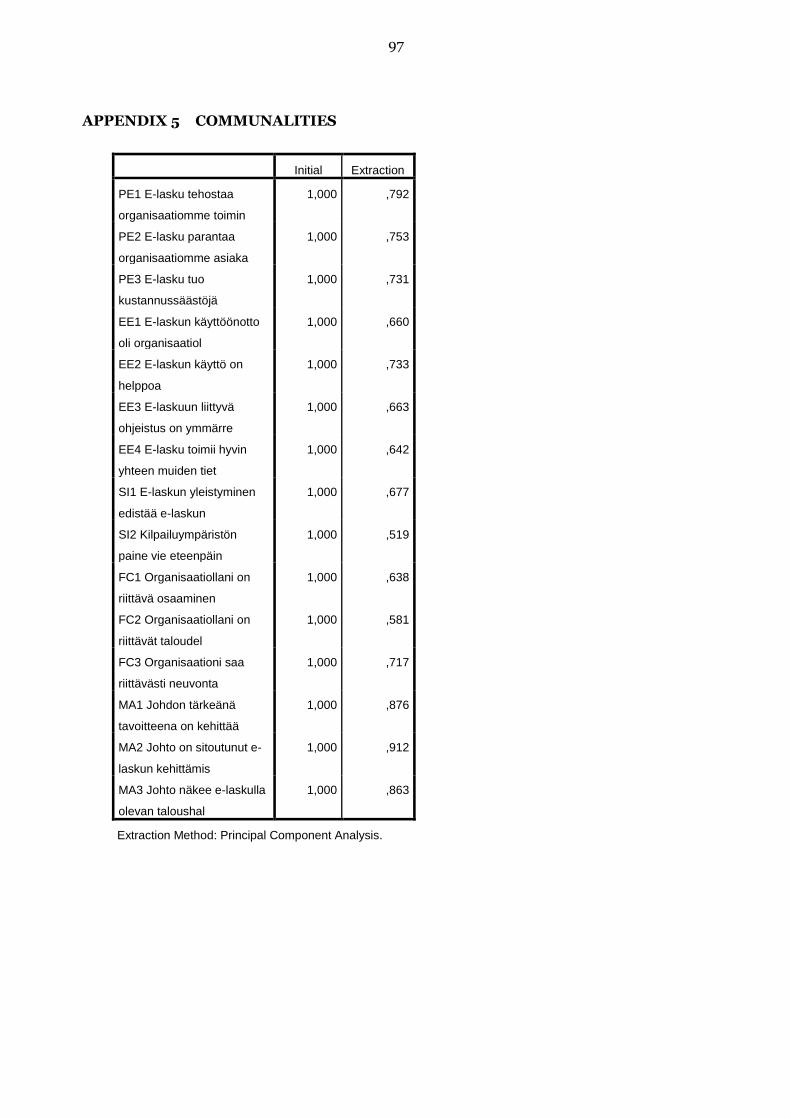
97
APPENDIX 5 COMMUNALITIES
Initial Extraction
PE1 E-lasku tehostaa
organisaatiomme toimin
1,000 ,792
PE2 E-lasku parantaa
organisaatiomme asiaka
1,000 ,753
PE3 E-lasku tuo
kustannussäästöjä
1,000 ,731
EE1 E-laskun käyttöönotto
oli organisaatiol
1,000 ,660
EE2 E-laskun käyttö on
helppoa
1,000 ,733
EE3 E-laskuun liittyvä
ohjeistus on ymmärre
1,000 ,663
EE4 E-lasku toimii hyvin
yhteen muiden tiet
1,000 ,642
SI1 E-laskun yleistyminen
edistää e-laskun
1,000 ,677
SI2 Kilpailuympäristön
paine vie eteenpäin
1,000 ,519
FC1 Organisaatiollani on
riittävä osaaminen
1,000 ,638
FC2 Organisaatiollani on
riittävät taloudel
1,000 ,581
FC3 Organisaationi saa
riittävästi neuvonta
1,000 ,717
MA1 Johdon tärkeänä
tavoitteena on kehittää
1,000 ,876
MA2 Johto on sitoutunut e-
laskun kehittämis
1,000 ,912
MA3 Johto näkee e-laskulla
olevan taloushal
1,000 ,863
Extraction Method: Principal Component Analysis.
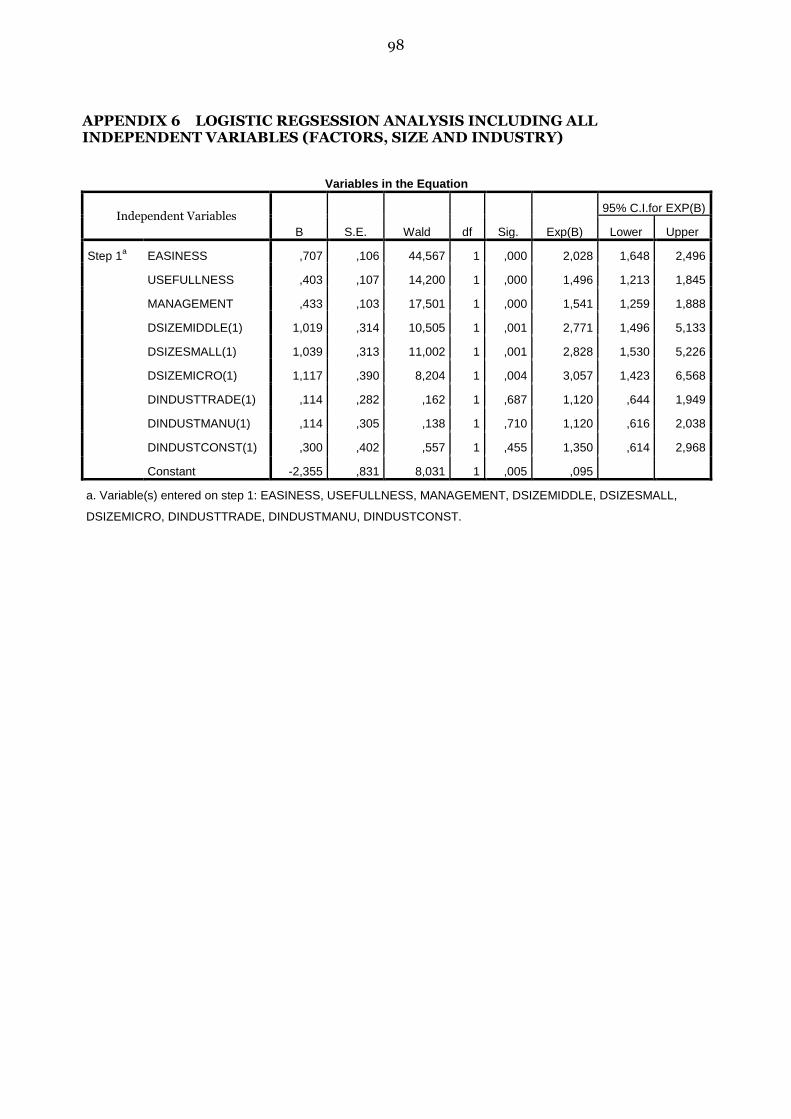
98
APPENDIX 6 LOGISTIC REGSESSION ANALYSIS INCLUDING ALL INDEPENDENT VARIABLES (FACTORS, SIZE AND INDUSTRY)
Variables in the Equation
Independent Variables
B S.E. Wald df Sig. Exp(B)
95% C.I.for EXP(B)
Lower Upper
Step 1a EASINESS ,707 ,106 44,567 1 ,000 2,028 1,648 2,496
USEFULLNESS ,403 ,107 14,200 1 ,000 1,496 1,213 1,845
MANAGEMENT ,433 ,103 17,501 1 ,000 1,541 1,259 1,888
DSIZEMIDDLE(1) 1,019 ,314 10,505 1 ,001 2,771 1,496 5,133
DSIZESMALL(1) 1,039 ,313 11,002 1 ,001 2,828 1,530 5,226
DSIZEMICRO(1) 1,117 ,390 8,204 1 ,004 3,057 1,423 6,568
DINDUSTTRADE(1) ,114 ,282 ,162 1 ,687 1,120 ,644 1,949
DINDUSTMANU(1) ,114 ,305 ,138 1 ,710 1,120 ,616 2,038
DINDUSTCONST(1) ,300 ,402 ,557 1 ,455 1,350 ,614 2,968
Constant -2,355 ,831 8,031 1 ,005 ,095
a. Variable(s) entered on step 1: EASINESS, USEFULLNESS, MANAGEMENT, DSIZEMIDDLE, DSIZESMALL,
DSIZEMICRO, DINDUSTTRADE, DINDUSTMANU, DINDUSTCONST.
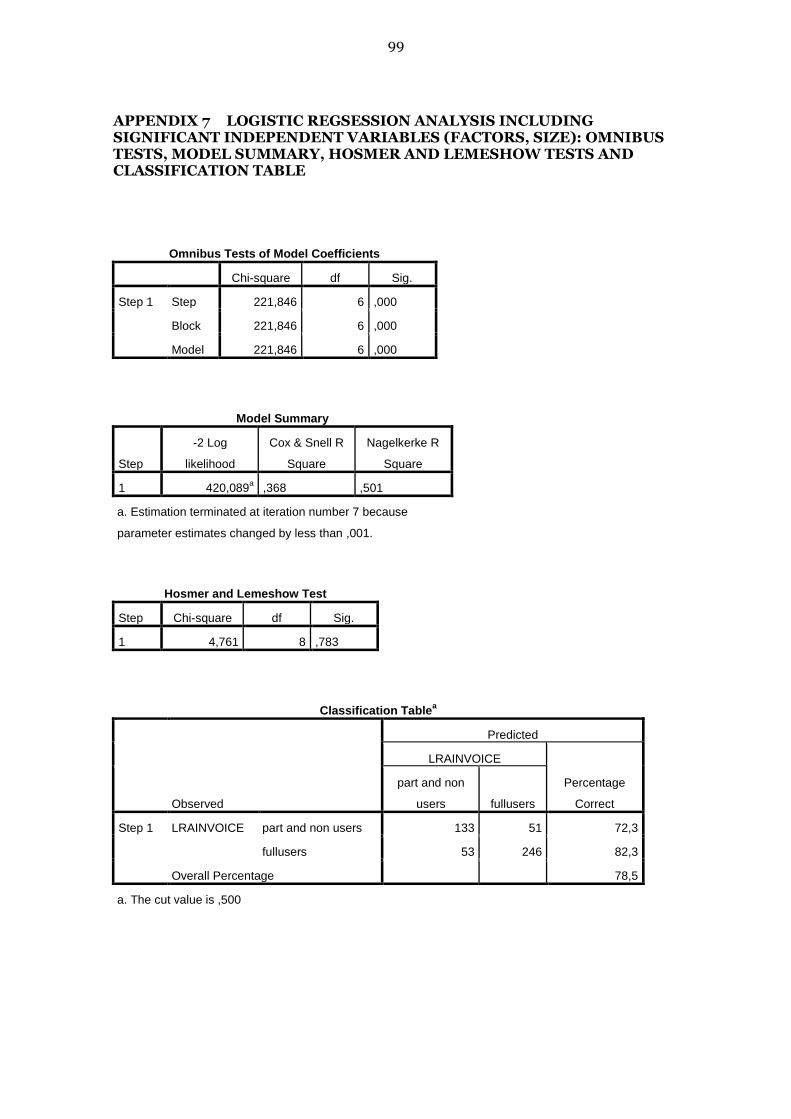
99
APPENDIX 7 LOGISTIC REGSESSION ANALYSIS INCLUDING SIGNIFICANT INDEPENDENT VARIABLES (FACTORS, SIZE): OMNIBUS TESTS, MODEL SUMMARY, HOSMER AND LEMESHOW TESTS AND CLASSIFICATION TABLE
Omnibus Tests of Model Coefficients
Chi-square df Sig.
Step 1 Step 221,846 6 ,000
Block 221,846 6 ,000
Model 221,846 6 ,000
Model Summary
Step
-2 Log
likelihood
Cox & Snell R
Square
Nagelkerke R
Square
1 420,089a ,368 ,501
a. Estimation terminated at iteration number 7 because
parameter estimates changed by less than ,001.
Hosmer and Lemeshow Test
Step Chi-square df Sig.
1 4,761 8 ,783
Classification Tablea
Observed
Predicted
LRAINVOICE
Percentage
Correct
part and non
users fullusers
Step 1 LRAINVOICE part and non users 133 51 72,3
fullusers 53 246 82,3
Overall Percentage 78,5
a. The cut value is ,500
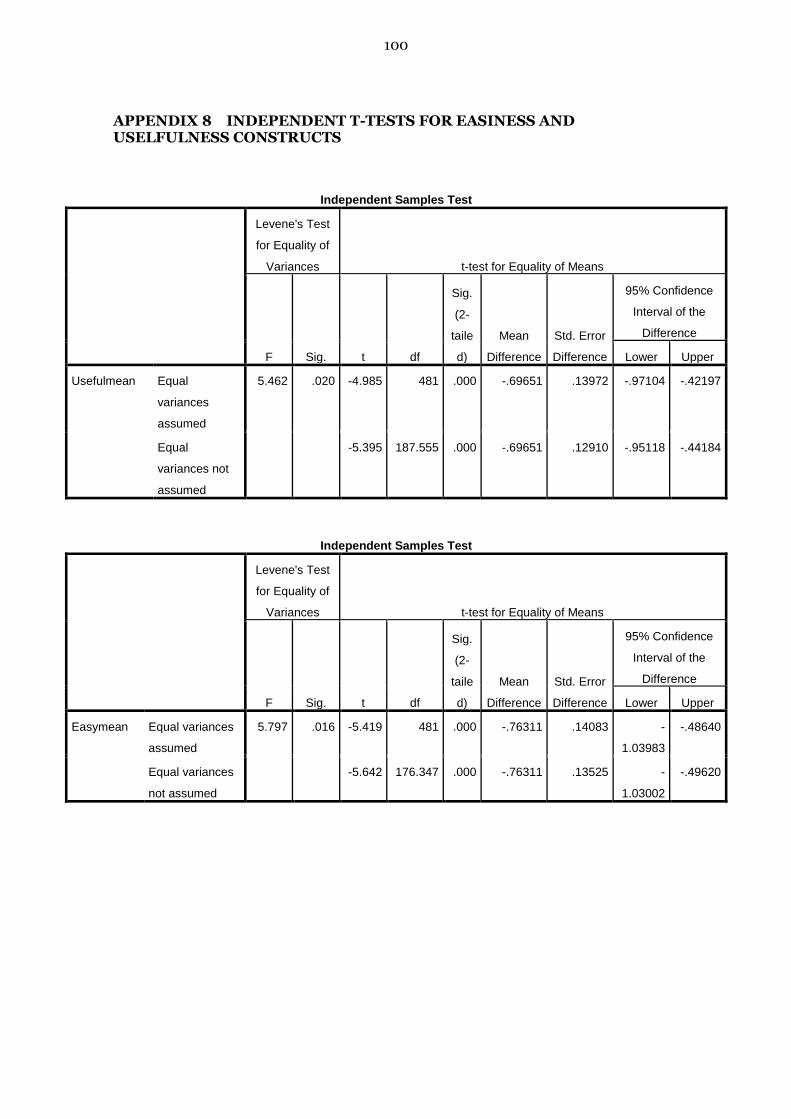
100
APPENDIX 8 INDEPENDENT T-TESTS FOR EASINESS AND USELFULNESS CONSTRUCTS
Independent Samples Test
Levene's Test
for Equality of
Variances t-test for Equality of Means
F Sig. t df
Sig.
(2-
taile
d)
Mean
Difference
Std. Error
Difference
95% Confidence
Interval of the
Difference
Lower Upper
Usefulmean Equal
variances
assumed
5.462 .020 -4.985 481 .000 -.69651 .13972 -.97104 -.42197
Equal
variances not
assumed
-5.395 187.555 .000 -.69651 .12910 -.95118 -.44184
Independent Samples Test
Levene's Test
for Equality of
Variances t-test for Equality of Means
F Sig. t df
Sig.
(2-
taile
d)
Mean
Difference
Std. Error
Difference
95% Confidence
Interval of the
Difference
Lower Upper
Easymean Equal variances
assumed
5.797 .016 -5.419 481 .000 -.76311 .14083 -
1.03983
-.48640
Equal variances
not assumed
-5.642 176.347 .000 -.76311 .13525 -
1.03002
-.49620
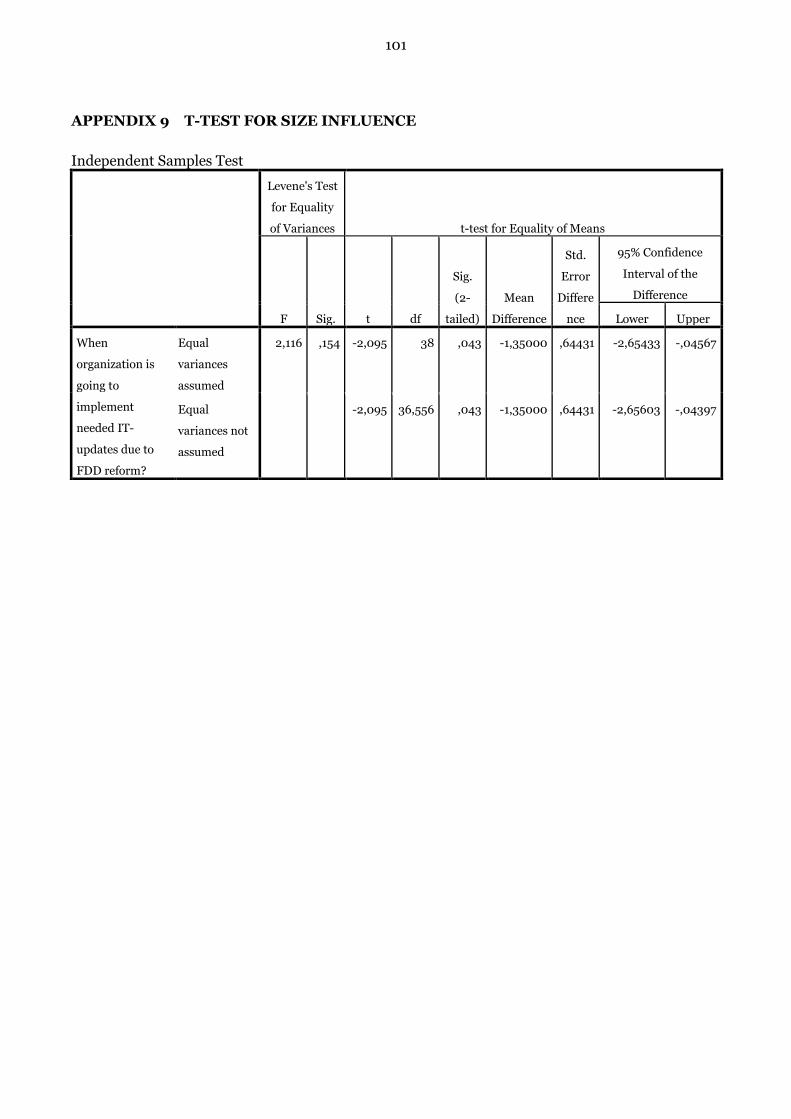
101
APPENDIX 9 T-TEST FOR SIZE INFLUENCE
Independent Samples Test
Levene's Test
for Equality
of Variances t-test for Equality of Means
F Sig. t df
Sig.
(2-
tailed)
Mean
Difference
Std.
Error
Differe
nce
95% Confidence
Interval of the
Difference
Lower Upper
When
organization is
going to
implement
needed IT-
updates due to
FDD reform?
Equal
variances
assumed
2,116 ,154 -2,095 38 ,043 -1,35000 ,64431 -2,65433 -,04567
Equal
variances not
assumed
-2,095 36,556 ,043 -1,35000 ,64431 -2,65603 -,04397