Embed Size (px)
Citation preview

Revista de economía mundial 45, 2017, 143-160
ISSN: 1576-0162
Evolution oF inEquality in latin amErica (1980-2014): a multidimEnSional aPProach BEyond incomE
evolución de la desigualdad en aMéRica latina (1980-2014): un enfoque MultidiMensional Más allá del ingReso
Carmen TruebaUniversidad de Cantabria
Lorena RemuzgoUniversidad de Cantabria
Recibido: enero de 2016; aceptado: diciembre de 2016
aBStract
Latin America is the region with the greatest inequality in terms of incomes. Thus, during the last years, the United Nations Development Programme (UNDP) has showed concern about the obstacle that inequality causes in the human development of this region. Given that higher economic growth does not necessarily lead to the achievement of further progress social, develop-ment beyond income will be one of the most important UNDP’s messages for its upcoming report for this region to be launched early 2016. In this paper, we propose a new multidimensional approach to study inequality in welfare in terms of the components of the Human Development Index of the UNDP –health, education and income– in the period 1980-2014. For this purpose we use the multidimensional inequality indices proposed by Maasoumi (1986) that can be decomposable into the between- and within-group inequality com-ponents.
Keywords: Latin America; Inequality; Wellbeing; Human Development.

rESumEn
América Latina es la región con mayor desigualdad en términos de renta. Tal es así, que el Programa de Naciones Unidas para el Desarrollo (PNUD) viene mostrando en los últimos años su preocupación por el obstáculo que supone la desigualdad para el desarrollo humano de esta región. En este sentido, uno de los mensajes más importantes en los que se centra este organismo en el informe que lanzará a principios del año 2016 es el desarrollo más allá del ingreso, pues un mayor crecimiento económico no conduce necesariamente a la consecución de un mayor progreso social. En este trabajo planteamos un enfoque multidimensional novedoso para el estudio de la desigualdad en el bienestar, en términos de las componentes del Índice de Desarrollo Humano del PNUD –salud, educación y renta– en el periodo 1980-2014. Para ello, recurrimos a los índices de desigualdad multidimensional propuestos por Maa-soumi (1986), los cuales permiten analizar las componentes de desigualdad inter e intrarregional.
Palabras clave: América Latina; Desigualdad; Bienestar; Desarrollo Hu-mano.
JEL Classification: C00, D63, I00, O10, R11.

Revista de economía mundial 45, 2017, 143-160
1. introduction
One of the distinguishing features of the world economy is the existence of inequality between countries (Fawaz et al., 2014; Piketty, 2014). The pro-cesses of industrialization marked the path of economic development in the XIX and XX centuries, becoming an essential requirement for progress (Berzosa, 2008).
Latin America is the most unequal region in the world in terms of income distribution (Alvaredo and Gasparini, 2015; Amarante et al., 2015), having important consequences in the standard of living, the incidence of poverty and the social exclusion (Fitzgerald, 2009). Although there is no consensus on the origin of inequality, most of the historical, sociological and economic studies search for some explanation of the lagging of the region in colonial times.
A brief analysis of the history of Latin America sheds light on the causes of a phenomenon that has been given in all its constituent countries since colonial times: inequality (Dominguez, 2009). The unequal distribution of resources and income came to this land as part of the colonial heritage (Yáñez, 2000; Matus, 2004; World Bank, 2004; Solimano, 2016a) and has been identified as one of the main causes of not obtaining, from a growth model led by ex-ports of raw materials, the same results as other countries also favoured by the abundance of natural resources like the United States, Canada or Australia (Lingarde and Tylecote, 1999; Altman, 2003; McLean, 2004).
Given that Latin America is a developing region, its level of inequality is not only a result of internal inequality in each country, but also of the dif-ferences between Latin American countries themselves and the disparities between them and the leading countries worldwide (Bértola and Ocampo, 2012; Ravallion, 2014). The inequality in Latin America is such that it is dif-ficult to consider this region as a homogeneous group of countries (García and Sánchez, 2008).
To give an idea of the magnitude of this problem, we provide the following example. If we consider the region of Latin America, Venezuela is the country with the lowest income inequality in this area. However, this same country ranks second, just behind the United States, if we take into account the mem-ber countries of the Organization for Economic Cooperation and Development (World Bank, 2016).
Globally, the evolution of the Gini index from 1980 to 2014 shows that Latin America is the most unequal region in the world (0.518), followed by

146 Carmen Trueba, Lorena remuzgo
Africa (0.439), Oceania (0.430), Northern America (0.365), Asia (0.359) and Europe (0.312)1 (see Figure 1).
This situation of the society of Latin American, which recorded in 2013 a poverty rate of 28.1 percent of the population –while indigence or extreme poverty stood at 11.7 percent– (CEPAL, 2014), becomes a problem when pov-erty reduction policies focus on economic growth as a matter of priority.
During the last years, the United Nations Development Programme (UNDP) has showed concern about the obstacle that inequality causes in the human development of this region, considering its treatment of primary importance. In this sense, one of the most important messages that the agency focuses on the report launched in early 2016 is considering development beyond income, as higher economic growth does not necessarily lead to the achievement of a greater social progress.
The aim of this paper is to analyse the evolution of inequality in the welfare of Latin America in the period 1980-2014 from a novel multidimensional ap-proach2. For this purpose, we use the multidimensional inequality indices pro-posed by Maasoumi (1986) that can be decomposable into the between- and within-group inequality components.
FiGurE 1. rEGional incomE inEquality mEaSurEd By Gini indEx (1980-2014)3.
Source. Authors using data from the World Bank (2015).
In terms of welfare, the economic dimension –collected through the inco-mes– has had a predominant role in studies of inequality. However, to carry out appropriate strategies for social progress, welfare must be conceived as a
1 The division of the territory has been made based on the composition of the macro geographical regions created by the United Nations Statistics.2 According to the distinction made by Milanovic (2005) between the different concepts of inequality, in this paper we analyse the inequality between Latin American countries, considering each country as a unit regardless of its population.3 These values reflect the unweighted average of the Gini coefficients available for each country in the study period.

147
Revista de economía mundial 45, 2017, 143-160
evolution of inequality in latin ameRica (1980-2014): a multidimensional appRoach Beyond income
multidimensional process (Sen, 1985; Streeten, 1994; Stiglitz et al., 2009). As Dominguez (2009) points out, when the concentration of income is high, inequality masks poverty. In addition, there is evidence that the positive de-velopment of a region in economic terms does not necessarily mean that the other dimensions of wellbeing behave in the same way (Bourguignon and Mo-rrisson, 2002; Noorkbahsh, 2006, Konya, 2008; McGillivray and Markova, 2010; Martinez, 2012). Therefore, the consideration of social aspects, such as education or health, in the definition of welfare requires a comprehensive definition of this concept.
In order to bring ourselves closer to the notion of welfare, we resort to the concept of development of an individual as a process of expanding human ca-pabilities (Sen, 1984, 1988, 1989 and 1999), which marked the origin of the human development paradigm adopted by the UNDP in 19904.
The UNDP defines the human development as a process of expanding hu-man capabilities, considering that the three most essential capabilities are a long and healthy life, access to knowledge and a decent standard of living (UNDP, 1990). The UNDP materialized this idea through the Human Develop-ment Index (HDI), which measures the achievement of a country on three basic dimensions of human development: health, education and income. These three dimensions are quantified numerically by three intermediate indices –health index, education index and income index, respectively– which are aggregated using a geometric mean to obtain the HDI for each country.
The health index is constructed in terms of the life expectancy, the educa-tion index is composed of the geometric mean of two intermediate sub-indices, the expected years of schooling and the mean years of schooling and, finally, the income index is set by the gross national income per capita. The HDI uses the logarithm of income in order to reflect the diminishing importance of in-come with increasing GNI. Each of these intermediate indices are normalized using maximum values, which are given by the maximum values observed in countries between 1980 and the last data available, and minimum values es-tablished in accordance with the minimum subsistence level.
Despite its limitations5, the HDI has meant an enormous breakthrough in the representation of development in a homogeneous way, allowing assess the progress of each country’s wellbeing and facilitating international comparisons. In addition, the formula introduced in 2010, which amended the form of ag-gregation replacing the arithmetic mean by the geometric mean, represented a change in the conception of the relationship between the components of health, education and income, reducing the substitution degree among them. In this line, the use of an additive scheme used to contribute to interpretation errors, for example, when variations occurring in the overall index were due
4 According to other studies, we consider the concepts of development, human development, wellbeing and welfare as synonyms (McGuillivray and Pillarisetti, 2004; Decancq et al, 2009 and McGuillivray and Markova, 2010).5 For a wide review of the criticisms of the HDI see Domínguez et al. (2011).

148 Carmen Trueba, Lorena remuzgo
exclusively to variations in one of the intermediate indices (Desai, 1991; Sagar and Najam, 1998; Dominguez and Guijarro, 2009).
The rest of this paper is organized as follows. In Section 2, the methodology used in the multidimensional inequality analysis is detailed. Next, the main results of the analysis are exposed along with different sensitivity analysis. Fi-nally, Section 4 concludes.
2. mEthodoloGy
In this section, we exhibit the methodology used in the multidimensional inequality analysis. The multidimensional inequality measures applied in this paper are additively decomposable by population groups allowing the analysis of inequality both between and within regions.
Consider a sample of N countries where we want to study, jointly, K dimen-sions related to welfare. These values are collected in the matrix X of dimen-sion NxK:
(1)
where each element of the matrix, xij, is the value of the dimension or variable j of country i. In this paper, as we want to analyze the inequality in the Latin American countries’ wellbeing understood as ‘more than income’, the values xij correspond to the components of the HDI –Health index, Education index and Income index– in each country.
In order to analyze the evolution of inequality, we consider the multidimen-sional inequality measures proposed by Maasoumi (1986). These measures are based on the concept of generalized entropy and they are defined as:
(2)
where the γ parameter represents the weight assigned to the different parts of the distribution. Thus, the higher the γ value, the greater the weight given to the countries with higher wellbeing.
When γ takes the values -1 –the least developed countries received more weight– and 0 –it is assigned the same weight to all the parts of the distribu-tion–, we are faced with the special cases of these measures, which are ex-pressed respectively as:
,
1
1
1111
⎥⎥⎥⎥⎥⎥
⎦
⎤
⎢⎢⎢⎢⎢⎢
⎣
⎡
=
NKNjN
iKiji
Kj
xxx
xxx
xxx
……!!!
……!!!
……
X (1)
,0,1,11)1(
1)(1
1
-≠∑ γγγ
γ
γ
N
i
i
ss
NGEM
=
+
⎥⎥⎦
⎤
⎢⎢⎣
⎡−⎟
⎠
⎞⎜⎝
⎛+
=X (2)
,log1)(1
1 ∑=
− ⎟⎟⎠
⎞⎜⎜⎝
⎛=
N
i iss
NGEM X
(3)
.log1)(1
0 ⎟⎠
⎞⎜⎝
⎛= ∑
= ss
ss
NGEM i
N
i
iX
(4)
,,,1,1
1Nixs
K
jijji …=⎟⎟
⎠
⎞⎜⎜⎝
⎛=
−
=
−∑β
βδ
(5)
,,,1,1
3/1 NixsK
jiji …==∏
= (6)
,)()()( XXX γγγ WBGEM +=
(7)
,),()(1
⎟⎟⎠
⎞⎜⎜⎝
⎛= ∑
=
G
g
gg sshNN
fB Xγ
(8)
.),(1)(1∑ ∑= ∈
⎟⎟⎠
⎞⎜⎜⎝
⎛=
G
g gi
gi
gg sshN
fwW Xγ
(9)
where ( ) ;,1
1gixs K
j ijji ∈=−
=
−∑ ββδ s is the arithmetic mean of the values si and
gs is the arithmetic mean of the values si over the countries in group g.
149
Revista de economía mundial 45, 2017, 143-160
evolution of inequality in latin ameRica (1980-2014): a multidimensional appRoach Beyond income
(3)
(4)
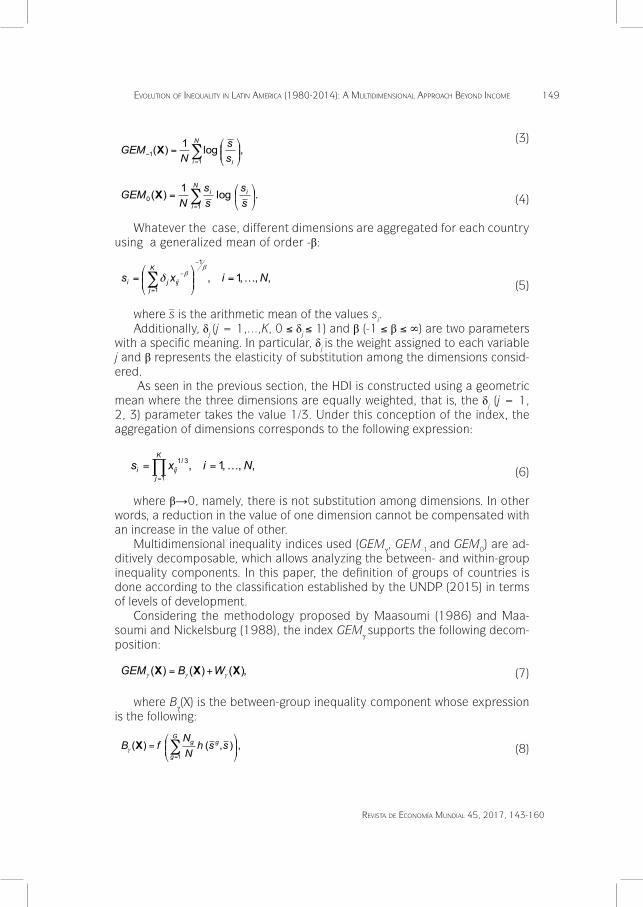
Whatever the case, different dimensions are aggregated for each country using a generalized mean of order -β:
(5)
where s is the arithmetic mean of the values si.Additionally, δj (j = 1,…,K, 0 ≤ δj ≤ 1) and β (-1 ≤ β ≤ ∞) are two parameters
with a specific meaning. In particular, δj is the weight assigned to each variable j and β represents the elasticity of substitution among the dimensions consid-ered.
As seen in the previous section, the HDI is constructed using a geometric mean where the three dimensions are equally weighted, that is, the δj (j = 1, 2, 3) parameter takes the value 1/3. Under this conception of the index, the aggregation of dimensions corresponds to the following expression:
(6)
where β→0, namely, there is not substitution among dimensions. In other words, a reduction in the value of one dimension cannot be compensated with an increase in the value of other.
Multidimensional inequality indices used (GEMγ, GEM-1 and GEM0) are ad-ditively decomposable, which allows analyzing the between- and within-group inequality components. In this paper, the definition of groups of countries is done according to the classification established by the UNDP (2015) in terms of levels of development.
Considering the methodology proposed by Maasoumi (1986) and Maa-soumi and Nickelsburg (1988), the index GEMγ supports the following decom-position:
(7)
where Bγ(X) is the between-group inequality component whose expression is the following:
(8)
,
1
1
1111
⎥⎥⎥⎥⎥⎥
⎦
⎤
⎢⎢⎢⎢⎢⎢
⎣
⎡
=
NKNjN
iKiji
Kj
xxx
xxx
xxx
……!!!
……!!!
……
X (1)
,0,1,11)1(
1)(1
1
-≠∑ γγγ
γ
γ
N
i
i
ss
NGEM
=
+
⎥⎥⎦
⎤
⎢⎢⎣
⎡−⎟
⎠
⎞⎜⎝
⎛+
=X (2)
,log1)(1
1 ∑=
− ⎟⎟⎠
⎞⎜⎜⎝
⎛=
N
i iss
NGEM X
(3)
.log1)(1
0 ⎟⎠
⎞⎜⎝
⎛= ∑
= ss
ss
NGEM i
N
i
iX
(4)
,,,1,1
1Nixs
K
jijji …=⎟⎟
⎠
⎞⎜⎜⎝
⎛=
−
=
−∑β
βδ
(5)
,,,1,1
3/1 NixsK
jiji …==∏
= (6)
,)()()( XXX γγγ WBGEM +=
(7)
,),()(1
⎟⎟⎠
⎞⎜⎜⎝
⎛= ∑
=
G
g
gg sshNN
fB Xγ
(8)
.),(1)(1∑ ∑= ∈
⎟⎟⎠
⎞⎜⎜⎝
⎛=
G
g gi
gi
gg sshN
fwW Xγ
(9)
where ( ) ;,1
1gixs K
j ijji ∈=−
=
−∑ ββδ s is the arithmetic mean of the values si and
gs is the arithmetic mean of the values si over the countries in group g.
–
,
1
1
1111
⎥⎥⎥⎥⎥⎥
⎦
⎤
⎢⎢⎢⎢⎢⎢
⎣
⎡
=
NKNjN
iKiji
Kj
xxx
xxx
xxx
……!!!
……!!!
……
X (1)
,0,1,11)1(
1)(1
1
-≠∑ γγγ
γ
γ
N
i
i
ss
NGEM
=
+
⎥⎥⎦
⎤
⎢⎢⎣
⎡−⎟
⎠
⎞⎜⎝
⎛+
=X (2)
,log1)(1
1 ∑=
− ⎟⎟⎠
⎞⎜⎜⎝
⎛=
N
i iss
NGEM X
(3)
.log1)(1
0 ⎟⎠
⎞⎜⎝
⎛= ∑
= ss
ss
NGEM i
N
i
iX
(4)
,,,1,1
1Nixs
K
jijji …=⎟⎟
⎠
⎞⎜⎜⎝
⎛=
−
=
−∑β
βδ
(5)
,,,1,1
3/1 NixsK
jiji …==∏
= (6)
,)()()( XXX γγγ WBGEM +=
(7)
,),()(1
⎟⎟⎠
⎞⎜⎜⎝
⎛= ∑
=
G
g
gg sshNN
fB Xγ
(8)
.),(1)(1∑ ∑= ∈
⎟⎟⎠
⎞⎜⎜⎝
⎛=
G
g gi
gi
gg sshN
fwW Xγ
(9)
where ( ) ;,1
1gixs K
j ijji ∈=−
=
−∑ ββδ s is the arithmetic mean of the values si and
gs is the arithmetic mean of the values si over the countries in group g.

150 Carmen Trueba, Lorena remuzgo
and Wγ(X) is the within-group inequality component which can be express as:
(9)
Table 1 shows the elements of these indexes for the different values of γ parameter, where
is the arithmetic mean of the values si and sg is the arithmetic mean of the values si over the countries in group g.
taBlE 1. ElEmEntS oF thE BEtwEEn- and within-GrouP inEquality comPonEntS.
Source: Gigliariano and Mosler (2009).
3. data and rESultS
The data used in this analysis have been taken from the Human Develop-ment Report, developed by the UNDP (2015). The variables under study are the components of the HDI –Health index, Education Index and Income index– which are normalized from 0 to 1. We use the available historical data on 18 Latin American countries for the time period 1980-20146, classified according to three levels of development: very high, high and medium7.
In this section, we analyze the multidimensional inequality in the Latin American countries’ wellbeing considering the preceding dimensions and using the measures described in Section 2. As specified previously, these measures include three parameters. According to the construction of the HDI made by the UNDP, the δ parameter has been set to 1/3 in order to attach the same weight to the three human development dimensions. Under the new concep-tion of the HDI, the value of the β parameter goes to 0, avoiding a compensa-tion between the values of the wellbeing dimensions included in the analysis.
6 2014 is the last year for which the UNDP provides information on the variables under study.7 Very high human development: Argentina and Chile; High human development: Brazil, Colombia, Costa Rica, Cuba, Dominican Republic, Ecuador, Mexico, Panama, Peru, Uruguay and Venezuela; and Medium human development: Bolivia, El Salvador, Guatemala, Haiti, Honduras, Nicaragua and Paraguay. The low level of development is not considered because no Latin American country has such category of development.
,
1
1
1111
⎥⎥⎥⎥⎥⎥
⎦
⎤
⎢⎢⎢⎢⎢⎢
⎣
⎡
=
NKNjN
iKiji
Kj
xxx
xxx
xxx
……!!!
……!!!
……
X (1)
,0,1,11)1(
1)(1
1
-≠∑ γγγ
γ
γ
N
i
i
ss
NGEM
=
+
⎥⎥⎦
⎤
⎢⎢⎣
⎡−⎟
⎠
⎞⎜⎝
⎛+
=X (2)
,log1)(1
1 ∑=
− ⎟⎟⎠
⎞⎜⎜⎝
⎛=
N
i iss
NGEM X
(3)
.log1)(1
0 ⎟⎠
⎞⎜⎝
⎛= ∑
= ss
ss
NGEM i
N
i
iX
(4)
,,,1,1
1Nixs
K
jijji …=⎟⎟
⎠
⎞⎜⎜⎝
⎛=
−
=
−∑β
βδ
(5)
,,,1,1
3/1 NixsK
jiji …==∏
= (6)
,)()()( XXX γγγ WBGEM +=
(7)
,),()(1
⎟⎟⎠
⎞⎜⎜⎝
⎛= ∑
=
G
g
gg sshNN
fB Xγ
(8)
.),(1)(1∑ ∑= ∈
⎟⎟⎠
⎞⎜⎜⎝
⎛=
G
g gi
gi
gg sshN
fwW Xγ
(9)
where ( ) ;,1
1gixs K
j ijji ∈=−
=
−∑ ββδ s is the arithmetic mean of the values si and
gs is the arithmetic mean of the values si over the countries in group g.
–
TABLE 1. ELEMENTS OF THE BETWEEN- AND WITHIN-GROUP INEQUALITY COMPONENTS.
Gamma )(yf )( tt;h ,G,g,wg …1=
10,≠ γ )(
yγγ +1
1
1
−
+
⎟⎠⎞
⎜⎝⎛
γ
tt
γ+
⎟⎟⎠
⎞⎜⎜⎝
⎛1
s
s
N
N gg
1−=γ y ⎟⎠⎞
⎜⎝⎛tt
log N
Ng
0=γ y ⎟⎠⎞
⎜⎝⎛tt
ttlog
sN
sN gg
Source. Gigliariano and Mosler (2009).

151
Revista de economía mundial 45, 2017, 143-160
evolution of inequality in latin ameRica (1980-2014): a multidimensional appRoach Beyond income
Finally, γ parameter has been set to 0 assigning the same importance to all the countries.
It should be noted that the multidimensional indices used in this paper can be additively decomposed by population groups. In other words, this decomposition allows studying which part of total inequality can be at-tributed to differences between groups and what to disparities within each one. While interregional inequality only considers the differences between average inequalities of each group, the intraregional component highlights the inequality between the countries which belong to the same group. In this paper we have chosen to divide the sample of countries into three sub-groups considering the development levels establish by the UNDP (2015).
FiGurE 2. (lEFt PanEl) Evolution oF total inEquality in wEllBEinG and itS dEcomPoSition By PoPulation GrouPS. (riGht PanEl) Evoluton oF thE rElativE imPortancE oF thE BEtwEEn and within inEquality comPonEntS8.
Source: Authors using data from the UNDP (2015).
The left panel of Figure 2 shows the evolution of the GEMγ, Bγ and Wγ in-dices for the multidimensional notion of wellbeing –health, education and in-come– over the period 1980-2014. These indices are computed giving the same weight to all the countries and assuming no substitution degree among dimensions. The solid line represents the total inequality value, the dashed line exhibits the between-group inequality component and the dotted line displays the inequality within groups.
When all countries are equally weighted (γ = 0), total inequality in wellbeing decreases by about 50 percent over the period 1980-2014. The disparities decline on the basis of the period of time considered. Thus, between 1980 and 1985 we observe a reduction in inequality around 6 percent. From 1985 to 2005 the diminution is closed to 15 percent every five years, while in the time period 2005-2014 occurred the least contrac-tion. This fact is in accordance with the reduction in income inequality that has
8 Results expressed x102.

152 Carmen Trueba, Lorena remuzgo
taken place in Latin America since the year 2010 (Diaz-Bazan, 2015; Gasparini et al., 2016). In particular, such reduction was generated by the strong income growth registered in this region (Solimano, 2016b; Cord et al., 2017).
Regarding the inequality between countries, it is observed a decreasing pat-tern from 1980 to 2014 quantified in 40 percent. Once again we can distinguish three time periods. First, until 1985 the inequality is slightly reduced, approxi-mately 4 percent. As in the total inequality case, the largest decline takes place in the two following decades. In particular, the concentration diminished by 15 percentage points every five years, reaching the minimum level in 2005, and holding the opposite tendency since then.
In relation to the within-group inequality component, it is perceived the big-gest fall –roughly 75 percent– in wellbeing inequality, being much more accentu-ated in the latter 4 years of the study period.
The evolution of the relative importance of the between- and within-group inequality components are shown in the right panel of Figure 2. According to the results, both components contributed to the change in overall inequality from 1980 to 2014. This aspect supports the choice for the presented methodology, which considers the decomposition of total inequality in both components.
As seen in Figure 2, during all the period the predominant component is the inequality between groups (above 75 percent). It should be noted that the intraregional component has been progressively reducing its weight in total in-equality in favor of the other element from 1980 to 2014.
3.1. SEnSitivity analySiS By countriES
Up to now, we have analysed the evolution of inequality in Latin America, observing a decreasing pattern over the period 1980-2014. In this section, we study the sensitivity of the results to each Latin American country that brings up the following question: Do all the countries contribute equally to the level of inequality in the welfare of Latin America? To address this issue, we focus in the last year of the study period (2014).
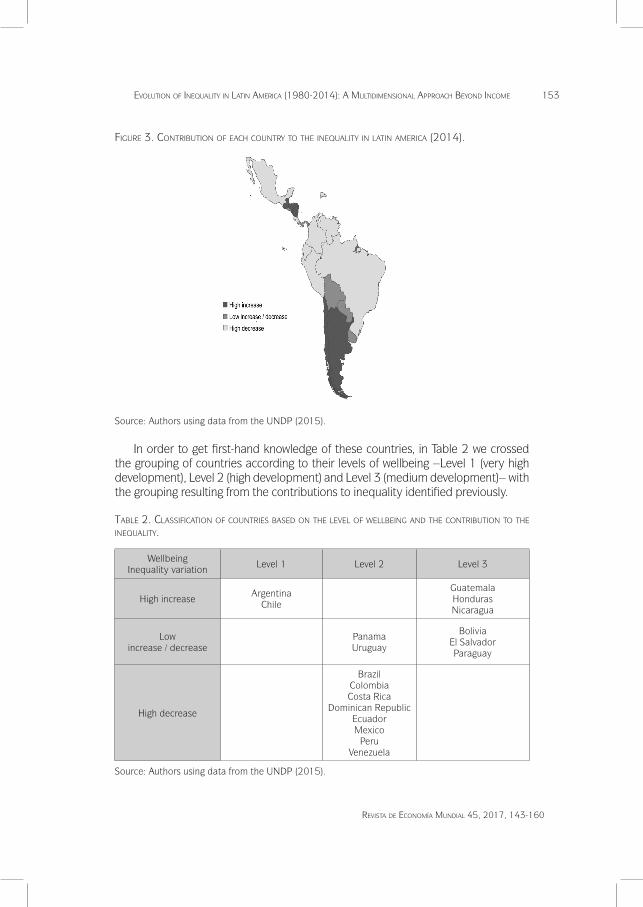
In Figure 3 we represent the contribution of the different countries of Latin America to the inequality values recorded by the region as a whole. Three groups of countries can be distinguished: those which contribute substantially to the inequality increase, those that remain inequality at the same level –with small variations both positive and negative– and those which cooperate significantly to the reduction of inequality.
The first group consists of Honduras –with a contribution of 16 percent– and Argentina, Guatemala, Chile and Nicaragua which contribute by around 8.5 percent. In the second group are Bolivia, Uruguay, El Salvador, Panama and Paraguay with a small contribution –about 1 percent–. Finally, the third group is completed by Costa Rica, Venezuela, Mexico and Brazil –with a participation of less than 5 percent– and Dominican Republic, Colombia, Peru and Ecuador which have associated a decrease above 5 percent.
153
Revista de economía mundial 45, 2017, 143-160
evolution of inequality in latin ameRica (1980-2014): a multidimensional appRoach Beyond income
FiGurE 3. contriBution oF Each country to thE inEquality in latin amErica (2014).
Source: Authors using data from the UNDP (2015).
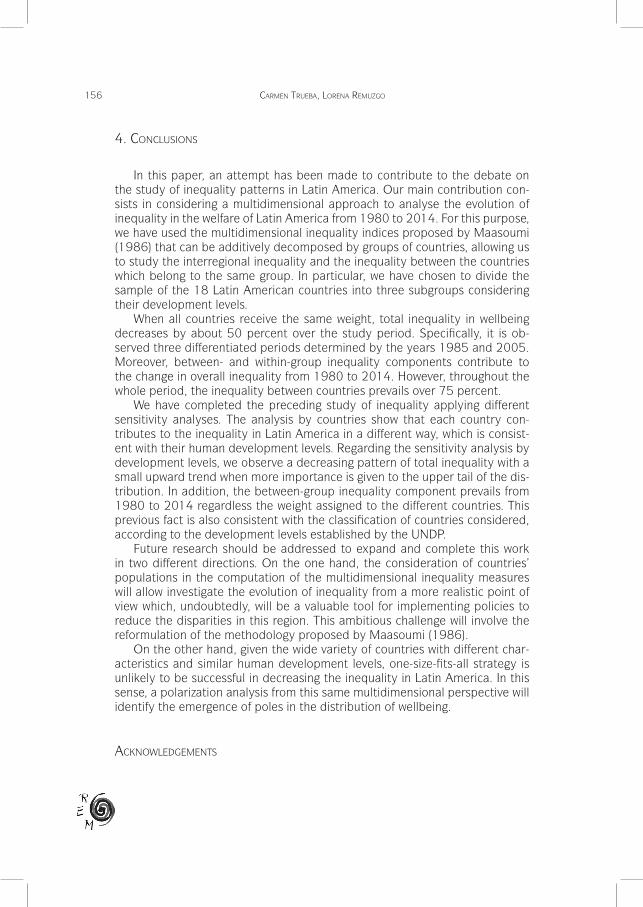
In order to get first-hand knowledge of these countries, in Table 2 we crossed the grouping of countries according to their levels of wellbeing –Level 1 (very high development), Level 2 (high development) and Level 3 (medium development)– with the grouping resulting from the contributions to inequality identified previously.
taBlE 2. claSSiFication oF countriES BaSEd on thE lEvEl oF wEllBEinG and thE contriBution to thE inEquality.
Wellbeing Inequality variation
Level 1 Level 2 Level 3
High increaseArgentina
Chile
GuatemalaHonduras Nicaragua
Low increase / decrease
Panama Uruguay
Bolivia El SalvadorParaguay
High decrease
BrazilColombiaCosta Rica
Dominican RepublicEcuadorMexico
PeruVenezuela
Source: Authors using data from the UNDP (2015).

154 Carmen Trueba, Lorena remuzgo
The situation of Argentina, Chile Guatemala, Honduras and Nicaragua is consistent with its high contribution to the inequality in Latin America given that these countries have an extreme value of wellbeing (Level 1 or 3). Simi-larly, it seems reasonable that countries with a Level 2 of wellbeing, such as Panama and Uruguay, do not greatly affect the results of the whole region. The same circumstance happens with Bolivia, El Salvador and Paraguay whose development is close to Level 2 in spite of being located in Level 3.
Finally, Brazil, Colombia, Costa Rica, Dominican Republic, Ecuador, Mexi-co, Peru and Venezuela are situated in an intermediate category of inequality. The homogeneity of this group is likely to contribute to the reduction of the inequality figures registered in this region because this aggregate represents nearly 45 percent of the countries of Latin America.
3.2. SEnSitivity analySiS By dEvEloPmEnt lEvElS
To complete the previous study of inequality, in this section, we carry out two different sensitivity analyses. Firstly, we study the evolution of total in-equality in wellbeing during the period 1980-2014, paying special attention to the weight assigned to the different parts of the distribution. Secondly, we analyze the relative importance of the between- and within-group inequality components in global inequality for different values of the γ parameter, allow-ing us to study the sensitivity of the results to variations in the weight assigned to the different development levels.
The top panel of Figure 4 shows the evolution of the GEM index to the γ parameter9. Thus, the higher the γ value, the greater the weight given to the countries with higher wellbeing.
The inequality trend decreases from 1980 to 2014 irrespective of γ param-eter value. These results support those obtained in Figure 2, when all countries are equally weighted (γ = 0). In this sense, the maximum level of inequality is reached in the year 1980 when γ is set to -10. On the other side, the lowest level of inequality occurs in the year 2014 when is attached the same weight to the 18 Latin American countries.
Our analysis reveals a general behavior pattern regardless the year consid-ered. Specifically, a decrease is perceived since the γ sensitivity parameter takes the value -10 until it is in the range [5, 7]. From this point onwards, inequality shows a slight upward trend as it is given more importance to the upper tail of the distribution. It should be highlighted that inequality suffers a remarkable fall when γ takes de value -1 and 0, being more accentuated in the latter case.
The evolution of the relative importance of the between- and within-group inequality components for several values of the γ parameter are shown in the bottom panel of Figure 4. This approach allows us to analyze the weight of the components in total inequality without assuming a specific weighting scheme among countries.
9 The γ parameter ranges from -10 to 10 by increments of 0.02.

155
Revista de economía mundial 45, 2017, 143-160
evolution of inequality in latin ameRica (1980-2014): a multidimensional appRoach Beyond income
According to the results, the between-group inequality component pre-dominates from 1980 to 2014 without regard to the weight assigned to the different countries. This fact is consistent with the classification of countries considered, according to the development levels established by the UNDP. Comparing the first and the last years of the study -1980 and 2014-, we can conclude that the dominant component in 1980 has increased its importance in total inequality at the expense of the other element. It should be note that, from the year 2005 onwards, the within-group inequality component reduces its weight as it is given more relevance to the most developed countries.
FiGurE 4. (toP PanEl) Evolution oF total inEquality in wEllBEinG (1980-2014) . (Bottom PanEl) Evoluton oF thE rElativE imPortancE oF thE within-GrouP inEquality comPonEnt in total inEquality10 (1980-2014) .
Source: Authors using data from the UNDP (2015).
10 Results expressed x102.
156 Carmen Trueba, Lorena remuzgo
4. concluSionS
In this paper, an attempt has been made to contribute to the debate on the study of inequality patterns in Latin America. Our main contribution con-sists in considering a multidimensional approach to analyse the evolution of inequality in the welfare of Latin America from 1980 to 2014. For this purpose, we have used the multidimensional inequality indices proposed by Maasoumi (1986) that can be additively decomposed by groups of countries, allowing us to study the interregional inequality and the inequality between the countries which belong to the same group. In particular, we have chosen to divide the sample of the 18 Latin American countries into three subgroups considering their development levels.
When all countries receive the same weight, total inequality in wellbeing decreases by about 50 percent over the study period. Specifically, it is ob-served three differentiated periods determined by the years 1985 and 2005. Moreover, between- and within-group inequality components contribute to the change in overall inequality from 1980 to 2014. However, throughout the whole period, the inequality between countries prevails over 75 percent.
We have completed the preceding study of inequality applying different sensitivity analyses. The analysis by countries show that each country con-tributes to the inequality in Latin America in a different way, which is consist-ent with their human development levels. Regarding the sensitivity analysis by development levels, we observe a decreasing pattern of total inequality with a small upward trend when more importance is given to the upper tail of the dis-tribution. In addition, the between-group inequality component prevails from 1980 to 2014 regardless the weight assigned to the different countries. This previous fact is also consistent with the classification of countries considered, according to the development levels established by the UNDP.
Future research should be addressed to expand and complete this work in two different directions. On the one hand, the consideration of countries’ populations in the computation of the multidimensional inequality measures will allow investigate the evolution of inequality from a more realistic point of view which, undoubtedly, will be a valuable tool for implementing policies to reduce the disparities in this region. This ambitious challenge will involve the reformulation of the methodology proposed by Maasoumi (1986).
On the other hand, given the wide variety of countries with different char-acteristics and similar human development levels, one-size-fits-all strategy is unlikely to be successful in decreasing the inequality in Latin America. In this sense, a polarization analysis from this same multidimensional perspective will identify the emergence of poles in the distribution of wellbeing.
acknowlEdGEmEntS

157
Revista de economía mundial 45, 2017, 143-160
evolution of inequality in latin ameRica (1980-2014): a multidimensional appRoach Beyond income
The authors thank the Ministerio de Economía y Competitividad (Project ECO2013-48326-C2-2-P) and the Ministerio de Educación, Cultura y Deporte (FPU13/02155) for the partial support of this work.
rEFErEncES
Altman, M. (2003): “Staple Theory and Export-Led Growth: Constructing Dif-ferential Growth”, Australian Economical History Review, 43 (3), 230-255.
Alvaredo, F. and Gasparini, L. (2015); “Recent Trends in Inequality and Poverty in Developing Countries”; in Atkinson A. and Bourguignon F. (2015): Hand-book of Income Distribution, Elsevier, Amsterdam.
Amarante, V., Galván, M. and Mancero, X. (2016): “Desigualdad en América Latina: una medición global”, Revista CEPAL, 118, 27-47.
Bértola, L. and Ocampo, J. A. (2012): The Economic Development of Latin America since Independence, Oxford University Press, Oxford.
Berzosa, C. (2008): “Los modelos de desarrollo tardíos”, Revista de Economía Mundial, 18, 51-63.
Bourguignon, F. and Morrison, C. (2002): “Inequality among World Citizens”, American Economic Review, 92, 727-744.
Comisión Económica para América Latina y el Caribe, CEPAL (2014): Pano-rama Social de América Latina (LC/G.2635-P), Santiago de Chile.
Cord, L., Barriga Cabanillas, O., Lucchetti, L., Rodríguez Castelán, C., Sousa, L. D., and Valderrama, D. (2017): “Inequality Stagnation in Latin America in the Aftermath of the Global Financial Crisis”, Review of Development Eco-nomics, 21 (1), 157-181.
Decancq, K., Decoster, A. and Schokkaert, E. (2009): “Evolution of World In-equality in Well-being”, World Development, 37, 11-25.
Desai, M. (1991): “Human Development: Concepts and Measurement”, Euro-pean Economic Review, 35 (2-3), 350-357.
Diaz-Bazan, T. (2015): “Measuring Inequality from Top to Bottom”, World Bank Policy Research Working Paper, 7237.
Domínguez, R. and Guijarro, M. (2009): “Gender Inequality and Economic Growth in Spain. An Exploratory Analysis”, Review of Regional Studies, 39 (1), 23-48.
Domínguez, R. (2009): “Desigualdad y bloqueo al desarrollo en América Lati-na”, Principios: estudios de economía política, 13, 5-32.
Domínguez, R., Guijarro, M. and Trueba, C. (2011): “Recuperando la dimensión política del desarrollo humano”, Sistema: revista de ciencias sociales, 220, 11-31.
Fawaz, F., Rahnamamoghadam, M. and Valcarcel, V. (2014): “A Refinement of the Relationship between Economic Growth and Income Inequality in De-veloping Countries”, Munich Personal RePEc Archive.
FitzGerald, V. (2009): “La distribución de ingresos y rentas en América Latina du-rante el siglo XX: un estudio inicial”, Cuadernos Económicos de ICE, 78, 29-56.

158 Carmen Trueba, Lorena remuzgo
Gasparini, L., Cruces, G., and Tornarolli, L. (2016). “Chronicle of a Decelera-tion Foretold: Income inequality in Latin America in the 2010s”, Revista de Economía Mundial, 43, 25-46.
García, J. M. and Sánchez, A. (2008): “América Latina: ¿volver a empezar?”, Revista de Economía Mundial, 18, 93-103.
Gigliarano, C and Mosler, K. (2009): “Constructing Indices of Multivariate Po-larization”, Journal of Economic Inequality, 7, 435-460.
Konya, L. (2008): “What Does the Human Development Index Tell Us about Convergence?” Applied Econometrics and International Development, 8, 19-40.
Lingarde, S. and Tylecote, A. (1999): “Resource-Rich Countries’ Success and Failure in Technological Ascent, 1870-1970: the Nordic Countries versus Argentina, Uruguay and Brazil”, Journal of European Economic History, 28 (1), 77-112.
Martínez, R. (2012): “Inequality and the New Human Development Index”, Ap-plied Economics Letters, 19, 533-35.
Maasoumi, E. (1986): “The Measurement and Decomposition of Multidimen-sional Inequality”, Econometrica, 54, 991-997.
Maasoumi, E. and Nickelsburg, G. (1988):”Multivariate Measures of Well-Being and an Analysis of Inequality in the Michigan Data”, Journal of Business and Economic Statistics, 6, 327-334.
Matus, M. (2004): “Trayectorias divergentes de la desigualdad en América Latina”, Instituciones y Desarrollo, 16, 195-247.
McGillivray, M. and Pillarisetti, J. R. (2004): “International Inequality in Well-Being”, Journal of International Development, 16, 563-574.
McGillivray, M. and Markova, N. (2010): “Global Inequality in Wellbeing Dimen-sions”, Journal of Development Studies, 46, 371-378.
McLean, I. W. (2004): “Australian Economic Growth in Historical Perspective”, Economic Record, 250, 330-345.
Milanovic, B. (2005): Worlds Apart: Measuring International and Global In-equality, Princeton University Press, Princeton and Oxford.
Noorbakhsh, F. (2006): “International Convergence or Higher Inequality in Hu-man Development? Evidence for 1975-2002”, WIDER Research Paper No. 2006/15.
Piketty, T. (2014): El capital en el siglo XXI, Fondo de Cultura Económica de España, Madrid.
Ravallion, M. (2014): “Income Inequality in the Developing World”, Science, 344, 851-855.
Sagar, A. D. and Najam, A. (1998): The Human Development Index: A Critical Review, Ecological Economics, 25 (3), 249-264.
Sen, A. K. (1984): Resources, Values and Development, Basil Blackwell, Oxford.Sen, A. K. (1985): Commodities and Capabilities, North-Holland, Amsterdam.Sen, A. K. (1988): “The Concept of Development”. In Chenery, H. and Srini-
vasan, T. (eds.): Handbook of Development Economics, Elsevier, Amsterdam.
159
Revista de economía mundial 45, 2017, 143-160
evolution of inequality in latin ameRica (1980-2014): a multidimensional appRoach Beyond income
Sen, A. K. (1989): “Development as Capabilities Expansion”, Journal of Devel-opment Planning, 19, 41-58.
Sen, A. K. (1999): Development as Freedom, Oxford University Press, Oxford.Solimano, A. (2016a): “Is inequality really declining in Latin America? Evidence
on income, wealth and the social Structure” Revista de Economía Mundial, 43, 69-92.
Solimano, A. (2016b): Global Capitalism at Disarray. Inequality, Debt and Aus-terity. Oxford University Press.
Stiglitz, J.E., Sen, A. and Fitoussi, J. (2009): Report by the Commission on the Measurement of Economic Performance and Social Progress, Paris.
Streeten, P. (1994): “Human development: means and ends”, American Eco-nomic Review, 84, 232–237.
UNDP (1990): Human Development Report 1990: Concept and Measurement of Human Development, Oxford University Press, Nueva York.
UNDP (2015): Human Development report 2015: Work for Human Develop-ment, Oxford University Press, New York.
World Bank (2004): Inequality in Latin America and the Caribbean: Breaking with History, Washington, D.C.
World Bank (2015): World Development Indicators database, Washington, D.C. http://data.worldbank.org. Accessed 1 December 2015.
Yáñez, C. (2000): “Atraso y desigualdad. La perspectiva de la historia económi-ca”, Instituciones y Desarrollo, 6, 47-78.