Embed Size (px)
Citation preview

International Review of Research in Open and Distributed Learning
Volume 17, Number 2
February – 2016
E-learning in Mongolian Higher Education
Suvdmaa Tuul, Otgontugs Banzragch, and Tsogzolmaa Saizmaa National University of Mongolia
Abstract This paper reviews the e-learning course development in selected universities of Mongolia and
attempts to classify the e-learning programs that are in practice at the tertiary education level in the
country. The given paper uses both secondary and primary sources.
The authors determined what factors influence e-learning type classification and how time consuming
is e-learning in course development stage in comparison to that of face-to-face learning? Methods
such as computation using threshold values, k-means clustering, and comparison of means using
paired t tests were used. Furthermore, comparison of means was used to validate the factors.
In conclusion, authors deliver recommendations based on analysis lessons learned for further
development. This research has practical implications for higher education managers to make
informed decisions.
Keywords: e-learning, Mongolia, higher education, k-means clustering, means comparison
Introduction Higher education has become increasingly important on the national agenda and has undergone
profound mutations and reforms worldwide over the past decades, as portrayed in the “Organisation
for Economic Co-operation and Development (OECD) review of tertiary education policies”
(Organisation for Economic Co-operation and Development, 2008). There is a substantial
market for higher education in Mongolia. In the 2014 to 2015 academic year, 13,360 lecturers and
administrators provided service to 178,295 students out of which 19,065 were master’s students and
3,391 were PhD students at 101 higher educational institutions (Ministry of Education and Science,
2015). Mongolia ranks seventh internationally in the share of GDP (9.0%) allocated to education, and
its education law guarantees that at least 20% of the government budget is spent on education

E-learning in Mongolian Higher Education Tuul, Banzragch, and Saizmaa
182
(Government of Mongolia, 2006). However Mongolian higher education receives only 12% of that
amount (Asian Development Bank Institute, 2010).
Global trends in higher education include the expansion of higher education systems, wider
participation, emergence of new players, more diverse profiles of institutions, programmes and
students, continuing advancement and rapid integration of new technology, greater
internationalisation, increasing pressures on costs and new modes of financing, growing emphasis on
market forces (competition and signalling mechanisms), new modes of governance stressing
performance, and quality and accountability (Tremblay, Lalancette, & Roseveare, 2012).
E-learning is a global phonemon over the last decades in higher education. Likewise, E-learning
initiatives can be a cost-effective method of delivering higher education in Mongolia with its vast
territory and sparse population. There were numerous e-learning materials developed over the last
couple of years. However, there is a limited research on e-learning in Mongolia.
Mongolia has adequate infrastructure to develop e-learning. This achievement is a result of the E-
Mongolia National Program 2005–2012 which aimed to become one of the most Information and
Communications Technology (ICT) developed 10 countries in the Asia pacific region. Out of 144
nations, Mongolia ranked 61st in ICT use, 83rd in higher education and training, and 80th in Internet
access in schools in the 2014–2015 Global Competitiveness Report (World Economic Forum, 2015). A
study by the International Trade Union (ITU) and the United Nations Educational, Scientific, and
Cultural Organization (UNESCO; 2013) indicates that in Mongolia, 16.4% of population use internet
and 16% of households have an Internet connection. In 2012, Mongolia ranked per 100 inhabitants,
100th of 183 counties in fixed broadband penetration, 61st of 128 countries in mobile broadband
penetration (ITU & NESCO, 2013). Furthermore, Mongolia ranked 92nd out of 166 economies
worldwide in the information development index in 2013 (ITU, 2014).
Research Methodology The study puts emphasis on the developmental stage of an e-learning course. This study is carried out
to investigate the following research questions:
1. What types of e-learning exists in Mongolia, and how can we classify them?
2. What factors influence the e-learning classification? What has been the motivation or
incentive to develop e-learning programs at universities?
3. How labor intensive is e-learning in comparison to face-to-face learning in the
developmental stage? In order to measure and compare we have broken down the task into 2
questions. How much time do faculty members dedicate to e-course development? How much
is it in comparison to face-to-face learning?
4. In what ways has the legislative and regulatory framework coordinated e-learning?
A mixed method research design (Creswell, 2012) including the collection and quantitative analysis of
questionnaire data followed by qualitative analysis of focus group interview data was used to address
the research questions. The study utilized purposeful sampling when selecting the population.
E-learning in Mongolian Higher Education Tuul, Banzragch, and Saizmaa
183
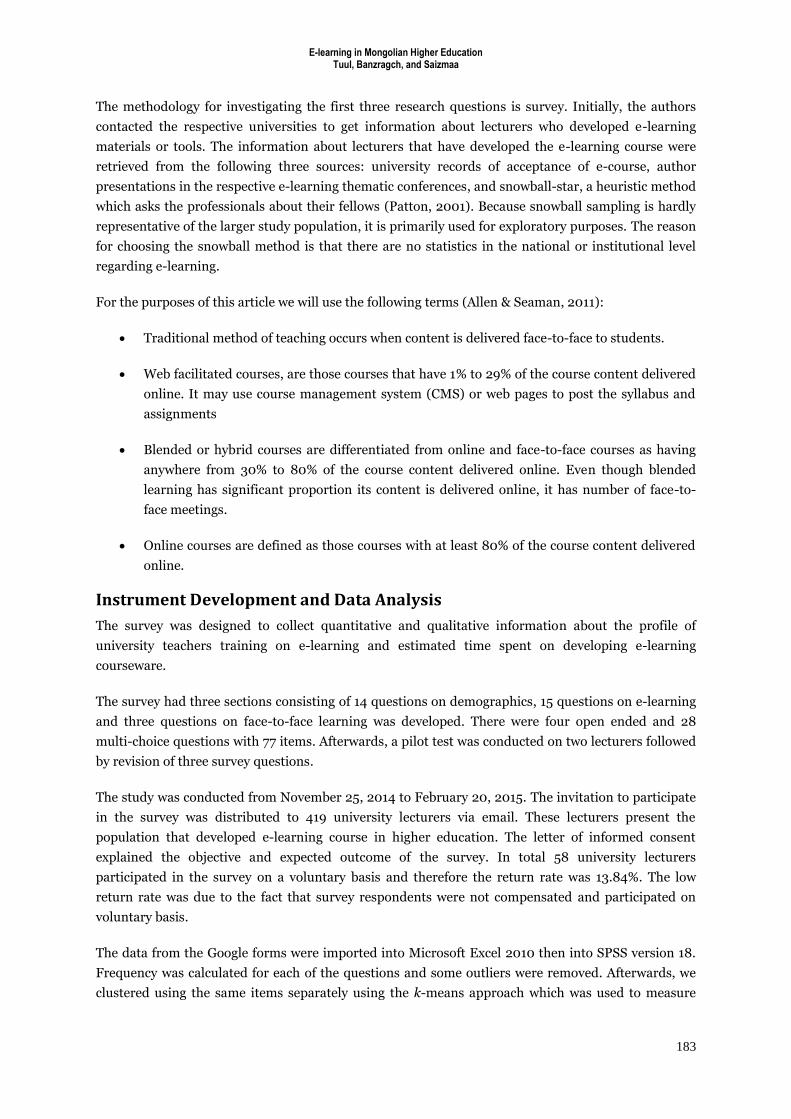
The methodology for investigating the first three research questions is survey. Initially, the authors
contacted the respective universities to get information about lecturers who developed e-learning
materials or tools. The information about lecturers that have developed the e-learning course were
retrieved from the following three sources: university records of acceptance of e-course, author
presentations in the respective e-learning thematic conferences, and snowball-star, a heuristic method
which asks the professionals about their fellows (Patton, 2001). Because snowball sampling is hardly
representative of the larger study population, it is primarily used for exploratory purposes. The reason
for choosing the snowball method is that there are no statistics in the national or institutional level
regarding e-learning.
For the purposes of this article we will use the following terms (Allen & Seaman, 2011):
Traditional method of teaching occurs when content is delivered face-to-face to students.
Web facilitated courses, are those courses that have 1% to 29% of the course content delivered
online. It may use course management system (CMS) or web pages to post the syllabus and
assignments
Blended or hybrid courses are differentiated from online and face-to-face courses as having
anywhere from 30% to 80% of the course content delivered online. Even though blended
learning has significant proportion its content is delivered online, it has number of face-to-
face meetings.
Online courses are defined as those courses with at least 80% of the course content delivered
online.
Instrument Development and Data Analysis
The survey was designed to collect quantitative and qualitative information about the profile of
university teachers training on e-learning and estimated time spent on developing e-learning
courseware.
The survey had three sections consisting of 14 questions on demographics, 15 questions on e-learning
and three questions on face-to-face learning was developed. There were four open ended and 28
multi-choice questions with 77 items. Afterwards, a pilot test was conducted on two lecturers followed
by revision of three survey questions.
The study was conducted from November 25, 2014 to February 20, 2015. The invitation to participate
in the survey was distributed to 419 university lecturers via email. These lecturers present the
population that developed e-learning course in higher education. The letter of informed consent
explained the objective and expected outcome of the survey. In total 58 university lecturers
participated in the survey on a voluntary basis and therefore the return rate was 13.84%. The low
return rate was due to the fact that survey respondents were not compensated and participated on
voluntary basis.
The data from the Google forms were imported into Microsoft Excel 2010 then into SPSS version 18.
Frequency was calculated for each of the questions and some outliers were removed. Afterwards, we
clustered using the same items separately using the k-means approach which was used to measure
E-learning in Mongolian Higher Education Tuul, Banzragch, and Saizmaa
184
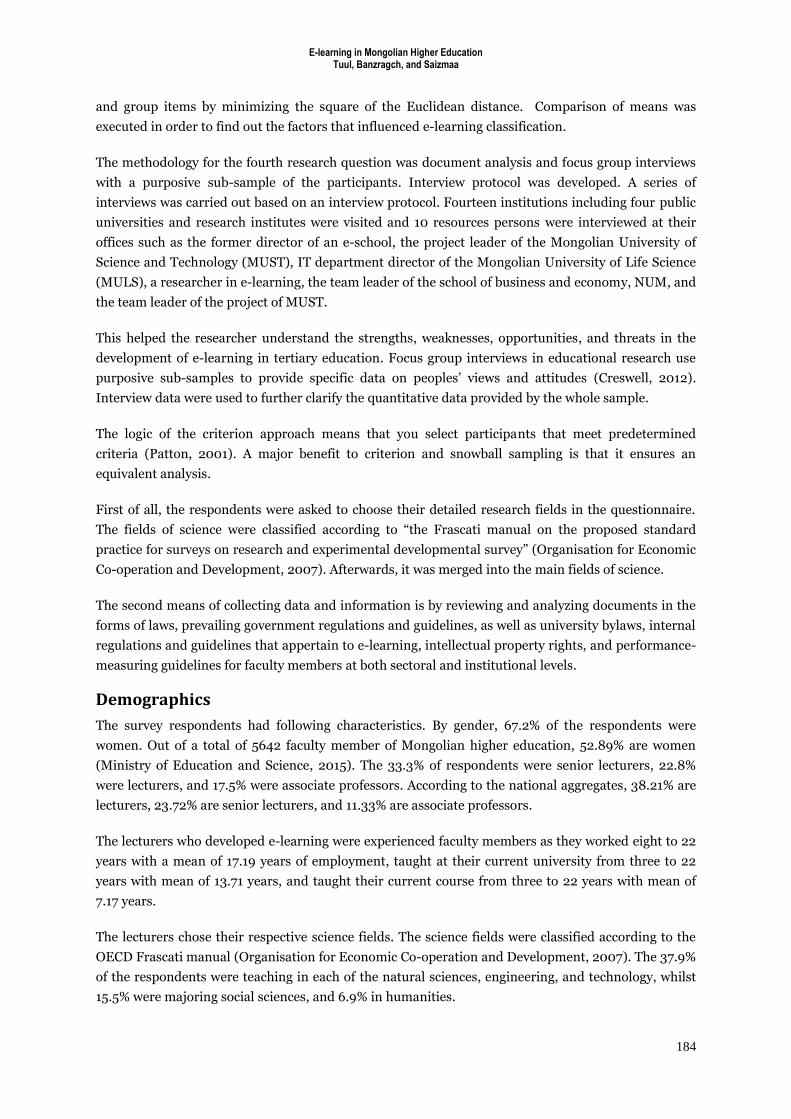
and group items by minimizing the square of the Euclidean distance. Comparison of means was
executed in order to find out the factors that influenced e-learning classification.
The methodology for the fourth research question was document analysis and focus group interviews
with a purposive sub-sample of the participants. Interview protocol was developed. A series of
interviews was carried out based on an interview protocol. Fourteen institutions including four public
universities and research institutes were visited and 10 resources persons were interviewed at their
offices such as the former director of an e-school, the project leader of the Mongolian University of
Science and Technology (MUST), IT department director of the Mongolian University of Life Science
(MULS), a researcher in e-learning, the team leader of the school of business and economy, NUM, and
the team leader of the project of MUST.
This helped the researcher understand the strengths, weaknesses, opportunities, and threats in the
development of e-learning in tertiary education. Focus group interviews in educational research use
purposive sub-samples to provide specific data on peoples’ views and attitudes (Creswell, 2012).
Interview data were used to further clarify the quantitative data provided by the whole sample.
The logic of the criterion approach means that you select participants that meet predetermined
criteria (Patton, 2001). A major benefit to criterion and snowball sampling is that it ensures an
equivalent analysis.
First of all, the respondents were asked to choose their detailed research fields in the questionnaire.
The fields of science were classified according to “the Frascati manual on the proposed standard
practice for surveys on research and experimental developmental survey” (Organisation for Economic
Co-operation and Development, 2007). Afterwards, it was merged into the main fields of science.
The second means of collecting data and information is by reviewing and analyzing documents in the
forms of laws, prevailing government regulations and guidelines, as well as university bylaws, internal
regulations and guidelines that appertain to e-learning, intellectual property rights, and performance-
measuring guidelines for faculty members at both sectoral and institutional levels.
Demographics
The survey respondents had following characteristics. By gender, 67.2% of the respondents were
women. Out of a total of 5642 faculty member of Mongolian higher education, 52.89% are women
(Ministry of Education and Science, 2015). The 33.3% of respondents were senior lecturers, 22.8%
were lecturers, and 17.5% were associate professors. According to the national aggregates, 38.21% are
lecturers, 23.72% are senior lecturers, and 11.33% are associate professors.
The lecturers who developed e-learning were experienced faculty members as they worked eight to 22
years with a mean of 17.19 years of employment, taught at their current university from three to 22
years with mean of 13.71 years, and taught their current course from three to 22 years with mean of
7.17 years.
The lecturers chose their respective science fields. The science fields were classified according to the
OECD Frascati manual (Organisation for Economic Co-operation and Development, 2007). The 37.9%
of the respondents were teaching in each of the natural sciences, engineering, and technology, whilst
15.5% were majoring social sciences, and 6.9% in humanities.

E-learning in Mongolian Higher Education Tuul, Banzragch, and Saizmaa
185
A competency is the ability to meet individual and social demands successfully, or to carry out a task
or activity. The ability to use knowledge and information interactively is one of the key competences in
the twenty-first century (Organisation for Economic Co-operation and Development, 2002). Likewise,
one of the key competencies of university lecturers is the ability to use new technology. Faculty
development plays an important role in building this competency. The majority of respondents
(74.1%) said they participated in e-learning training: 34.5% of respondents were involved in one to
three days training, 27.5% were trained four to 10 days, 6.9% were trained up to one month, and only
5.1% were trained more than one semester. Funding for training of 60.3% of respondents was
provided by the university or faculty. Lecturers have interest in e-learning as 8.6% of them used
private funding. The fact that a quarter or 25.9% of respondents were not involved in training and that
36.2% of respondents said they do not use any learning theory to develop e-learning, highlights the
importance of faculty re-training on e-learning.
The question 11 asked the respondents about Learning Management System (LMS) that they use at
universities. In total, 57.9% of respondents said their universities have locally developed LMS in the
Mongolian language, 17.5% informed that they use other systems such as MOODLE or MOOCs, 10.5%
notified that LMS is under construction, and 14% stated that their universities have no LMS in place.
Results The survey instrument and interview presented following results.
Why the lecturers develop e-learning?
The majority of respondents said the purpose to develop e-learning was to direct knowledge building
(37.9%), provide students with information (36.2%), and engage in discussion or e-forums (13.8%).
Some respondents said they applied cognitivist (10.3%), behaviorist (6.9%), and constructivist (3.4)
approaches to develop e-learning.
The Classification of E-learning
In our research we considered that one semester consists of 16 weeks. To classify e-learning types, we
choose Question 24 which asked the respondents how comprehensive is the e-learning that they have
developed? The question is composed of 11 components such as (a) curriculum, (b) lecture, (c)
seminar and lab works, (d) self-check quiz, (e) mid-term exam and assignments, (f) course book and
other supporting printed materials, (g) supporting photo gallery, audio and video, (h) glossary, (i)
research database, (j) past exams, (k) guide and help for e-learners. First of all, we asked the
respondents to identify the number of developed units in intervals such as 1, 2, 3-5, 6-10, 11-15, equal
or more than 16 units or 1 semester. Afterwards, authors decoded range intervals into scale to conduct
classification analysis, compare means and regression. The scaled values are 1, 2, 4, 8, 13, and 16
respectively.
Initially, integrated_e_learning value is created after totaling and averaging scaled values of the first
six components. We summed the number of items of the five components such as lecture, seminar
and lab work, self-assessment quiz, mid-term exam and assignments, and course book and other
supporting printed materials. We excluded curriculum for further analysis as every course had this
component. Components such as a supporting photo gallery, and audio and video material; a glossary;

E-learning in Mongolian Higher Education Tuul, Banzragch, and Saizmaa
186
a research database; past exams; a guide and help for e-learners were excluded from further
computation as they were too detailed, received few responses, and were course specific. Then, an
imputed variable called E-learning Class was created. In order to classify the courses, three
approaches were applied such as computation using threshold values (Allen & Seaman 2011), k-means
with one variable and k-means with five variables.
First, we classified the measurements using threshold values by Allen and Seaman (2011). We
consider only 16 weeks being full e-learning courses for a semester or 100%. The classification results
are presented on Table 1.
The second method used to group was k-means clustering. The cluster number was set to three.
Afterwards, it classified the 58 measurements into three types such as Web facilitated, blended or
hybrid, and online. It is interesting that six responses fall into an interval between [80; 82,5], whereas
80 is a bottom line to online learning. Therefore, we can conclude that maybe we should narrow the
online learning bottom line to 85 in this case.
The third method used to explore classification was the k-means with five independent variables. We
found that 22.4% of the courses are Web facilitated courses, 74.1% are blended courses, and only 3.4%
meets the requirement of online courses.
Table 1
Comparative Classification of E-learning
Method
Computation using threshold values
k-means with one variable k-means with five independent variables
Groups n Mean n Mean n Cluster centers Web facilitated
12 9.06 12 9.06 13 (12.5; 6.25; 18.75; 12.5; 6.25)
Blended 15 63.25 20 67.87 43 (100; 87.5; 87.5; 75; 81.25) Online 31 96.04 26 98.79 2 (100; 56.25; 100; 100; 100) Conclusion Not applicable as
it uses simple threshold numbers.
Not applicable as we totaled and averaged. This may have caused blurring.
Applicable as the methodology is reasonable. Furthermore, cluster results meet the interview.
Note. Computation using threshold values by Allen and Seaman (2011). n = the number of courses.
The latter approach, k-means clustering with five independent variables, is applicable as the
methodology is reasonable and cluster results matched with the interview results. Therefore, we
accepted this cluster.
Factors Affecting E-learning Classification
Next, we tried to determine factors that influence the e-learning classification. In order to determine
which factors affect e-learning classification we used means comparison. Therefore, e-learning
classification was coded into 1 (Web facilitated), 2 (blended) and 3 (online).

E-learning in Mongolian Higher Education Tuul, Banzragch, and Saizmaa
187
In the third method, where we used k-means with five independent variables, the factors displayed in
Table 2 have influence on e-learning classification. The significance levels were achieved by using
analysis of variance (ANOVA) tests.
Table 2
Factors Affecting E-learning Classification
Factor F-value df p-value Position 2.44 6 .037
LMS 2.75 3 .050 Master degree courses 3.30 2 .049 Team composition 2.68 4 .041 Expected lifetime of e-
course 3.15 5 .015
Marking down assignments in face-to-face learning
2.66 4 .045
Senior lecturers and lecturers, who have the highest workload, had the highest tendency to develop e-
learning. Professors, associate professors, and department heads had an average tendency to develop
e-learning. Assistant lecturers and researchers (other) had a lower tendency to develop e-learning.
Lecturers of the universities with in-house developed LMS have a tendency to develop e-learning.
Some Details of statistical analysis are shown in Annex 1.
The report on masters degree courses showed an upward trend. As the course specialization level
increases, the tendency to develop e-course increases. The more specialized the course, the greater the
tendency was to shift to e-learning.
Team composition was essential in the development of e-learning. Team leadership was significant.
The expected lifetime of e-learning reflects in positive way. The study showed that e-learning was used
for an average of four to five years with a mean of 1.81.
We conducted regression analysis, as the mean of “master degree courses” showed trend. The
following relationship was found as a result of regression. The constant was 1.095 and unstandardized
coefficient was 0.26 (see Equation 1). This means that as master’s course subjects shifted from basic to
professional to specialized, the lecturer’s motivation or willingness to incorporate e-learning increased
by 26%.
Image 1: regression analysis
residual is
tion,specializa coursemaster of level theis x
learning,-e develop to tendency y the where
0.16=R;+0.26x+1.095=y 2

E-learning in Mongolian Higher Education Tuul, Banzragch, and Saizmaa
188
Table 3
Regression Analysis Coefficientsa
Model Unstandardize
d Coefficients
Standardized
Coefficients
t-
statistic
P
value B
Std.
Error Beta
(Constant) 1.095 .264 4.141 .000
For which educational level do
you use e-learning? [master]
.262 .101 .406 2.588 .014
Note. aDependent Variable: Cluster Number of Case. bPredictors: (Constant), 19. For which
educational level do you use e-learning? [master]
Table 4
Results of the ANOVAa test
Model
Sum of
Squares df
Mean
Square
F-
statistic p-value
Regression 1.440 1 1.440 6.700 .014b
Residual 7.310 34 .215
Total 8.750 35
Note. aDependent Variable: Cluster Number of Case. bPredictors: (Constant), 19. For
which educational level do you use e-learning? [master]
Only masters by coursework are practiced in Mongolia. There is scarce financial assistantship for
graduate students and majority of them are part time. The family and work commitments have to be
addressed alongside studies. Therefore, the e-learning programs are in high demand for adults to
overcome time and space limitations.
This is in line with survey findings where 19 tertiary education institutions from 13 countries
participated (Center for Educational Research and Innovation, 2005). The survey concluded that
whole award programs with a relevant online presence were more common at the postgraduate level
to meet the demand of experienced learners wishing to combine work, family, and study.
E-course Development Time vs. preparation to Face-to-Face Learning
In order to calculate the time devoted to each of the activities, the mean values were calculated.
For e-learning, the most time consuming activities were the development of student e-learning
manuals (12.92 days), development of trial versions of e-courses (12.49 days), and improvement based
on trial results (12.19 days). On average, lecturers spent 295.5 days to develop an e-course. This is

E-learning in Mongolian Higher Education Tuul, Banzragch, and Saizmaa
189
longer than that of the design (one to two months) and production (two to six months) of MOOCs
(Hochschulrektorenkonferenz, June 2014).
In face-to-face learning, the most time consuming activities were curriculum development (2.5 days)
and developing final exams (2.5 days). On average, lecturers spent 90.35 days for face-to-face
teaching.
The Interview and Document Analysis Results
Document analysis revealed that there is lack of policy and regulation. Article 8.1 of the Law on
Education of Mongolia states that formal education can be in day, evening, and external forms. The
universities conduct distance learning using this article. The only document in force is the Policy on
ICT in Education Sector 2012–2016 approved by order A24 of the Minister of Education, Culture and
Science on September 20, 2012. In the framework of the second objective to integrate learning with
ICTs, the following activities are planned: develop standard requirements for the e-learning courses
from teaching and ICT perspectives; establish independent organization in charge of e-learning,
teaching, and learning; adopt creative commons license and enable open source courseware; policy
support for higher education institutions that are developing open courses, enabling access to open
course wares, developing distance learning infrastructure for common use; and introduce mobile
learning. The policy has well developed monitoring indicators, where 10 out of 50 are relevant to the
International Standard Classification on Education (ISCED) level 6 education.
Documents such as ICT Vision up to 2010, National Program on Distance Education 2002–2010,
The Introduction of ICT into Education Sector up to 2010, E-Mongolia 2005–2012 have expired. The
legislative framework needs to coordinate the market demand and global trend. The clear and concise
recognition of e-learning, its quality assurance is essential to new regulation. As outlined in a
comparative study of quality assurance in Asian distance education, Mongolia needs to set quality
assurance criteria for both face-to-face and distance learning institutions (Jung, Wong, Li, Sanjaa, &
Belawati, 2011).
The interview revealed lecturers’ assessment, future direction, thoughts, and concerns about e-
learning.
One lecturer described it that “The whole distance learning programs rely on single provision from law
on education. To introduce e-learning with credits in higher education institutions, government shall
issue detailed regulation.” [D4]
One lecturer revealed that “my master students work at remote mining site still can attend the class,
do the lab work and submit assignments. This is a huge benefit for the energy engineers.” [D6]
A team leader of the project from Mongolian university of science and technology (MUST) informed
that some university lecturers felt sensitive over their intellectual property rights. To deal with it
MUST organized series of workshops on e-learning and intellectual property rights and issued
recommendations on adoption of creative commons. [D5] Authors believe that faculty members
hiring guide and fixed term employment contract shall reflect intellectual property rights of
universities.

E-learning in Mongolian Higher Education Tuul, Banzragch, and Saizmaa
190
“The e-learning institute said that ‘because we engineering university, we used mainly internal
resources. Lecturers provided the curriculum, supplied materials and supervised execution of
students, who did technical work for the e-learning. On the other hand, students did some technical
assignments by working on e-learning projects” [D1]
One manager said that “Leadership is essential for e-learning development. It is win-win situation
where faculty members, students and university benefitted from this initiative” [D2].
MULS said that development of e-learning serves as one of the performance indicators for the faculty
members.
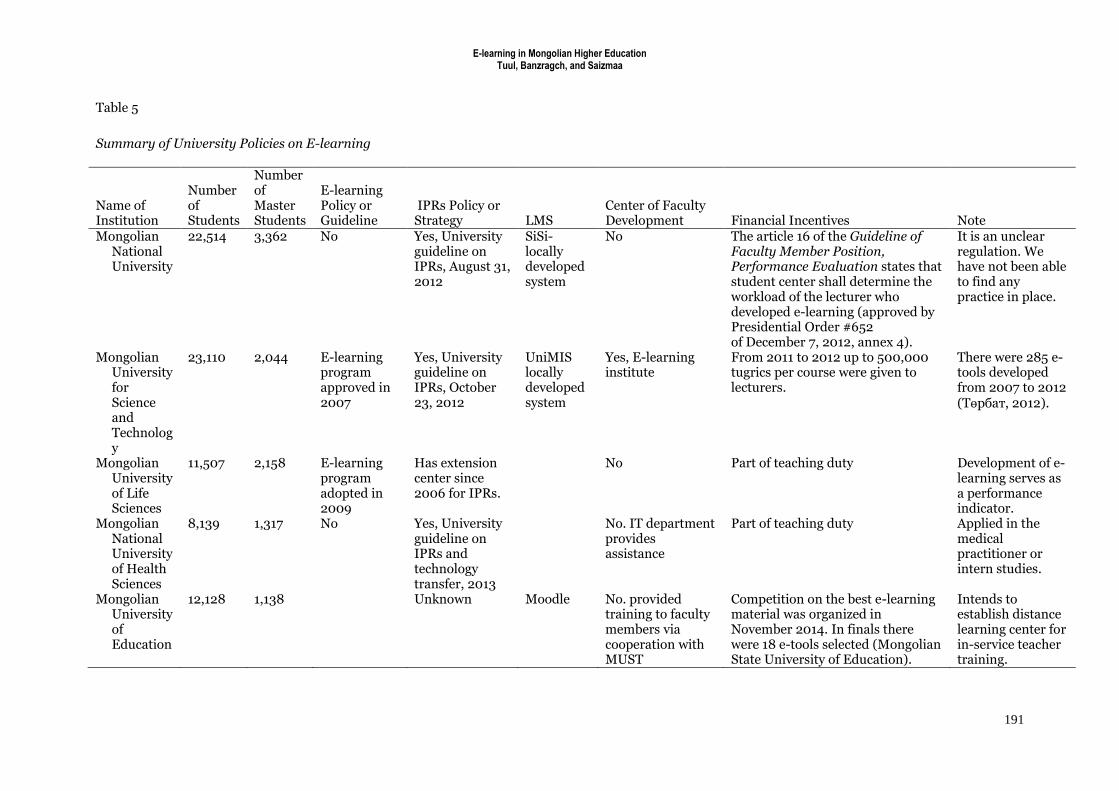
Table 5 presents a summary of university policies on e-learning.
E-learning in Mongolian Higher Education Tuul, Banzragch, and Saizmaa
191
Table 5
Summary of University Policies on E-learning
Name of Institution
Number of Students
Number of Master Students
E-learning Policy or Guideline
IPRs Policy or Strategy LMS
Center of Faculty Development Financial Incentives Note
Mongolian National University
22,514 3,362 No Yes, University guideline on IPRs, August 31, 2012
SiSi- locally developed system
No The article 16 of the Guideline of Faculty Member Position, Performance Evaluation states that student center shall determine the workload of the lecturer who developed e-learning (approved by Presidential Order #652 of December 7, 2012, annex 4).
It is an unclear regulation. We have not been able to find any practice in place.
Mongolian University for Science and Technology
23,110 2,044 E-learning program approved in 2007
Yes, University guideline on IPRs, October 23, 2012
UniMIS locally developed system
Yes, E-learning institute
From 2011 to 2012 up to 500,000 tugrics per course were given to lecturers.
There were 285 e-tools developed from 2007 to 2012 (Төрбат, 2012).
Mongolian University of Life Sciences
11,507 2,158 E-learning program adopted in 2009
Has extension center since 2006 for IPRs.
No Part of teaching duty Development of e-learning serves as a performance indicator.
Mongolian National University of Health Sciences
8,139 1,317 No Yes, University guideline on IPRs and technology transfer, 2013
No. IT department provides assistance
Part of teaching duty Applied in the medical practitioner or intern studies.
Mongolian University of Education
12,128 1,138 Unknown Moodle No. provided training to faculty members via cooperation with MUST
Competition on the best e-learning material was organized in November 2014. In finals there were 18 e-tools selected (Mongolian State University of Education).
Intends to establish distance learning center for in-service teacher training.

E-learning in Mongolian Higher Education Tuul, Banzragch, and Saizmaa
192
Conclusion E-learning in higher education in Mongolia is in its early stage of development. We determined what
factors influence the e-learning type classification and how time consuming e-learning is in the course
development stage in comparison to that of face-to-face learning?
Three approaches such as computation using threshold values (Allen & Seaman, 2011), k-means
clustering with one variable and k-means clustering with five independent variables were used to
classify courses. The latter approach is applicable as the methodology is reasonable and cluster results
matched with the results of the interview.
We attempted to classify them using k-means with five independent variables and found that 22.4% of
the courses are Web facilitated courses, 74.1% are blended courses, and only 3.4% meet the
requirement of online courses.
A study limitation is that key stakeholders such as students have not participated in the study. The
study represents a snapshot of the higher education sector. The differences between universities and
fields of science were explored. However, due to the small sample size it did not show a significant
difference. It could be subject to future research.
Afterwards, we tried to determine the factors that influence e-learning classification. The variables
such as lecturers’ position, LMS, master’s degree courses out of all levels of tertiary education, team
leadership, expected lifetime of e-course and marking down assignments in face-to-face learning
showed significant influence to e-learning classification. Out of the variables, only masters’s degree
course level proved to be significant with a coefficient of 0.26 and a constant of 1.095. This means that
as master’s course subjects shifted from basic, professional to specialized, the lecturer’s motivation or
willingness increased by 26%.
The intellectual property rights of universities shall be enforced. At a national level, there shall be a
clear and concise article on recognition of e-learning as a form of learning and to ensure e-learning
degree acceptance in the law on higher education. The legislative framework needs to coordinate the
market demand and global trend and shall be enforced in sectoral and institutional levels. The quality
accreditation is an essential step for future development.
At an institutional level, the majority of e-courses were initiated by lecturers. Only very few
universities have centers for teaching excellence or e-learning institutes that can provide training and
hands-on assistance.
References Asian Development Bank Institute. (2010). Economic shocks and higher education reform: People's
Republic of China, Mongolia, and Viet Nam. Mahwah, New Jersey; London: Lawrence
Erlbaum.
Allen, I. E., & Seaman, J. (2011). Going the distance: Online education in the United States, 2011.
Wellesley, MA: Babson Survey Research Group.

E-learning in Mongolian Higher Education Tuul, Banzragch, and Saizmaa
193
Center for Educational Research and Innovation (CERI). (2005). Elearning in tertiary education:
Where do we stand? , OECD publishing.
Creswell, J. W. (2012). Educational research: Planning, conducting and evaluating quantitative and
qualitative research (4th ed.). Boston, MA: Pearson Education.
Government of Mongolia, (2006). The State budget, Retrieved from http://www.legalinfo.mn
Hochschulrektorenkonferenz. (2014, June). The potential and problems of MOOCs: MOOCs in the
context of digital teaching. Bonn, Germany: German Rectors' Conference.
International Trade Union. (2014). Measuring the information society report. Geneva Switzerland:
ITU.
International Trade Union & the United Nations Educational, Scientific & Cultural Organization.
(Sep., 2013). The state of broadband 2013: Universalizing broadband. Geneva, Switzerland:
The Broadband Commission for Digital Development.
Jung, I., Wong, T. M., Li, C., Sanjaa, B., & Belawati, T. (2011). Quality assurance in Asian distance
education: Diverse approaches and common culture. The International Review of Research in
Open and Distributed Learning, 12(6), 63-83. Retrieved from
http://www.irrodl.org/index.php/irrodl/article/view/991/1953.
Ministry of education and science. (2015, February 1). Statistical bulletin of education and science
sector. Retrieved from http://www.meds.gov.mn/HigherSta1415.
Mongolian State University of Education. (n.d.). Retrieved on January 3, 2015, from
http://msue.edu.mn/index.php?module=menu&cmd=content&id=1274&menu_id=121.
Organisation for Economic Co-operation and Development. (2002). Definition and selection of key
competencies: theoritical and conceptual foundations. Neuchatel: Swiss Federation Statistical
office.
Organisation for Economic Co-operation and Development. (2007). Revised field of science and
technology (fos) classification in the Frascati manual
(DSTI/EAS/STP/NESTI(2006)19/FINAL). OECD publishing .
Organisation for Economic Co-operation and Development. (2008). Tertiary education for knowledge
society. Paris: OECD Publishing.
Patton, M. Q. (2001). Qualitative evaluation and research methods (3 ed.). Newbury Park, CA: Sage.
Төрбат, P. (2012). ШУТИС-ийн E-Нээлттэй сургуулийн оюуны өмчийн зохицуулалт. ШУТҮЗ:
Эрдэм шинжилгээний байгууллагын оюуны өмчийн асуудлууд, ШУТИС-ийн хэвлэлийн
газар.
Tremblay, K., Lalancette, D., & Roseveare, D. (2012). Assessment of higher education learning
outcomes: Feasibility study report volume 1. Location: OECD.

E-learning in Mongolian Higher Education Tuul, Banzragch, and Saizmaa
194
World Economic Forum. (2015). The global competitiveness report 2014–2015. Geneva, Switzerland:
Publisher.

E-learning in Mongolian Higher Education Tuul, Banzragch, and Saizmaa
195
Annex 1: Details of Statistical Analysis
Table 2.1
Position’s Influence to e-Learning Classification
Cluster Number of Case
4. Position Mean N Std. Deviation
Head of department 1.60 5 .548 Professor 1.86 7 .690 Associate professor 1.70 10 .483 Senior lecturer 1.95 20 .394 Lecturer 1.92 13 .277 Associate Lecturer 1.00 1 . Other 1.00 2 .000 Total 1.81 58 .476
Lecturers of the universities have in house developed LMS have tendency to develop e-learning.
Table 2.2
Having LMS has Influence to e-Learning Classification
Cluster Number of Case
11. Does your university have learning management system?
Mean N Std. Deviation
Under development 1.33 6 .516 Local or Mongolian developed 1.82 33 .465 University has no LMS 2.00 8 .535 Other 1.90 10 .316 Total 1.81 57 .480
The report on Master degree courses showed upward trend. As the course specialization level
increases, the tendency to develop e-course increases. The more specialized is the course, the tendency
to shift e-learning increases.
Table 2.3
Master’s Degree Course has Influence to e-Learning Classification
Cluster Number of Case
19. For which educational level do you use e-learning? [master]
Mean N Std. Deviation
General academic 1.33 6 .516

E-learning in Mongolian Higher Education Tuul, Banzragch, and Saizmaa
196
Professional 1.67 6 .516 Special 1.88 24 .448 Total 1.75 36 .500
Team composition was essential in the development of e-learning. The team leadership was
significant.
Table 2.4
Team Work Influence to e-Learning Classification
Cluster Number of Case
23. Would you introduce your team? Mean N Std.
Deviation
No 1.78 41 .475
1 person 1.86 14 .363
3 people 3.00 1 .
4 people 2.00 1 .
More than 5 people 1.00 1 .
Total 1.81 58 .476
Expected lifetime of e-learning reflects in positive way. Study shows that e-learning will be used for
average of 4-5 years with the total mean of 1.81.
Table 2.5
The Expected Number of Years to Use e-Learning Material
Cluster Number of Case
27. What is the lifetime of the e-
learning?
Mean N Std.
Deviation
1-2 years 1.29 7 .488
2-3 years 1.75 12 .452
4-5 years 1.96 23 .475
6-7 years 2.00 6 .000
8-9 years 1.60 5 .548
More than 10 years 2.00 4 .000
Total 1.81 57 .480
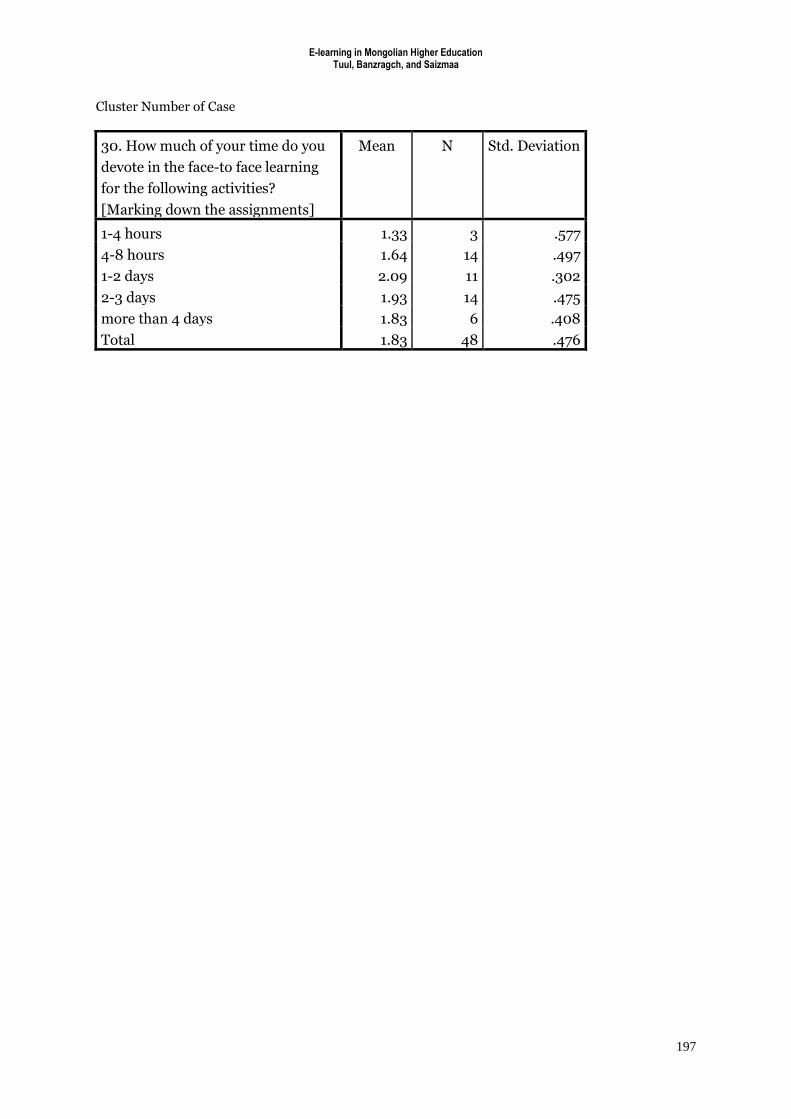
Table 2.6
Marking Down Assignment in Traditional Learning has Influence to e-Learning
Classification
E-learning in Mongolian Higher Education Tuul, Banzragch, and Saizmaa
197
Cluster Number of Case
30. How much of your time do you
devote in the face-to face learning
for the following activities?
[Marking down the assignments]
Mean N Std. Deviation
1-4 hours 1.33 3 .577
4-8 hours 1.64 14 .497
1-2 days 2.09 11 .302
2-3 days 1.93 14 .475
more than 4 days 1.83 6 .408
Total 1.83 48 .476