Embed Size (px)
Citation preview
E&P Forum
Quantitative Risk Assessment Data Directory Report No 11.8/250 1996

Introduction E&P Forum QRA Datasheet Directory Rev 0
13/06/2003 INTROD.DOC Page 1
INTRODUCTION
Introduction E&P Forum QRA Datasheet Directory Rev 0
13/06/2003 INTROD.DOC Page 2
The E&P Forum’s “Guidelines for the Development and Application of Health, Safety and Environmental Management Systems” (HSEMS) [1], identifies “Evaluation and Risk Management” as a key element of an HSE management system. The use of formal risk assessment in achieving the goal-setting objectives of this element is becoming widely accepted in E&P companies and an essential framework in recent legislative acts. Experience shows that the application of risk assessment is important to both improved plant and system integrity and cost effectiveness by providing valuable information for risk management decision-making. Formal risk assessment is a structured, systematic process which supplements traditional design and risk management processes. It can be based on qualitative or quantitative methods or a combination, thereof. The objective of formal risk assessment is to analyze and evaluate risk. Risk assessment is made up of three fundamental steps: hazard identification to identify what could go wrong, consequence assessment to address the potential effects and frequency assessment to determine the underlying causes and likelihood or probability of occurrence of the hazardous event. In risk assessment, frequency is estimated based on knowledge and expert judgment, historical experience, and analytical methods combined together to support judgments made by risk assessment teams. Historical experience is expressed in terms of statistical data gathered from existing operations, generally in the form of incidents, base failure rates and failure probabilities. A key issue when using risk assessment is the uncertainties associated with the results and hence, the confidence with which the information can be used to influence decisions. Therein lies the need for reliable data to support E&P risk assessment work. Since incident data are important to providing insight into incident scenarios, the availability of suitable data is a key need of all E&P companies using HSE management systems, regardless of whether the company performs qualitative or quantitative risk assessments. Given the common E&P company need and relatively large resource requirement for data collection and assessment, the E&P Forum formed the QRA Subcommittee in 1989. One of its first project’s was to produce a position paper on Quantitative Risk Assessment [2]. Upon completion of this work, the need for better data to support E&P risk assessments was determined to be a primary work objective of the QRA subcommittee. Activities of the QRA subcommittee include: Workshop on Data in Oil and Gas Quantitative Risk Assessments [3], the Hydrocarbon Leak and Ignition Project (HCLIP) [4] and, most recently, the Risk Assessment Data Directory. Risk Assessment Data Directory The objective of the Risk Assessment Data Directory is to provide a catalogue of information that can be used to improve the quality and consistency of risk assessments with readily available benchmark data and references for common incidents analyzed in upstream production operations. Typical incidents analyzed in E&P risk assessments were identified and divided into four major categories for which twenty six individual datasheets were developed. Each datasheet contains: information describing the event; incident frequency, population and causal data; and a discussion of the data sources, range, availability and application. The directory is intended to be a reference document for estimating screening level and order of magnitude incident frequencies. The directory also provides reference lists of data sources that can be called upon for more detailed information. Its primary applications are for reviewing risk assessments performed by others (e.g., consultants, design contractors, etc.) and evaluating risk in Quantified Risk Assessments (QRAs) and qualitative assessments. As
Introduction E&P Forum QRA Datasheet Directory Rev 0
13/06/2003 INTROD.DOC Page 3
such, the directory is not intended to be a comprehensive catalogue of incident data. Applications requiring more comprehensive data should refer to the original references as well as other publicly available information and company data sources that may be available. The project was carried out as a Subcommittee activity to take advantage of the pooling of knowledge and expertise between participants representing various major E&P companies and other E&P Forum members. Sources for the data include information available to the public and industry such as may be obtained from industry projects and the literature. That is, the directory contains organized publicly available information and data contributed by individual companies which has been previously submitted by other venues. While every reasonable effort has been made to ensure the quality and accuracy of the information and data provided, it is the responsibility of each company or organization using the data to review the information and assure themselves that the data is suitable for their specific application. Development Process The approach for developing the directory was to prepare the data sheets as a QRA Subcommittee activity without any central funding of external consultants. The Shell document, “Guidelines for Risk Assessment Data” developed by SIEP’s E&P HSE Department in 1992 [5] was made available to all members on a confidential basis and acted as the foundation for this new directory. First, the QRA Subcommittee developed a prioritized list of datasheets, generated a data index, and prepared a pro-forma for the contents and organization. Next, a member of the QRA Subcommittee was designated the focal point for each datasheet. The focal points were responsible for coordinating the development of their assigned datasheet. The focal points called on expertise within their own organizations and, in some cases, employed the assistance of various outside consultants. Other QRA Subcommittee members contributed data and reviewed draft data sheets. QRA Subcommittee meetings were held quarterly to peer review and finalize the draft datasheets. This process commenced in November 1994. The final draft datasheets were completed and the draft directory was assembled in second quarter of 1996. As a quality assurance check, the draft directory was then reviewed by an independent expert, and after approval from the E&P Forum Safety, Health and Personnel Competence (SHAPC) committee was issued in fourth quarter of 1996. As with all E&P Forum documents, the directory is available to the public at no charge.
Introduction E&P Forum QRA Datasheet Directory Rev 0
13/06/2003 INTROD.DOC Page 4
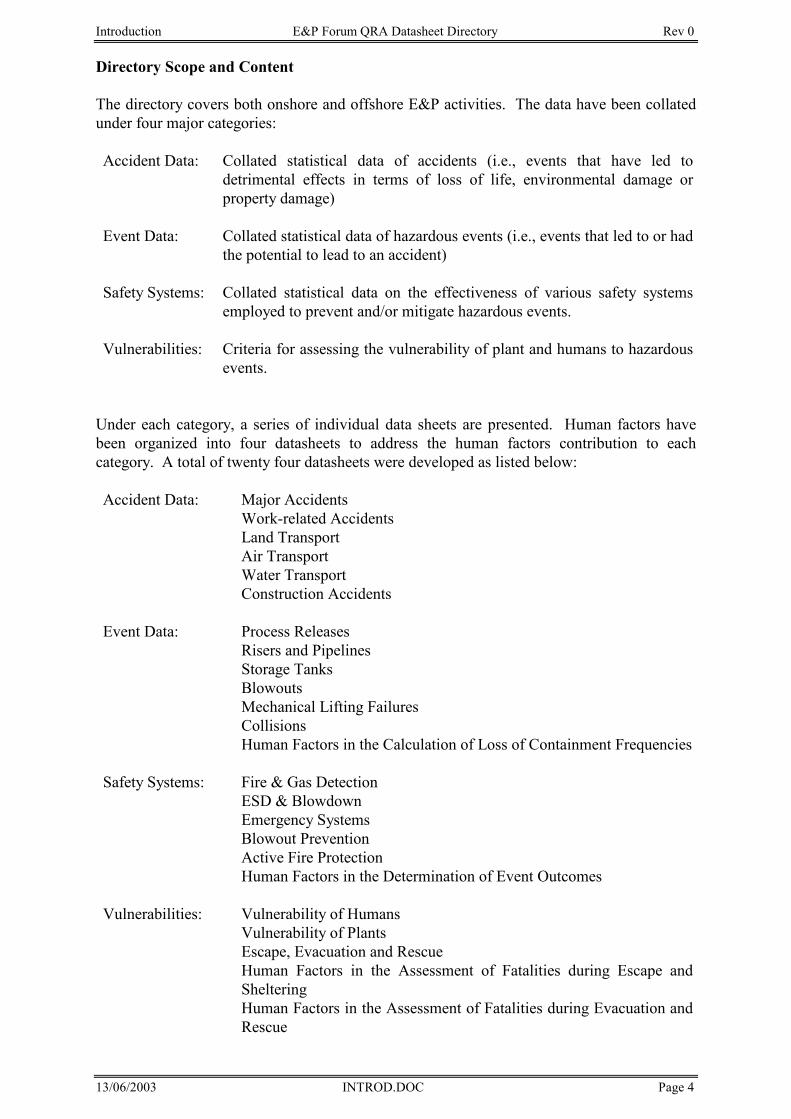
Directory Scope and Content The directory covers both onshore and offshore E&P activities. The data have been collated under four major categories: Accident Data: Collated statistical data of accidents (i.e., events that have led to
detrimental effects in terms of loss of life, environmental damage or property damage)
Event Data: Collated statistical data of hazardous events (i.e., events that led to or had
the potential to lead to an accident) Safety Systems: Collated statistical data on the effectiveness of various safety systems
employed to prevent and/or mitigate hazardous events. Vulnerabilities: Criteria for assessing the vulnerability of plant and humans to hazardous
events.
Under each category, a series of individual data sheets are presented. Human factors have been organized into four datasheets to address the human factors contribution to each category. A total of twenty four datasheets were developed as listed below: Accident Data: Major Accidents
Work-related Accidents Land Transport Air Transport Water Transport Construction Accidents
Event Data: Process Releases
Risers and Pipelines Storage Tanks Blowouts Mechanical Lifting Failures
Collisions Human Factors in the Calculation of Loss of Containment Frequencies Safety Systems: Fire & Gas Detection
ESD & Blowdown Emergency Systems Blowout Prevention Active Fire Protection Human Factors in the Determination of Event Outcomes Vulnerabilities: Vulnerability of Humans Vulnerability of Plants Escape, Evacuation and Rescue Human Factors in the Assessment of Fatalities during Escape and
Sheltering Human Factors in the Assessment of Fatalities during Evacuation and
Rescue
Introduction E&P Forum QRA Datasheet Directory Rev 0
13/06/2003 INTROD.DOC Page 5
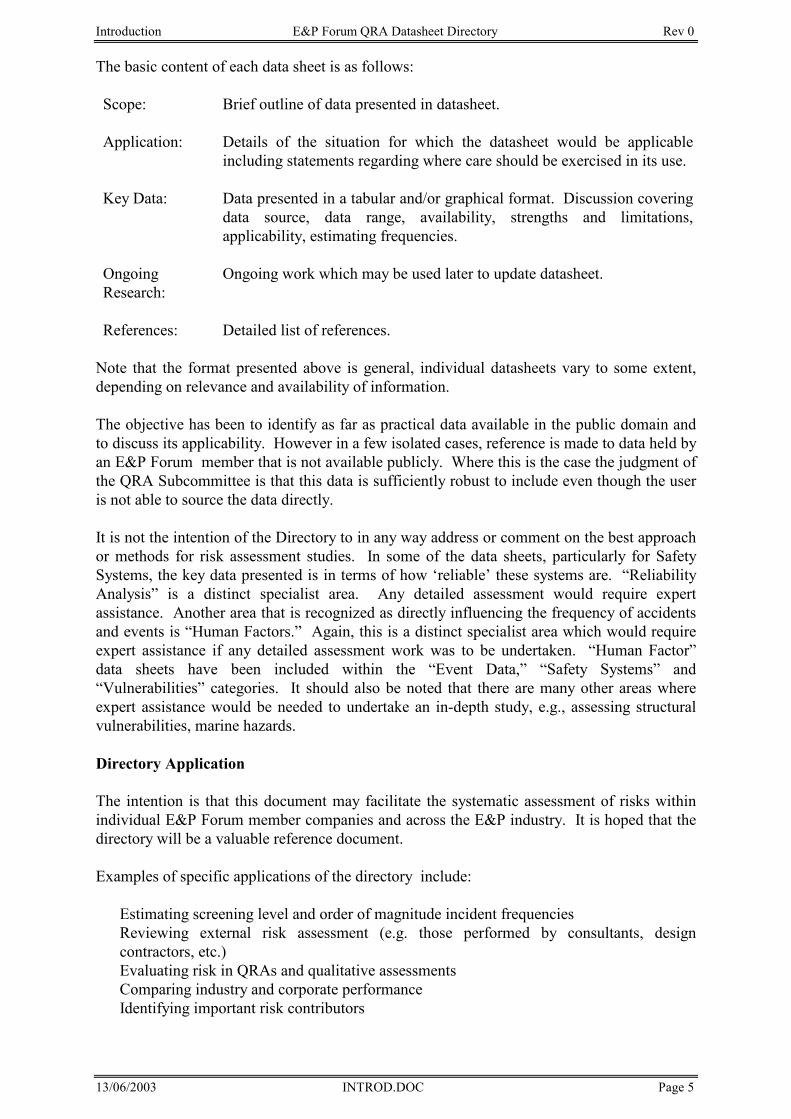
The basic content of each data sheet is as follows: Scope: Brief outline of data presented in datasheet. Application: Details of the situation for which the datasheet would be applicable
including statements regarding where care should be exercised in its use. Key Data: Data presented in a tabular and/or graphical format. Discussion covering
data source, data range, availability, strengths and limitations, applicability, estimating frequencies.
Ongoing Research:
Ongoing work which may be used later to update datasheet.
References: Detailed list of references.
Note that the format presented above is general, individual datasheets vary to some extent, depending on relevance and availability of information. The objective has been to identify as far as practical data available in the public domain and to discuss its applicability. However in a few isolated cases, reference is made to data held by an E&P Forum member that is not available publicly. Where this is the case the judgment of the QRA Subcommittee is that this data is sufficiently robust to include even though the user is not able to source the data directly. It is not the intention of the Directory to in any way address or comment on the best approach or methods for risk assessment studies. In some of the data sheets, particularly for Safety Systems, the key data presented is in terms of how ‘reliable’ these systems are. “Reliability Analysis” is a distinct specialist area. Any detailed assessment would require expert assistance. Another area that is recognized as directly influencing the frequency of accidents and events is “Human Factors.” Again, this is a distinct specialist area which would require expert assistance if any detailed assessment work was to be undertaken. “Human Factor” data sheets have been included within the “Event Data,” “Safety Systems” and “Vulnerabilities” categories. It should also be noted that there are many other areas where expert assistance would be needed to undertake an in-depth study, e.g., assessing structural vulnerabilities, marine hazards. Directory Application The intention is that this document may facilitate the systematic assessment of risks within individual E&P Forum member companies and across the E&P industry. It is hoped that the directory will be a valuable reference document. Examples of specific applications of the directory include: • Estimating screening level and order of magnitude incident frequencies • Reviewing external risk assessment (e.g. those performed by consultants, design
contractors, etc.) • Evaluating risk in QRAs and qualitative assessments • Comparing industry and corporate performance • Identifying important risk contributors
Introduction E&P Forum QRA Datasheet Directory Rev 0
13/06/2003 INTROD.DOC Page 6
Updating Plans It is recognized and accepted that the data presented in the “E&P Forum Risk Assessment Data Directory” will become out of date. Nevertheless, many of the data bases identified are actively maintained and; hence, by directly accessing these source databases, up-to-date information can be obtained. In the future, this directory may be updated. The E&P Forum will maintain a file for each data sheet. There is an open invitation to forward any new or better information, or data from other geographic areas, to the E&P Forum. It would also be appreciated if the E&P Forum could be notified of any errors identified. This information will be periodically reviewed by the QRA Subcommittee.
Introduction E&P Forum QRA Datasheet Directory Rev 0
13/06/2003 INTROD.DOC Page 7
REFERENCES
1. E&P Forum, “Guidelines for the Development and Application of Health, Safety and Environmental Management Systems”, Report No. 6.36/210, July 1994.
2. E&P Forum, “Quantitative Risk Assessment, A Position Paper Issued by the E&P Forum”,
Report No. 11.2/150, May 1989. 3. E&P Forum, “Workshop on Data in Oil and Gas Quantitative Risk Assessments”, Report
No. 11.7/205, January 1994. 4. E&P Forum, “Hydrocarbon Leak and Ignition Database”, DNV Technica, March 1992. 5. Shell Internationale Petroleum Maatschappij B. V., “Guidelines for Risk Assessment
Data”, May 1992.
Introduction E&P Forum QRA Datasheet Directory Rev 0
13/06/2003 INTROD.DOC Page 8
Major Accidents E&P Forum QRA Datasheet Directory Rev 0
13/06/2003 MAJORACC.DOC Page 1
MAJOR ACCIDENTS
Major Accidents E&P Forum QRA Datasheet Directory Rev 0
13/06/2003 MAJORACC.DOC Page 2
TABLE OF CONTENTS
1. SUMMARY--------------------------------------------------------------------------------------------- 3
2. MAJOR OFFSHORE ACCIDENTS INVOLVING FATALITIES -------------------------- 3
3. MAJOR ONSHORE ACCIDENTS WITH HIGH PROPERTY DAMAGE LOSSES- 3
4. MAJOR OFFSHORE ENVIRONMENTAL ACCIDENTS---------------------------------- 4
REFERENCES----------------------------------------------------------------------------------------- 16
Major Accidents E&P Forum QRA Datasheet Directory Rev 0
13/06/2003 MAJORACC.DOC Page 3
1. SUMMARY
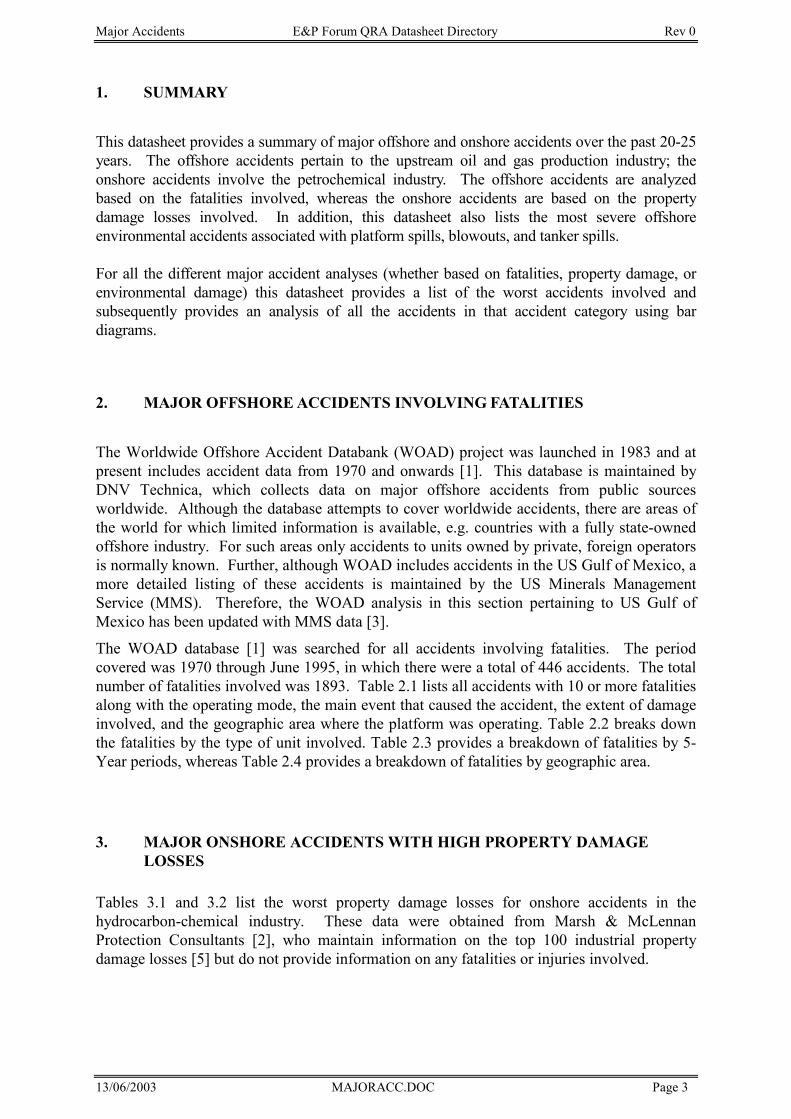
This datasheet provides a summary of major offshore and onshore accidents over the past 20-25 years. The offshore accidents pertain to the upstream oil and gas production industry; the onshore accidents involve the petrochemical industry. The offshore accidents are analyzed based on the fatalities involved, whereas the onshore accidents are based on the property damage losses involved. In addition, this datasheet also lists the most severe offshore environmental accidents associated with platform spills, blowouts, and tanker spills. For all the different major accident analyses (whether based on fatalities, property damage, or environmental damage) this datasheet provides a list of the worst accidents involved and subsequently provides an analysis of all the accidents in that accident category using bar diagrams.
2. MAJOR OFFSHORE ACCIDENTS INVOLVING FATALITIES
The Worldwide Offshore Accident Databank (WOAD) project was launched in 1983 and at present includes accident data from 1970 and onwards [1]. This database is maintained by DNV Technica, which collects data on major offshore accidents from public sources worldwide. Although the database attempts to cover worldwide accidents, there are areas of the world for which limited information is available, e.g. countries with a fully state-owned offshore industry. For such areas only accidents to units owned by private, foreign operators is normally known. Further, although WOAD includes accidents in the US Gulf of Mexico, a more detailed listing of these accidents is maintained by the US Minerals Management Service (MMS). Therefore, the WOAD analysis in this section pertaining to US Gulf of Mexico has been updated with MMS data [3].
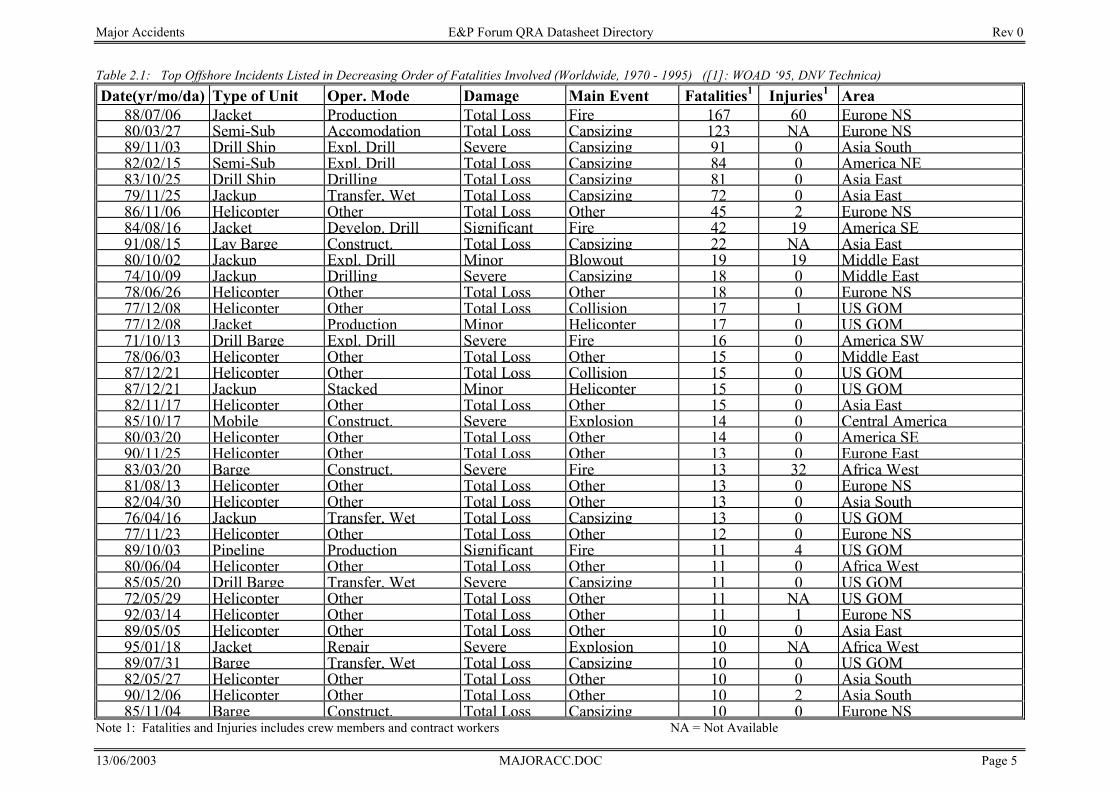
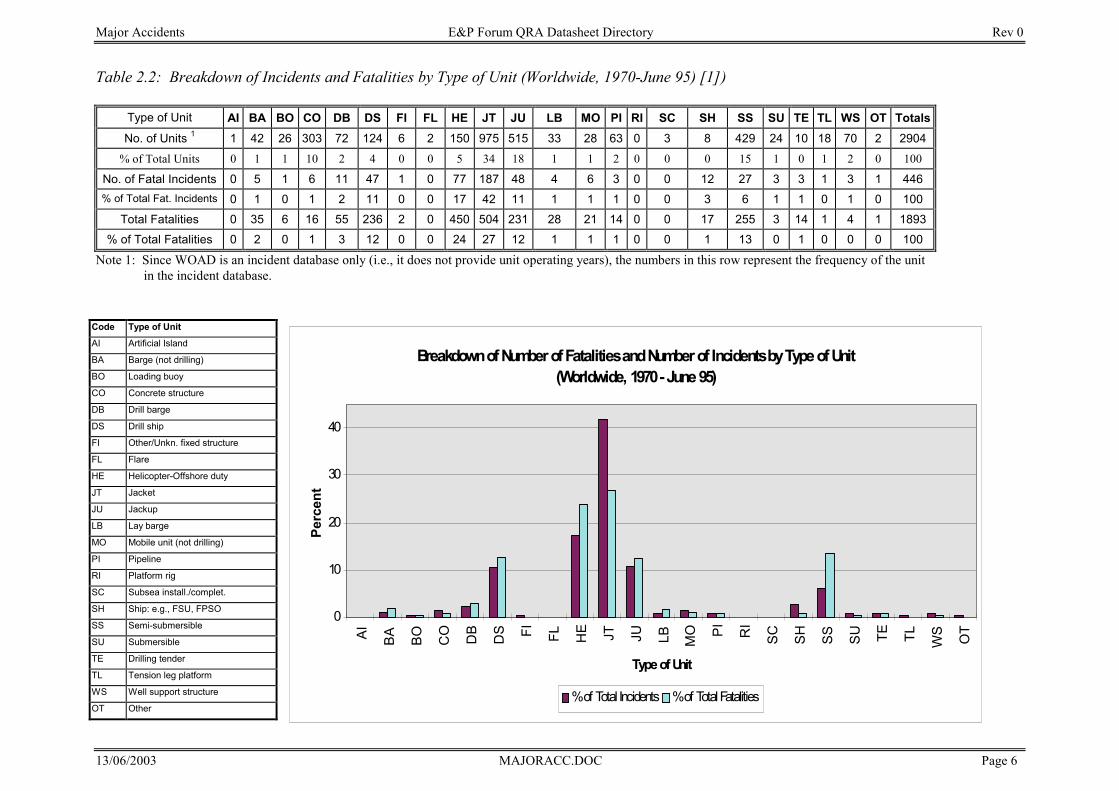
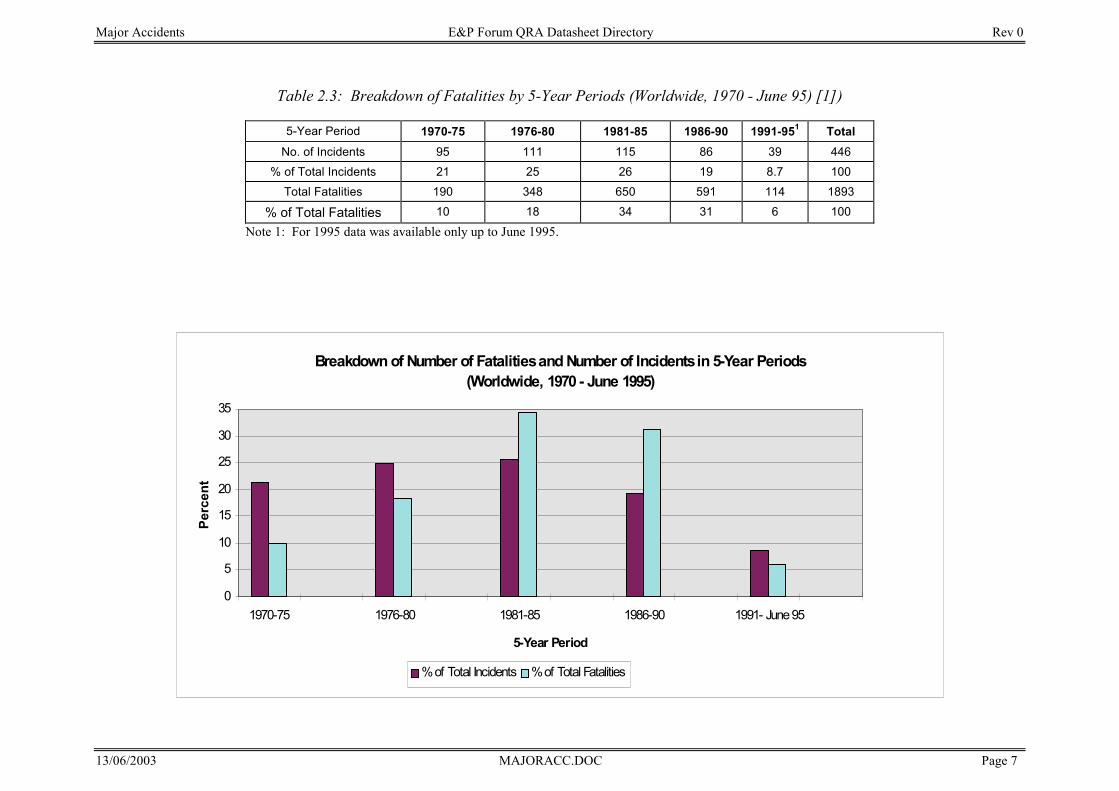
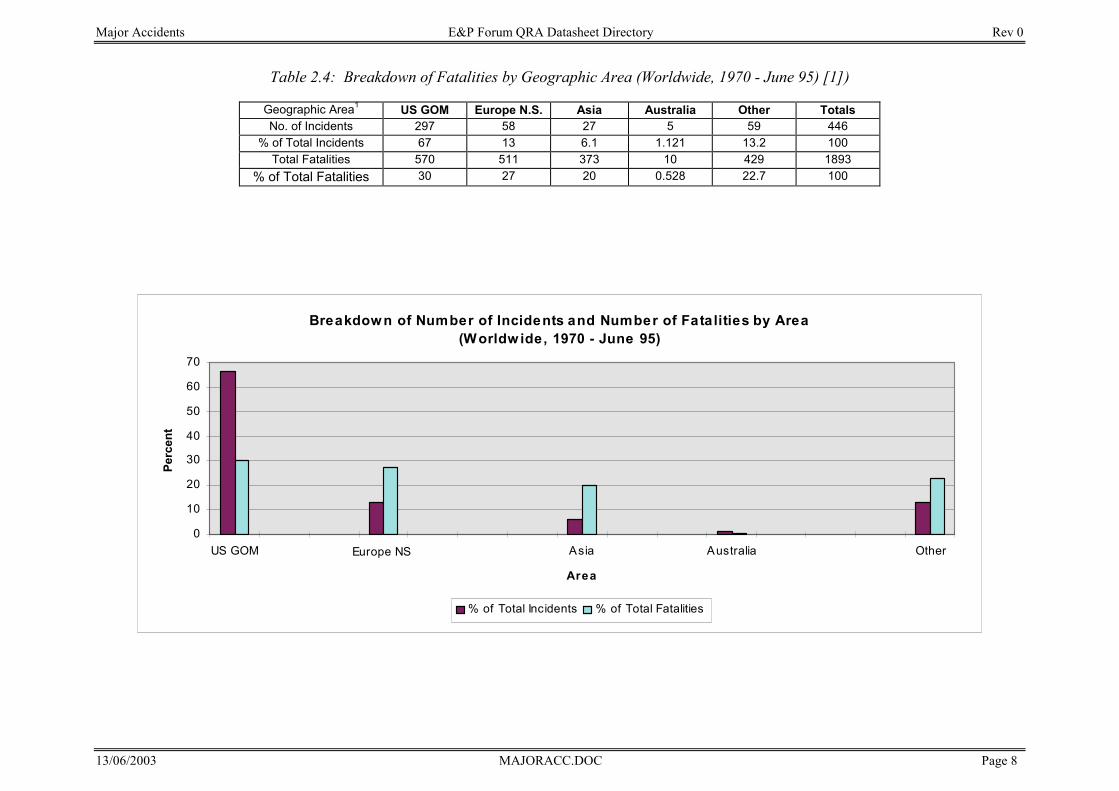
The WOAD database [1] was searched for all accidents involving fatalities. The period covered was 1970 through June 1995, in which there were a total of 446 accidents. The total number of fatalities involved was 1893. Table 2.1 lists all accidents with 10 or more fatalities along with the operating mode, the main event that caused the accident, the extent of damage involved, and the geographic area where the platform was operating. Table 2.2 breaks down the fatalities by the type of unit involved. Table 2.3 provides a breakdown of fatalities by 5-Year periods, whereas Table 2.4 provides a breakdown of fatalities by geographic area.
3. MAJOR ONSHORE ACCIDENTS WITH HIGH PROPERTY DAMAGE LOSSES
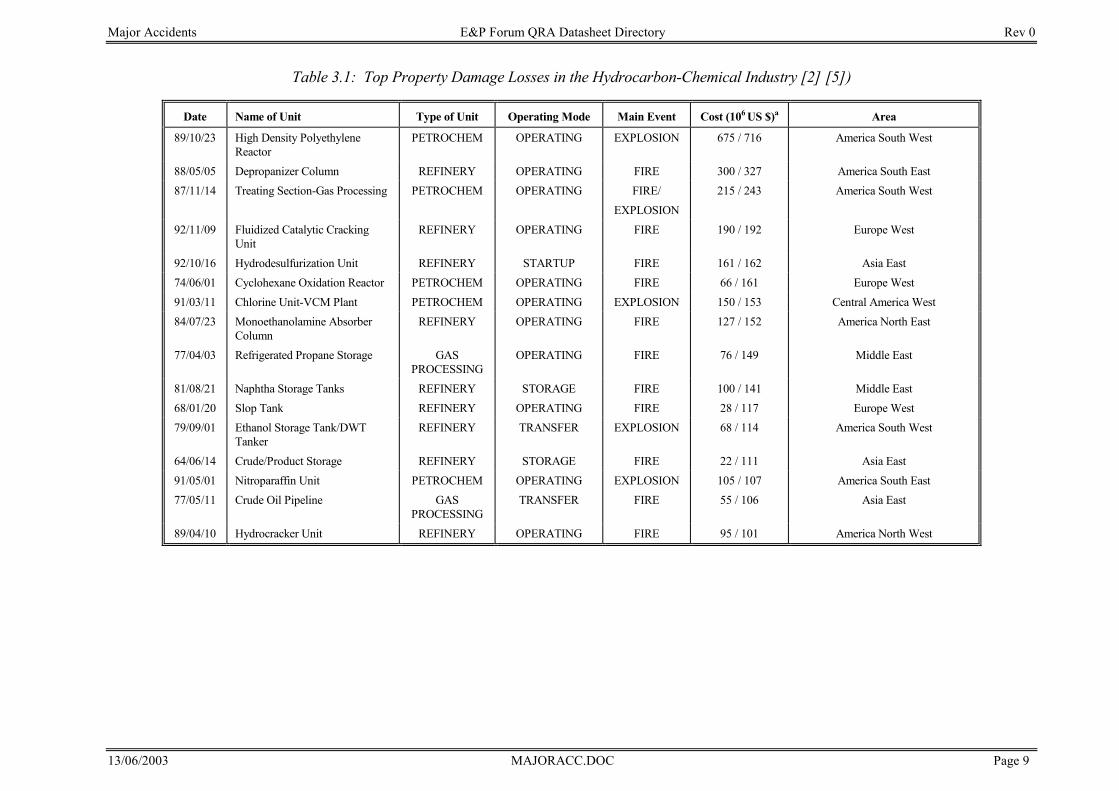
Tables 3.1 and 3.2 list the worst property damage losses for onshore accidents in the hydrocarbon-chemical industry. These data were obtained from Marsh & McLennan Protection Consultants [2], who maintain information on the top 100 industrial property damage losses [5] but do not provide information on any fatalities or injuries involved.
Major Accidents E&P Forum QRA Datasheet Directory Rev 0
13/06/2003 MAJORACC.DOC Page 4
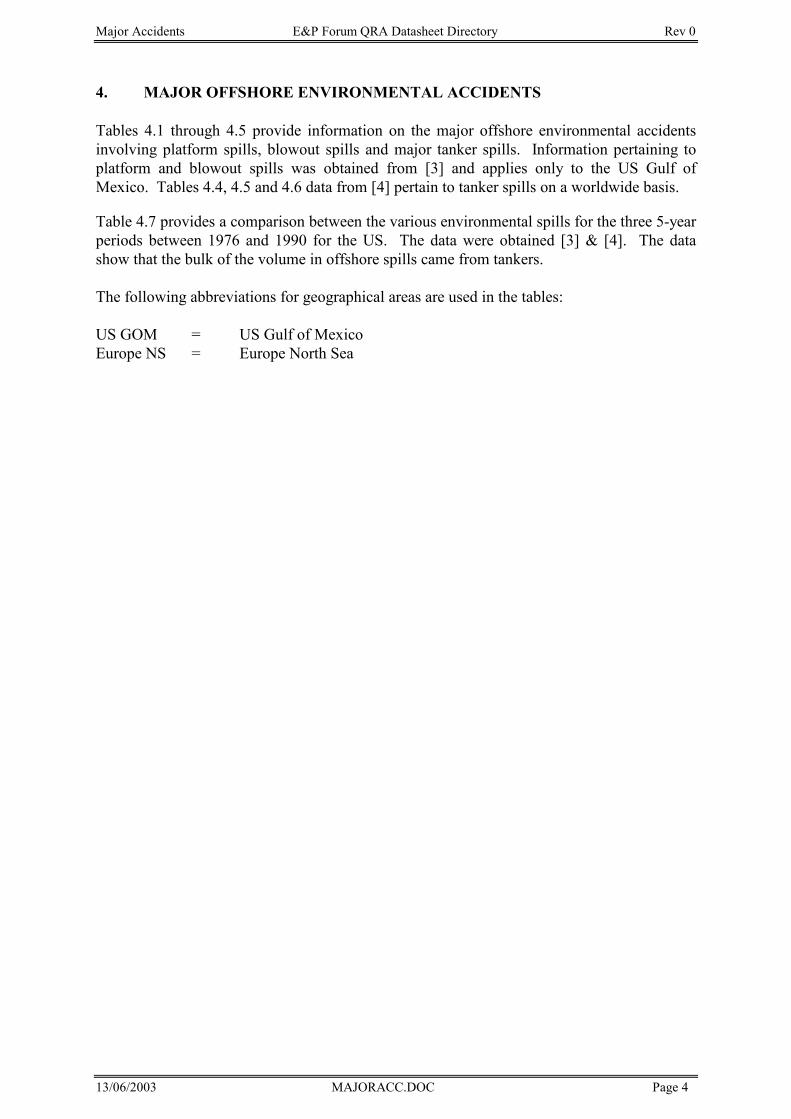
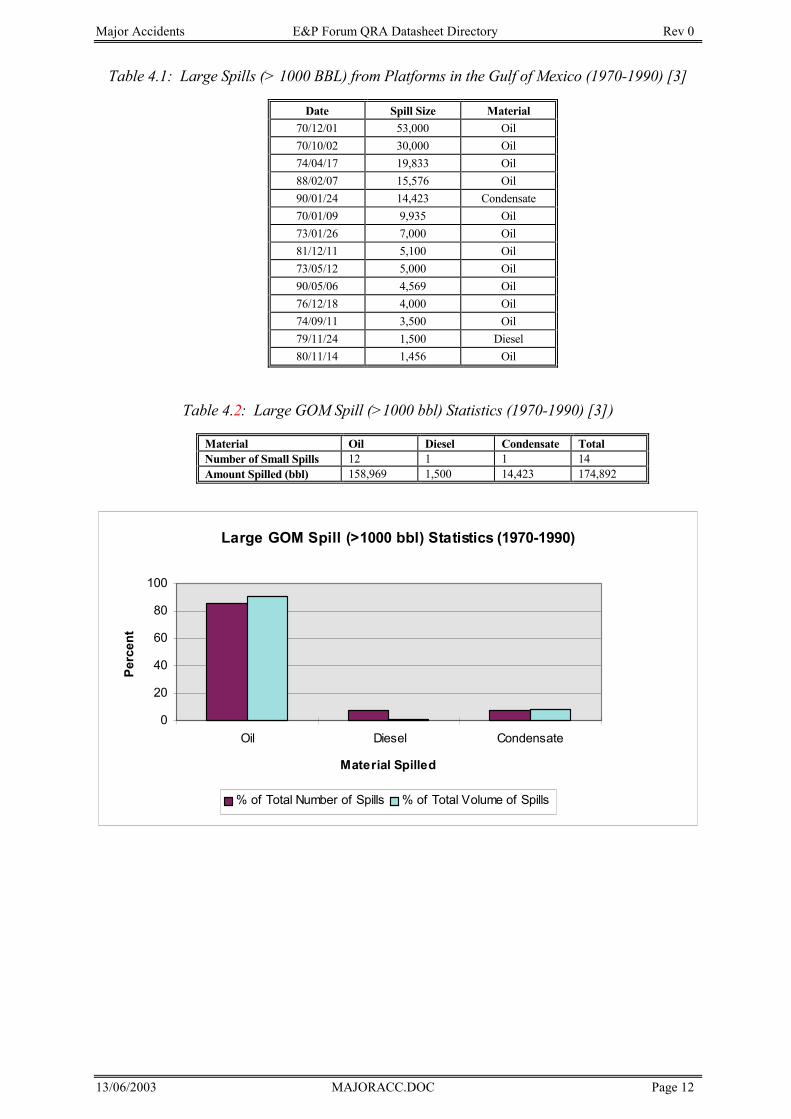
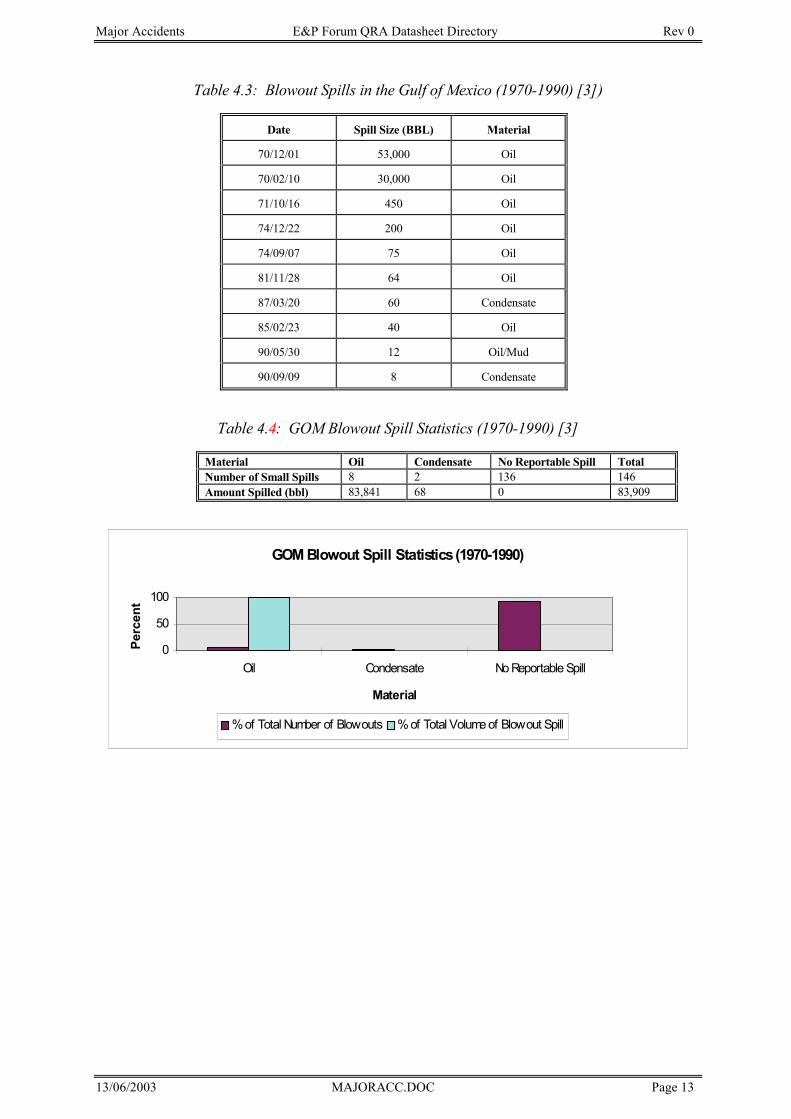
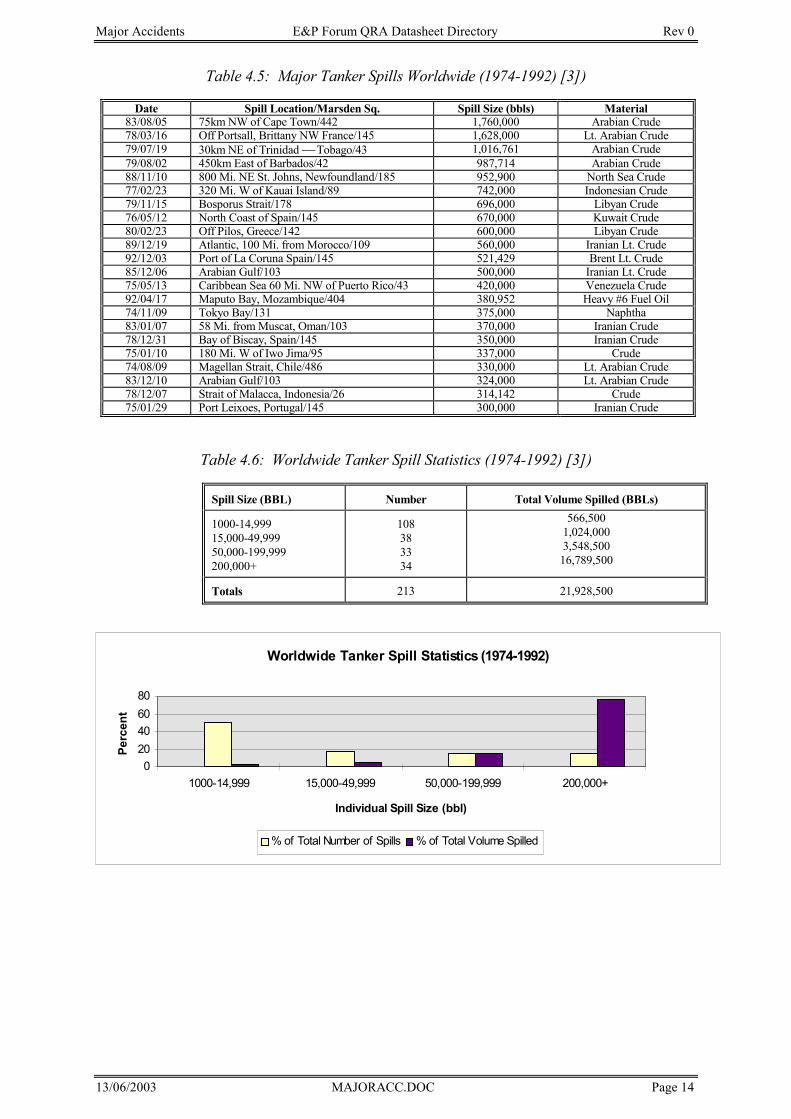
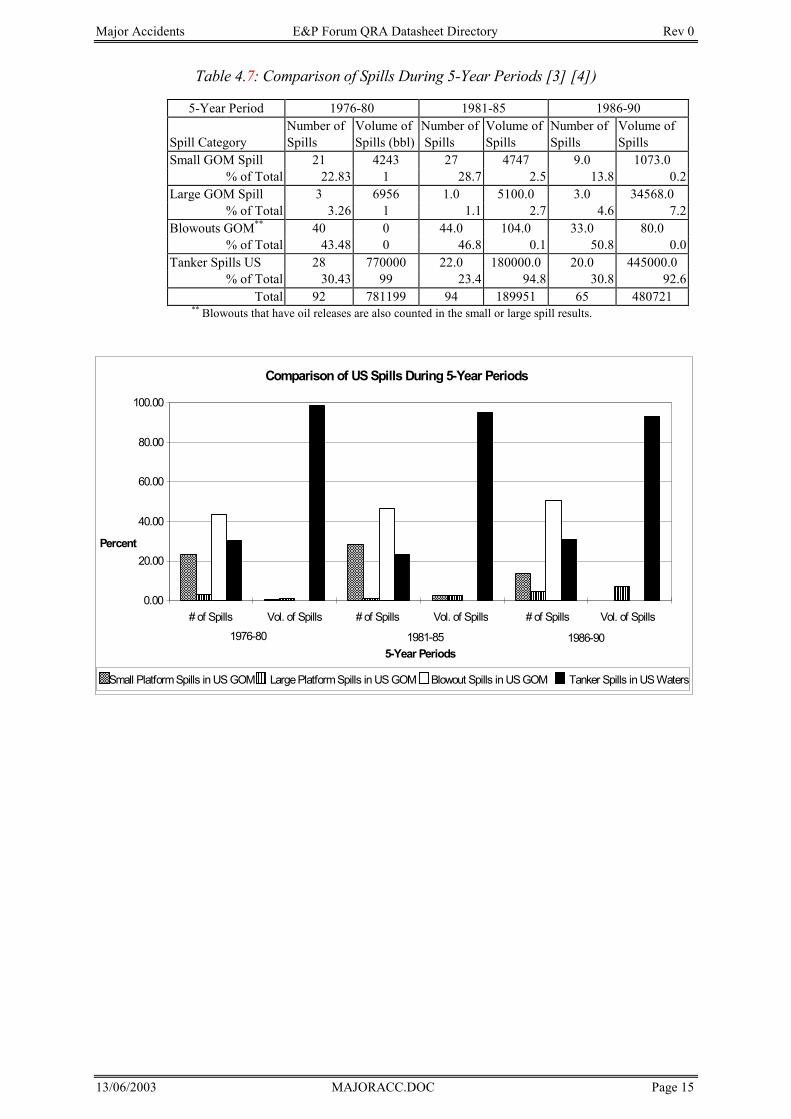
4. MAJOR OFFSHORE ENVIRONMENTAL ACCIDENTS Tables 4.1 through 4.5 provide information on the major offshore environmental accidents involving platform spills, blowout spills and major tanker spills. Information pertaining to platform and blowout spills was obtained from [3] and applies only to the US Gulf of Mexico. Tables 4.4, 4.5 and 4.6 data from [4] pertain to tanker spills on a worldwide basis. Table 4.7 provides a comparison between the various environmental spills for the three 5-year periods between 1976 and 1990 for the US. The data were obtained [3] & [4]. The data show that the bulk of the volume in offshore spills came from tankers. The following abbreviations for geographical areas are used in the tables: US GOM = US Gulf of Mexico Europe NS = Europe North Sea
Major Accidents E&P Forum QRA Datasheet Directory Rev 0
13/06/2003 MAJORACC.DOC Page 5
Table 2.1: Top Offshore Incidents Listed in Decreasing Order of Fatalities Involved (Worldwide, 1970 - 1995) ([1]: WOAD ‘95, DNV Technica)Date(yr/mo/da) Type of Unit Oper. Mode Damage Main Event Fatalities1 Injuries1 Area
88/07/06 Jacket Production Total Loss Fire 167 60 Europe NS80/03/27 Semi-Sub Accomodation Total Loss Capsizing 123 NA Europe NS89/11/03 Drill Ship Expl. Drill Severe Capsizing 91 0 Asia South82/02/15 Semi-Sub Expl. Drill Total Loss Capsizing 84 0 America NE83/10/25 Drill Ship Drilling Total Loss Capsizing 81 0 Asia East79/11/25 Jackup Transfer, Wet Total Loss Capsizing 72 0 Asia East86/11/06 Helicopter Other Total Loss Other 45 2 Europe NS84/08/16 Jacket Develop. Drill Significant Fire 42 19 America SE91/08/15 Lay Barge Construct. Total Loss Capsizing 22 NA Asia East80/10/02 Jackup Expl. Drill Minor Blowout 19 19 Middle East74/10/09 Jackup Drilling Severe Capsizing 18 0 Middle East78/06/26 Helicopter Other Total Loss Other 18 0 Europe NS77/12/08 Helicopter Other Total Loss Collision 17 1 US GOM77/12/08 Jacket Production Minor Helicopter 17 0 US GOM71/10/13 Drill Barge Expl. Drill Severe Fire 16 0 America SW78/06/03 Helicopter Other Total Loss Other 15 0 Middle East87/12/21 Helicopter Other Total Loss Collision 15 0 US GOM87/12/21 Jackup Stacked Minor Helicopter 15 0 US GOM82/11/17 Helicopter Other Total Loss Other 15 0 Asia East85/10/17 Mobile Construct. Severe Explosion 14 0 Central America80/03/20 Helicopter Other Total Loss Other 14 0 America SE90/11/25 Helicopter Other Total Loss Other 13 0 Europe East83/03/20 Barge Construct. Severe Fire 13 32 Africa West81/08/13 Helicopter Other Total Loss Other 13 0 Europe NS82/04/30 Helicopter Other Total Loss Other 13 0 Asia South76/04/16 Jackup Transfer, Wet Total Loss Capsizing 13 0 US GOM77/11/23 Helicopter Other Total Loss Other 12 0 Europe NS89/10/03 Pipeline Production Significant Fire 11 4 US GOM80/06/04 Helicopter Other Total Loss Other 11 0 Africa West85/05/20 Drill Barge Transfer, Wet Severe Capsizing 11 0 US GOM72/05/29 Helicopter Other Total Loss Other 11 NA US GOM92/03/14 Helicopter Other Total Loss Other 11 1 Europe NS89/05/05 Helicopter Other Total Loss Other 10 0 Asia East95/01/18 Jacket Repair Severe Explosion 10 NA Africa West89/07/31 Barge Transfer, Wet Total Loss Capsizing 10 0 US GOM82/05/27 Helicopter Other Total Loss Other 10 0 Asia South90/12/06 Helicopter Other Total Loss Other 10 2 Asia South85/11/04 Barge Construct. Total Loss Capsizing 10 0 Europe NS
Note 1: Fatalities and Injuries includes crew members and contract workers NA = Not Available
Major Accidents E&P Forum QRA Datasheet Directory Rev 0
13/06/2003 MAJORACC.DOC Page 6
Table 2.2: Breakdown of Incidents and Fatalities by Type of Unit (Worldwide, 1970-June 95) [1])
Type of Unit AI BA BO CO DB DS FI FL HE JT JU LB MO PI RI SC SH SS SU TE TL WS OT TotalsNo. of Units 1 1 42 26 303 72 124 6 2 150 975 515 33 28 63 0 3 8 429 24 10 18 70 2 2904
% of Total Units 0 1 1 10 2 4 0 0 5 34 18 1 1 2 0 0 0 15 1 0 1 2 0 100
No. of Fatal Incidents 0 5 1 6 11 47 1 0 77 187 48 4 6 3 0 0 12 27 3 3 1 3 1 446% of Total Fat. Incidents 0 1 0 1 2 11 0 0 17 42 11 1 1 1 0 0 3 6 1 1 0 1 0 100
Total Fatalities 0 35 6 16 55 236 2 0 450 504 231 28 21 14 0 0 17 255 3 14 1 4 1 1893% of Total Fatalities 0 2 0 1 3 12 0 0 24 27 12 1 1 1 0 0 1 13 0 1 0 0 0 100
Note 1: Since WOAD is an incident database only (i.e., it does not provide unit operating years), the numbers in this row represent the frequency of the unitin the incident database.
Code Type of UnitAI Artificial Island
BA Barge (not drilling)
BO Loading buoy
CO Concrete structure
DB Drill barge
DS Drill ship
FI Other/Unkn. fixed structure
FL Flare
HE Helicopter-Offshore duty
JT Jacket
JU Jackup
LB Lay barge
MO Mobile unit (not drilling)
PI Pipeline
RI Platform rig
SC Subsea install./complet.
SH Ship: e.g., FSU, FPSO
SS Semi-submersible
SU Submersible
TE Drilling tender
TL Tension leg platform
WS Well support structure
OT Other
BreakdownofNumberofFatalitiesandNumberof IncidentsbyTypeofUnit(Worldwide, 1970-June95)
0
10
20
30
40
AI BA BO CO DB
DS FI FL HE JT JU LB MO PI RI
SC SH SS SU TE TL WS OT
TypeofUnit
Perc
ent
%of Total Incidents %of TotalFatalities
Major Accidents E&P Forum QRA Datasheet Directory Rev 0
13/06/2003 MAJORACC.DOC Page 7
Table 2.3: Breakdown of Fatalities by 5-Year Periods (Worldwide, 1970 - June 95) [1])
5-Year Period 1970-75 1976-80 1981-85 1986-90 1991-951 TotalNo. of Incidents 95 111 115 86 39 446
% of Total Incidents 21 25 26 19 8.7 100Total Fatalities 190 348 650 591 114 1893
% of Total Fatalities 10 18 34 31 6 100Note 1: For 1995 data was available only up to June 1995.
Breakdown of Number of Fatalitiesand Number of Incidentsin 5-Year Periods(Worldwide, 1970 - June 1995)
0
5
10
15
20
25
30
35
1970-75 1976-80 1981-85 1986-90 1991- June95
5-Year Period
Perc
ent
%of Total Incidents %of Total Fatalities
Major Accidents E&P Forum QRA Datasheet Directory Rev 0
13/06/2003 MAJORACC.DOC Page 8
Table 2.4: Breakdown of Fatalities by Geographic Area (Worldwide, 1970 - June 95) [1])
Geographic Area1 US GOM Europe N.S. Asia Australia Other TotalsNo. of Incidents 297 58 27 5 59 446
% of Total Incidents 67 13 6.1 1.121 13.2 100Total Fatalities 570 511 373 10 429 1893
% of Total Fatalities 30 27 20 0.528 22.7 100
Breakdown of Number of Incidents and Number of Fatalities by Area(Worldwide, 1970 - June 95)
0
10
20
30
40
50
60
70
US GOM Australia Other
Area
Perc
ent
% of Total Incidents % of Total Fatalities
Europe NS Asia
Major Accidents E&P Forum QRA Datasheet Directory Rev 0
13/06/2003 MAJORACC.DOC Page 9
Table 3.1: Top Property Damage Losses in the Hydrocarbon-Chemical Industry [2] [5])
Date Name of Unit Type of Unit Operating Mode Main Event Cost (106 US $)a Area
89/10/23 High Density PolyethyleneReactor
PETROCHEM OPERATING EXPLOSION 675 / 716 America South West
88/05/05 Depropanizer Column REFINERY OPERATING FIRE 300 / 327 America South East87/11/14 Treating Section-Gas Processing PETROCHEM OPERATING FIRE/
EXPLOSION215 / 243 America South West
92/11/09 Fluidized Catalytic CrackingUnit
REFINERY OPERATING FIRE 190 / 192 Europe West
92/10/16 Hydrodesulfurization Unit REFINERY STARTUP FIRE 161 / 162 Asia East74/06/01 Cyclohexane Oxidation Reactor PETROCHEM OPERATING FIRE 66 / 161 Europe West91/03/11 Chlorine Unit-VCM Plant PETROCHEM OPERATING EXPLOSION 150 / 153 Central America West84/07/23 Monoethanolamine Absorber
ColumnREFINERY OPERATING FIRE 127 / 152 America North East
77/04/03 Refrigerated Propane Storage GASPROCESSING
OPERATING FIRE 76 / 149 Middle East
81/08/21 Naphtha Storage Tanks REFINERY STORAGE FIRE 100 / 141 Middle East68/01/20 Slop Tank REFINERY OPERATING FIRE 28 / 117 Europe West79/09/01 Ethanol Storage Tank/DWT
TankerREFINERY TRANSFER EXPLOSION 68 / 114 America South West
64/06/14 Crude/Product Storage REFINERY STORAGE FIRE 22 / 111 Asia East91/05/01 Nitroparaffin Unit PETROCHEM OPERATING EXPLOSION 105 / 107 America South East77/05/11 Crude Oil Pipeline GAS
PROCESSINGTRANSFER FIRE 55 / 106 Asia East
89/04/10 Hydrocracker Unit REFINERY OPERATING FIRE 95 / 101 America North West
Major Accidents E&P Forum QRA Datasheet Directory Rev 0
13/06/2003 MAJORACC.DOC Page 10
Table 3.1 (continued): Top Property Damage Losses in the Hydrocarbon-Chemical Industry [2] [5])
Date Name of Unit Type of Unit Operating Mode Main Event Cost (106 US $)a Area
78/05/30 Alkylation Tank Farm REFINERY STORAGE FIRE 55 / 100 America South West78/04/15 Gas Transmission Pipeline GAS PROCESSING TRANSFER EXPLOSION 54 / 97 Middle East70/12/05 Hydrocracking Unit REFINERY OPERATING EXPLOSION 27 / 95 America North East84/08/15 Fluid Bed Coking Unit REFINERY OPERATING FIRE 76 / 91 Canada87/03/22 Hydrocracking Unit REFINERY STARTUP FIRE 79 / 89 Europe West66/01/04 Butane Sphere REFINERY STORAGE FIRE 18 / 84 Europe West91/03/12 Ethylene Oxide Unit PETROCHEM OPERATING EXPLOSION 80 / 82 America South West89/03/07 Aldehyde Column PETROCHEM OPERATING EXPLOSION 77 / 82 Europe West85/05/19 Ethylene Plant PETROCHEM OPERATING FIRE 65 / 77 Europe South, Mediterranean77/07/08 Pipeline PIPELINE STARTUP FIRE 40 / 77 Arctic, America67/08/08 Isobutane Pipeline REFINERY TRANSFER FIRE 17 / 77 America South East
a Two cost figures are listed: the first figure is the accident cost at the time the accident occurred. The second figure is the trended accident cost in 1993 dollars.
Major Accidents E&P Forum QRA Datasheet Directory Rev 0
13/06/2003 MAJORACC.DOC Page 11
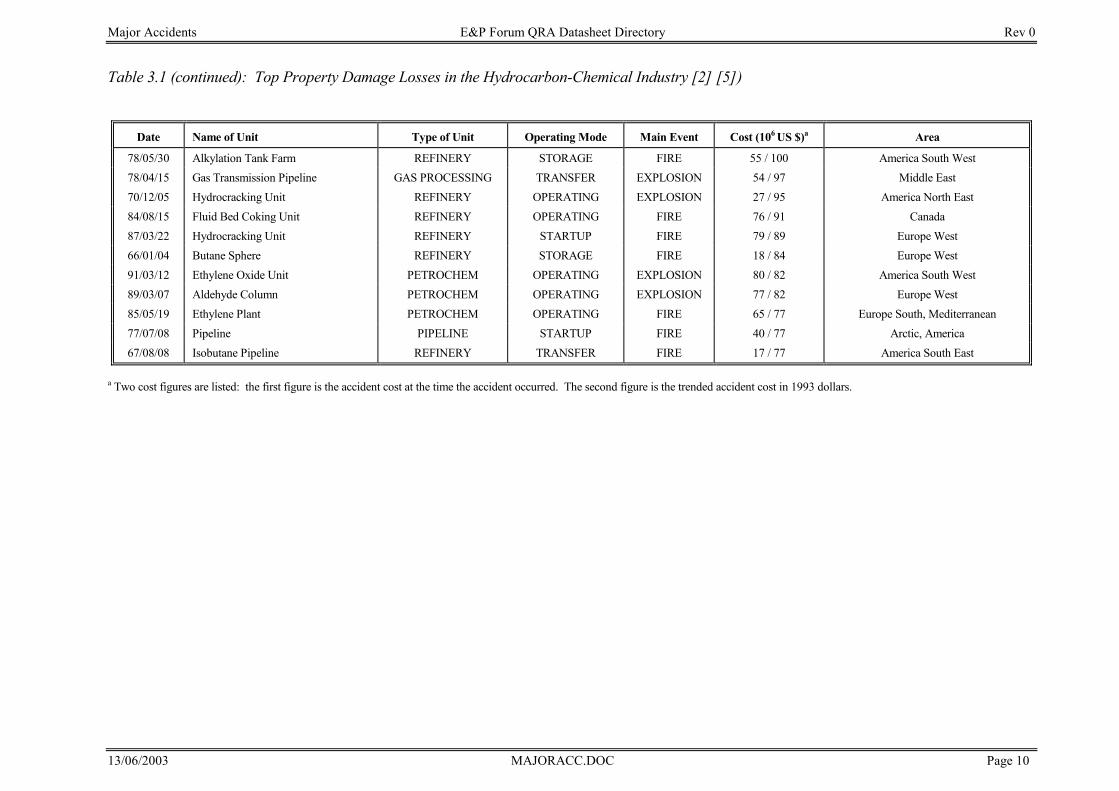
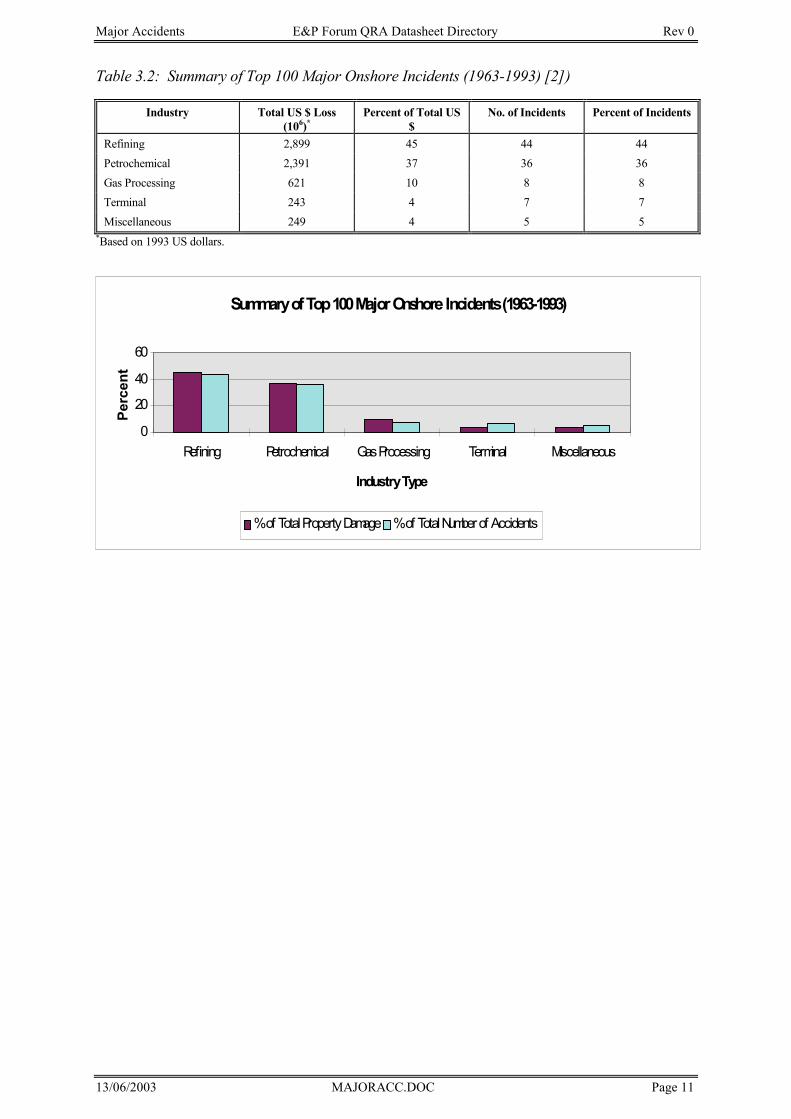
Table 3.2: Summary of Top 100 Major Onshore Incidents (1963-1993) [2])
Industry Total US $ Loss (106)*
Percent of Total US $
No. of Incidents Percent of Incidents
Refining 2,899 45 44 44 Petrochemical 2,391 37 36 36 Gas Processing 621 10 8 8 Terminal 243 4 7 7 Miscellaneous 249 4 5 5
*Based on 1993 US dollars.
Summary of Top 100 Major Onshore Incidents (1963-1993)
0
20
40
60
Refining Petrochemical Gas Processing Terminal Miscellaneous
Industry Type
Perc
ent
%of Total Property Damage %of Total Number of Accidents
Major Accidents E&P Forum QRA Datasheet Directory Rev 0
13/06/2003 MAJORACC.DOC Page 12
Table 4.1: Large Spills (> 1000 BBL) from Platforms in the Gulf of Mexico (1970-1990) [3]
Date Spill Size Material 70/12/01 53,000 Oil 70/10/02 30,000 Oil 74/04/17 19,833 Oil 88/02/07 15,576 Oil 90/01/24 14,423 Condensate 70/01/09 9,935 Oil 73/01/26 7,000 Oil 81/12/11 5,100 Oil 73/05/12 5,000 Oil 90/05/06 4,569 Oil 76/12/18 4,000 Oil 74/09/11 3,500 Oil 79/11/24 1,500 Diesel 80/11/14 1,456 Oil
Table 4.2: Large GOM Spill (>1000 bbl) Statistics (1970-1990) [3])
Material Oil Diesel Condensate Total Number of Small Spills 12 1 1 14 Amount Spilled (bbl) 158,969 1,500 14,423 174,892
Large GOM Spill (>1000 bbl) Statistics (1970-1990)
0
20
40
60
80
100
Oil Diesel Condensate
Material Spilled
Perc
ent
% of Total Number of Spills % of Total Volume of Spills
Major Accidents E&P Forum QRA Datasheet Directory Rev 0
13/06/2003 MAJORACC.DOC Page 13
Table 4.3: Blowout Spills in the Gulf of Mexico (1970-1990) [3])
Date Spill Size (BBL) Material
70/12/01 53,000 Oil
70/02/10 30,000 Oil
71/10/16 450 Oil
74/12/22 200 Oil
74/09/07 75 Oil
81/11/28 64 Oil
87/03/20 60 Condensate
85/02/23 40 Oil
90/05/30 12 Oil/Mud
90/09/09 8 Condensate
Table 4.4: GOM Blowout Spill Statistics (1970-1990) [3]
Material Oil Condensate No Reportable Spill Total Number of Small Spills 8 2 136 146 Amount Spilled (bbl) 83,841 68 0 83,909
GOM Blowout Spill Statistics (1970-1990)
0
50
100
Oil Condensate No Reportable Spill
Material
Perc
ent
%of Total Number of Blowouts % of Total Volume of Blowout Spill
Major Accidents E&P Forum QRA Datasheet Directory Rev 0
13/06/2003 MAJORACC.DOC Page 14
Table 4.5: Major Tanker Spills Worldwide (1974-1992) [3])
Date Spill Location/Marsden Sq. Spill Size (bbls) Material 83/08/05 75km NW of Cape Town/442 1,760,000 Arabian Crude 78/03/16 Off Portsall, Brittany NW France/145 1,628,000 Lt. Arabian Crude 79/07/19 30km NE of Trinidad Tobago/43 1,016,761 Arabian Crude 79/08/02 450km East of Barbados/42 987,714 Arabian Crude 88/11/10 800 Mi. NE St. Johns, Newfoundland/185 952,900 North Sea Crude 77/02/23 320 Mi. W of Kauai Island/89 742,000 Indonesian Crude 79/11/15 Bosporus Strait/178 696,000 Libyan Crude 76/05/12 North Coast of Spain/145 670,000 Kuwait Crude 80/02/23 Off Pilos, Greece/142 600,000 Libyan Crude 89/12/19 Atlantic, 100 Mi. from Morocco/109 560,000 Iranian Lt. Crude 92/12/03 Port of La Coruna Spain/145 521,429 Brent Lt. Crude 85/12/06 Arabian Gulf/103 500,000 Iranian Lt. Crude 75/05/13 Caribbean Sea 60 Mi. NW of Puerto Rico/43 420,000 Venezuela Crude 92/04/17 Maputo Bay, Mozambique/404 380,952 Heavy #6 Fuel Oil 74/11/09 Tokyo Bay/131 375,000 Naphtha 83/01/07 58 Mi. from Muscat, Oman/103 370,000 Iranian Crude 78/12/31 Bay of Biscay, Spain/145 350,000 Iranian Crude 75/01/10 180 Mi. W of Iwo Jima/95 337,000 Crude 74/08/09 Magellan Strait, Chile/486 330,000 Lt. Arabian Crude 83/12/10 Arabian Gulf/103 324,000 Lt. Arabian Crude 78/12/07 Strait of Malacca, Indonesia/26 314,142 Crude 75/01/29 Port Leixoes, Portugal/145 300,000 Iranian Crude
Table 4.6: Worldwide Tanker Spill Statistics (1974-1992) [3])
Spill Size (BBL) Number Total Volume Spilled (BBLs)
1000-14,999 15,000-49,999 50,000-199,999 200,000+
108 38 33 34
566,500 1,024,000 3,548,500
16,789,500
Totals 213 21,928,500
Worldwide Tanker Spill Statistics (1974-1992)
020406080
1000-14,999 15,000-49,999 50,000-199,999 200,000+
Individual Spill Size (bbl)
Perc
ent
% of Total Number of Spills % of Total Volume Spilled
Major Accidents E&P Forum QRA Datasheet Directory Rev 0
13/06/2003 MAJORACC.DOC Page 15
Table 4.7: Comparison of Spills During 5-Year Periods [3] [4])
5-Year Period 1976-80 1981-85 1986-90 Number of Volume of Number of Volume of Number of Volume of
Spill Category Spills Spills (bbl) Spills Spills Spills Spills Small GOM Spill 21 4243 27 4747 9.0 1073.0
% of Total 22.83 1 28.7 2.5 13.8 0.2Large GOM Spill 3 6956 1.0 5100.0 3.0 34568.0
% of Total 3.26 1 1.1 2.7 4.6 7.2Blowouts GOM** 40 0 44.0 104.0 33.0 80.0
% of Total 43.48 0 46.8 0.1 50.8 0.0Tanker Spills US 28 770000 22.0 180000.0 20.0 445000.0
% of Total 30.43 99 23.4 94.8 30.8 92.6Total 92 781199 94 189951 65 480721
** Blowouts that have oil releases are also counted in the small or large spill results.
Comparison of US Spills During 5-Year Periods
0.00
20.00
40.00
60.00
80.00
100.00
# of Spills Vol. of Spills # of Spills Vol. of Spills # of Spills Vol. of Spills
5-Year Periods
Percent
Small Platform Spills in US GOM Large Platform Spills in US GOM Blowout Spills in US GOM Tanker Spills in US Waters
1976-80 1981-85 1986-90
Major Accidents E&P Forum QRA Datasheet Directory Rev 0
13/06/2003 MAJORACC.DOC Page 16
REFERENCES
1. WOAD - Worldwide Offshore Accident Databank Version 4.10 - DNV Technica 2. A. Manuele, “One Hundred Largest Losses - A Thirty Year Review of Property Damage
Losses in the Hydrocarbon - Chemical Industries”, Marsh & McLennan Protection Consultants, April 1986.
3. “Accidents Associated with Oil and Gas Operations”, OCS 1956-1990, OCS MMS 92-
0058, October 1992, U.S. Minerals Management Services, Department of Interior. 4. Worldwide Tanker Spill Database, US Mineral Management Services, US Department of
Interior.
5. D. Mahoney, “Large Property Damage Losses in the Hydrocarbon - Chemical Industries.” A Thirty-year Review, Sixteenth Edition, Marsh & McLennan Protection Consultants, 1995

Major Accidents E&P Forum QRA Datasheet Directory Rev 0
13/06/2003 MAJORACC.DOC Page 17
6.

Work Related Accidents E&P Forum QRA Datasheet Directory Rev 0
13/06/2003 WRKRLACC.DOC Page 1
WORK RELATED ACCIDENTS
Work Related Accidents E&P Forum QRA Datasheet Directory Rev 0
13/06/2003 WRKRLACC.DOC Page 2
TABLE OF CONTENTS
1. WORK RELATED FATAL ACCIDENT RATES
1.1 SUMMARY------------------------------------------------------------------------------------------- 3
1.1.1 Scope -------------------------------------------------------------------------------------------------------------------3
1.1.2 Application------------------------------------------------------------------------------------------------------------3
1.2 KEY DATA------------------------------------------------------------------------------------------- 3
2. WORK RELATED LOST TIME ACCIDENT RATES
2.1 SUMMARY----------------------------------------------------------------------------------------- 10
2.1.1 Scope ----------------------------------------------------------------------------------------------------------------- 10
2.1.2 Application---------------------------------------------------------------------------------------------------------- 10
2.2 KEY DATA----------------------------------------------------------------------------------------- 10
REFERENCES----------------------------------------------------------------------------------------- 14
Work Related Accidents E&P Forum QRA Datasheet Directory Rev 0
13/06/2003 WRKRLACC.DOC Page 3
1. WORK RELATED FATAL ACCIDENT RATES
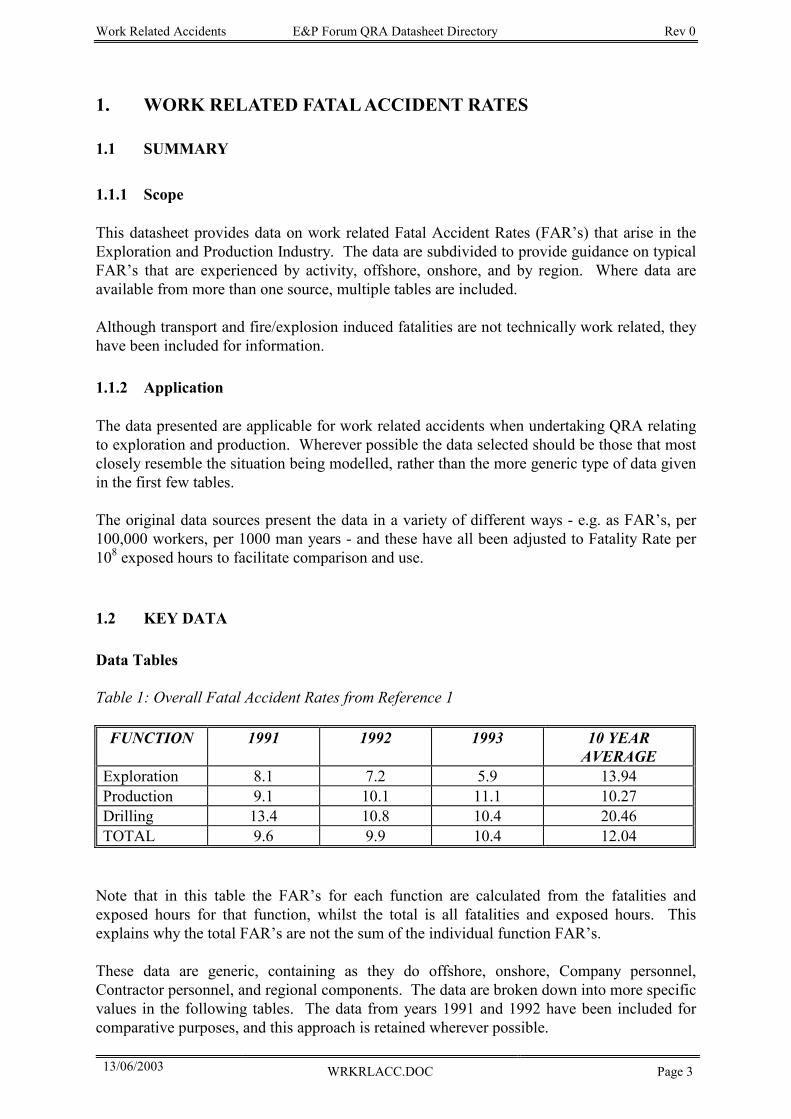
1.1 SUMMARY 1.1.1 Scope This datasheet provides data on work related Fatal Accident Rates (FAR’s) that arise in the Exploration and Production Industry. The data are subdivided to provide guidance on typical FAR’s that are experienced by activity, offshore, onshore, and by region. Where data are available from more than one source, multiple tables are included. Although transport and fire/explosion induced fatalities are not technically work related, they have been included for information. 1.1.2 Application The data presented are applicable for work related accidents when undertaking QRA relating to exploration and production. Wherever possible the data selected should be those that most closely resemble the situation being modelled, rather than the more generic type of data given in the first few tables. The original data sources present the data in a variety of different ways - e.g. as FAR’s, per 100,000 workers, per 1000 man years - and these have all been adjusted to Fatality Rate per 108 exposed hours to facilitate comparison and use.
1.2 KEY DATA Data Tables Table 1: Overall Fatal Accident Rates from Reference 1
FUNCTION 1991 1992 1993 10 YEAR AVERAGE
Exploration 8.1 7.2 5.9 13.94 Production 9.1 10.1 11.1 10.27 Drilling 13.4 10.8 10.4 20.46 TOTAL 9.6 9.9 10.4 12.04
Note that in this table the FAR’s for each function are calculated from the fatalities and exposed hours for that function, whilst the total is all fatalities and exposed hours. This explains why the total FAR’s are not the sum of the individual function FAR’s. These data are generic, containing as they do offshore, onshore, Company personnel, Contractor personnel, and regional components. The data are broken down into more specific values in the following tables. The data from years 1991 and 1992 have been included for comparative purposes, and this approach is retained wherever possible.
Work Related Accidents E&P Forum QRA Datasheet Directory Rev 0
13/06/2003 WRKRLACC.DOC Page 4
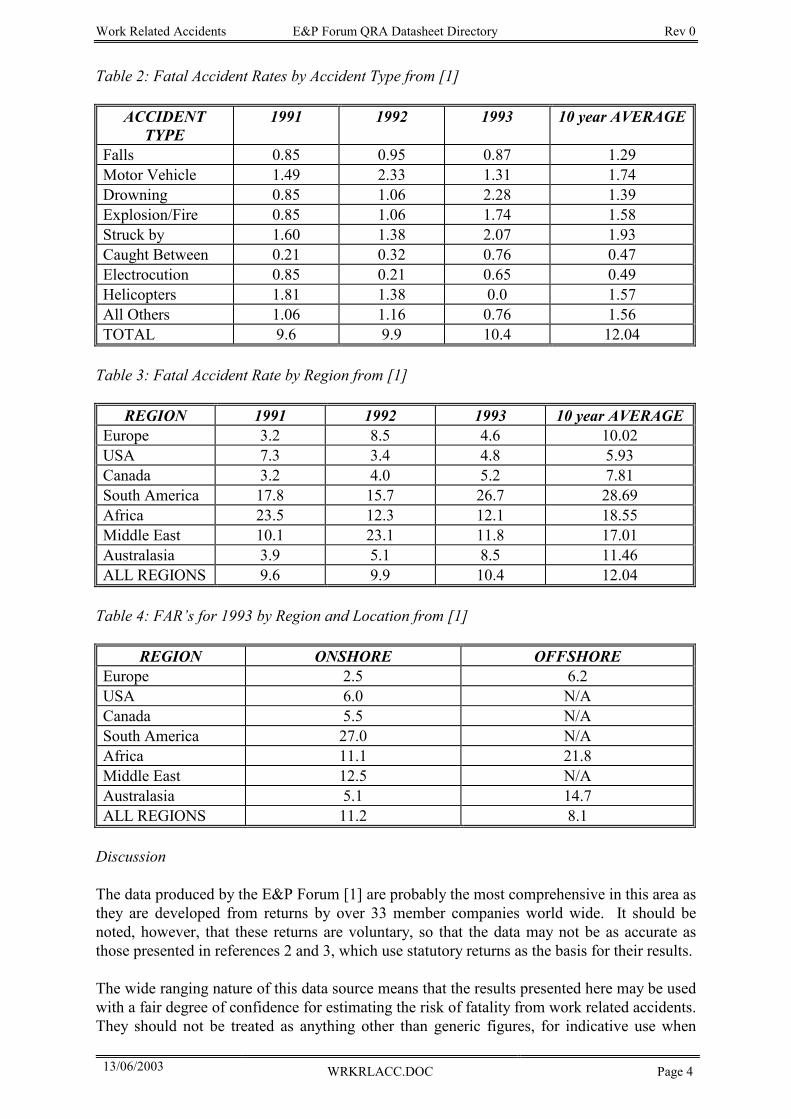
Table 2: Fatal Accident Rates by Accident Type from [1]
ACCIDENT TYPE
1991 1992 1993 10 year AVERAGE
Falls 0.85 0.95 0.87 1.29 Motor Vehicle 1.49 2.33 1.31 1.74 Drowning 0.85 1.06 2.28 1.39 Explosion/Fire 0.85 1.06 1.74 1.58 Struck by 1.60 1.38 2.07 1.93 Caught Between 0.21 0.32 0.76 0.47 Electrocution 0.85 0.21 0.65 0.49 Helicopters 1.81 1.38 0.0 1.57 All Others 1.06 1.16 0.76 1.56 TOTAL 9.6 9.9 10.4 12.04
Table 3: Fatal Accident Rate by Region from [1]
REGION 1991 1992 1993 10 year AVERAGE Europe 3.2 8.5 4.6 10.02 USA 7.3 3.4 4.8 5.93 Canada 3.2 4.0 5.2 7.81 South America 17.8 15.7 26.7 28.69 Africa 23.5 12.3 12.1 18.55 Middle East 10.1 23.1 11.8 17.01 Australasia 3.9 5.1 8.5 11.46 ALL REGIONS 9.6 9.9 10.4 12.04
Table 4: FAR’s for 1993 by Region and Location from [1]
REGION ONSHORE OFFSHORE Europe 2.5 6.2 USA 6.0 N/A Canada 5.5 N/A South America 27.0 N/A Africa 11.1 21.8 Middle East 12.5 N/A Australasia 5.1 14.7 ALL REGIONS 11.2 8.1
Discussion
The data produced by the E&P Forum [1] are probably the most comprehensive in this area as they are developed from returns by over 33 member companies world wide. It should be noted, however, that these returns are voluntary, so that the data may not be as accurate as those presented in references 2 and 3, which use statutory returns as the basis for their results. The wide ranging nature of this data source means that the results presented here may be used with a fair degree of confidence for estimating the risk of fatality from work related accidents. They should not be treated as anything other than generic figures, for indicative use when
Work Related Accidents E&P Forum QRA Datasheet Directory Rev 0
13/06/2003 WRKRLACC.DOC Page 5
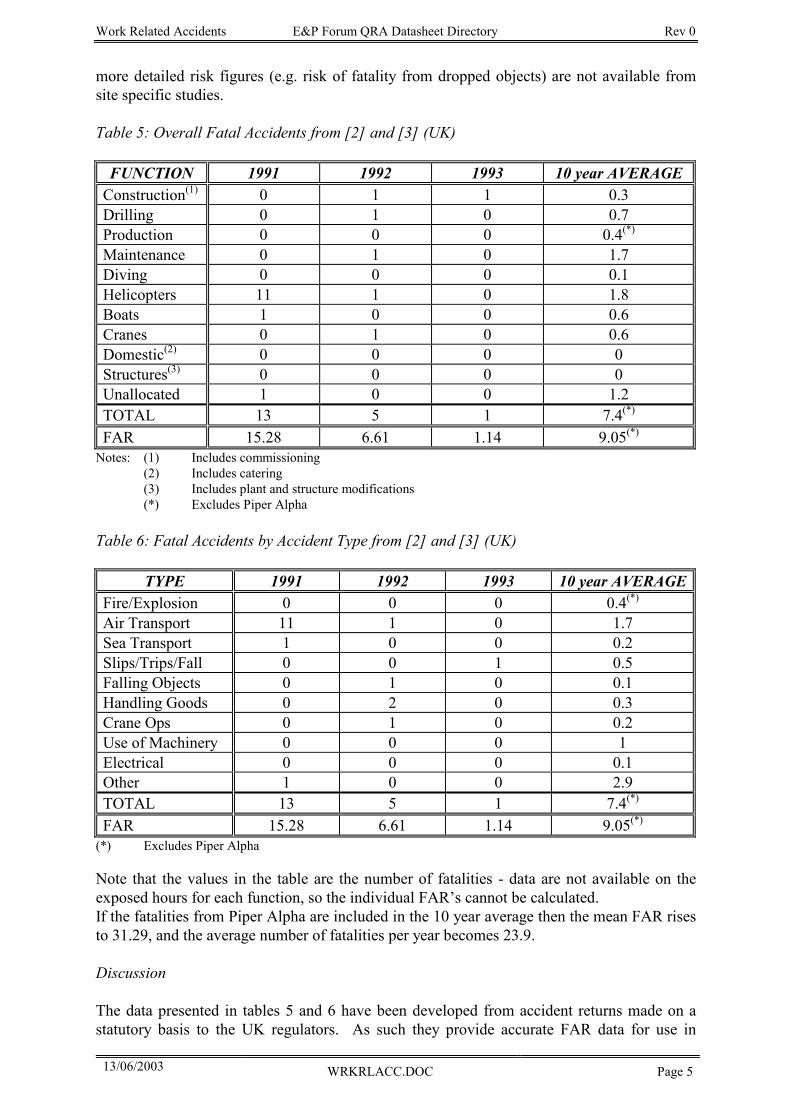
more detailed risk figures (e.g. risk of fatality from dropped objects) are not available from site specific studies. Table 5: Overall Fatal Accidents from [2] and [3] (UK)
FUNCTION 1991 1992 1993 10 year AVERAGE Construction(1) 0 1 1 0.3 Drilling 0 1 0 0.7 Production 0 0 0 0.4(*) Maintenance 0 1 0 1.7 Diving 0 0 0 0.1 Helicopters 11 1 0 1.8 Boats 1 0 0 0.6 Cranes 0 1 0 0.6 Domestic(2) 0 0 0 0 Structures(3) 0 0 0 0 Unallocated 1 0 0 1.2 TOTAL 13 5 1 7.4(*) FAR 15.28 6.61 1.14 9.05(*)
Notes: (1) Includes commissioning (2) Includes catering (3) Includes plant and structure modifications (*) Excludes Piper Alpha Table 6: Fatal Accidents by Accident Type from [2] and [3] (UK)
TYPE 1991 1992 1993 10 year AVERAGEFire/Explosion 0 0 0 0.4(*) Air Transport 11 1 0 1.7 Sea Transport 1 0 0 0.2 Slips/Trips/Fall 0 0 1 0.5 Falling Objects 0 1 0 0.1 Handling Goods 0 2 0 0.3 Crane Ops 0 1 0 0.2 Use of Machinery 0 0 0 1 Electrical 0 0 0 0.1 Other 1 0 0 2.9 TOTAL 13 5 1 7.4(*) FAR 15.28 6.61 1.14 9.05(*)
(*) Excludes Piper Alpha Note that the values in the table are the number of fatalities - data are not available on the exposed hours for each function, so the individual FAR’s cannot be calculated. If the fatalities from Piper Alpha are included in the 10 year average then the mean FAR rises to 31.29, and the average number of fatalities per year becomes 23.9. Discussion
The data presented in tables 5 and 6 have been developed from accident returns made on a statutory basis to the UK regulators. As such they provide accurate FAR data for use in
Work Related Accidents E&P Forum QRA Datasheet Directory Rev 0
13/06/2003 WRKRLACC.DOC Page 6
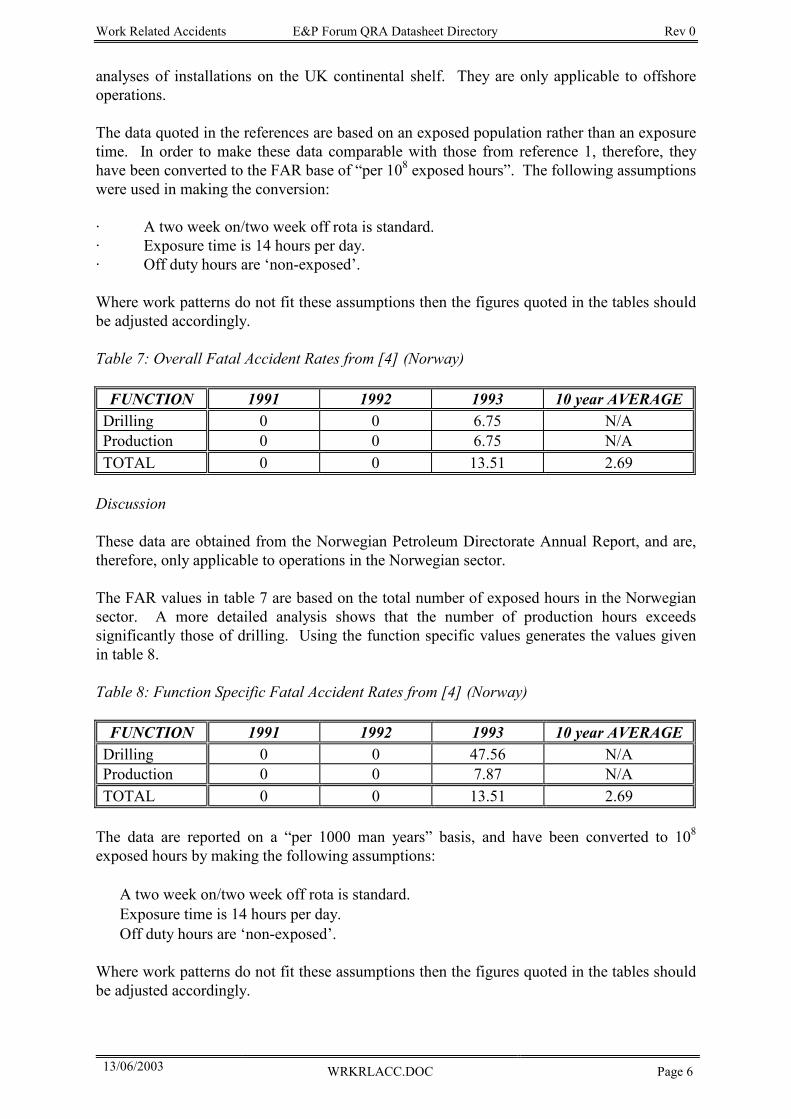
analyses of installations on the UK continental shelf. They are only applicable to offshore operations. The data quoted in the references are based on an exposed population rather than an exposure time. In order to make these data comparable with those from reference 1, therefore, they have been converted to the FAR base of “per 108 exposed hours”. The following assumptions were used in making the conversion: · A two week on/two week off rota is standard. · Exposure time is 14 hours per day. · Off duty hours are ‘non-exposed’. Where work patterns do not fit these assumptions then the figures quoted in the tables should be adjusted accordingly. Table 7: Overall Fatal Accident Rates from [4] (Norway)
FUNCTION 1991 1992 1993 10 year AVERAGE Drilling 0 0 6.75 N/A Production 0 0 6.75 N/A TOTAL 0 0 13.51 2.69
Discussion
These data are obtained from the Norwegian Petroleum Directorate Annual Report, and are, therefore, only applicable to operations in the Norwegian sector. The FAR values in table 7 are based on the total number of exposed hours in the Norwegian sector. A more detailed analysis shows that the number of production hours exceeds significantly those of drilling. Using the function specific values generates the values given in table 8. Table 8: Function Specific Fatal Accident Rates from [4] (Norway)
FUNCTION 1991 1992 1993 10 year AVERAGE Drilling 0 0 47.56 N/A Production 0 0 7.87 N/A TOTAL 0 0 13.51 2.69
The data are reported on a “per 1000 man years” basis, and have been converted to 108
exposed hours by making the following assumptions: • A two week on/two week off rota is standard. • Exposure time is 14 hours per day. • Off duty hours are ‘non-exposed’. Where work patterns do not fit these assumptions then the figures quoted in the tables should be adjusted accordingly.
Work Related Accidents E&P Forum QRA Datasheet Directory Rev 0
13/06/2003 WRKRLACC.DOC Page 7
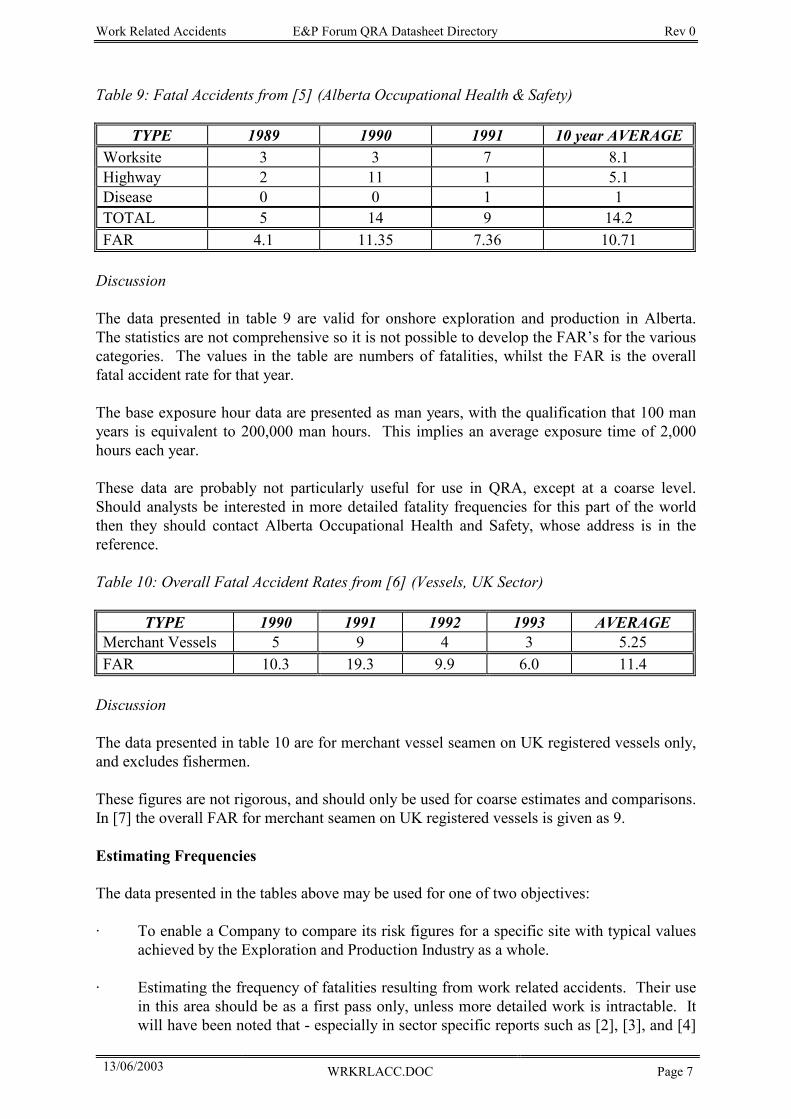
Table 9: Fatal Accidents from [5] (Alberta Occupational Health & Safety)
TYPE 1989 1990 1991 10 year AVERAGE Worksite 3 3 7 8.1 Highway 2 11 1 5.1 Disease 0 0 1 1 TOTAL 5 14 9 14.2 FAR 4.1 11.35 7.36 10.71
Discussion
The data presented in table 9 are valid for onshore exploration and production in Alberta. The statistics are not comprehensive so it is not possible to develop the FAR’s for the various categories. The values in the table are numbers of fatalities, whilst the FAR is the overall fatal accident rate for that year. The base exposure hour data are presented as man years, with the qualification that 100 man years is equivalent to 200,000 man hours. This implies an average exposure time of 2,000 hours each year. These data are probably not particularly useful for use in QRA, except at a coarse level. Should analysts be interested in more detailed fatality frequencies for this part of the world then they should contact Alberta Occupational Health and Safety, whose address is in the reference. Table 10: Overall Fatal Accident Rates from [6] (Vessels, UK Sector)
TYPE 1990 1991 1992 1993 AVERAGE Merchant Vessels 5 9 4 3 5.25 FAR 10.3 19.3 9.9 6.0 11.4
Discussion
The data presented in table 10 are for merchant vessel seamen on UK registered vessels only, and excludes fishermen. These figures are not rigorous, and should only be used for coarse estimates and comparisons. In [7] the overall FAR for merchant seamen on UK registered vessels is given as 9. Estimating Frequencies The data presented in the tables above may be used for one of two objectives: · To enable a Company to compare its risk figures for a specific site with typical values achieved by the Exploration and Production Industry as a whole. · Estimating the frequency of fatalities resulting from work related accidents. Their use
in this area should be as a first pass only, unless more detailed work is intractable. It will have been noted that - especially in sector specific reports such as [2], [3], and [4]
Work Related Accidents E&P Forum QRA Datasheet Directory Rev 0
13/06/2003 WRKRLACC.DOC Page 8
- the FAR values vary significantly from one year to the next, and this severely limits their use as a definitive tool.
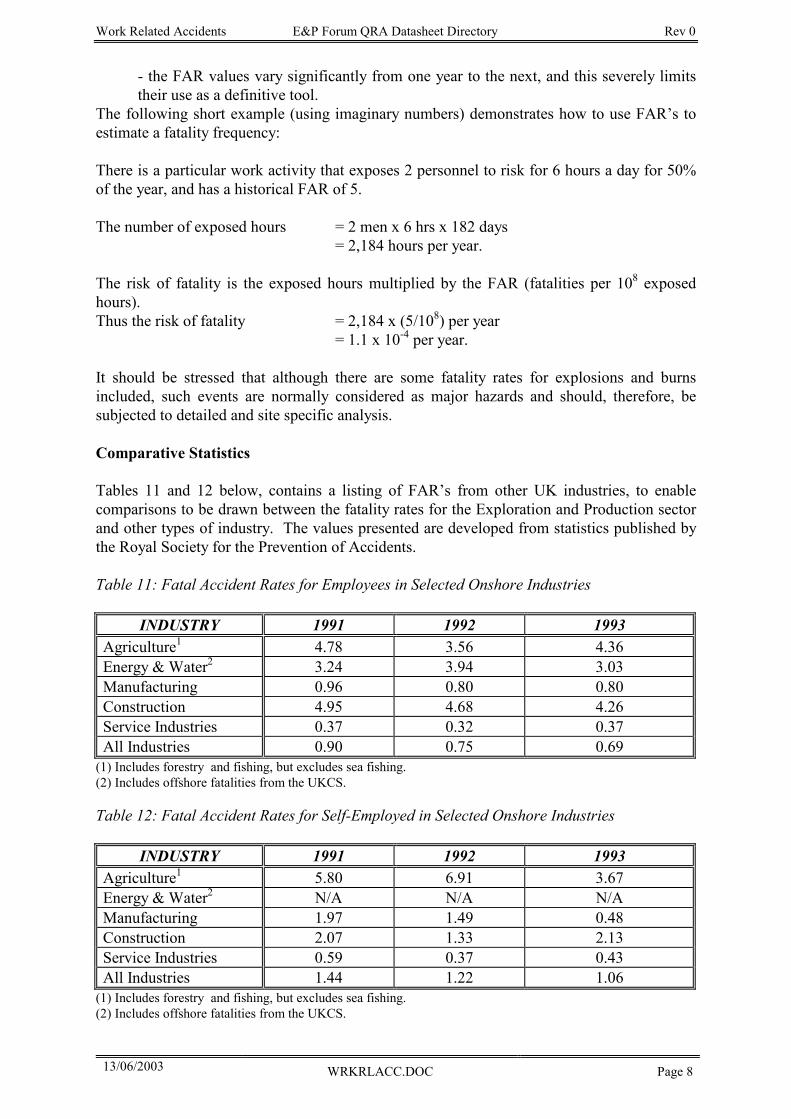
The following short example (using imaginary numbers) demonstrates how to use FAR’s to estimate a fatality frequency: There is a particular work activity that exposes 2 personnel to risk for 6 hours a day for 50% of the year, and has a historical FAR of 5. The number of exposed hours = 2 men x 6 hrs x 182 days = 2,184 hours per year. The risk of fatality is the exposed hours multiplied by the FAR (fatalities per 108 exposed hours). Thus the risk of fatality = 2,184 x (5/108) per year = 1.1 x 10⁻⁴ per year. It should be stressed that although there are some fatality rates for explosions and burns included, such events are normally considered as major hazards and should, therefore, be subjected to detailed and site specific analysis. Comparative Statistics Tables 11 and 12 below, contains a listing of FAR’s from other UK industries, to enable comparisons to be drawn between the fatality rates for the Exploration and Production sector and other types of industry. The values presented are developed from statistics published by the Royal Society for the Prevention of Accidents. Table 11: Fatal Accident Rates for Employees in Selected Onshore Industries
INDUSTRY 1991 1992 1993 Agriculture1 4.78 3.56 4.36 Energy & Water2 3.24 3.94 3.03 Manufacturing 0.96 0.80 0.80 Construction 4.95 4.68 4.26 Service Industries 0.37 0.32 0.37 All Industries 0.90 0.75 0.69
(1) Includes forestry and fishing, but excludes sea fishing. (2) Includes offshore fatalities from the UKCS. Table 12: Fatal Accident Rates for Self-Employed in Selected Onshore Industries
INDUSTRY 1991 1992 1993 Agriculture1 5.80 6.91 3.67 Energy & Water2 N/A N/A N/A Manufacturing 1.97 1.49 0.48 Construction 2.07 1.33 2.13 Service Industries 0.59 0.37 0.43 All Industries 1.44 1.22 1.06
(1) Includes forestry and fishing, but excludes sea fishing. (2) Includes offshore fatalities from the UKCS.
Work Related Accidents E&P Forum QRA Datasheet Directory Rev 0
13/06/2003 WRKRLACC.DOC Page 9
These data are presented on a “per 100,000” basis, and have been converted to FAR’s using the following assumptions: · 8 hours exposure per day. · 5 days exposure per week. · 20 days holiday per worker, and 8 statutory holiday days per year. This results in a exposure time of 1,880 hours per worker per year. If appropriate the values in the table should be adjusted when used for comparative purposes. Ongoing Research Although the term research is not particularly appropriate, it is fair to say that fatality statistics are collected and published on an ongoing, annual, basis. It is entirely possible, therefore, to track the performance of the industry, or a particular sector within it, to assess and analyse the trends in safety performance.
Work Related Accidents E&P Forum QRA Datasheet Directory Rev 0
13/06/2003 WRKRLACC.DOC Page 10
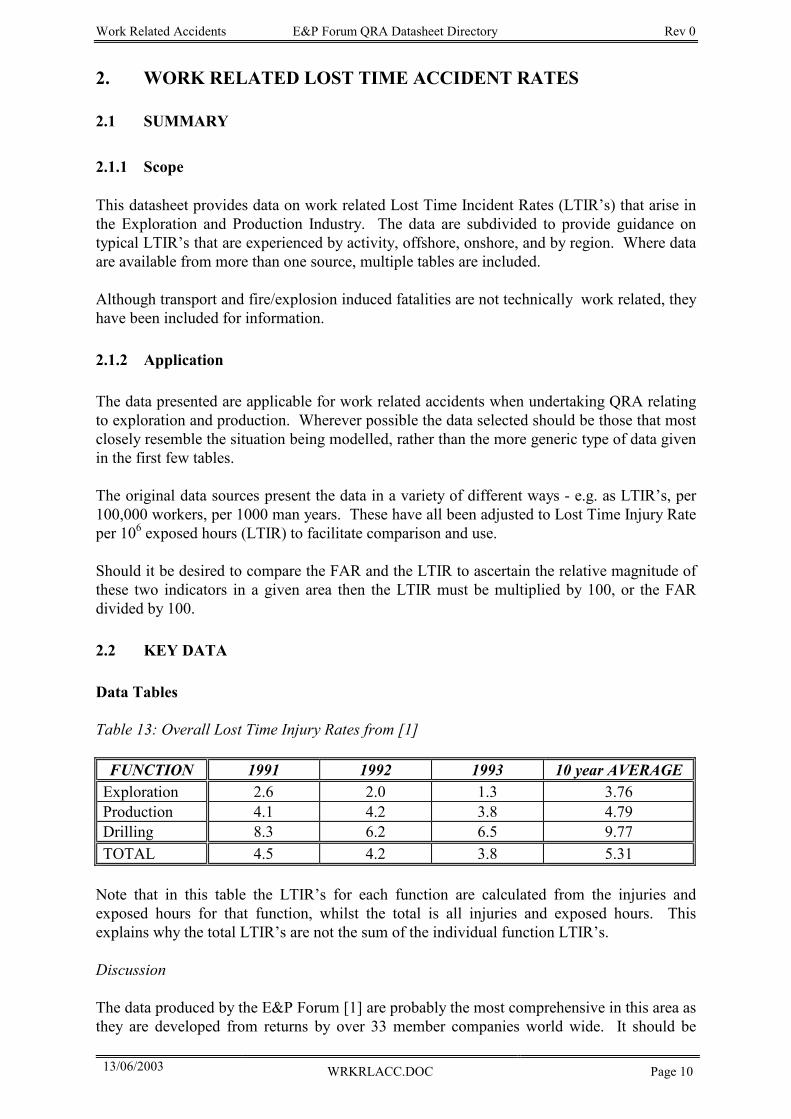
2. WORK RELATED LOST TIME ACCIDENT RATES 2.1 SUMMARY 2.1.1 Scope This datasheet provides data on work related Lost Time Incident Rates (LTIR’s) that arise in the Exploration and Production Industry. The data are subdivided to provide guidance on typical LTIR’s that are experienced by activity, offshore, onshore, and by region. Where data are available from more than one source, multiple tables are included. Although transport and fire/explosion induced fatalities are not technically work related, they have been included for information. 2.1.2 Application The data presented are applicable for work related accidents when undertaking QRA relating to exploration and production. Wherever possible the data selected should be those that most closely resemble the situation being modelled, rather than the more generic type of data given in the first few tables. The original data sources present the data in a variety of different ways - e.g. as LTIR’s, per 100,000 workers, per 1000 man years. These have all been adjusted to Lost Time Injury Rate per 106 exposed hours (LTIR) to facilitate comparison and use. Should it be desired to compare the FAR and the LTIR to ascertain the relative magnitude of these two indicators in a given area then the LTIR must be multiplied by 100, or the FAR divided by 100. 2.2 KEY DATA Data Tables Table 13: Overall Lost Time Injury Rates from [1]
FUNCTION 1991 1992 1993 10 year AVERAGE Exploration 2.6 2.0 1.3 3.76 Production 4.1 4.2 3.8 4.79 Drilling 8.3 6.2 6.5 9.77 TOTAL 4.5 4.2 3.8 5.31
Note that in this table the LTIR’s for each function are calculated from the injuries and exposed hours for that function, whilst the total is all injuries and exposed hours. This explains why the total LTIR’s are not the sum of the individual function LTIR’s. Discussion
The data produced by the E&P Forum [1] are probably the most comprehensive in this area as they are developed from returns by over 33 member companies world wide. It should be
Work Related Accidents E&P Forum QRA Datasheet Directory Rev 0
13/06/2003 WRKRLACC.DOC Page 11
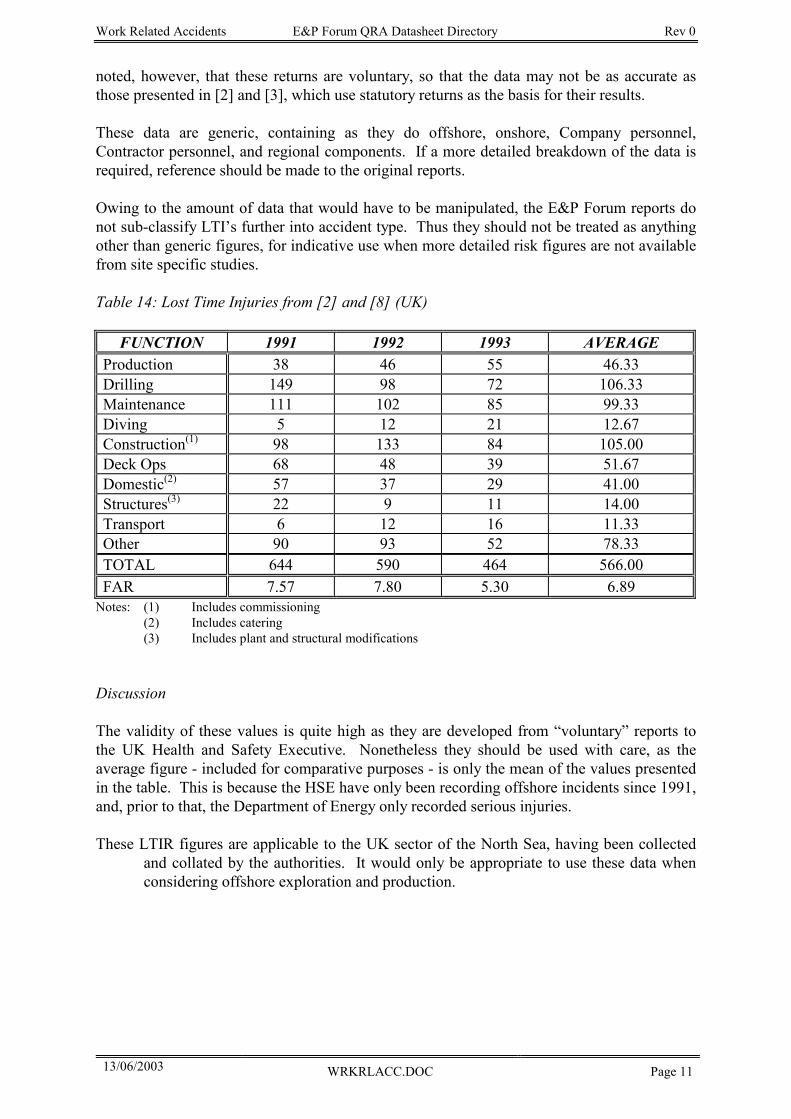
noted, however, that these returns are voluntary, so that the data may not be as accurate as those presented in [2] and [3], which use statutory returns as the basis for their results. These data are generic, containing as they do offshore, onshore, Company personnel, Contractor personnel, and regional components. If a more detailed breakdown of the data is required, reference should be made to the original reports. Owing to the amount of data that would have to be manipulated, the E&P Forum reports do not sub-classify LTI’s further into accident type. Thus they should not be treated as anything other than generic figures, for indicative use when more detailed risk figures are not available from site specific studies. Table 14: Lost Time Injuries from [2] and [8] (UK)
FUNCTION 1991 1992 1993 AVERAGE Production 38 46 55 46.33 Drilling 149 98 72 106.33 Maintenance 111 102 85 99.33 Diving 5 12 21 12.67 Construction(1) 98 133 84 105.00 Deck Ops 68 48 39 51.67 Domestic(2) 57 37 29 41.00 Structures(3) 22 9 11 14.00 Transport 6 12 16 11.33 Other 90 93 52 78.33 TOTAL 644 590 464 566.00 FAR 7.57 7.80 5.30 6.89
Notes: (1) Includes commissioning (2) Includes catering (3) Includes plant and structural modifications
Discussion
The validity of these values is quite high as they are developed from “voluntary” reports to the UK Health and Safety Executive. Nonetheless they should be used with care, as the average figure - included for comparative purposes - is only the mean of the values presented in the table. This is because the HSE have only been recording offshore incidents since 1991, and, prior to that, the Department of Energy only recorded serious injuries. These LTIR figures are applicable to the UK sector of the North Sea, having been collected
and collated by the authorities. It would only be appropriate to use these data when considering offshore exploration and production.
Work Related Accidents E&P Forum QRA Datasheet Directory Rev 0
13/06/2003 WRKRLACC.DOC Page 12
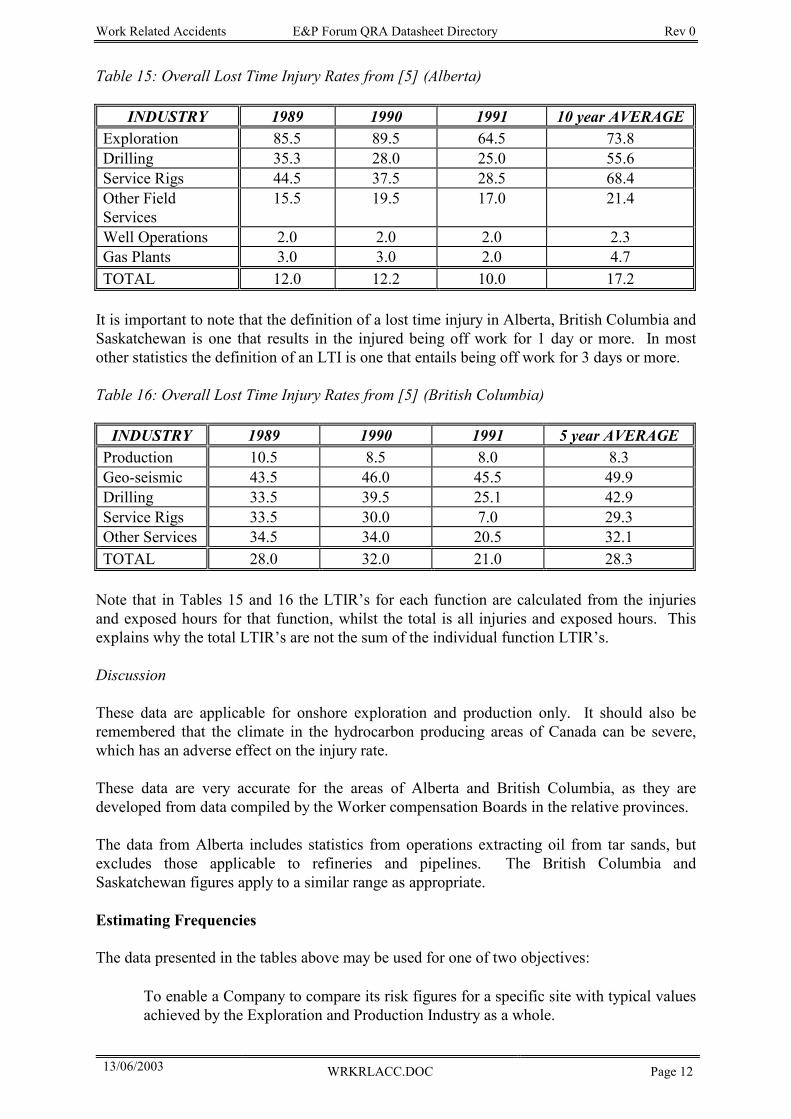
Table 15: Overall Lost Time Injury Rates from [5] (Alberta)
INDUSTRY 1989 1990 1991 10 year AVERAGE Exploration 85.5 89.5 64.5 73.8 Drilling 35.3 28.0 25.0 55.6 Service Rigs 44.5 37.5 28.5 68.4 Other Field Services
15.5 19.5 17.0 21.4
Well Operations 2.0 2.0 2.0 2.3 Gas Plants 3.0 3.0 2.0 4.7 TOTAL 12.0 12.2 10.0 17.2
It is important to note that the definition of a lost time injury in Alberta, British Columbia and Saskatchewan is one that results in the injured being off work for 1 day or more. In most other statistics the definition of an LTI is one that entails being off work for 3 days or more. Table 16: Overall Lost Time Injury Rates from [5] (British Columbia)
INDUSTRY 1989 1990 1991 5 year AVERAGE Production 10.5 8.5 8.0 8.3 Geo-seismic 43.5 46.0 45.5 49.9 Drilling 33.5 39.5 25.1 42.9 Service Rigs 33.5 30.0 7.0 29.3 Other Services 34.5 34.0 20.5 32.1 TOTAL 28.0 32.0 21.0 28.3
Note that in Tables 15 and 16 the LTIR’s for each function are calculated from the injuries and exposed hours for that function, whilst the total is all injuries and exposed hours. This explains why the total LTIR’s are not the sum of the individual function LTIR’s. Discussion
These data are applicable for onshore exploration and production only. It should also be remembered that the climate in the hydrocarbon producing areas of Canada can be severe, which has an adverse effect on the injury rate. These data are very accurate for the areas of Alberta and British Columbia, as they are developed from data compiled by the Worker compensation Boards in the relative provinces. The data from Alberta includes statistics from operations extracting oil from tar sands, but excludes those applicable to refineries and pipelines. The British Columbia and Saskatchewan figures apply to a similar range as appropriate. Estimating Frequencies The data presented in the tables above may be used for one of two objectives: • To enable a Company to compare its risk figures for a specific site with typical values
achieved by the Exploration and Production Industry as a whole.
Work Related Accidents E&P Forum QRA Datasheet Directory Rev 0
13/06/2003 WRKRLACC.DOC Page 13
• Estimating the frequency of injuries resulting from work related accidents. Their use in this area should be as a first pass only, unless more detailed work is intractable. In this regard the LTIR data are slightly less varied from year to year than those for fatalities, so a greater degree of confidence may be attached to such analyses.
The frequency estimation is performed in the same way as indicated in section 1.2 above: There is a particular work activity that exposes 2 personnel to a risk of injury for 6 hours a day for 50% of the year, and has a historical LTIR of 24. The number of exposed hours = 2 men x 6 hrs x 182 days = 2,184 hours per year. The frequency of injury is the exposed hours multiplied by the LTIR (injuries per 106 exposed hours). Thus the frequency of injury = 2,184 x (24/106) per year = 5.24 x 10⁻² per year. This is equivalent to 1 injury every 19 years. Note, however, that this is a less frequent use of these data and must be approached with a great deal of caution. This is because the LTIR cannot be used to estimate the risk of a particular injury. The outcome of a fatal accident is known - death, and risk values may be developed quite readily. With non-fatal accidents, however, there may be a multitude of consequences - for a fall these may range from a bruised arm to a broken back - which makes this analysis of less significance. The frequency of accidents may be estimated, but not their risk, unless a conditional probability can be assigned to each possible injury that may occur as a result of the accident. Comparative Statistics Comparative statistics have not been included for lost time injuries owing to their multiplicity and diversity. Analysts needing these data should approach the appropriate authorities in the areas of interest, or local accident prevention societies. Ongoing Research As with fatality statistics, the term research is not particularly appropriate. Injury statistics are collected and published on an ongoing, annual, basis by most regulatory authorities and many accident prevention societies (E.g. RoSPA in the UK). It is entirely possible, therefore, to track the performance of the industry, or a particular sector within it, to assess and analyse the trends in safety performance.
Work Related Accidents E&P Forum QRA Datasheet Directory Rev 0
13/06/2003 WRKRLACC.DOC Page 14
REFERENCES 1. Accident Data 1993, E&P Forum Report No. 6.37/212, August 1994, back to
Accident Data 1985, E&P Forum Report No. 6.8/131, December 1986. 2. Offshore Accident and Incident Statistics Report 1993, UK Health and Safety
Executive Offshore Technology Report No. OTO 94/010, October 1994 3. Development of the Oil and Gas Resources of the United Kingdom, Department of
Energy, 1991, ISBN 0 11 413705 6 4. Norwegian Petroleum Directorate, Annual Report 1993 5. Lost Time Injuries and Illnesses, Upstream Oil and Gas Industries, Alberta 1982 -
1991. Alberta Occupational Health and Safety, December 1992. 6. Casualties to Vessels and Accidents to Men, Return for 1993, Marine Accident
Investigation Board. 7. E&P Forum Member. 8. Offshore Accident and Incident Statistics Report 1994, UK Health and Safety
Executive Offshore Technology Report No. OTO 95/953, 1995

Work Related Accidents E&P Forum QRA Datasheet Directory Rev 0
13/06/2003 WRKRLACC.DOC Page 15

Land Transport E&P Forum QRA Datasheet Directory Rev 0
13/06/2003 LANDTRAN.DOC Page 1
LAND TRANSPORT
Land Transport E&P Forum QRA Datasheet Directory Rev 0
13/06/2003 LANDTRAN.DOC Page 2
TABLE OF CONTENTS
1. SUMMARY 31.1 Scope 3 1.2 Application 3
2. WORLDWIDE STATISTICAL DATA 4
2.1 Road Accidents 4 2.2 International Comparison of Road Deaths
5 3. UNITED KINGDOM: TRANSPORT STATISTICS 6
3.1 Road Transport 6 3.2 Risk Comparison of Transport Modes 7 3.3 Transport of Dangerous Substances 7
4. DESERT DRIVING STATISTICS 8
5. TRAFFIC ACCIDENTS DURING TRANSPORT OF PETROLEUM PRODUCTS 8
6. U.S.A. DATA 9
6.1 Introduction 9 6.2 Available Data 9
6.2.1 Road Transport - Trucks 9 6.2.2 Rail Transport 10
7. FURTHER DATA AVAILABLE 10
REFERENCES 11
Land Transport E&P Forum QRA Datasheet Directory Rev 0
13/06/2003 LANDTRAN.DOC Page 3
1. SUMMARY 1.1 Scope This data sheet provides information on land transport accident statistics for use in Quantitative Risk Assessment (QRA). The data sheet includes guidelines for the interpretation of data sources, references of which are given. Most of the data concern motor vehicles and rail transport, although some data for cyclists and pedestrians are also presented. 1.2 Application
This data sheet contains global data plus more detailed data from the USA and the United Kingdom. When using these data, it should be realised that they may not be directly applicable to the specific location under study. It is therefore strongly recommended that local data sources on accidents and transport risk from governmental or other national or regional institutions are accessed before using the data given in this sheet. Should these local data not be accessible, or their reliability/applicability be questioned, then the data in this data sheet could be used after factoring for local circumstances. The statistical information from the UK with certain assumptions can be used to derive general rules for areas elsewhere in Europe or the world: for example the influence of age and road type on accident rates. However, data which have been adjusted to allow for local circumstances should always be used with caution: the assumptions made are likely to be highly judgemental and hence may reduce the reliability of the adjusted data vis a vis reality. Each assumption shall be clearly documented so that an auditable trail is maintained.
Land Transport E&P Forum QRA Datasheet Directory Rev 0
13/06/2003 LANDTRAN.DOC Page 4
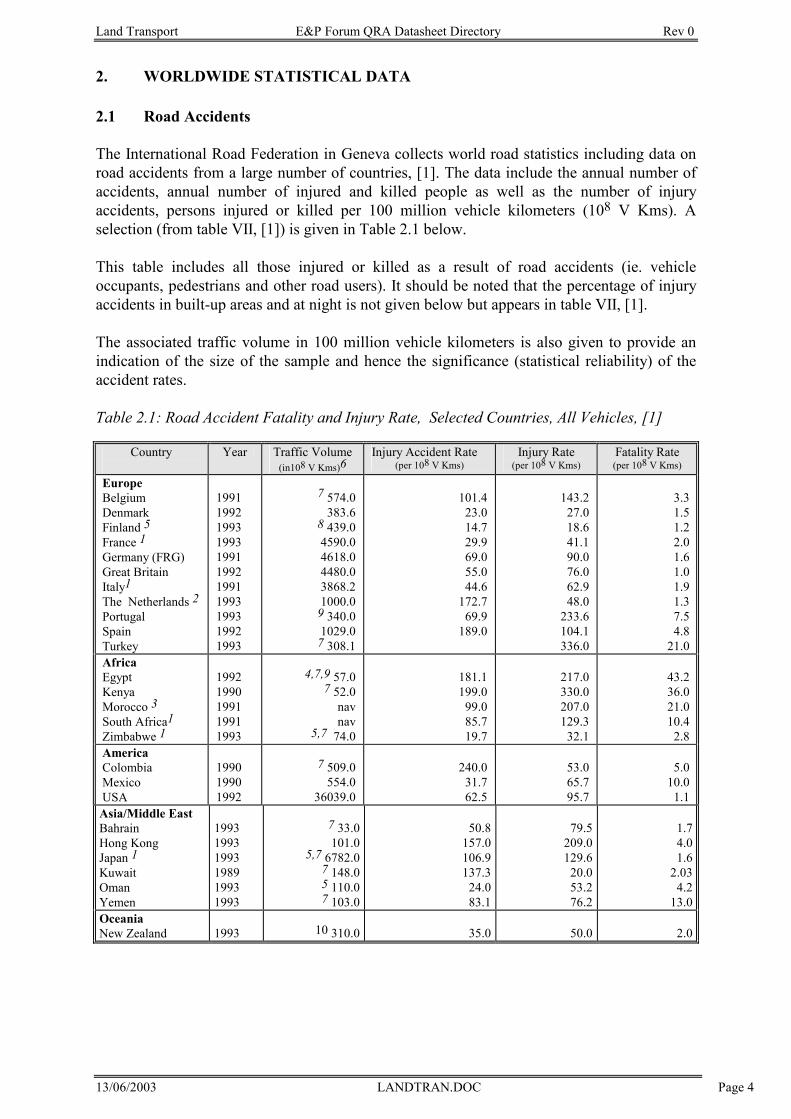
2. WORLDWIDE STATISTICAL DATA 2.1 Road Accidents The International Road Federation in Geneva collects world road statistics including data on road accidents from a large number of countries, [1]. The data include the annual number of accidents, annual number of injured and killed people as well as the number of injury accidents, persons injured or killed per 100 million vehicle kilometers (108 V Kms). A selection (from table VII, [1]) is given in Table 2.1 below. This table includes all those injured or killed as a result of road accidents (ie. vehicle occupants, pedestrians and other road users). It should be noted that the percentage of injury accidents in built-up areas and at night is not given below but appears in table VII, [1]. The associated traffic volume in 100 million vehicle kilometers is also given to provide an indication of the size of the sample and hence the significance (statistical reliability) of the accident rates. Table 2.1: Road Accident Fatality and Injury Rate, Selected Countries, All Vehicles, [1]
Country Year Traffic Volume (in108 V Kms)6
Injury Accident Rate (per 108 V Kms)
Injury Rate (per 108 V Kms)
Fatality Rate (per 108 V Kms)
Europe Belgium Denmark Finland 5 France 1Germany (FRG) Great Britain Italy1The Netherlands 2 Portugal Spain Turkey
1991 1992 1993 1993 1991 1992 1991 1993 1993 1992 1993
7 574.0
383.6 8 439.0
4590.0 4618.0 4480.0 3868.2 1000.0
9 340.0 1029.0
7 308.1
101.4
23.0 14.7 29.9 69.0 55.0 44.6
172.7 69.9
189.0
143.2
27.0 18.6 41.1 90.0 76.0 62.9 48.0
233.6 104.1 336.0
3.3 1.5 1.2 2.0 1.6 1.0 1.9 1.3 7.5 4.8
21.0 Africa Egypt Kenya Morocco 3 South Africa1Zimbabwe 1
1992 1990 1991 1991 1993
4,7,9 57.0
7 52.0 nav nav
5,7 74.0
181.1 199.0
99.0 85.7 19.7
217.0 330.0 207.0 129.3
32.1
43.2 36.0 21.0 10.4
2.8 America Colombia Mexico USA
1990 1990 1992
7 509.0
554.0 36039.0
240.0
31.7 62.5
53.0 65.7 95.7
5.0
10.0 1.1
Asia/Middle East Bahrain Hong Kong Japan 1 Kuwait Oman Yemen
1993 1993 1993 1989 1993 1993
7 33.0101.0
5,7 6782.07 148.05 110.07 103.0
50.8157.0106.9137.3
24.083.1
79.5209.0129.6
20.053.276.2
1.74.01.6
2.034.2
13.0Oceania New Zealand
1993 10 310.0 35.0 50.0 2.0
Land Transport E&P Forum QRA Datasheet Directory Rev 0
13/06/2003 LANDTRAN.DOC Page 5
Notes: 1 In accordance with the commonly agreed international definition, most countries define a fatality as
being due to a road accident if death occurs within 30 days of the accident. The official road accident statistics of some countries however limit the fatalities to those occurring within shorter periods after the accident. Where different, the actual definitions are given below and should be taken into account when comparing the data in the above table: France (6 days), Italy (7 days), Spain (24 hours), South Africa (6 days), Zimbabwe (on the spot) and Japan (24 hours).
2 Excluding casualties among cyclists. 3 Outside cities. 4 1993 figure. 5 1992 figure. 6 Total number of vehicle kilometers derived from table V, [1] by adding figures for each vehicle type. 7 2 wheeler kilometers not included (not available). 8 2 wheeler kilometers 1992 figure. 9 Goods vehicle kilometers not included (not available). 10 E&P Forum member data.
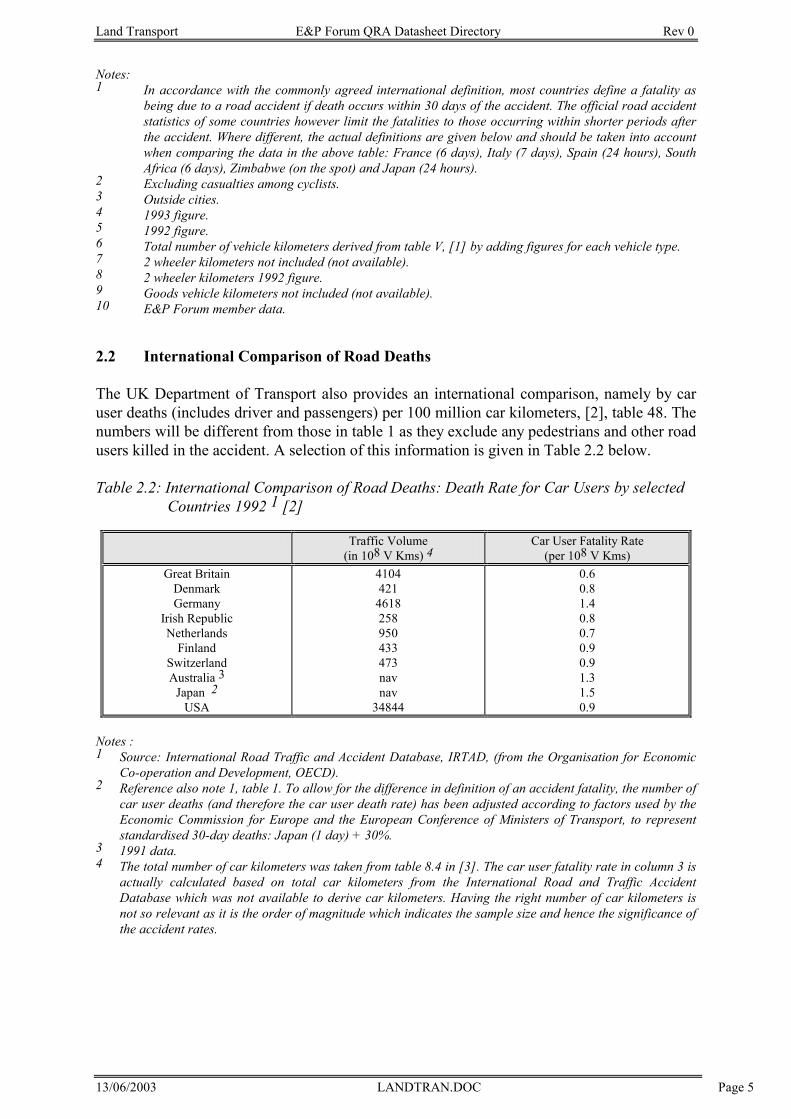
2.2 International Comparison of Road Deaths The UK Department of Transport also provides an international comparison, namely by car user deaths (includes driver and passengers) per 100 million car kilometers, [2], table 48. The numbers will be different from those in table 1 as they exclude any pedestrians and other road users killed in the accident. A selection of this information is given in Table 2.2 below.
Table 2.2: International Comparison of Road Deaths: Death Rate for Car Users by selected Countries 1992 1 [2]
Traffic Volume (in 108 V Kms) 4
Car User Fatality Rate (per 108 V Kms)
Great Britain Denmark Germany
Irish Republic Netherlands
Finland Switzerland Australia 3
Japan 2 USA
4104 421
4618 258 950 433 473 nav nav
34844
0.6 0.8 1.4 0.8 0.7 0.9 0.9 1.3 1.5 0.9
Notes : 1 Source: International Road Traffic and Accident Database, IRTAD, (from the Organisation for Economic
Co-operation and Development, OECD). 2 Reference also note 1, table 1. To allow for the difference in definition of an accident fatality, the number of
car user deaths (and therefore the car user death rate) has been adjusted according to factors used by the Economic Commission for Europe and the European Conference of Ministers of Transport, to represent standardised 30-day deaths: Japan (1 day) + 30%.
3 1991 data. 4 The total number of car kilometers was taken from table 8.4 in [3]. The car user fatality rate in column 3 is
actually calculated based on total car kilometers from the International Road and Traffic Accident Database which was not available to derive car kilometers. Having the right number of car kilometers is not so relevant as it is the order of magnitude which indicates the sample size and hence the significance of the accident rates.
Land Transport E&P Forum QRA Datasheet Directory Rev 0
13/06/2003 LANDTRAN.DOC Page 6
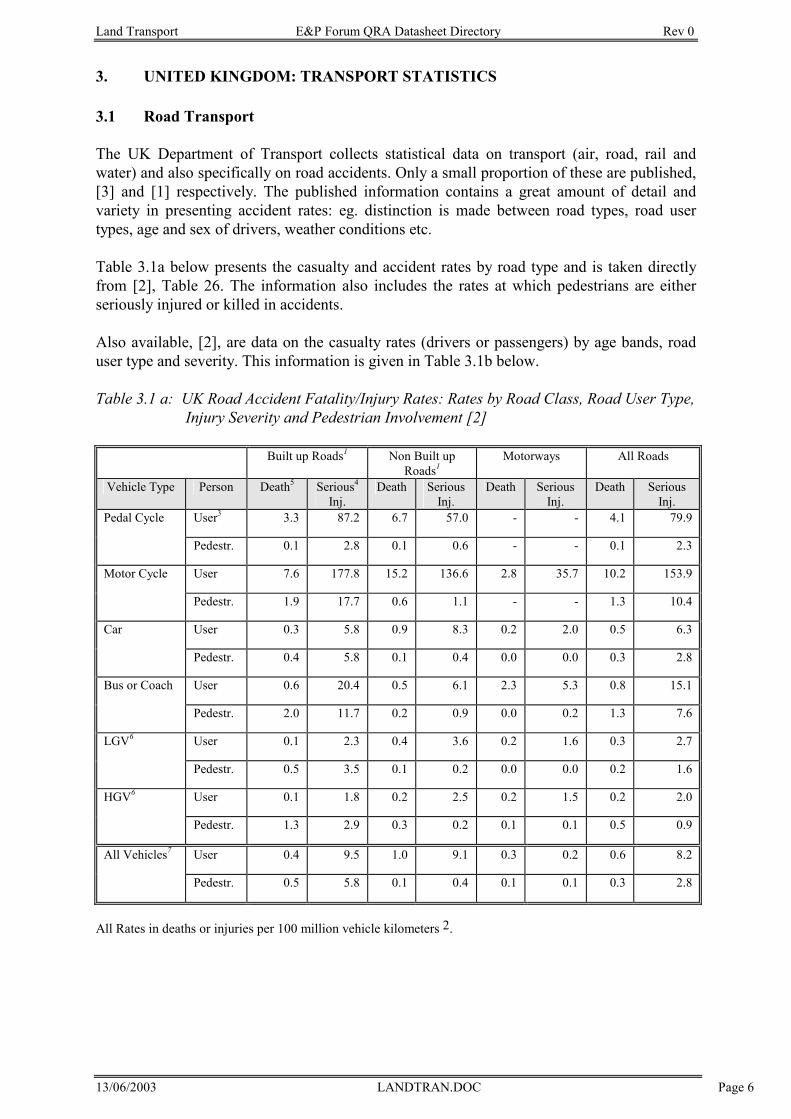
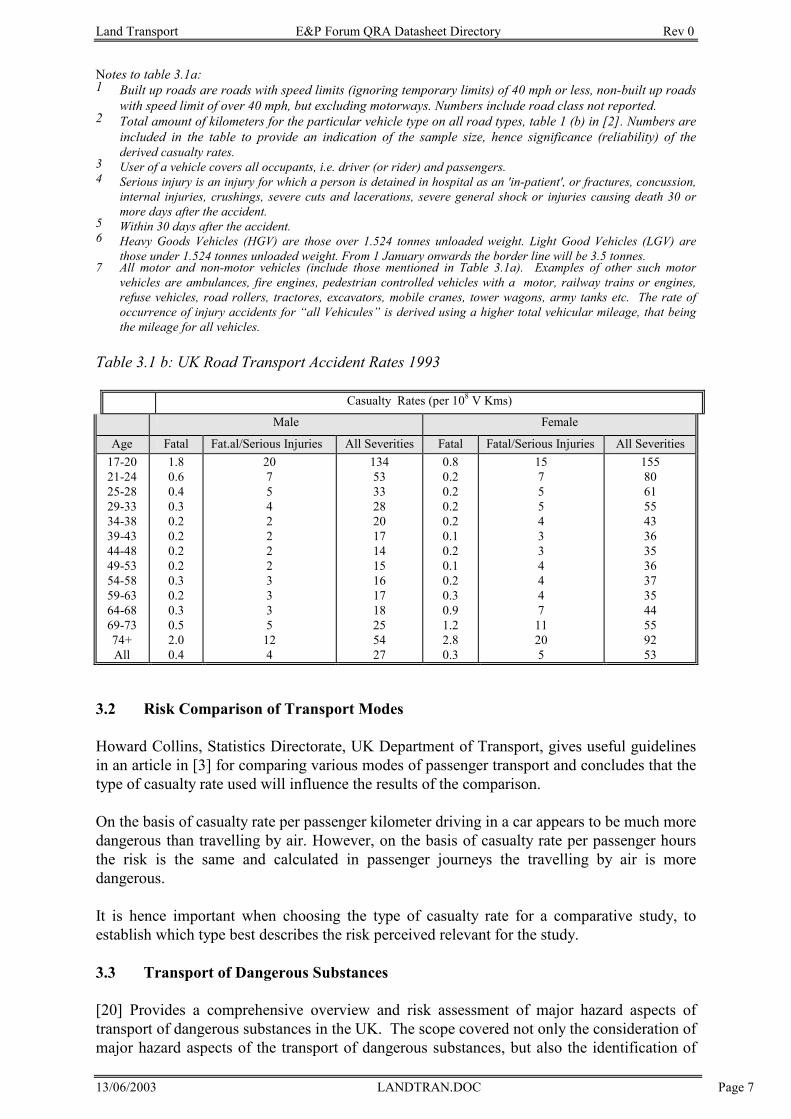
3. UNITED KINGDOM: TRANSPORT STATISTICS 3.1 Road Transport The UK Department of Transport collects statistical data on transport (air, road, rail and water) and also specifically on road accidents. Only a small proportion of these are published, [3] and [1] respectively. The published information contains a great amount of detail and variety in presenting accident rates: eg. distinction is made between road types, road user types, age and sex of drivers, weather conditions etc. Table 3.1a below presents the casualty and accident rates by road type and is taken directly from [2], Table 26. The information also includes the rates at which pedestrians are either seriously injured or killed in accidents. Also available, [2], are data on the casualty rates (drivers or passengers) by age bands, road user type and severity. This information is given in Table 3.1b below. Table 3.1 a: UK Road Accident Fatality/Injury Rates: Rates by Road Class, Road User Type,
Injury Severity and Pedestrian Involvement [2]
Built up Roads1 Non Built up Roads1
Motorways All Roads
Vehicle Type Person Death5 Serious4
Inj. Death Serious
Inj. Death Serious
Inj. Death Serious
Inj. Pedal Cycle User3 3.3 87.2 6.7 57.0 - - 4.1 79.9
Pedestr. 0.1 2.8 0.1 0.6 - - 0.1 2.3
Motor Cycle User 7.6 177.8 15.2 136.6 2.8 35.7 10.2 153.9
Pedestr. 1.9 17.7 0.6 1.1 - - 1.3 10.4
Car User 0.3 5.8 0.9 8.3 0.2 2.0 0.5 6.3
Pedestr. 0.4 5.8 0.1 0.4 0.0 0.0 0.3 2.8
Bus or Coach User 0.6 20.4 0.5 6.1 2.3 5.3 0.8 15.1
Pedestr. 2.0 11.7 0.2 0.9 0.0 0.2 1.3 7.6
LGV6 User 0.1 2.3 0.4 3.6 0.2 1.6 0.3 2.7
Pedestr. 0.5 3.5 0.1 0.2 0.0 0.0 0.2 1.6
HGV6 User 0.1 1.8 0.2 2.5 0.2 1.5 0.2 2.0
Pedestr. 1.3 2.9 0.3 0.2 0.1 0.1 0.5 0.9
All Vehicles7 User 0.4 9.5 1.0 9.1 0.3 0.2 0.6 8.2
Pedestr. 0.5 5.8 0.1 0.4 0.1 0.1 0.3 2.8
All Rates in deaths or injuries per 100 million vehicle kilometers 2.
Land Transport E&P Forum QRA Datasheet Directory Rev 0
13/06/2003 LANDTRAN.DOC Page 7
Notes to table 3.1a: 1 Built up roads are roads with speed limits (ignoring temporary limits) of 40 mph or less, non-built up roads
with speed limit of over 40 mph, but excluding motorways. Numbers include road class not reported. 2 Total amount of kilometers for the particular vehicle type on all road types, table 1 (b) in [2]. Numbers are
included in the table to provide an indication of the sample size, hence significance (reliability) of the derived casualty rates.
3 User of a vehicle covers all occupants, i.e. driver (or rider) and passengers. 4 Serious injury is an injury for which a person is detained in hospital as an 'in-patient', or fractures, concussion,
internal injuries, crushings, severe cuts and lacerations, severe general shock or injuries causing death 30 or more days after the accident.
5 Within 30 days after the accident. 6 Heavy Goods Vehicles (HGV) are those over 1.524 tonnes unloaded weight. Light Good Vehicles (LGV) are
those under 1.524 tonnes unloaded weight. From 1 January onwards the border line will be 3.5 tonnes. 7 All motor and non-motor vehicles (include those mentioned in Table 3.1a). Examples of other such motor
vehicles are ambulances, fire engines, pedestrian controlled vehicles with a motor, railway trains or engines, refuse vehicles, road rollers, tractores, excavators, mobile cranes, tower wagons, army tanks etc. The rate of occurrence of injury accidents for “all Vehicules” is derived using a higher total vehicular mileage, that being the mileage for all vehicles.
Table 3.1 b: UK Road Transport Accident Rates 1993
Casualty Rates (per 108 V Kms)
Male Female
Age Fatal Fat.al/Serious Injuries All Severities Fatal Fatal/Serious Injuries All Severities 17-20 21-24 25-28 29-33 34-38 39-43 44-48 49-53 54-58 59-63 64-68 69-73 74+ All
1.8 0.6 0.4 0.3 0.2 0.2 0.2 0.2 0.3 0.2 0.3 0.5 2.0 0.4
20 75422223335
12 4
134 53 33 28 20 17 14 15 16 17 18 25 54 27
0.8 0.2 0.2 0.2 0.2 0.1 0.2 0.1 0.2 0.3 0.9 1.2 2.8 0.3
15 7554334447
11 20 5
155 80 61 55 43 36 35 36 37 35 44 55 92 53
3.2 Risk Comparison of Transport Modes Howard Collins, Statistics Directorate, UK Department of Transport, gives useful guidelines in an article in [3] for comparing various modes of passenger transport and concludes that the type of casualty rate used will influence the results of the comparison. On the basis of casualty rate per passenger kilometer driving in a car appears to be much more dangerous than travelling by air. However, on the basis of casualty rate per passenger hours the risk is the same and calculated in passenger journeys the travelling by air is more dangerous. It is hence important when choosing the type of casualty rate for a comparative study, to establish which type best describes the risk perceived relevant for the study. 3.3 Transport of Dangerous Substances [20] Provides a comprehensive overview and risk assessment of major hazard aspects of transport of dangerous substances in the UK. The scope covered not only the consideration of major hazard aspects of the transport of dangerous substances, but also the identification of
Land Transport E&P Forum QRA Datasheet Directory Rev 0
13/06/2003 LANDTRAN.DOC Page 8
appropriate control measures and advice on any additional action that might be necessary. It does not include radioactive substances, transport by air or by pipelines or risks to the environment.
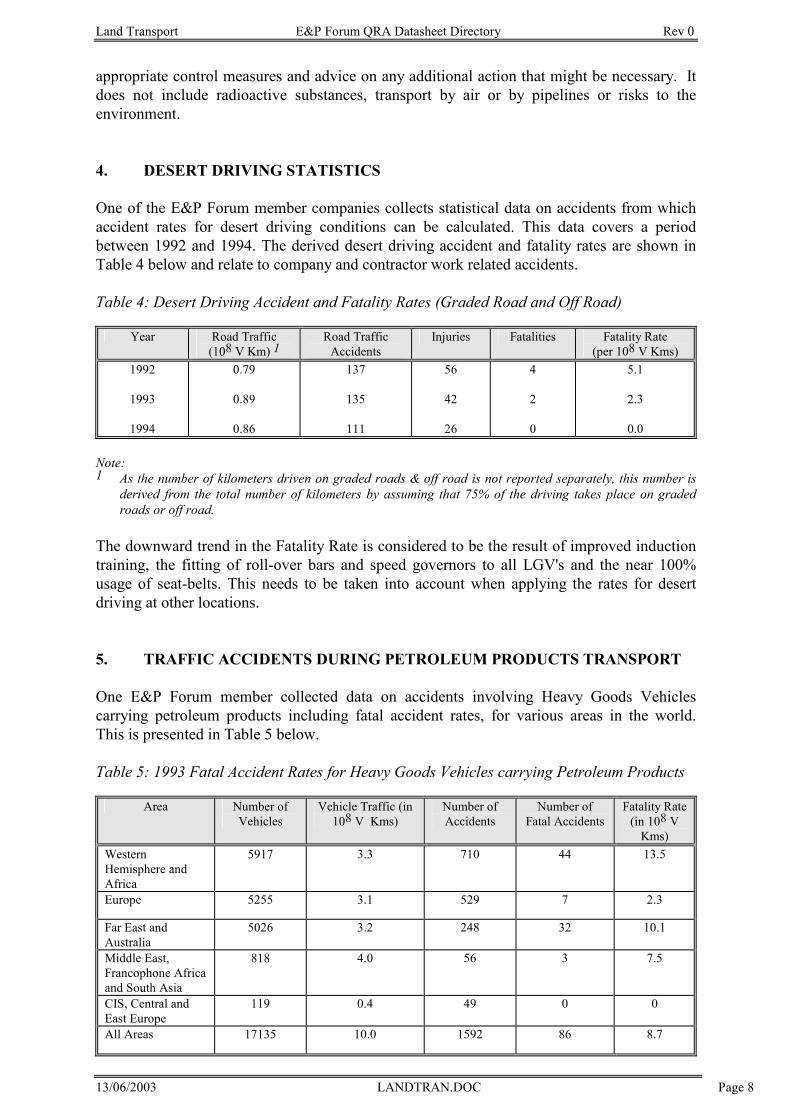
4. DESERT DRIVING STATISTICS One of the E&P Forum member companies collects statistical data on accidents from which accident rates for desert driving conditions can be calculated. This data covers a period between 1992 and 1994. The derived desert driving accident and fatality rates are shown in Table 4 below and relate to company and contractor work related accidents. Table 4: Desert Driving Accident and Fatality Rates (Graded Road and Off Road)
Year Road Traffic (108 V Km) 1
Road Traffic Accidents
Injuries Fatalities Fatality Rate (per 108 V Kms)
1992
1993
1994
0.79
0.89
0.86
137
135
111
56
42
26
4
2
0
5.1
2.3
0.0
Note: 1 As the number of kilometers driven on graded roads & off road is not reported separately, this number is
derived from the total number of kilometers by assuming that 75% of the driving takes place on graded roads or off road.
The downward trend in the Fatality Rate is considered to be the result of improved induction training, the fitting of roll-over bars and speed governors to all LGV's and the near 100% usage of seat-belts. This needs to be taken into account when applying the rates for desert driving at other locations.
5. TRAFFIC ACCIDENTS DURING PETROLEUM PRODUCTS TRANSPORT One E&P Forum member collected data on accidents involving Heavy Goods Vehicles carrying petroleum products including fatal accident rates, for various areas in the world. This is presented in Table 5 below. Table 5: 1993 Fatal Accident Rates for Heavy Goods Vehicles carrying Petroleum Products
Area Number of Vehicles
Vehicle Traffic (in 108 V Kms)
Number of Accidents
Number of Fatal Accidents
Fatality Rate (in 108 V
Kms) Western Hemisphere and Africa
5917 3.3 710 44 13.5
Europe 5255 3.1 529 7 2.3
Far East and Australia
5026 3.2 248 32 10.1
Middle East, Francophone Africa and South Asia
818 4.0 56 3 7.5
CIS, Central and East Europe
119 0.4 49 0 0
All Areas 17135 10.0 1592 86 8.7
Land Transport E&P Forum QRA Datasheet Directory Rev 0
13/06/2003 LANDTRAN.DOC Page 9
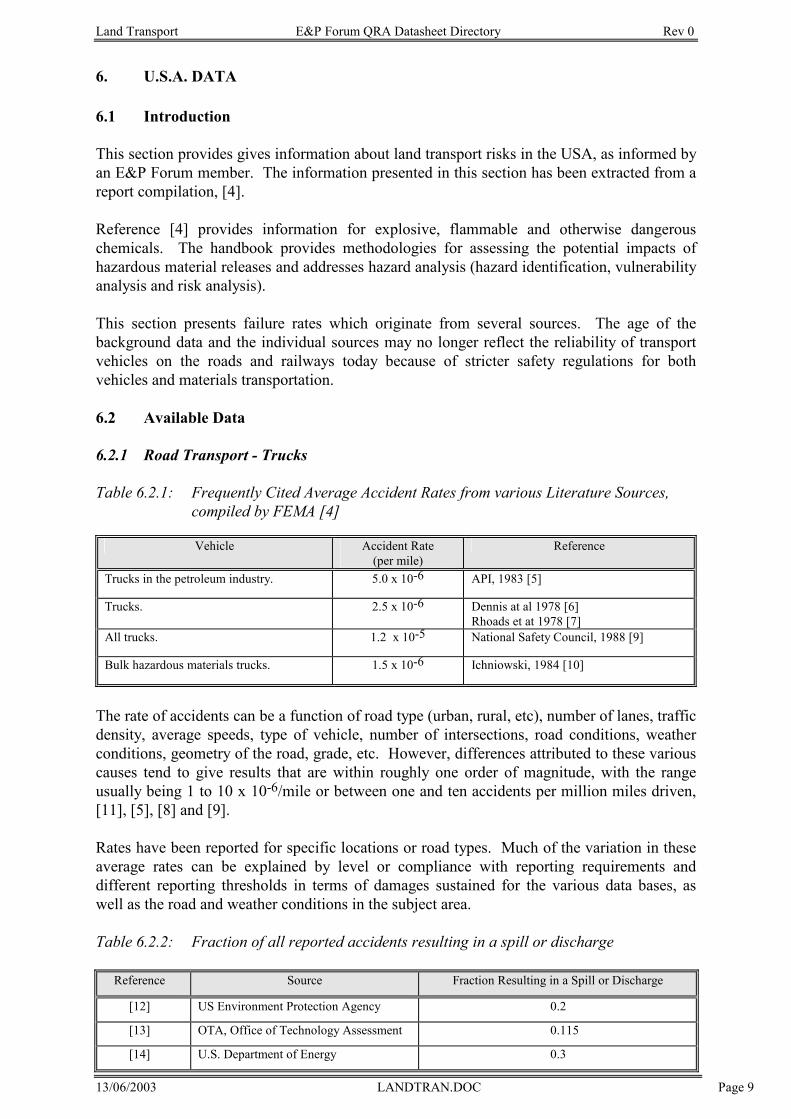
6. U.S.A. DATA 6.1 Introduction This section provides gives information about land transport risks in the USA, as informed by an E&P Forum member. The information presented in this section has been extracted from a report compilation, [4]. Reference [4] provides information for explosive, flammable and otherwise dangerous chemicals. The handbook provides methodologies for assessing the potential impacts of hazardous material releases and addresses hazard analysis (hazard identification, vulnerability analysis and risk analysis). This section presents failure rates which originate from several sources. The age of the background data and the individual sources may no longer reflect the reliability of transport vehicles on the roads and railways today because of stricter safety regulations for both vehicles and materials transportation. 6.2 Available Data 6.2.1 Road Transport - Trucks Table 6.2.1: Frequently Cited Average Accident Rates from various Literature Sources,
compiled by FEMA [4]
Vehicle Accident Rate (per mile)
Reference
Trucks in the petroleum industry. 5.0 x 10⁻⁶ API, 1983 [5]
Trucks. 2.5 x 10⁻⁶ Dennis at al 1978 [6] Rhoads et at 1978 [7]
All trucks. 1.2 x 10⁻⁵ National Safety Council, 1988 [9]
Bulk hazardous materials trucks. 1.5 x 10⁻⁶ Ichniowski, 1984 [10]
The rate of accidents can be a function of road type (urban, rural, etc), number of lanes, traffic density, average speeds, type of vehicle, number of intersections, road conditions, weather conditions, geometry of the road, grade, etc. However, differences attributed to these various causes tend to give results that are within roughly one order of magnitude, with the range usually being 1 to 10 x 10-6/mile or between one and ten accidents per million miles driven, [11], [5], [8] and [9]. Rates have been reported for specific locations or road types. Much of the variation in these average rates can be explained by level or compliance with reporting requirements and different reporting thresholds in terms of damages sustained for the various data bases, as well as the road and weather conditions in the subject area. Table 6.2.2: Fraction of all reported accidents resulting in a spill or discharge
Reference Source Fraction Resulting in a Spill or Discharge
[12] US Environment Protection Agency 0.2
[13] OTA, Office of Technology Assessment 0.115
[14] U.S. Department of Energy 0.3
Land Transport E&P Forum QRA Datasheet Directory Rev 0
13/06/2003 LANDTRAN.DOC Page 10
[15] U.S. Department of Transportation 0.46
Others <0.01 up to 0.5
Reference [6] states that 0.3 - 1.2 percent (0.003 - 0.012) of most types of truck accidents result in a fire. Some data sources combine the accident rate with prespecified levels of accident severity, for example, Clarke et al [16].
Minor 2.4 x 10⁻⁶/mile. Moderate 4.5 x 10⁻⁸/mile. Severe 7.2 x 10⁻⁹/mile. Extra severe 3.5 x 10⁻⁹/mile. Extreme 1.2 x 10⁻⁹/mile. A review of hazardous material accidents on highways over the five-year period 1981 through 1985 was carried out by Midwest Research Institute (MRI), [17]. This study concluded that, based on truck accidents reported to the Bureau of Motor Carrier Safety (BMCS) of the Federal Highway Administration, 15.2 percent of accidents involving hazardous material-carrying vehicles resulted in a release. Accidents involving tank trucks resulted in releases 16.6 percent of the time based on 1984-1985 BMCS reported accident data. It is not clear whether accidents involving empty trucks that normally carry hazardous material were included in the data base. The implication in this study, however, is that only loaded trucks are included. 6.2.2 Rail Transport The overall accident rate for US railroads has been reported as being 4.6 x 10⁻⁶ accidents per train-mile travelled in 1987. This rate was comprised of 4.9 x 10⁻⁷ collisions per train-mile, 3.2 x 10⁻⁶ derailments per train-mile, and 8.6 x 10⁻⁷ other types of accidents per train-mile. The general trend has been a reduction in the overall accident rate, the collision rate, and the derailment rate, with only the rate for "other" accidents holding at about one per million train-miles, Federal Railroads Administration (FRA) [18], as might be expected due to the many new regulations adopted since 1984 to improve railroad safety. For example, the overall accidents rates reported for the period 1979-1984 were:
Year Accident (per 108 train-miles)
1984 1983 1982 1981 1980 1979
6.6 7.0 8.0 8.6
11.8 12.8
Note: Some adjustments were made in the rates to account for changes in reporting thresholds. The overall rate of 4.6 x 10⁻⁶ accidents per train-mile can be sub-divided into a rate of about 2.9 x 10⁻⁶ per train-mile for mainline track and 1.3 x 10⁻⁵ per train-mile for rail yards, FRA [18]. For a 5-year period, the average number of cars per freight train has been about 70 [19] and the average number of cars involved in each accident has been estimated at between 10 and 20 percent of these.
Land Transport E&P Forum QRA Datasheet Directory Rev 0
13/06/2003 LANDTRAN.DOC Page 11
Railway data for the UK [21] exhibit accident rates and trends similar to US railroads. In both cases however, when undertaking studies involving the transport of dangerous substances, a better source of information is the UK Health & Safety Commission’s “Major Hazard Aspects of the Transport of dangerous Substances” [20].
7. FURTHER DATA AVAILABLE Also, in addition to the data sources already used, the sources [22], [23], [24], [25] and [26] might contain more useful information, subject to specific needs (and location).
Land Transport E&P Forum QRA Datasheet Directory Rev 0
13/06/2003 LANDTRAN.DOC Page 12
REFERENCES -1
[1] "World Road Statistics 1980-1993", International Road Federation (IRF) in Geneva, edition 1994, ISSN 0444-1419.
[2] "Road Accidents Great Britain 1993", The Casualty Report, London HMSO, ISBN 0-
11551291-8. [3] "Transport Statistics Great Britain 1979-1989", The Department of Transport, London
HMSO, September 1994, ISBN 0-11-551633-6. [4] Federal Emergency Management Agency, "Handbook of Chemical Hazard Analysis
Procedures", available from Federal Emergency Management Agency, Publications Office, 500 C Street, SW, Washington, DC 20472.
[5] American Petroleum Institute, "Summary of Motor Vehicle Accidents in the
Petroleum Industry for 1982", June 1983. [6] Dennis, A.W. et al, "Severities of Transportation Accidents Involving Large
Packages", Sandia Laboratories, NTIS SAND-77-0001, May 1978. [7] Rhoads, R.E. et al, "An Assessment of the Risk of Transporting Gasoline by Truck",
prepared by Pacific Northwest Laboratory for the U.S. Department of Energy, PNL-2133, November 1978.
[8] Smith, R.N. and E.L. Wilmot, "Truck Accident and Fatality Rates Calculated from
California Highway Accident Statistics for 1980 and 1981", prepared by Sandia National Laboratories for the U.S. Department of Energy, SAND-82-7066, November 1982.
[9] National Safety Council, "Accident Facts", 1988 Edition. [10] Ichniowski T., "New Measures to Bolster Safety in Transportation", Chemical
Engineering, November 12, 1984, pp. 35-39. [11] Urbanek, G.L. and E.J. Barber, "Development of Criteria to Designate Routes for
Transporting Hazardous Materials", prepared by Peat, Marwick, Mitchell and Co. for the Federal Highway Administration, NTIS PB81-164725, September 1980.
[12] ICF, Inc., "Assessing the Releases and Costs Associated with Truck Transport of
Hazardous Wastes", U.S. Environmental Protection Agency, NTIS PB84-224468, 1984.
[13] Office of Technology Assessment, "Transportation of Hazardous Materials", OTA-
SET-340, U.S. Government Printing Office, Washington D.C., July 1986.
Land Transport E&P Forum QRA Datasheet Directory Rev 0
13/06/2003 LANDTRAN.DOC Page 13
REFERENCES - 2
[14] Elder, H.K. et al, "An Assessment of the Risk of Transporting Spent Nuclear Fuel by Truck", prepared by Pacific Northwest Laboratory for the U.S. Department of Energy, PNL-2588, November 1978.
[15] Arthur D. Little, Inc., "Assessment of Risks and Risk Control Options Associated
with Liquefied Natural Gas Trucking Operations from Distrigas Terminal, Everett, Massachusetts", prepared for the U.S. Department of Transportation, Contract No. DOT-RC-82037, June 1979.
[16] Clarke, R.K. et al, "Severities of Transportation Accidents", Sandia National
Laboratories, NTIS SLA-74-0001, July 1976. [17] Midwest Research Institute, "Present Practices of Highway Transportation of
Hazardous Materials, Task B Interim Report, Literature Review", prepared for the Federal Highway Administration, DTFH61-86-C-00039, January 30, 1987.
[18] Federal Railroad Administration, "Accident/Incident Bulletin, No. 152, Calendar Year
1983", July 1983. [19] Association of American Railroads, "Railroad Facts, 1985 Edition", August 1985. [20] "Major Hazard Aspects of the Transport of dangerous Substances", Advisory
Committee on Dangerous Substances, UK HSC (Health & Safety Commission), ISBN 011-8856995, 1991.
[21] “Railway Safety. Report on the safety record of the railways in Great Britain during
1994/95”. Health & Safety Executive. [22] "Annual Bulletin of Transport Statistics for Europe", published in Geneva by the
United Nations Economic Commission for Europe (UNECE). [23] "Statistical Trends in Transport", published by the European Conference of Ministers
of Transport (ECMT). [24] "Transport Statistical Yearbook", published by the Statistical Office of the European
Community (EC). [25] National Highway Traffic Safety Administration, Washington, USA. [26] National Safety Council, "Accident Facts", Chicago, USA.
Risk Assessment Data For Accidents E&P Forum QRA Datasheet Directory Involving Aircrafts And Helicopters Rev 0
13/06/2003 AIRTRANS.DOC Page 1
AIR TRANSPORT RISK ASSESSMENT DATA FOR ACCIDENTS
INVOLVING AIRCRAFTS AND HELICOPTERS
Risk Assessment Data For Accidents E&P Forum QRA Datasheet Directory Involving Aircrafts And Helicopters Rev 0
13/06/2003 AIRTRANS.DOC Page 2
TABLE OF CONTENTS
1. SUMMARY -------------------------------------------------------------------------------------------- 3
1.1 Scope---------------------------------------------------------------------------------------------------------------------3
1.2 Application -------------------------------------------------------------------------------------------------------------3
2. KEY DATA--------------------------------------------------------------------------------------------- 4
ONGOING RESEARCH------------------------------------------------------------------------------- 9
REFERENCES----------------------------------------------------------------------------------------- 10
Risk Assessment Data For Accidents E&P Forum QRA Datasheet Directory Involving Aircrafts And Helicopters Rev 0
13/06/2003 AIRTRANS.DOC Page 3
1. SUMMARY
1.1 Scope This data sheet gives information about Fatal Accidents Rates (FARs) for aircraft and helicopters in exploration and production. As oil industry aviation is a relatively small data set, the data sheet includes data for comparison purpose from other types of aviation (e.g. scheduled flights).
1.2 Application The data presented in table 1 through 6 are applicable for Quantitative Risk Assessment (QRA) relating to offshore helicopter transportation, helicopter operations in other areas and fixed wing operations in general. Wherever possible the data selected should be those that most closely resemble the situation being modelled. The original data sources present the data in a variety of different ways - e.g. as Fatal Accident Rates (FARs) per 100 000 passenger kilometres, per 100 000 aircraft hours - and these have all been adjusted to Fatality Rate per 108 exposed hours to facilitate comparison and use. Adjustment procedures are described in [1]. The FARs which have been developed represent average figures over a large population. There are major variations between scheduled carrier services and non-scheduled services, and between amateur flying and professional flying. The scale of these differences is shown in Table 2. All reviews of air safety stress the importance of pilot ability and training in achieving safe flying. However, there are considerable differences in the various helicopter safety reviews regarding the proportion of accidents which are considered to result mainly from human error (e.g. the 1984 HARP world-wide review [2] estimated 60-65% compared to SINTEF North Sea review [3] which estimated only 14%). In fact, the SINTEF review attributed 55% of accidents to technical failure. An amateur pilot might be considered to increase the chance of fatal accident 10 fold which is the ratio between fatal accident rates for private and business flying (2.40 per 100 000 flying hours) to that of non-commercial public carriers (0.21 per 100 000 flying hours). Users can therefore consider a range of accident rate multipliers from 1-10 depending on the circumstances.
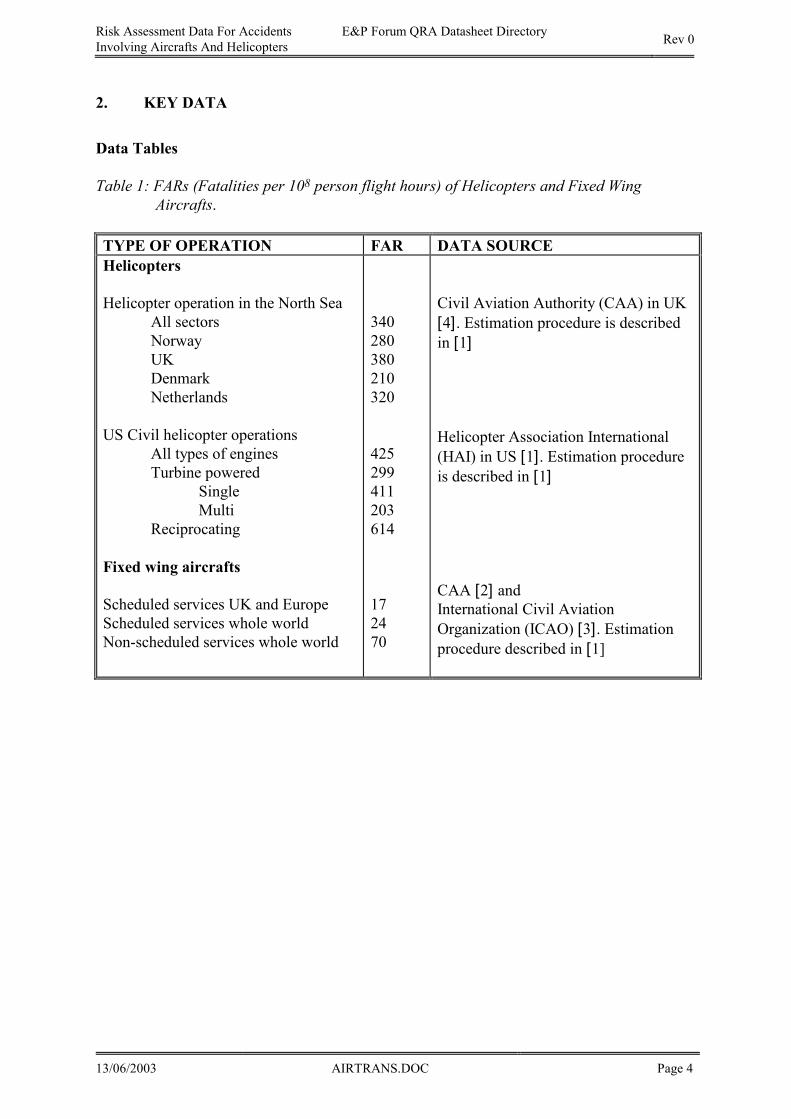
Risk Assessment Data For Accidents E&P Forum QRA Datasheet Directory Involving Aircrafts And Helicopters Rev 0
13/06/2003 AIRTRANS.DOC Page 4
2. KEY DATA Data Tables Table 1: FARs (Fatalities per 108 person flight hours) of Helicopters and Fixed Wing
Aircrafts.
TYPE OF OPERATION FAR DATA SOURCE Helicopters Helicopter operation in the North Sea All sectors Norway UK Denmark Netherlands US Civil helicopter operations All types of engines Turbine powered Single Multi Reciprocating Fixed wing aircrafts
Scheduled services UK and Europe Scheduled services whole world Non-scheduled services whole world
340 280 380 210 320
425 299 411 203 614
17 24 70
Civil Aviation Authority (CAA) in UK [4]. Estimation procedure is described in [1]
Helicopter Association International (HAI) in US [1]. Estimation procedure is described in [1]
CAA [2] and International Civil Aviation Organization (ICAO) [3]. Estimation procedure described in [1]
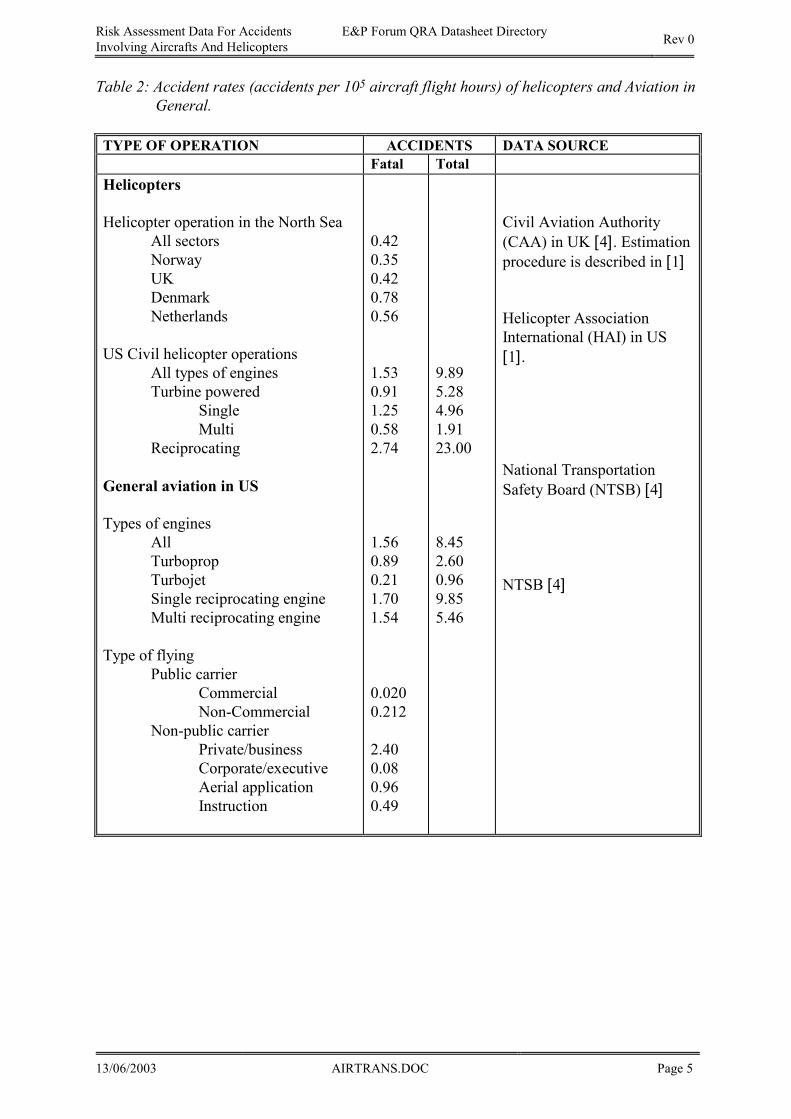
Risk Assessment Data For Accidents E&P Forum QRA Datasheet Directory Involving Aircrafts And Helicopters Rev 0
13/06/2003 AIRTRANS.DOC Page 5
Table 2: Accident rates (accidents per 105 aircraft flight hours) of helicopters and Aviation in General.
TYPE OF OPERATION ACCIDENTS DATA SOURCE
Fatal Total Helicopters Helicopter operation in the North Sea All sectors Norway UK Denmark Netherlands US Civil helicopter operations All types of engines Turbine powered Single Multi Reciprocating General aviation in US
Types of engines All Turboprop Turbojet Single reciprocating engine Multi reciprocating engine Type of flying Public carrier Commercial Non-Commercial Non-public carrier Private/business Corporate/executive Aerial application Instruction
0.42 0.35 0.42 0.78 0.56
1.53 0.91 1.25 0.58 2.74
1.56 0.89 0.21 1.70 1.54
0.020 0.212 2.40 0.08 0.96 0.49
9.89 5.28 4.96 1.91 23.00
8.45 2.60 0.96 9.85 5.46
Civil Aviation Authority (CAA) in UK [4]. Estimation procedure is described in [1]
Helicopter Association International (HAI) in US [1].
National Transportation Safety Board (NTSB) [4]
NTSB [4]
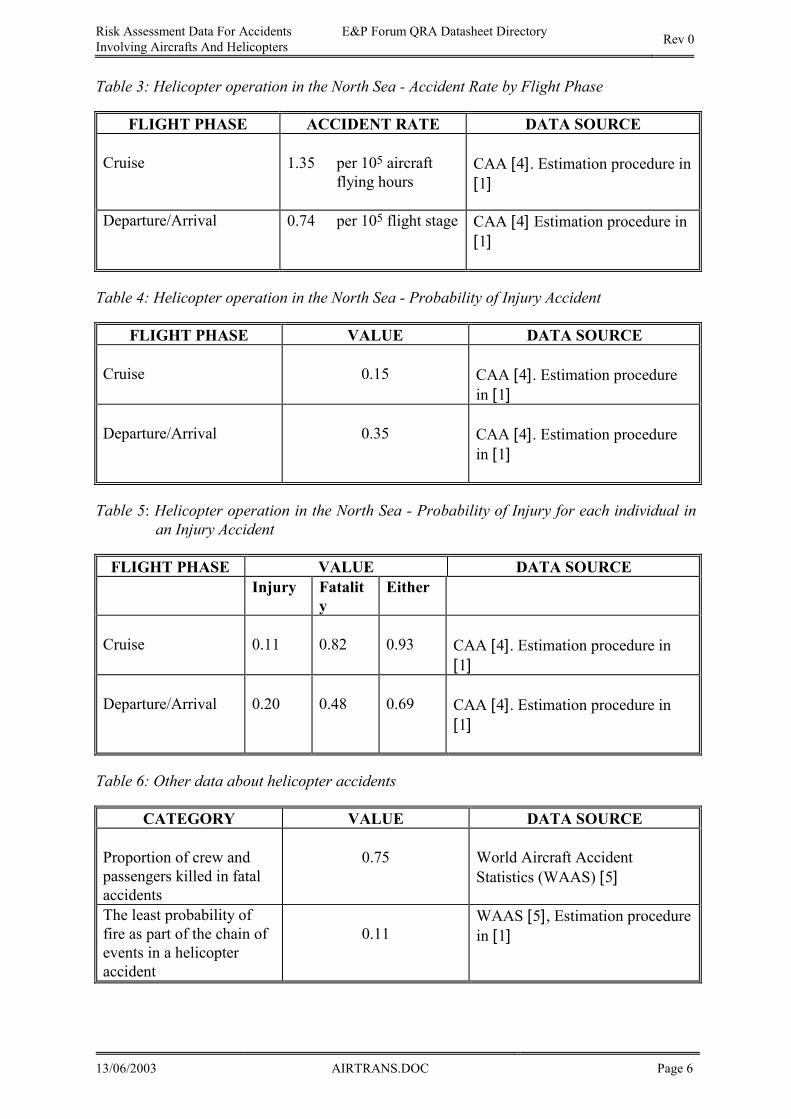
Risk Assessment Data For Accidents E&P Forum QRA Datasheet Directory Involving Aircrafts And Helicopters Rev 0
13/06/2003 AIRTRANS.DOC Page 6
Table 3: Helicopter operation in the North Sea - Accident Rate by Flight Phase
FLIGHT PHASE ACCIDENT RATE DATA SOURCE
Cruise 1.35 per 105 aircraft
flying hours
CAA [4]. Estimation procedure in [1]
Departure/Arrival 0.74 per 105 flight stage CAA [4] Estimation procedure in [1]
Table 4: Helicopter operation in the North Sea - Probability of Injury Accident
FLIGHT PHASE VALUE DATA SOURCE
Cruise
0.15 CAA [4]. Estimation procedure in [1]
Departure/Arrival
0.35 CAA [4]. Estimation procedure in [1]
Table 5: Helicopter operation in the North Sea - Probability of Injury for each individual in an Injury Accident
FLIGHT PHASE VALUE DATA SOURCE Injury Fatalit
yEither
Cruise 0.11
0.82
0.93
CAA [4]. Estimation procedure in [1]
Departure/Arrival
0.20 0.48
0.69
CAA [4]. Estimation procedure in [1]
Table 6: Other data about helicopter accidents
CATEGORY VALUE DATA SOURCE
Proportion of crew and passengers killed in fatal accidents
0.75
World Aircraft Accident Statistics (WAAS) [5]
The least probability of fire as part of the chain of events in a helicopter accident
0.11
WAAS [5], Estimation procedure in [1]
Risk Assessment Data For Accidents E&P Forum QRA Datasheet Directory Involving Aircrafts And Helicopters Rev 0
13/06/2003 AIRTRANS.DOC Page 7
Discussion
Data Source The FAR estimation for offshore helicopter operations is based on data collected by the Civil Aviation Authority (CAA) in UK. CAA, by their Safety & Analysis Unit, have published statistical reports on offshore helicopter operations since 1985. In addition to the statistical reports from CAA, data and estimates from the Helicopter Safety Study [3] are used in order to obtain estimates for the period 1973-1995. These data sources are considered as very valid, especially with respect to the number of fatalities. The FAR estimation for civil aviation in general is based on data collected by the International Civil Aviation Organization (ICAO) and published in their statistical yearbook; "Civil Aviation Statistics of the World". The data cover the period 1984 -1993, and include scheduled and non-scheduled services. The ICAO data are considered as very valid with respect to scheduled and non-scheduled commercial air transport. Another source is the "Annual Review of Aircraft Accident Data published" by the National Transport Safety Board in US. The data include all helicopter accidents in all types of rotorcraft application. The data cover the period 1976-1986. The FAR estimation for US civil helicopter operation is based on data from Helicopter Association International in US. Data about fatalities and aircraft flying hours is considered as very valid. However, the exact number of passenger flying hours is not available and has to be estimated. The data cover the period 1975-1994. Data Range The exact number of person flight hours is not available. The numbers in Table 1 have been estimated, based on some data, supplied with judgements. For the helicopter operations in the North Sea, the relative uncertainty in these numbers is judged to be within the range of 10% for Norway and UK, and 30% for the Netherlands and Denmark. The uncertainty in the overall figures is judged to be within the range of 10% - 15%. Availability Data about offshore helicopter operations in the Norwegian, UK and Danish sector in the North Sea are readily available from CAA. Data about civil helicopter operations in US is available from HAI. Data about civil aviation is readily available from ICAO. However, exact data about person flight hours is not recorded in any of the sources and has to be estimated.
Risk Assessment Data For Accidents E&P Forum QRA Datasheet Directory Involving Aircrafts And Helicopters Rev 0
13/06/2003 AIRTRANS.DOC Page 8
Strengths The strength of the presented data is that detailed information about fatal accidents has been collected since the start of the petroleum activities and exact data about aircraft hours and passenger kilometres have been collected since 1985. ICAO has a well-organised system for the collection of aviation data that has been running since 1944. Limitations The FAR values for helicopter operations in the North Sea are limited to scheduled and non-scheduled transport operations in the North Sea. The data are not representative for special operations like; lifting, search and rescue, training, etc. The FAR values for fixed wing aircrafts are only valid for scheduled and non-scheduled services. Another limitation is that ICAO does not separate between fixed and rotary wing services. However, the data are dominated by fixed wing services and is therefore most applicable for this kind of services. Applicability The presented data can be used to calculate the potential number of fatalities per year from a given helicopter transportation. Estimating Frequencies The frequency (per year) of fatal accidents involving helicopter transport and of fatalities may be approached in two ways using the data. 1. Calculate the exposure hours using the number of flights per year, the likely duration of the
flight and the expected number of passengers. Many widely used helicopters carry 24 passengers. Multiply by the FAR given in Table 1. This gives a direct figure for deaths per year for helicopter flying.
2. Work out the expected number of flights per year for various purposes. Group them
according to the duration and the likely number of passengers. For each group apply the accident rate per 100 000 hours flown from Table 2 (US data). The number of deaths per accident is calculated from the number of passengers and crew multiplied by 0.75, which is the proportion of passengers getting killed in a fatal accident (see Table 6). The sum of all types of flight gives potential deaths per year due to helicopter operations.
The second method is a little more complex but can take account of adjustment factors more "visibly". However, users should note that fine adjustments are not usually worth the effort; uncertainties in the base data are usually far larger than any plausible adjustment factors.
Example CalculationA development in the Norwegian sector in the North Sea will require 28 helicopter flights per week to and from the field, each flight lasting 1.5 hours and carrying 26 passengers and crew. In-field movements will require 56 flights a week, each with 14 passengers and lasting 0.5 hours. Estimate the potential number of fatalities per year from this helicopter operation.
Risk Assessment Data For Accidents E&P Forum QRA Datasheet Directory Involving Aircrafts And Helicopters Rev 0
13/06/2003 AIRTRANS.DOC Page 9
1. Total person exposure hours
28 × 26 × 1.5 + 56 × 14 × 0.5 = 1484 exposure hours per week = 77168 exposure hours per year Expected fatality rate = exposure hours × FAR x 10-8
From Table 1, FAR for Norwegian sector is 280. 77168 × 280 x 10-8 = 0.22 accident fatalities per year from helicopter accidents.
2. Flying hours times accident rate
Probability of a fatal accident involving a turbine powered helicopter is taken from Table 2. The general aviation rate of 0.91 fatal accidents per 105 flying hours is reduced by 50% for the offshore sector giving a rate of 0.46 fatal accidents per 105 flying hours. From Table 6 it is noted that 75% of passengers will probably be killed in a fatal accident; however we judge that in this case this might be reduced by 75% for the in-field flights because of rapid response by rescue boats and first aid giving a rate of 0.2 of the passengers likely to be killed in an in-field fatal accident.
Base to field In field
Flying hours per week Flying hours per year Fatal accident rate Accidents per year Persons per flight Proportion killed Fatalities per year
42 2184 460/108 hr 10.1/103 hr 28 0.75 0.21
28 1456 460/108 hr 6.7/103 hr 14 0.2 0.02
Predicted fatality rate = 0.23 fatalities per year from helicopter accidents.
Comparative Statistics The overall figure of 340 10-8 fatalities per person flight hour for helicopter operations in the North Sea, is approximately 10% less than the figure of 380 x 10-8 reported in the Helicopter Safety Study [3]. The figure is about 20% less than the figure of 430 x 10-8 reported for Norway and UK up to August 1982 [6]. Thus, there seems to be an improvement in the experienced FAR. Some trend tests have been performed, indicating that improvements have taken place [1].
ONGOING RESEARCH
Although the term research is not particularly appropriate, it is fair to say that fatality statistics are collected and published on an ongoing, annual basis. It is therefore entirely possible to track the performance of the offshore helicopter transport operations and to analyse the trends in safety performance. In this connection it can be mentioned that CAA in 1982 predicted that the FAR value for scheduled services in 1990 would be of the order of 24 for fixed wing scheduled aircraft [7].
Risk Assessment Data For Accidents E&P Forum QRA Datasheet Directory Involving Aircrafts And Helicopters Rev 0
13/06/2003 AIRTRANS.DOC Page 10
REFERENCES
[1] Paulsen, T and Lydersen, S. (1995) Risk Assessment Data - Accidents Involving
Aircrafts and Helicopters. SINTEF Report No. STF75 F95018, Restricted., Trondheim, Norway.
[2] Civil Aviation Authority (1984) Review of helicopter airworthiness. Report of the
helicopter Airworthiness Review Panel of Airworthiness Requirements Board (HARP Report), CAP 491, June 1984 (HMSO)
[3] Ingstad, I., Rosness, R., Sten, T., Ulleberg, T., Rausand, M., Lydersen, S. and
Schølberg, P.(1990) Helicopter Safety Study, Detailed Results. SINTEF Report STF75 F90009 Trondheim (Confidential)
[4] CAA (1985-1994) Offshore Helicopter Operations Statistical Reports. Civil Aviation
Authorities, Safety and Analysis Group.
[1] Helicopter Association International (1995). Data received on fax by request. The data are obtained from the statistics published by The Federal Aviation Administration in US.
[2] Civil Aviation Authority (1987) Reportable Accidents to British Registered Aircraft,
and to Foreign Registered Aircraft in UK Air Space, CAP 547, February 1989 (HMSO).
[3] ICAO (1984-1993) Statistical Year Book. Civil Aviation Statistics of the World.
International Civil Aviation Organization Publications. [4] National Transportation Safety Board (1989) Annual Review of Aircraft Accident
Data, NTSB PB89-121453. [5] World Aircraft Accident Statistics
[6] Lydersen, S.: (1982) Fatal Accident Rate in Helicopter Transportation. SINTEF Project Memo, project no 880354.11, 1982- 10- 11.
[7] Lloyd,E. and Tye, W. (1982) Systematic Safety. Safety Assessment of Aircraft Systems.
Civil Aviation Authority London July 1982
Risk Assessment Data For Accidents E&P Forum QRA Datasheet Directory Involving Aircrafts And Helicopters Rev 0
13/06/2003 AIRTRANS.DOC Page 11
Water Transport E&P Forum QRA Directory - Rev 0
13/06/2003 WATERTR.DOC Page 1
WATER TRANSPORT
Water Transport E&P Forum QRA Directory - Rev 0
13/06/2003 WATERTR.DOC Page 2
TABLE OF CONTENTS
1. SUMMARY -------------------------------------------------------------------------------------------- 3
1.1 Scope ---------------------------------------------------------------------------------------------------------------------3
1.2 Application--------------------------------------------------------------------------------------------------------------3
2. KEY DATA INVOLVING ACCIDENTS TO VESSELS/SHIPS--------------------------- 4
2.1 Accidents at sea --------------------------------------------------------------------------------------------------------4
2.2 Total loss/major accidents -------------------------------------------------------------------------------------------5 2.2.1 Accident Causes--------------------------------------------------------------------------------------------------------5 2.2.2 Total loss/major accidents (Norway) -------------------------------------------------------------------------------5 2.2.3 Age contribution -------------------------------------------------------------------------------------------------------5 2.2.4 Total loss world-wide vs. Tonnage ---------------------------------------------------------------------------------6 2.2.5 Loss by flag (country of registration)-------------------------------------------------------------------------------6
3. KEY DATA INVOLVING ACCIDENT TO SEAMEN---------------------------------------- 7
3.1 FARs for marine accidents-------------------------------------------------------------------------------------------7
3.2 Type of Accidents to Crew Members - Merchant vessels ------------------------------------------------------7
3.3 Accidents to seamen ---------------------------------------------------------------------------------------------------8
4. KEY DATA INVOLVING RELEASE/SPILL INTO THE SEA----------------------------- 9
4.1 Pollution Incidents related to Offshore Loading (UK - Non-CALM systems) -----------------------------9
4.2 Pollution Incidents Frequency Rates per lifting -----------------------------------------------------------------9
4.3 Release/spills from tankers - world-wide------------------------------------------------------------------------ 10
5. REFERENCES ------------------------------------------------------------------------------------- 12
Water Transport E&P Forum QRA Directory - Rev 0
13/06/2003 WATERTR.DOC Page 3
1. SUMMARY 1.1 Scope This data sheet provides data on water transports risk in relation to activities within the Exploration and Production Industry. The activities constitute supply vessels, shuttle tankers, workboats, vessels (e.g. cranes, diving etc) and standby-vessels. Drilling rigs, flotels, production ships etc are not included. 1.2 Application The data presented are applicable to activities in support of operations within exploration for and production of hydrocarbon. Very few statistics exist as a comprehensive system for collection and verification of data in this field has not been established. The data given may have to be corrected or adjusted to fit the specific circumstances one attempts to analyse. Statistics dealing with total loss may give lower figures for the latest years due to the fact that not all vessels will be written off immediately after an accident. In some cases, the vessel may be categorised as ‘out of service’, and after some time a decision to write it off or bring it back in service will be made. There is a lack of consistency as to the year the vessel may be written off; i.e. the year when the accident took place or the year when the decision was made. In some cases the source may change the rules as to which year the vessel will be classified as total loss without correcting the previous data. Accordingly, total loss and major accident cases are grouped together, as major accident cases are candidates for being written off and thus become a total loss (see item 2.2). The total population with regard to vessels and personnel is difficult to assess. Most statistics available have been collected and registered with regard to the flag, and not the region where the vessels were sailing or where the accident took place. The same difficulty exists with regard to crew members, particularly since comprehensive statistics on the workforce on the vessels are not available, and only estimations can be made. The workforce are mainly registered according to the flag of the vessel, and not the nationality of the persons involved. It should be noted that some of the references and sources of information are issued on an annual or regular basis (e.g. [2] [4]) and it is advised that data in this datasheet should be checked agianst a more updated version from the source. 1.3 Abbreviations in this datasheet FAR Fatal Accident Rate (defined as fatal accidents per 108 exposed hours) UKCS United Kingdom Continental Shelf
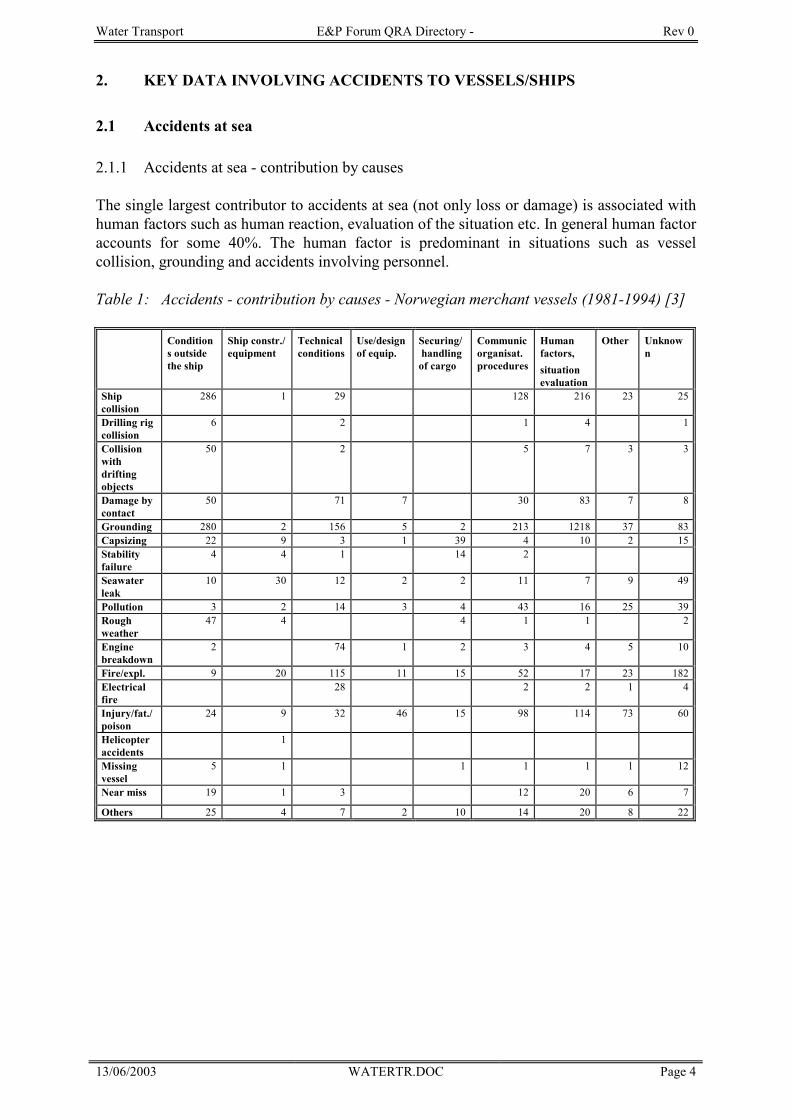
Water Transport E&P Forum QRA Directory - Rev 0
13/06/2003 WATERTR.DOC Page 4
2. KEY DATA INVOLVING ACCIDENTS TO VESSELS/SHIPS 2.1 Accidents at sea 2.1.1 Accidents at sea - contribution by causes The single largest contributor to accidents at sea (not only loss or damage) is associated with human factors such as human reaction, evaluation of the situation etc. In general human factor accounts for some 40%. The human factor is predominant in situations such as vessel collision, grounding and accidents involving personnel. Table 1: Accidents - contribution by causes - Norwegian merchant vessels (1981-1994) [3]
Conditions outside the ship
Ship constr./ equipment
Technical conditions
Use/design of equip.
Securing/ handling of cargo
Communic organisat. procedures
Human factors, situation evaluation
Other Unknown
Ship collision
286 1 29 128 216 23 25
Drilling rig collision
6 2 1 4 1
Collision with drifting objects
50 2 5 7 3 3
Damage by contact
50 71 7 30 83 7 8
Grounding 280 2 156 5 2 213 1218 37 83Capsizing 22 9 3 1 39 4 10 2 15Stability failure
4 4 1 14 2
Seawater leak
10 30 12 2 2 11 7 9 49
Pollution 3 2 14 3 4 43 16 25 39Rough weather
47 4 4 1 1 2
Engine breakdown
2 74 1 2 3 4 5 10
Fire/expl. 9 20 115 11 15 52 17 23 182Electrical fire
28 2 2 1 4
Injury/fat./poison
24 9 32 46 15 98 114 73 60
Helicopter accidents
1
Missing vessel
5 1 1 1 1 1 12
Near miss 19 1 3 12 20 6 7
Others 25 4 7 2 10 14 20 8 22
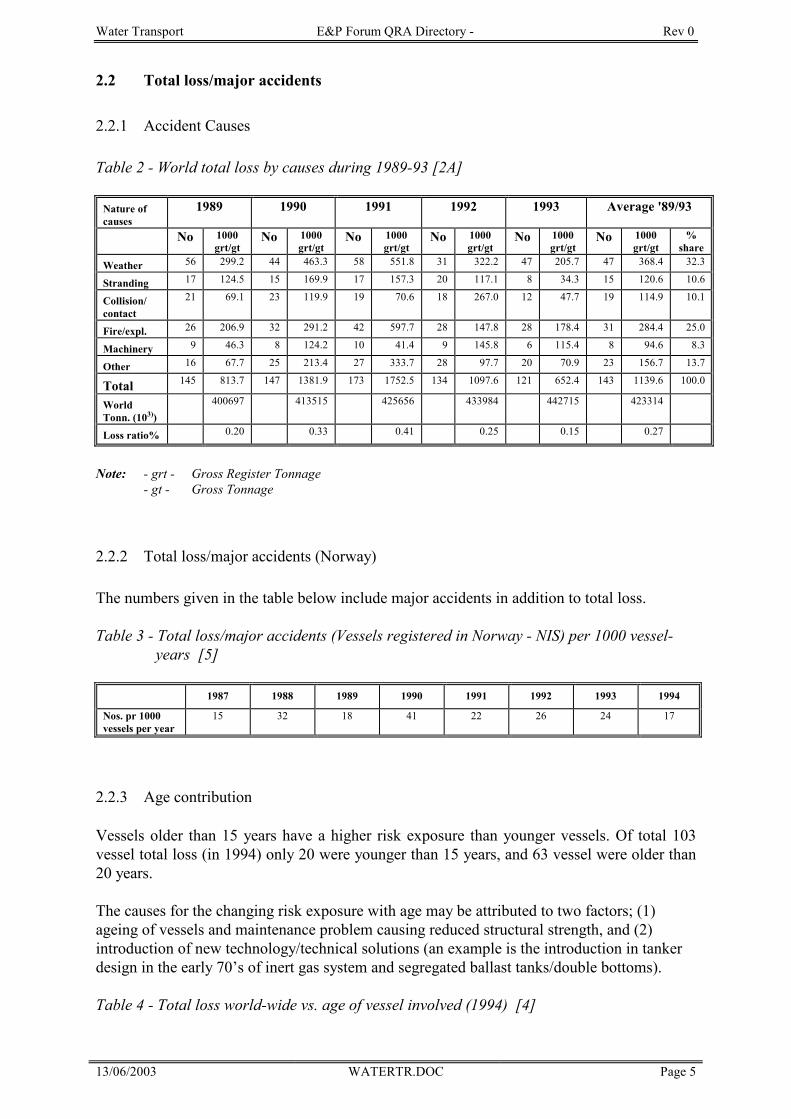
Water Transport E&P Forum QRA Directory - Rev 0
13/06/2003 WATERTR.DOC Page 5
2.2 Total loss/major accidents 2.2.1 Accident Causes Table 2 - World total loss by causes during 1989-93 [2A]
Nature of causes
1989 1990 1991 1992 1993 Average '89/93
No 1000 grt/gt No 1000
grt/gt No 1000 grt/gt No 1000
grt/gt No 1000 grt/gt No 1000
grt/gt %
share Weather 56 299.2 44 463.3 58 551.8 31 322.2 47 205.7 47 368.4 32.3
Stranding 17 124.5 15 169.9 17 157.3 20 117.1 8 34.3 15 120.6 10.6
Collision/ contact
21 69.1 23 119.9 19 70.6 18 267.0 12 47.7 19 114.9 10.1
Fire/expl. 26 206.9 32 291.2 42 597.7 28 147.8 28 178.4 31 284.4 25.0
Machinery 9 46.3 8 124.2 10 41.4 9 145.8 6 115.4 8 94.6 8.3
Other 16 67.7 25 213.4 27 333.7 28 97.7 20 70.9 23 156.7 13.7
Total 145 813.7 147 1381.9 173 1752.5 134 1097.6 121 652.4 143 1139.6 100.0
World Tonn. (103))
400697 413515 425656 433984 442715 423314
Loss ratio% 0.20 0.33 0.41 0.25 0.15 0.27
Note: - grt - Gross Register Tonnage - gt - Gross Tonnage
2.2.2 Total loss/major accidents (Norway) The numbers given in the table below include major accidents in addition to total loss. Table 3 - Total loss/major accidents (Vessels registered in Norway - NIS) per 1000 vessel-
years [5]
1987 1988 1989 1990 1991 1992 1993 1994 Nos. pr 1000 vessels per year
15 32 18 41 22 26 24 17
2.2.3 Age contribution Vessels older than 15 years have a higher risk exposure than younger vessels. Of total 103 vessel total loss (in 1994) only 20 were younger than 15 years, and 63 vessel were older than 20 years.
The causes for the changing risk exposure with age may be attributed to two factors; (1) ageing of vessels and maintenance problem causing reduced structural strength, and (2) introduction of new technology/technical solutions (an example is the introduction in tanker design in the early 70’s of inert gas system and segregated ballast tanks/double bottoms).
Table 4 - Total loss world-wide vs. age of vessel involved (1994) [4]
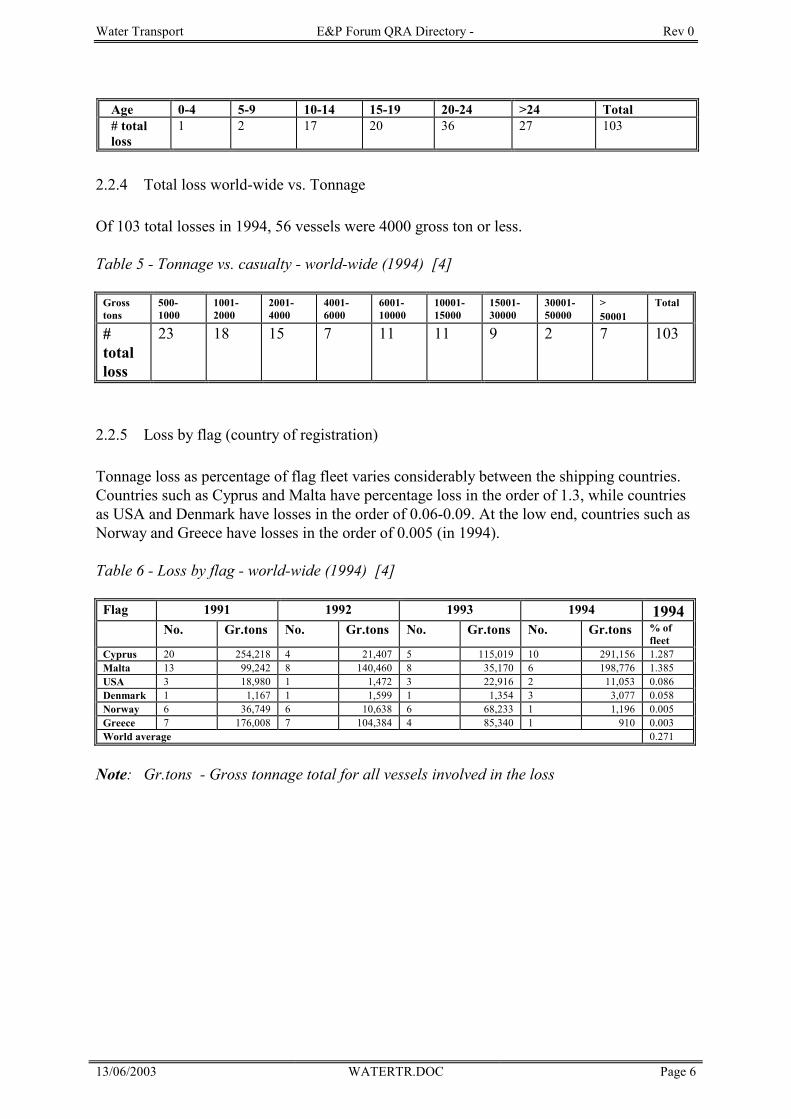
Water Transport E&P Forum QRA Directory - Rev 0
13/06/2003 WATERTR.DOC Page 6
2.2.4 Total loss world-wide vs. Tonnage Of 103 total losses in 1994, 56 vessels were 4000 gross ton or less. Table 5 - Tonnage vs. casualty - world-wide (1994) [4]
Gross tons
500-1000
1001-2000
2001-4000
4001-6000
6001-10000
10001-15000
15001-30000
30001-50000
>50001
Total
#total loss
23 18 15 7 11 11 9 2 7 103
2.2.5 Loss by flag (country of registration) Tonnage loss as percentage of flag fleet varies considerably between the shipping countries. Countries such as Cyprus and Malta have percentage loss in the order of 1.3, while countries as USA and Denmark have losses in the order of 0.06-0.09. At the low end, countries such as Norway and Greece have losses in the order of 0.005 (in 1994). Table 6 - Loss by flag - world-wide (1994) [4]
Flag 1991 1992 1993 1994 1994 No. Gr.tons No. Gr.tons No. Gr.tons No. Gr.tons % of
fleet Cyprus 20 254,218 4 21,407 5 115,019 10 291,156 1.287 Malta 13 99,242 8 140,460 8 35,170 6 198,776 1.385 USA 3 18,980 1 1,472 3 22,916 2 11,053 0.086 Denmark 1 1,167 1 1,599 1 1,354 3 3,077 0.058 Norway 6 36,749 6 10,638 6 68,233 1 1,196 0.005 Greece 7 176,008 7 104,384 4 85,340 1 910 0.003 World average 0.271
Note: Gr.tons - Gross tonnage total for all vessels involved in the loss
Age 0-4 5-9 10-14 15-19 20-24 >24 Total # total loss
1 2 17 20 36 27 103
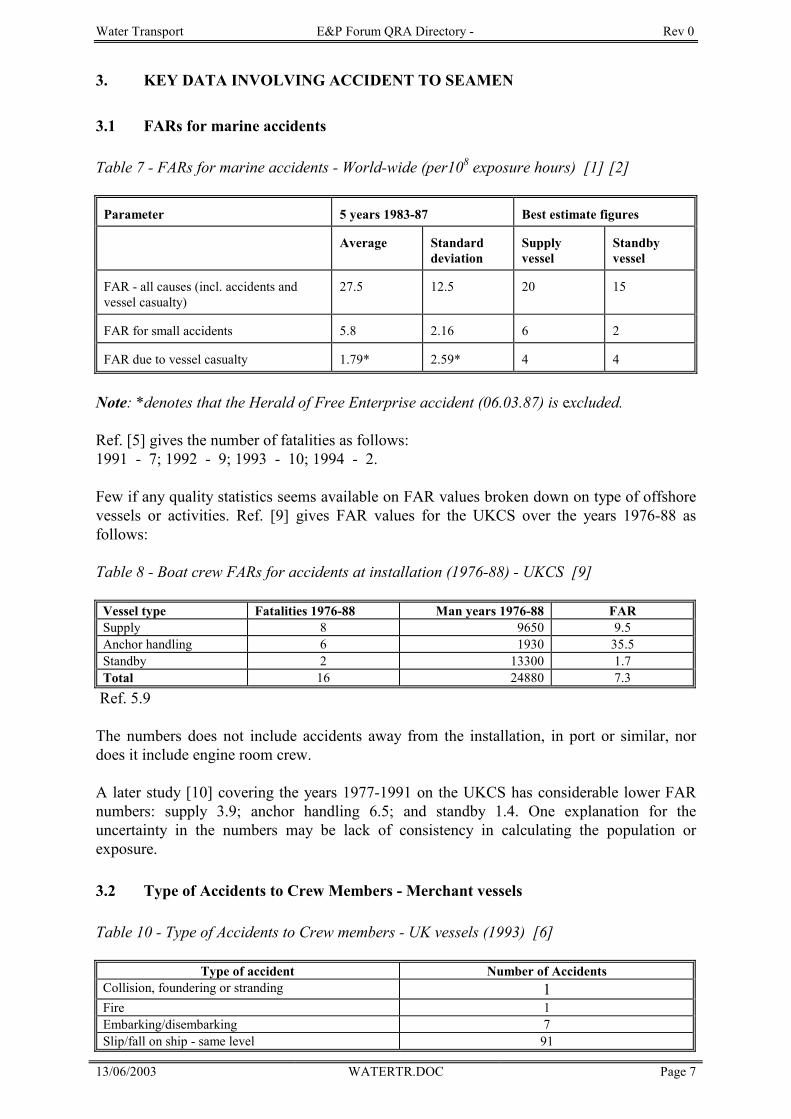
Water Transport E&P Forum QRA Directory - Rev 0
13/06/2003 WATERTR.DOC Page 7
3. KEY DATA INVOLVING ACCIDENT TO SEAMEN 3.1 FARs for marine accidents Table 7 - FARs for marine accidents - World-wide (per108 exposure hours) [1] [2]
Parameter 5 years 1983-87 Best estimate figures
Average Standard deviation
Supply vessel
Standby vessel
FAR - all causes (incl. accidents and vessel casualty)
27.5
12.5
20
15
FAR for small accidents 5.8
2.16
6 2
FAR due to vessel casualty 1.79*
2.59*
4 4
Note: *denotes that the Herald of Free Enterprise accident (06.03.87) is excluded. Ref. [5] gives the number of fatalities as follows: 1991 - 7; 1992 - 9; 1993 - 10; 1994 - 2. Few if any quality statistics seems available on FAR values broken down on type of offshore vessels or activities. Ref. [9] gives FAR values for the UKCS over the years 1976-88 as follows: Table 8 - Boat crew FARs for accidents at installation (1976-88) - UKCS [9]
Vessel type Fatalities 1976-88 Man years 1976-88 FAR Supply 8 9650 9.5 Anchor handling 6 1930 35.5 Standby 2 13300 1.7 Total 16 24880 7.3 Ref. 5.9 The numbers does not include accidents away from the installation, in port or similar, nor does it include engine room crew. A later study [10] covering the years 1977-1991 on the UKCS has considerable lower FAR numbers: supply 3.9; anchor handling 6.5; and standby 1.4. One explanation for the uncertainty in the numbers may be lack of consistency in calculating the population or exposure. 3.2 Type of Accidents to Crew Members - Merchant vessels Table 10 - Type of Accidents to Crew members - UK vessels (1993) [6]
Type of accident Number of Accidents Collision, foundering or stranding 1Fire 1Embarking/disembarking 7Slip/fall on ship - same level 91
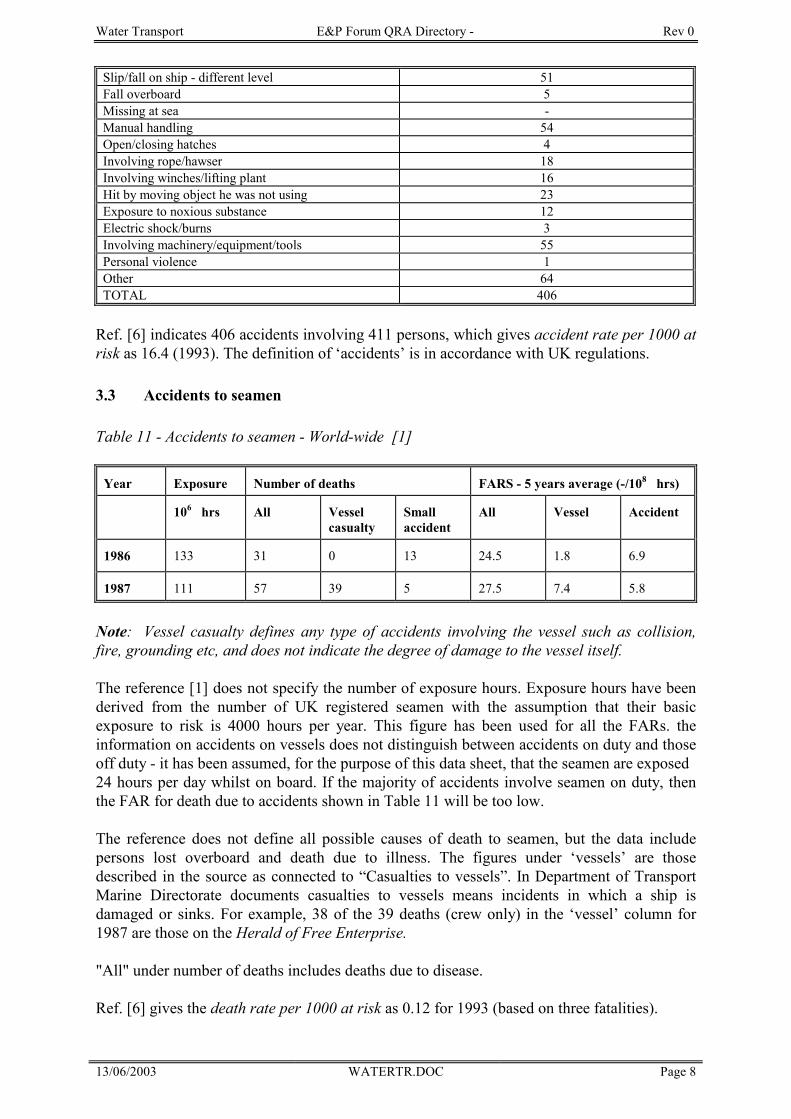
Water Transport E&P Forum QRA Directory - Rev 0
13/06/2003 WATERTR.DOC Page 8
Slip/fall on ship - different level 51 Fall overboard 5Missing at sea -Manual handling 54 Open/closing hatches 4Involving rope/hawser 18 Involving winches/lifting plant 16 Hit by moving object he was not using 23 Exposure to noxious substance 12 Electric shock/burns 3Involving machinery/equipment/tools 55 Personal violence 1Other 64 TOTAL 406
Ref. [6] indicates 406 accidents involving 411 persons, which gives accident rate per 1000 at risk as 16.4 (1993). The definition of ‘accidents’ is in accordance with UK regulations. 3.3 Accidents to seamen Table 11 - Accidents to seamen - World-wide [1]
Year Exposure Number of deaths FARS - 5 years average (-/108 hrs)
106 hrs All Vessel casualty
Small accident
All Vessel Accident
1986
133 31 0 13 24.5 1.8 6.9
1987 111 57 39 5 27.5 7.4 5.8
Note: Vessel casualty defines any type of accidents involving the vessel such as collision, fire, grounding etc, and does not indicate the degree of damage to the vessel itself. The reference [1] does not specify the number of exposure hours. Exposure hours have been derived from the number of UK registered seamen with the assumption that their basic exposure to risk is 4000 hours per year. This figure has been used for all the FARs. the information on accidents on vessels does not distinguish between accidents on duty and those off duty - it has been assumed, for the purpose of this data sheet, that the seamen are exposed 24 hours per day whilst on board. If the majority of accidents involve seamen on duty, then the FAR for death due to accidents shown in Table 11 will be too low. The reference does not define all possible causes of death to seamen, but the data include persons lost overboard and death due to illness. The figures under ‘vessels’ are those described in the source as connected to “Casualties to vessels”. In Department of Transport Marine Directorate documents casualties to vessels means incidents in which a ship is damaged or sinks. For example, 38 of the 39 deaths (crew only) in the ‘vessel’ column for 1987 are those on the Herald of Free Enterprise.
"All" under number of deaths includes deaths due to disease. Ref. [6] gives the death rate per 1000 at risk as 0.12 for 1993 (based on three fatalities).
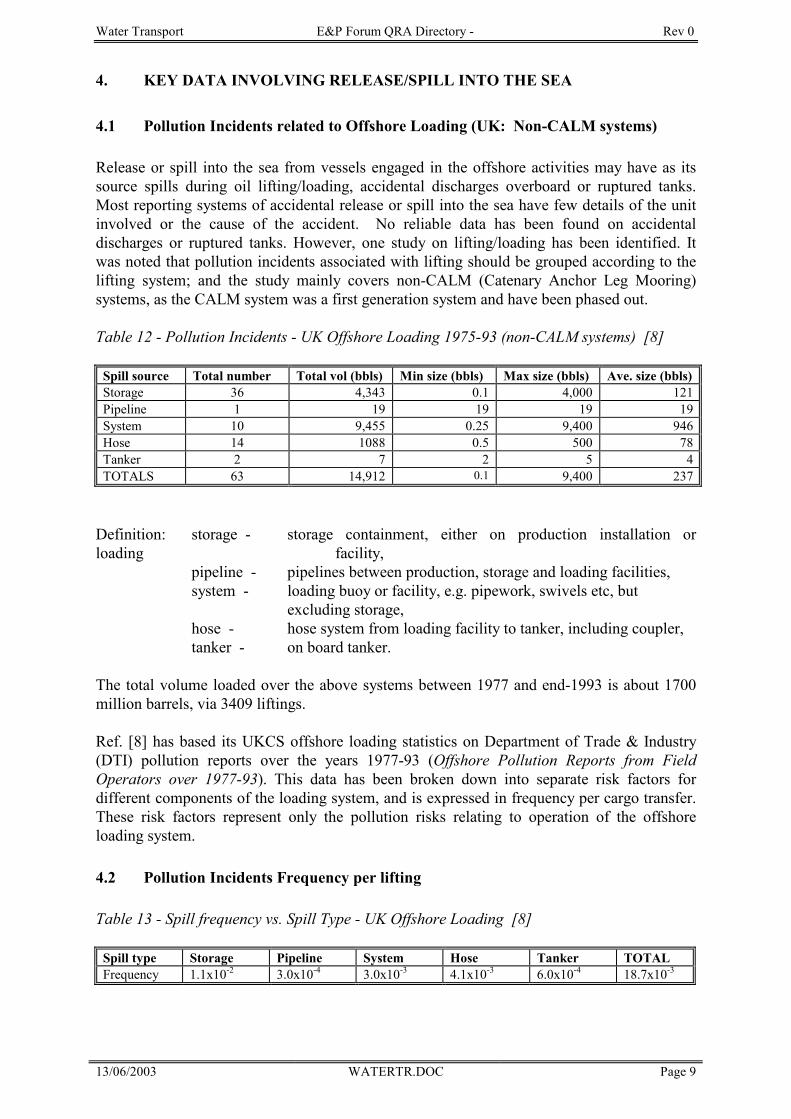
Water Transport E&P Forum QRA Directory - Rev 0
13/06/2003 WATERTR.DOC Page 9
4. KEY DATA INVOLVING RELEASE/SPILL INTO THE SEA 4.1 Pollution Incidents related to Offshore Loading (UK: Non-CALM systems) Release or spill into the sea from vessels engaged in the offshore activities may have as its source spills during oil lifting/loading, accidental discharges overboard or ruptured tanks. Most reporting systems of accidental release or spill into the sea have few details of the unit involved or the cause of the accident. No reliable data has been found on accidental discharges or ruptured tanks. However, one study on lifting/loading has been identified. It was noted that pollution incidents associated with lifting should be grouped according to the lifting system; and the study mainly covers non-CALM (Catenary Anchor Leg Mooring) systems, as the CALM system was a first generation system and have been phased out. Table 12 - Pollution Incidents - UK Offshore Loading 1975-93 (non-CALM systems) [8]
Spill source Total number Total vol (bbls) Min size (bbls) Max size (bbls) Ave. size (bbls)Storage 36 4,343 0.1 4,000 121Pipeline 1 19 19 19 19System 10 9,455 0.25 9,400 946Hose 14 1088 0.5 500 78Tanker 2 7 2 5 4TOTALS 63 14,912 0.1 9,400 237
Definition: storage - storage containment, either on production installation or loading facility, pipeline - pipelines between production, storage and loading facilities, system - loading buoy or facility, e.g. pipework, swivels etc, but excluding storage, hose - hose system from loading facility to tanker, including coupler, tanker - on board tanker. The total volume loaded over the above systems between 1977 and end-1993 is about 1700 million barrels, via 3409 liftings. Ref. [8] has based its UKCS offshore loading statistics on Department of Trade & Industry (DTI) pollution reports over the years 1977-93 (Offshore Pollution Reports from Field Operators over 1977-93). This data has been broken down into separate risk factors for different components of the loading system, and is expressed in frequency per cargo transfer. These risk factors represent only the pollution risks relating to operation of the offshore loading system. 4.2 Pollution Incidents Frequency per lifting Table 13 - Spill frequency vs. Spill Type - UK Offshore Loading [8]
Spill type Storage Pipeline System Hose Tanker TOTAL Frequency 1.1x10⁻² 3.0x10⁻⁴ 3.0x10⁻³ 4.1x10⁻³ 6.0x10⁻⁴ 18.7x10⁻³
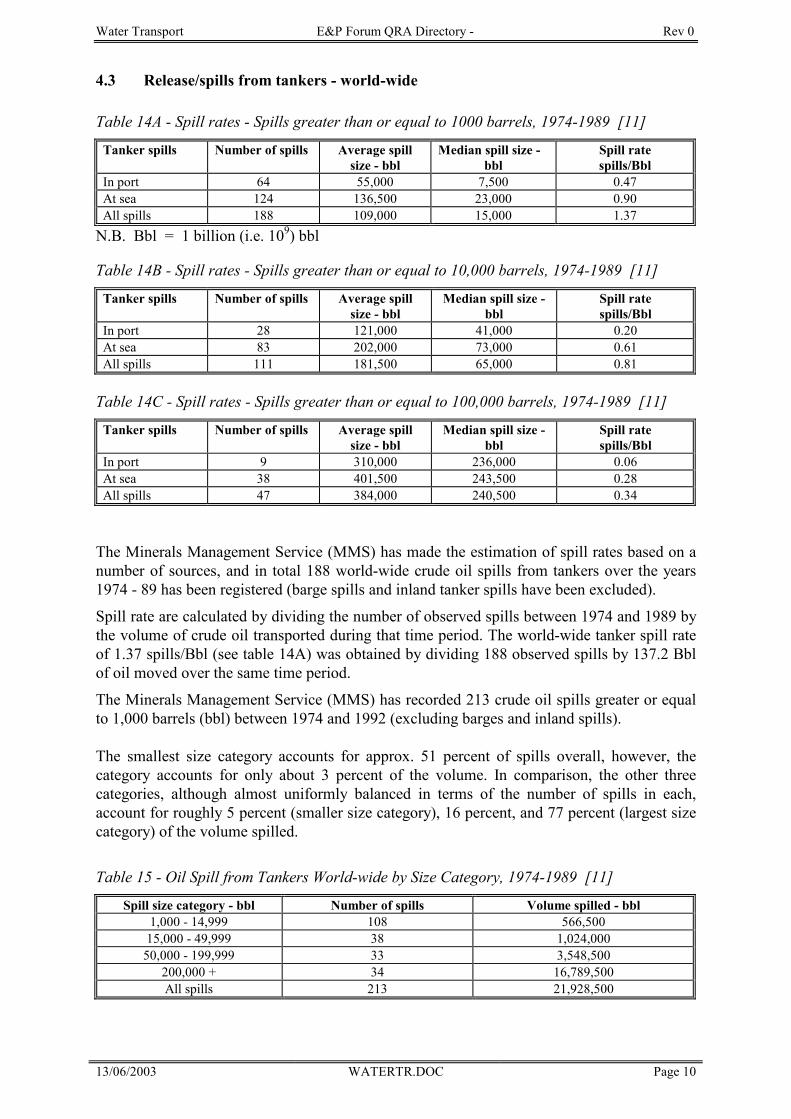
Water Transport E&P Forum QRA Directory - Rev 0
13/06/2003 WATERTR.DOC Page 10
4.3 Release/spills from tankers - world-wide Table 14A - Spill rates - Spills greater than or equal to 1000 barrels, 1974-1989 [11]
Tanker spills Number of spills Average spill size - bbl
Median spill size - bbl
Spill rate spills/Bbl
In port 64 55,000 7,500 0.47 At sea 124 136,500 23,000 0.90 All spills 188 109,000 15,000 1.37
N.B. Bbl = 1 billion (i.e. 109) bbl
Table 14B - Spill rates - Spills greater than or equal to 10,000 barrels, 1974-1989 [11]
Tanker spills Number of spills Average spill size - bbl
Median spill size - bbl
Spill rate spills/Bbl
In port 28 121,000 41,000 0.20 At sea 83 202,000 73,000 0.61 All spills 111 181,500 65,000 0.81
Table 14C - Spill rates - Spills greater than or equal to 100,000 barrels, 1974-1989 [11]
Tanker spills Number of spills Average spill size - bbl
Median spill size - bbl
Spill rate spills/Bbl
In port 9 310,000 236,000 0.06 At sea 38 401,500 243,500 0.28 All spills 47 384,000 240,500 0.34
The Minerals Management Service (MMS) has made the estimation of spill rates based on a number of sources, and in total 188 world-wide crude oil spills from tankers over the years 1974 - 89 has been registered (barge spills and inland tanker spills have been excluded).
Spill rate are calculated by dividing the number of observed spills between 1974 and 1989 by the volume of crude oil transported during that time period. The world-wide tanker spill rate of 1.37 spills/Bbl (see table 14A) was obtained by dividing 188 observed spills by 137.2 Bbl of oil moved over the same time period.
The Minerals Management Service (MMS) has recorded 213 crude oil spills greater or equal to 1,000 barrels (bbl) between 1974 and 1992 (excluding barges and inland spills). The smallest size category accounts for approx. 51 percent of spills overall, however, the category accounts for only about 3 percent of the volume. In comparison, the other three categories, although almost uniformly balanced in terms of the number of spills in each, account for roughly 5 percent (smaller size category), 16 percent, and 77 percent (largest size category) of the volume spilled.
Table 15 - Oil Spill from Tankers World-wide by Size Category, 1974-1989 [11]
Spill size category - bbl Number of spills Volume spilled - bbl 1,000 - 14,999 108 566,500
15,000 - 49,999 38 1,024,000 50,000 - 199,999 33 3,548,500
200,000 + 34 16,789,500 All spills 213 21,928,500
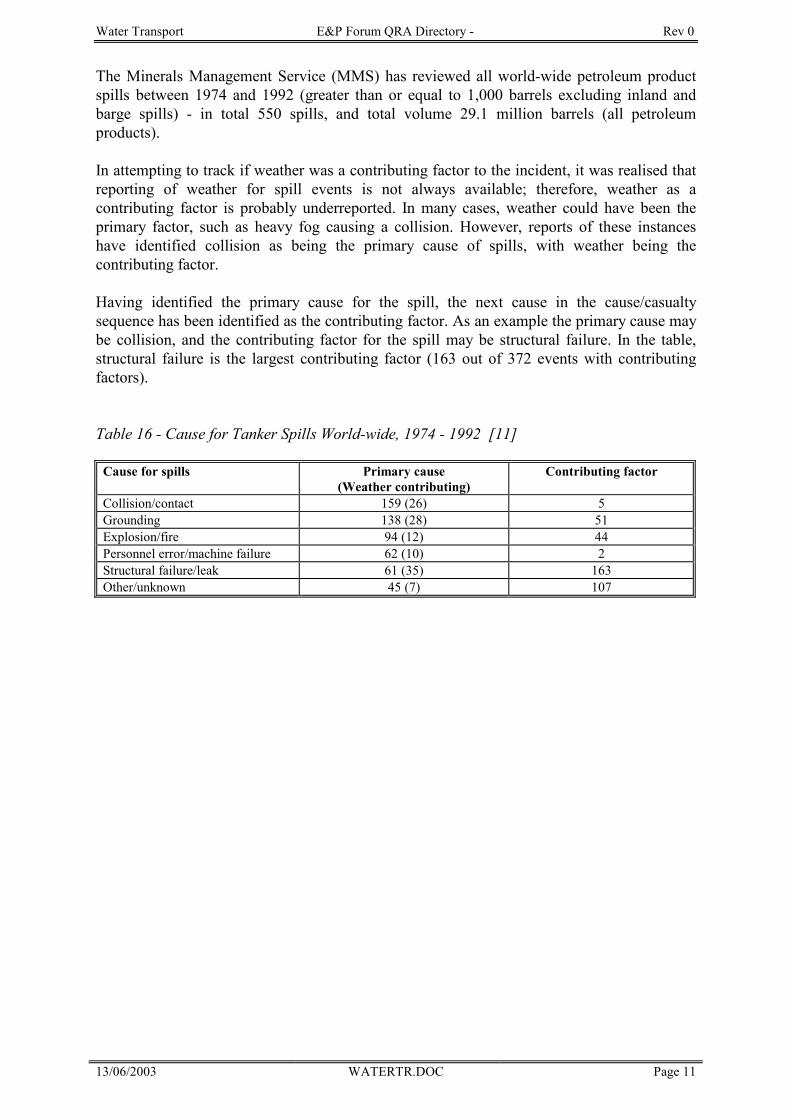
Water Transport E&P Forum QRA Directory - Rev 0
13/06/2003 WATERTR.DOC Page 11
The Minerals Management Service (MMS) has reviewed all world-wide petroleum product spills between 1974 and 1992 (greater than or equal to 1,000 barrels excluding inland and barge spills) - in total 550 spills, and total volume 29.1 million barrels (all petroleum products). In attempting to track if weather was a contributing factor to the incident, it was realised that reporting of weather for spill events is not always available; therefore, weather as a contributing factor is probably underreported. In many cases, weather could have been the primary factor, such as heavy fog causing a collision. However, reports of these instances have identified collision as being the primary cause of spills, with weather being the contributing factor. Having identified the primary cause for the spill, the next cause in the cause/casualty sequence has been identified as the contributing factor. As an example the primary cause may be collision, and the contributing factor for the spill may be structural failure. In the table, structural failure is the largest contributing factor (163 out of 372 events with contributing factors).
Table 16 - Cause for Tanker Spills World-wide, 1974 - 1992 [11]
Cause for spills Primary cause (Weather contributing)
Contributing factor
Collision/contact 159 (26) 5Grounding 138 (28) 51 Explosion/fire 94 (12) 44 Personnel error/machine failure 62 (10) 2Structural failure/leak 61 (35) 163 Other/unknown 45 (7) 107
Water Transport E&P Forum QRA Directory - Rev 0
13/06/2003 WATERTR.DOC Page 12
5. REFERENCES [1] Casualties to vessels and accidents to men
Vessels registered in the United Kingdom - 1987 UK Department of Transport Marine Directorate, HMSO.
[2] Shipping statistics year book 1988
Institute of Shipping Economics and Logistics, Bremen. [2A] Shipping statistics year book 1994 Institute of Shipping Economics and Logistics, Bremen. [3] Skipsfarts statistikk 1994 - 2. Sj�ulykker (Shipping statistics - 2. Accidents at sea)
Sj�fartsdirektoratet (Norwegian Maritime Directorate), Oslo. [4] ILU Casualty Statistics 1994
The Institute of London Underwriters, London. [5] Sjøfartsdirektoratet Årsmelding 1994 (Norwegian Maritime Directorate Annual Report 1994), Oslo. [6] Marine Accident Investigation Branch Annual Report 1993, Department of Transport, Southampton, 1994. [7] Norwegian Petroleum Directorate Annual Report 1994, Stavanger, 1995. [8] Report "Offshore Loading and Shuttle Tanker Risks - April 1995" held by an E&P Forum member [9] DnV Technica Report C2709; May 1991. [10] DnV Technica Report C3896; January 1993. [11] US Minerals Management Service - MMS Worldwide Tanker Spill Database 1993.
Water Transport E&P Forum QRA Directory - Rev 0
13/06/2003 WATERTR.DOC Page 13

Fabrication, Construction E&P Forum QRA Datasheet Directory Rev 0 and Installation
13/06/2003 FABRI.DOC Page 1
FABRICATION, CONSTRUCTION AND INSTALLATION
Fabrication, Construction E&P Forum QRA Datasheet Directory Rev 0 and Installation
13/06/2003 FABRI.DOC Page 2
TABLE OF CONTENTS
1 SCOPE -------------------------------------------------------------------------------------------------- 3
2 APPLICATION ---------------------------------------------------------------------------------------- 4
2.1 Major Accidents -------------------------------------------------------------------------------------------------------5
2.2 Occupational/personal injury accidents---------------------------------------------------------------------------6
3 KEY DATA---------------------------------------------------------------------------------------------- 9
3.1 Historical Frequencies of Major Accidents ----------------------------------------------------------------------9
3.2 Contributors to Major Accidents--------------------------------------------------------------------------------- 14 3.2.1 Dropped objects frequencies--------------------------------------------------------------------------------------- 14
3.2.1.1 Single Heavy Lifts---------------------------------------------------------------------------------------------- 14 3.2.1.2 Tandem Heavy Lifts ------------------------------------------------------------------------------------------- 15 3.2.1.3 Smaller Lifts (e.g. lifting of piles, hammers, modules, etc.)--------------------------------------------- 15
3.2.2 Mooring failure frequencies---------------------------------------------------------------------------------------- 15 3.2.2.1 Moored at a quay ----------------------------------------------------------------------------------------------- 15 3.2.2.2 Mooring/anchor lines at the installation site --------------------------------------------------------------- 15
3.2.3 Dynamic positioning failure frequency--------------------------------------------------------------------------- 16 3.2.4 Floating unit collisions with installations ------------------------------------------------------------------------ 17 3.2.5 Ballasting failure frequency---------------------------------------------------------------------------------------- 18 3.2.6 Weather window forecasting failure ------------------------------------------------------------------------------ 18
4 REFERENCES -------------------------------------------------------------------------------------- 20
Fabrication, Construction E&P Forum QRA Datasheet Directory Rev 0 and Installation
13/06/2003 FABRI.DOC Page 3
1. SCOPE The data in this sheet are concerned with the quantification of fabrication, construction and installation risks in respect of personnel safety and asset integrity. The data sheet has not been designed to assist with the quantification of general project management uncertainties for the purpose of estimating the likelihood of project schedule and cost overruns. This is considered to be a separate subject. Measured in terms of the life-cycle of a project, the fabrication, construction and installation phases have a short duration and can be characterised as: • labour intensive • involving a large number of one-off tasks • requiring temporary work arrangements and working environments • exposing components/structures to non-design loading condition. In terms of the last of these, structures can be designed to withstand extreme loadings when in-situ, such as an offshore installation being designed for a one-hundred year return wave (a storm having an annual probability of occurrence of 10-2). However, their tolerance can be considerably lower during the temporary phases. In addition, ancillary systems such as semi-submersible crane vessels, can be in a condition which makes them vulnerable to adverse weather for the period of an operation. In regard to the QRA of an onshore facility there may be no need to treat the three phases as distinct. All hazardous operations could take place at the one site and the phases could overlap in the project schedule. For an offshore installation, the first two phases - fabrication and construction - are similar and likewise there may be no need to differentiate between them. For example, in the UK Offshore Installation and Wells (Design & Construction, etc) Regulations [1], which propose the requirement for consideration of risks throughout the lifecycle of an offshore installation, no distinction is made and the two phases are grouped under the heading of “construction and other work”. However, the installation phase is distinct. Due to the variety of projects, definitions of the three phases can be in functional terms only. Definitions of the phases are:
• Fabrication Activities performed in producing significant sub-components, packages, or modules which
will be combined during the construction phase.
• Construction Activities performed to combine the sub-components, packages, or modules, in readiness for final installation.
With this definition, construction may involve the assembly of relatively large sections of an installation. Examples would include: • assembly of process packages , • lifting of modules onto a module support frame (MSF), • mechanical outfitting of a concrete gravity based structure (GBS).
Fabrication, Construction E&P Forum QRA Datasheet Directory Rev 0 and Installation
13/06/2003 FABRI.DOC Page 4
Fabrication activities need not take place in the same location as the construction activities. Therefore, construction could involve the transport of substantial sections of the installation between sites. The hazards and risks associated with these activities may need to be considered and analysed within the framework of a “total” risk analysis.
• Installation
Activities performed to transfer the structure to, and position at, the designated site.
This definition is tailored to offshore developments, where one or more structures are transported and assembled at the site. An onshore facility may have no equivalent activities.
For an offshore jacket platform this phase can include the lifting or load-out of the jacket and deck, onto transport barges. Some structures, such as concrete gravity based structures, can be towed without the assistance of a transport barge.
2. APPLICATION This data sheet can be used in risk assessments oriented to either quantifying risks to personnel or to quantifying risks to asset integrity. Major accidents are considered to have the potential for multiple loss of life and/or asset damage. Accordingly, an event which had no potential for human impact but resulted in significant repair or replacement of an asset, would be classified as a major accident. Therefore the term major accident is used here in a broader way than by the UK Health & Safety Executive [15], in which there is a focus on causing serious injury or loss of life to five or more persons. However, it is a narrower definition than used by the Norwegian Petroleum Directorate for an “accidental event”:
“An uncontrolled event which may lead to loss of human life, personal injury, damage to the environment and loss of assets and financial interests”. [16]
It is not intended that this data sheet contains all data necessary to calculate major accident frequencies. Its primary role is to indicate the types of accidents which can occur in the fabrication, construction and installation phases and to present pertinent data which may not be in other data sheets. The majority of data items presented are relevant to the QRA of offshore installation activities. This bias is due to the complexity of offshore operations for which specific data are necessary. In comparison, the data requirements for onshore projects are generic - such as dropped object frequencies - and data can be taken from elsewhere in the data directory. Fatal accident rate (FAR) statistics are presented and estimates of FAR for each phase are given. These estimates should not be regarded as recommendations for acceptable project FAR.
Fabrication, Construction E&P Forum QRA Datasheet Directory Rev 0 and Installation
13/06/2003 FABRI.DOC Page 5
2.1 Major Accidents The manufacture and assembly of one or more structures, in a changeable and hazardous environment, involve possibilities of damaging assets and incurring fatalities. Although major accidents could occur in all phases, the scope of major accidents tends to increase through the phases. For example, an in-situ pipeline can be at risk during the installation of an offshore structure. At a high level, types of incidents which can occur are: • impacts between objects/structures • over-stress of either the structure or of equipment/vessels being used in the activity • fire and explosion events • and in the case of offshore activities: loss of buoyancy, either of the structure or of
equipment/vessels being used in the activity The following is an indicative list of events per phase. By the nature of accidents, the events listed are not mutually exclusive as some can be the cause or outcome of others. A necessary stage in an analysis is to check that all risks are covered but not double counted. Structured approaches have been developed for quantified risk assessment of the construction and installation [2]. Note: Due to the similarity between the fabrication and construction phases, the two have been combined. • Fabrication/Construction:
- dropped object (e.g. dropped module when lifting onto a module support frame) - over-stressing of the structure, due to:
- design fault - failure of a supporting structure (e.g axle failure during transporting) - collision during transportation - ballasting failure - exposure to adverse weather conditions - missile impact of a ruptured gas bottle - explosion as a result of one or more ruptured gas bottles
- loss of buoyancy of a floating structure during fabrication/construction such as the capsizing of a concrete mixing barge)
- fire caused by loss of containment of flammable material (such as rupture of temporary fuel tanks)
• Installation:
In general, the types of events listed above for the fabrication and construction phases are relevant also to the installation phase, particularly in regard to onshore installation activities.
The proximity of in-situ or prior installed equipment creates hazards which may not be present during fabrication and construction, in particular the escalation potential from live or shut-in equipment.
Fabrication, Construction E&P Forum QRA Datasheet Directory Rev 0 and Installation
13/06/2003 FABRI.DOC Page 6
Listed below are incidents relevant to installing an offshore structure, the nature of which is distinct from onshore installation:
• failure during load-out, which could result in over-stressing of the structure • dropping the structure when lifting onto a transport barge • towing failure during the transfer of the installation to site, which could lead to the
loss of the installation • grounding of the structure during transport to site (e.g. during tow) • failure of the transport barge (e.g. ballasting failure) during the tow to site • premature detonation of explosive charges when launching a jacket • collision between an attendant vessel (such as a semi-submersible crane barge)
and the structure during the installation • dropped object at the installation site (e.g. dropped jacket, dropped pile). This
could lead to: - impact with pre-installed equipment, such as a sub-sea template - impact with “live” in-situ equipment, such as a pipeline
• exposure to adverse weather (i.e. weather conditions which exceed stability or structural limitations)
• structural failure of a construction vessel (e.g. overstress of the crane boom) 2.2 Occupational/personal injury accidents In terms of occupational hazards, the temporary nature of these phases tends to give rise to relatively “uncontrolled” working environments. This aspect, in combination with the intensity of the activities, results in occupational risks which are greater than in the subsequent operational phase. Occupational hazards, such as working at height, swinging objects, unguarded machinery, are not unique to these phases, though the frequency of exposure is likely to be higher than in others. Also, there is higher probability for workers to be exposed to simultaneous activities. It is logical to expect that occupational risks are greater for offshore activities compared to the equivalent onshore activities: • greater likelihood of working at height; • increased chance of physical interference between activities due to a compact “worksite”; • greater need for simultaneous activities due to time constraints (weather windows); • harsher environmental conditions. In assessing the occupational risks to offshore workers, there are hazards which are unique to offshore operations: • diving operations • helicopter transfer • use of evacuation and rescue systems (with consideration given to false alarm evacuation) Using the data presented in Tables 2 and 3 and the assumptions regarding the differences between onshore and offshore occupational risks, estimates of Fatal Accident Rates (FAR) per phase are put forward in Table 1. Specific data for diving risks are presented in Table 4.
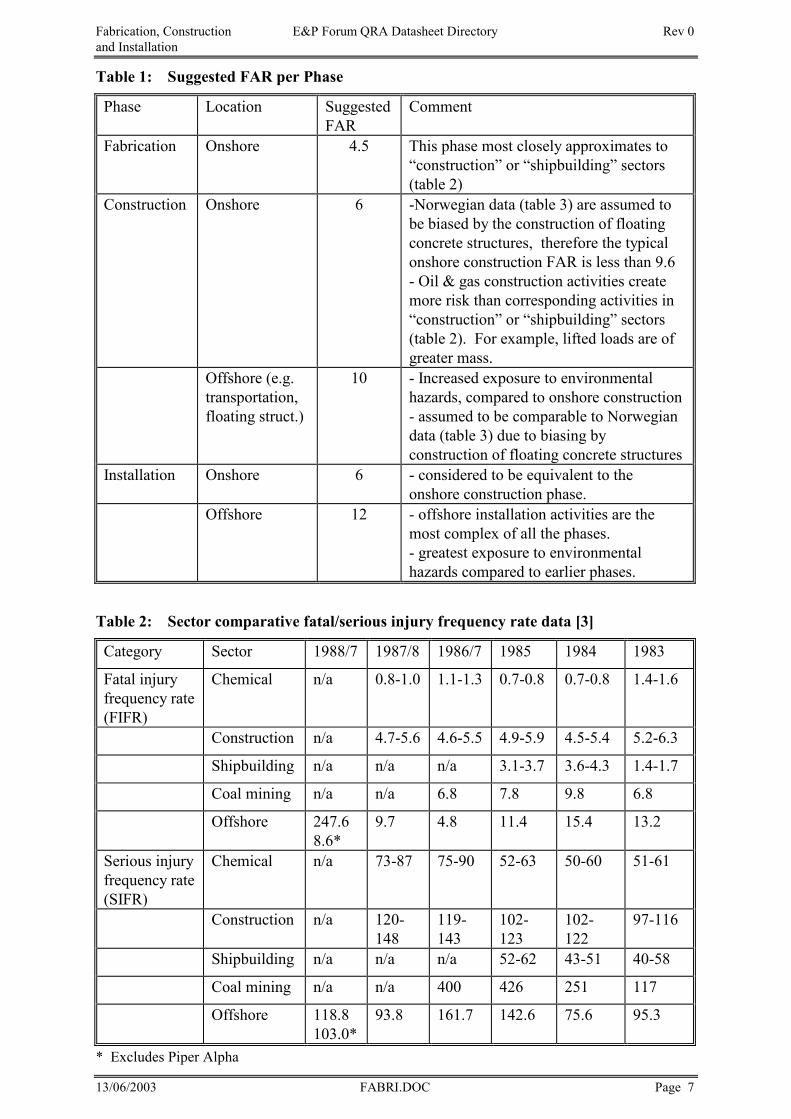
Fabrication, Construction E&P Forum QRA Datasheet Directory Rev 0 and Installation
13/06/2003 FABRI.DOC Page 7
Table 1: Suggested FAR per Phase
Phase Location Suggested FAR
Comment
Fabrication Onshore 4.5 This phase most closely approximates to “construction” or “shipbuilding” sectors (table 2)
Construction Onshore 6 -Norwegian data (table 3) are assumed to be biased by the construction of floating concrete structures, therefore the typical onshore construction FAR is less than 9.6 - Oil & gas construction activities create more risk than corresponding activities in “construction” or “shipbuilding” sectors (table 2). For example, lifted loads are of greater mass.
Offshore (e.g. transportation, floating struct.)
10 - Increased exposure to environmental hazards, compared to onshore construction - assumed to be comparable to Norwegian data (table 3) due to biasing by construction of floating concrete structures
Installation Onshore 6 - considered to be equivalent to the onshore construction phase.
Offshore 12 - offshore installation activities are the most complex of all the phases. - greatest exposure to environmental hazards compared to earlier phases.
Table 2: Sector comparative fatal/serious injury frequency rate data [3]
Category Sector 1988/7 1987/8 1986/7 1985 1984 1983
Fatal injury frequency rate (FIFR)
Chemical n/a 0.8-1.0 1.1-1.3 0.7-0.8 0.7-0.8 1.4-1.6
Construction n/a 4.7-5.6 4.6-5.5 4.9-5.9 4.5-5.4 5.2-6.3
Shipbuilding n/a n/a n/a 3.1-3.7 3.6-4.3 1.4-1.7
Coal mining n/a n/a 6.8 7.8 9.8 6.8
Offshore 247.6 8.6*
9.7 4.8 11.4 15.4 13.2
Serious injury frequency rate (SIFR)
Chemical n/a 73-87 75-90 52-63 50-60 51-61
Construction n/a 120-148
119-143
102-123
102-122
97-116
Shipbuilding n/a n/a n/a 52-62 43-51 40-58
Coal mining n/a n/a 400 426 251 117
Offshore 118.8 103.0*
93.8 161.7 142.6 75.6 95.3
* Excludes Piper Alpha
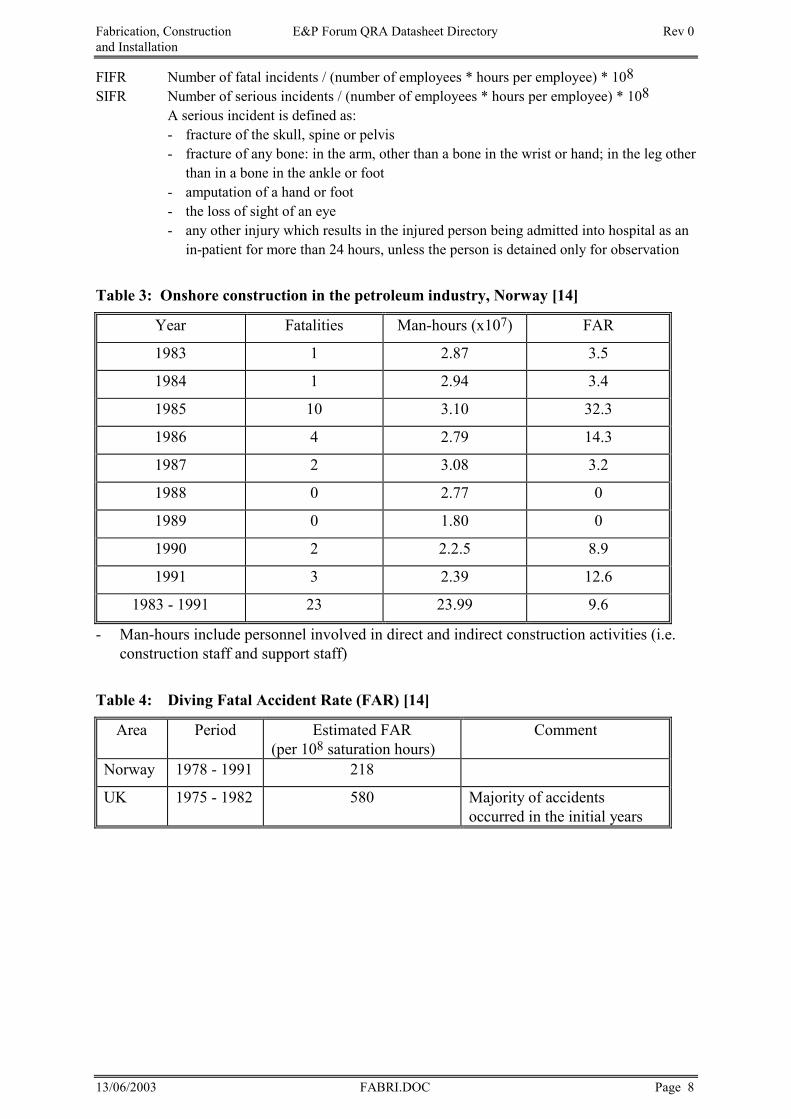
Fabrication, Construction E&P Forum QRA Datasheet Directory Rev 0 and Installation
13/06/2003 FABRI.DOC Page 8
FIFR Number of fatal incidents / (number of employees * hours per employee) * 108SIFR Number of serious incidents / (number of employees * hours per employee) * 108
A serious incident is defined as: - fracture of the skull, spine or pelvis - fracture of any bone: in the arm, other than a bone in the wrist or hand; in the leg other
than in a bone in the ankle or foot - amputation of a hand or foot - the loss of sight of an eye - any other injury which results in the injured person being admitted into hospital as an
in-patient for more than 24 hours, unless the person is detained only for observation
Table 3: Onshore construction in the petroleum industry, Norway [14]
Year Fatalities Man-hours (x107) FAR
1983 1 2.87 3.5
1984 1 2.94 3.4
1985 10 3.10 32.3
1986 4 2.79 14.3
1987 2 3.08 3.2
1988 0 2.77 0
1989 0 1.80 0
1990 2 2.2.5 8.9
1991 3 2.39 12.6
1983 - 1991 23 23.99 9.6
- Man-hours include personnel involved in direct and indirect construction activities (i.e. construction staff and support staff)
Table 4: Diving Fatal Accident Rate (FAR) [14]
Area Period Estimated FAR (per 108 saturation hours)
Comment
Norway 1978 - 1991 218
UK 1975 - 1982 580 Majority of accidents occurred in the initial years
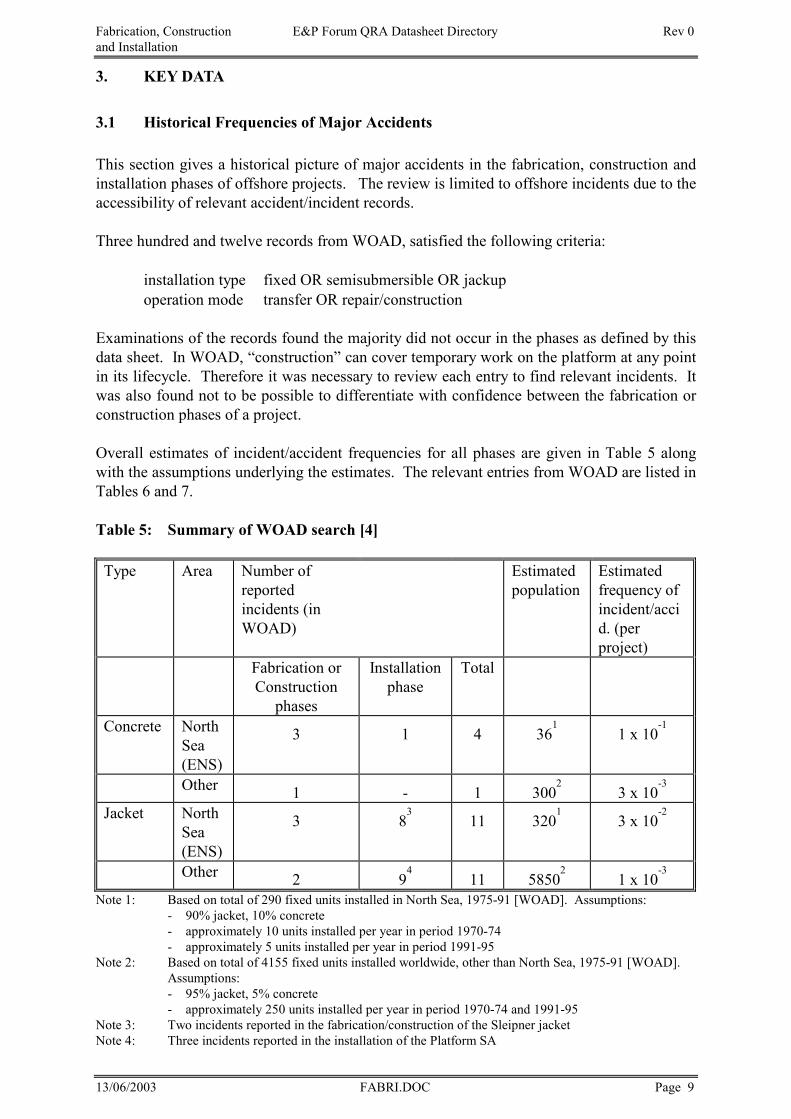
Fabrication, Construction E&P Forum QRA Datasheet Directory Rev 0 and Installation
13/06/2003 FABRI.DOC Page 9
3. KEY DATA 3.1 Historical Frequencies of Major Accidents This section gives a historical picture of major accidents in the fabrication, construction and installation phases of offshore projects. The review is limited to offshore incidents due to the accessibility of relevant accident/incident records. Three hundred and twelve records from WOAD, satisfied the following criteria: • installation type fixed OR semisubmersible OR jackup • operation mode transfer OR repair/construction Examinations of the records found the majority did not occur in the phases as defined by this data sheet. In WOAD, “construction” can cover temporary work on the platform at any point in its lifecycle. Therefore it was necessary to review each entry to find relevant incidents. It was also found not to be possible to differentiate with confidence between the fabrication or construction phases of a project. Overall estimates of incident/accident frequencies for all phases are given in Table 5 along with the assumptions underlying the estimates. The relevant entries from WOAD are listed in Tables 6 and 7. Table 5: Summary of WOAD search [4]
Type Area Number of reported incidents (in WOAD)
Estimated population
Estimated frequency of incident/accid. (per project)
Fabrication or Construction
phases
Installation phase
Total
Concrete North Sea (ENS)
3 1 4 361
1 x 10⁻¹
Other 1 - 1 3002
3 x 10⁻³
Jacket North
Sea (ENS)
3 83
11 3201
3 x 10⁻²
Other 2 94
11 58502
1 x 10⁻³
Note 1: Based on total of 290 fixed units installed in North Sea, 1975-91 [WOAD]. Assumptions:
- 90% jacket, 10% concrete - approximately 10 units installed per year in period 1970-74 - approximately 5 units installed per year in period 1991-95
Note 2: Based on total of 4155 fixed units installed worldwide, other than North Sea, 1975-91 [WOAD]. Assumptions: - 95% jacket, 5% concrete - approximately 250 units installed per year in period 1970-74 and 1991-95
Note 3: Two incidents reported in the fabrication/construction of the Sleipner jacket Note 4: Three incidents reported in the installation of the Platform SA
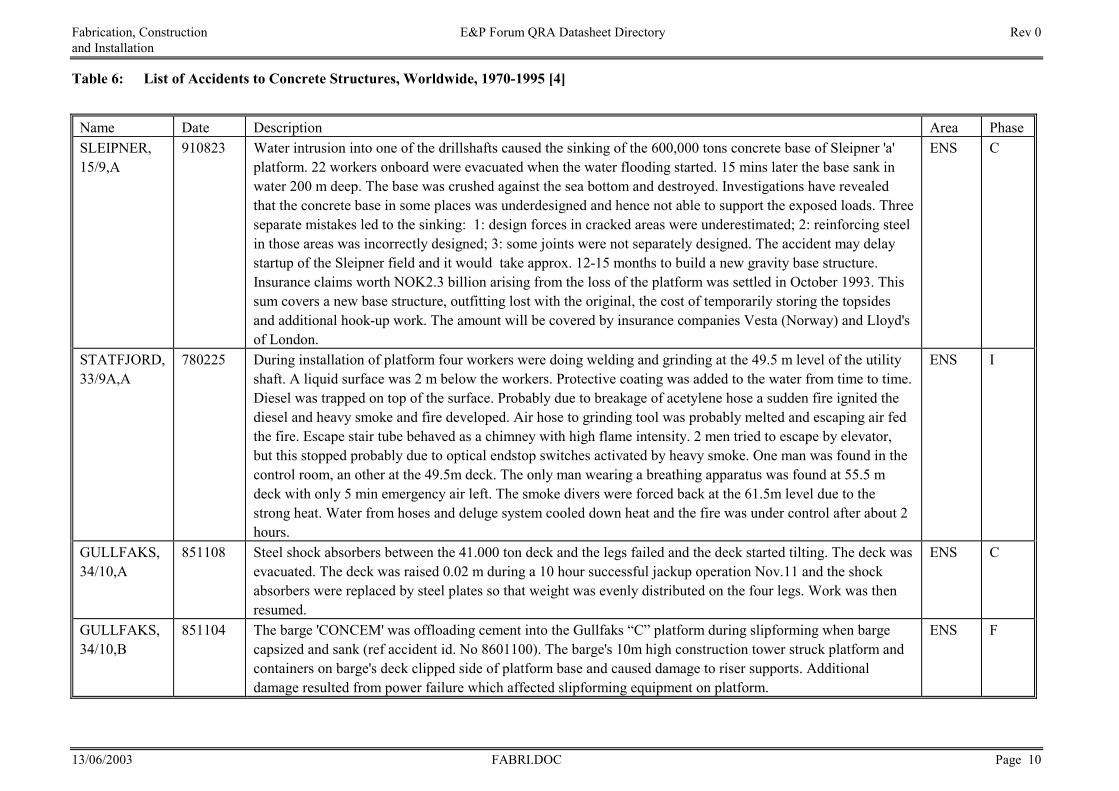
Fabrication, Construction E&P Forum QRA Datasheet Directory Rev 0and Installation
13/06/2003 FABRI.DOC Page 10
Table 6: List of Accidents to Concrete Structures, Worldwide, 1970-1995 [4]
Name Date Description Area PhaseSLEIPNER,15/9,A
910823 Water intrusion into one of the drillshafts caused the sinking of the 600,000 tons concrete base of Sleipner 'a'platform. 22 workers onboard were evacuated when the water flooding started. 15 mins later the base sank inwater 200 m deep. The base was crushed against the sea bottom and destroyed. Investigations have revealedthat the concrete base in some places was underdesigned and hence not able to support the exposed loads. Threeseparate mistakes led to the sinking: 1: design forces in cracked areas were underestimated; 2: reinforcing steelin those areas was incorrectly designed; 3: some joints were not separately designed. The accident may delaystartup of the Sleipner field and it would take approx. 12-15 months to build a new gravity base structure.Insurance claims worth NOK2.3 billion arising from the loss of the platform was settled in October 1993. Thissum covers a new base structure, outfitting lost with the original, the cost of temporarily storing the topsidesand additional hook-up work. The amount will be covered by insurance companies Vesta (Norway) and Lloyd'sof London.
ENS C
STATFJORD,33/9A,A
780225 During installation of platform four workers were doing welding and grinding at the 49.5 m level of the utilityshaft. A liquid surface was 2 m below the workers. Protective coating was added to the water from time to time.Diesel was trapped on top of the surface. Probably due to breakage of acetylene hose a sudden fire ignited thediesel and heavy smoke and fire developed. Air hose to grinding tool was probably melted and escaping air fedthe fire. Escape stair tube behaved as a chimney with high flame intensity. 2 men tried to escape by elevator,but this stopped probably due to optical endstop switches activated by heavy smoke. One man was found in thecontrol room, an other at the 49.5m deck. The only man wearing a breathing apparatus was found at 55.5 mdeck with only 5 min emergency air left. The smoke divers were forced back at the 61.5m level due to thestrong heat. Water from hoses and deluge system cooled down heat and the fire was under control after about 2hours.
ENS I
GULLFAKS,34/10,A
851108 Steel shock absorbers between the 41.000 ton deck and the legs failed and the deck started tilting. The deck wasevacuated. The deck was raised 0.02 m during a 10 hour successful jackup operation Nov.11 and the shockabsorbers were replaced by steel plates so that weight was evenly distributed on the four legs. Work was thenresumed.
ENS C
GULLFAKS,34/10,B
851104 The barge 'CONCEM' was offloading cement into the Gullfaks “C” platform during slipforming when bargecapsized and sank (ref accident id. No 8601100). The barge's 10m high construction tower struck platform andcontainers on barge's deck clipped side of platform base and caused damage to riser supports. Additionaldamage resulted from power failure which affected slipforming equipment on platform.
ENS F
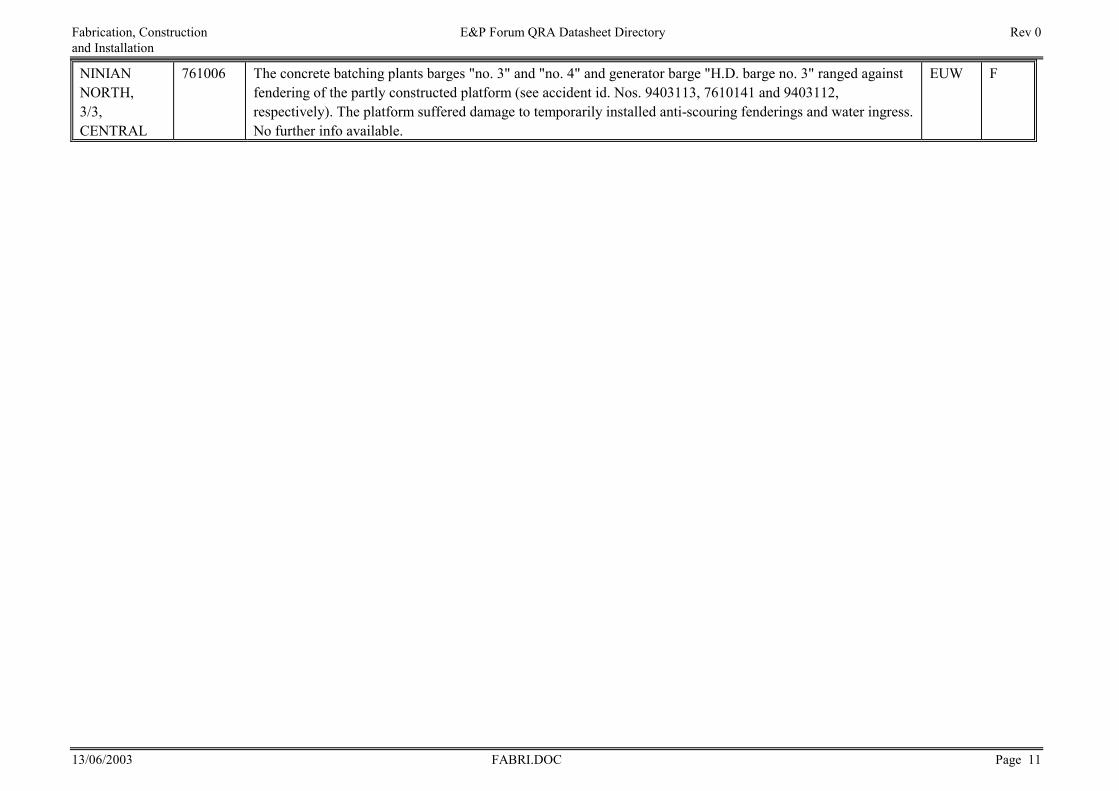
Fabrication, Construction E&P Forum QRA Datasheet Directory Rev 0and Installation
13/06/2003 FABRI.DOC Page 11
NINIANNORTH,3/3,CENTRAL
761006 The concrete batching plants barges "no. 3" and "no. 4" and generator barge "H.D. barge no. 3" ranged againstfendering of the partly constructed platform (see accident id. Nos. 9403113, 7610141 and 9403112,respectively). The platform suffered damage to temporarily installed anti-scouring fenderings and water ingress.No further info available.
EUW F
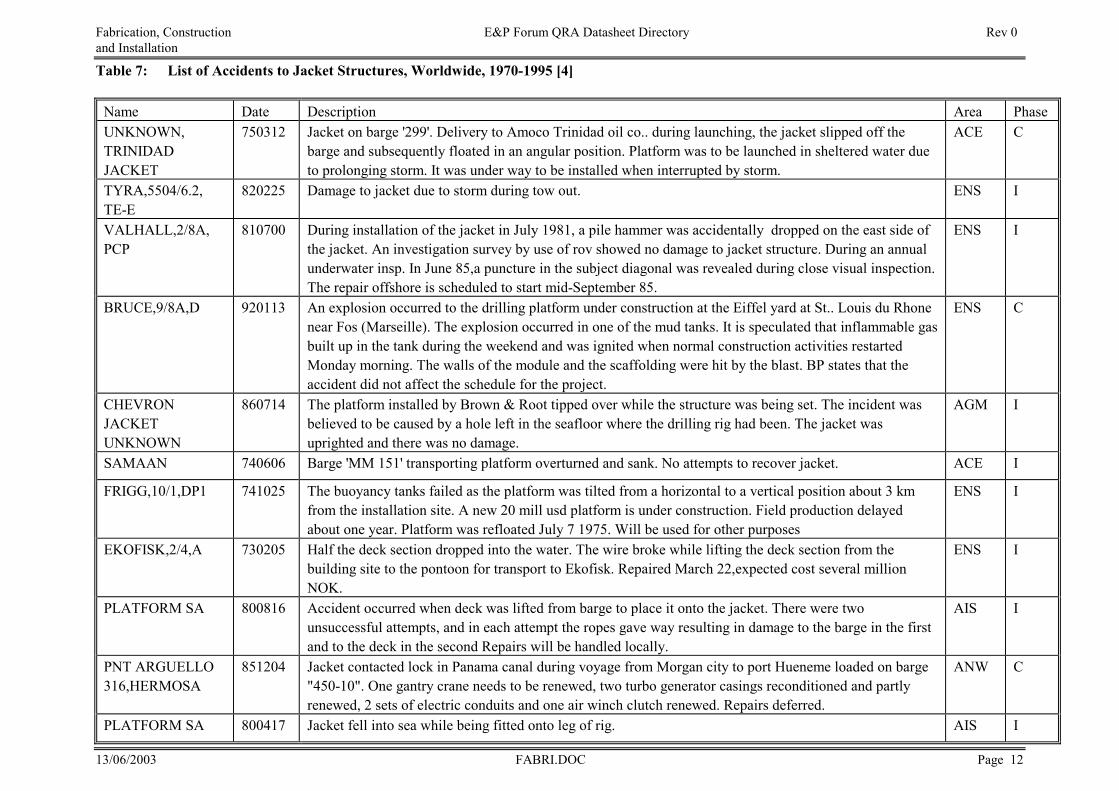
Fabrication, Construction E&P Forum QRA Datasheet Directory Rev 0and Installation
13/06/2003 FABRI.DOC Page 12
Table 7: List of Accidents to Jacket Structures, Worldwide, 1970-1995 [4]
Name Date Description Area PhaseUNKNOWN,TRINIDADJACKET
750312 Jacket on barge '299'. Delivery to Amoco Trinidad oil co.. during launching, the jacket slipped off thebarge and subsequently floated in an angular position. Platform was to be launched in sheltered water dueto prolonging storm. It was under way to be installed when interrupted by storm.
ACE C
TYRA,5504/6.2,TE-E
820225 Damage to jacket due to storm during tow out. ENS I
VALHALL,2/8A,PCP
810700 During installation of the jacket in July 1981, a pile hammer was accidentally dropped on the east side ofthe jacket. An investigation survey by use of rov showed no damage to jacket structure. During an annualunderwater insp. In June 85,a puncture in the subject diagonal was revealed during close visual inspection.The repair offshore is scheduled to start mid-September 85.
ENS I
BRUCE,9/8A,D 920113 An explosion occurred to the drilling platform under construction at the Eiffel yard at St.. Louis du Rhonenear Fos (Marseille). The explosion occurred in one of the mud tanks. It is speculated that inflammable gasbuilt up in the tank during the weekend and was ignited when normal construction activities restartedMonday morning. The walls of the module and the scaffolding were hit by the blast. BP states that theaccident did not affect the schedule for the project.
ENS C
CHEVRONJACKETUNKNOWN
860714 The platform installed by Brown & Root tipped over while the structure was being set. The incident wasbelieved to be caused by a hole left in the seafloor where the drilling rig had been. The jacket wasuprighted and there was no damage.
AGM I
SAMAAN 740606 Barge 'MM 151' transporting platform overturned and sank. No attempts to recover jacket. ACE I
FRIGG,10/1,DP1 741025 The buoyancy tanks failed as the platform was tilted from a horizontal to a vertical position about 3 kmfrom the installation site. A new 20 mill usd platform is under construction. Field production delayedabout one year. Platform was refloated July 7 1975. Will be used for other purposes
ENS I
EKOFISK,2/4,A 730205 Half the deck section dropped into the water. The wire broke while lifting the deck section from thebuilding site to the pontoon for transport to Ekofisk. Repaired March 22,expected cost several millionNOK.
ENS I
PLATFORM SA 800816 Accident occurred when deck was lifted from barge to place it onto the jacket. There were twounsuccessful attempts, and in each attempt the ropes gave way resulting in damage to the barge in the firstand to the deck in the second Repairs will be handled locally.
AIS I
PNT ARGUELLO316,HERMOSA
851204 Jacket contacted lock in Panama canal during voyage from Morgan city to port Hueneme loaded on barge"450-10". One gantry crane needs to be renewed, two turbo generator casings reconditioned and partlyrenewed, 2 sets of electric conduits and one air winch clutch renewed. Repairs deferred.
ANW C
PLATFORM SA 800417 Jacket fell into sea while being fitted onto leg of rig. AIS I
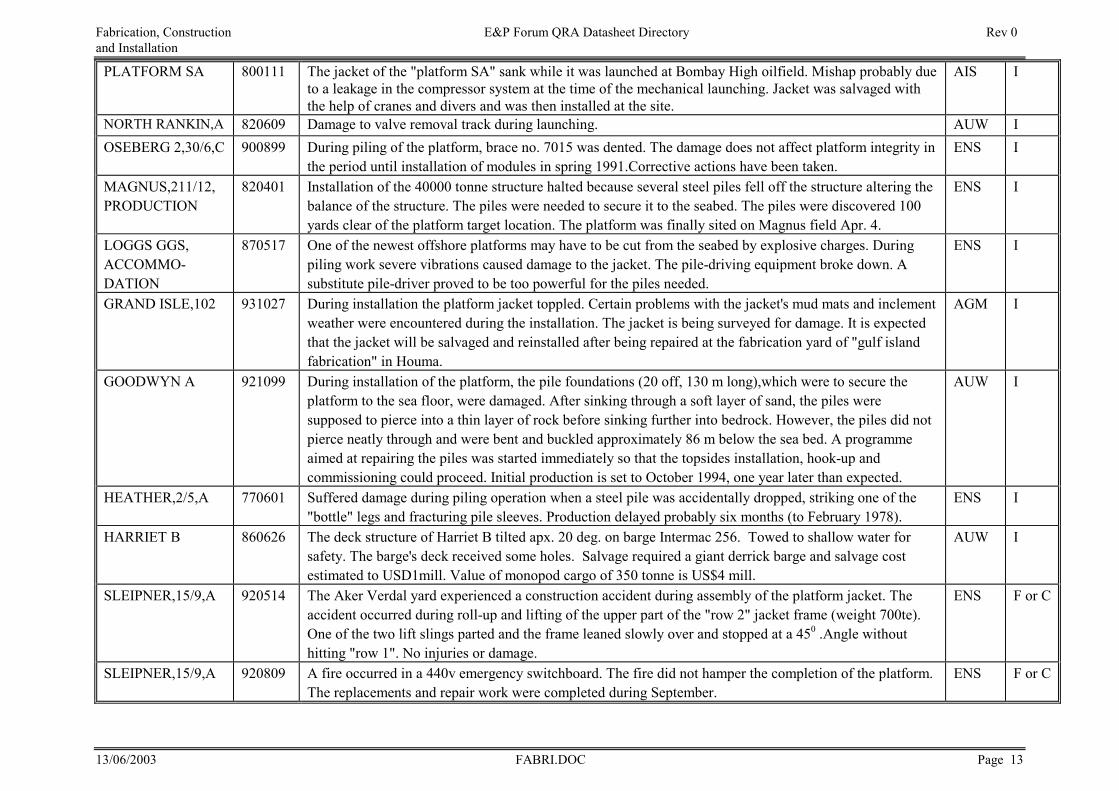
Fabrication, Construction E&P Forum QRA Datasheet Directory Rev 0and Installation
13/06/2003 FABRI.DOC Page 13
PLATFORM SA 800111 The jacket of the "platform SA" sank while it was launched at Bombay High oilfield. Mishap probably dueto a leakage in the compressor system at the time of the mechanical launching. Jacket was salvaged withthe help of cranes and divers and was then installed at the site.
AIS I
NORTH RANKIN,A 820609 Damage to valve removal track during launching. AUW IOSEBERG 2,30/6,C 900899 During piling of the platform, brace no. 7015 was dented. The damage does not affect platform integrity in
the period until installation of modules in spring 1991.Corrective actions have been taken.ENS I
MAGNUS,211/12,PRODUCTION
820401 Installation of the 40000 tonne structure halted because several steel piles fell off the structure altering thebalance of the structure. The piles were needed to secure it to the seabed. The piles were discovered 100yards clear of the platform target location. The platform was finally sited on Magnus field Apr. 4.
ENS I
LOGGS GGS,ACCOMMO-DATION
870517 One of the newest offshore platforms may have to be cut from the seabed by explosive charges. Duringpiling work severe vibrations caused damage to the jacket. The pile-driving equipment broke down. Asubstitute pile-driver proved to be too powerful for the piles needed.
ENS I
GRAND ISLE,102 931027 During installation the platform jacket toppled. Certain problems with the jacket's mud mats and inclementweather were encountered during the installation. The jacket is being surveyed for damage. It is expectedthat the jacket will be salvaged and reinstalled after being repaired at the fabrication yard of "gulf islandfabrication" in Houma.
AGM I
GOODWYN A 921099 During installation of the platform, the pile foundations (20 off, 130 m long),which were to secure theplatform to the sea floor, were damaged. After sinking through a soft layer of sand, the piles weresupposed to pierce into a thin layer of rock before sinking further into bedrock. However, the piles did notpierce neatly through and were bent and buckled approximately 86 m below the sea bed. A programmeaimed at repairing the piles was started immediately so that the topsides installation, hook-up andcommissioning could proceed. Initial production is set to October 1994, one year later than expected.
AUW I
HEATHER,2/5,A 770601 Suffered damage during piling operation when a steel pile was accidentally dropped, striking one of the"bottle" legs and fracturing pile sleeves. Production delayed probably six months (to February 1978).
ENS I
HARRIET B 860626 The deck structure of Harriet B tilted apx. 20 deg. on barge Intermac 256. Towed to shallow water forsafety. The barge's deck received some holes. Salvage required a giant derrick barge and salvage costestimated to USD1mill. Value of monopod cargo of 350 tonne is US$4 mill.
AUW I
SLEIPNER,15/9,A 920514 The Aker Verdal yard experienced a construction accident during assembly of the platform jacket. Theaccident occurred during roll-up and lifting of the upper part of the "row 2" jacket frame (weight 700te).One of the two lift slings parted and the frame leaned slowly over and stopped at a 450 .Angle withouthitting "row 1". No injuries or damage.
ENS F or C
SLEIPNER,15/9,A 920809 A fire occurred in a 440v emergency switchboard. The fire did not hamper the completion of the platform.The replacements and repair work were completed during September.
ENS F or C
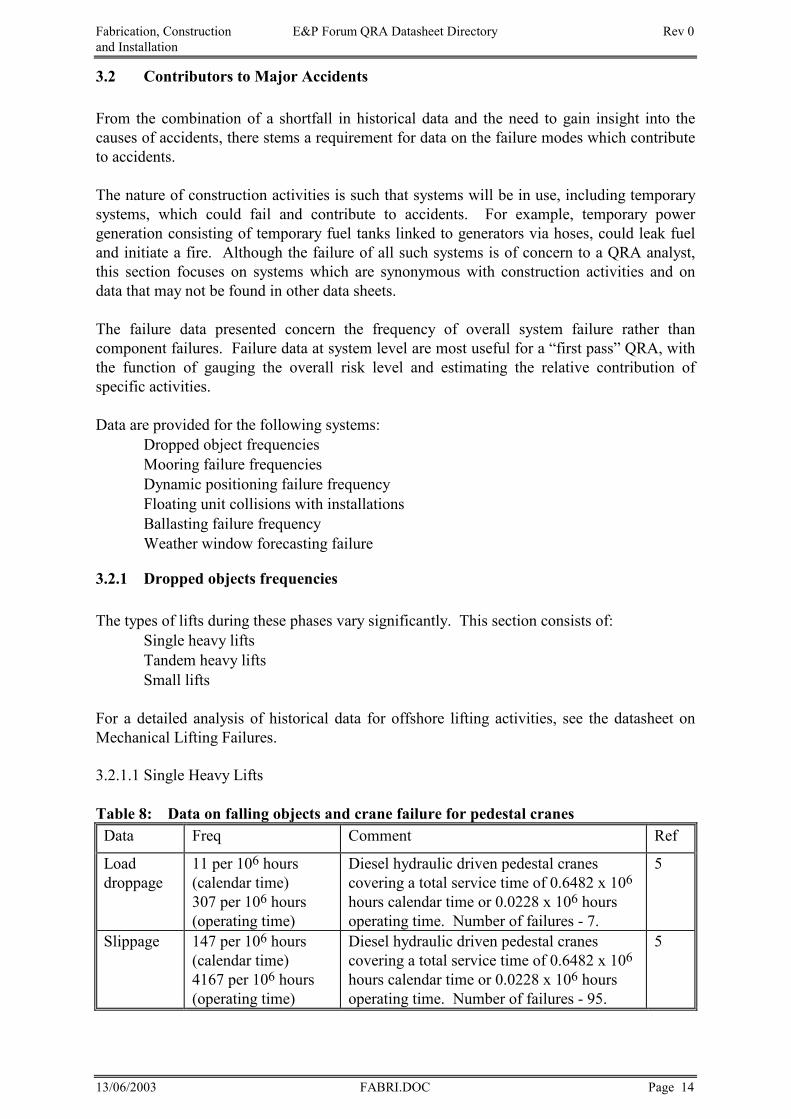
Fabrication, Construction E&P Forum QRA Datasheet Directory Rev 0 and Installation
13/06/2003 FABRI.DOC Page 14
3.2 Contributors to Major Accidents From the combination of a shortfall in historical data and the need to gain insight into the causes of accidents, there stems a requirement for data on the failure modes which contribute to accidents. The nature of construction activities is such that systems will be in use, including temporary systems, which could fail and contribute to accidents. For example, temporary power generation consisting of temporary fuel tanks linked to generators via hoses, could leak fuel and initiate a fire. Although the failure of all such systems is of concern to a QRA analyst, this section focuses on systems which are synonymous with construction activities and on data that may not be found in other data sheets. The failure data presented concern the frequency of overall system failure rather than component failures. Failure data at system level are most useful for a “first pass” QRA, with the function of gauging the overall risk level and estimating the relative contribution of specific activities. Data are provided for the following systems: • Dropped object frequencies • Mooring failure frequencies • Dynamic positioning failure frequency • Floating unit collisions with installations • Ballasting failure frequency • Weather window forecasting failure
3.2.1 Dropped objects frequencies The types of lifts during these phases vary significantly. This section consists of: • Single heavy lifts • Tandem heavy lifts • Small lifts For a detailed analysis of historical data for offshore lifting activities, see the datasheet on Mechanical Lifting Failures. 3.2.1.1 Single Heavy Lifts Table 8: Data on falling objects and crane failure for pedestal cranes Data Freq Comment Ref
Load droppage
11 per 106 hours (calendar time) 307 per 106 hours (operating time)
Diesel hydraulic driven pedestal cranes covering a total service time of 0.6482 x 10⁶
hours calendar time or 0.0228 x 10⁶ hours operating time. Number of failures - 7.
5
Slippage 147 per 106 hours (calendar time) 4167 per 106 hours (operating time)
Diesel hydraulic driven pedestal cranes covering a total service time of 0.6482 x 10⁶
hours calendar time or 0.0228 x 10⁶ hours operating time. Number of failures - 95.
5
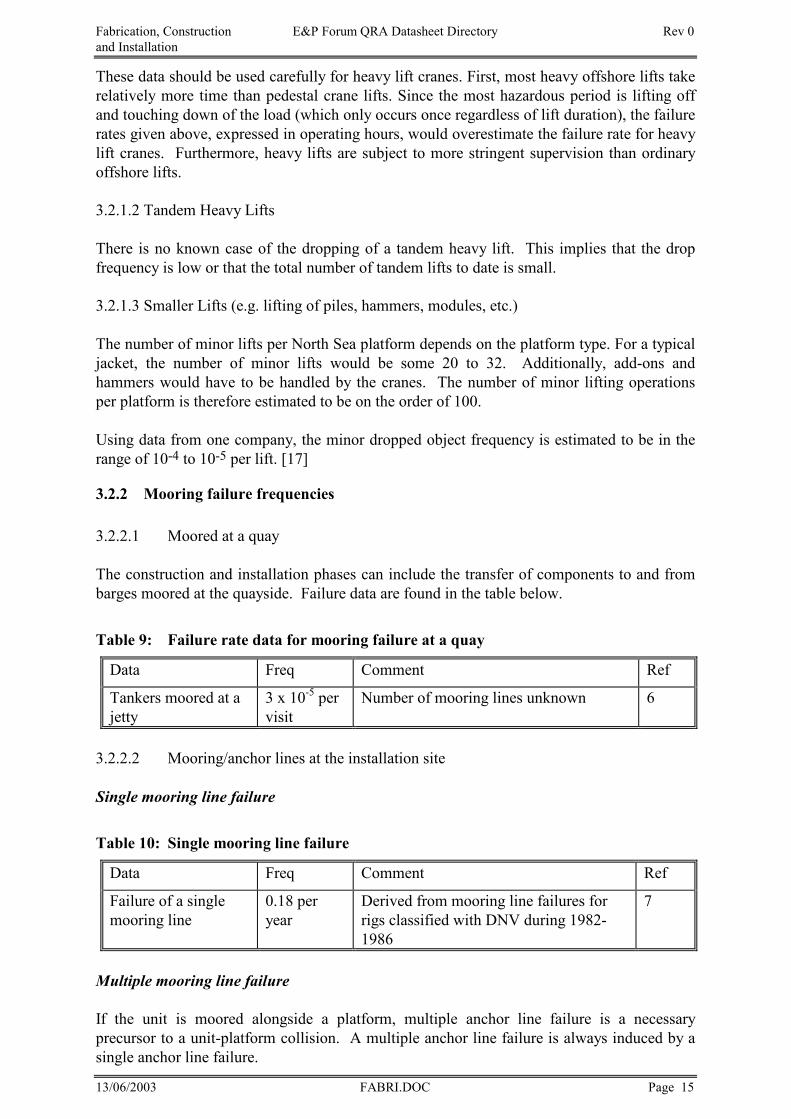
Fabrication, Construction E&P Forum QRA Datasheet Directory Rev 0 and Installation
13/06/2003 FABRI.DOC Page 15
These data should be used carefully for heavy lift cranes. First, most heavy offshore lifts take relatively more time than pedestal crane lifts. Since the most hazardous period is lifting off and touching down of the load (which only occurs once regardless of lift duration), the failure rates given above, expressed in operating hours, would overestimate the failure rate for heavy lift cranes. Furthermore, heavy lifts are subject to more stringent supervision than ordinary offshore lifts. 3.2.1.2 Tandem Heavy Lifts There is no known case of the dropping of a tandem heavy lift. This implies that the drop frequency is low or that the total number of tandem lifts to date is small. 3.2.1.3 Smaller Lifts (e.g. lifting of piles, hammers, modules, etc.) The number of minor lifts per North Sea platform depends on the platform type. For a typical jacket, the number of minor lifts would be some 20 to 32. Additionally, add-ons and hammers would have to be handled by the cranes. The number of minor lifting operations per platform is therefore estimated to be on the order of 100. Using data from one company, the minor dropped object frequency is estimated to be in the range of 10-4 to 10-5 per lift. [17]
3.2.2 Mooring failure frequencies 3.2.2.1 Moored at a quay The construction and installation phases can include the transfer of components to and from barges moored at the quayside. Failure data are found in the table below.
Table 9: Failure rate data for mooring failure at a quay
Data Freq Comment Ref
Tankers moored at a jetty
3 x 10⁻⁵ per visit
Number of mooring lines unknown 6
3.2.2.2 Mooring/anchor lines at the installation site
Single mooring line failure
Table 10: Single mooring line failure
Data Freq Comment Ref
Failure of a single mooring line
0.18 per year
Derived from mooring line failures for rigs classified with DNV during 1982-1986
7
Multiple mooring line failure
If the unit is moored alongside a platform, multiple anchor line failure is a necessary precursor to a unit-platform collision. A multiple anchor line failure is always induced by a single anchor line failure.
Fabrication, Construction E&P Forum QRA Datasheet Directory Rev 0 and Installation
13/06/2003 FABRI.DOC Page 16
Table 11: Multiple mooring line failure
Data Freq Comment Ref
multiple anchor line failure
2 x 10-
3/year Event tree analysis using failure rate of 0.18 per year for single mooring line
7
3.2.3 Dynamic positioning failure frequency Mooring Assist Systems (APM) are also included with Dynamic Positioning Systems (DPS). WOAD [8] gives various failure data for mobile units, e.g., drilling ships, drill barges, submersibles, semi-submersibles etc. A total of 431 accidents with mobile units occurred worldwide between 1970 and 1989 [8]. Of these incidents 102 accidents (24%) took place during transfer, with the remainder (329) while the unit was on location (e.g during drilling or production, providing supporting or accommodation facilities). Of the 329 incidents while on location, 130 can be related to the positioning system - 26 categorised as involving a machinery malfunction, 104 involving some other form of failure. Further analysis of these two categories is provided in tables 12 & 13. Table 12: "Machinery Malfunctioning", i.e. propulsion or pumping machinery failure,
from WOAD [8] Data Freq Comment Ref
Some form of accident due to machinery malfunction
3 x 10⁻³
per unit-year
The total number of accidents worldwide in the period 1970-1989 is 26, of which 23 can be classified as an initiating event
8
Major damage/loss due to machinery malfunction
1 x 10⁻³
per unit-year
Seven (7) of these incidents caused substantial damage or induced unit loss
8
Minor damage due to machinery malfunction
1 x 10⁻³
per unit-year
North Sea data. Period 1980-1989. One event
8
The DoE [9] gives a frequency of reported failures of DPS for the period of 1980 to 1989 resulting in loss of position, i.e. movement outside the permissible range of deviation for the operation at hand. It is based on data for diving support vessels. A normalised annual frequency of failure per vessel between 1.5 and 2.0 is quoted. Some vessels have reported up to three incidents in one year. Almost half (46%) of the reported incidents have operator error identified as the primary cause. One third (33%) have position reference or computer failure as the primary cause, 21% have failure of vessel systems including thrusters, power generation or power supply as the initial cause.
Fabrication, Construction E&P Forum QRA Datasheet Directory Rev 0 and Installation
13/06/2003 FABRI.DOC Page 17
Table 13: "Off Position", i.e. a mobile unit out of its expected position or drifting out of control, but not categorised as due to machinery failure, from WOAD [8]
Data Freq Comment Ref
Off position incident 3 x 10⁻³
per unit-year
The number of off position accidents worldwide between 1970 and 1989 is 104 over 8587 unit-years. Of these incidents only 25 were initiating events (the remaining incidents were the outcome of another incident)
8
Total loss of the unit, or severe and significant damage to the unit due to off-position
2 x 10⁻³
per unit-year
Of the 25 cases above only 15 involved total loss of the unit, or severe and significant damage
8
Significant damage 1 x 10⁻³
per unit-year
North Sea data. Period 1980-1989 (823 unit-years). One initiating event out of 18 incidents
8
3.2.4 Floating unit collisions with installations Various types of floating units can come in close proximity to the structure during the installation phase. A collision has consequences for personnel and the structural integrity.
Table 14: Collision between mobile floating unit and fixed installation
Data Freq Comment Ref
Mobile unit-fixed platform collision frequency, for second generation semi-subs
2 x 10-
5/year
Estimate 10
Mobile unit-fixed platform collision frequency, for third generation semi-subs
1 x 10-
5/year
Estimate 10
Flotel-platform collision for flotels with a mooring assist system
4 x 10-
6/year
Estimate based on the combination of bad weather, mooring line failure, unfavourable wind direction, and unsuccessful remedial manoeuvring
11
Flotel-platform collision for flotels with a twelve-point passive chain mooring (i.e. no mooring assist system)
7 x 10-
5/year
Estimate based on the combination of bad weather, mooring line failure, unfavourable wind direction, and unsuccessful remedial manoeuvring
11
Note: − A semi-sub constructed in the early 1980s, based on the specifications developed following the Alexander
Kielland accident, would be a typical second generation design. It is characterised by an eight point mooring system, a limited thruster capacity and a ballast system with a limited degree of redundancy.
− The main characteristics of the third generation semi-sub are a twelve point mooring line system, and a ballast system according to the latest NMD requirements.
Fabrication, Construction E&P Forum QRA Datasheet Directory Rev 0 and Installation
13/06/2003 FABRI.DOC Page 18
3.2.5 Ballasting failure frequency The only known incident of a semi-submersible capsizing due to ballast system failure is the Ocean Ranger (1982). The crew of the Ocean Ranger failed to respond correctly after water had entered the ballast control room.
Table 15: Ballasting Failure Frequency Data
Data Freq Comment Ref
Capsize frequency due to ballast system failure
5x10⁻⁴
/unit-year
number of active semi-submersible years (i.e. 2080 years over the period 1970-89
8
Impairment of overall integrity for an eight column semi-submersible due to ballast system failures
4x10⁻⁵
/unit-year
fault tree and event tree analysis
12
Severe damage (i.e. extreme listing or loss) for second generation semi-subs
1x10⁻⁴
/year
10
Severe damage (i.e. extreme listing or loss) for third generation semi-subs
5x10⁻⁵
/year
10
Human errors frequency for filling one ballast tank
6x10⁻⁵
/ operation
Fault tree analysis showed importance of human errors for ballast system failure
7
Human errors frequency for filling two tanks erroneously
1x10⁻⁶
/ operation
Fault tree analysis showed importance of human errors for ballast system failure
7
Note: − A semi-sub constructed in the early 1980s, based on the specifications developed following the Alexander
Kielland accident, would be a typical second generation design. It is characterised by an eight point mooring system, a limited thruster capacity and a ballast system with a limited degree of redundancy.
− The main characteristics of the third generation semi-sub are a twelve point mooring line system, and a ballast system according to the latest NMD requirements.
3.2.6 Weather window forecasting failure A structure or vessel involved in marine operations can tolerate only a certain range of weather conditions. During construction or installation, the structure or vessel may be in a condition which makes it particularly vulnerable. For example, an un-piled jacket has a significantly greater sensitivity to environmental loads than when piled. If exposed to weather which exceeds the tolerable threshold, the structure or vessel could be adversely affected. In the extreme an asset could be damaged or even lost and/or fatalities incurred. The accuracy of weather forecasting decreases with the length of the forecast. Therefore, from the moment of commencing an operation the likelihood of the weather deviating from the forecast value increases over time.
Fabrication, Construction E&P Forum QRA Datasheet Directory Rev 0 and Installation
13/06/2003 FABRI.DOC Page 19
Recent research has quantified the accuracy of forecasting wave conditions in the North Sea [13]. The data presented in table below are for wave heights between 0 and 3m in the winter period.
Table 16: North Sea Forecast Accuracy for 0-3m (Hs) Waves in the Winter Period
Time since forecast (hrs)
Likelihood of wave height exceeding the forecast
value (%)
0.5 m exceedance 1 m exceedance 1.5 m exceedance
6 21.0 7.0 2.0
12 23.0 9.0 3.0
18 25.0 10.5 4.0
24 27.5 12.0 5.0
36 30.0 16.0 7.0
48 33.0 20.0 10.0
Fabrication, Construction E&P Forum QRA Datasheet Directory Rev 0 and Installation
13/06/2003 FABRI.DOC Page 20
4. REFERENCES 1. UK Health & Safety Executive, The Offshore Installations and Wells (Design &
Construction, etc) Regulations, 1996 No913. 2 Trbojevic V.M., Bellamy L.J., Brabazon P.G., Gudmestad T., Rettedal W.K.,
“Methodology for the analysis of risks during the construction and installation phases of an offshore platform”, J Loss Prev. Process Ind., 1994, Vol 7, No 4
3. Institute of Offshore Engineering; “Offshore Accident Statistics, an analysis and
review”, 1990, UKOOA 4. Worldwide Offshore Accident Databank (WOAD) Search 5. OREDA; "Offshore Reliability Data"; Hovik, Norway, 1984 6. UK Health & Safety Executive, “Canvey, A Second Report, A Review of
Potential Hazards From Operations in the Canvey Island/Thurrock Area Three Years After Publication of the Canvey Report”, 1978, HMSO.
7. Department of Energy; "Comparative Safety Evaluation of Arrangements for
Accommodating Personnel Offshore"; Report ref. OTN-88-175; December 1988 8. Worldwide Offshore Accident Databank (WOAD); "WOAD Statistical Report
1990"; Hovik, Norway, 1990 9. Department of Energy; "Dynamic Positioning Incidents 1980-1988", Prepared by Global Maritime Limited, Report no OTO-87-005; 1989 10. J.E. Vinnem and B. Hope; "Offshore Safety Management (Theoretical Fundament
and Practical Experiences)"; Trondheim, Norway, 1986 11. Safe Offshore AB; "Bridge a Way to Safety"; Sweden, November 1988 12. Risk Assessment of Buoyancy Loss (RABL), Report No. 3, Ship-MODU
Collision Frequency, Siktec a/s, Trondheim, 1987 13. Brabazon P.G., Hopkins J.S., Gudmestad O.T., “Estimating the likelihood of
weather criteria exceedance during marine operations”, in press 14. Data provided by E&P Forum Member 15. UK Health & Safety Executive, Offshore Installations (Safety Case) Regulations,
1992. 16. Norwegian Petroleum Directorate, Regulations relating to implementation and use
of risk analyses in the petroleum activities. 4 December 1990. 17. Data provided by E&P Forum Member
Fabrication, Construction E&P Forum QRA Datasheet Directory Rev 0 and Installation
13/06/2003 FABRI.DOC Page 21
Process Release & Ignition E&P Forum QRA Datasheet Directory Rev 0
13/06/2003 PROCSREL.DOC Page 1
PROCESS RELEASE AND IGNITION
Process Release & Ignition E&P Forum QRA Datasheet Directory Rev 0
13/06/2003 PROCSREL.DOC Page 2
TABLE OF CONTENTS
1. SUMMARY-------------------------------------------------------------------------------------------- 3
1.1 Scope ---------------------------------------------------------------------------------------------------------------------3
1.2 Application -------------------------------------------------------------------------------------------------------------3
2. RELEASES------------------------------------------------------------------------------------------- 4
2.1 Historical data ---------------------------------------------------------------------------------------------------------4 2.1.1 Location of leaks-------------------------------------------------------------------------------------------------------4 2.1.2 Source of Leaks --------------------------------------------------------------------------------------------------------5 2.1.3 Frequency of Major Releases ----------------------------------------------------------------------------------------8
2.2 Models for Prediction of Release and Dispersion---------------------------------------------------------------9 2.2.1 Models for Release Frequencies-------------------------------------------------------------------------------------9 2.2.2 Models for Dispersion from a Release --------------------------------------------------------------------------- 14
3. IGNITION -------------------------------------------------------------------------------------------- 10
3.1 Historical Data ------------------------------------------------------------------------------------------------------- 10
3.2 Probability of Ignition on Platforms ----------------------------------------------------------------------------- 12
3.3 Models for Prediction of Fire and Explosion Consequences ------------------------------------------------ 14 3.3.1 Models for Ignition -------------------------------------------------------------------------------------------------- 14 3.3.2 Models for Fire and Explosions ----------------------------------------------------------------------------------- 14
4. MISCELLANEOUS------------------------------------------------------------------------------- 15
4.1 Vapour Cloud Explosions ----------------------------------------------------------------------------------------- 15
4.2 Research -------------------------------------------------------------------------------------------------------------- 23
5. REFERENCES ------------------------------------------------------------------------------------- 24
Process Release & Ignition E&P Forum QRA Datasheet Directory Rev 0
13/06/2003 PROCSREL.DOC Page 3
1. SUMMARY 1.1 Scope This datasheet summarises information about the frequency of releases from hydrocarbon processing equipment and the ignition of such releases. It addresses frequencies based on historical data as well as by calculation and suggests frequencies which may be suitable for risk assessment.
1.2 Application Existing hydrocarbon leak and ignition data are not very reliable. Quality data on a detailed level are scarce. There are many ways in which historical data may not match the particular platform under consideration. Some of the factors which may affect overall probability for release are: • -Engineering standards applied to critical items • -Complexity of unit and process • -Plant spacing and access • -Maintenance standards and inspection/preventive systems • -Overall grouping and spacing of functions • -Age of equipment • -Degree of process loading and other operating patterns • -Quality of operating staff This has been recognised by E&P Forum members who have set up a project to improve the data available for the industry. The project is expected to be operational; i.e. collection and distribution of data, in 1996. With a continuous data collection system it is expected that the E&P Forum database will make much improved data available for the industry within a few years. Application of the data presented in this datasheet poses the challenge of assessing the relevance of the data to the technology and operating condition of the case being reviewed or assessed.
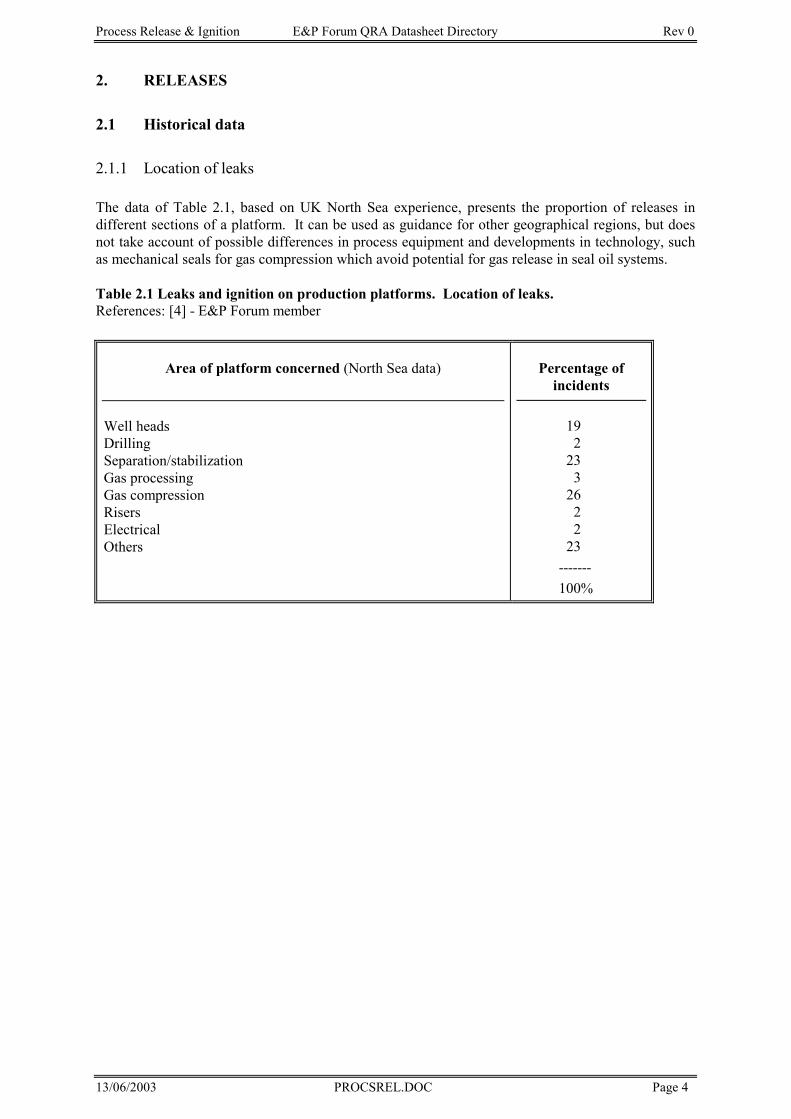
Process Release & Ignition E&P Forum QRA Datasheet Directory Rev 0
13/06/2003 PROCSREL.DOC Page 4
2. RELEASES 2.1 Historical data 2.1.1 Location of leaks The data of Table 2.1, based on UK North Sea experience, presents the proportion of releases in different sections of a platform. It can be used as guidance for other geographical regions, but does not take account of possible differences in process equipment and developments in technology, such as mechanical seals for gas compression which avoid potential for gas release in seal oil systems. Table 2.1 Leaks and ignition on production platforms. Location of leaks. References: [4] - E&P Forum member
Area of platform concerned (North Sea data)
Well heads Drilling Separation/stabilization Gas processing Gas compression Risers Electrical Others
Percentage of incidents
19 2
23 3
26 2
223
------- 100%
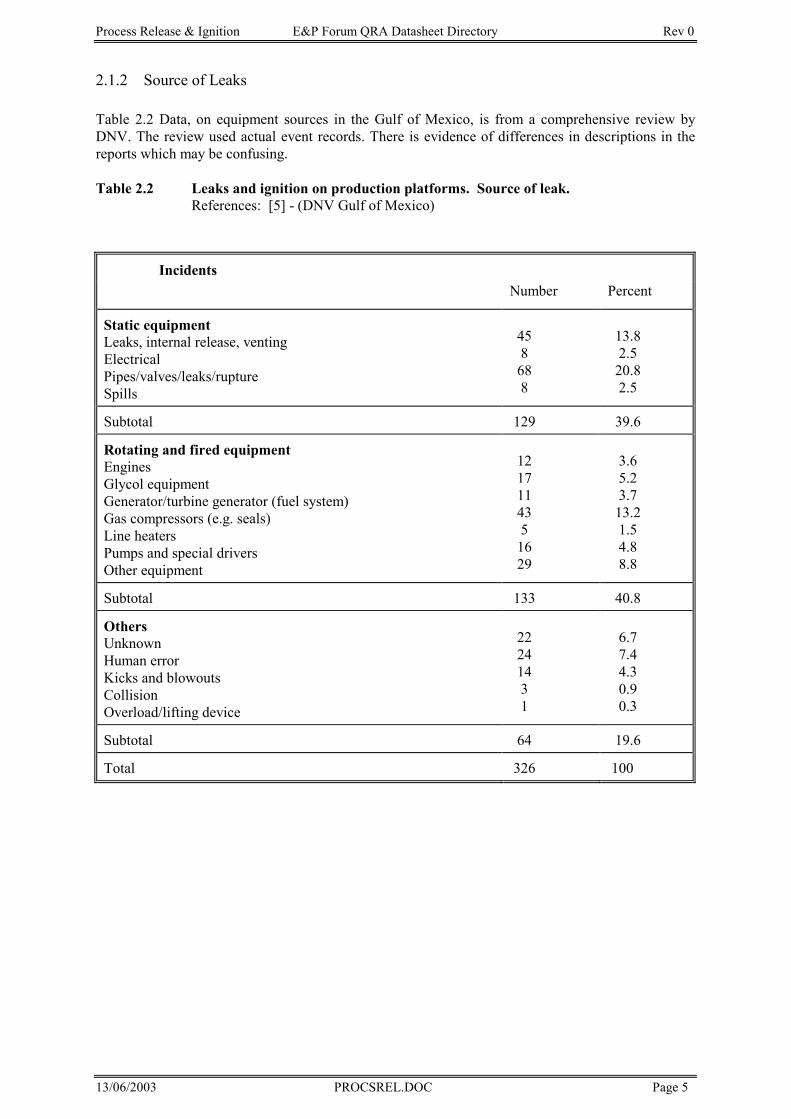
Process Release & Ignition E&P Forum QRA Datasheet Directory Rev 0
13/06/2003 PROCSREL.DOC Page 5
2.1.2 Source of Leaks Table 2.2 Data, on equipment sources in the Gulf of Mexico, is from a comprehensive review by DNV. The review used actual event records. There is evidence of differences in descriptions in the reports which may be confusing. Table 2.2 Leaks and ignition on production platforms. Source of leak.
References: [5] - (DNV Gulf of Mexico)
Incidents Number Percent
Static equipment Leaks, internal release, venting Electrical Pipes/valves/leaks/rupture Spills
45
868
8
13.8 2.520.8
2.5
Subtotal 129 39.6
Rotating and fired equipment Engines Glycol equipment Generator/turbine generator (fuel system) Gas compressors (e.g. seals) Line heaters Pumps and special drivers Other equipment
12
1711
435
16 29
3.6 5.2
3.7 13.2 1.5
4.8 8.8
Subtotal 133 40.8
Others Unknown Human error Kicks and blowouts Collision Overload/lifting device
22
2414
31
6.7 7.4
4.3 0.9
0.3
Subtotal 64 19.6
Total 326 100
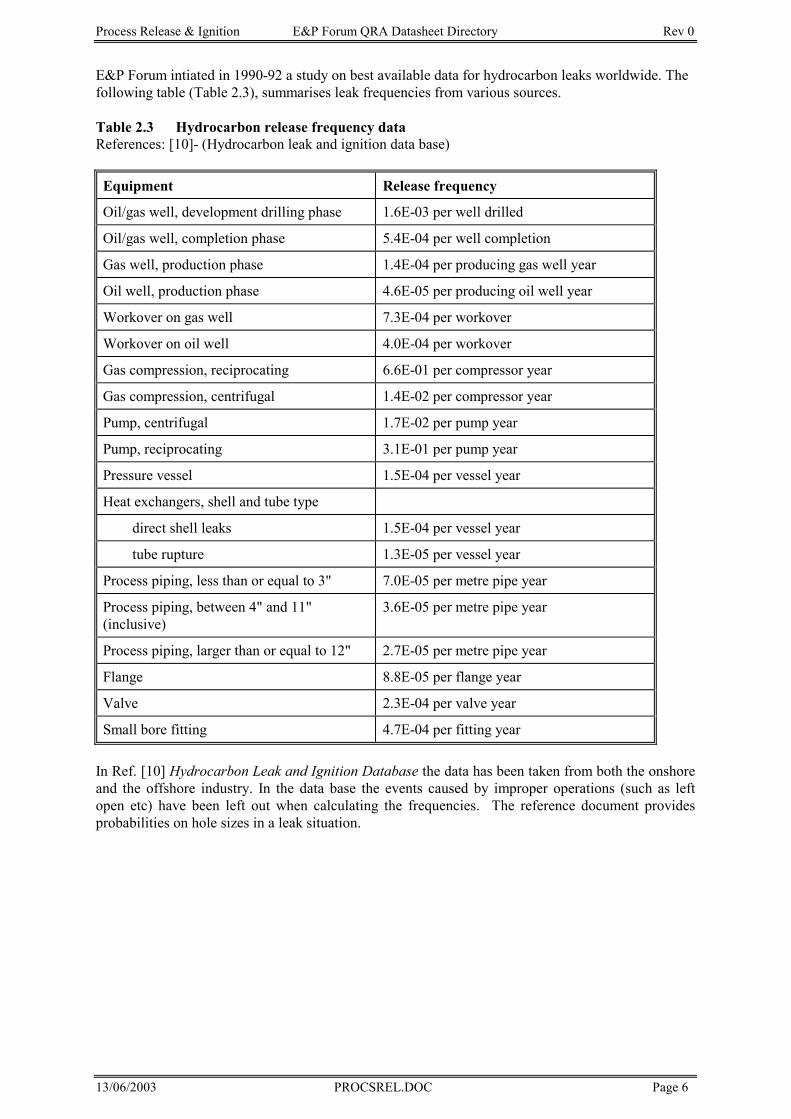
Process Release & Ignition E&P Forum QRA Datasheet Directory Rev 0
13/06/2003 PROCSREL.DOC Page 6
E&P Forum intiated in 1990-92 a study on best available data for hydrocarbon leaks worldwide. The following table (Table 2.3), summarises leak frequencies from various sources. Table 2.3 Hydrocarbon release frequency data References: [10]- (Hydrocarbon leak and ignition data base)
Equipment Release frequency
Oil/gas well, development drilling phase 1.6E-03 per well drilled
Oil/gas well, completion phase 5.4E-04 per well completion
Gas well, production phase 1.4E-04 per producing gas well year
Oil well, production phase 4.6E-05 per producing oil well year
Workover on gas well 7.3E-04 per workover
Workover on oil well 4.0E-04 per workover
Gas compression, reciprocating 6.6E-01 per compressor year
Gas compression, centrifugal 1.4E-02 per compressor year
Pump, centrifugal 1.7E-02 per pump year
Pump, reciprocating 3.1E-01 per pump year
Pressure vessel 1.5E-04 per vessel year
Heat exchangers, shell and tube type
direct shell leaks 1.5E-04 per vessel year
tube rupture 1.3E-05 per vessel year
Process piping, less than or equal to 3" 7.0E-05 per metre pipe year
Process piping, between 4" and 11" (inclusive)
3.6E-05 per metre pipe year
Process piping, larger than or equal to 12" 2.7E-05 per metre pipe year
Flange 8.8E-05 per flange year
Valve 2.3E-04 per valve year
Small bore fitting 4.7E-04 per fitting year
In Ref. [10] Hydrocarbon Leak and Ignition Database the data has been taken from both the onshore and the offshore industry. In the data base the events caused by improper operations (such as left open etc) have been left out when calculating the frequencies. The reference document provides probabilities on hole sizes in a leak situation.
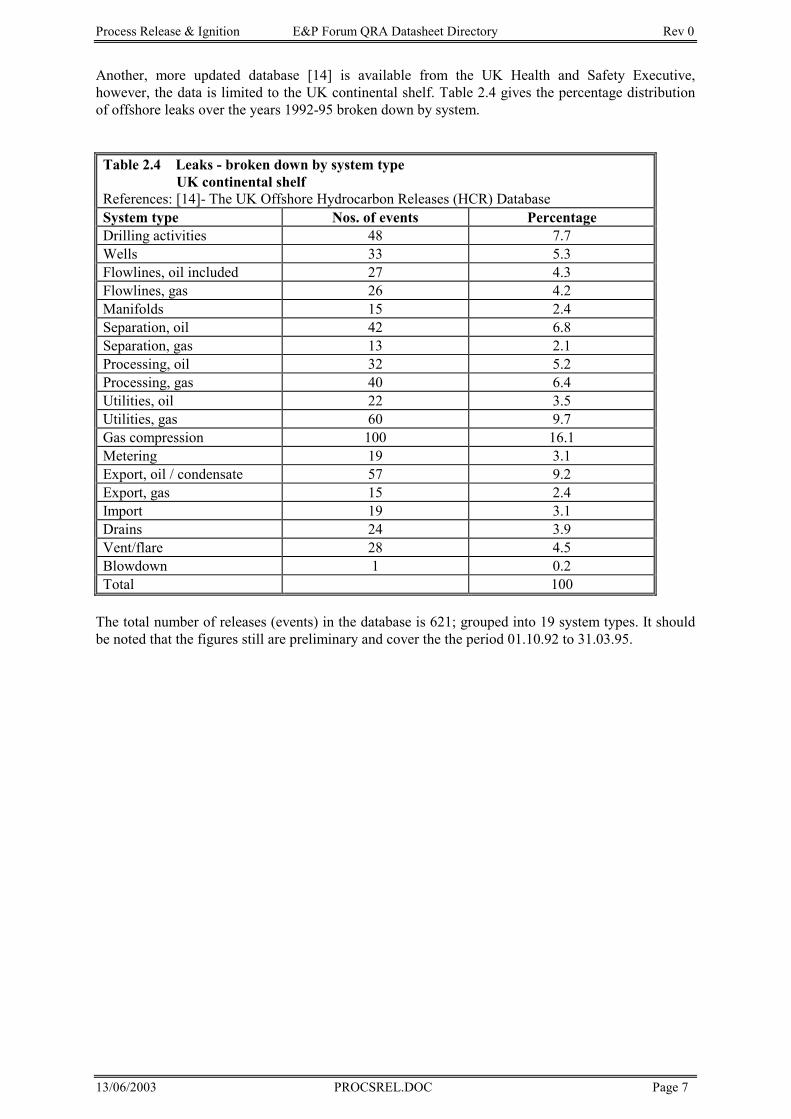
Process Release & Ignition E&P Forum QRA Datasheet Directory Rev 0
13/06/2003 PROCSREL.DOC Page 7
Another, more updated database [14] is available from the UK Health and Safety Executive, however, the data is limited to the UK continental shelf. Table 2.4 gives the percentage distribution of offshore leaks over the years 1992-95 broken down by system.
Table 2.4 Leaks - broken down by system type UK continental shelf References: [14]- The UK Offshore Hydrocarbon Releases (HCR) Database System type Nos. of events Percentage Drilling activities 48 7.7 Wells 33 5.3 Flowlines, oil included 27 4.3 Flowlines, gas 26 4.2 Manifolds 15 2.4 Separation, oil 42 6.8 Separation, gas 13 2.1 Processing, oil 32 5.2 Processing, gas 40 6.4 Utilities, oil 22 3.5 Utilities, gas 60 9.7 Gas compression 100 16.1 Metering 19 3.1 Export, oil / condensate 57 9.2 Export, gas 15 2.4 Import 19 3.1 Drains 24 3.9 Vent/flare 28 4.5 Blowdown 1 0.2 Total 100
The total number of releases (events) in the database is 621; grouped into 19 system types. It should be noted that the figures still are preliminary and cover the the period 01.10.92 to 31.03.95.
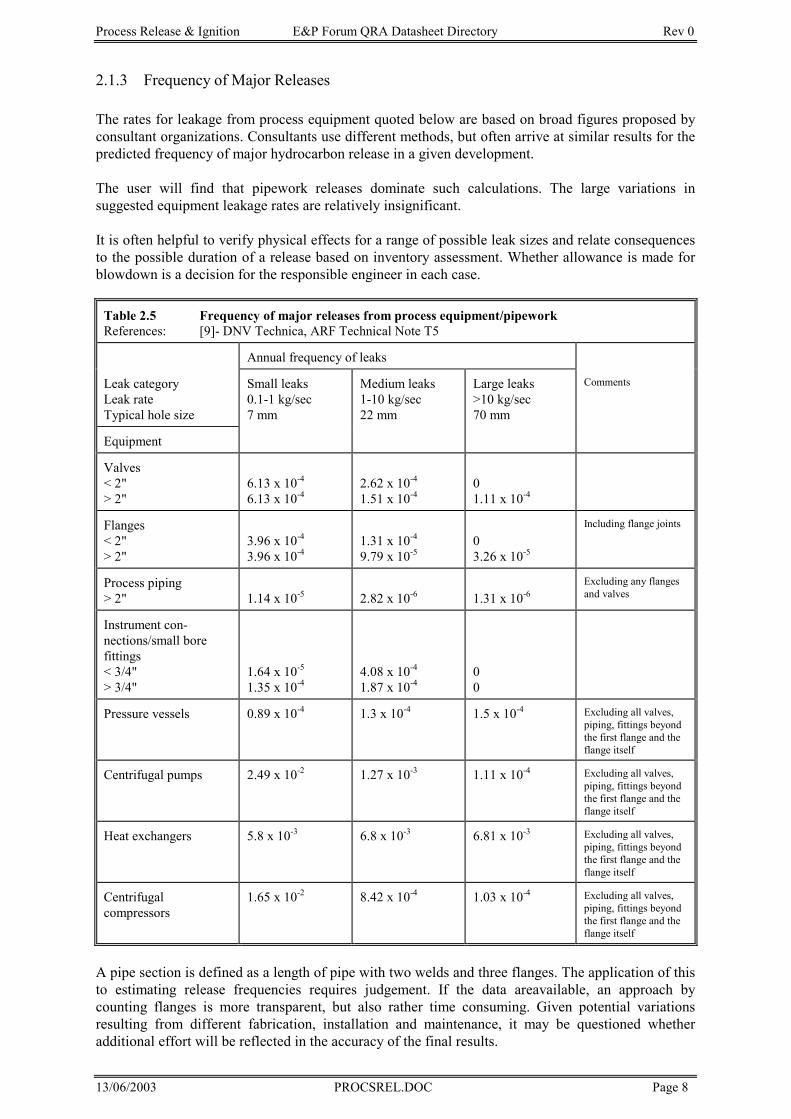
Process Release & Ignition E&P Forum QRA Datasheet Directory Rev 0
13/06/2003 PROCSREL.DOC Page 8
2.1.3 Frequency of Major Releases The rates for leakage from process equipment quoted below are based on broad figures proposed by consultant organizations. Consultants use different methods, but often arrive at similar results for the predicted frequency of major hydrocarbon release in a given development. The user will find that pipework releases dominate such calculations. The large variations in suggested equipment leakage rates are relatively insignificant. It is often helpful to verify physical effects for a range of possible leak sizes and relate consequences to the possible duration of a release based on inventory assessment. Whether allowance is made for blowdown is a decision for the responsible engineer in each case.
Table 2.5 Frequency of major releases from process equipment/pipework References: [9]- DNV Technica, ARF Technical Note T5
Annual frequency of leaks
Leak category Leak rate Typical hole size
Small leaks 0.1-1 kg/sec 7 mm
Medium leaks 1-10 kg/sec 22 mm
Large leaks >10 kg/sec 70 mm
Comments
Equipment
Valves < 2" > 2"
6.13 x 10⁻⁴
6.13 x 10⁻⁴ 2.62 x 10⁻⁴
1.51 x 10⁻⁴ 01.11 x 10⁻⁴
Flanges < 2" > 2"
3.96 x 10⁻⁴ 3.96 x 10⁻⁴
1.31 x 10⁻⁴ 9.79 x 10⁻⁵
03.26 x 10⁻⁵
Including flange joints
Process piping > 2"
1.14 x 10⁻⁵ 2.82 x 10⁻⁶ 1.31 x 10⁻⁶
Excluding any flanges and valves
Instrument con-nections/small bore fittings < 3/4" > 3/4"
1.64 x 10⁻⁵ 1.35 x 10⁻⁴
4.08 x 10⁻⁴ 1.87 x 10⁻⁴
00
Pressure vessels 0.89 x 10⁻⁴ 1.3 x 10⁻⁴ 1.5 x 10⁻⁴ Excluding all valves, piping, fittings beyond the first flange and the flange itself
Centrifugal pumps 2.49 x 10⁻² 1.27 x 10⁻³ 1.11 x 10⁻⁴ Excluding all valves, piping, fittings beyond the first flange and the flange itself
Heat exchangers 5.8 x 10⁻³ 6.8 x 10⁻³ 6.81 x 10⁻³ Excluding all valves, piping, fittings beyond the first flange and the flange itself
Centrifugal compressors
1.65 x 10⁻² 8.42 x 10⁻⁴ 1.03 x 10⁻⁴ Excluding all valves, piping, fittings beyond the first flange and the flange itself
A pipe section is defined as a length of pipe with two welds and three flanges. The application of this to estimating release frequencies requires judgement. If the data areavailable, an approach by counting flanges is more transparent, but also rather time consuming. Given potential variations resulting from different fabrication, installation and maintenance, it may be questioned whether additional effort will be reflected in the accuracy of the final results.

Process Release & Ignition E&P Forum QRA Datasheet Directory Rev 0
13/06/2003 PROCSREL.DOC Page 9
The leak sizes described as medium and large are given typical sizes of 860 mm2 (33 mm dia) and 4300 mm2 (74 mm dia) respectively. 2.2 Models for Prediction of Release and Dispersion 2.2.1 Models for Release Frequencies The release frequencies given in table 2.5 and other sources are normally based on historical failure data for a given population combined with use of expert judgement. The release frequencies from any particular type of mechanical equipment are normally regarded as constant for the time period covered by a risk analysis.
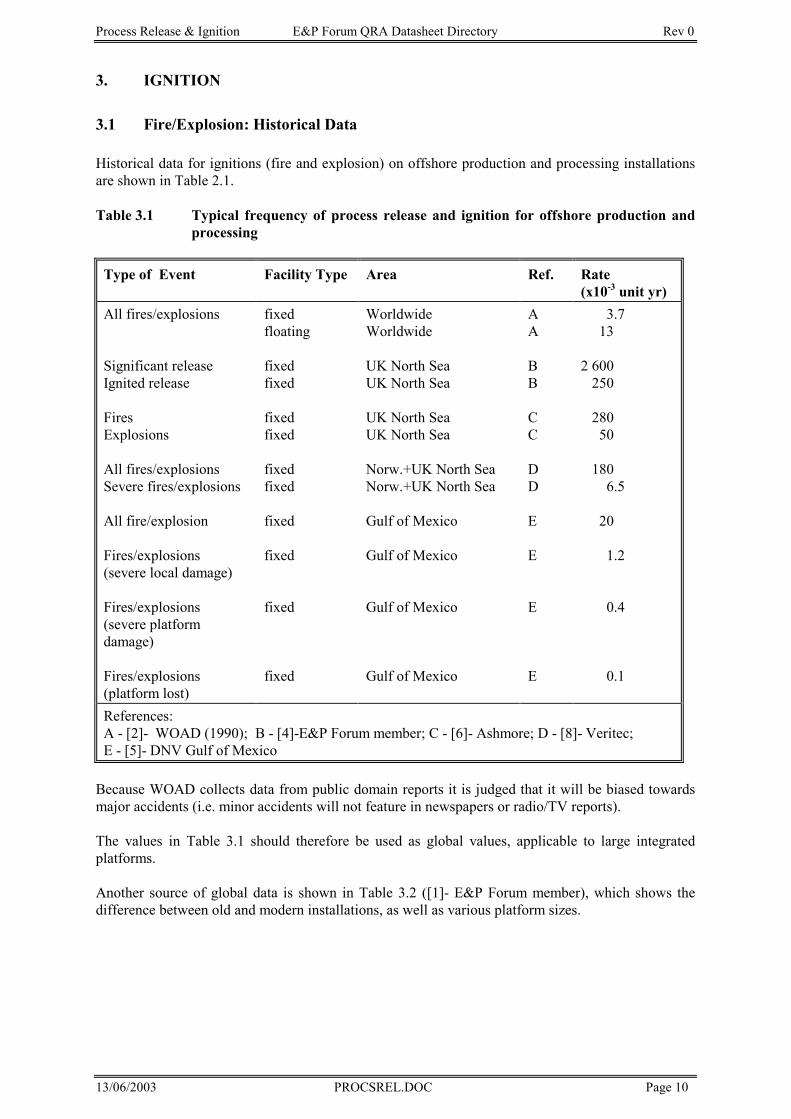
Process Release & Ignition E&P Forum QRA Datasheet Directory Rev 0
13/06/2003 PROCSREL.DOC Page 10
3. IGNITION 3.1 Fire/Explosion: Historical Data Historical data for ignitions (fire and explosion) on offshore production and processing installations are shown in Table 2.1. Table 3.1 Typical frequency of process release and ignition for offshore production and
processing
Type of Event Facility Type
Area
Ref.
Rate (x10-3 unit yr)
All fires/explosions
Significant release Ignited release Fires Explosions All fires/explosions Severe fires/explosions All fire/explosion Fires/explosions (severe local damage) Fires/explosions (severe platform damage) Fires/explosions (platform lost)
fixed floating fixed fixed fixed fixed fixed fixed fixed fixed
fixed
fixed
Worldwide Worldwide UK North Sea UK North Sea UK North Sea UK North Sea Norw.+UK North Sea Norw.+UK North Sea Gulf of Mexico Gulf of Mexico
Gulf of Mexico
Gulf of Mexico
AA
BB
CC
DD
E
E
E
E
3.7 13 2 600 250
280 50
180 6.5
20
1.2
0.4
0.1
References: A - [2]- WOAD (1990); B - [4]-E&P Forum member; C - [6]- Ashmore; D - [8]- Veritec; E - [5]- DNV Gulf of Mexico
Because WOAD collects data from public domain reports it is judged that it will be biased towards major accidents (i.e. minor accidents will not feature in newspapers or radio/TV reports). The values in Table 3.1 should therefore be used as global values, applicable to large integrated platforms. Another source of global data is shown in Table 3.2 ([1]- E&P Forum member), which shows the difference between old and modern installations, as well as various platform sizes.
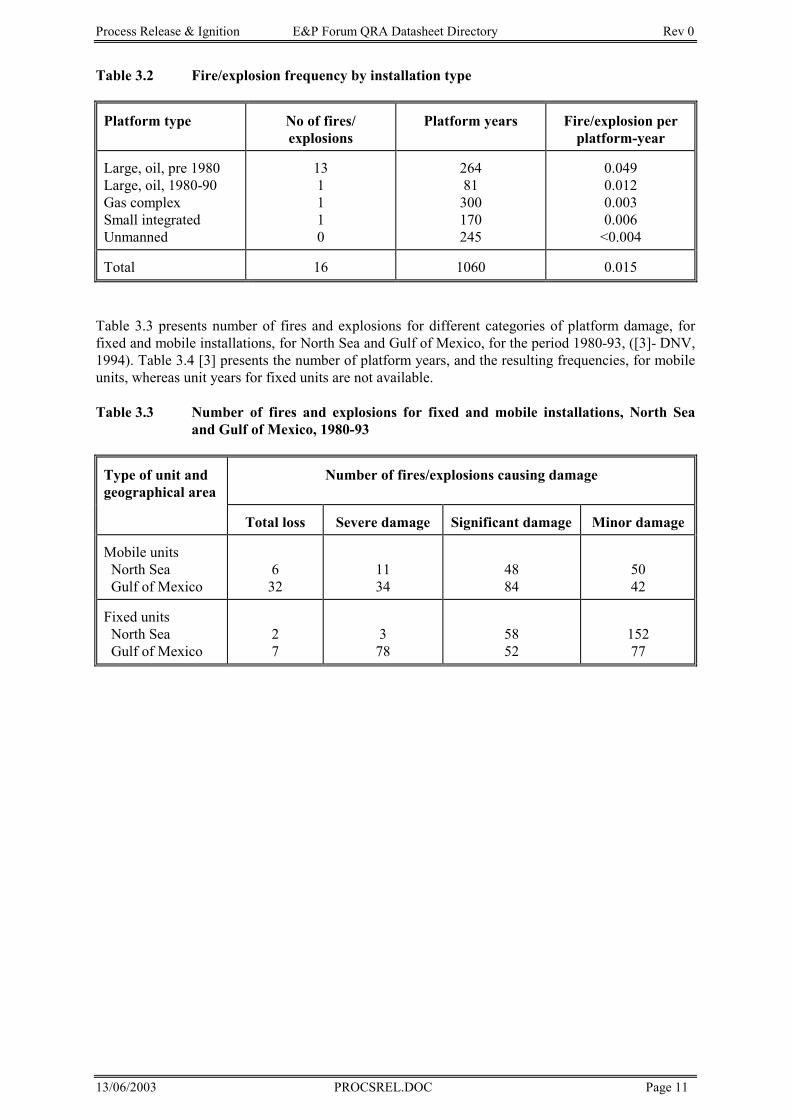
Process Release & Ignition E&P Forum QRA Datasheet Directory Rev 0
13/06/2003 PROCSREL.DOC Page 11
Table 3.2 Fire/explosion frequency by installation type
Platform type
No of fires/ explosions
Platform years
Fire/explosion per
platform-year
Large, oil, pre 1980 Large, oil, 1980-90 Gas complex Small integrated Unmanned
13 1110
264 81
300 170 245
0.049 0.012 0.003 0.006
<0.004
Total
16
1060
0.015
Table 3.3 presents number of fires and explosions for different categories of platform damage, for fixed and mobile installations, for North Sea and Gulf of Mexico, for the period 1980-93, ([3]- DNV, 1994). Table 3.4 [3] presents the number of platform years, and the resulting frequencies, for mobile units, whereas unit years for fixed units are not available. Table 3.3 Number of fires and explosions for fixed and mobile installations, North Sea
and Gulf of Mexico, 1980-93
Type of unit and geographical area
Number of fires/explosions causing damage
Total loss Severe damage
Significant damage
Minor damage
Mobile units North Sea Gulf of Mexico
632
11 34
48 84
50 42
Fixed units North Sea Gulf of Mexico
27
378
58 52
152 77
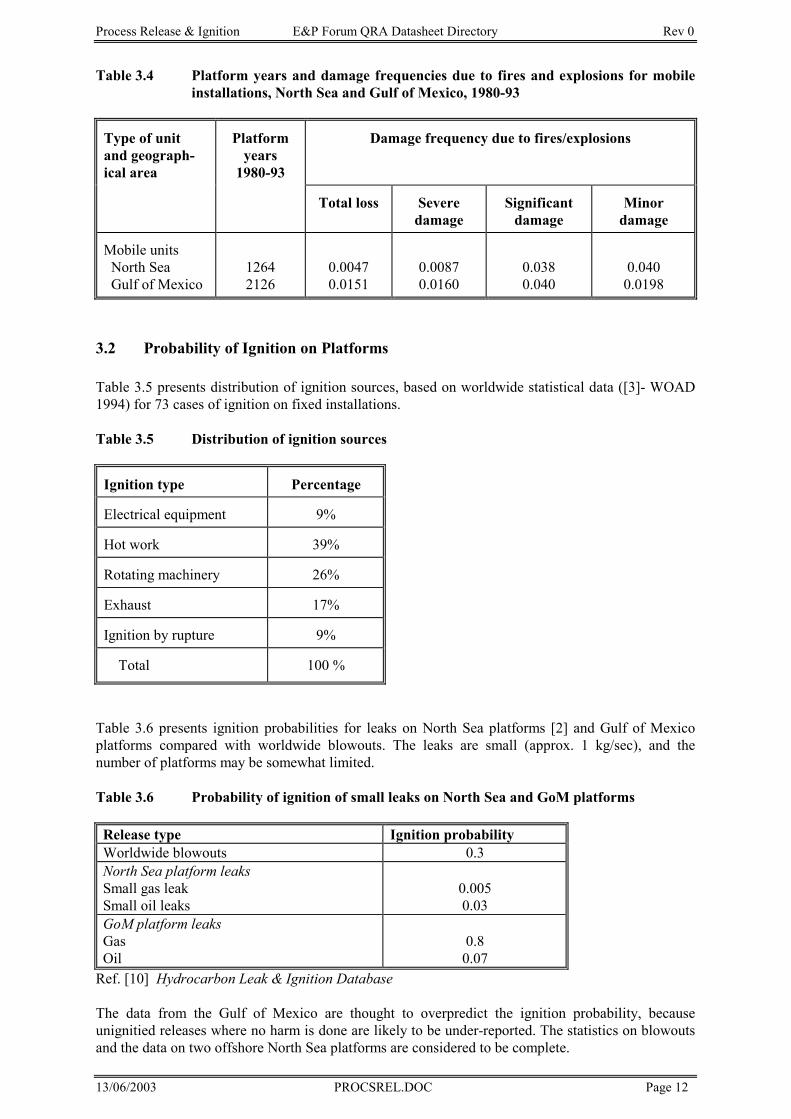
Process Release & Ignition E&P Forum QRA Datasheet Directory Rev 0
13/06/2003 PROCSREL.DOC Page 12
Table 3.4 Platform years and damage frequencies due to fires and explosions for mobile installations, North Sea and Gulf of Mexico, 1980-93
Type of unit and geograph-ical area
Platform
years 1980-93
Damage frequency due to fires/explosions
Total loss
Severe damage
Significant
damage
Minor
damage
Mobile units North Sea Gulf of Mexico
1264 2126
0.0047 0.0151
0.0087 0.0160
0.038 0.040
0.040 0.0198
3.2 Probability of Ignition on Platforms Table 3.5 presents distribution of ignition sources, based on worldwide statistical data ([3]- WOAD 1994) for 73 cases of ignition on fixed installations. Table 3.5 Distribution of ignition sources
Ignition type
Percentage
Electrical equipment
9%
Hot work
39%
Rotating machinery
26%
Exhaust
17%
Ignition by rupture
9%
Total
100 %
Table 3.6 presents ignition probabilities for leaks on North Sea platforms [2] and Gulf of Mexico platforms compared with worldwide blowouts. The leaks are small (approx. 1 kg/sec), and the number of platforms may be somewhat limited. Table 3.6 Probability of ignition of small leaks on North Sea and GoM platforms Release type Ignition probability Worldwide blowouts 0.3North Sea platform leaks Small gas leak Small oil leaks
0.005 0.03
GoM platform leaks Gas Oil
0.8 0.07
Ref. [10] Hydrocarbon Leak & Ignition Database
The data from the Gulf of Mexico are thought to overpredict the ignition probability, because unignitied releases where no harm is done are likely to be under-reported. The statistics on blowouts and the data on two offshore North Sea platforms are considered to be complete.
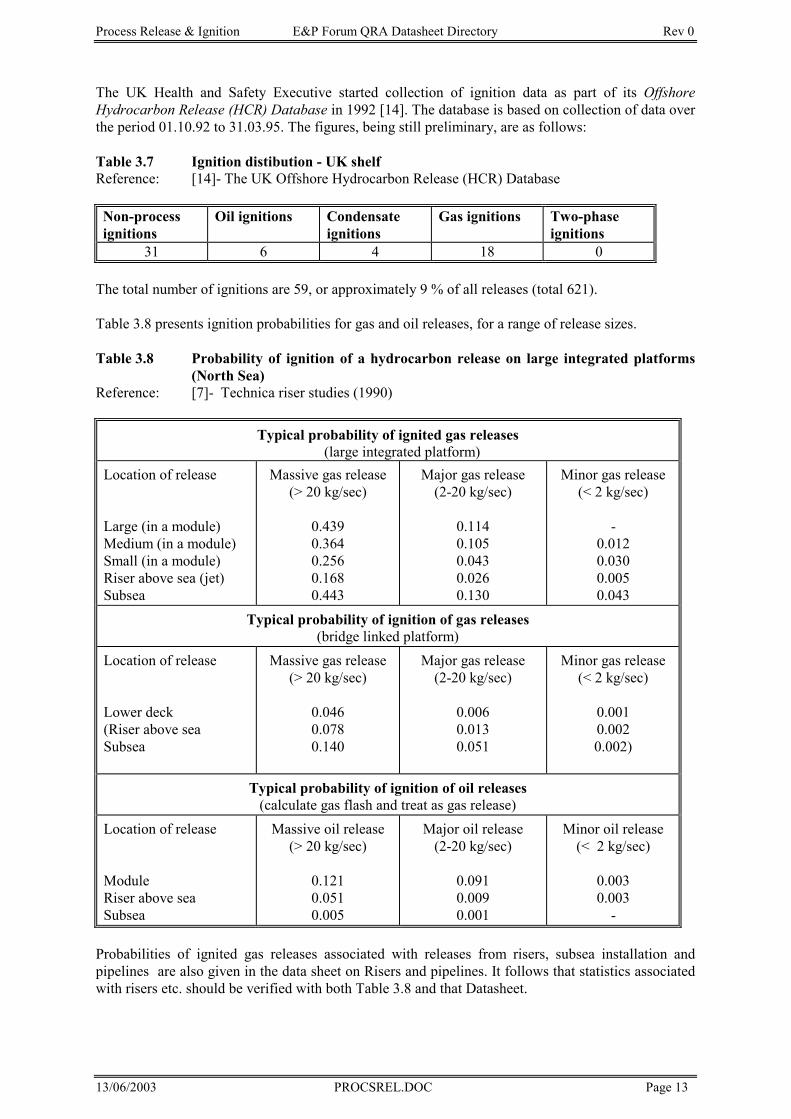
Process Release & Ignition E&P Forum QRA Datasheet Directory Rev 0
13/06/2003 PROCSREL.DOC Page 13
The UK Health and Safety Executive started collection of ignition data as part of its Offshore Hydrocarbon Release (HCR) Database in 1992 [14]. The database is based on collection of data over the period 01.10.92 to 31.03.95. The figures, being still preliminary, are as follows: Table 3.7 Ignition distibution - UK shelf Reference: [14]- The UK Offshore Hydrocarbon Release (HCR) Database Non-process ignitions
Oil ignitions Condensate ignitions
Gas ignitions Two-phase ignitions
31 6 4 18 0
The total number of ignitions are 59, or approximately 9 % of all releases (total 621).
Table 3.8 presents ignition probabilities for gas and oil releases, for a range of release sizes. Table 3.8 Probability of ignition of a hydrocarbon release on large integrated platforms
(North Sea) Reference: [7]- Technica riser studies (1990)
Typical probability of ignited gas releases (large integrated platform)
Location of release
Large (in a module) Medium (in a module) Small (in a module) Riser above sea (jet) Subsea
Massive gas release
(> 20 kg/sec)
0.439 0.364 0.256 0.168 0.443
Major gas release
(2-20 kg/sec)
0.114 0.105 0.043 0.026 0.130
Minor gas release
(< 2 kg/sec) -
0.012 0.030 0.005 0.043
Typical probability of ignition of gas releases (bridge linked platform)
Location of release
Lower deck (Riser above sea Subsea
Massive gas release (> 20 kg/sec)
0.046 0.078 0.140
Major gas release
(2-20 kg/sec)
0.006 0.013 0.051
Minor gas release
(< 2 kg/sec)
0.001 0.002 0.002)
Typical probability of ignition of oil releases (calculate gas flash and treat as gas release)
Location of release
Module Riser above sea Subsea
Massive oil release
(> 20 kg/sec)
0.121 0.051 0.005
Major oil release
(2-20 kg/sec)
0.091 0.009 0.001
Minor oil release
(< 2 kg/sec)
0.003 0.003
-
Probabilities of ignited gas releases associated with releases from risers, subsea installation and pipelines are also given in the data sheet on Risers and pipelines. It follows that statistics associated with risers etc. should be verified with both Table 3.8 and that Datasheet.
Process Release & Ignition E&P Forum QRA Datasheet Directory Rev 0
13/06/2003 PROCSREL.DOC Page 14
3.3 Models for Prediction of Fire and Explosion Consequences 3.3.1 Models for Ignition The minimum ignition energy for different flammable gases differs significantly, but for Methane, Ethane, Propane and other relevant natural gases these energies are generally low. Sparks generated from static electricity may therefore easily ignite a flammable gas cloud. Hot surfaces and open flames are other potential ignition sources. Ignition models include these and other sources and they are based on experimental data combined with expert judgement. Several computer programmes include models for ignition of flammable gases and liquids. The models are based on theoretical assessments and, only to a minor extent, empirical data. The prediction of ignition probabilities as a function of gas dispersion, reflecting the equipment and activities in the areas, is uncertain and in considerable need of more refined modelling. A Joint Industry Project carried out by DNV Technica (N), Scandpower (N), AEA Technology (UK) and COWIconsult (DK) is directed at improvement of the modelling in this field. The project is scheduled to be complete at the end of 1996. It is expected that the historical data for ignitions will improve when the E&P Forum project on HC leak and ignition data collection is further progressed. [10] [11] [12]. 3.3.2 Models for Fire and Explosions As for dispersion, there are several models for fire and explosion calculations. For fire calculations the models cover jet fires, fireballs (BLEVEs), pool fires, flash fires etc. For explosion calculations, there are also several models depending on physical or chemical energy sources, and for gas explosions (deflagration, detonation). There are several computer programmes that can calculate fire and explosion phenomena based on the above mentioned types. The models used by the programmes include simple models of the release phenomena, to detailed state of the art Computational Fluid Dynamics (CFD) calculations. 3.3.3 Models for Release Consequence Analysis When modelling accidental releases the most critical step is to estimate the amount released per second and the dependence of the release rate with time. The nature of the release will depend on the state of the material within the containment; gaseous, 2-phase, liquid, a boiling liquid or sub-cooled liquid. The dispersion of jet releases, plume releases, area sources and instantaneous releases are calculated using models specific to the mode of release and the density of the gas. Models of evaporation from a pool on the ground or spill on water are also available. The released substance can either be flammable or toxic or both. Reference [13], (pages 431-439) gives further explanation of parameters which affect dispersion. There are several computer codes that can calculate dispersion based on the above mentioned release types. The models used by the computer codes include simple to detailed models of the release phenomena, and state of the art CFD calculation.
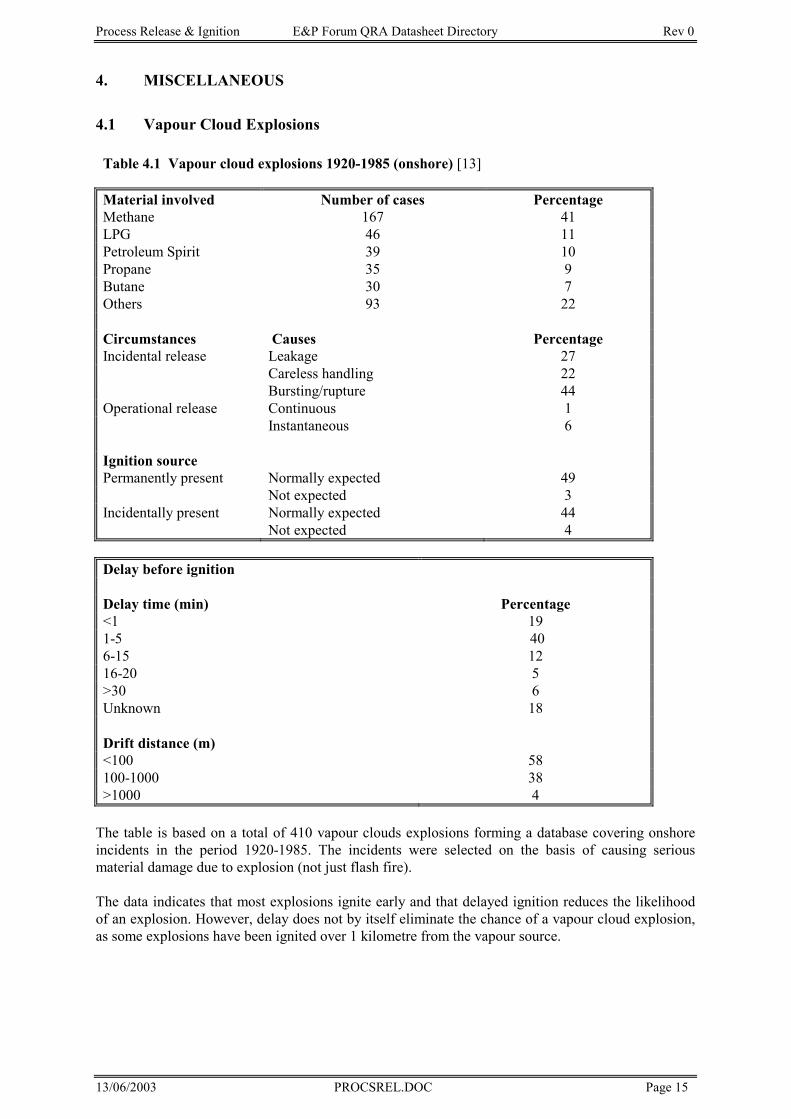
Process Release & Ignition E&P Forum QRA Datasheet Directory Rev 0
13/06/2003 PROCSREL.DOC Page 15
4. MISCELLANEOUS 4.1 Vapour Cloud Explosions Table 4.1 Vapour cloud explosions 1920-1985 (onshore) [13]
Material involved Number of cases Percentage Methane 167 41 LPG 46 11 Petroleum Spirit 39 10 Propane 35 9 Butane 30 7 Others 93 22
Circumstances Causes Percentage Incidental release Leakage 27
Careless handling 22 Bursting/rupture 44
Operational release Continuous 1 Instantaneous 6
Ignition source Permanently present Normally expected 49
Not expected 3 Incidentally present Normally expected 44
Not expected 4
Delay before ignition
Delay time (min) Percentage <1 191-5 406-15 12 16-20 5 >30 6 Unknown 18
Drift distance (m) <100 58 100-1000 38 >1000 4
The table is based on a total of 410 vapour clouds explosions forming a database covering onshore incidents in the period 1920-1985. The incidents were selected on the basis of causing serious material damage due to explosion (not just flash fire). The data indicates that most explosions ignite early and that delayed ignition reduces the likelihood of an explosion. However, delay does not by itself eliminate the chance of a vapour cloud explosion, as some explosions have been ignited over 1 kilometre from the vapour source.
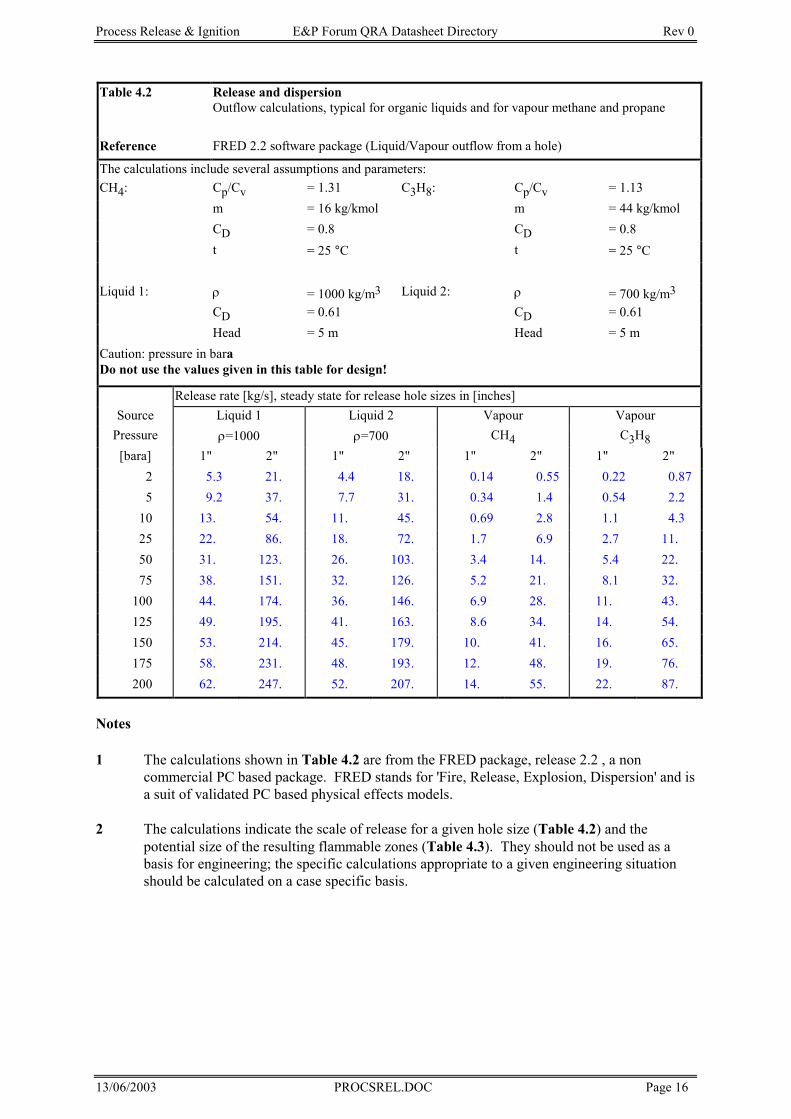
Process Release & Ignition E&P Forum QRA Datasheet Directory Rev 0
13/06/2003 PROCSREL.DOC Page 16
Table 4.2 Release and dispersion Outflow calculations, typical for organic liquids and for vapour methane and propane
Reference FRED 2.2 software package (Liquid/Vapour outflow from a hole)
The calculations include several assumptions and parameters: CH4: Cp/Cv = 1.31 C3H8: Cp/Cv = 1.13
m = 16 kg/kmol m = 44 kg/kmol CD = 0.8 CD = 0.8 t = 25 °C t = 25 °C
Liquid 1: ρ = 1000 kg/m3 Liquid 2: ρ = 700 kg/m3
CD = 0.61 CD = 0.61 Head = 5 m Head = 5 m
Caution: pressure in baraDo not use the values given in this table for design!
Release rate [kg/s], steady state for release hole sizes in [inches] Source Liquid 1 Liquid 2 Vapour Vapour
Pressure ρ=1000 ρ=700 CH4 C3H8[bara] 1" 2" 1" 2" 1" 2" 1" 2"
2 5.3 21. 4.4 18. 0.14 0.55 0.22 0.87 5 9.2 37. 7.7 31. 0.34 1.4 0.54 2.2
10 13. 54. 11. 45. 0.69 2.8 1.1 4.3 25 22. 86. 18. 72. 1.7 6.9 2.7 11. 50 31. 123. 26. 103. 3.4 14. 5.4 22. 75 38. 151. 32. 126. 5.2 21. 8.1 32.
100 44. 174. 36. 146. 6.9 28. 11. 43. 125 49. 195. 41. 163. 8.6 34. 14. 54. 150 53. 214. 45. 179. 10. 41. 16. 65. 175 58. 231. 48. 193. 12. 48. 19. 76. 200 62. 247. 52. 207. 14. 55. 22. 87.
Notes 1 The calculations shown in Table 4.2 are from the FRED package, release 2.2 , a non
commercial PC based package. FRED stands for 'Fire, Release, Explosion, Dispersion' and is a suit of validated PC based physical effects models.
2 The calculations indicate the scale of release for a given hole size (Table 4.2) and the
potential size of the resulting flammable zones (Table 4.3). They should not be used as a basis for engineering; the specific calculations appropriate to a given engineering situation should be calculated on a case specific basis.
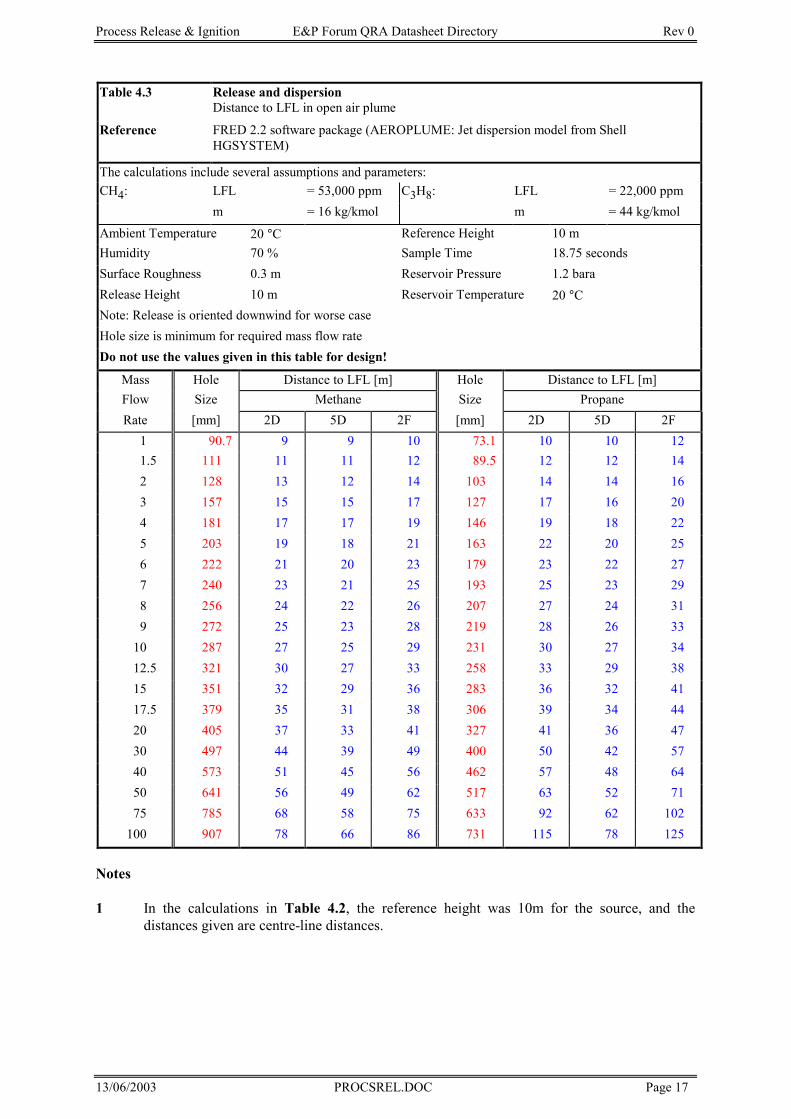
Process Release & Ignition E&P Forum QRA Datasheet Directory Rev 0
13/06/2003 PROCSREL.DOC Page 17
Table 4.3 Release and dispersion Distance to LFL in open air plume
Reference FRED 2.2 software package (AEROPLUME: Jet dispersion model from Shell HGSYSTEM)
The calculations include several assumptions and parameters: CH4: LFL = 53,000 ppm C3H8: LFL = 22,000 ppm
m = 16 kg/kmol m = 44 kg/kmol
Ambient Temperature 20 °C Reference Height 10 m Humidity 70 % Sample Time 18.75 seconds Surface Roughness 0.3 m Reservoir Pressure 1.2 bara Release Height 10 m Reservoir Temperature 20 °CNote: Release is oriented downwind for worse case Hole size is minimum for required mass flow rate Do not use the values given in this table for design!
Mass Hole Distance to LFL [m] Hole Distance to LFL [m] Flow Size Methane Size Propane Rate [mm] 2D 5D 2F [mm] 2D 5D 2F
1 90.7 9 9 10 73.1 10 10 12 1.5 111 11 11 12 89.5 12 12 14 2 128 13 12 14 103 14 14 16 3 157 15 15 17 127 17 16 20 4 181 17 17 19 146 19 18 22 5 203 19 18 21 163 22 20 25 6 222 21 20 23 179 23 22 27 7 240 23 21 25 193 25 23 29 8 256 24 22 26 207 27 24 31 9 272 25 23 28 219 28 26 33
10 287 27 25 29 231 30 27 34 12.5 321 30 27 33 258 33 29 38 15 351 32 29 36 283 36 32 41 17.5 379 35 31 38 306 39 34 44 20 405 37 33 41 327 41 36 47 30 497 44 39 49 400 50 42 57 40 573 51 45 56 462 57 48 64 50 641 56 49 62 517 63 52 71 75 785 68 58 75 633 92 62 102
100 907 78 66 86 731 115 78 125
Notes 1 In the calculations in Table 4.2, the reference height was 10m for the source, and the
distances given are centre-line distances.
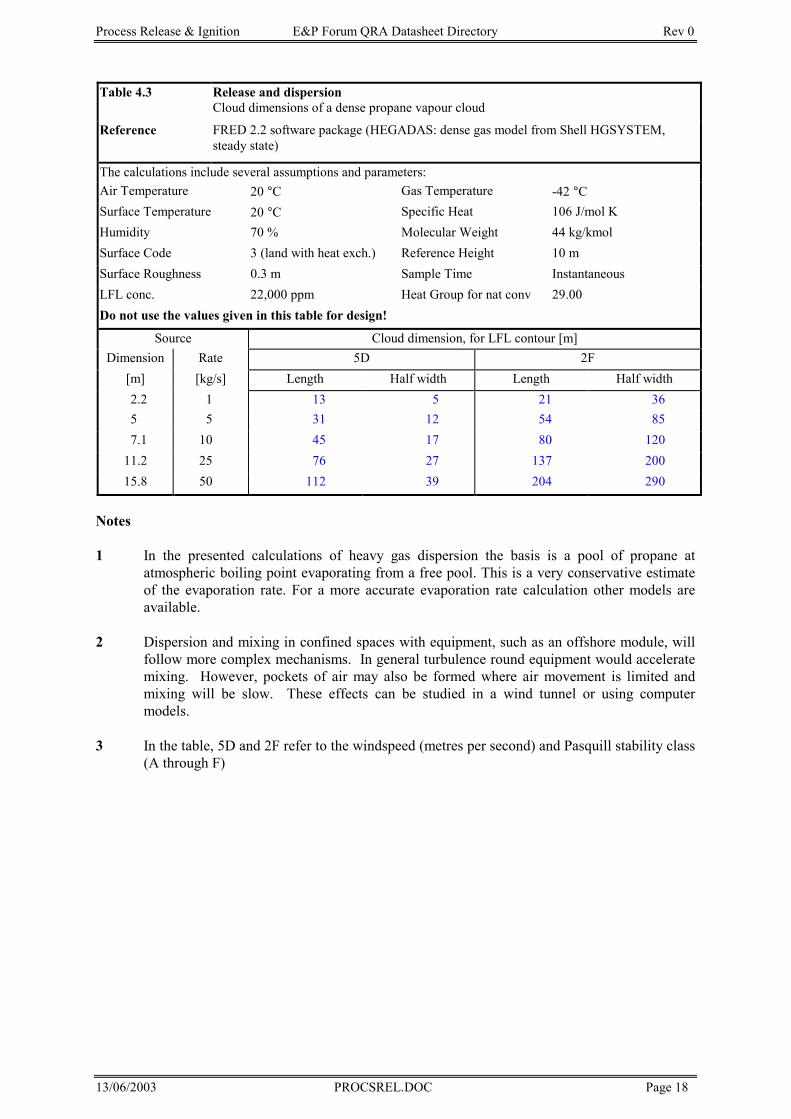
Process Release & Ignition E&P Forum QRA Datasheet Directory Rev 0
13/06/2003 PROCSREL.DOC Page 18
Table 4.3 Release and dispersion Cloud dimensions of a dense propane vapour cloud
Reference FRED 2.2 software package (HEGADAS: dense gas model from Shell HGSYSTEM, steady state)
The calculations include several assumptions and parameters: Air Temperature 20 °C Gas Temperature -42 °CSurface Temperature 20 °C Specific Heat 106 J/mol K Humidity 70 % Molecular Weight 44 kg/kmol Surface Code 3 (land with heat exch.) Reference Height 10 m Surface Roughness 0.3 m Sample Time Instantaneous LFL conc. 22,000 ppm Heat Group for nat conv 29.00 Do not use the values given in this table for design!
Source Cloud dimension, for LFL contour [m] Dimension Rate 5D 2F
[m] [kg/s] Length Half width Length Half width 2.2 1 13 5 21 36 5 5 31 12 54 85 7.1 10 45 17 80 120
11.2 25 76 27 137 200 15.8 50 112 39 204 290
Notes 1 In the presented calculations of heavy gas dispersion the basis is a pool of propane at
atmospheric boiling point evaporating from a free pool. This is a very conservative estimate of the evaporation rate. For a more accurate evaporation rate calculation other models are available.
2 Dispersion and mixing in confined spaces with equipment, such as an offshore module, will
follow more complex mechanisms. In general turbulence round equipment would accelerate mixing. However, pockets of air may also be formed where air movement is limited and mixing will be slow. These effects can be studied in a wind tunnel or using computer models.
3 In the table, 5D and 2F refer to the windspeed (metres per second) and Pasquill stability class
(A through F)
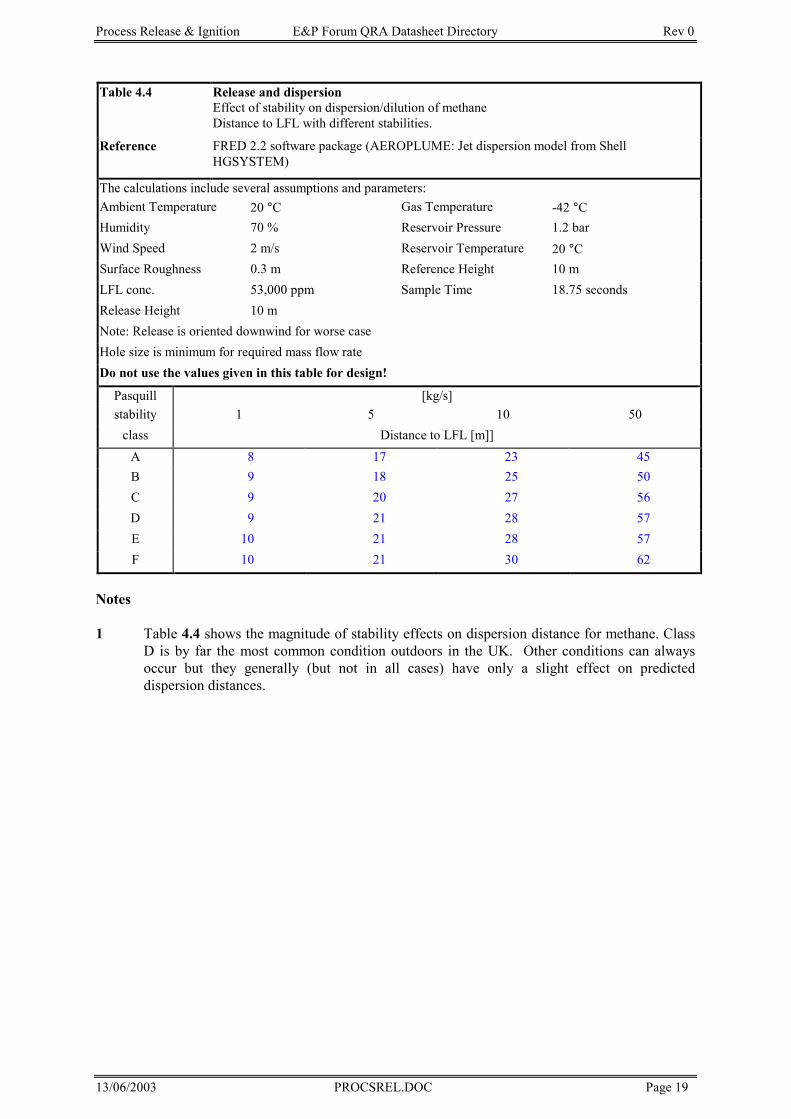
Process Release & Ignition E&P Forum QRA Datasheet Directory Rev 0
13/06/2003 PROCSREL.DOC Page 19
Table 4.4 Release and dispersion Effect of stability on dispersion/dilution of methane Distance to LFL with different stabilities.
Reference FRED 2.2 software package (AEROPLUME: Jet dispersion model from Shell HGSYSTEM)
The calculations include several assumptions and parameters: Ambient Temperature 20 °C Gas Temperature -42 °CHumidity 70 % Reservoir Pressure 1.2 bar Wind Speed 2 m/s Reservoir Temperature 20 °CSurface Roughness 0.3 m Reference Height 10 m LFL conc. 53,000 ppm Sample Time 18.75 seconds Release Height 10 m Note: Release is oriented downwind for worse case Hole size is minimum for required mass flow rate Do not use the values given in this table for design!
Pasquill [kg/s] stability 1 5 10 50
class Distance to LFL [m]]
A 8 17 23 45 B 9 18 25 50 C 9 20 27 56 D 9 21 28 57 E 10 21 28 57 F 10 21 30 62
Notes 1 Table 4.4 shows the magnitude of stability effects on dispersion distance for methane. Class
D is by far the most common condition outdoors in the UK. Other conditions can always occur but they generally (but not in all cases) have only a slight effect on predicted dispersion distances.
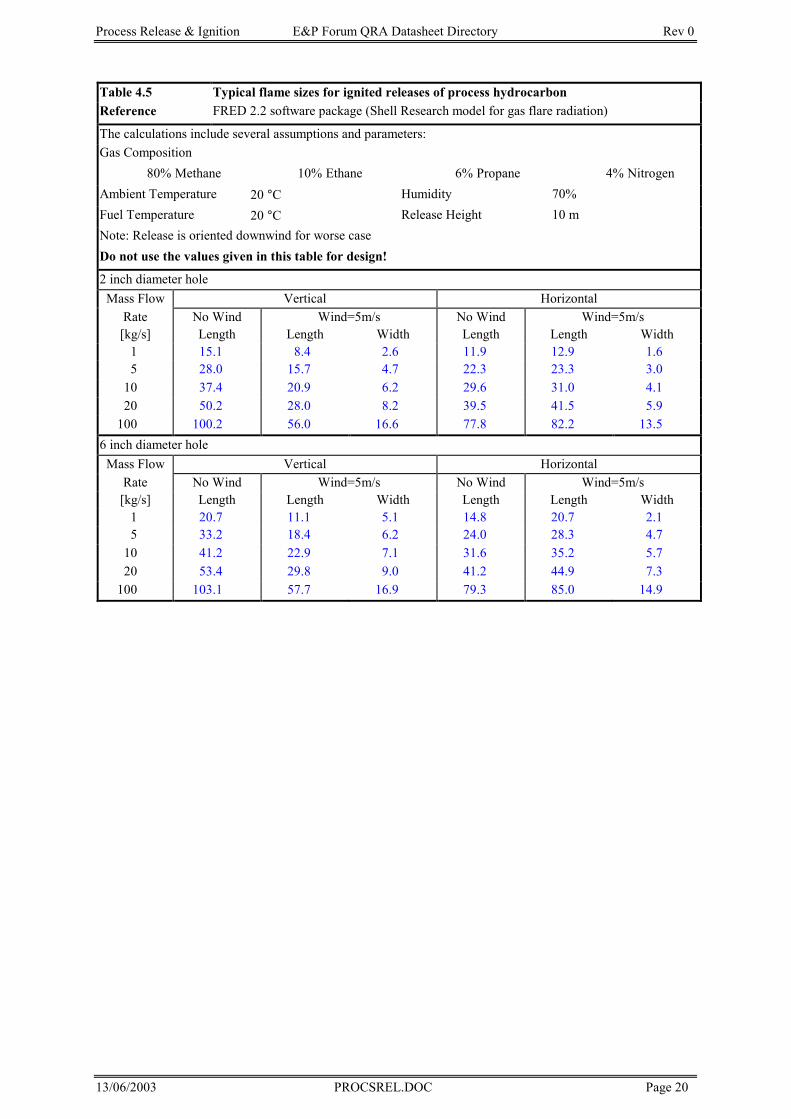
Process Release & Ignition E&P Forum QRA Datasheet Directory Rev 0
13/06/2003 PROCSREL.DOC Page 20
Table 4.5 Typical flame sizes for ignited releases of process hydrocarbon Reference FRED 2.2 software package (Shell Research model for gas flare radiation)
The calculations include several assumptions and parameters: Gas Composition
80% Methane 10% Ethane 6% Propane 4% Nitrogen Ambient Temperature 20 °C Humidity 70% Fuel Temperature 20 °C Release Height 10 m Note: Release is oriented downwind for worse case Do not use the values given in this table for design!
2 inch diameter hole Mass Flow Vertical Horizontal
Rate No Wind Wind=5m/s No Wind Wind=5m/s [kg/s] Length Length Width Length Length Width
1 15.1 8.4 2.6 11.9 12.9 1.6 5 28.0 15.7 4.7 22.3 23.3 3.0
10 37.4 20.9 6.2 29.6 31.0 4.1 20 50.2 28.0 8.2 39.5 41.5 5.9
100 100.2 56.0 16.6 77.8 82.2 13.5 6 inch diameter hole
Mass Flow Vertical Horizontal Rate No Wind Wind=5m/s No Wind Wind=5m/s [kg/s] Length Length Width Length Length Width
1 20.7 11.1 5.1 14.8 20.7 2.1 5 33.2 18.4 6.2 24.0 28.3 4.7
10 41.2 22.9 7.1 31.6 35.2 5.7 20 53.4 29.8 9.0 41.2 44.9 7.3
100 103.1 57.7 16.9 79.3 85.0 14.9
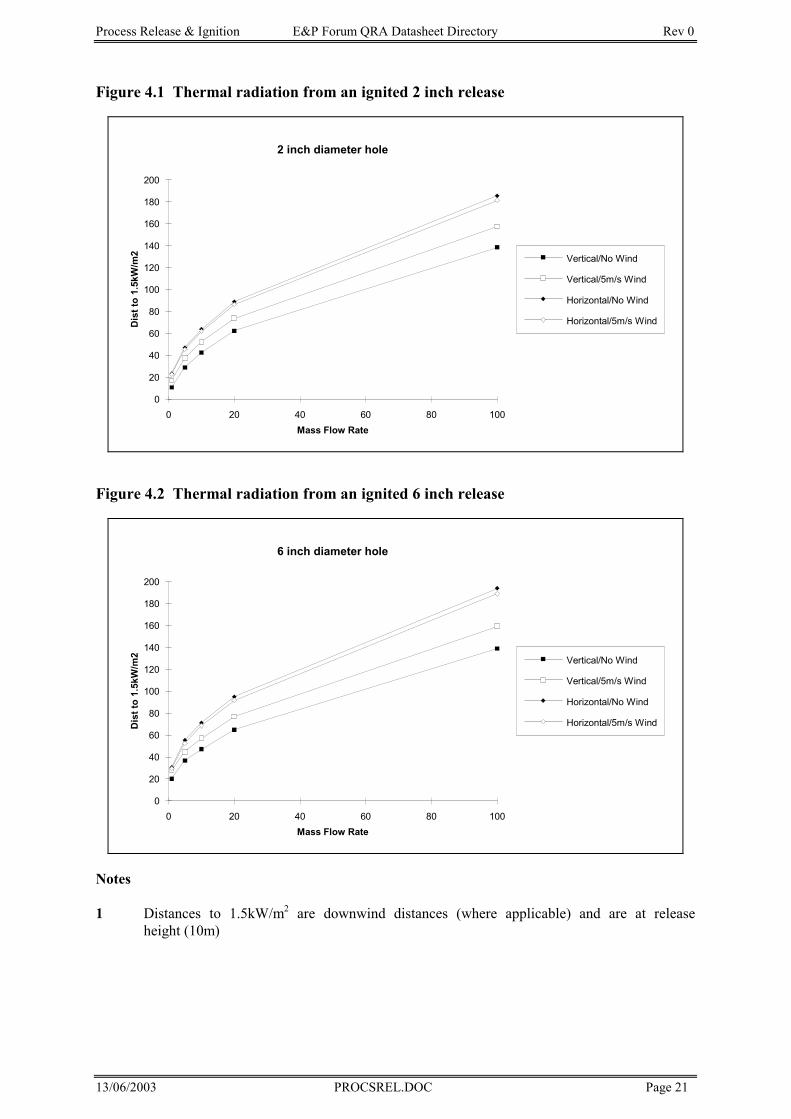
Process Release & Ignition E&P Forum QRA Datasheet Directory Rev 0
13/06/2003 PROCSREL.DOC Page 21
Figure 4.1 Thermal radiation from an ignited 2 inch release
2 inch diameter hole
Mass Flow Rate
Dis
tto
1.5k
W/m
2
0
20
40
60
80
100
120
140
160
180
200
0 20 40 60 80 100
Vertical/No Wind
Vertical/5m/s Wind
Horizontal/No Wind
Horizontal/5m/s Wind
Figure 4.2 Thermal radiation from an ignited 6 inch release
6 inch diameter hole
Mass Flow Rate
Dis
tto
1.5k
W/m
2
0
20
40
60
80
100
120
140
160
180
200
0 20 40 60 80 100
Vertical/No Wind
Vertical/5m/s Wind
Horizontal/No Wind
Horizontal/5m/s Wind
Notes 1 Distances to 1.5kW/m2 are downwind distances (where applicable) and are at release height (10m)
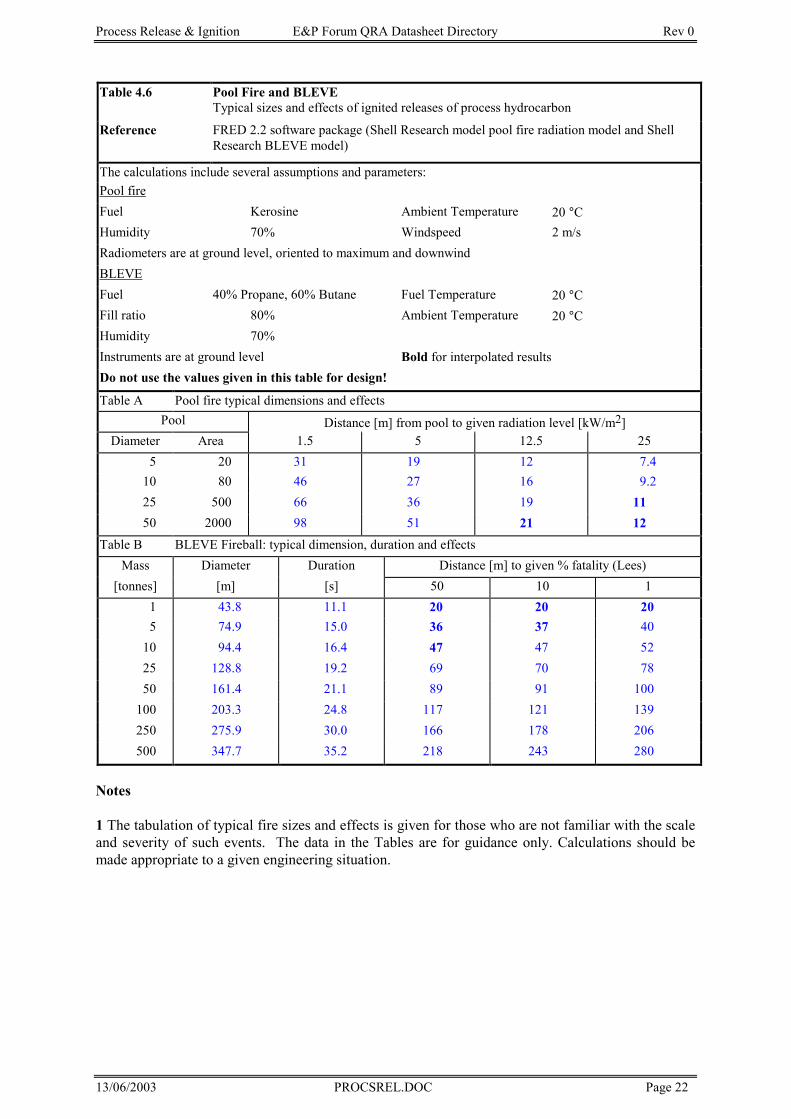
Process Release & Ignition E&P Forum QRA Datasheet Directory Rev 0
13/06/2003 PROCSREL.DOC Page 22
Table 4.6 Pool Fire and BLEVE Typical sizes and effects of ignited releases of process hydrocarbon
Reference FRED 2.2 software package (Shell Research model pool fire radiation model and Shell Research BLEVE model)
The calculations include several assumptions and parameters: Pool fireFuel Kerosine Ambient Temperature 20 °CHumidity 70% Windspeed 2 m/s Radiometers are at ground level, oriented to maximum and downwind BLEVEFuel 40% Propane, 60% Butane Fuel Temperature 20 °CFill ratio 80% Ambient Temperature 20 °CHumidity 70% Instruments are at ground level Bold for interpolated results Do not use the values given in this table for design!
Table A Pool fire typical dimensions and effects Pool Distance [m] from pool to given radiation level [kW/m2]
Diameter Area 1.5 5 12.5 25 5 20 31 19 12 7.4
10 80 46 27 16 9.2 25 500 66 36 19 11 50 2000 98 51 21 12
Table B BLEVE Fireball: typical dimension, duration and effects Mass Diameter Duration Distance [m] to given % fatality (Lees)
[tonnes] [m] [s] 50 10 1 1 43.8 11.1 20 20 20 5 74.9 15.0 36 37 40
10 94.4 16.4 47 47 52 25 128.8 19.2 69 70 78 50 161.4 21.1 89 91 100
100 203.3 24.8 117 121 139 250 275.9 30.0 166 178 206 500 347.7 35.2 218 243 280
Notes 1 The tabulation of typical fire sizes and effects is given for those who are not familiar with the scale and severity of such events. The data in the Tables are for guidance only. Calculations should be made appropriate to a given engineering situation.
Process Release & Ignition E&P Forum QRA Datasheet Directory Rev 0
13/06/2003 PROCSREL.DOC Page 23
4.2 Research There are several ongoing research and development projects within the area of release, dispersion, ignition and fires/explosions. It is expected that these projects will influence the models used, and substitute for lack of historical or relevant data; focus the attention of the industry on the need for quality historical data. Release frequencies: • E&P forum leak and ignition database • UK HSE release data for UK sector Ignition models: • Joint Industry Project: Ignition Modelling (1995-96) with DNV Industry, Scandpower, AEA
Technology and COWIconsult. Fire and Explosion modelling • Joint industry project on Blast and Fire engineering with The Steel Construction Institute. • Gas safety Programme 1993-96. CMR, Bergen. • Fire on Sea (1993-96), SINTEF/NBL.
It is expected that the historical data for release frequencies will improve when the E&P Forum project on HC (hydrocarbon) leak and ignition data collection has been established. The work was started in 1990-92 as a feasibility study whereby a database was established, and the structure and procedures for a more comprehensive database were decided as a follow-up. Ref. [10] [11] [12]. A similar database to the one being developed by E&P Forum is established by UK HSE (Health and Safety Executive). The data input are provided by all UK operators, however, HSE will only make summary reports available for the public and potential users. No intention or possibilities are at present made to integrate the HSE database with similar data from other regions/areas. A major problem with historical data on releases is associated with the leak rate and leak volume. It is acknowledged (ref. [11]) that hole sizes are one of the most difficult parameters to collect, and various methods are offered.
Process Release & Ignition E&P Forum QRA Datasheet Directory Rev 0
13/06/2003 PROCSREL.DOC Page 24
5. REFERENCES
5.1 E&P Forum member 5.2 DNV, 1990: Worldwide Offshore Accident Data, Statistical Report 1990, Det Norske Veritas 5.3 DNV, 1994: Worldwide Offshore Accident Data, (WOAD) Det Norske Veritas, 1994 5.4 E&P Forum member 5.5 Sofyanos, T., 1981: Causes and Consequences of Fires and Explosions on Offshore Platforms: Statistical Survey of Gulf of Mexico Data, DNV Rep 81-0057 5.6 Ashmore, F.S., 1989: The Design and Integrity of Deluge Systems, Proceeding of conference on Contingency Planning for the Offshore Industry, Aberdeen, January 1989 5.7 Technica (UK), 1990: Riser Safety Evaluation Routine, Report issued by an E&P Forum
member, 90-1045, April, 1990 5.8 Veritec, 1988; Reassessment of Fatal Accident Frequency Rates for Troll Gas only Topsides, Report 88-3101 5.9 DNV Technica; ARF Technical Note T5, 1996. 5.10 Hydrocarbon Leak and Ignition Data Base
Prepared for E&P Forum by DNV Technica Project No. N658, 20. February 1992 Issued as EP report EP 92-0503. 5.11 Guidelines for HC Leak and Ignition Data Collection
Prepared for E&P Forum by DNV Technica Project No. N658, 20. February 1992 Issued as EP report EP 92-0577. 5.12 Calibration of HC Leak Frequency and Ignition Probability Data Prepared for E&P Forum by DNV Technica Project No. N658, 20. February 1992 Issued as EP report EP 92-0504. 5.13 Loss Prevention in the Process Industies F. P. Lees Butterworth, 1980, ISBN 0-408-10604-2. 5.14 The Offshore Hydrocarbon Release (HCR) Database R. A. P. Bruce (HSE Offshore Safety Division)
ICHEME Symposium Series No. 139.
Process Release & Ignition E&P Forum QRA Datasheet Directory Rev 0
13/06/2003 PROCSREL.DOC Page 25
Riser and Pipeline Leaks E&P Forum QRA Data Directory Rev 0
13/06/2003 RISER.DOC Page 1
RRIISSEERR AANNDD PPIIPPEELLIINNEESS LLEEAAKKSS
Riser and Pipeline Leaks E&P Forum QRA Data Directory Rev 0
13/06/2003 RISER.DOC Page 2
TTAABBLLEE OOFF CCOONNTTEENNTTSS
11.. SSUUMMMMAARRYY ............................................................................................................................................................................................................................3311..11 SSccooppee ................................................................................................................................................................................................................................................3311..22 AApppplliiccaattiioonn ..............................................................................................................................................................................................................................33
22.. KKEEYY DDAATTAA ............................................................................................................................................................................................................................ 3322..11 OOffffsshhoorree PPiippeelliinneess ...................................................................................................................................................................................................... 33
22..11..11 PPooppuullaattiioonn DDaattaa ............................................................................................................................................................................................3322..11..22 IInncciiddeenntt DDaattaa ....................................................................................................................................................................................................4422..11..33 FFrreeqquueennccyy EEssttiimmaatteess ............................................................................................................................................................................5522..11..44 DDiissccuussssiioonn ............................................................................................................................................................................................................88
22..22 OOnnsshhoorree PPiippeelliinneess .................................................................................................................................................................................................... 110022..33 IIggnniittiioonn PPrroobbaabbiilliittyy .............................................................................................................................................................................................. 111122..44 UUmmbbiilliiccaallss ............................................................................................................................................................................................................................ 1122
33.. OONNGGOOIINNGG RREESSEEAARRCCHH ............................................................................................................................................................................ 1133
44.. RREEFFEERREENNCCEESS ............................................................................................................................................................................................................ 1144
Riser and Pipeline Leaks E&P Forum QRA Data Directory Rev 0
13/06/2003 RISER.DOC Page 3
11.. SSUUMMMMAARRYY
11..11 SSccooppee
TThhiiss ddaattaa sshheeeett ccoovveerrss lloossss ooff ccoonnttaaiinnmmeenntt ffrroomm ppiippeelliinneess aanndd rriisseerrss.. DDaattaa aarree pprreesseenntteedd ffoorrbbootthh sstteeeell ppiippeess aanndd fflleexxiibblleess,, aanndd ddeettaaiilleedd ffoorr aa nnuummbbeerr ooff ffaaccttoorrss iinnfflluueenncciinngg tthhee ffrreeqquueennccyyooff lloossss ooff ccoonnttaaiinnmmeenntt..
OOnnllyy iinncciiddeennttss iinnvvoollvviinngg lloossss ooff ccoonnttaaiinnmmeenntt aarree iinncclluuddeedd iinn tthhiiss ddaattaa sshheeeett.. HHoowweevveerr,, RReeff..[[11]] aallssoo ccoonnttaaiinnss ddaattaa oonn rriisseerr aanndd ppiippeelliinnee iinncciiddeennttss wwhhiicchh ddiidd nnoott rreessuulltt iinn lleeaakkss,, bbuuttppoossssiibbllyy ccaauusseedd rreeppaaiirr aaccttiivviittiieess aanndd pprroodduuccttiioonn ddoowwnn ttiimmee.. HHeennccee,, aasssseessssmmeenntt ooff rriisskk ttooppeerrssoonnnneell aanndd ttoo tthhee eennvviirroonnmmeenntt iiss pprriioorriittiisseedd,, wwhhiillee rriisskk ooff lloossss ooff pprroodduuccttiioonn iiss nnoott..
EEssttiimmaatteess ooff iiggnniittiioonn pprroobbaabbiilliittiieess ooff aa rreelleeaassee ffrroomm ppiippeelliinneess aanndd rriisseerrss aarree aallssoo ggiivveenn..
AA sseeccttiioonn oonn rreelliiaabbiilliittyy ddaattaa ooff uummbbiilliiccaallss iiss aallssoo iinncclluuddeedd.. TThhiiss ccoommpprriisseess uummbbiilliiccaallss uusseeddffoorr pprroodduuccttiioonn aanndd iinnjjeeccttiioonn wweellll ccoonnttrrooll aass wweellll aass ppiippeelliinnee ssaaffeettyy vvaallvvee ccoonnttrrooll..
11..22 AApppplliiccaattiioonn
EEmmpphhaassiiss iiss ppuutt oonn ooffffsshhoorree iinnssttaallllaattiioonnss iinn tthhee NNoorrtthh SSeeaa.. HHoowweevveerr,, ddaattaa ffrroomm tthhee GGuullff ooffMMeexxiiccoo aanndd ffrroomm oonnsshhoorree ppiippeelliinneess aarree pprreesseenntteedd ffoorr rreeffeerreennccee..
TThhee ddaattaa sshheeeett ggiivveess ddeettaaiillss oonn aa nnuummbbeerr ooff ffaaccttoorrss tthhaatt ccaann iinnfflluueennccee tthhee ffaaiilluurree rraattee ffoorrppiippeelliinneess aanndd rriisseerrss.. HHoowweevveerr,, iitt sshhoouulldd bbee nnootteedd tthhaatt iinnddiivviidduuaall ppiippeelliinneess mmaayy hhaavvee vveerryyddiiffffeerreenntt pprrooppeerrttiieess,, cchhaarraacctteerriissttiiccss aanndd ffuunnccttiioonnss,, mmaannyy ooff wwhhiicchh mmaayy nnoott hhaavvee bbeeeennccoonnssiiddeerreedd ttoo tthhee rreeqquuiirreedd ddeettaaiill hheerree.. TThheerreeffoorree,, iitt iiss rreeccoommmmeennddeedd tthhaatt iinn hhaazzaarrdd aanndd rriisskkaannaallyyssiiss eeaacchh ppiippeelliinnee sshhoouulldd bbee aasssseesssseedd oonn iittss oowwnn mmeerriittss..
22.. KKEEYY DDAATTAA
22..11 OOffffsshhoorree PPiippeelliinneess
TThhee ddaattaa pprreesseenntteedd iinn tthhiiss ddaattaa sshheeeett iiss ttaakkeenn ffrroomm tthhee PPAARRLLOOCC 9922 rreeppoorrtt bbyy AAMMEE [[11]],, iiff nnoottootthheerrwwiissee ssttaatteedd.. RReeffeerreennccee [[11]] ddeessccrriibbeess aa ccoommpprreehheennssiivvee ddaattaabbaassee aannaallyyssiiss ppeerrffoorrmmeedd oonnbbeehhaallff ooff tthhee HHeeaalltthh aanndd SSaaffeettyy EExxeeccuuttiivvee ((HHSSEE)).. TThhee ssttuuddyy ccoovveerrss tthhee vvaarriioouuss sseeccttoorrss ooff tthheeNNoorrtthh SSeeaa.. IInncciiddeennttss iinncclluuddeedd aarree ssoouurrcceedd ffrroomm iinnffoorrmmaattiioonn hheelldd bbyy RReegguullaattoorryy AAuutthhoorriittiieessaanndd PPiippeelliinnee OOppeerraattoorrss.. EEaacchh iinncciiddeenntt hhaass bbeeeenn ssuubbjjeecctt ttoo tthhoorroouugghh iinnvveessttiiggaattiioonn.. AAccoorrrreellaattiioonn ooff tthhee ddaattaa aallssoo iinncclluuddeedd ffoollllooww--uupp ccllaarriiffiiccaattiioonn ooff iinncciiddeenntt ddeettaaiillss.. TThhee HHSSEErreeppoorrtt iiss ggeenneerraallllyy rreeccooggnniisseedd aass tthhee bbeesstt ssoouurrccee ooff NNoorrtthh SSeeaa ddaattaa,, aanndd ssuuppeerrsseeddeess pprreevviioouusswwoorrkk bbyy ccoonnssuullttaannttss aanndd ccoommppaanniieess ffoorr tthhiiss aarreeaa..
TThhee nnuummbbeerr ooff iinncciiddeennttss iinn [[11]] iiss 229955 wwiitthh 220011 iinnvvoollvviinngg ooppeerraattiinngg ppiippeelliinneess aanndd rriisseerrss ((iinnccll..ffiittttiinnggss)),, tthhee rreemmaaiinnddeerr ooccccuurrrriinngg dduurriinngg ccoonnssttrruuccttiioonn,, hhyyddrrootteesstt eettcc.. OOff tthhee 220011 iinncciiddeennttss,, 9944ccaauusseedd lloossss ooff ccoonnttaaiinnmmeenntt.. AAtt tthhee ddaattee ooff tthhee rreeppoorrtt ((bbyy eenndd ooff 11999911)) tthheerree wweerree 779944ppiippeelliinneess iinn tthhee NNoorrtthh SSeeaa wwiitthh aa ttoottaall lleennggtthh ooff aabboouutt 1155777700 kkmm,, rreepprreesseennttiinngg aallmmoosstt 113300000000kkmm--yyeeaarrss ooff ooppeerraattiioonn.. IInn aaddddiittiioonn,, ddaattaa oonn 990022 rriisseerrss wwiitthh aa ttoottaall ooff aapppprrooxx.. 77770000 yyeeaarrss ooffooppeerraattiioonnaall eexxppeerriieennccee iiss iinncclluuddeedd..
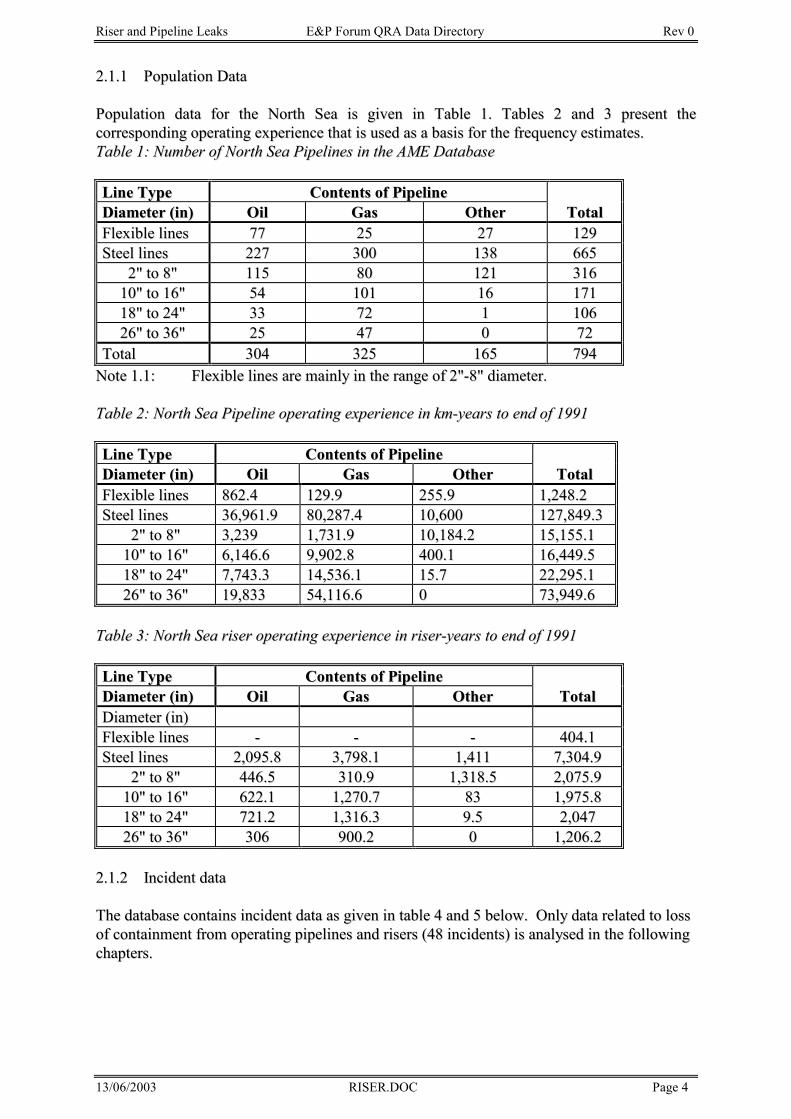
Riser and Pipeline Leaks E&P Forum QRA Data Directory Rev 0
13/06/2003 RISER.DOC Page 4
22..11..11 PPooppuullaattiioonn DDaattaa
PPooppuullaattiioonn ddaattaa ffoorr tthhee NNoorrtthh SSeeaa iiss ggiivveenn iinn TTaabbllee 11.. TTaabblleess 22 aanndd 33 pprreesseenntt tthheeccoorrrreessppoonnddiinngg ooppeerraattiinngg eexxppeerriieennccee tthhaatt iiss uusseedd aass aa bbaassiiss ffoorr tthhee ffrreeqquueennccyy eessttiimmaatteess..TTaabbllee 11:: NNuummbbeerr ooff NNoorrtthh SSeeaa PPiippeelliinneess iinn tthhee AAMMEE DDaattaabbaassee
LLiinnee TTyyppee CCoonntteennttss ooff PPiippeelliinneeDDiiaammeetteerr ((iinn)) OOiill GGaass OOtthheerr TToottaallFFlleexxiibbllee lliinneess 7777 2255 2277 112299SStteeeell lliinneess 222277 330000 113388 666655
22"" ttoo 88"" 111155 8800 112211 3311661100"" ttoo 1166"" 5544 110011 1166 1177111188"" ttoo 2244"" 3333 7722 11 1100662266"" ttoo 3366"" 2255 4477 00 7722
TToottaall 330044 332255 116655 779944NNoottee 11..11:: FFlleexxiibbllee lliinneess aarree mmaaiinnllyy iinn tthhee rraannggee ooff 22""--88"" ddiiaammeetteerr..
TTaabbllee 22:: NNoorrtthh SSeeaa PPiippeelliinnee ooppeerraattiinngg eexxppeerriieennccee iinn kkmm--yyeeaarrss ttoo eenndd ooff 11999911
LLiinnee TTyyppee CCoonntteennttss ooff PPiippeelliinneeDDiiaammeetteerr ((iinn)) OOiill GGaass OOtthheerr TToottaallFFlleexxiibbllee lliinneess 886622..44 112299..99 225555..99 11,,224488..22SStteeeell lliinneess 3366,,996611..99 8800,,228877..44 1100,,660000 112277,,884499..33
22"" ttoo 88"" 33,,223399 11,,773311..99 1100,,118844..22 1155,,115555..111100"" ttoo 1166"" 66,,114466..66 99,,990022..88 440000..11 1166,,444499..551188"" ttoo 2244"" 77,,774433..33 1144,,553366..11 1155..77 2222,,229955..112266"" ttoo 3366"" 1199,,883333 5544,,111166..66 00 7733,,994499..66
TTaabbllee 33:: NNoorrtthh SSeeaa rriisseerr ooppeerraattiinngg eexxppeerriieennccee iinn rriisseerr--yyeeaarrss ttoo eenndd ooff 11999911
LLiinnee TTyyppee CCoonntteennttss ooff PPiippeelliinneeDDiiaammeetteerr ((iinn)) OOiill GGaass OOtthheerr TToottaallDDiiaammeetteerr ((iinn))FFlleexxiibbllee lliinneess -- -- -- 440044..11SStteeeell lliinneess 22,,009955..88 33,,779988..11 11,,441111 77,,330044..99
22"" ttoo 88"" 444466..55 331100..99 11,,331188..55 22,,007755..991100"" ttoo 1166"" 662222..11 11,,227700..77 8833 11,,997755..881188"" ttoo 2244"" 772211..22 11,,331166..33 99..55 22,,0044772266"" ttoo 3366"" 330066 990000..22 00 11,,220066..22
22..11..22 IInncciiddeenntt ddaattaa
TThhee ddaattaabbaassee ccoonnttaaiinnss iinncciiddeenntt ddaattaa aass ggiivveenn iinn ttaabbllee 44 aanndd 55 bbeellooww.. OOnnllyy ddaattaa rreellaatteedd ttoo lloossssooff ccoonnttaaiinnmmeenntt ffrroomm ooppeerraattiinngg ppiippeelliinneess aanndd rriisseerrss ((4488 iinncciiddeennttss)) iiss aannaallyysseedd iinn tthhee ffoolllloowwiinnggcchhaapptteerrss..
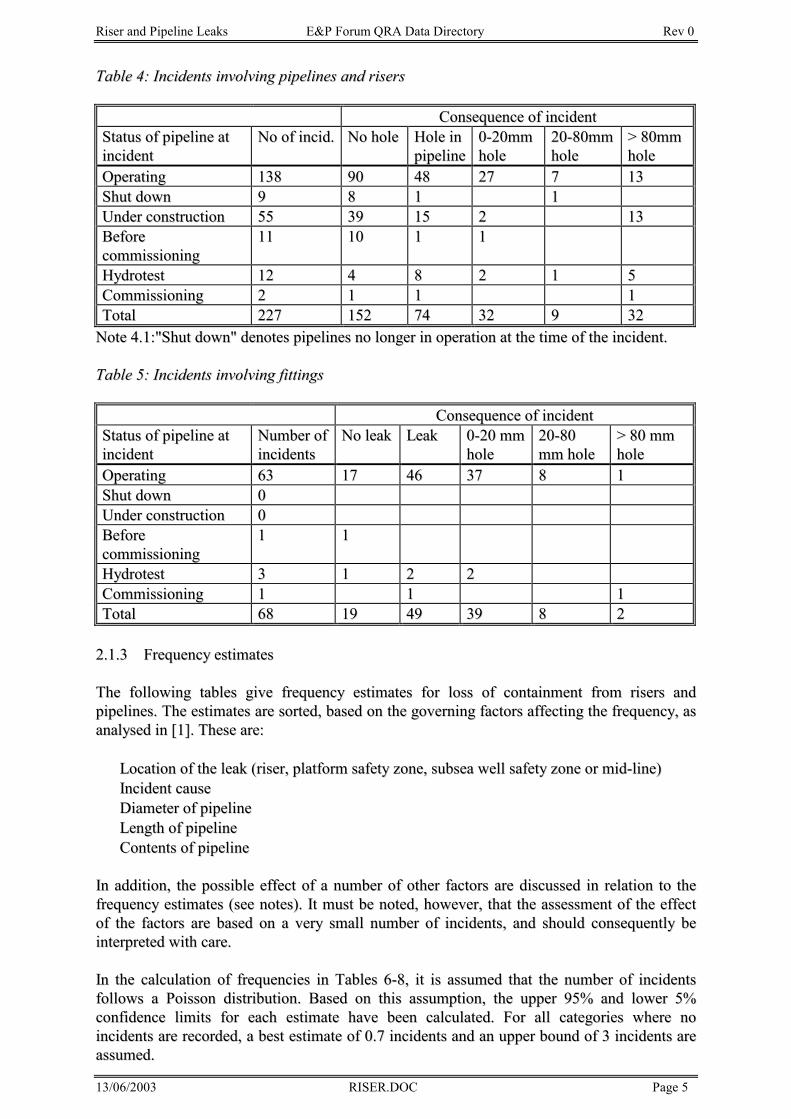
Riser and Pipeline Leaks E&P Forum QRA Data Directory Rev 0
13/06/2003 RISER.DOC Page 5
TTaabbllee 44:: IInncciiddeennttss iinnvvoollvviinngg ppiippeelliinneess aanndd rriisseerrss
CCoonnsseeqquueennccee ooff iinncciiddeennttSSttaattuuss ooff ppiippeelliinnee aattiinncciiddeenntt
NNoo ooff iinncciidd.. NNoo hhoollee HHoollee iinnppiippeelliinnee
00--2200mmmmhhoollee
2200--8800mmmmhhoollee
>> 8800mmmmhhoollee
OOppeerraattiinngg 113388 9900 4488 2277 77 1133SShhuutt ddoowwnn 99 88 11 11UUnnddeerr ccoonnssttrruuccttiioonn 5555 3399 1155 22 1133BBeeffoorreeccoommmmiissssiioonniinngg
1111 1100 11 11
HHyyddrrootteesstt 1122 44 88 22 11 55CCoommmmiissssiioonniinngg 22 11 11 11TToottaall 222277 115522 7744 3322 99 3322
NNoottee 44..11::""SShhuutt ddoowwnn"" ddeennootteess ppiippeelliinneess nnoo lloonnggeerr iinn ooppeerraattiioonn aatt tthhee ttiimmee ooff tthhee iinncciiddeenntt..
TTaabbllee 55:: IInncciiddeennttss iinnvvoollvviinngg ffiittttiinnggss
CCoonnsseeqquueennccee ooff iinncciiddeennttSSttaattuuss ooff ppiippeelliinnee aattiinncciiddeenntt
NNuummbbeerr ooffiinncciiddeennttss
NNoo lleeaakk LLeeaakk 00--2200 mmmmhhoollee
2200--8800mmmm hhoollee
>> 8800 mmmmhhoollee
OOppeerraattiinngg 6633 1177 4466 3377 88 11SShhuutt ddoowwnn 00UUnnddeerr ccoonnssttrruuccttiioonn 00BBeeffoorreeccoommmmiissssiioonniinngg
11 11
HHyyddrrootteesstt 33 11 22 22CCoommmmiissssiioonniinngg 11 11 11TToottaall 6688 1199 4499 3399 88 22
22..11..33 FFrreeqquueennccyy eessttiimmaatteess
TThhee ffoolllloowwiinngg ttaabblleess ggiivvee ffrreeqquueennccyy eessttiimmaatteess ffoorr lloossss ooff ccoonnttaaiinnmmeenntt ffrroomm rriisseerrss aannddppiippeelliinneess.. TThhee eessttiimmaatteess aarree ssoorrtteedd,, bbaasseedd oonn tthhee ggoovveerrnniinngg ffaaccttoorrss aaffffeeccttiinngg tthhee ffrreeqquueennccyy,, aassaannaallyysseedd iinn [[11]].. TThheessee aarree::
•• LLooccaattiioonn ooff tthhee lleeaakk ((rriisseerr,, ppllaattffoorrmm ssaaffeettyy zzoonnee,, ssuubbsseeaa wweellll ssaaffeettyy zzoonnee oorr mmiidd--lliinnee))•• IInncciiddeenntt ccaauussee•• DDiiaammeetteerr ooff ppiippeelliinnee•• LLeennggtthh ooff ppiippeelliinnee•• CCoonntteennttss ooff ppiippeelliinnee
IInn aaddddiittiioonn,, tthhee ppoossssiibbllee eeffffeecctt ooff aa nnuummbbeerr ooff ootthheerr ffaaccttoorrss aarree ddiissccuusssseedd iinn rreellaattiioonn ttoo tthheeffrreeqquueennccyy eessttiimmaatteess ((sseeee nnootteess)).. IItt mmuusstt bbee nnootteedd,, hhoowweevveerr,, tthhaatt tthhee aasssseessssmmeenntt ooff tthhee eeffffeeccttooff tthhee ffaaccttoorrss aarree bbaasseedd oonn aa vveerryy ssmmaallll nnuummbbeerr ooff iinncciiddeennttss,, aanndd sshhoouulldd ccoonnsseeqquueennttllyy bbeeiinntteerrpprreetteedd wwiitthh ccaarree..
IInn tthhee ccaallccuullaattiioonn ooff ffrreeqquueenncciieess iinn TTaabblleess 66--88,, iitt iiss aassssuummeedd tthhaatt tthhee nnuummbbeerr ooff iinncciiddeennttssffoolllloowwss aa PPooiissssoonn ddiissttrriibbuuttiioonn.. BBaasseedd oonn tthhiiss aassssuummppttiioonn,, tthhee uuppppeerr 9955%% aanndd lloowweerr 55%%ccoonnffiiddeennccee lliimmiittss ffoorr eeaacchh eessttiimmaattee hhaavvee bbeeeenn ccaallccuullaatteedd.. FFoorr aallll ccaatteeggoorriieess wwhheerree nnooiinncciiddeennttss aarree rreeccoorrddeedd,, aa bbeesstt eessttiimmaattee ooff 00..77 iinncciiddeennttss aanndd aann uuppppeerr bboouunndd ooff 33 iinncciiddeennttss aarreeaassssuummeedd..
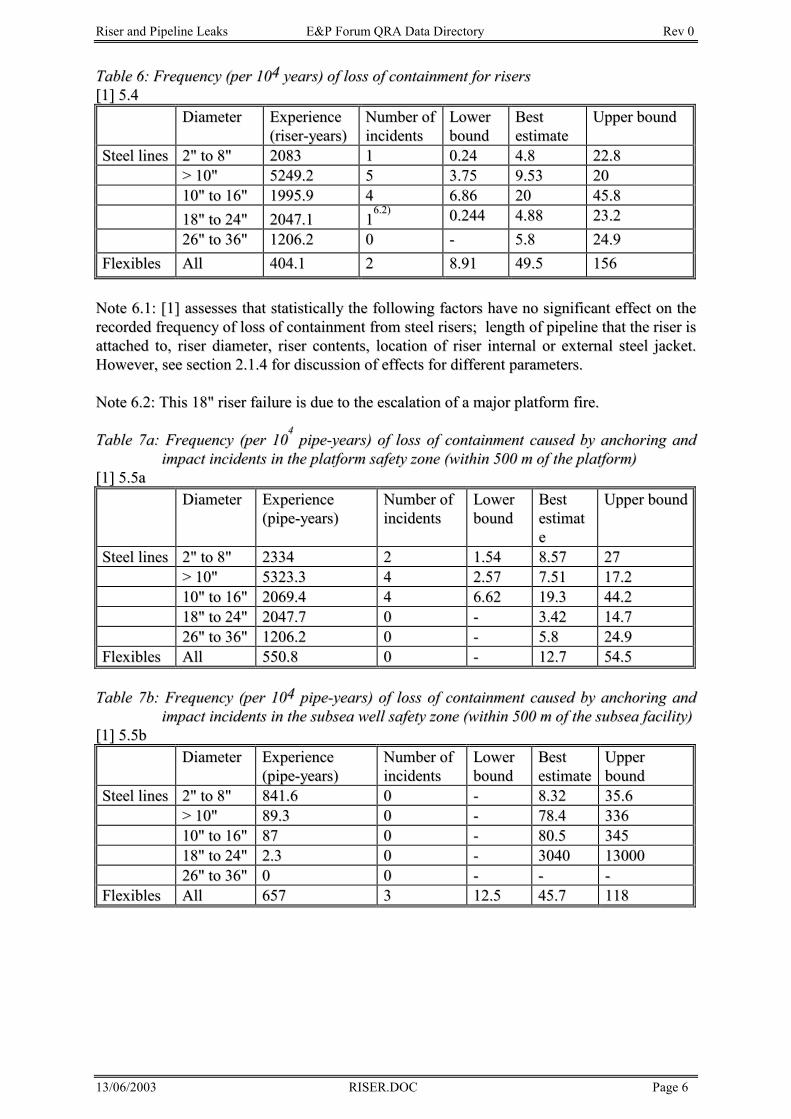
Riser and Pipeline Leaks E&P Forum QRA Data Directory Rev 0
13/06/2003 RISER.DOC Page 6
TTaabbllee 66:: FFrreeqquueennccyy ((ppeerr 110044 yyeeaarrss)) ooff lloossss ooff ccoonnttaaiinnmmeenntt ffoorr rriisseerrss[[11]] 55..44
DDiiaammeetteerr EExxppeerriieennccee((rriisseerr--yyeeaarrss))
NNuummbbeerr ooffiinncciiddeennttss
LLoowweerrbboouunndd
BBeesstteessttiimmaattee
UUppppeerr bboouunndd
SStteeeell lliinneess 22"" ttoo 88"" 22008833 11 00..2244 44..88 2222..88>> 1100"" 55224499..22 55 33..7755 99..5533 22001100"" ttoo 1166"" 11999955..99 44 66..8866 2200 4455..881188"" ttoo 2244"" 22004477..11 11
66..22)) 00..224444 44..8888 2233..222266"" ttoo 3366"" 11220066..22 00 -- 55..88 2244..99
FFlleexxiibblleess AAllll 440044..11 22 88..9911 4499..55 115566
NNoottee 66..11:: [[11]] aasssseesssseess tthhaatt ssttaattiissttiiccaallllyy tthhee ffoolllloowwiinngg ffaaccttoorrss hhaavvee nnoo ssiiggnniiffiiccaanntt eeffffeecctt oonn tthheerreeccoorrddeedd ffrreeqquueennccyy ooff lloossss ooff ccoonnttaaiinnmmeenntt ffrroomm sstteeeell rriisseerrss;; lleennggtthh ooff ppiippeelliinnee tthhaatt tthhee rriisseerr iissaattttaacchheedd ttoo,, rriisseerr ddiiaammeetteerr,, rriisseerr ccoonntteennttss,, llooccaattiioonn ooff rriisseerr iinntteerrnnaall oorr eexxtteerrnnaall sstteeeell jjaacckkeett..HHoowweevveerr,, sseeee sseeccttiioonn 22..11..44 ffoorr ddiissccuussssiioonn ooff eeffffeeccttss ffoorr ddiiffffeerreenntt ppaarraammeetteerrss..
NNoottee 66..22:: TThhiiss 1188"" rriisseerr ffaaiilluurree iiss dduuee ttoo tthhee eessccaallaattiioonn ooff aa mmaajjoorr ppllaattffoorrmm ffiirree..
TTaabbllee 77aa:: FFrreeqquueennccyy ((ppeerr 110044
ppiippee--yyeeaarrss)) ooff lloossss ooff ccoonnttaaiinnmmeenntt ccaauusseedd bbyy aanncchhoorriinngg aannddiimmppaacctt iinncciiddeennttss iinn tthhee ppllaattffoorrmm ssaaffeettyy zzoonnee ((wwiitthhiinn 550000 mm ooff tthhee ppllaattffoorrmm))
[[11]] 55..55aaDDiiaammeetteerr EExxppeerriieennccee
((ppiippee--yyeeaarrss))NNuummbbeerr ooffiinncciiddeennttss
LLoowweerrbboouunndd
BBeesstteessttiimmaattee
UUppppeerr bboouunndd
SStteeeell lliinneess 22"" ttoo 88"" 22333344 22 11..5544 88..5577 2277>> 1100"" 55332233..33 44 22..5577 77..5511 1177..221100"" ttoo 1166"" 22006699..44 44 66..6622 1199..33 4444..221188"" ttoo 2244"" 22004477..77 00 -- 33..4422 1144..772266"" ttoo 3366"" 11220066..22 00 -- 55..88 2244..99
FFlleexxiibblleess AAllll 555500..88 00 -- 1122..77 5544..55
TTaabbllee 77bb:: FFrreeqquueennccyy ((ppeerr 110044 ppiippee--yyeeaarrss)) ooff lloossss ooff ccoonnttaaiinnmmeenntt ccaauusseedd bbyy aanncchhoorriinngg aannddiimmppaacctt iinncciiddeennttss iinn tthhee ssuubbsseeaa wweellll ssaaffeettyy zzoonnee ((wwiitthhiinn 550000 mm ooff tthhee ssuubbsseeaa ffaacciilliittyy))
[[11]] 55..55bbDDiiaammeetteerr EExxppeerriieennccee
((ppiippee--yyeeaarrss))NNuummbbeerr ooffiinncciiddeennttss
LLoowweerrbboouunndd
BBeesstteessttiimmaattee
UUppppeerrbboouunndd
SStteeeell lliinneess 22"" ttoo 88"" 884411..66 00 -- 88..3322 3355..66>> 1100"" 8899..33 00 -- 7788..44 3333661100"" ttoo 1166"" 8877 00 -- 8800..55 3344551188"" ttoo 2244"" 22..33 00 -- 33004400 11330000002266"" ttoo 3366"" 00 00 -- -- --
FFlleexxiibblleess AAllll 665577 33 1122..55 4455..77 111188
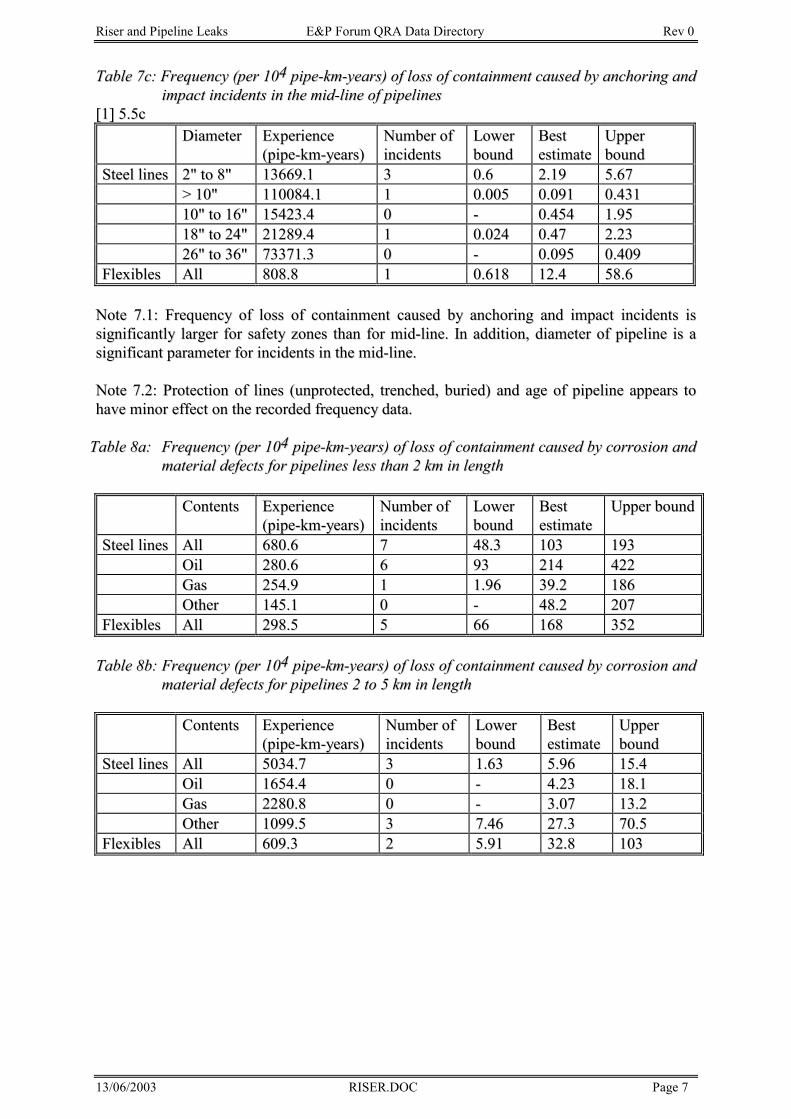
Riser and Pipeline Leaks E&P Forum QRA Data Directory Rev 0
13/06/2003 RISER.DOC Page 7
TTaabbllee 77cc:: FFrreeqquueennccyy ((ppeerr 110044 ppiippee--kkmm--yyeeaarrss)) ooff lloossss ooff ccoonnttaaiinnmmeenntt ccaauusseedd bbyy aanncchhoorriinngg aannddiimmppaacctt iinncciiddeennttss iinn tthhee mmiidd--lliinnee ooff ppiippeelliinneess
[[11]] 55..55ccDDiiaammeetteerr EExxppeerriieennccee
((ppiippee--kkmm--yyeeaarrss))NNuummbbeerr ooffiinncciiddeennttss
LLoowweerrbboouunndd
BBeesstteessttiimmaattee
UUppppeerrbboouunndd
SStteeeell lliinneess 22"" ttoo 88"" 1133666699..11 33 00..66 22..1199 55..6677>> 1100"" 111100008844..11 11 00..000055 00..009911 00..4433111100"" ttoo 1166"" 1155442233..44 00 -- 00..445544 11..99551188"" ttoo 2244"" 2211228899..44 11 00..002244 00..4477 22..22332266"" ttoo 3366"" 7733337711..33 00 -- 00..009955 00..440099
FFlleexxiibblleess AAllll 880088..88 11 00..661188 1122..44 5588..66
NNoottee 77..11:: FFrreeqquueennccyy ooff lloossss ooff ccoonnttaaiinnmmeenntt ccaauusseedd bbyy aanncchhoorriinngg aanndd iimmppaacctt iinncciiddeennttss iissssiiggnniiffiiccaannttllyy llaarrggeerr ffoorr ssaaffeettyy zzoonneess tthhaann ffoorr mmiidd--lliinnee.. IInn aaddddiittiioonn,, ddiiaammeetteerr ooff ppiippeelliinnee iiss aassiiggnniiffiiccaanntt ppaarraammeetteerr ffoorr iinncciiddeennttss iinn tthhee mmiidd--lliinnee..
NNoottee 77..22:: PPrrootteeccttiioonn ooff lliinneess ((uunnpprrootteecctteedd,, ttrreenncchheedd,, bbuurriieedd)) aanndd aaggee ooff ppiippeelliinnee aappppeeaarrss ttoohhaavvee mmiinnoorr eeffffeecctt oonn tthhee rreeccoorrddeedd ffrreeqquueennccyy ddaattaa..
TTaabbllee 88aa:: FFrreeqquueennccyy ((ppeerr 110044 ppiippee--kkmm--yyeeaarrss)) ooff lloossss ooff ccoonnttaaiinnmmeenntt ccaauusseedd bbyy ccoorrrroossiioonn aannddmmaatteerriiaall ddeeffeeccttss ffoorr ppiippeelliinneess lleessss tthhaann 22 kkmm iinn lleennggtthh
CCoonntteennttss EExxppeerriieennccee((ppiippee--kkmm--yyeeaarrss))
NNuummbbeerr ooffiinncciiddeennttss
LLoowweerrbboouunndd
BBeesstteessttiimmaattee
UUppppeerr bboouunndd
SStteeeell lliinneess AAllll 668800..66 77 4488..33 110033 119933OOiill 228800..66 66 9933 221144 442222GGaass 225544..99 11 11..9966 3399..22 118866OOtthheerr 114455..11 00 -- 4488..22 220077
FFlleexxiibblleess AAllll 229988..55 55 6666 116688 335522
TTaabbllee 88bb:: FFrreeqquueennccyy ((ppeerr 110044 ppiippee--kkmm--yyeeaarrss)) ooff lloossss ooff ccoonnttaaiinnmmeenntt ccaauusseedd bbyy ccoorrrroossiioonn aannddmmaatteerriiaall ddeeffeeccttss ffoorr ppiippeelliinneess 22 ttoo 55 kkmm iinn lleennggtthh
CCoonntteennttss EExxppeerriieennccee((ppiippee--kkmm--yyeeaarrss))
NNuummbbeerr ooffiinncciiddeennttss
LLoowweerrbboouunndd
BBeesstteessttiimmaattee
UUppppeerrbboouunndd
SStteeeell lliinneess AAllll 55003344..77 33 11..6633 55..9966 1155..44OOiill 11665544..44 00 -- 44..2233 1188..11GGaass 22228800..88 00 -- 33..0077 1133..22OOtthheerr 11009999..55 33 77..4466 2277..33 7700..55
FFlleexxiibblleess AAllll 660099..33 22 55..9911 3322..88 110033
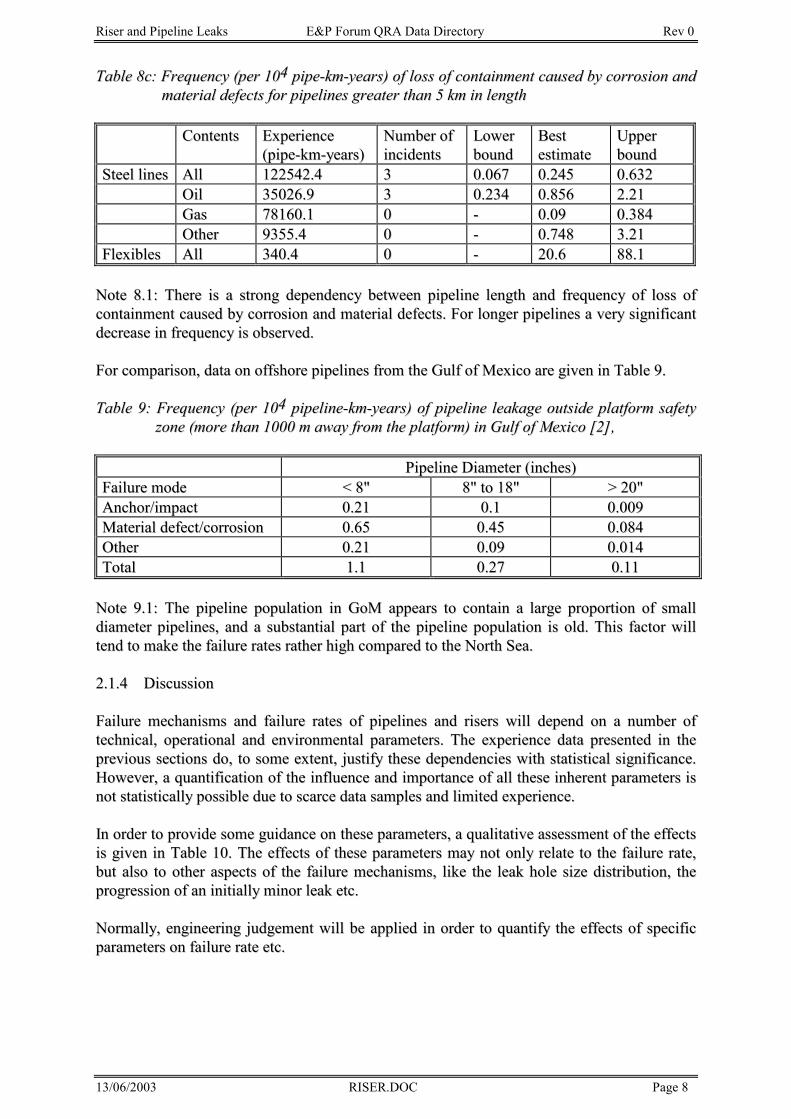
Riser and Pipeline Leaks E&P Forum QRA Data Directory Rev 0
13/06/2003 RISER.DOC Page 8
TTaabbllee 88cc:: FFrreeqquueennccyy ((ppeerr 110044 ppiippee--kkmm--yyeeaarrss)) ooff lloossss ooff ccoonnttaaiinnmmeenntt ccaauusseedd bbyy ccoorrrroossiioonn aannddmmaatteerriiaall ddeeffeeccttss ffoorr ppiippeelliinneess ggrreeaatteerr tthhaann 55 kkmm iinn lleennggtthh
CCoonntteennttss EExxppeerriieennccee((ppiippee--kkmm--yyeeaarrss))
NNuummbbeerr ooffiinncciiddeennttss
LLoowweerrbboouunndd
BBeesstteessttiimmaattee
UUppppeerrbboouunndd
SStteeeell lliinneess AAllll 112222554422..44 33 00..006677 00..224455 00..663322OOiill 3355002266..99 33 00..223344 00..885566 22..2211GGaass 7788116600..11 00 -- 00..0099 00..338844OOtthheerr 99335555..44 00 -- 00..774488 33..2211
FFlleexxiibblleess AAllll 334400..44 00 -- 2200..66 8888..11
NNoottee 88..11:: TThheerree iiss aa ssttrroonngg ddeeppeennddeennccyy bbeettwweeeenn ppiippeelliinnee lleennggtthh aanndd ffrreeqquueennccyy ooff lloossss ooffccoonnttaaiinnmmeenntt ccaauusseedd bbyy ccoorrrroossiioonn aanndd mmaatteerriiaall ddeeffeeccttss.. FFoorr lloonnggeerr ppiippeelliinneess aa vveerryy ssiiggnniiffiiccaannttddeeccrreeaassee iinn ffrreeqquueennccyy iiss oobbsseerrvveedd..
FFoorr ccoommppaarriissoonn,, ddaattaa oonn ooffffsshhoorree ppiippeelliinneess ffrroomm tthhee GGuullff ooff MMeexxiiccoo aarree ggiivveenn iinn TTaabbllee 99..
TTaabbllee 99:: FFrreeqquueennccyy ((ppeerr 110044 ppiippeelliinnee--kkmm--yyeeaarrss)) ooff ppiippeelliinnee lleeaakkaaggee oouuttssiiddee ppllaattffoorrmm ssaaffeettyyzzoonnee ((mmoorree tthhaann 11000000 mm aawwaayy ffrroomm tthhee ppllaattffoorrmm)) iinn GGuullff ooff MMeexxiiccoo [[22]],,
PPiippeelliinnee DDiiaammeetteerr ((iinncchheess))FFaaiilluurree mmooddee << 88"" 88"" ttoo 1188"" >> 2200""AAnncchhoorr//iimmppaacctt 00..2211 00..11 00..000099MMaatteerriiaall ddeeffeecctt//ccoorrrroossiioonn 00..6655 00..4455 00..008844OOtthheerr 00..2211 00..0099 00..001144TToottaall 11..11 00..2277 00..1111
NNoottee 99..11:: TThhee ppiippeelliinnee ppooppuullaattiioonn iinn GGooMM aappppeeaarrss ttoo ccoonnttaaiinn aa llaarrggee pprrooppoorrttiioonn ooff ssmmaallllddiiaammeetteerr ppiippeelliinneess,, aanndd aa ssuubbssttaannttiiaall ppaarrtt ooff tthhee ppiippeelliinnee ppooppuullaattiioonn iiss oolldd.. TThhiiss ffaaccttoorr wwiilllltteenndd ttoo mmaakkee tthhee ffaaiilluurree rraatteess rraatthheerr hhiigghh ccoommppaarreedd ttoo tthhee NNoorrtthh SSeeaa..
22..11..44 DDiissccuussssiioonn
FFaaiilluurree mmeecchhaanniissmmss aanndd ffaaiilluurree rraatteess ooff ppiippeelliinneess aanndd rriisseerrss wwiillll ddeeppeenndd oonn aa nnuummbbeerr oofftteecchhnniiccaall,, ooppeerraattiioonnaall aanndd eennvviirroonnmmeennttaall ppaarraammeetteerrss.. TThhee eexxppeerriieennccee ddaattaa pprreesseenntteedd iinn tthheepprreevviioouuss sseeccttiioonnss ddoo,, ttoo ssoommee eexxtteenntt,, jjuussttiiffyy tthheessee ddeeppeennddeenncciieess wwiitthh ssttaattiissttiiccaall ssiiggnniiffiiccaannccee..HHoowweevveerr,, aa qquuaannttiiffiiccaattiioonn ooff tthhee iinnfflluueennccee aanndd iimmppoorrttaannccee ooff aallll tthheessee iinnhheerreenntt ppaarraammeetteerrss iissnnoott ssttaattiissttiiccaallllyy ppoossssiibbllee dduuee ttoo ssccaarrccee ddaattaa ssaammpplleess aanndd lliimmiitteedd eexxppeerriieennccee..
IInn oorrddeerr ttoo pprroovviiddee ssoommee gguuiiddaannccee oonn tthheessee ppaarraammeetteerrss,, aa qquuaalliittaattiivvee aasssseessssmmeenntt ooff tthhee eeffffeeccttssiiss ggiivveenn iinn TTaabbllee 1100.. TThhee eeffffeeccttss ooff tthheessee ppaarraammeetteerrss mmaayy nnoott oonnllyy rreellaattee ttoo tthhee ffaaiilluurree rraattee,,bbuutt aallssoo ttoo ootthheerr aassppeeccttss ooff tthhee ffaaiilluurree mmeecchhaanniissmmss,, lliikkee tthhee lleeaakk hhoollee ssiizzee ddiissttrriibbuuttiioonn,, tthheepprrooggrreessssiioonn ooff aann iinniittiiaallllyy mmiinnoorr lleeaakk eettcc..
NNoorrmmaallllyy,, eennggiinneeeerriinngg jjuuddggeemmeenntt wwiillll bbee aapppplliieedd iinn oorrddeerr ttoo qquuaannttiiffyy tthhee eeffffeeccttss ooff ssppeecciiffiiccppaarraammeetteerrss oonn ffaaiilluurree rraattee eettcc..
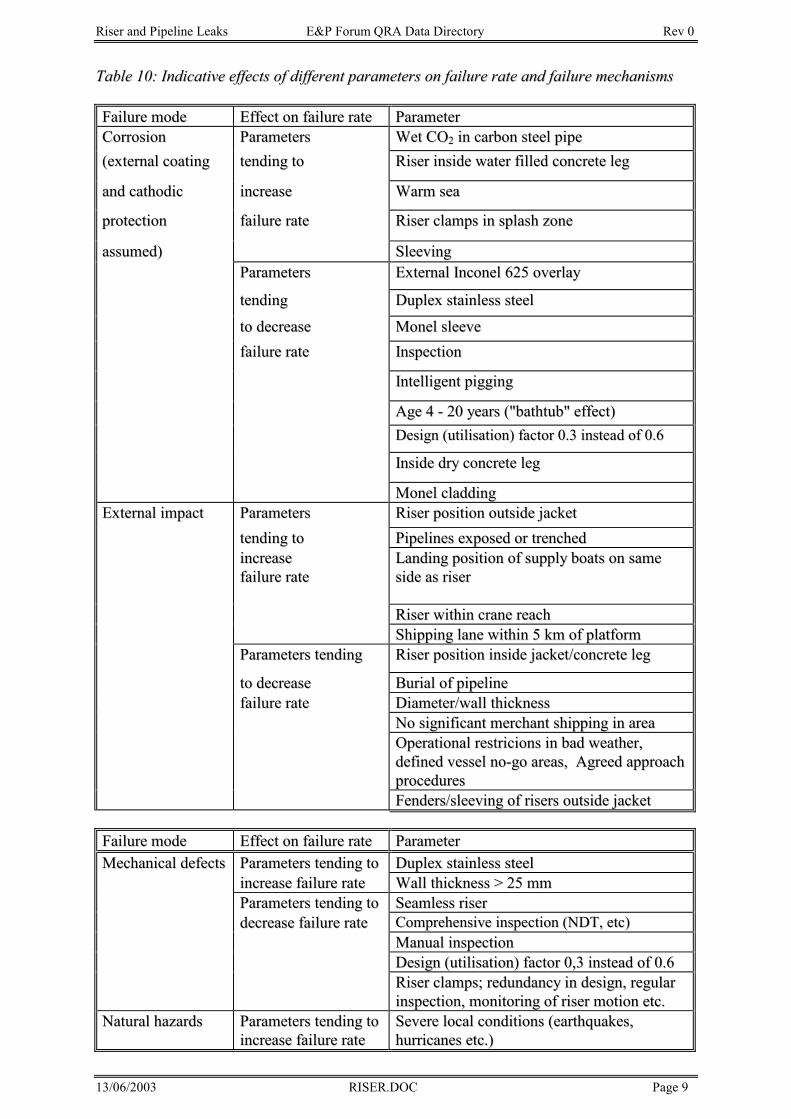
Riser and Pipeline Leaks E&P Forum QRA Data Directory Rev 0
13/06/2003 RISER.DOC Page 9
TTaabbllee 1100:: IInnddiiccaattiivvee eeffffeeccttss ooff ddiiffffeerreenntt ppaarraammeetteerrss oonn ffaaiilluurree rraattee aanndd ffaaiilluurree mmeecchhaanniissmmss
FFaaiilluurree mmooddee EEffffeecctt oonn ffaaiilluurree rraattee PPaarraammeetteerrCCoorrrroossiioonn PPaarraammeetteerrss WWeett CCOO22 iinn ccaarrbboonn sstteeeell ppiippee((eexxtteerrnnaall ccooaattiinngg tteennddiinngg ttoo RRiisseerr iinnssiiddee wwaatteerr ffiilllleedd ccoonnccrreettee lleegg
aanndd ccaatthhooddiicc iinnccrreeaassee WWaarrmm sseeaa
pprrootteeccttiioonn ffaaiilluurree rraattee RRiisseerr ccllaammppss iinn ssppllaasshh zzoonnee
aassssuummeedd)) SSlleeeevviinnggPPaarraammeetteerrss EExxtteerrnnaall IInnccoonneell 662255 oovveerrllaayy
tteennddiinngg DDuupplleexx ssttaaiinnlleessss sstteeeell
ttoo ddeeccrreeaassee MMoonneell sslleeeevveeffaaiilluurree rraattee IInnssppeeccttiioonn
IInntteelllliiggeenntt ppiiggggiinngg
AAggee 44 -- 2200 yyeeaarrss ((""bbaatthhttuubb"" eeffffeecctt))DDeessiiggnn ((uuttiilliissaattiioonn)) ffaaccttoorr 00..33 iinnsstteeaadd ooff 00..66
IInnssiiddee ddrryy ccoonnccrreettee lleegg
MMoonneell ccllaaddddiinnggEExxtteerrnnaall iimmppaacctt PPaarraammeetteerrss RRiisseerr ppoossiittiioonn oouuttssiiddee jjaacckkeett
tteennddiinngg ttoo PPiippeelliinneess eexxppoosseedd oorr ttrreenncchheeddiinnccrreeaasseeffaaiilluurree rraattee
LLaannddiinngg ppoossiittiioonn ooff ssuuppppllyy bbooaattss oonn ssaammeessiiddee aass rriisseerr
RRiisseerr wwiitthhiinn ccrraannee rreeaacchhSShhiippppiinngg llaannee wwiitthhiinn 55 kkmm ooff ppllaattffoorrmm
PPaarraammeetteerrss tteennddiinngg RRiisseerr ppoossiittiioonn iinnssiiddee jjaacckkeett//ccoonnccrreettee lleegg
ttoo ddeeccrreeaassee BBuurriiaall ooff ppiippeelliinneeffaaiilluurree rraattee DDiiaammeetteerr//wwaallll tthhiicckknneessss
NNoo ssiiggnniiffiiccaanntt mmeerrcchhaanntt sshhiippppiinngg iinn aarreeaaOOppeerraattiioonnaall rreessttrriicciioonnss iinn bbaadd wweeaatthheerr,,ddeeffiinneedd vveesssseell nnoo--ggoo aarreeaass,, AAggrreeeedd aapppprrooaacchhpprroocceedduurreessFFeennddeerrss//sslleeeevviinngg ooff rriisseerrss oouuttssiiddee jjaacckkeett
FFaaiilluurree mmooddee EEffffeecctt oonn ffaaiilluurree rraattee PPaarraammeetteerrMMeecchhaanniiccaall ddeeffeeccttss PPaarraammeetteerrss tteennddiinngg ttoo DDuupplleexx ssttaaiinnlleessss sstteeeell
iinnccrreeaassee ffaaiilluurree rraattee WWaallll tthhiicckknneessss >> 2255 mmmmPPaarraammeetteerrss tteennddiinngg ttoo SSeeaammlleessss rriisseerrddeeccrreeaassee ffaaiilluurree rraattee CCoommpprreehheennssiivvee iinnssppeeccttiioonn ((NNDDTT,, eettcc))
MMaannuuaall iinnssppeeccttiioonnDDeessiiggnn ((uuttiilliissaattiioonn)) ffaaccttoorr 00,,33 iinnsstteeaadd ooff 00..66RRiisseerr ccllaammppss;; rreedduunnddaannccyy iinn ddeessiiggnn,, rreegguullaarriinnssppeeccttiioonn,, mmoonniittoorriinngg ooff rriisseerr mmoottiioonn eettcc..
NNaattuurraall hhaazzaarrddss PPaarraammeetteerrss tteennddiinngg ttooiinnccrreeaassee ffaaiilluurree rraattee
SSeevveerree llooccaall ccoonnddiittiioonnss ((eeaarrtthhqquuaakkeess,,hhuurrrriiccaanneess eettcc..))
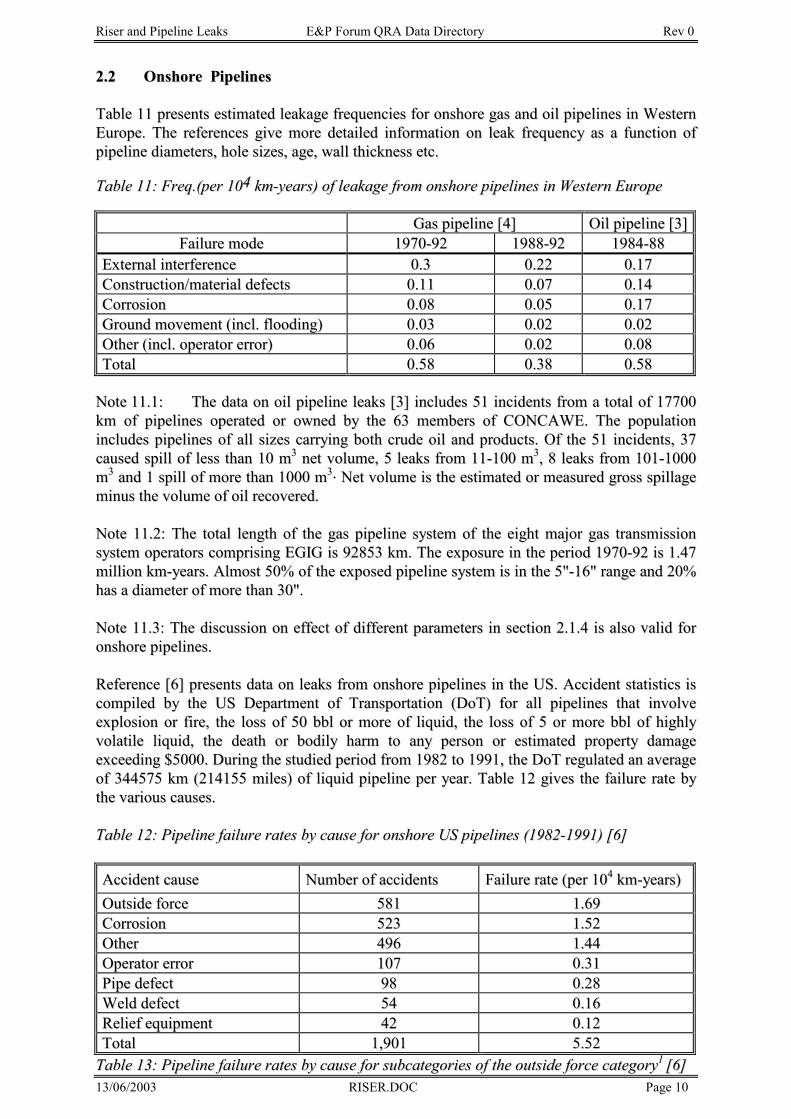
Riser and Pipeline Leaks E&P Forum QRA Data Directory Rev 0
13/06/2003 RISER.DOC Page 10
22..22 OOnnsshhoorree PPiippeelliinneess
TTaabbllee 1111 pprreesseennttss eessttiimmaatteedd lleeaakkaaggee ffrreeqquueenncciieess ffoorr oonnsshhoorree ggaass aanndd ooiill ppiippeelliinneess iinn WWeesstteerrnnEEuurrooppee.. TThhee rreeffeerreenncceess ggiivvee mmoorree ddeettaaiilleedd iinnffoorrmmaattiioonn oonn lleeaakk ffrreeqquueennccyy aass aa ffuunnccttiioonn ooffppiippeelliinnee ddiiaammeetteerrss,, hhoollee ssiizzeess,, aaggee,, wwaallll tthhiicckknneessss eettcc..
TTaabbllee 1111:: FFrreeqq..((ppeerr 110044 kkmm--yyeeaarrss)) ooff lleeaakkaaggee ffrroomm oonnsshhoorree ppiippeelliinneess iinn WWeesstteerrnn EEuurrooppee
GGaass ppiippeelliinnee [[44]] OOiill ppiippeelliinnee [[33]]FFaaiilluurree mmooddee 11997700--9922 11998888--9922 11998844--8888
EExxtteerrnnaall iinntteerrffeerreennccee 00..33 00..2222 00..1177CCoonnssttrruuccttiioonn//mmaatteerriiaall ddeeffeeccttss 00..1111 00..0077 00..1144CCoorrrroossiioonn 00..0088 00..0055 00..1177GGrroouunndd mmoovveemmeenntt ((iinnccll.. ffllooooddiinngg)) 00..0033 00..0022 00..0022OOtthheerr ((iinnccll.. ooppeerraattoorr eerrrroorr)) 00..0066 00..0022 00..0088TToottaall 00..5588 00..3388 00..5588
NNoottee 1111..11:: TThhee ddaattaa oonn ooiill ppiippeelliinnee lleeaakkss [[33]] iinncclluuddeess 5511 iinncciiddeennttss ffrroomm aa ttoottaall ooff 1177770000kkmm ooff ppiippeelliinneess ooppeerraatteedd oorr oowwnneedd bbyy tthhee 6633 mmeemmbbeerrss ooff CCOONNCCAAWWEE.. TThhee ppooppuullaattiioonniinncclluuddeess ppiippeelliinneess ooff aallll ssiizzeess ccaarrrryyiinngg bbootthh ccrruuddee ooiill aanndd pprroodduuccttss.. OOff tthhee 5511 iinncciiddeennttss,, 3377ccaauusseedd ssppiillll ooff lleessss tthhaann 1100 mm33 nneett vvoolluummee,, 55 lleeaakkss ffrroomm 1111--110000 mm33,, 88 lleeaakkss ffrroomm 110011--11000000mm33 aanndd 11 ssppiillll ooff mmoorree tthhaann 11000000 mm33.. NNeett vvoolluummee iiss tthhee eessttiimmaatteedd oorr mmeeaassuurreedd ggrroossss ssppiillllaaggeemmiinnuuss tthhee vvoolluummee ooff ooiill rreeccoovveerreedd..
NNoottee 1111..22:: TThhee ttoottaall lleennggtthh ooff tthhee ggaass ppiippeelliinnee ssyysstteemm ooff tthhee eeiigghhtt mmaajjoorr ggaass ttrraannssmmiissssiioonnssyysstteemm ooppeerraattoorrss ccoommpprriissiinngg EEGGIIGG iiss 9922885533 kkmm.. TThhee eexxppoossuurree iinn tthhee ppeerriioodd 11997700--9922 iiss 11..4477mmiilllliioonn kkmm--yyeeaarrss.. AAllmmoosstt 5500%% ooff tthhee eexxppoosseedd ppiippeelliinnee ssyysstteemm iiss iinn tthhee 55""--1166"" rraannggee aanndd 2200%%hhaass aa ddiiaammeetteerr ooff mmoorree tthhaann 3300""..
NNoottee 1111..33:: TThhee ddiissccuussssiioonn oonn eeffffeecctt ooff ddiiffffeerreenntt ppaarraammeetteerrss iinn sseeccttiioonn 22..11..44 iiss aallssoo vvaalliidd ffoorroonnsshhoorree ppiippeelliinneess..
RReeffeerreennccee [[66]] pprreesseennttss ddaattaa oonn lleeaakkss ffrroomm oonnsshhoorree ppiippeelliinneess iinn tthhee UUSS.. AAcccciiddeenntt ssttaattiissttiiccss iissccoommppiilleedd bbyy tthhee UUSS DDeeppaarrttmmeenntt ooff TTrraannssppoorrttaattiioonn ((DDooTT)) ffoorr aallll ppiippeelliinneess tthhaatt iinnvvoollvveeeexxpplloossiioonn oorr ffiirree,, tthhee lloossss ooff 5500 bbbbll oorr mmoorree ooff lliiqquuiidd,, tthhee lloossss ooff 55 oorr mmoorree bbbbll ooff hhiigghhllyyvvoollaattiillee lliiqquuiidd,, tthhee ddeeaatthh oorr bbooddiillyy hhaarrmm ttoo aannyy ppeerrssoonn oorr eessttiimmaatteedd pprrooppeerrttyy ddaammaaggeeeexxcceeeeddiinngg $$55000000.. DDuurriinngg tthhee ssttuuddiieedd ppeerriioodd ffrroomm 11998822 ttoo 11999911,, tthhee DDooTT rreegguullaatteedd aann aavveerraaggeeooff 334444557755 kkmm ((221144115555 mmiilleess)) ooff lliiqquuiidd ppiippeelliinnee ppeerr yyeeaarr.. TTaabbllee 1122 ggiivveess tthhee ffaaiilluurree rraattee bbyytthhee vvaarriioouuss ccaauusseess..
TTaabbllee 1122:: PPiippeelliinnee ffaaiilluurree rraatteess bbyy ccaauussee ffoorr oonnsshhoorree UUSS ppiippeelliinneess ((11998822--11999911)) [[66]]
AAcccciiddeenntt ccaauussee NNuummbbeerr ooff aacccciiddeennttss FFaaiilluurree rraattee ((ppeerr 110044 kkmm--yyeeaarrss))OOuuttssiiddee ffoorrccee 558811 11..6699CCoorrrroossiioonn 552233 11..5522OOtthheerr 449966 11..4444OOppeerraattoorr eerrrroorr 110077 00..3311PPiippee ddeeffeecctt 9988 00..2288WWeelldd ddeeffeecctt 5544 00..1166RReelliieeff eeqquuiippmmeenntt 4422 00..1122TToottaall 11,,990011 55..5522
TTaabbllee 1133:: PPiippeelliinnee ffaaiilluurree rraatteess bbyy ccaauussee ffoorr ssuubbccaatteeggoorriieess ooff tthhee oouuttssiiddee ffoorrccee ccaatteeggoorryy11 [[66]]
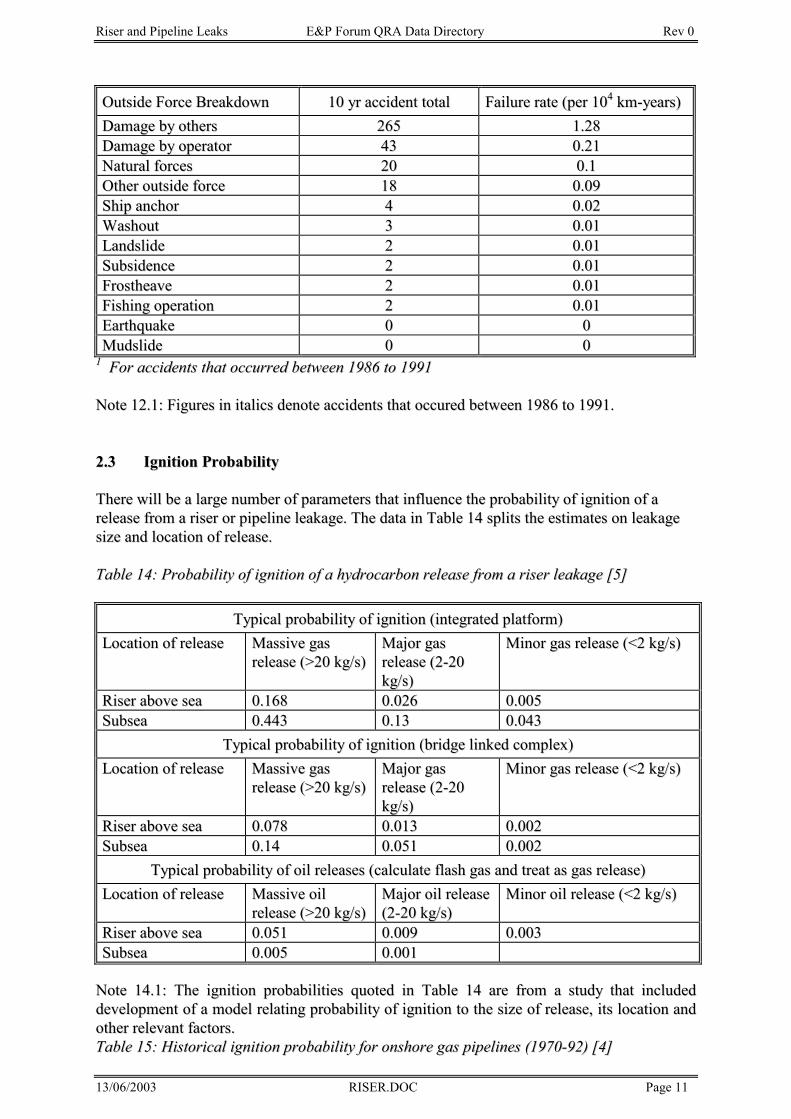
Riser and Pipeline Leaks E&P Forum QRA Data Directory Rev 0
13/06/2003 RISER.DOC Page 11
OOuuttssiiddee FFoorrccee BBrreeaakkddoowwnn 1100 yyrr aacccciiddeenntt ttoottaall FFaaiilluurree rraattee ((ppeerr 110044 kkmm--yyeeaarrss))DDaammaaggee bbyy ootthheerrss 226655 11..2288DDaammaaggee bbyy ooppeerraattoorr 4433 00..2211NNaattuurraall ffoorrcceess 2200 00..11OOtthheerr oouuttssiiddee ffoorrccee 1188 00..0099SShhiipp aanncchhoorr 44 00..0022WWaasshhoouutt 33 00..0011LLaannddsslliiddee 22 00..0011SSuubbssiiddeennccee 22 00..0011FFrroosstthheeaavvee 22 00..0011FFiisshhiinngg ooppeerraattiioonn 22 00..0011EEaarrtthhqquuaakkee 00 00MMuuddsslliiddee 00 00
11 FFoorr aacccciiddeennttss tthhaatt ooccccuurrrreedd bbeettwweeeenn 11998866 ttoo 11999911
NNoottee 1122..11:: FFiigguurreess iinn iittaalliiccss ddeennoottee aacccciiddeennttss tthhaatt ooccccuurreedd bbeettwweeeenn 11998866 ttoo 11999911..
22..33 IIggnniittiioonn PPrroobbaabbiilliittyy
TThheerree wwiillll bbee aa llaarrggee nnuummbbeerr ooff ppaarraammeetteerrss tthhaatt iinnfflluueennccee tthhee pprroobbaabbiilliittyy ooff iiggnniittiioonn ooff aarreelleeaassee ffrroomm aa rriisseerr oorr ppiippeelliinnee lleeaakkaaggee.. TThhee ddaattaa iinn TTaabbllee 1144 sspplliittss tthhee eessttiimmaatteess oonn lleeaakkaaggeessiizzee aanndd llooccaattiioonn ooff rreelleeaassee..
TTaabbllee 1144:: PPrroobbaabbiilliittyy ooff iiggnniittiioonn ooff aa hhyyddrrooccaarrbboonn rreelleeaassee ffrroomm aa rriisseerr lleeaakkaaggee [[55]]
TTyyppiiccaall pprroobbaabbiilliittyy ooff iiggnniittiioonn ((iinntteeggrraatteedd ppllaattffoorrmm))LLooccaattiioonn ooff rreelleeaassee MMaassssiivvee ggaass
rreelleeaassee ((>>2200 kkgg//ss))MMaajjoorr ggaassrreelleeaassee ((22--2200kkgg//ss))
MMiinnoorr ggaass rreelleeaassee ((<<22 kkgg//ss))
RRiisseerr aabboovvee sseeaa 00..116688 00..002266 00..000055SSuubbsseeaa 00..444433 00..1133 00..004433
TTyyppiiccaall pprroobbaabbiilliittyy ooff iiggnniittiioonn ((bbrriiddggee lliinnkkeedd ccoommpplleexx))LLooccaattiioonn ooff rreelleeaassee MMaassssiivvee ggaass
rreelleeaassee ((>>2200 kkgg//ss))MMaajjoorr ggaassrreelleeaassee ((22--2200kkgg//ss))
MMiinnoorr ggaass rreelleeaassee ((<<22 kkgg//ss))
RRiisseerr aabboovvee sseeaa 00..007788 00..001133 00..000022SSuubbsseeaa 00..1144 00..005511 00..000022
TTyyppiiccaall pprroobbaabbiilliittyy ooff ooiill rreelleeaasseess ((ccaallccuullaattee ffllaasshh ggaass aanndd ttrreeaatt aass ggaass rreelleeaassee))LLooccaattiioonn ooff rreelleeaassee MMaassssiivvee ooiill
rreelleeaassee ((>>2200 kkgg//ss))MMaajjoorr ooiill rreelleeaassee((22--2200 kkgg//ss))
MMiinnoorr ooiill rreelleeaassee ((<<22 kkgg//ss))
RRiisseerr aabboovvee sseeaa 00..005511 00..000099 00..000033SSuubbsseeaa 00..000055 00..000011
NNoottee 1144..11:: TThhee iiggnniittiioonn pprroobbaabbiilliittiieess qquuootteedd iinn TTaabbllee 1144 aarree ffrroomm aa ssttuuddyy tthhaatt iinncclluuddeeddddeevveellooppmmeenntt ooff aa mmooddeell rreellaattiinngg pprroobbaabbiilliittyy ooff iiggnniittiioonn ttoo tthhee ssiizzee ooff rreelleeaassee,, iittss llooccaattiioonn aannddootthheerr rreelleevvaanntt ffaaccttoorrss..TTaabbllee 1155:: HHiissttoorriiccaall iiggnniittiioonn pprroobbaabbiilliittyy ffoorr oonnsshhoorree ggaass ppiippeelliinneess ((11997700--9922)) [[44]]
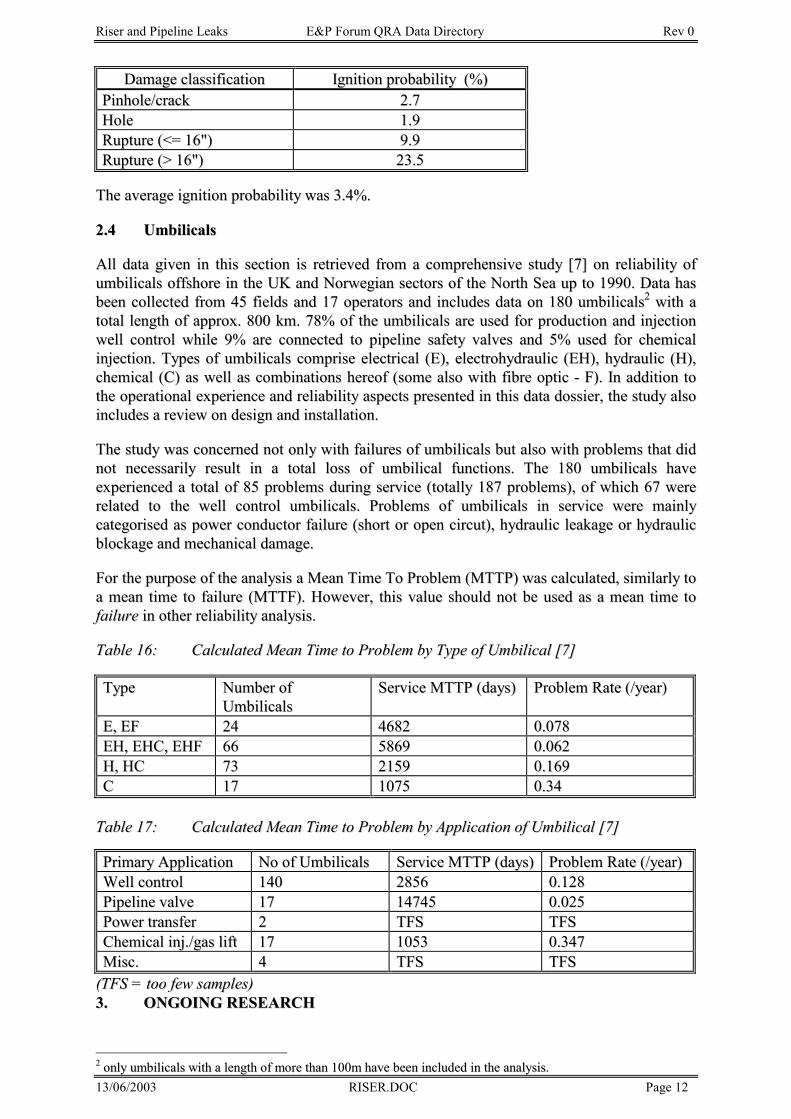
Riser and Pipeline Leaks E&P Forum QRA Data Directory Rev 0
13/06/2003 RISER.DOC Page 12
DDaammaaggee ccllaassssiiffiiccaattiioonn IIggnniittiioonn pprroobbaabbiilliittyy ((%%))PPiinnhhoollee//ccrraacckk 22..77HHoollee 11..99RRuuppttuurree ((<<== 1166"")) 99..99RRuuppttuurree ((>> 1166"")) 2233..55
TThhee aavveerraaggee iiggnniittiioonn pprroobbaabbiilliittyy wwaass 33..44%%..
22..44 UUmmbbiilliiccaallss
AAllll ddaattaa ggiivveenn iinn tthhiiss sseeccttiioonn iiss rreettrriieevveedd ffrroomm aa ccoommpprreehheennssiivvee ssttuuddyy [[77]] oonn rreelliiaabbiilliittyy ooffuummbbiilliiccaallss ooffffsshhoorree iinn tthhee UUKK aanndd NNoorrwweeggiiaann sseeccttoorrss ooff tthhee NNoorrtthh SSeeaa uupp ttoo 11999900.. DDaattaa hhaassbbeeeenn ccoolllleecctteedd ffrroomm 4455 ffiieellddss aanndd 1177 ooppeerraattoorrss aanndd iinncclluuddeess ddaattaa oonn 118800 uummbbiilliiccaallss22 wwiitthh aattoottaall lleennggtthh ooff aapppprrooxx.. 880000 kkmm.. 7788%% ooff tthhee uummbbiilliiccaallss aarree uusseedd ffoorr pprroodduuccttiioonn aanndd iinnjjeeccttiioonnwweellll ccoonnttrrooll wwhhiillee 99%% aarree ccoonnnneecctteedd ttoo ppiippeelliinnee ssaaffeettyy vvaallvveess aanndd 55%% uusseedd ffoorr cchheemmiiccaalliinnjjeeccttiioonn.. TTyyppeess ooff uummbbiilliiccaallss ccoommpprriissee eelleeccttrriiccaall ((EE)),, eelleeccttrroohhyyddrraauulliicc ((EEHH)),, hhyyddrraauulliicc ((HH)),,cchheemmiiccaall ((CC)) aass wweellll aass ccoommbbiinnaattiioonnss hheerreeooff ((ssoommee aallssoo wwiitthh ffiibbrree ooppttiicc -- FF)).. IInn aaddddiittiioonn ttootthhee ooppeerraattiioonnaall eexxppeerriieennccee aanndd rreelliiaabbiilliittyy aassppeeccttss pprreesseenntteedd iinn tthhiiss ddaattaa ddoossssiieerr,, tthhee ssttuuddyy aallssooiinncclluuddeess aa rreevviieeww oonn ddeessiiggnn aanndd iinnssttaallllaattiioonn..
TThhee ssttuuddyy wwaass ccoonncceerrnneedd nnoott oonnllyy wwiitthh ffaaiilluurreess ooff uummbbiilliiccaallss bbuutt aallssoo wwiitthh pprroobblleemmss tthhaatt ddiiddnnoott nneecceessssaarriillyy rreessuulltt iinn aa ttoottaall lloossss ooff uummbbiilliiccaall ffuunnccttiioonnss.. TThhee 118800 uummbbiilliiccaallss hhaavveeeexxppeerriieenncceedd aa ttoottaall ooff 8855 pprroobblleemmss dduurriinngg sseerrvviiccee ((ttoottaallllyy 118877 pprroobblleemmss)),, ooff wwhhiicchh 6677 wweerreerreellaatteedd ttoo tthhee wweellll ccoonnttrrooll uummbbiilliiccaallss.. PPrroobblleemmss ooff uummbbiilliiccaallss iinn sseerrvviiccee wweerree mmaaiinnllyyccaatteeggoorriisseedd aass ppoowweerr ccoonndduuccttoorr ffaaiilluurree ((sshhoorrtt oorr ooppeenn cciirrccuutt)),, hhyyddrraauulliicc lleeaakkaaggee oorr hhyyddrraauulliiccbblloocckkaaggee aanndd mmeecchhaanniiccaall ddaammaaggee..
FFoorr tthhee ppuurrppoossee ooff tthhee aannaallyyssiiss aa MMeeaann TTiimmee TToo PPrroobblleemm ((MMTTTTPP)) wwaass ccaallccuullaatteedd,, ssiimmiillaarrllyy ttooaa mmeeaann ttiimmee ttoo ffaaiilluurree ((MMTTTTFF)).. HHoowweevveerr,, tthhiiss vvaalluuee sshhoouulldd nnoott bbee uusseedd aass aa mmeeaann ttiimmee ttooffaaiilluurree iinn ootthheerr rreelliiaabbiilliittyy aannaallyyssiiss..
TTaabbllee 1166:: CCaallccuullaatteedd MMeeaann TTiimmee ttoo PPrroobblleemm bbyy TTyyppee ooff UUmmbbiilliiccaall [[77]]
TTyyppee NNuummbbeerr ooffUUmmbbiilliiccaallss
SSeerrvviiccee MMTTTTPP ((ddaayyss)) PPrroobblleemm RRaattee ((//yyeeaarr))
EE,, EEFF 2244 44668822 00..007788EEHH,, EEHHCC,, EEHHFF 6666 55886699 00..006622HH,, HHCC 7733 22115599 00..116699CC 1177 11007755 00..3344
TTaabbllee 1177:: CCaallccuullaatteedd MMeeaann TTiimmee ttoo PPrroobblleemm bbyy AApppplliiccaattiioonn ooff UUmmbbiilliiccaall [[77]]
PPrriimmaarryy AApppplliiccaattiioonn NNoo ooff UUmmbbiilliiccaallss SSeerrvviiccee MMTTTTPP ((ddaayyss)) PPrroobblleemm RRaattee ((//yyeeaarr))WWeellll ccoonnttrrooll 114400 22885566 00..112288PPiippeelliinnee vvaallvvee 1177 1144774455 00..002255PPoowweerr ttrraannssffeerr 22 TTFFSS TTFFSSCChheemmiiccaall iinnjj..//ggaass lliifftt 1177 11005533 00..334477MMiisscc.. 44 TTFFSS TTFFSS
((TTFFSS == ttoooo ffeeww ssaammpplleess))33.. OONNGGOOIINNGG RREESSEEAARRCCHH
22 oonnllyy uummbbiilliiccaallss wwiitthh aa lleennggtthh ooff mmoorree tthhaann 110000mm hhaavvee bbeeeenn iinncclluuddeedd iinn tthhee aannaallyyssiiss..
Riser and Pipeline Leaks E&P Forum QRA Data Directory Rev 0
13/06/2003 RISER.DOC Page 13
AA nnuummbbeerr ooff rreesseeaarrcchh pprrooggrraammmmeess aarree iinn pprrooggrreessss oonn tteessttiinngg ooff fflleexxiibbllee rriisseerrss//hhoosseess.. TThheesseeiinncclluuddee tteessttiinngg ppeerrffoorrmmeedd bbyy CCoofflleexxiipp,, WWeellllssttrreeaamm aanndd SSIINNTTEEFF..
AA JJIIPP pprroojjeecctt oonn ddeevveellooppmmeenntt ooff aann aannaallyyssiiss mmooddeell ffoorr pprreeddiiccttiioonn ooff iiggnniittiioonn pprroobbaabbiilliittyy hhaassbbeeeenn iinniittiiaatteedd iinn 11999955 aanndd wwiillll ccoonnttiinnuuee tthhrroouugghh 11999966.. TThhee pprroojjeecctt iiss ssuuppppoorrtteedd bbyy 66 mmaajjoorr ooiillccoommppaanniieess aanndd uunnddeerrttaakkeenn bbyy DDNNVV TTeecchhnniiccaa,, AAEEAA aanndd SSccaannddppoowweerr.. TThhee aannaallyyssiiss mmooddeellsshhoouulldd aallssoo bbee aapppplliiccaabbllee ttoo mmaajjoorr rreelleeaasseess iinn ooppeenn aaiirr ((ffrroomm rriisseerrss aanndd ppiippeelliinneess))..
Riser and Pipeline Leaks E&P Forum QRA Data Directory Rev 0
13/06/2003 RISER.DOC Page 14
RREEFFEERREENNCCEESS
[[11]] AAddvvaanncceedd MMeecchhaanniiccss && EEnnggiinneeeerriinngg LLttdd::PPAARRLLOOCC 9922 TThhee uuppddaattee ooff lloossss ooff ccoonnttaaiinnmmeenntt ddaattaa ffoorr ooffffsshhoorree ppiippeelliinneess..FFiinnaall rreeppoorrtt ffoorr UUKKOOOOAA aanndd HHSSEE.. FFeebbrruuaarryy 11999933..
[[22]] EE&&PP FFoorruumm SSoouurrccee
[[33]] PPeerrffoorrmmaannccee ooff ooiill iinndduussttrryy ppiippeelliinneess iinn WWeesstteerrnn EEuurrooppee 11998888..CCOONNCCAAWWEE ((tthhee ooiill ccoommppaanniieess'' EEuurrooppeeaann OOrrggaanniissaattiioonn ffoorr EEnnvviirroonnmmeenntt,, HHeeaalltthh aannddSSaaffeettyy)),, DDeecceemmbbeerr 11998899..
[[44]] EEuurrooppeeaann GGaass PPiippeelliinnee IInncciiddeenntt DDaattaa GGrroouupp ((EEGGIIGG))GGaass ppiippeelliinnee iinncciiddeennttss.. RReeppoorrtt 11997700--11999922..OOccttoobbeerr 11999933..
[[55]] EE&&PP FFoorruumm SSoouurrccee
[[66]] DDiiaannee JJ HHoovveeyy eett aall.. PPiippeelliinnee AAcccciiddeennttss,, FFaaiilluurree PPrroobbaabbiilliittyy ddeetteerrmmiinneedd ffrroommHHiissttoorriiccaall DDaattaa,, OOiill aanndd GGaass JJoouurrnnaall,, JJuullyy 1122 11999933..
[[77]] SSttuuddyy ooff tthhee ppeerrffoorrmmaannccee aanndd rreelliiaabbiilliittyy ooff hhyyddrraauulliicc,, eelleeccttrroohhyyddrraauulliicc aanndd mmuullttii--ffuunnccttiioonnaall uummbbiilliiccaallss.. EEnnggiinneeeerriinngg RReesseeaarrcchh cceennttrree,, JJuullyy 11999900..
Riser and Pipeline Leaks E&P Forum QRA Data Directory Rev 0
13/06/2003 RISER.DOC Page 15
Storage Tanks E&P Forum QRA Datasheet Directory Rev 0
13/06/2003 STORTANK.DOC Page 1
STORAGE TANK INCIDENTS
Storage Tanks E&P Forum QRA Datasheet Directory Rev 0
13/06/2003 STORTANK.DOC Page 2
TABLE OF CONTENTS
1. SUMMARY--------------------------------------------------------------------------------------------- 3
2. STORAGE TANK POPULATION---------------------------------------------------------------- 3
3. STORAGE TANK LEAK FREQUENCY ------------------------------------------------------- 5
4. STORAGE TANK LEAK CAUSES-------------------------------------------------------------- 8
5. STORAGE TANK FIRES -------------------------------------------------------------------------- 9
6. REFERENCES ------------------------------------------------------------------------------------- 12
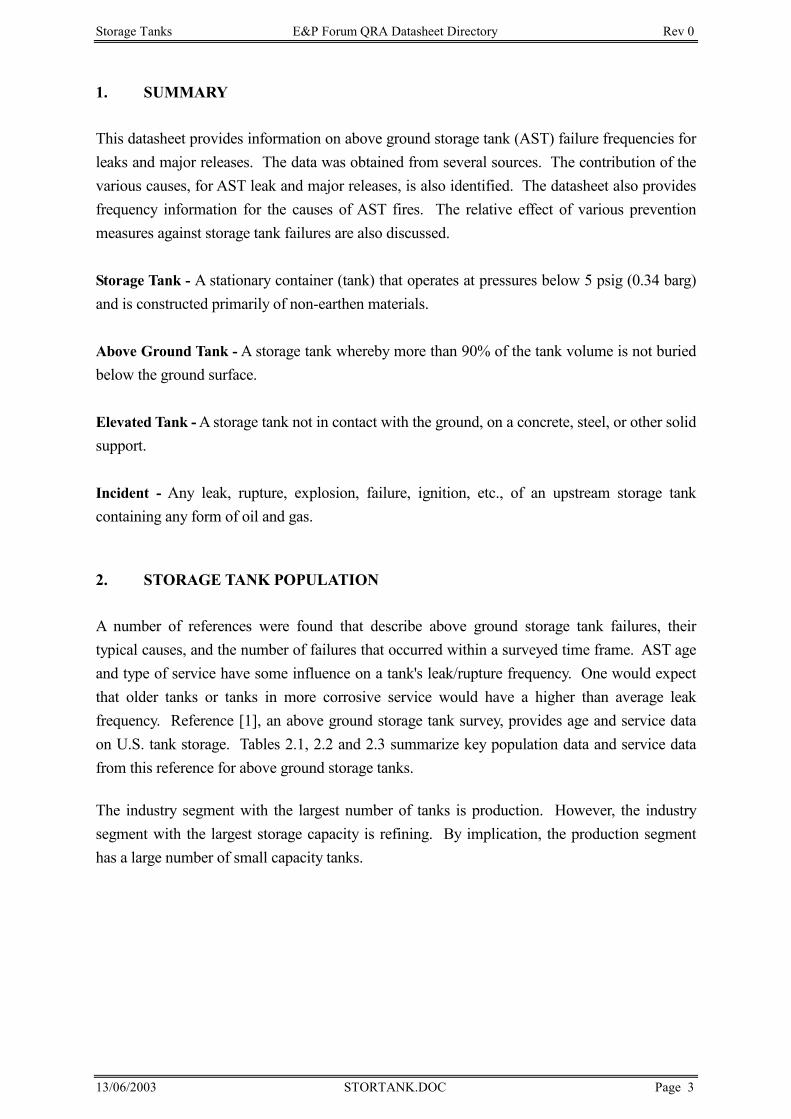
Storage Tanks E&P Forum QRA Datasheet Directory Rev 0
13/06/2003 STORTANK.DOC Page 3
1. SUMMARY This datasheet provides information on above ground storage tank (AST) failure frequencies for leaks and major releases. The data was obtained from several sources. The contribution of the various causes, for AST leak and major releases, is also identified. The datasheet also provides frequency information for the causes of AST fires. The relative effect of various prevention measures against storage tank failures are also discussed. Storage Tank - A stationary container (tank) that operates at pressures below 5 psig (0.34 barg) and is constructed primarily of non-earthen materials. Above Ground Tank - A storage tank whereby more than 90% of the tank volume is not buried below the ground surface. Elevated Tank - A storage tank not in contact with the ground, on a concrete, steel, or other solid support. Incident - Any leak, rupture, explosion, failure, ignition, etc., of an upstream storage tank containing any form of oil and gas.
2. STORAGE TANK POPULATION A number of references were found that describe above ground storage tank failures, their typical causes, and the number of failures that occurred within a surveyed time frame. AST age and type of service have some influence on a tank's leak/rupture frequency. One would expect that older tanks or tanks in more corrosive service would have a higher than average leak frequency. Reference [1], an above ground storage tank survey, provides age and service data on U.S. tank storage. Tables 2.1, 2.2 and 2.3 summarize key population data and service data from this reference for above ground storage tanks. The industry segment with the largest number of tanks is production. However, the industry segment with the largest storage capacity is refining. By implication, the production segment has a large number of small capacity tanks.
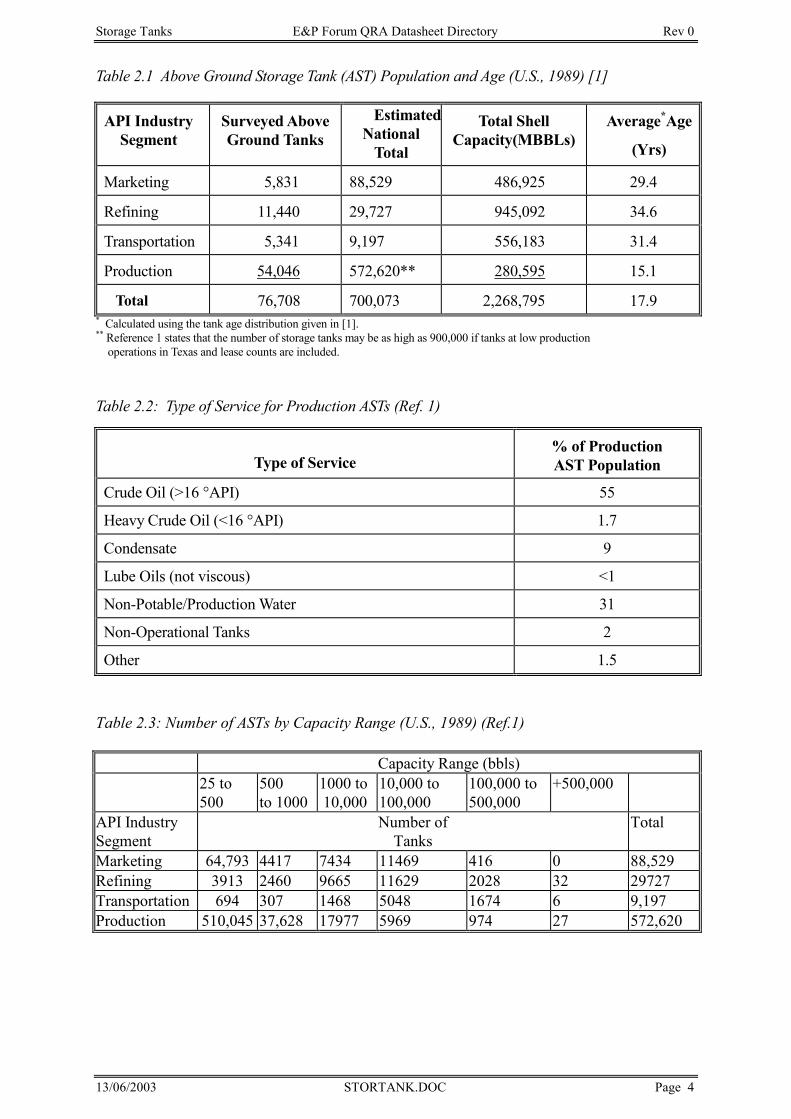
Storage Tanks E&P Forum QRA Datasheet Directory Rev 0
13/06/2003 STORTANK.DOC Page 4
Table 2.1 Above Ground Storage Tank (AST) Population and Age (U.S., 1989) [1]
API Industry Segment
Surveyed Above Ground Tanks
Estimated National
Total
Total Shell Capacity(MBBLs)
Average*Age
(Yrs)
Marketing 5,831 88,529 486,925 29.4
Refining 11,440 29,727 945,092 34.6
Transportation 5,341 9,197 556,183 31.4
Production 54,046 572,620** 280,595 15.1
Total 76,708 700,073 2,268,795 17.9 * Calculated using the tank age distribution given in [1]. ** Reference 1 states that the number of storage tanks may be as high as 900,000 if tanks at low production
operations in Texas and lease counts are included.
Table 2.2: Type of Service for Production ASTs (Ref. 1)
Type of Service
% of Production AST Population
Crude Oil (>16 °API) 55
Heavy Crude Oil (<16 °API) 1.7
Condensate 9
Lube Oils (not viscous) <1
Non-Potable/Production Water 31
Non-Operational Tanks 2
Other 1.5
Table 2.3: Number of ASTs by Capacity Range (U.S., 1989) (Ref.1)
Capacity Range (bbls) 25 to 500
500 to 1000
1000 to 10,000
10,000 to 100,000
100,000 to 500,000
+500,000
API Industry Segment
Number of Tanks
Total
Marketing 64,793 4417 7434 11469 416 0 88,529 Refining 3913 2460 9665 11629 2028 32 29727 Transportation 694 307 1468 5048 1674 6 9,197 Production 510,045 37,628 17977 5969 974 27 572,620
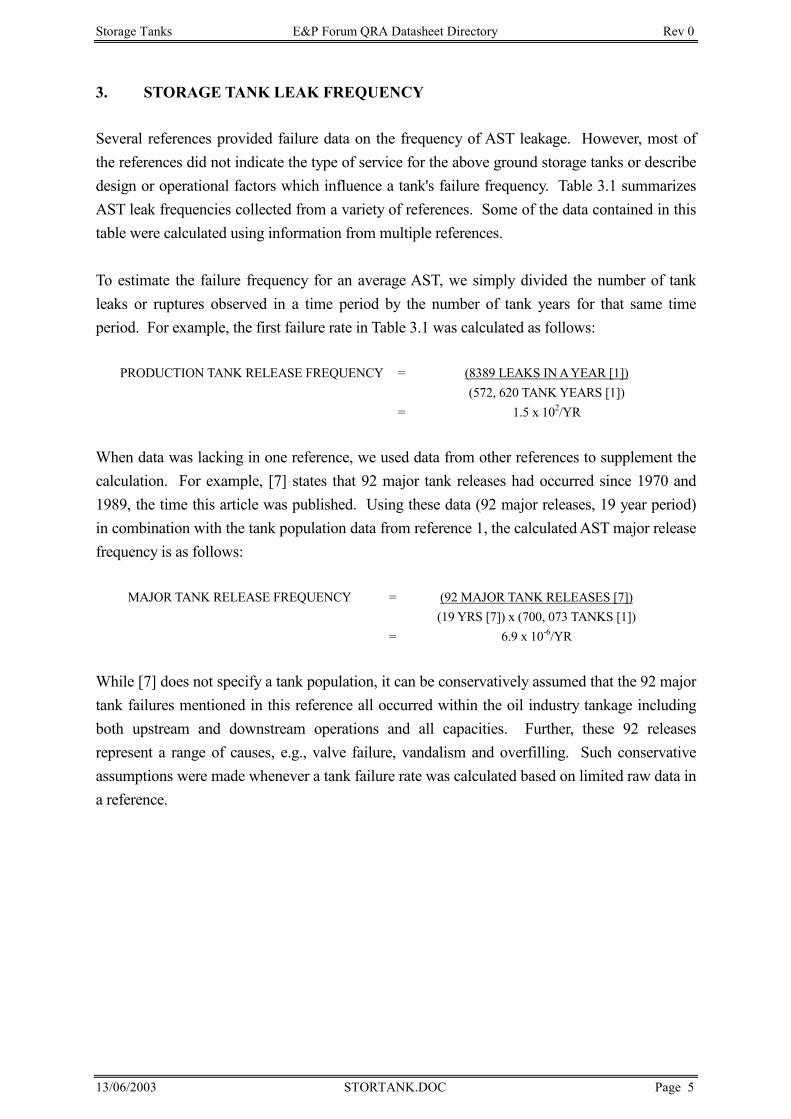
Storage Tanks E&P Forum QRA Datasheet Directory Rev 0
13/06/2003 STORTANK.DOC Page 5
3. STORAGE TANK LEAK FREQUENCY Several references provided failure data on the frequency of AST leakage. However, most of the references did not indicate the type of service for the above ground storage tanks or describe design or operational factors which influence a tank's failure frequency. Table 3.1 summarizes AST leak frequencies collected from a variety of references. Some of the data contained in this table were calculated using information from multiple references. To estimate the failure frequency for an average AST, we simply divided the number of tank leaks or ruptures observed in a time period by the number of tank years for that same time period. For example, the first failure rate in Table 3.1 was calculated as follows:
PRODUCTION TANK RELEASE FREQUENCY = (8389 LEAKS IN A YEAR [1])
(572, 620 TANK YEARS [1]) = 1.5 x 10²/YR
When data was lacking in one reference, we used data from other references to supplement the calculation. For example, [7] states that 92 major tank releases had occurred since 1970 and 1989, the time this article was published. Using these data (92 major releases, 19 year period) in combination with the tank population data from reference 1, the calculated AST major release frequency is as follows:
MAJOR TANK RELEASE FREQUENCY = (92 MAJOR TANK RELEASES [7])(19 YRS [7]) x (700, 073 TANKS [1])
= 6.9 x 10⁻⁶/YR
While [7] does not specify a tank population, it can be conservatively assumed that the 92 major tank failures mentioned in this reference all occurred within the oil industry tankage including both upstream and downstream operations and all capacities. Further, these 92 releases represent a range of causes, e.g., valve failure, vandalism and overfilling. Such conservative assumptions were made whenever a tank failure rate was calculated based on limited raw data in a reference.
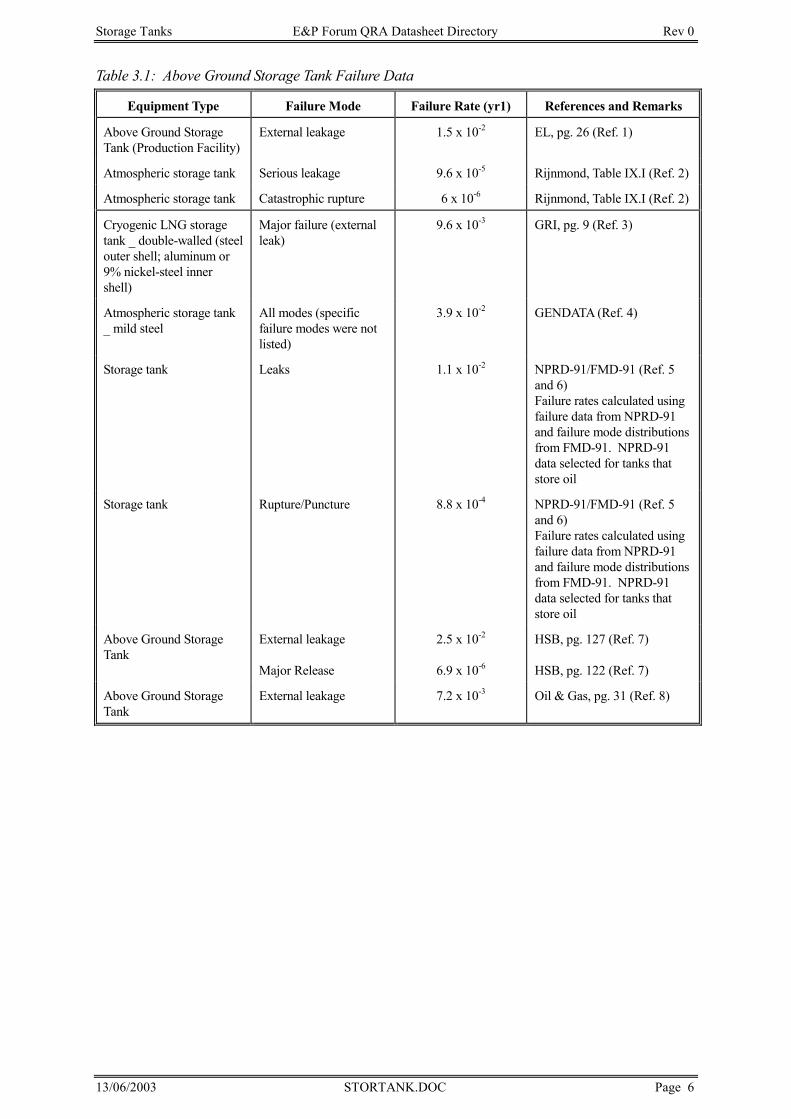
Storage Tanks E&P Forum QRA Datasheet Directory Rev 0
13/06/2003 STORTANK.DOC Page 6
Table 3.1: Above Ground Storage Tank Failure Data
Equipment Type Failure Mode Failure Rate (yr1) References and Remarks
Above Ground Storage Tank (Production Facility)
External leakage 1.5 x 10⁻² EL, pg. 26 (Ref. 1)
Atmospheric storage tank Serious leakage 9.6 x 10⁻⁵ Rijnmond, Table IX.I (Ref. 2)
Atmospheric storage tank Catastrophic rupture 6 x 10⁻⁶ Rijnmond, Table IX.I (Ref. 2)
Cryogenic LNG storage tank _ double-walled (steel outer shell; aluminum or 9% nickel-steel inner shell)
Major failure (external leak)
9.6 x 10⁻³ GRI, pg. 9 (Ref. 3)
Atmospheric storage tank _ mild steel
All modes (specific failure modes were not listed)
3.9 x 10⁻² GENDATA (Ref. 4)
Storage tank Leaks 1.1 x 10⁻² NPRD-91/FMD-91 (Ref. 5 and 6) Failure rates calculated using failure data from NPRD-91 and failure mode distributions from FMD-91. NPRD-91 data selected for tanks that store oil
Storage tank Rupture/Puncture 8.8 x 10⁻⁴ NPRD-91/FMD-91 (Ref. 5 and 6) Failure rates calculated using failure data from NPRD-91 and failure mode distributions from FMD-91. NPRD-91 data selected for tanks that store oil
Above Ground Storage Tank
External leakage Major Release
2.5 x 10⁻²
6.9 x 10⁻⁶
HSB, pg. 127 (Ref. 7) HSB, pg. 122 (Ref. 7)
Above Ground Storage Tank
External leakage 7.2 x 10⁻³ Oil & Gas, pg. 31 (Ref. 8)
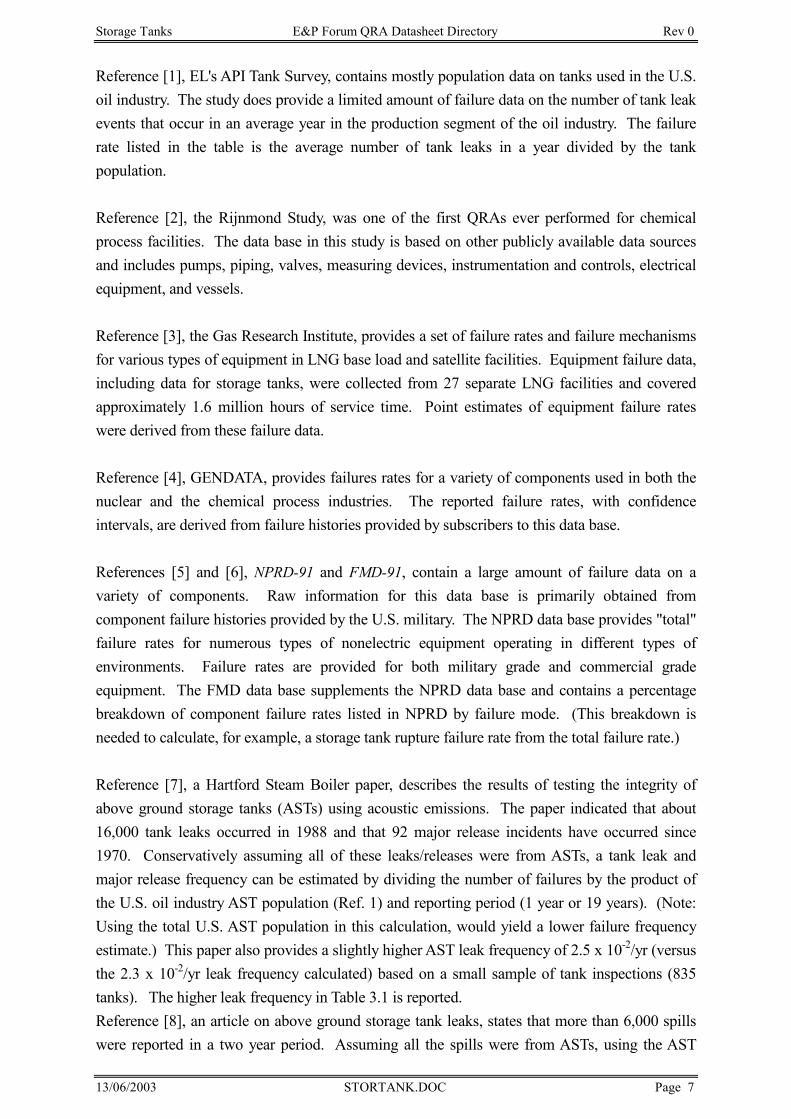
Storage Tanks E&P Forum QRA Datasheet Directory Rev 0
13/06/2003 STORTANK.DOC Page 7
Reference [1], EL's API Tank Survey, contains mostly population data on tanks used in the U.S. oil industry. The study does provide a limited amount of failure data on the number of tank leak events that occur in an average year in the production segment of the oil industry. The failure rate listed in the table is the average number of tank leaks in a year divided by the tank population. Reference [2], the Rijnmond Study, was one of the first QRAs ever performed for chemical process facilities. The data base in this study is based on other publicly available data sources and includes pumps, piping, valves, measuring devices, instrumentation and controls, electrical equipment, and vessels. Reference [3], the Gas Research Institute, provides a set of failure rates and failure mechanisms for various types of equipment in LNG base load and satellite facilities. Equipment failure data, including data for storage tanks, were collected from 27 separate LNG facilities and covered approximately 1.6 million hours of service time. Point estimates of equipment failure rates were derived from these failure data. Reference [4], GENDATA, provides failures rates for a variety of components used in both the nuclear and the chemical process industries. The reported failure rates, with confidence intervals, are derived from failure histories provided by subscribers to this data base. References [5] and [6], NPRD-91 and FMD-91, contain a large amount of failure data on a variety of components. Raw information for this data base is primarily obtained from component failure histories provided by the U.S. military. The NPRD data base provides "total" failure rates for numerous types of nonelectric equipment operating in different types of environments. Failure rates are provided for both military grade and commercial grade equipment. The FMD data base supplements the NPRD data base and contains a percentage breakdown of component failure rates listed in NPRD by failure mode. (This breakdown is needed to calculate, for example, a storage tank rupture failure rate from the total failure rate.) Reference [7], a Hartford Steam Boiler paper, describes the results of testing the integrity of above ground storage tanks (ASTs) using acoustic emissions. The paper indicated that about 16,000 tank leaks occurred in 1988 and that 92 major release incidents have occurred since 1970. Conservatively assuming all of these leaks/releases were from ASTs, a tank leak and major release frequency can be estimated by dividing the number of failures by the product of the U.S. oil industry AST population (Ref. 1) and reporting period (1 year or 19 years). (Note: Using the total U.S. AST population in this calculation, would yield a lower failure frequency estimate.) This paper also provides a slightly higher AST leak frequency of 2.5 x 10⁻²/yr (versus the 2.3 x 10⁻²/yr leak frequency calculated) based on a small sample of tank inspections (835 tanks). The higher leak frequency in Table 3.1 is reported. Reference [8], an article on above ground storage tank leaks, states that more than 6,000 spills were reported in a two year period. Assuming all the spills were from ASTs, using the AST
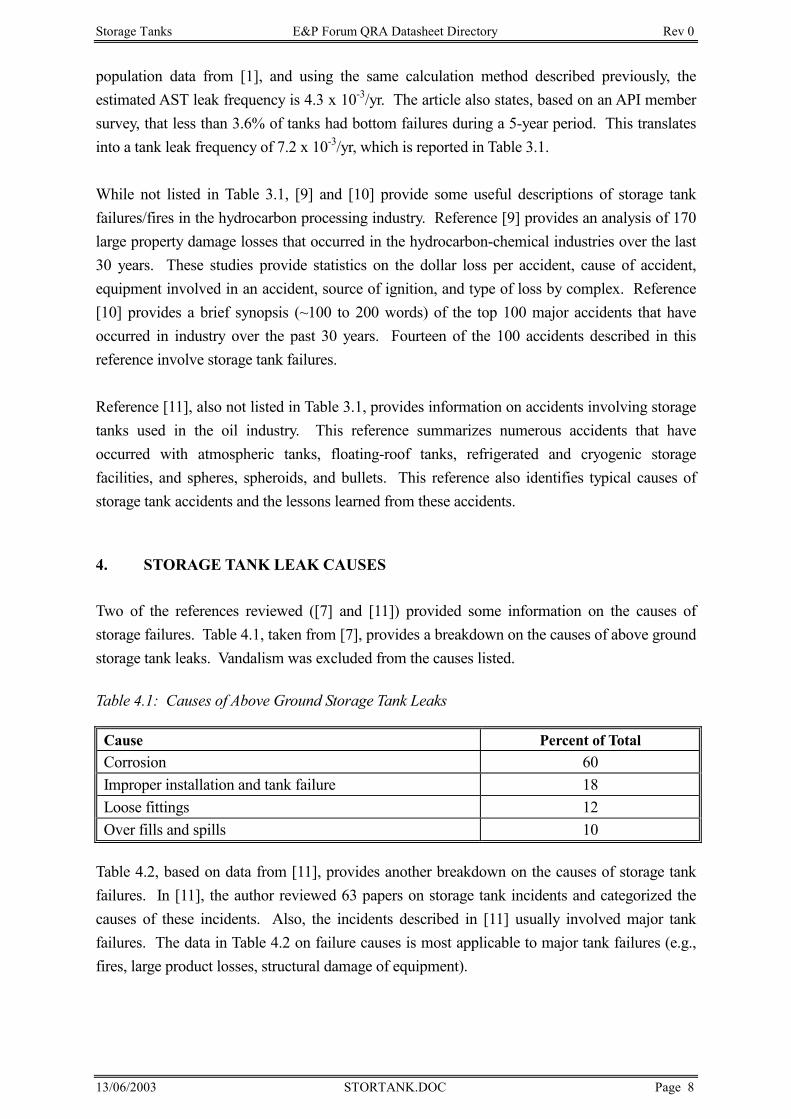
Storage Tanks E&P Forum QRA Datasheet Directory Rev 0
13/06/2003 STORTANK.DOC Page 8
population data from [1], and using the same calculation method described previously, the estimated AST leak frequency is 4.3 x 10⁻³/yr. The article also states, based on an API member survey, that less than 3.6% of tanks had bottom failures during a 5-year period. This translates into a tank leak frequency of 7.2 x 10⁻³/yr, which is reported in Table 3.1. While not listed in Table 3.1, [9] and [10] provide some useful descriptions of storage tank failures/fires in the hydrocarbon processing industry. Reference [9] provides an analysis of 170 large property damage losses that occurred in the hydrocarbon-chemical industries over the last 30 years. These studies provide statistics on the dollar loss per accident, cause of accident, equipment involved in an accident, source of ignition, and type of loss by complex. Reference [10] provides a brief synopsis (~100 to 200 words) of the top 100 major accidents that have occurred in industry over the past 30 years. Fourteen of the 100 accidents described in this reference involve storage tank failures. Reference [11], also not listed in Table 3.1, provides information on accidents involving storage tanks used in the oil industry. This reference summarizes numerous accidents that have occurred with atmospheric tanks, floating-roof tanks, refrigerated and cryogenic storage facilities, and spheres, spheroids, and bullets. This reference also identifies typical causes of storage tank accidents and the lessons learned from these accidents.
4. STORAGE TANK LEAK CAUSES Two of the references reviewed ([7] and [11]) provided some information on the causes of storage failures. Table 4.1, taken from [7], provides a breakdown on the causes of above ground storage tank leaks. Vandalism was excluded from the causes listed. Table 4.1: Causes of Above Ground Storage Tank Leaks
Cause Percent of Total Corrosion 60 Improper installation and tank failure 18 Loose fittings 12 Over fills and spills 10
Table 4.2, based on data from [11], provides another breakdown on the causes of storage tank failures. In [11], the author reviewed 63 papers on storage tank incidents and categorized the causes of these incidents. Also, the incidents described in [11] usually involved major tank failures. The data in Table 4.2 on failure causes is most applicable to major tank failures (e.g., fires, large product losses, structural damage of equipment).
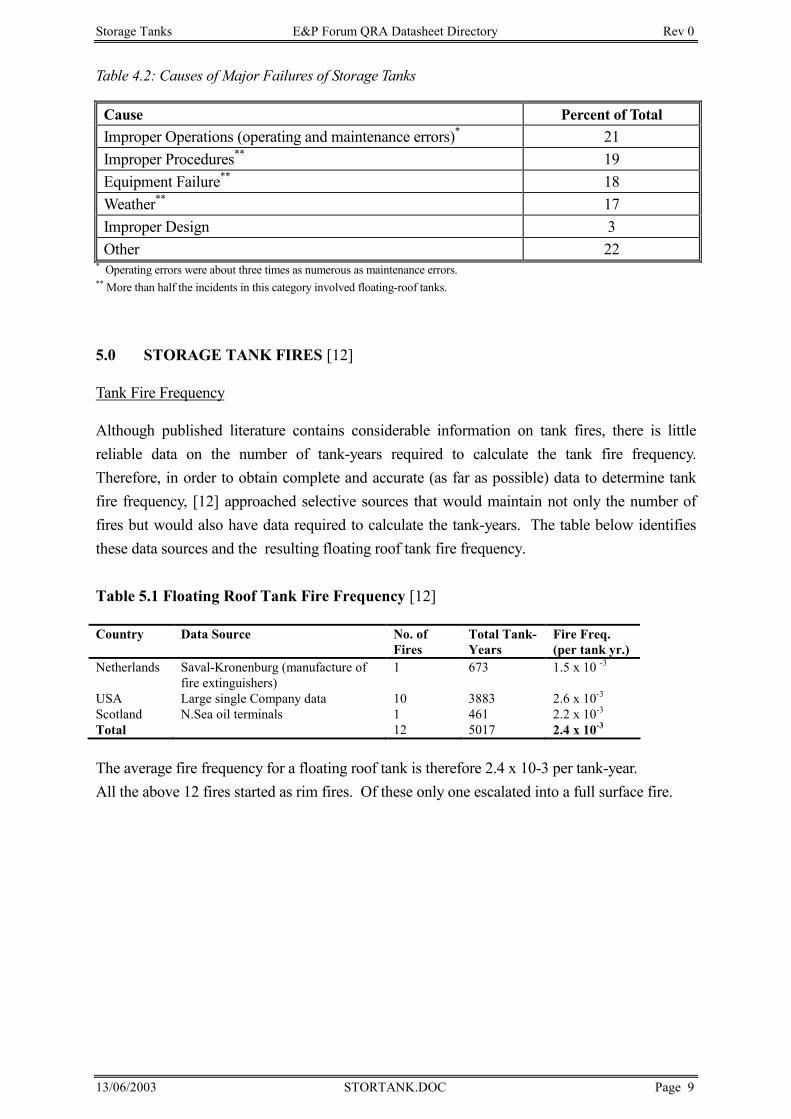
Storage Tanks E&P Forum QRA Datasheet Directory Rev 0
13/06/2003 STORTANK.DOC Page 9
Table 4.2: Causes of Major Failures of Storage Tanks
Cause Percent of Total Improper Operations (operating and maintenance errors)* 21 Improper Procedures** 19 Equipment Failure** 18 Weather** 17 Improper Design 3 Other 22
* Operating errors were about three times as numerous as maintenance errors. ** More than half the incidents in this category involved floating-roof tanks.
5.0 STORAGE TANK FIRES [12] Tank Fire Frequency
Although published literature contains considerable information on tank fires, there is little reliable data on the number of tank-years required to calculate the tank fire frequency. Therefore, in order to obtain complete and accurate (as far as possible) data to determine tank fire frequency, [12] approached selective sources that would maintain not only the number of fires but would also have data required to calculate the tank-years. The table below identifies these data sources and the resulting floating roof tank fire frequency. Table 5.1 Floating Roof Tank Fire Frequency [12]
Country Data Source No. of Fires
Total Tank-Years
Fire Freq. (per tank yr.)
Netherlands Saval-Kronenburg (manufacture of fire extinguishers)
1 673 1.5 x 10 -3
USA Large single Company data 10 3883 2.6 x 10⁻³ Scotland N.Sea oil terminals 1 461 2.2 x 10⁻³ Total 12 5017 2.4 x 10⁻³
The average fire frequency for a floating roof tank is therefore 2.4 x 10⁻³ per tank-year. All the above 12 fires started as rim fires. Of these only one escalated into a full surface fire.
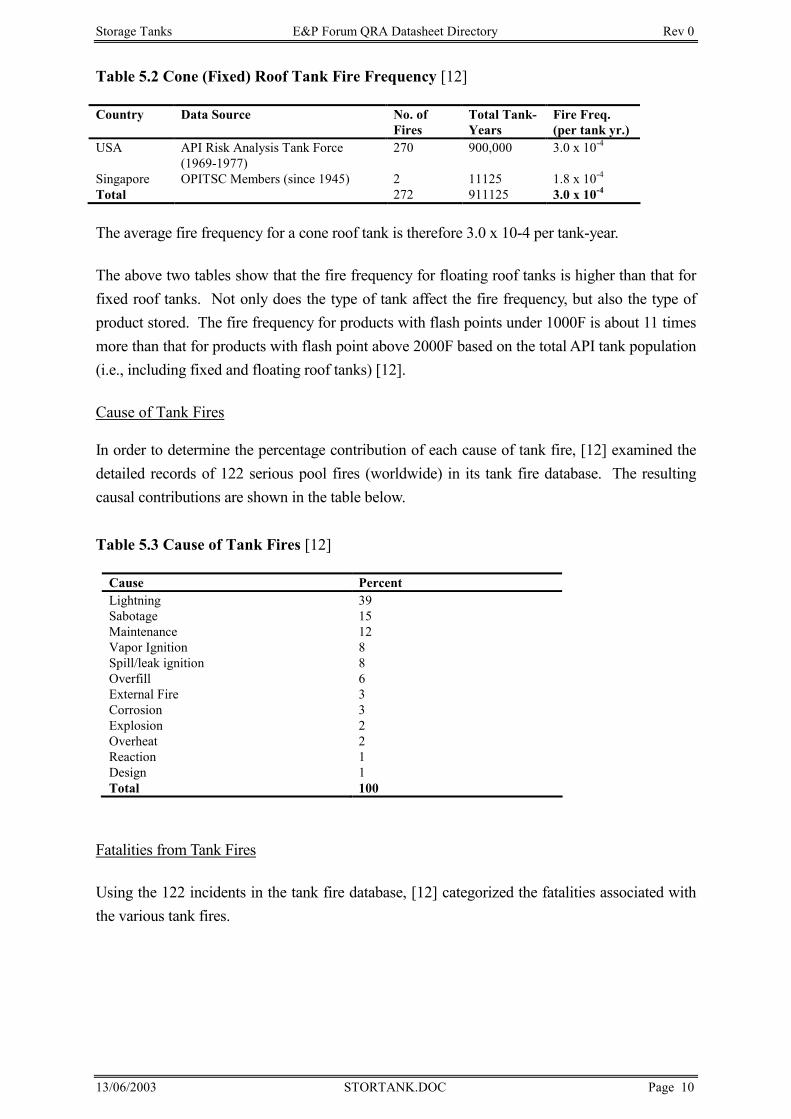
Storage Tanks E&P Forum QRA Datasheet Directory Rev 0
13/06/2003 STORTANK.DOC Page 10
Table 5.2 Cone (Fixed) Roof Tank Fire Frequency [12]
Country Data Source No. of Fires
Total Tank-Years
Fire Freq. (per tank yr.)
USA API Risk Analysis Tank Force (1969-1977)
270 900,000 3.0 x 10⁻⁴
Singapore OPITSC Members (since 1945) 2 11125 1.8 x 10⁻⁴
Total 272 911125 3.0 x 10⁻⁴
The average fire frequency for a cone roof tank is therefore 3.0 x 10⁻⁴ per tank-year. The above two tables show that the fire frequency for floating roof tanks is higher than that for fixed roof tanks. Not only does the type of tank affect the fire frequency, but also the type of product stored. The fire frequency for products with flash points under 1000F is about 11 times more than that for products with flash point above 2000F based on the total API tank population (i.e., including fixed and floating roof tanks) [12]. Cause of Tank Fires
In order to determine the percentage contribution of each cause of tank fire, [12] examined the detailed records of 122 serious pool fires (worldwide) in its tank fire database. The resulting causal contributions are shown in the table below. Table 5.3 Cause of Tank Fires [12]
Cause Percent Lightning 39 Sabotage 15 Maintenance 12 Vapor Ignition 8 Spill/leak ignition 8 Overfill 6 External Fire 3 Corrosion 3 Explosion 2 Overheat 2 Reaction 1 Design 1 Total 100
Fatalities from Tank Fires
Using the 122 incidents in the tank fire database, [12] categorized the fatalities associated with the various tank fires.
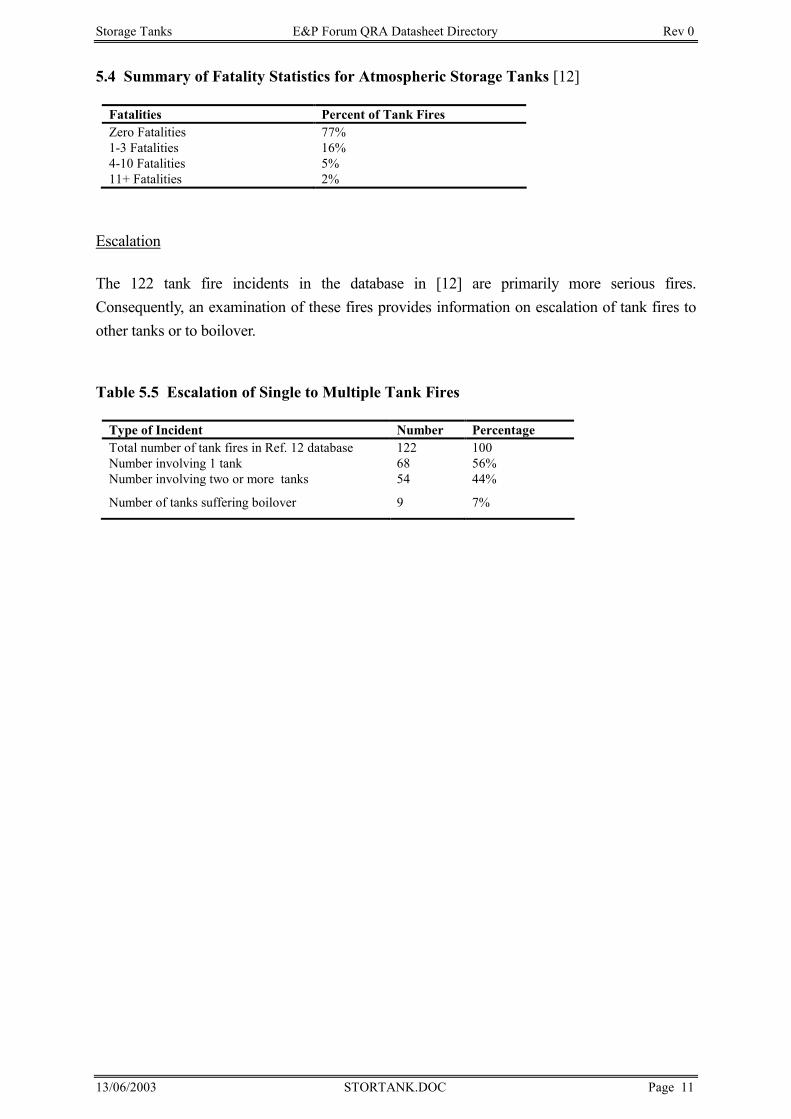
Storage Tanks E&P Forum QRA Datasheet Directory Rev 0
13/06/2003 STORTANK.DOC Page 11
5.4 Summary of Fatality Statistics for Atmospheric Storage Tanks [12]
Fatalities Percent of Tank Fires Zero Fatalities 77% 1-3 Fatalities 16% 4-10 Fatalities 5% 11+ Fatalities 2%
Escalation
The 122 tank fire incidents in the database in [12] are primarily more serious fires. Consequently, an examination of these fires provides information on escalation of tank fires to other tanks or to boilover.
Table 5.5 Escalation of Single to Multiple Tank Fires
Type of Incident Number Percentage Total number of tank fires in Ref. 12 database 122 100 Number involving 1 tank 68 56% Number involving two or more tanks 54 44%
Number of tanks suffering boilover 9 7%
Storage Tanks E&P Forum QRA Datasheet Directory Rev 0
13/06/2003 STORTANK.DOC Page 12
6. REFERENCES 1. R. A. Christensen and R. F. Eilbert, Aboveground Storage Tank Survey, EL RN-623,
Entropy Limited, Lincoln, MA, 1989. 2. Cremer and Warner, Ltd., Risk Analysis of Six Potentially Hazardous Industrial Objects in
the Rijnmond Area _ A Pilot Study for the Covo Steering Committee, D. Reide Publishing Company, Dordrecht, Holland, 1982.
3. D. W. Johnson and J. R. Welker, Development of an Improved LNG Plant Failure Rate Data Base, Gas Research Institute, Chicago, IL, 1981.
4. GENDATA, Issue 1, Systems Reliability Service, United Kingdom Atomic Energy Authority, Culcheth, Warrington, ENGLAND WA3 4NE.
5. W. Denson, et al., Nonelectric Parts Reliability Data, Reliability Analysis Center, Rome, NY, 1991.
6. G. Chandler, et al., Failure Mode/Mechanisms Distributions, Reliability Analysis Center, Rome, NY, 1991.
7. R. W. Lauben and D. L. Robinson, "Acoustic Emission Integrity of Above Ground Storage Tanks," PWR-Vol. 5, Proceedings of the Industrial Power Conference, ASME, 1989.
8. P. Crow, "Limiting tank leaks," Oil & Gas Journal, September 19, 1994. 9. D. G. Mahoney, Large Property Damage Losses in the Hydrocarbon-Chemical Industries,
A Thirty Year Review, Fourteenth Edition, M&M Protection Consultants, New York, NY, 1992.
10. D. G. Mahoney, Large Property Damage Losses in the Hydrocarbon-Chemical Industries,A Thirty Year Review, Fifteenth Edition, M&M Protection Consultants, New York, NY, 1993.
11. API, Safety Digest of Lessons Learned, Section 6, Safe Operation of Storage Facilities,American Petroleum Institute, 1982.
12. “Atmospheric Storage Tank Study for Oil and Petrochemical Industries Technical and Safety Committee Singapore”, by Technica Ltd, London, April 1990.

Storage Tanks E&P Forum QRA Datasheet Directory Rev 0
13/06/2003 STORTANK.DOC Page 13

Blowouts E&P Forum QRA Directory Rev 0
13/06/2003 BLOWOUTS.DOC Page 1
BLOWOUTS
Blowouts E&P Forum QRA Directory Rev 0
13/06/2003 BLOWOUTS.DOC Page 2
TABLE OF CONTENTS
1. DEFINITIONS----------------------------------------------------------------------------------------- 3
2.1 Offshore-----------------------------------------------------------------------------------------------------------------4
2.2 Onshore -----------------------------------------------------------------------------------------------------------------6
2.3 Regulatory Bodies-----------------------------------------------------------------------------------------------------6
3. BLOWOUT FREQUENCY ESTIMATION ----------------------------------------------------------------------7
3.1 Offshore - Joint Industry Project (Scandpower) [1] -----------------------------------------------------------7
3.2 Offshore - US Studies-------------------------------------------------------------------------------------------------1
3.3 E&P Forum - Hydrocarbon Leak and Ignition Database [9]---------------------------------------------- 17
3.4 Onshore - US Studies ----------------------------------------------------------------------------------------------- 22
3.5 Onshore - ERCB Database ---------------------------------------------------------------------------------------- 23
REFERENCES----------------------------------------------------------------------------------------- 24
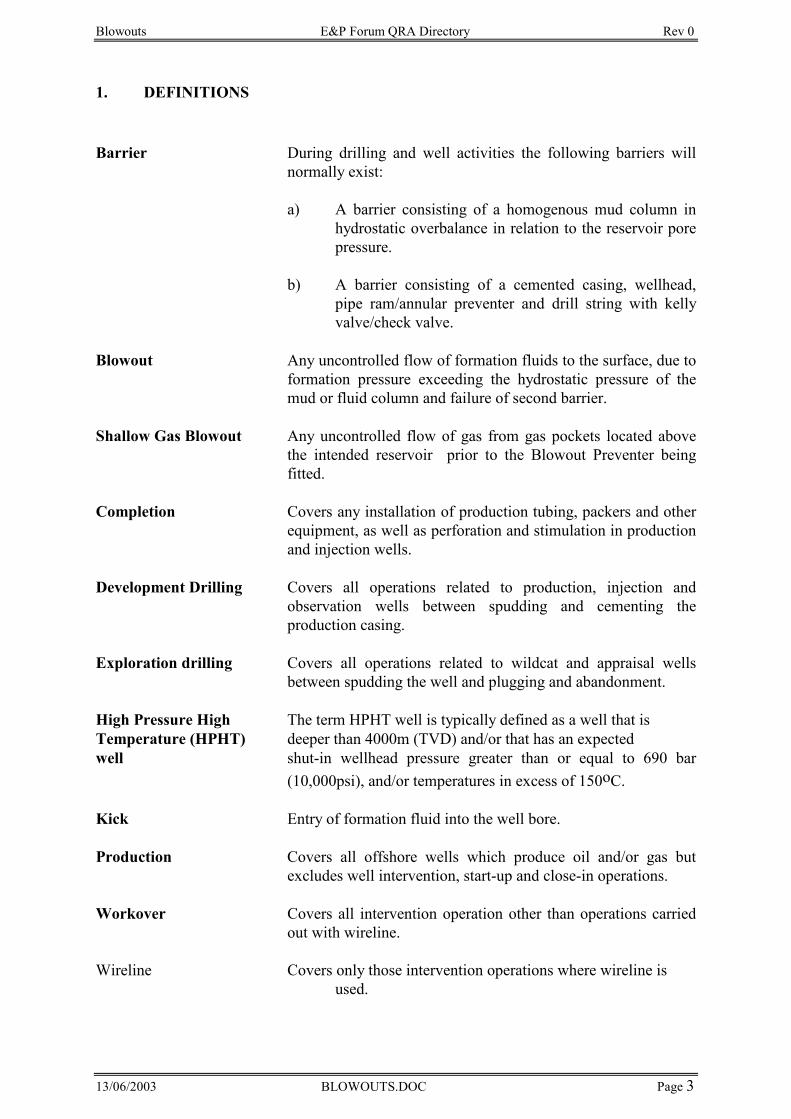
Blowouts E&P Forum QRA Directory Rev 0
13/06/2003 BLOWOUTS.DOC Page 3
1. DEFINITIONS
Barrier During drilling and well activities the following barriers will normally exist:
a) A barrier consisting of a homogenous mud column in
hydrostatic overbalance in relation to the reservoir pore pressure.
b) A barrier consisting of a cemented casing, wellhead,
pipe ram/annular preventer and drill string with kelly valve/check valve.
Blowout Any uncontrolled flow of formation fluids to the surface, due to
formation pressure exceeding the hydrostatic pressure of the mud or fluid column and failure of second barrier.
Shallow Gas Blowout Any uncontrolled flow of gas from gas pockets located above
the intended reservoir prior to the Blowout Preventer being fitted.
Completion Covers any installation of production tubing, packers and other
equipment, as well as perforation and stimulation in production and injection wells.
Development Drilling Covers all operations related to production, injection and
observation wells between spudding and cementing the production casing.
Exploration drilling Covers all operations related to wildcat and appraisal wells
between spudding the well and plugging and abandonment. High Pressure High The term HPHT well is typically defined as a well that is Temperature (HPHT) deeper than 4000m (TVD) and/or that has an expected well shut-in wellhead pressure greater than or equal to 690 bar
(10,000psi), and/or temperatures in excess of 150oC. Kick Entry of formation fluid into the well bore. Production Covers all offshore wells which produce oil and/or gas but
excludes well intervention, start-up and close-in operations. Workover Covers all intervention operation other than operations carried
out with wireline. Wireline Covers only those intervention operations where wireline is used.
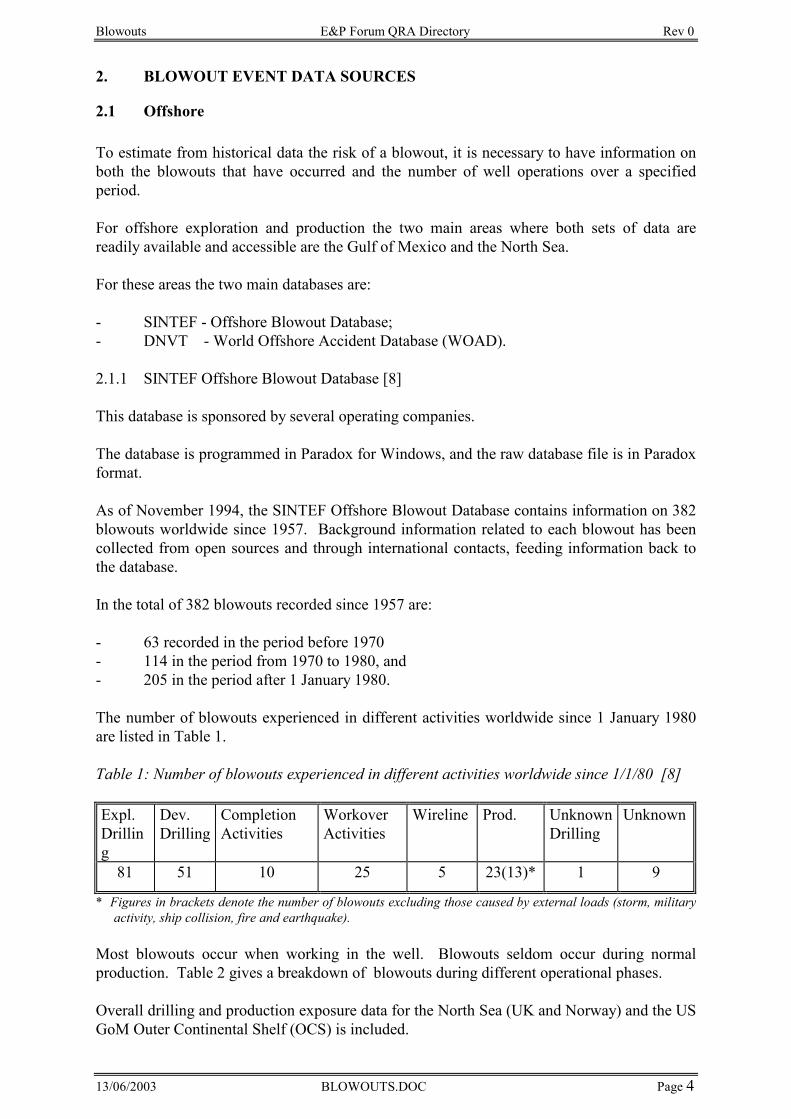
Blowouts E&P Forum QRA Directory Rev 0
13/06/2003 BLOWOUTS.DOC Page 4
2. BLOWOUT EVENT DATA SOURCES
2.1 Offshore To estimate from historical data the risk of a blowout, it is necessary to have information on both the blowouts that have occurred and the number of well operations over a specified period. For offshore exploration and production the two main areas where both sets of data are readily available and accessible are the Gulf of Mexico and the North Sea. For these areas the two main databases are: - SINTEF - Offshore Blowout Database; - DNVT - World Offshore Accident Database (WOAD). 2.1.1 SINTEF Offshore Blowout Database [8] This database is sponsored by several operating companies. The database is programmed in Paradox for Windows, and the raw database file is in Paradox format. As of November 1994, the SINTEF Offshore Blowout Database contains information on 382 blowouts worldwide since 1957. Background information related to each blowout has been collected from open sources and through international contacts, feeding information back to the database. In the total of 382 blowouts recorded since 1957 are: - 63 recorded in the period before 1970 - 114 in the period from 1970 to 1980, and - 205 in the period after 1 January 1980. The number of blowouts experienced in different activities worldwide since 1 January 1980 are listed in Table 1. Table 1: Number of blowouts experienced in different activities worldwide since 1/1/80 [8] Expl. Drilling
Dev. Drilling
Completion Activities
Workover Activities
Wireline Prod. Unknown Drilling
Unknown
81 51 10 25 5 23(13)* 1 9
* Figures in brackets denote the number of blowouts excluding those caused by external loads (storm, military activity, ship collision, fire and earthquake).
Most blowouts occur when working in the well. Blowouts seldom occur during normal production. Table 2 gives a breakdown of blowouts during different operational phases. Overall drilling and production exposure data for the North Sea (UK and Norway) and the US GoM Outer Continental Shelf (OCS) is included.
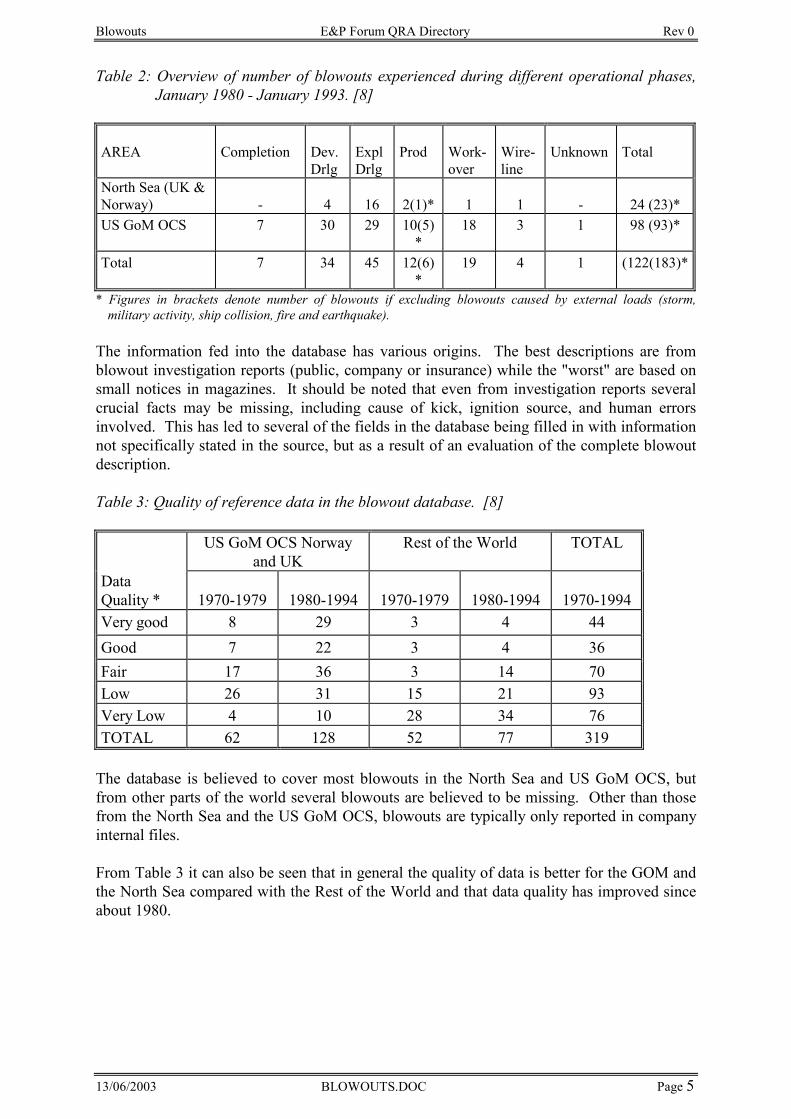
Blowouts E&P Forum QRA Directory Rev 0
13/06/2003 BLOWOUTS.DOC Page 5
Table 2: Overview of number of blowouts experienced during different operational phases, January 1980 - January 1993. [8]
AREA Completion
Dev. Drlg
ExplDrlg
Prod
Work-over
Wire-line
Unknown
Total
North Sea (UK & Norway)
- 4 16
2(1)*
1 1 - 24 (23)*
US GoM OCS 7 30 29 10(5)*
18 3 1 98 (93)*
Total 7 34 45 12(6)*
19 4 1 (122(183)*
* Figures in brackets denote number of blowouts if excluding blowouts caused by external loads (storm, military activity, ship collision, fire and earthquake).
The information fed into the database has various origins. The best descriptions are from blowout investigation reports (public, company or insurance) while the "worst" are based on small notices in magazines. It should be noted that even from investigation reports several crucial facts may be missing, including cause of kick, ignition source, and human errors involved. This has led to several of the fields in the database being filled in with information not specifically stated in the source, but as a result of an evaluation of the complete blowout description. Table 3: Quality of reference data in the blowout database. [8]
US GoM OCS Norway and UK
Rest of the World TOTAL
Data Quality *
1970-1979
1980-1994
1970-1979
1980-1994
1970-1994
Very good 8 29 3 4 44 Good 7 22 3 4 36 Fair 17 36 3 14 70 Low 26 31 15 21 93 Very Low 4 10 28 34 76 TOTAL 62 128 52 77 319
The database is believed to cover most blowouts in the North Sea and US GoM OCS, but from other parts of the world several blowouts are believed to be missing. Other than those from the North Sea and the US GoM OCS, blowouts are typically only reported in company internal files. From Table 3 it can also be seen that in general the quality of data is better for the GOM and the North Sea compared with the Rest of the World and that data quality has improved since about 1980.
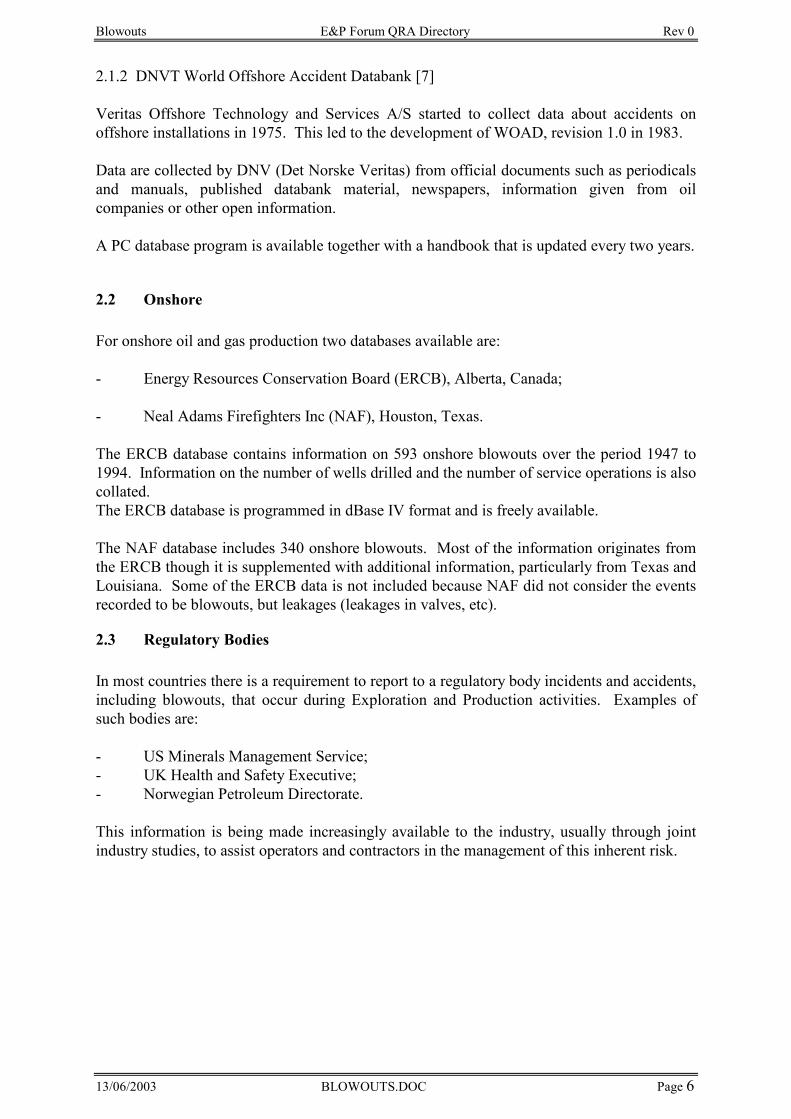
Blowouts E&P Forum QRA Directory Rev 0
13/06/2003 BLOWOUTS.DOC Page 6
2.1.2 DNVT World Offshore Accident Databank [7] Veritas Offshore Technology and Services A/S started to collect data about accidents on offshore installations in 1975. This led to the development of WOAD, revision 1.0 in 1983. Data are collected by DNV (Det Norske Veritas) from official documents such as periodicals and manuals, published databank material, newspapers, information given from oil companies or other open information. A PC database program is available together with a handbook that is updated every two years.
2.2 Onshore For onshore oil and gas production two databases available are: - Energy Resources Conservation Board (ERCB), Alberta, Canada; - Neal Adams Firefighters Inc (NAF), Houston, Texas. The ERCB database contains information on 593 onshore blowouts over the period 1947 to 1994. Information on the number of wells drilled and the number of service operations is also collated. The ERCB database is programmed in dBase IV format and is freely available. The NAF database includes 340 onshore blowouts. Most of the information originates from the ERCB though it is supplemented with additional information, particularly from Texas and Louisiana. Some of the ERCB data is not included because NAF did not consider the events recorded to be blowouts, but leakages (leakages in valves, etc).
2.3 Regulatory Bodies In most countries there is a requirement to report to a regulatory body incidents and accidents, including blowouts, that occur during Exploration and Production activities. Examples of such bodies are: - US Minerals Management Service; - UK Health and Safety Executive; - Norwegian Petroleum Directorate. This information is being made increasingly available to the industry, usually through joint industry studies, to assist operators and contractors in the management of this inherent risk.
Blowouts E&P Forum QRA Directory Rev 0
13/06/2003 BLOWOUTS.DOC Page 7
3. BLOWOUT FREQUENCY ESTIMATION
3.1 Offshore - Joint Industry Project (Scandpower) [1] From the information collated in the databases referenced in Section 2.1 it is possible to obtain a coarse estimate of historical blowout frequencies. In 1993 Scandpower A/S were sponsored by a group of operators to undertake a rigorous assessment of blowout frequencies with the following objectives: - identify and document changes in the technology and operational procedures used
over the last 10-15 years during the different drilling and well intervention activities; - identify and describe the parameters which are significant contributors to the
probability of a blowout; - to develop a differentiated PC-model for estimating site specific blowout frequencies. Two phases of the work programme have been completed with a third phase in 1995. 3.1.1 Blowout Frequency Scandpower carried out a comparison of the SINTEF and WOAD databases. A number of discrepancies were identified which have largely been resolved. The SINTEF database was selected for the work for exploration drilling, development drilling, completions, production, workover and wireline. Tables 4 - 9 give the estimated blowout frequencies. Figures 1 and 2 give a predicted regression line for exploration and development drilling. For exploration and development drilling the blowout frequencies are divided into shallow gas and deep hole blowout frequency .
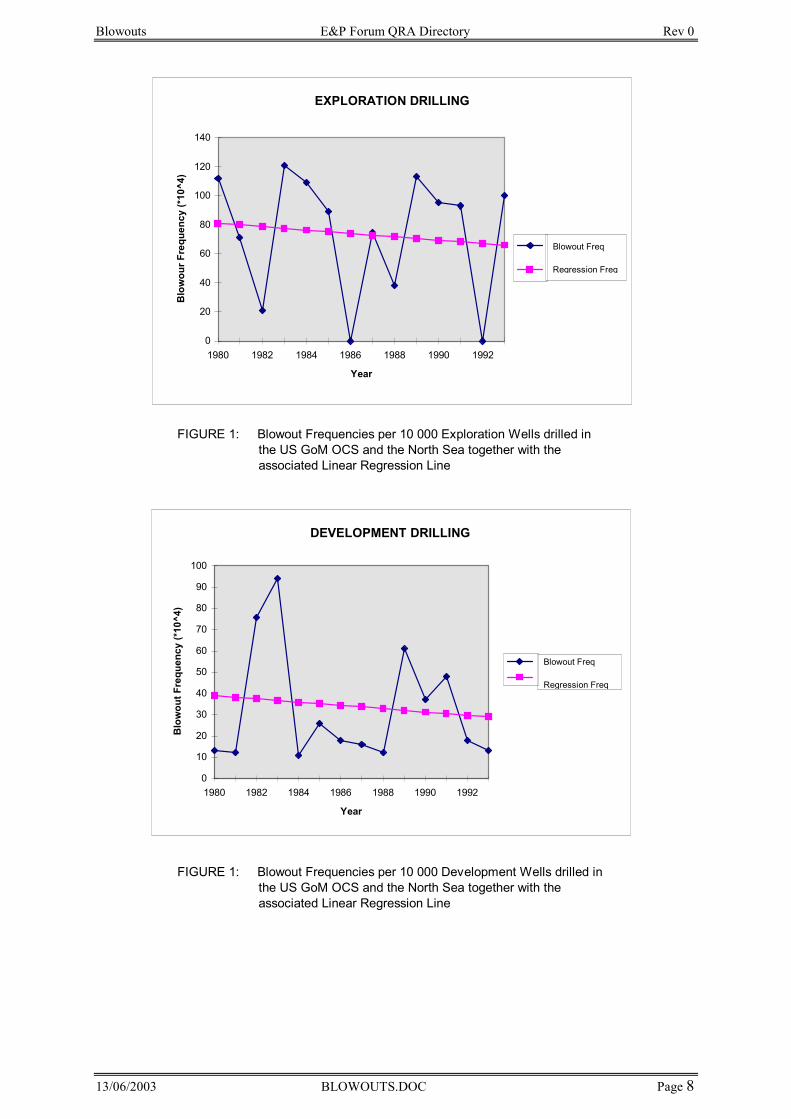
Blowouts E&P Forum QRA Directory Rev 0
13/06/2003 BLOWOUTS.DOC Page 8
FIGURE 1: Blowout Frequencies per 10 000 Exploration Wells drilled in the US GoM OCS and the North Sea together with the associated Linear Regression Line
FIGURE 1: Blowout Frequencies per 10 000 Development Wells drilled in the US GoM OCS and the North Sea together with the associated Linear Regression Line
DEVELOPMENT DRILLING
0
10
20
30
40
50
60
70
80
90
100
1980 1982 1984 1986 1988 1990 1992
Year
Blo
wou
tFre
quen
cy(*
10^4
)
Blowout Freq
Regression Freq
EXPLORATION DRILLING
0
20
40
60
80
100
120
140
1980 1982 1984 1986 1988 1990 1992
Year
Blo
wou
rFre
quen
cy(*
10^4
)
Blowout Freq
Regression Freq
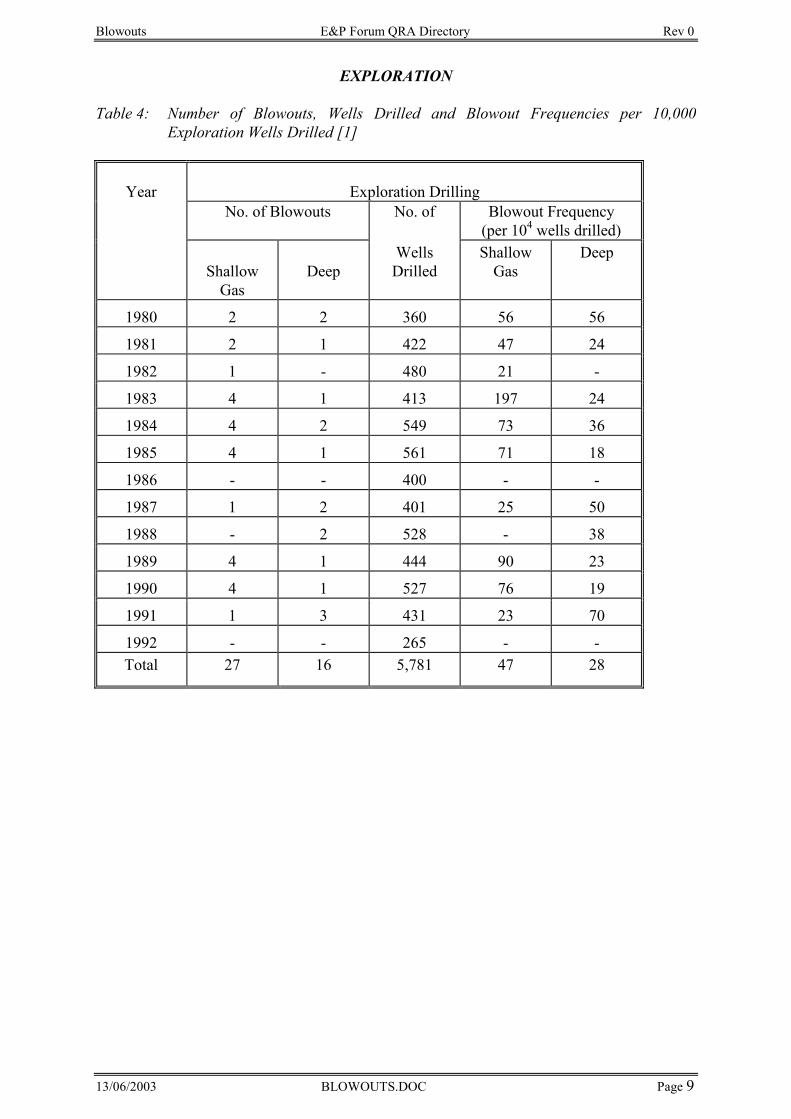
Blowouts E&P Forum QRA Directory Rev 0
13/06/2003 BLOWOUTS.DOC Page 9
EXPLORATION Table 4: Number of Blowouts, Wells Drilled and Blowout Frequencies per 10,000
Exploration Wells Drilled [1]
Year
Exploration Drilling No. of Blowouts No. of Blowout Frequency
(per 104 wells drilled)
Shallow Gas
Deep
Wells Drilled
Shallow Gas
Deep
1980 2 2 360 56 56
1981 2 1 422 47 24
1982 1 - 480 21 -
1983 4 1 413 197 24
1984 4 2 549 73 36
1985 4 1 561 71 18
1986 - - 400 - -
1987 1 2 401 25 50
1988 - 2 528 - 38
1989 4 1 444 90 23
1990 4 1 527 76 19
1991 1 3 431 23 70
1992 - - 265 - - Total 27 16 5,781 47 28
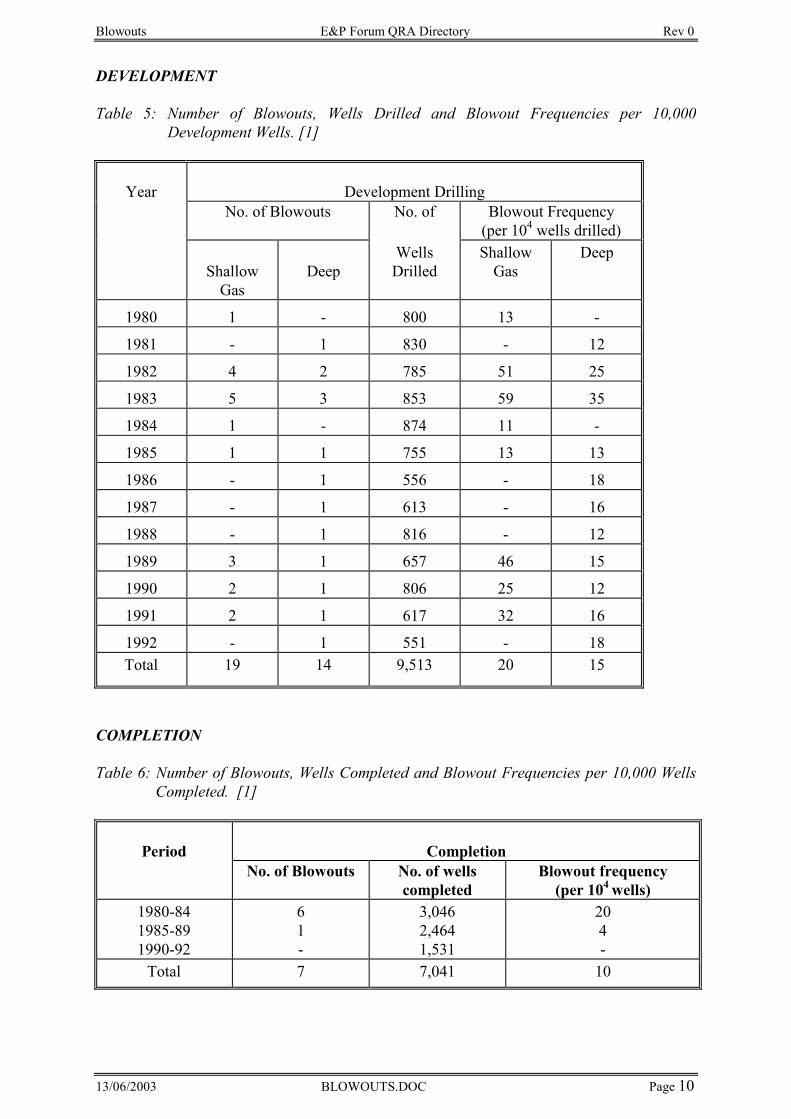
Blowouts E&P Forum QRA Directory Rev 0
13/06/2003 BLOWOUTS.DOC Page 10
DEVELOPMENT Table 5: Number of Blowouts, Wells Drilled and Blowout Frequencies per 10,000
Development Wells. [1]
Year
Development Drilling No. of Blowouts No. of Blowout Frequency
(per 104 wells drilled)
Shallow Gas
Deep
Wells Drilled
Shallow Gas
Deep
1980 1 - 800 13 -
1981 - 1 830 - 12
1982 4 2 785 51 25
1983 5 3 853 59 35
1984 1 - 874 11 -
1985 1 1 755 13 13
1986 - 1 556 - 18
1987 - 1 613 - 16
1988 - 1 816 - 12
1989 3 1 657 46 15
1990 2 1 806 25 12
1991 2 1 617 32 16
1992 - 1 551 - 18 Total 19 14 9,513 20 15
COMPLETION
Table 6: Number of Blowouts, Wells Completed and Blowout Frequencies per 10,000 Wells Completed. [1]
Period
Completion No. of Blowouts No. of wells
completed Blowout frequency
(per 104 wells) 1980-84 1985-89 1990-92
61-
3,046 2,464 1,531
20 4-
Total 7 7,041 10
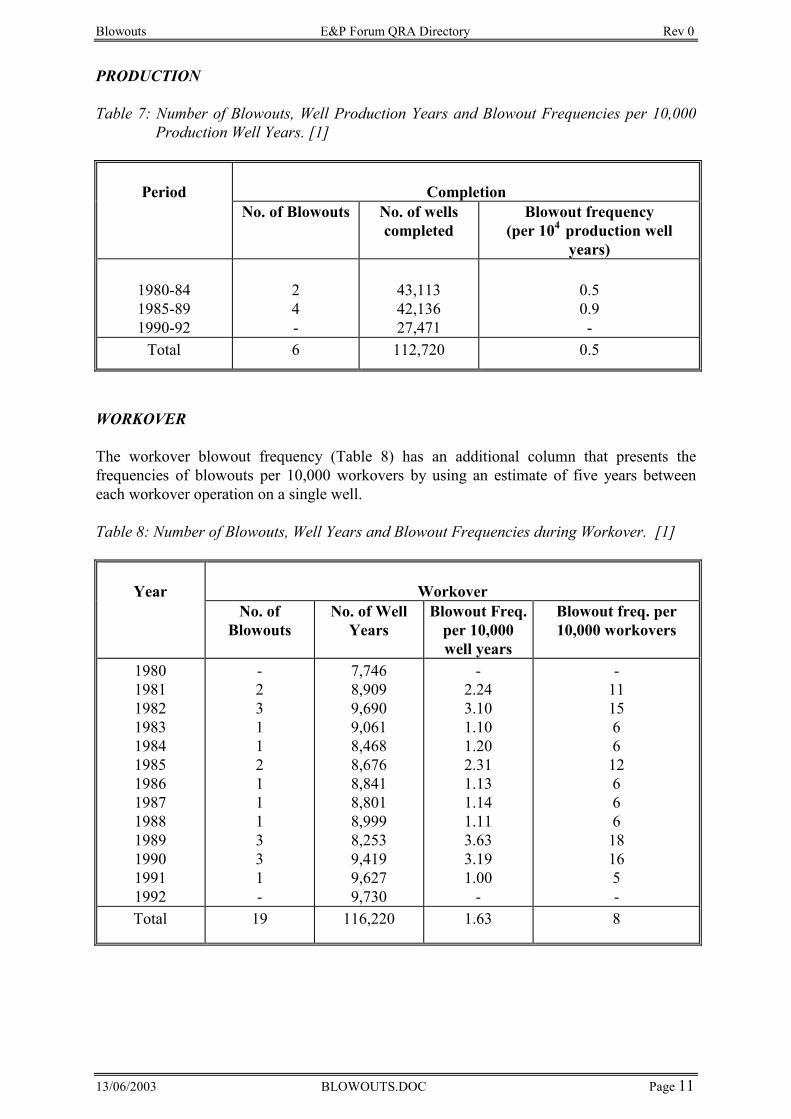
Blowouts E&P Forum QRA Directory Rev 0
13/06/2003 BLOWOUTS.DOC Page 11
PRODUCTION Table 7: Number of Blowouts, Well Production Years and Blowout Frequencies per 10,000
Production Well Years. [1]
Period
Completion No. of Blowouts No. of wells
completed Blowout frequency
(per 104 production well years)
1980-84 1985-89 1990-92
24-
43,113 42,136 27,471
0.5 0.9 -
Total 6 112,720 0.5
WORKOVER The workover blowout frequency (Table 8) has an additional column that presents the frequencies of blowouts per 10,000 workovers by using an estimate of five years between each workover operation on a single well. Table 8: Number of Blowouts, Well Years and Blowout Frequencies during Workover. [1]
Year
Workover No. of
Blowouts No. of Well
Years Blowout Freq.
per 10,000 well years
Blowout freq. per 10,000 workovers
1980 1981 1982 1983 1984 1985 1986 1987 1988 1989 1990 1991 1992
-23112111331-
7,746 8,909 9,690 9,061 8,468 8,676 8,841 8,801 8,999 8,253 9,419 9,627 9,730
-2.24 3.10 1.10 1.20 2.31 1.13 1.14 1.11 3.63 3.19 1.00
-
-11 15 6612 66618 16 5-
Total 19 116,220 1.63 8
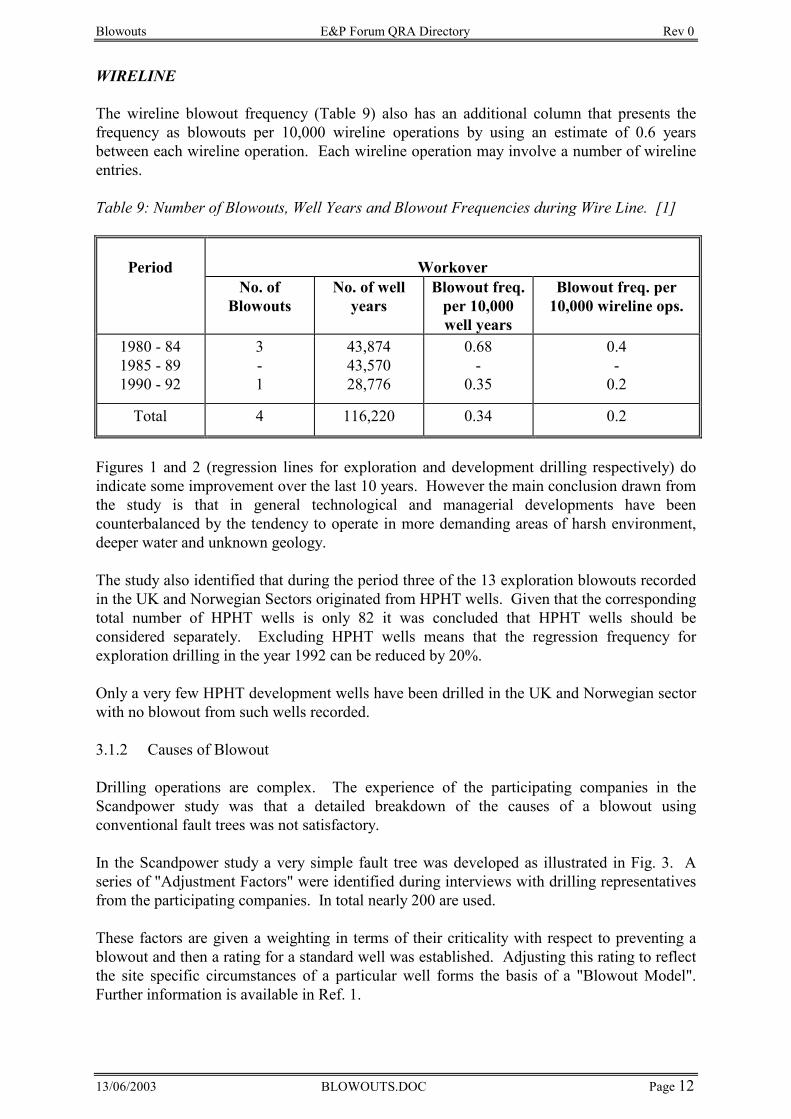
Blowouts E&P Forum QRA Directory Rev 0
13/06/2003 BLOWOUTS.DOC Page 12
WIRELINE The wireline blowout frequency (Table 9) also has an additional column that presents the frequency as blowouts per 10,000 wireline operations by using an estimate of 0.6 years between each wireline operation. Each wireline operation may involve a number of wireline entries. Table 9: Number of Blowouts, Well Years and Blowout Frequencies during Wire Line. [1]
Period
Workover No. of
Blowouts No. of well
years Blowout freq.
per 10,000 well years
Blowout freq. per 10,000 wireline ops.
1980 - 84 1985 - 89 1990 - 92
3-1
43,874 43,570 28,776
0.68 -
0.35
0.4 -
0.2
Total 4 116,220 0.34 0.2
Figures 1 and 2 (regression lines for exploration and development drilling respectively) do indicate some improvement over the last 10 years. However the main conclusion drawn from the study is that in general technological and managerial developments have been counterbalanced by the tendency to operate in more demanding areas of harsh environment, deeper water and unknown geology. The study also identified that during the period three of the 13 exploration blowouts recorded in the UK and Norwegian Sectors originated from HPHT wells. Given that the corresponding total number of HPHT wells is only 82 it was concluded that HPHT wells should be considered separately. Excluding HPHT wells means that the regression frequency for exploration drilling in the year 1992 can be reduced by 20%. Only a very few HPHT development wells have been drilled in the UK and Norwegian sector with no blowout from such wells recorded. 3.1.2 Causes of Blowout Drilling operations are complex. The experience of the participating companies in the Scandpower study was that a detailed breakdown of the causes of a blowout using conventional fault trees was not satisfactory. In the Scandpower study a very simple fault tree was developed as illustrated in Fig. 3. A series of "Adjustment Factors" were identified during interviews with drilling representatives from the participating companies. In total nearly 200 are used. These factors are given a weighting in terms of their criticality with respect to preventing a blowout and then a rating for a standard well was established. Adjusting this rating to reflect the site specific circumstances of a particular well forms the basis of a "Blowout Model". Further information is available in Ref. 1.
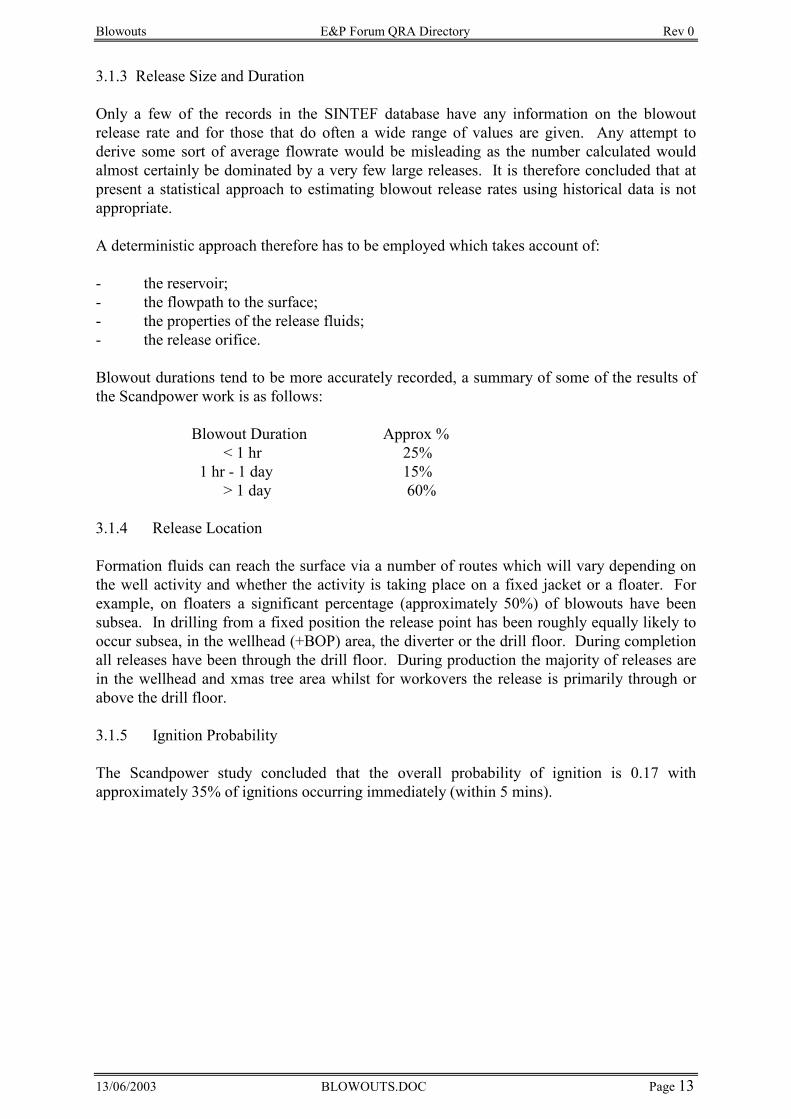
Blowouts E&P Forum QRA Directory Rev 0
13/06/2003 BLOWOUTS.DOC Page 13
3.1.3 Release Size and Duration Only a few of the records in the SINTEF database have any information on the blowout release rate and for those that do often a wide range of values are given. Any attempt to derive some sort of average flowrate would be misleading as the number calculated would almost certainly be dominated by a very few large releases. It is therefore concluded that at present a statistical approach to estimating blowout release rates using historical data is not appropriate. A deterministic approach therefore has to be employed which takes account of: - the reservoir; - the flowpath to the surface; - the properties of the release fluids; - the release orifice. Blowout durations tend to be more accurately recorded, a summary of some of the results of the Scandpower work is as follows:
Blowout Duration Approx % < 1 hr 25%
1 hr - 1 day 15% > 1 day 60% 3.1.4 Release Location Formation fluids can reach the surface via a number of routes which will vary depending on the well activity and whether the activity is taking place on a fixed jacket or a floater. For example, on floaters a significant percentage (approximately 50%) of blowouts have been subsea. In drilling from a fixed position the release point has been roughly equally likely to occur subsea, in the wellhead (+BOP) area, the diverter or the drill floor. During completion all releases have been through the drill floor. During production the majority of releases are in the wellhead and xmas tree area whilst for workovers the release is primarily through or above the drill floor. 3.1.5 Ignition Probability The Scandpower study concluded that the overall probability of ignition is 0.17 with approximately 35% of ignitions occurring immediately (within 5 mins).
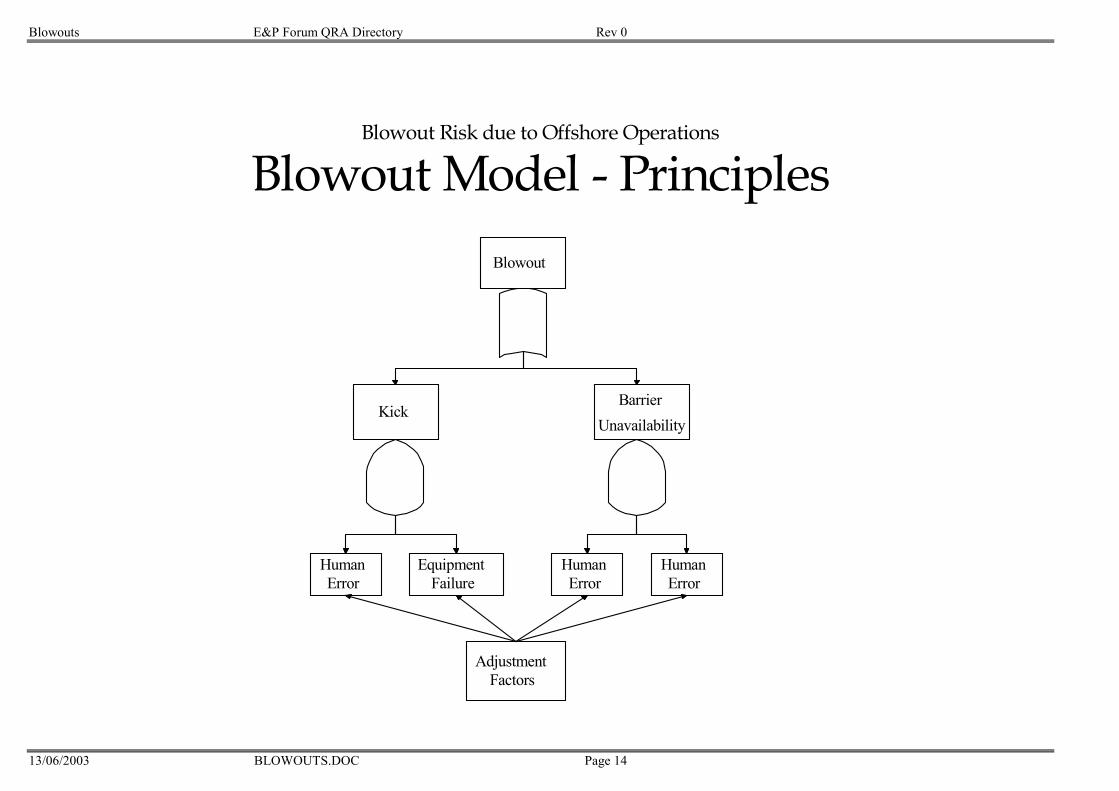
Blowouts E&P Forum QRA Directory Rev 0
13/06/2003 BLOWOUTS.DOC Page 14
Blowout Risk due to Offshore Operations
Blowout Model - PrinciplesBlowout
KickBarrier
Unavailability
HumanError
EquipmentFailure
HumanError
HumanError
AdjustmentFactors
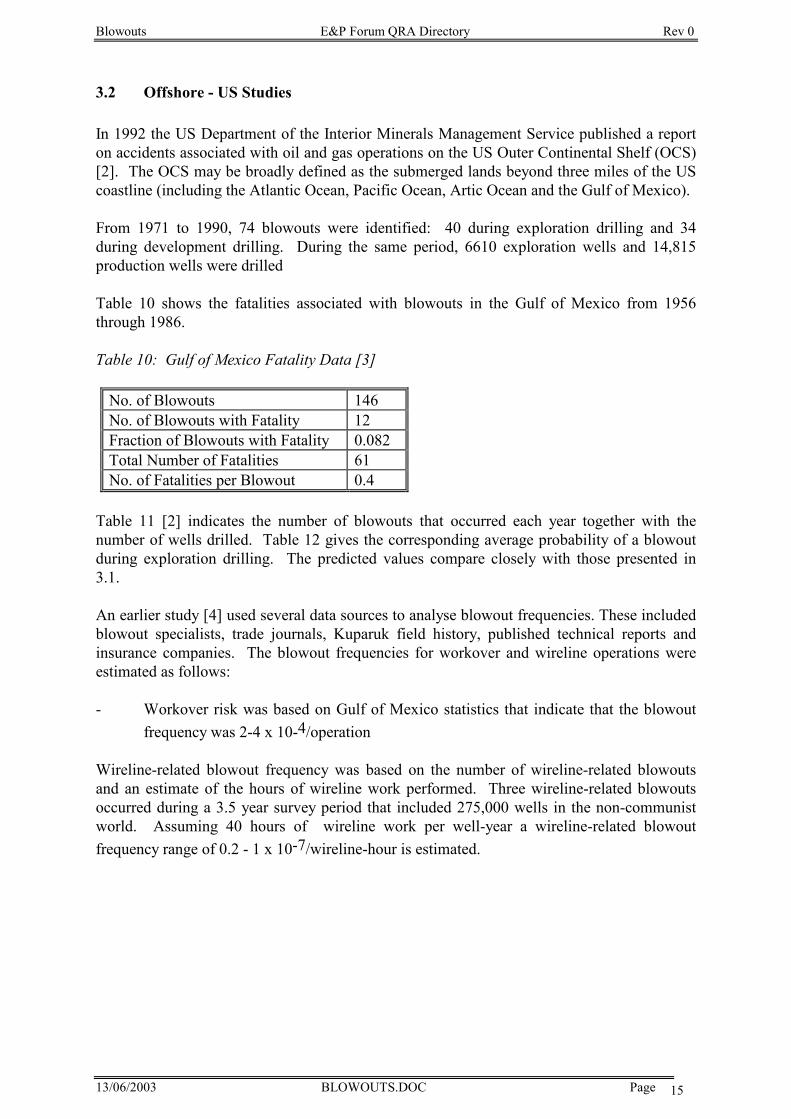
Blowouts E&P Forum QRA Directory Rev 0
13/06/2003 BLOWOUTS.DOC Page 15
3.2 Offshore - US Studies In 1992 the US Department of the Interior Minerals Management Service published a report on accidents associated with oil and gas operations on the US Outer Continental Shelf (OCS) [2]. The OCS may be broadly defined as the submerged lands beyond three miles of the US coastline (including the Atlantic Ocean, Pacific Ocean, Artic Ocean and the Gulf of Mexico). From 1971 to 1990, 74 blowouts were identified: 40 during exploration drilling and 34 during development drilling. During the same period, 6610 exploration wells and 14,815 production wells were drilled Table 10 shows the fatalities associated with blowouts in the Gulf of Mexico from 1956 through 1986. Table 10: Gulf of Mexico Fatality Data [3]
No. of Blowouts 146 No. of Blowouts with Fatality 12 Fraction of Blowouts with Fatality 0.082 Total Number of Fatalities 61 No. of Fatalities per Blowout 0.4
Table 11 [2] indicates the number of blowouts that occurred each year together with the number of wells drilled. Table 12 gives the corresponding average probability of a blowout during exploration drilling. The predicted values compare closely with those presented in 3.1. An earlier study [4] used several data sources to analyse blowout frequencies. These included blowout specialists, trade journals, Kuparuk field history, published technical reports and insurance companies. The blowout frequencies for workover and wireline operations were estimated as follows: - Workover risk was based on Gulf of Mexico statistics that indicate that the blowout
frequency was 2-4 x 10⁻⁴/operation Wireline-related blowout frequency was based on the number of wireline-related blowouts and an estimate of the hours of wireline work performed. Three wireline-related blowouts occurred during a 3.5 year survey period that included 275,000 wells in the non-communist world. Assuming 40 hours of wireline work per well-year a wireline-related blowout frequency range of 0.2 - 1 x 10⁻⁷/wireline-hour is estimated.
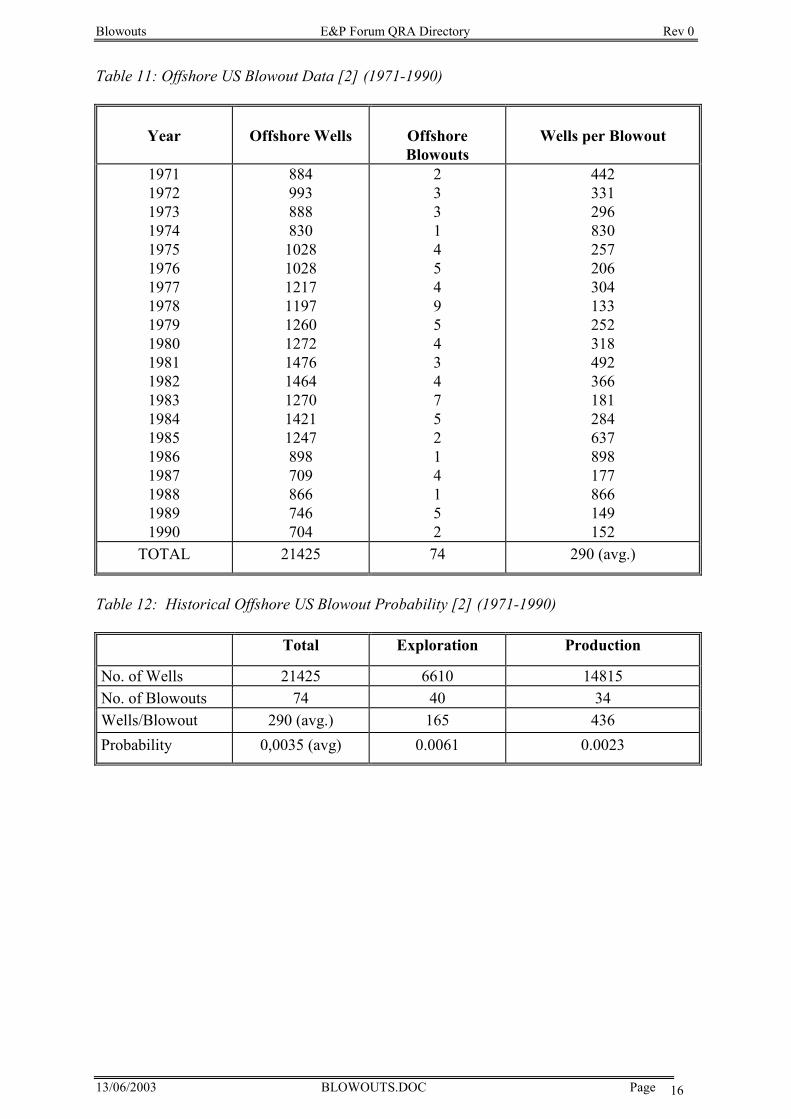
Blowouts E&P Forum QRA Directory Rev 0
13/06/2003 BLOWOUTS.DOC Page 16
Table 11: Offshore US Blowout Data [2] (1971-1990)
Year
Offshore Wells
Offshore Blowouts
Wells per Blowout
1971 1972 1973 1974 1975 1976 1977 1978 1979 1980 1981 1982 1983 1984 1985 1986 1987 1988 1989 1990
884 993 888 830 1028 1028 1217 1197 1260 1272 1476 1464 1270 1421 1247 898 709 866 746 704
23314549543475214152
442 331 296 830 257 206 304 133 252 318 492 366 181 284 637 898 177 866 149 152
TOTAL 21425 74 290 (avg.)
Table 12: Historical Offshore US Blowout Probability [2] (1971-1990)
Total Exploration Production
No. of Wells 21425 6610 14815 No. of Blowouts 74 40 34 Wells/Blowout 290 (avg.) 165 436 Probability 0,0035 (avg) 0.0061 0.0023
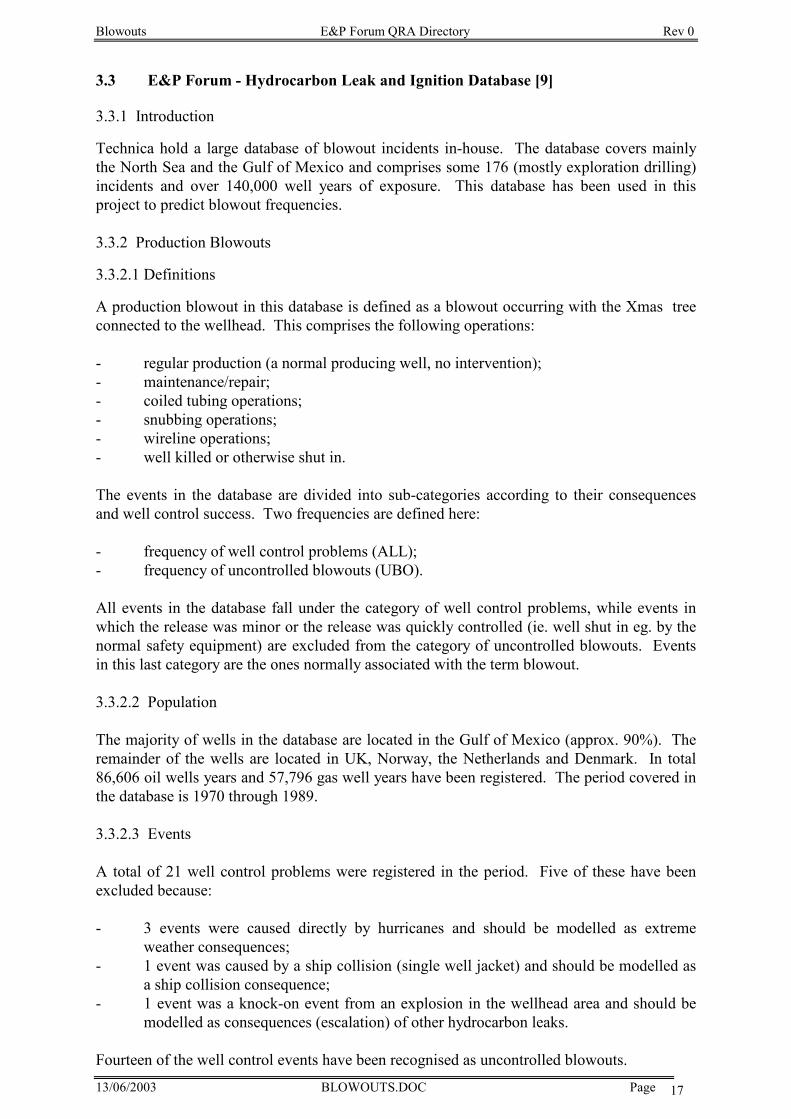
Blowouts E&P Forum QRA Directory Rev 0
13/06/2003 BLOWOUTS.DOC Page 17
3.3 E&P Forum - Hydrocarbon Leak and Ignition Database [9] 3.3.1 Introduction Technica hold a large database of blowout incidents in-house. The database covers mainly the North Sea and the Gulf of Mexico and comprises some 176 (mostly exploration drilling) incidents and over 140,000 well years of exposure. This database has been used in this project to predict blowout frequencies. 3.3.2 Production Blowouts 3.3.2.1 Definitions A production blowout in this database is defined as a blowout occurring with the Xmas tree connected to the wellhead. This comprises the following operations: - regular production (a normal producing well, no intervention); - maintenance/repair; - coiled tubing operations; - snubbing operations; - wireline operations; - well killed or otherwise shut in. The events in the database are divided into sub-categories according to their consequences and well control success. Two frequencies are defined here: - frequency of well control problems (ALL); - frequency of uncontrolled blowouts (UBO). All events in the database fall under the category of well control problems, while events in which the release was minor or the release was quickly controlled (ie. well shut in eg. by the normal safety equipment) are excluded from the category of uncontrolled blowouts. Events in this last category are the ones normally associated with the term blowout. 3.3.2.2 Population The majority of wells in the database are located in the Gulf of Mexico (approx. 90%). The remainder of the wells are located in UK, Norway, the Netherlands and Denmark. In total 86,606 oil wells years and 57,796 gas well years have been registered. The period covered in the database is 1970 through 1989. 3.3.2.3 Events A total of 21 well control problems were registered in the period. Five of these have been excluded because: - 3 events were caused directly by hurricanes and should be modelled as extreme
weather consequences; - 1 event was caused by a ship collision (single well jacket) and should be modelled as
a ship collision consequence; - 1 event was a knock-on event from an explosion in the wellhead area and should be
modelled as consequences (escalation) of other hydrocarbon leaks. Fourteen of the well control events have been recognised as uncontrolled blowouts.
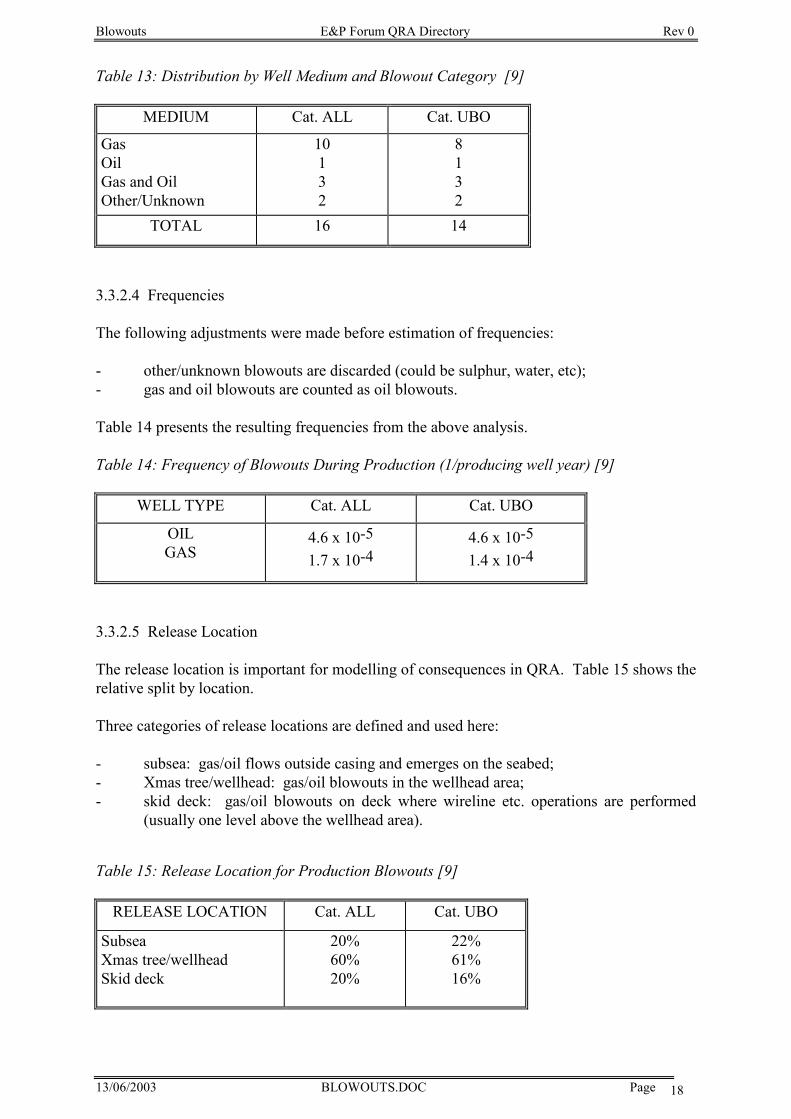
Blowouts E&P Forum QRA Directory Rev 0
13/06/2003 BLOWOUTS.DOC Page 18
Table 13: Distribution by Well Medium and Blowout Category [9]
MEDIUM Cat. ALL Cat. UBO
Gas Oil Gas and Oil Other/Unknown
10 132
8132
TOTAL 16 14
3.3.2.4 Frequencies The following adjustments were made before estimation of frequencies: - other/unknown blowouts are discarded (could be sulphur, water, etc); - gas and oil blowouts are counted as oil blowouts. Table 14 presents the resulting frequencies from the above analysis. Table 14: Frequency of Blowouts During Production (1/producing well year) [9]
WELL TYPE Cat. ALL Cat. UBO
OIL GAS
4.6 x 10⁻⁵ 1.7 x 10⁻⁴
4.6 x 10⁻⁵ 1.4 x 10⁻⁴
3.3.2.5 Release Location The release location is important for modelling of consequences in QRA. Table 15 shows the relative split by location. Three categories of release locations are defined and used here: - subsea: gas/oil flows outside casing and emerges on the seabed; - Xmas tree/wellhead: gas/oil blowouts in the wellhead area; - skid deck: gas/oil blowouts on deck where wireline etc. operations are performed
(usually one level above the wellhead area).
Table 15: Release Location for Production Blowouts [9]
RELEASE LOCATION Cat. ALL Cat. UBO
Subsea Xmas tree/wellhead Skid deck
20% 60% 20%
22% 61% 16%
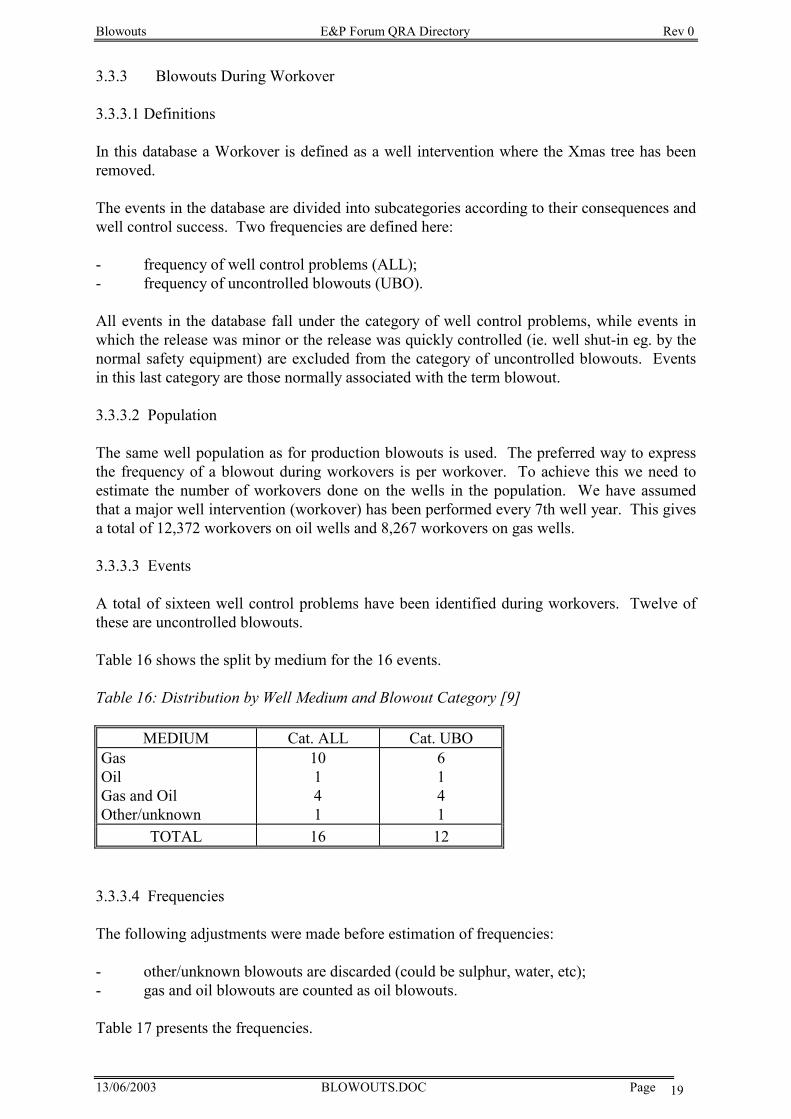
Blowouts E&P Forum QRA Directory Rev 0
13/06/2003 BLOWOUTS.DOC Page 19
3.3.3 Blowouts During Workover 3.3.3.1 Definitions In this database a Workover is defined as a well intervention where the Xmas tree has been removed. The events in the database are divided into subcategories according to their consequences and well control success. Two frequencies are defined here: - frequency of well control problems (ALL); - frequency of uncontrolled blowouts (UBO). All events in the database fall under the category of well control problems, while events in which the release was minor or the release was quickly controlled (ie. well shut-in eg. by the normal safety equipment) are excluded from the category of uncontrolled blowouts. Events in this last category are those normally associated with the term blowout. 3.3.3.2 Population The same well population as for production blowouts is used. The preferred way to express the frequency of a blowout during workovers is per workover. To achieve this we need to estimate the number of workovers done on the wells in the population. We have assumed that a major well intervention (workover) has been performed every 7th well year. This gives a total of 12,372 workovers on oil wells and 8,267 workovers on gas wells. 3.3.3.3 Events A total of sixteen well control problems have been identified during workovers. Twelve of these are uncontrolled blowouts. Table 16 shows the split by medium for the 16 events. Table 16: Distribution by Well Medium and Blowout Category [9]
MEDIUM Cat. ALL Cat. UBO Gas Oil Gas and Oil Other/unknown
10 141
6141
TOTAL 16 12
3.3.3.4 Frequencies The following adjustments were made before estimation of frequencies: - other/unknown blowouts are discarded (could be sulphur, water, etc); - gas and oil blowouts are counted as oil blowouts. Table 17 presents the frequencies.
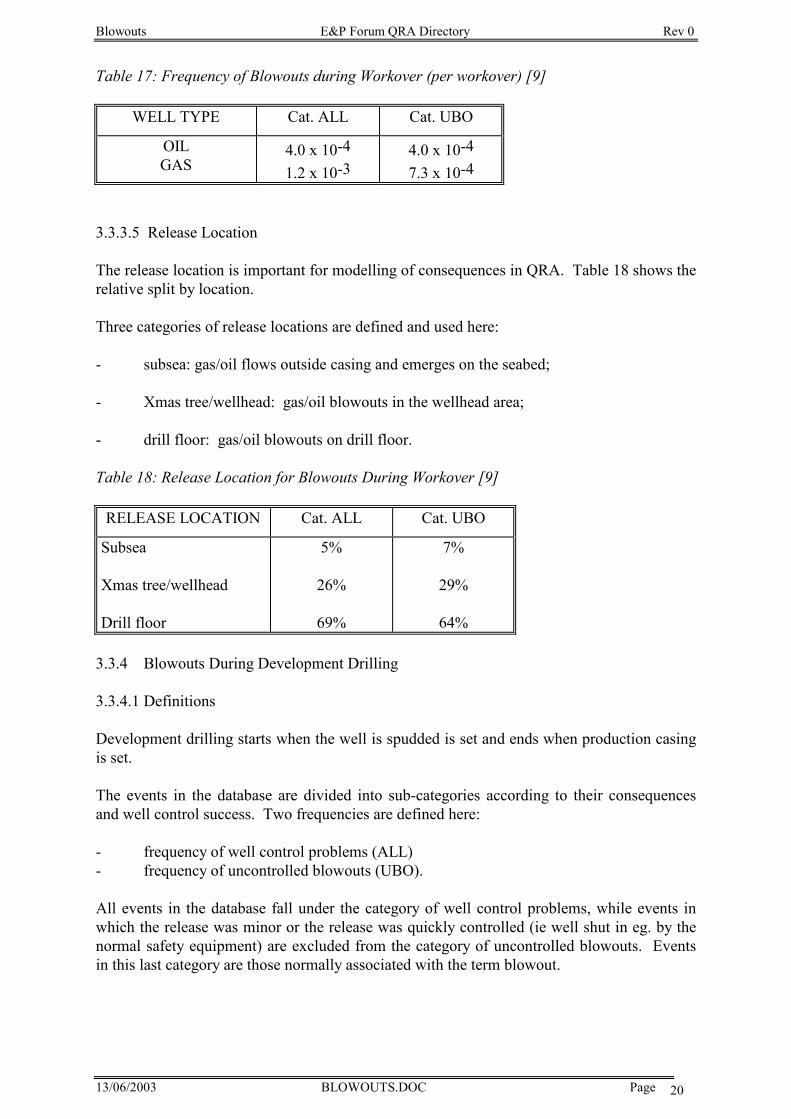
Blowouts E&P Forum QRA Directory Rev 0
13/06/2003 BLOWOUTS.DOC Page 20
Table 17: Frequency of Blowouts during Workover (per workover) [9]
WELL TYPE Cat. ALL Cat. UBO
OIL GAS
4.0 x 10⁻⁴ 1.2 x 10⁻³
4.0 x 10⁻⁴ 7.3 x 10⁻⁴
3.3.3.5 Release Location The release location is important for modelling of consequences in QRA. Table 18 shows the relative split by location. Three categories of release locations are defined and used here: - subsea: gas/oil flows outside casing and emerges on the seabed; - Xmas tree/wellhead: gas/oil blowouts in the wellhead area; - drill floor: gas/oil blowouts on drill floor. Table 18: Release Location for Blowouts During Workover [9]
RELEASE LOCATION Cat. ALL Cat. UBO
Subsea Xmas tree/wellhead Drill floor
5%
26%
69%
7%
29%
64%
3.3.4 Blowouts During Development Drilling 3.3.4.1 Definitions Development drilling starts when the well is spudded is set and ends when production casing is set. The events in the database are divided into sub-categories according to their consequences and well control success. Two frequencies are defined here: - frequency of well control problems (ALL) - frequency of uncontrolled blowouts (UBO). All events in the database fall under the category of well control problems, while events in which the release was minor or the release was quickly controlled (ie well shut in eg. by the normal safety equipment) are excluded from the category of uncontrolled blowouts. Events in this last category are those normally associated with the term blowout.
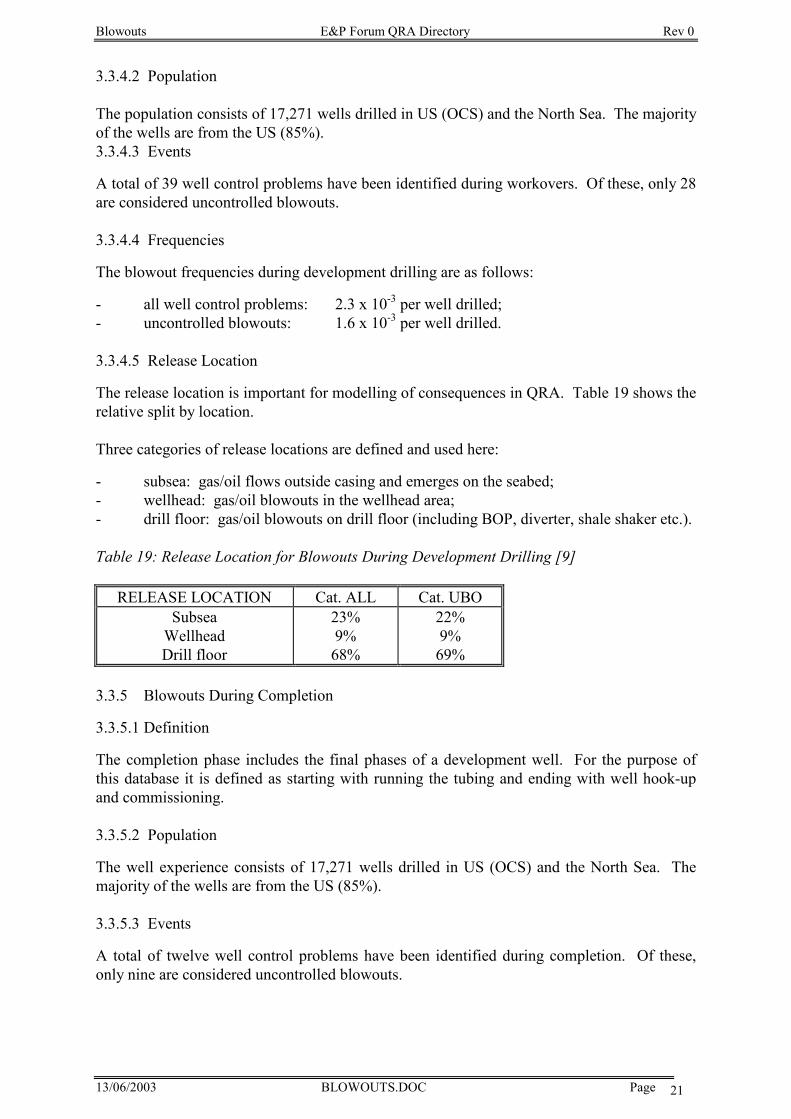
Blowouts E&P Forum QRA Directory Rev 0
13/06/2003 BLOWOUTS.DOC Page 21
3.3.4.2 Population The population consists of 17,271 wells drilled in US (OCS) and the North Sea. The majority of the wells are from the US (85%). 3.3.4.3 Events A total of 39 well control problems have been identified during workovers. Of these, only 28 are considered uncontrolled blowouts. 3.3.4.4 Frequencies The blowout frequencies during development drilling are as follows: - all well control problems: 2.3 x 10⁻³ per well drilled; - uncontrolled blowouts: 1.6 x 10⁻³ per well drilled. 3.3.4.5 Release Location The release location is important for modelling of consequences in QRA. Table 19 shows the relative split by location. Three categories of release locations are defined and used here: - subsea: gas/oil flows outside casing and emerges on the seabed; - wellhead: gas/oil blowouts in the wellhead area; - drill floor: gas/oil blowouts on drill floor (including BOP, diverter, shale shaker etc.). Table 19: Release Location for Blowouts During Development Drilling [9]
RELEASE LOCATION Cat. ALL Cat. UBO Subsea
Wellhead Drill floor
23% 9% 68%
22% 9% 69%
3.3.5 Blowouts During Completion 3.3.5.1 Definition The completion phase includes the final phases of a development well. For the purpose of this database it is defined as starting with running the tubing and ending with well hook-up and commissioning. 3.3.5.2 Population The well experience consists of 17,271 wells drilled in US (OCS) and the North Sea. The majority of the wells are from the US (85%). 3.3.5.3 Events A total of twelve well control problems have been identified during completion. Of these, only nine are considered uncontrolled blowouts.
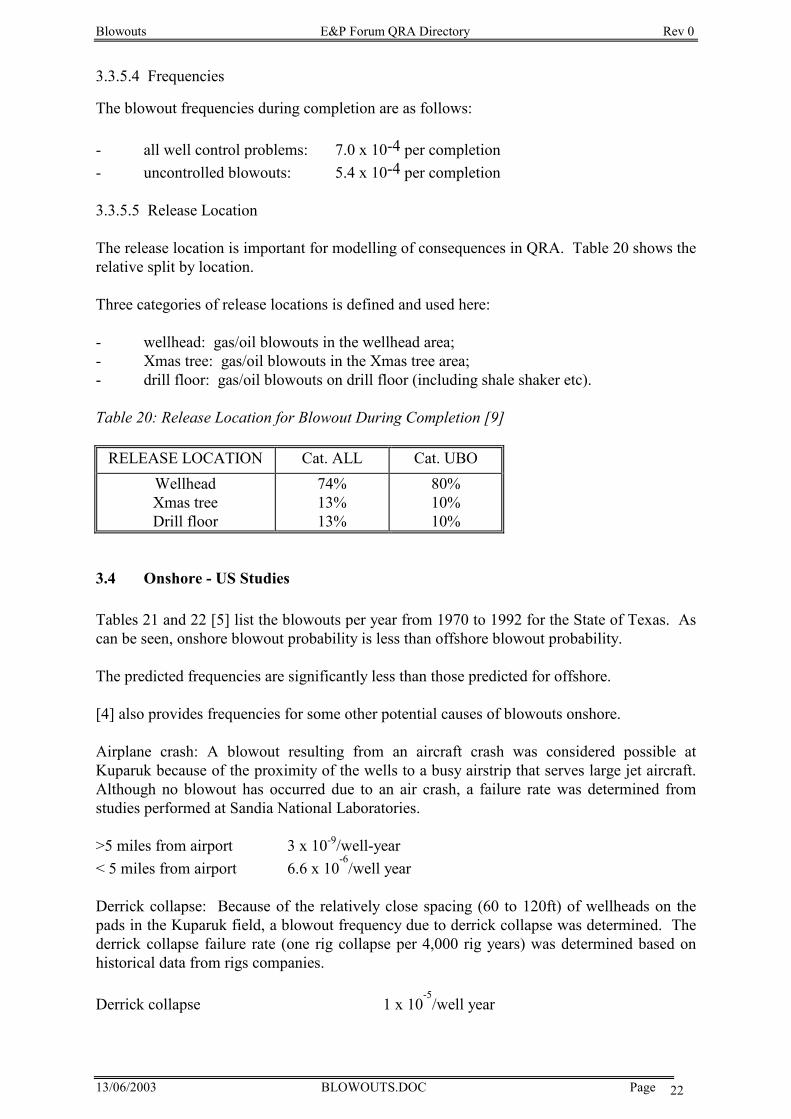
Blowouts E&P Forum QRA Directory Rev 0
13/06/2003 BLOWOUTS.DOC Page 22
3.3.5.4 Frequencies The blowout frequencies during completion are as follows: - all well control problems: 7.0 x 10⁻⁴ per completion - uncontrolled blowouts: 5.4 x 10⁻⁴ per completion 3.3.5.5 Release Location The release location is important for modelling of consequences in QRA. Table 20 shows the relative split by location. Three categories of release locations is defined and used here: - wellhead: gas/oil blowouts in the wellhead area; - Xmas tree: gas/oil blowouts in the Xmas tree area; - drill floor: gas/oil blowouts on drill floor (including shale shaker etc). Table 20: Release Location for Blowout During Completion [9]
RELEASE LOCATION Cat. ALL Cat. UBO Wellhead Xmas tree Drill floor
74% 13% 13%
80% 10% 10%
3.4 Onshore - US Studies Tables 21 and 22 [5] list the blowouts per year from 1970 to 1992 for the State of Texas. As can be seen, onshore blowout probability is less than offshore blowout probability. The predicted frequencies are significantly less than those predicted for offshore. [4] also provides frequencies for some other potential causes of blowouts onshore. Airplane crash: A blowout resulting from an aircraft crash was considered possible at Kuparuk because of the proximity of the wells to a busy airstrip that serves large jet aircraft. Although no blowout has occurred due to an air crash, a failure rate was determined from studies performed at Sandia National Laboratories. >5 miles from airport 3 x 10⁻⁹/well-year < 5 miles from airport 6.6 x 10
-6/well year
Derrick collapse: Because of the relatively close spacing (60 to 120ft) of wellheads on the pads in the Kuparuk field, a blowout frequency due to derrick collapse was determined. The derrick collapse failure rate (one rig collapse per 4,000 rig years) was determined based on historical data from rigs companies. Derrick collapse 1 x 10
-5/well year
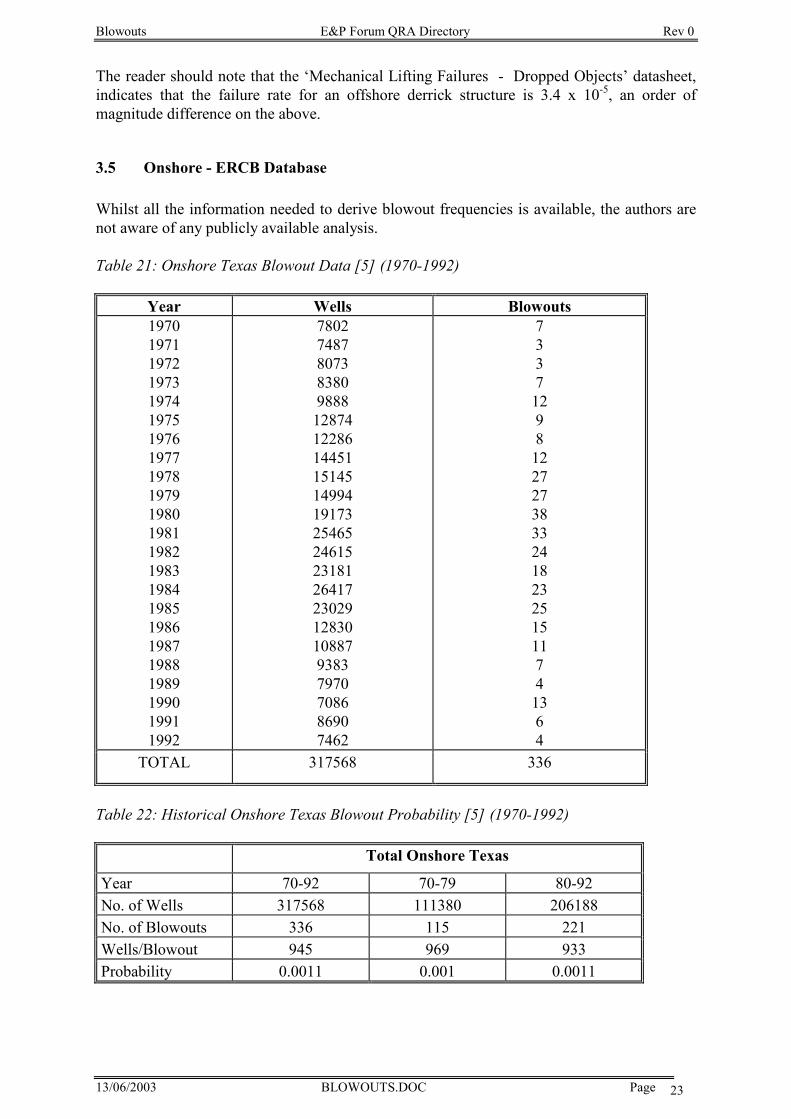
Blowouts E&P Forum QRA Directory Rev 0
13/06/2003 BLOWOUTS.DOC Page 23
The reader should note that the ‘Mechanical Lifting Failures - Dropped Objects’ datasheet, indicates that the failure rate for an offshore derrick structure is 3.4 x 10⁻⁵, an order of magnitude difference on the above.
3.5 Onshore - ERCB Database Whilst all the information needed to derive blowout frequencies is available, the authors are not aware of any publicly available analysis. Table 21: Onshore Texas Blowout Data [5] (1970-1992)
Year Wells Blowouts 1970 1971 1972 1973 1974 1975 1976 1977 1978 1979 1980 1981 1982 1983 1984 1985 1986 1987 1988 1989 1990 1991 1992
7802 7487 8073 8380 9888 12874 12286 14451 15145 14994 19173 25465 24615 23181 26417 23029 12830 10887 9383 7970 7086 8690 7462
733712 9812 27 27 38 33 24 18 23 25 15 11 7413 64
TOTAL 317568 336
Table 22: Historical Onshore Texas Blowout Probability [5] (1970-1992)
Total Onshore Texas
Year 70-92 70-79 80-92 No. of Wells 317568 111380 206188 No. of Blowouts 336 115 221 Wells/Blowout 945 969 933 Probability 0.0011 0.001 0.0011
Blowouts E&P Forum QRA Directory Rev 0
13/06/2003 BLOWOUTS.DOC Page 24
REFERENCES [1] "Blowout Risk Modelling", ASME Paper No. OMAE-95-1332, December 1994. [2] "Accidents Associated with Oil and Gas Operations, Outer Continental Shelf 1956-
1990" MM5 92-0058, US Department of the Interior, Minerals Management Service, October 1992.
[3] Minerals Management Service, OCS Report MMS 88-001 [4] "Subsurface Safety Valves: Safety Liability", J M Busch, et al, Journal of Petroleum
Technology, pp1813 - 1818, October 1985. [5] Texas Railroad Commission Reports [6] API Petroleum Data Book (1993) [7] "World Offshore Accident Database". DNV Technica Norge, PO Box 300, N-1322
Hovek, Norway. [8] "SINTEF Offshore Blowout Database". SINTEF Safety and Reliability, 7034
Trondheim, Norway. [9] “Hydrocarbon Leak and Ignition Database”, E&P Forum, 1992.
Blowouts E&P Forum QRA Directory Rev 0
13/06/2003 BLOWOUTS.DOC Page 15
Dropped Objects E&P Forum QRA Datasheet Directory Rev 0
13/06/2003 DROPPOBJ.DOC Page 1
MECHANICAL LIFTING FAILURES - DROPPED OBJECTS
Dropped Objects E&P Forum QRA Datasheet Directory Rev 0
13/06/2003 DROPPOBJ.DOC Page 2
TABLE OF CONTENTS
1. SUMMARY -------------------------------------------------------------------------------------------- 3
1.1 Scope--------------------------------------------------------------------------------------------------------------------------3
1.2 Application ------------------------------------------------------------------------------------------------------------------3
2. KEY DATA---------------------------------------------------------------------------------------------- 3
REFERENCES-------------------------------------------------------------------------------------------- 12
Dropped Objects E&P Forum QRA Datasheet Directory Rev 0
13/06/2003 DROPPOBJ.DOC Page 3
1. SUMMARY
1.1 Scope
This data sheet gives information about incidents resulting from the unsafe use or failure of cranes and other lifting devices. Specifically, it focuses on dropped object and swinging load accidents that could lead to the release of hydrocarbon, the damage of assets, or the physical harm of personnel.
1.2 Application The datasheet provides dropped load frequencies. In practice, risk assessments also consider other numerical inputs apart from purely dropped load frequency. For example, probabilities are often applied to account for other case-specific factors even though there may be no published data available. Some examples of these factors are: • Crane loading distribution including consideration of number of lifts per week and the time duration of the lifts • Probability of hydrocarbon release and ignition upon impact • Probability of target impact: pipework, structure, equipment • Probability of deck penetration
2. KEY DATA Serious Incidents Due to Dropped Objects and Swinging Loads (UK North Sea) Table 1 is the result of a study performed by the Health & Safety Executive on incidents surrounding lifting and rigging operations. The values in Table 1 were obtained from the Department of Energy/HSE ‘Safety’ database (Reference 1) on all recorded incidents involving cranes over the period 1981 to the end of September 1992. Records are based on incidents reported under the OIR9A reporting scheme. The database contained details of some 1160 incidents. Many of the incidents were of a relatively minor nature. Consequently the data was analyzed by the HSE to identify more “serious” incidents where it was believed that the potential existed for escalation into a significant event involving death or serious injury. Therefore, the analysis inevitably involved a degree of subjectivity as to which incidents had the potential to escalate to a “serious” incident. In many cases this issue was fairly clear-cut. In order to calculate incident frequencies on a per installation year basis, details of the number of installations (fixed and mobile) operating in each of the years was also required. Information for the years 1981 to 1990 were taken from the Department of Energy ‘Brown Book’. However, due to a change in format, the ‘Brown Book’ does not give equivalent figures for 1991 and 1992 and estimates had to be made for those years. The frequencies are calculated on a ‘per installation year’ basis.
Dropped Objects E&P Forum QRA Datasheet Directory Rev 0
13/06/2003 DROPPOBJ.DOC Page 4
Incidents classed as “serious” were further sub-divided into incidents where: a. impact was on the installation itself b. the dropped object fell into the sea (and hence could have impacted subsea equipment) c. the impact occured on a supply vessel
Incidents were further sub-divided by the type of lifting device involved. The types considered were: a. installation main cranes (pedestal cranes) b. derrick cranes (It is believed this category included crane barges working at or near an installation. An accident on a crane barge in transit is not believed to be included.) c. other fixed lifting devices e.g., lifting beams (including trolley cranes/hoists) d. portable lifting devices (e.g., chain blocks/slings etc.)
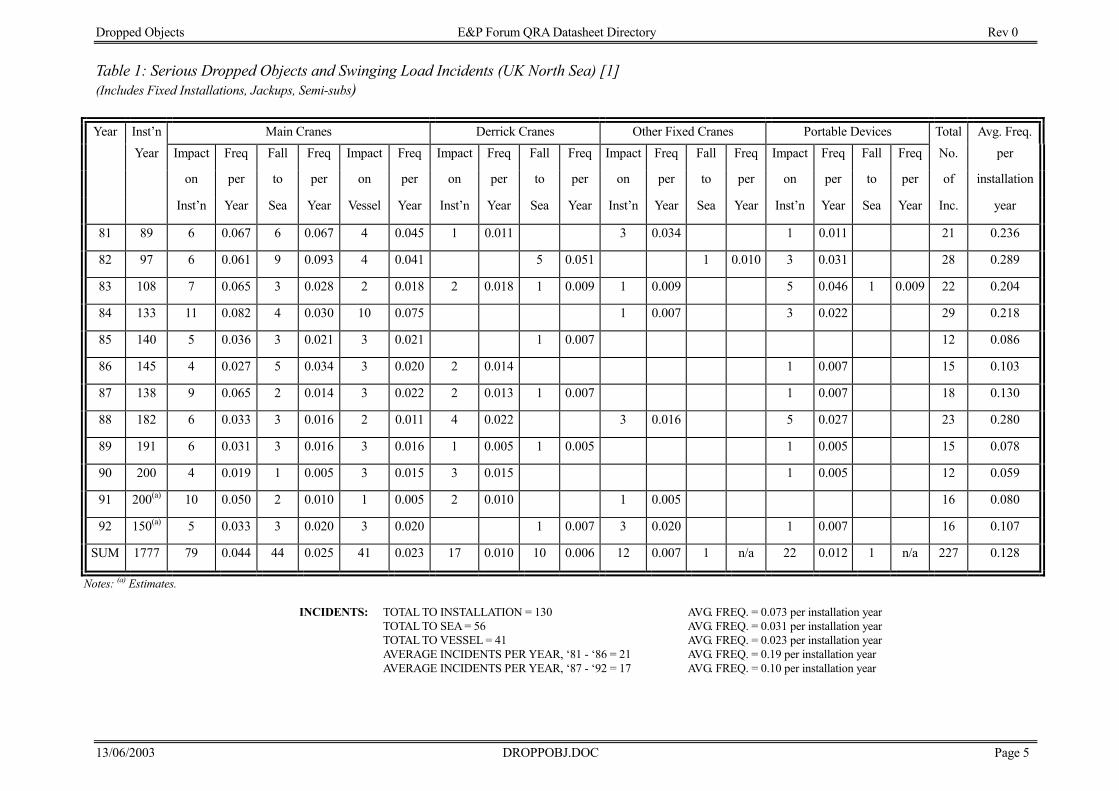
Dropped Objects E&P Forum QRA Datasheet Directory Rev 0
13/06/2003 DROPPOBJ.DOC Page 5
Table 1: Serious Dropped Objects and Swinging Load Incidents (UK North Sea) [1](Includes Fixed Installations, Jackups, Semi-subs)
Year Inst’n Main Cranes Derrick Cranes Other Fixed Cranes Portable Devices Total Avg. Freq.Year Impact Freq Fall Freq Impact Freq Impact Freq Fall Freq Impact Freq Fall Freq Impact Freq Fall Freq No. per
on per to per on per on per to per on per to per on per to per of installation
Inst’n Year Sea Year Vessel Year Inst’n Year Sea Year Inst’n Year Sea Year Inst’n Year Sea Year Inc. year
81 89 6 0.067 6 0.067 4 0.045 1 0.011 3 0.034 1 0.011 21 0.236
82 97 6 0.061 9 0.093 4 0.041 5 0.051 1 0.010 3 0.031 28 0.289
83 108 7 0.065 3 0.028 2 0.018 2 0.018 1 0.009 1 0.009 5 0.046 1 0.009 22 0.204
84 133 11 0.082 4 0.030 10 0.075 1 0.007 3 0.022 29 0.218
85 140 5 0.036 3 0.021 3 0.021 1 0.007 12 0.086
86 145 4 0.027 5 0.034 3 0.020 2 0.014 1 0.007 15 0.103
87 138 9 0.065 2 0.014 3 0.022 2 0.013 1 0.007 1 0.007 18 0.130
88 182 6 0.033 3 0.016 2 0.011 4 0.022 3 0.016 5 0.027 23 0.280
89 191 6 0.031 3 0.016 3 0.016 1 0.005 1 0.005 1 0.005 15 0.078
90 200 4 0.019 1 0.005 3 0.015 3 0.015 1 0.005 12 0.059
91 200(a) 10 0.050 2 0.010 1 0.005 2 0.010 1 0.005 16 0.080
92 150(a) 5 0.033 3 0.020 3 0.020 1 0.007 3 0.020 1 0.007 16 0.107
SUM 1777 79 0.044 44 0.025 41 0.023 17 0.010 10 0.006 12 0.007 1 n/a 22 0.012 1 n/a 227 0.128
Notes: (a) Estimates.
INCIDENTS: TOTAL TO INSTALLATION = 130 AVG. FREQ. = 0.073 per installation yearTOTAL TO SEA = 56 AVG. FREQ. = 0.031 per installation yearTOTAL TO VESSEL = 41 AVG. FREQ. = 0.023 per installation yearAVERAGE INCIDENTS PER YEAR, ‘81 - ‘86 = 21 AVG. FREQ. = 0.19 per installation yearAVERAGE INCIDENTS PER YEAR, ‘87 - ‘92 = 17 AVG. FREQ. = 0.10 per installation year
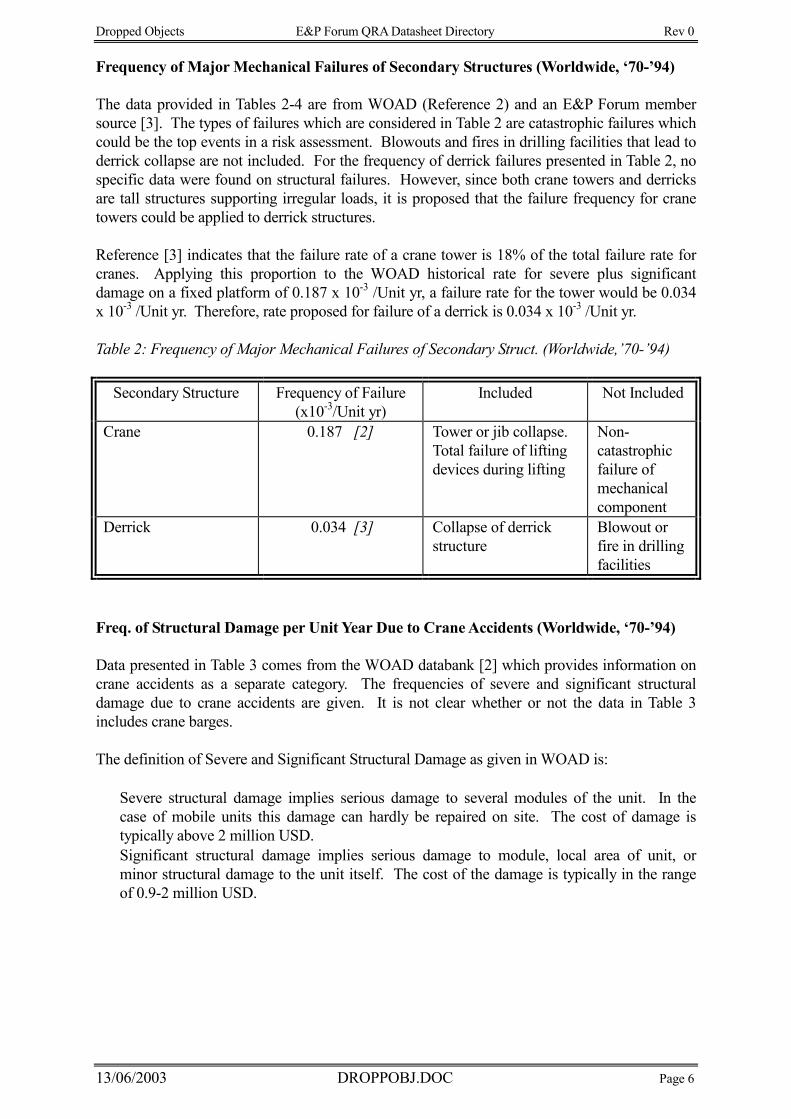
Dropped Objects E&P Forum QRA Datasheet Directory Rev 0
13/06/2003 DROPPOBJ.DOC Page 6
Frequency of Major Mechanical Failures of Secondary Structures (Worldwide, ‘70-’94) The data provided in Tables 2-4 are from WOAD (Reference 2) and an E&P Forum member source [3]. The types of failures which are considered in Table 2 are catastrophic failures which could be the top events in a risk assessment. Blowouts and fires in drilling facilities that lead to derrick collapse are not included. For the frequency of derrick failures presented in Table 2, no specific data were found on structural failures. However, since both crane towers and derricks are tall structures supporting irregular loads, it is proposed that the failure frequency for crane towers could be applied to derrick structures. Reference [3] indicates that the failure rate of a crane tower is 18% of the total failure rate for cranes. Applying this proportion to the WOAD historical rate for severe plus significant damage on a fixed platform of 0.187 x 10⁻³ /Unit yr, a failure rate for the tower would be 0.034 x 10⁻³ /Unit yr. Therefore, rate proposed for failure of a derrick is 0.034 x 10⁻³ /Unit yr. Table 2: Frequency of Major Mechanical Failures of Secondary Struct. (Worldwide,’70-’94)
Secondary Structure Frequency of Failure (x10-3/Unit yr)
Included Not Included
Crane 0.187 [2]
Tower or jib collapse. Total failure of lifting devices during lifting
Non-catastrophic failure of mechanical component
Derrick 0.034 [3] Collapse of derrick structure
Blowout or fire in drilling facilities
Freq. of Structural Damage per Unit Year Due to Crane Accidents (Worldwide, ‘70-’94) Data presented in Table 3 comes from the WOAD databank [2] which provides information on crane accidents as a separate category. The frequencies of severe and significant structural damage due to crane accidents are given. It is not clear whether or not the data in Table 3 includes crane barges. The definition of Severe and Significant Structural Damage as given in WOAD is: • Severe structural damage implies serious damage to several modules of the unit. In the case of mobile units this damage can hardly be repaired on site. The cost of damage is typically above 2 million USD. • Significant structural damage implies serious damage to module, local area of unit, or minor structural damage to the unit itself. The cost of the damage is typically in the range of 0.9-2 million USD.
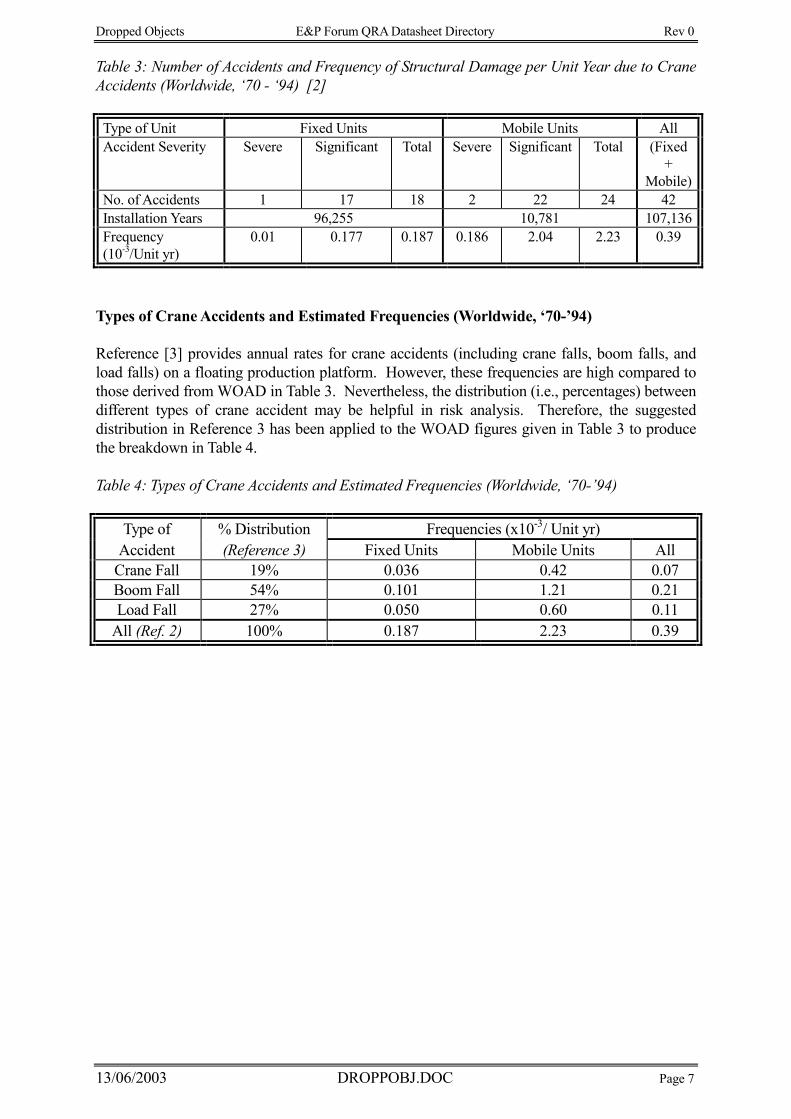
Dropped Objects E&P Forum QRA Datasheet Directory Rev 0
13/06/2003 DROPPOBJ.DOC Page 7
Table 3: Number of Accidents and Frequency of Structural Damage per Unit Year due to Crane Accidents (Worldwide, ‘70 - ‘94) [2] Type of Unit Fixed Units Mobile Units All Accident Severity Severe Significant Total Severe Significant Total (Fixed
+Mobile)
No. of Accidents 1 17 18 2 22 24 42 Installation Years 96,255 10,781 107,136Frequency (10-3/Unit yr)
0.01 0.177 0.187 0.186 2.04 2.23 0.39
Types of Crane Accidents and Estimated Frequencies (Worldwide, ‘70-’94) Reference [3] provides annual rates for crane accidents (including crane falls, boom falls, and load falls) on a floating production platform. However, these frequencies are high compared to those derived from WOAD in Table 3. Nevertheless, the distribution (i.e., percentages) between different types of crane accident may be helpful in risk analysis. Therefore, the suggested distribution in Reference 3 has been applied to the WOAD figures given in Table 3 to produce the breakdown in Table 4. Table 4: Types of Crane Accidents and Estimated Frequencies (Worldwide, ‘70-’94)
Type of % Distribution Frequencies (x10-3/ Unit yr) Accident (Reference 3) Fixed Units Mobile Units All
Crane Fall 19% 0.036 0.42 0.07 Boom Fall 54% 0.101 1.21 0.21 Load Fall 27% 0.050 0.60 0.11
All (Ref. 2) 100% 0.187 2.23 0.39
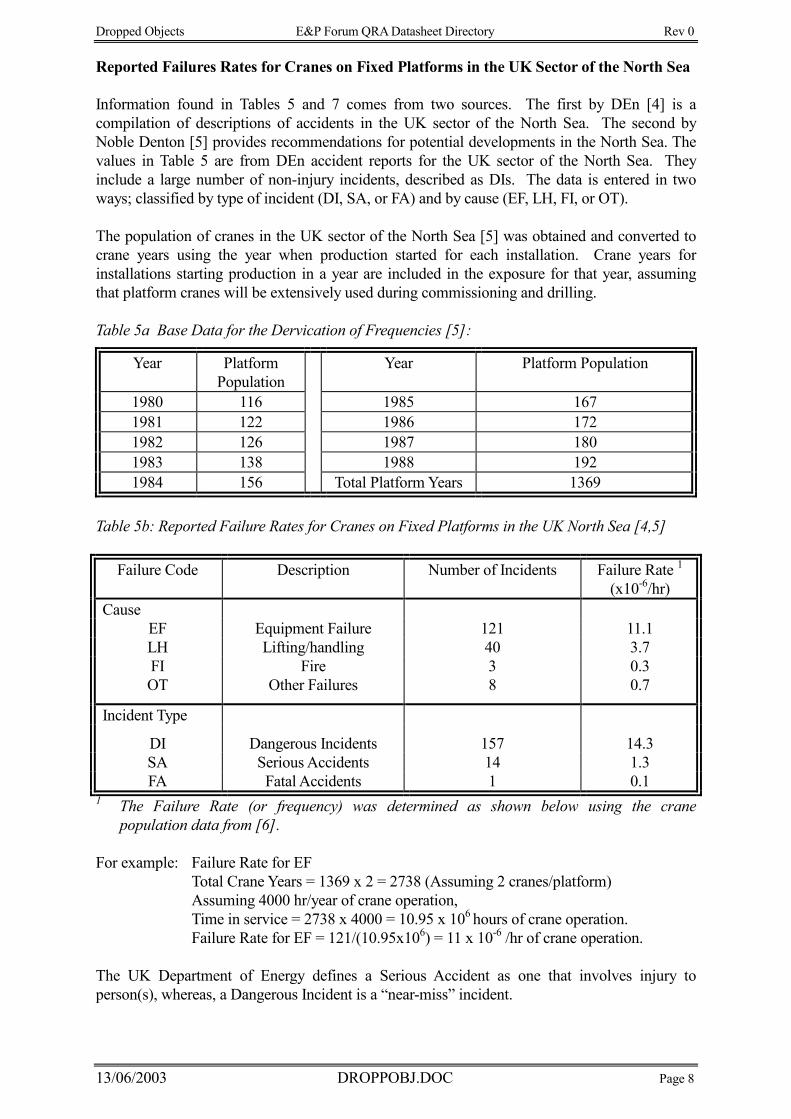
Dropped Objects E&P Forum QRA Datasheet Directory Rev 0
13/06/2003 DROPPOBJ.DOC Page 8
Reported Failures Rates for Cranes on Fixed Platforms in the UK Sector of the North Sea Information found in Tables 5 and 7 comes from two sources. The first by DEn [4] is a compilation of descriptions of accidents in the UK sector of the North Sea. The second by Noble Denton [5] provides recommendations for potential developments in the North Sea. The values in Table 5 are from DEn accident reports for the UK sector of the North Sea. They include a large number of non-injury incidents, described as DIs. The data is entered in two ways; classified by type of incident (DI, SA, or FA) and by cause (EF, LH, FI, or OT). The population of cranes in the UK sector of the North Sea [5] was obtained and converted to crane years using the year when production started for each installation. Crane years for installations starting production in a year are included in the exposure for that year, assuming that platform cranes will be extensively used during commissioning and drilling. Table 5a Base Data for the Dervication of Frequencies [5]:
Year Platform Population
Year Platform Population
1980 116 1985 167 1981 122 1986 172 1982 126 1987 180 1983 138 1988 192 1984 156 Total Platform Years 1369
Table 5b: Reported Failure Rates for Cranes on Fixed Platforms in the UK North Sea [4,5]
Failure Code Description Number of Incidents
Failure Rate 1
(x10-6/hr) Cause
EF Equipment Failure 121 11.1 LH Lifting/handling 40 3.7 FI Fire 3 0.3 OT Other Failures 8 0.7
Incident Type
DI Dangerous Incidents 157 14.3
SA Serious Accidents 14 1.3 FA Fatal Accidents 1 0.1
1 The Failure Rate (or frequency) was determined as shown below using the crane population data from [6]. For example: Failure Rate for EF Total Crane Years = 1369 x 2 = 2738 (Assuming 2 cranes/platform) Assuming 4000 hr/year of crane operation, Time in service = 2738 x 4000 = 10.95 x 10⁶ hours of crane operation. Failure Rate for EF = 121/(10.95x106) = 11 x 10-6 /hr of crane operation. The UK Department of Energy defines a Serious Accident as one that involves injury to person(s), whereas, a Dangerous Incident is a “near-miss” incident.
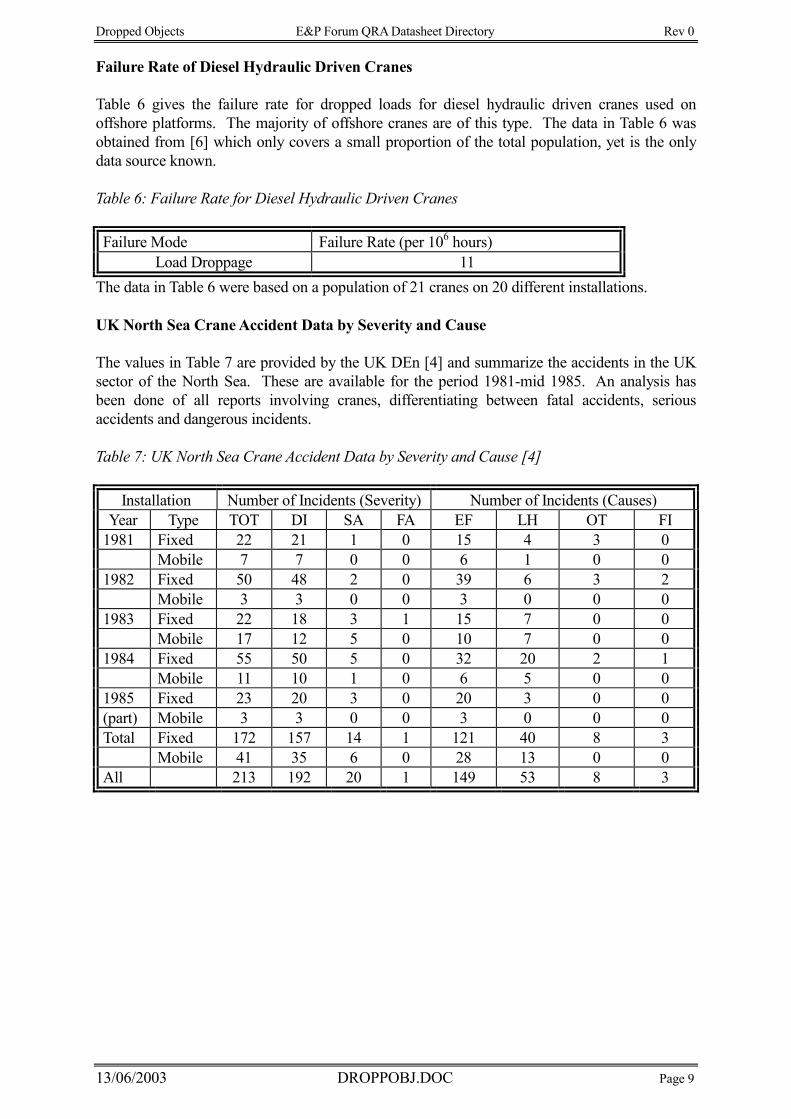
Dropped Objects E&P Forum QRA Datasheet Directory Rev 0
13/06/2003 DROPPOBJ.DOC Page 9
Failure Rate of Diesel Hydraulic Driven Cranes Table 6 gives the failure rate for dropped loads for diesel hydraulic driven cranes used on offshore platforms. The majority of offshore cranes are of this type. The data in Table 6 was obtained from [6] which only covers a small proportion of the total population, yet is the only data source known. Table 6: Failure Rate for Diesel Hydraulic Driven Cranes Failure Mode Failure Rate (per 106 hours)
Load Droppage 11 The data in Table 6 were based on a population of 21 cranes on 20 different installations.
UK North Sea Crane Accident Data by Severity and Cause The values in Table 7 are provided by the UK DEn [4] and summarize the accidents in the UK sector of the North Sea. These are available for the period 1981-mid 1985. An analysis has been done of all reports involving cranes, differentiating between fatal accidents, serious accidents and dangerous incidents. Table 7: UK North Sea Crane Accident Data by Severity and Cause [4]
Installation Number of Incidents (Severity) Number of Incidents (Causes) Year Type TOT DI SA FA EF LH OT FI
1981 Fixed 22 21 1 0 15 4 3 0 Mobile 7 7 0 0 6 1 0 0
1982 Fixed 50 48 2 0 39 6 3 2 Mobile 3 3 0 0 3 0 0 0
1983 Fixed 22 18 3 1 15 7 0 0 Mobile 17 12 5 0 10 7 0 0
1984 Fixed 55 50 5 0 32 20 2 1 Mobile 11 10 1 0 6 5 0 0
1985 Fixed 23 20 3 0 20 3 0 0 (part) Mobile 3 3 0 0 3 0 0 0 Total Fixed 172 157 14 1 121 40 8 3
Mobile 41 35 6 0 28 13 0 0 All 213 192 20 1 149 53 8 3
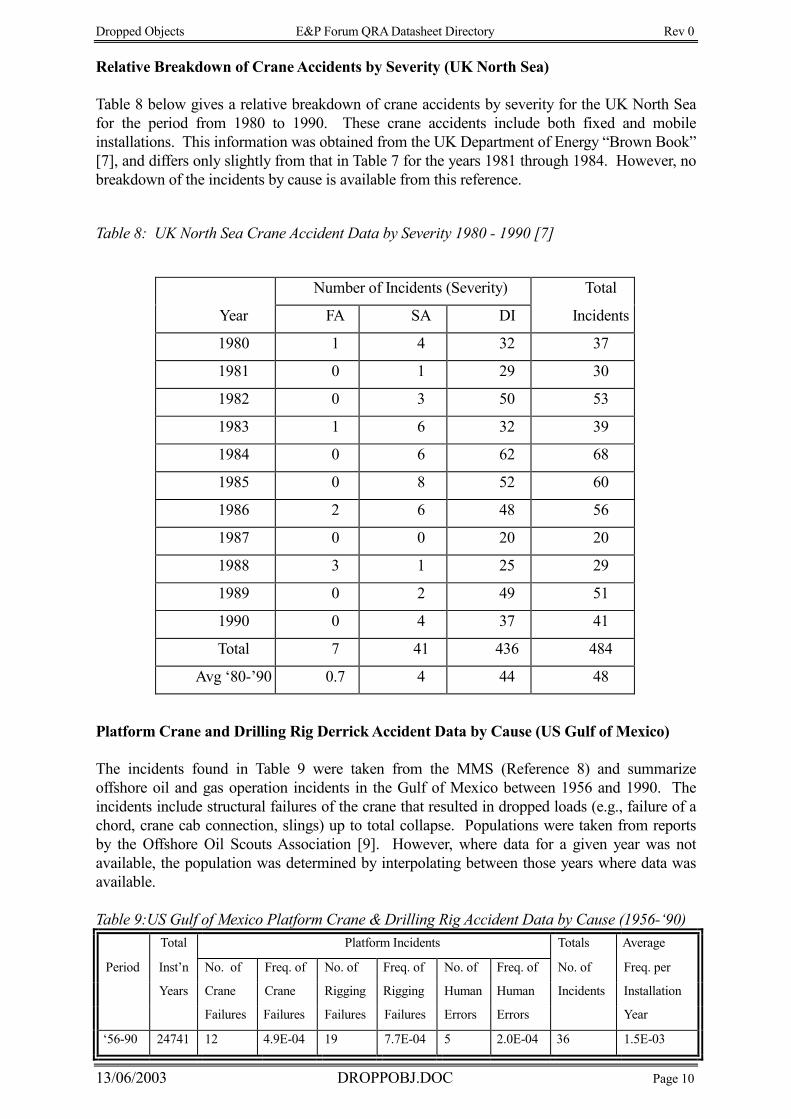
Dropped Objects E&P Forum QRA Datasheet Directory Rev 0
13/06/2003 DROPPOBJ.DOC Page 10
Relative Breakdown of Crane Accidents by Severity (UK North Sea) Table 8 below gives a relative breakdown of crane accidents by severity for the UK North Sea for the period from 1980 to 1990. These crane accidents include both fixed and mobile installations. This information was obtained from the UK Department of Energy “Brown Book” [7], and differs only slightly from that in Table 7 for the years 1981 through 1984. However, no breakdown of the incidents by cause is available from this reference.
Table 8: UK North Sea Crane Accident Data by Severity 1980 - 1990 [7]
Number of Incidents (Severity) Total
Year FA SA DI Incidents
1980 1 4 32 37
1981 0 1 29 30
1982 0 3 50 53
1983 1 6 32 39
1984 0 6 62 68
1985 0 8 52 60
1986 2 6 48 56
1987 0 0 20 20
1988 3 1 25 29
1989 0 2 49 51
1990 0 4 37 41
Total 7 41 436 484
Avg ‘80-’90 0.7 4 44 48
Platform Crane and Drilling Rig Derrick Accident Data by Cause (US Gulf of Mexico) The incidents found in Table 9 were taken from the MMS (Reference 8) and summarize offshore oil and gas operation incidents in the Gulf of Mexico between 1956 and 1990. The incidents include structural failures of the crane that resulted in dropped loads (e.g., failure of a chord, crane cab connection, slings) up to total collapse. Populations were taken from reports by the Offshore Oil Scouts Association [9]. However, where data for a given year was not available, the population was determined by interpolating between those years where data was available. Table 9:US Gulf of Mexico Platform Crane & Drilling Rig Accident Data by Cause (1956-‘90)
Total Platform Incidents Totals Average Period Inst’n No. of Freq. of No. of Freq. of No. of Freq. of No. of Freq. per
Years Crane Crane Rigging Rigging Human Human Incidents Installation
Failures Failures Failures Failures Errors Errors Year
‘56-90 24741 12 4.9E-04 19 7.7E-04 5 2.0E-04 36 1.5E-03
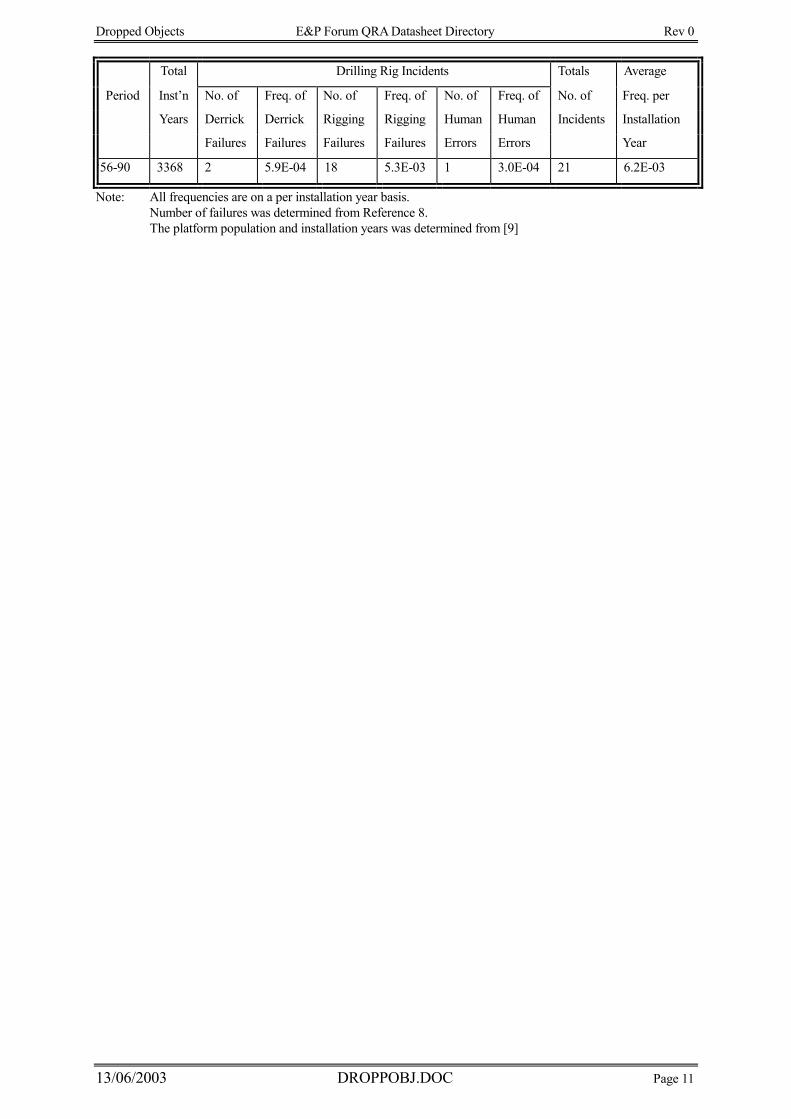
Dropped Objects E&P Forum QRA Datasheet Directory Rev 0
13/06/2003 DROPPOBJ.DOC Page 11
Total Drilling Rig Incidents Totals Average
Period Inst’n No. of Freq. of No. of Freq. of No. of Freq. of No. of Freq. per
Years Derrick Derrick Rigging Rigging Human Human Incidents Installation
Failures Failures Failures Failures Errors Errors Year
‘56-90 3368 2 5.9E-04 18 5.3E-03 1 3.0E-04 21 6.2E-03
Note: All frequencies are on a per installation year basis. Number of failures was determined from Reference 8. The platform population and installation years was determined from [9]
Dropped Objects E&P Forum QRA Datasheet Directory Rev 0
13/06/2003 DROPPOBJ.DOC Page 12
REFERENCES
1. J. N. Edmondson and T. Norman, “An Examination of the Number and Frequency of Serious Dropped Object and Swing Load Incidents Involving Cranes and Lifting Devices on Offshore Installations for the Period 1981-1992,” Offshore Technology Report - OTN 93 222, Health & Safety Executive, Sept. 1993. 2. WOAD - World Offshore Accident Databank, Statistical Report, 1994, Veritec, Norway. 3. E&P Forum Member, 1985. 4. UK Department of Energy Accident Summaries, 1981-1985. 5. Noble Denton North Sea Field Development Guide, through 1988. 6. OREDA-92 - Offshore Reliability Data, 2nd Edition, DNV Technica. 7. UK Department of Energy “Brown Book”, 1981-1985. 8. Lloyd M. Tracy, “Accidents Associated with Oil and Gas Operations: Outer Continental Shelf 1956-1990”, US. Department of the Interior, Minerals Management Service, Oct. 1992. 9. Offshore Oil Scouts Association, “Status of the Offshore Oil Industry & Statistical Review of Events”, Multiple Issues, through 1995.
Dropped Objects E&P Forum QRA Datasheet Directory Rev 0
13/06/2003 DROPPOBJ.DOC Page 13
Ship/Installation Collision E&P Forum QRA Directory Rev 0
13/06/2003 Collisions.doc Page 1
SHIP/INSTALLATION COLLISIONS
Ship/Installation Collision E&P Forum QRA Directory Rev 0
13/06/2003 Collisions.doc Page 2
Table of Contents
1 INTRODUCTION-------------------------------------------------------------------------------------- 4
2 CATEGORIES OF COLLIDING VESSELS --------------------------------------------------- 5
2.1 Merchant Vessels ------------------------------------------------------------------------------------------------------7
2.2 Naval Traffic -----------------------------------------------------------------------------------------------------------7 2.2.1 Surface Traffic---------------------------------------------------------------------------------------------------------7 2.2.2 Submerged Submarine Traffic --------------------------------------------------------------------------------------7
2.3 Fishing Vessels ---------------------------------------------------------------------------------------------------------8
2.4 Offshore Traffic -------------------------------------------------------------------------------------------------------8 2.4.1 External Offshore Traffic --------------------------------------------------------------------------------------------8 2.4.2 Field Related Offshore Traffic --------------------------------------------------------------------------------------8
3 HISTORICAL COLLISIONS --------------------------------------------------------------------- 10
3.1 Introduction ---------------------------------------------------------------------------------------------------------- 10
3.2 Passing Vessels ------------------------------------------------------------------------------------------------------- 10 3.2.1 Passing Vessel Collisions UK Continental Shelf -------------------------------------------------------------- 10 3.2.2 Passing Vessel Collisions Norwegian Continental Shelf ----------------------------------------------------- 11 3.2.3 Passing Vessel Collisions Dutch Continental Shelf ----------------------------------------------------------- 12 3.2.4 Passing Vessel Collisions German Sector----------------------------------------------------------------------- 12 3.2.5 Passing Vessel Collisions World Wide-------------------------------------------------------------------------- 12 3.2.6 Evaluation of Data - Passing Vessel Collisions ---------------------------------------------------------------- 13
3.3 Visiting Vessels------------------------------------------------------------------------------------------------------- 14 3.3.1 Introduction ---------------------------------------------------------------------------------------------------------- 14 3.3.2 Operational Exposure - UK Sector ------------------------------------------------------------------------------- 14 3.3.3 Reported Collision Incidents - UK Sector ---------------------------------------------------------------------- 14 3.3.4 Collision Frequency Per Installation-Year - UK Sector ------------------------------------------------------ 15 3.3.5 Collision Frequency Per Vessel Visit ---------------------------------------------------------------------------- 18 3.3.6 Collision Frequency Per Vessel Orientation-------------------------------------------------------------------- 19 3.3.7 Collision Causation Factors - Visiting Vessels----------------------------------------------------------------- 19 3.3.8 Evaluation of Data - Visiting Vessel Collisions---------------------------------------------------------------- 21
4 COLLISION FREQUENCY MODELLING --------------------------------------------------- 23
4.1 Introduction ---------------------------------------------------------------------------------------------------------- 23
4.2 Ship/Installation Collision Frequency Modelling ------------------------------------------------------------- 23 4.2.1 Important Factors Affecting Collision Frequency ------------------------------------------------------------- 23 4.2.2 Collision Frequency Models--------------------------------------------------------------------------------------- 25
4.3 Vessel Traffic Pattern and Volume ------------------------------------------------------------------------------ 25 4.3.1 General---------------------------------------------------------------------------------------------------------------- 25 4.3.2 Factors Affecting the Traffic Volume---------------------------------------------------------------------------- 25 4.3.3 How to get Traffic Data -------------------------------------------------------------------------------------------- 26
5 COLLISION CONSEQUENCES---------------------------------------------------------------- 27
5.1 General ---------------------------------------------------------------------------------------------------------------- 27
6 RISK REDUCING MEASURES----------------------------------------------------------------- 28
Ship/Installation Collision E&P Forum QRA Directory Rev 0
13/06/2003 Collisions.doc Page 3
6.1 Use of Risk Reducing Measures ---------------------------------------------------------------------------------- 28
6.2 Overview of Risk Reducing Measures--------------------------------------------------------------------------- 28
7 RESEARCH AND DEVELOPMENT PROJECTS ----------------------------------------- 29
7.1 Introduction ---------------------------------------------------------------------------------------------------------- 29
7.2 UK Continental Shelf Shipping Traffic Database------------------------------------------------------------- 29
7.3 The Effectiveness of Collision Control & Avoidance Systems ---------------------------------------------- 29
7.4 Comparison of ship-platform collision frequency models. -------------------------------------------------- 30
8 REFERENCES -------------------------------------------------------------------------------------- 31
Ship/Installation Collision E&P Forum QRA Directory Rev 0
13/06/2003 Collisions.doc Page 4
1 INTRODUCTION This data sheet provides data on ship/installation collision risk in relation to activities within the offshore oil & gas Exploration and Production Industry. The risk related to icebergs are not considered. During the last decade, considerable attention has been given to the risk related to collisions between offshore oil and gas platforms and ships in the North Sea. Several research programs have looked into this problem and considerable steps have been taken to improve the modelling of these problems. Collision risk is highly location dependent due to variation in ship traffic from one location to another. The ship traffic volume and pattern at the specific location should hence be considered with considerable care. This dependency on location also means that use of historical data which are averaged over a large number of different locations, is not possible. Field related offshore traffic involve those vessels which are specifically visiting the unit, and are therefore considered to be less dependent of the location of the platform. This means that there will be smaller variation in the collision frequency from one platform to another, and it is possible to use historical data to a much greater extent than for the other collision types.
Ship/Installation Collision E&P Forum QRA Directory Rev 0
13/06/2003 Collisions.doc Page 5
2 CATEGORIES OF COLLIDING VESSELS Ship traffic may for this purpose be divided into two groups: • EXTERNAL: Ship traffic which is not related to the installation being considered,
including merchant vessels, fishing vessels, naval vessels etc.
• FIELD RELATED: Offshore-related traffic which is there to serve the installation being considered, e.g. supply vessels, oil tankers, work vessels etc.
Collisions can be divided into two groups:
• Powered collisions ( Vessel steaming towards the installation )
• Drifting collisions ( Vessel drifting towards the installation ) Powered collisions will cover situations like navigational/manoeuvring errors (human/technical failures), watch keeping failure, bad visibility/ineffective radar use, etc. A drifting vessel is a vessel which has lost its propulsion or has experienced a progressive failure of anchor lines or towline and is drifting only under the influence of environmental forces.
In Table 2.1 the different types of vessels that may collide with the platform are shown.
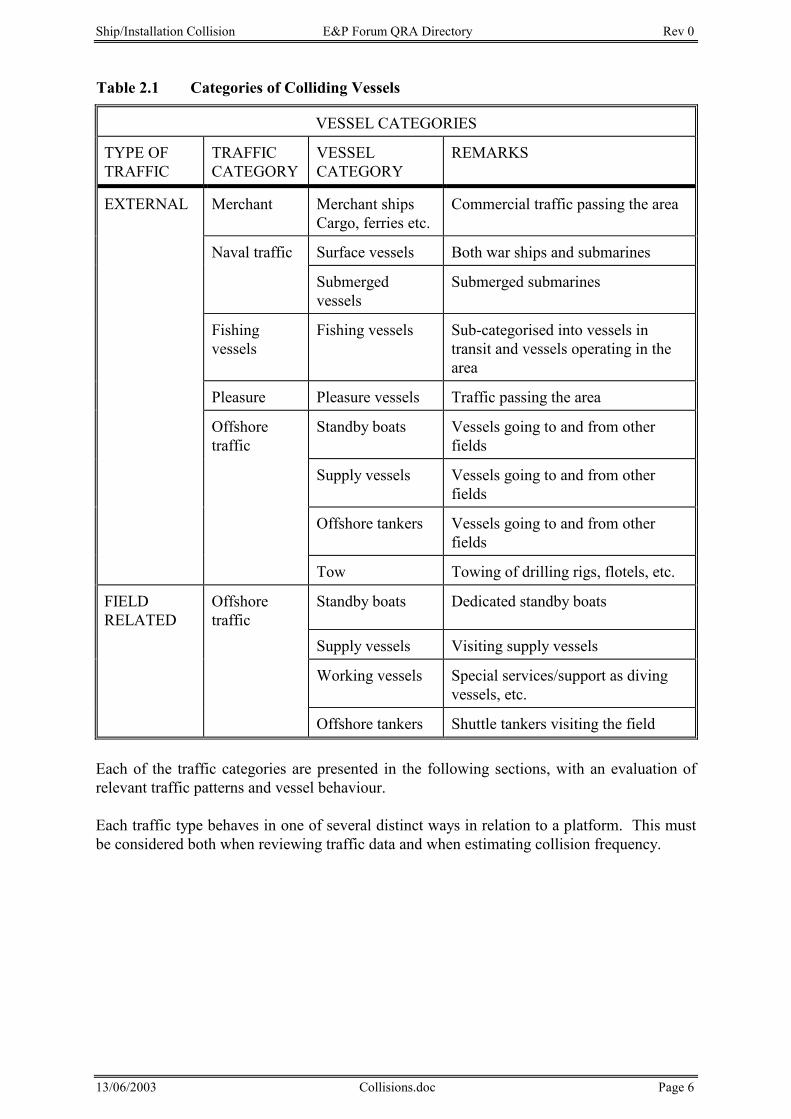
Ship/Installation Collision E&P Forum QRA Directory Rev 0
13/06/2003 Collisions.doc Page 6
Each of the traffic categories are presented in the following sections, with an evaluation of relevant traffic patterns and vessel behaviour. Each traffic type behaves in one of several distinct ways in relation to a platform. This must be considered both when reviewing traffic data and when estimating collision frequency.
Table 2.1 Categories of Colliding Vessels
VESSEL CATEGORIES
TYPE OF TRAFFIC
TRAFFIC CATEGORY
VESSEL CATEGORY
REMARKS
EXTERNAL Merchant Merchant ships Cargo, ferries etc.
Commercial traffic passing the area
Naval traffic Surface vessels Both war ships and submarines
Submerged vessels
Submerged submarines
Fishing vessels
Fishing vessels Sub-categorised into vessels in transit and vessels operating in the area
Pleasure Pleasure vessels Traffic passing the area
Offshore traffic
Standby boats Vessels going to and from other fields
Supply vessels Vessels going to and from other fields
Offshore tankers Vessels going to and from other fields
Tow Towing of drilling rigs, flotels, etc.
FIELD RELATED
Offshore traffic
Standby boats Dedicated standby boats
Supply vessels Visiting supply vessels
Working vessels Special services/support as diving vessels, etc.
Offshore tankers Shuttle tankers visiting the field
Ship/Installation Collision E&P Forum QRA Directory Rev 0
13/06/2003 Collisions.doc Page 7
2.1 Merchant Vessels Merchant vessels are frequently found to represent the greatest platform collision hazard, since: • Merchant vessels are often large and may thus represent considerable impact energy. • The traffic may be very dense in some areas. • No prevailing influence by oil and gas operators. In addition there is a problem of the uncertainties in the risk estimates which are higher than for many of the other vessel groups as merchant vessel operating standards vary in quality.
2.2 Naval Traffic Estimating risk associated with naval vessels is a problem because information about movements and volume is restricted and hence difficult to obtain. Estimation very often has to be based on surveys or subjective evaluation. Further, the volume is difficult to assess since possible routes and areas where naval vessels operate/exercise can vary each year. The variation in traffic routes and density can also be dependent on the political situation. Naval traffic may be divided into two main categories, surface traffic (submarines included) and submerged traffic.
2.2.1 Surface Traffic As already mentioned, collisions are either due to drifting of the vessel or may occur while the vessel is under power (errant vessels). Drifting is less likely to happen with a naval vessel than with a merchant vessel because it is designed to operate under difficult conditions and thus with a high degree of reliability. A reduced probability of drifting combined with a relatively low number of vessels usually makes this scenario negligible, at least in relation to the overall collision risk. As regards collisions under power, this scenario can probably also be disregarded. These vessels have a large crew compared to merchant vessels. They will always have at least two persons on the bridge (large vessels like frigates, destroyers, carriers etc. will have more personnel on the bridge). Normally the operation room is also manned. Considering the number of personnel "on watch" it seems very unlikely that a naval surface vessel should not know of/detect the platform and avoid it compared to a merchant vessel. In addition, naval vessels are more likely to operate in groups, something which also will reduce the collision probability. Submarines operating on the surface are not considered to represent any higher threat to the platform than any other surface vessel. All in all, it is considered that the contribution to overall collision risk from such vessels is likely to be very low.
2.2.2 Submerged Submarine Traffic As for naval surface vessels, due to a reduced probability of drifting combined with a relatively low number of vessels, the contribution from drifting submarines to the overall collision risk is neglected. Submerged submarines are in a special situation because they do not have a look-out. Navigation is therefore completely dependent on electronic navigational aids and sonar.
Ship/Installation Collision E&P Forum QRA Directory Rev 0
13/06/2003 Collisions.doc Page 8
A 550 ton, West German submarine collided with Norsk Hydro’s Oseberg B platform in March 1988 causing damage estimated at up to NOK 200 million. In connection with this accident, it was stated that it was often very difficult for submarines to detect platforms which do not emit much sound in the water. In principle submarines are officially restricted from operating in the immediate vicinity of offshore installation in times of peace. Nevertheless the Norsk Hydro incident shows a deviation from this principle. Some data on the submarine traffic have been collected [1]. An appropriate number of submarines in activity in the entire North Sea, at all times, seems to be in the region of 15 - 25.
2.3 Fishing Vessels Fishing vessels are divided into two groups, depending on the operational pattern : • Fishing vessels can be in transit from the coast to and from different fishing areas. • Secondly, the vessels may be fishing in an area. The vessel’s operation and behaviour
during fishing ( primarily trawling) will be complex and varied, but usually at low speed and with no preferred heading.
Fishing vessels vary in size from large factory/freezer ships to smaller vessels operating near the coast. Typically, a large fishing vessel will have a displacement around 1000 tons. This implies that the collision energy will be less than 20 MJ. For a typical North Sea installation neither drifting vessels nor vessels under power will normally be able to threaten the integrity of the platform. However, the risers and other relevant equipment will have considerably less impact resistance. Powered as well as drifting fishing vessels will hence be considered and models for these scenarios have been developed.
2.4 Offshore Traffic 2.4.1 External Offshore Traffic Passing offshore vessels, tankers as well as supply, standby and work vessels are in many respects similar to passing merchant vessels, except that such vessel operations tend to be more aware of the offshore installations and also may benefit from EP Operator influence (procedure, training competency, communication etc.). Vessels or installations under tow pose particular problems which should be considered separately [1].
2.4.2 Field Related Offshore Traffic The most frequent collisions/contacts occur between offshore supply vessels and the platform to which they are delivering supplies. Those impacts generally cause only minor damage, although significant impacts have been reported [2]. It is worth noting that e.g. the Norwegian and the UK criteria for design against vessel impacts have been derived from a probabilistic evaluation of supply vessel impacts [3, 4]. These collisions are therefore to a large degree taken care of in the platform design.
Ship/Installation Collision E&P Forum QRA Directory Rev 0
13/06/2003 Collisions.doc Page 9
Generally, collisions with any sort of offshore-related traffic can be more easily controlled because the vessels are operated by the oil companies themselves, and they can impose restrictions on this traffic if it is deemed necessary.
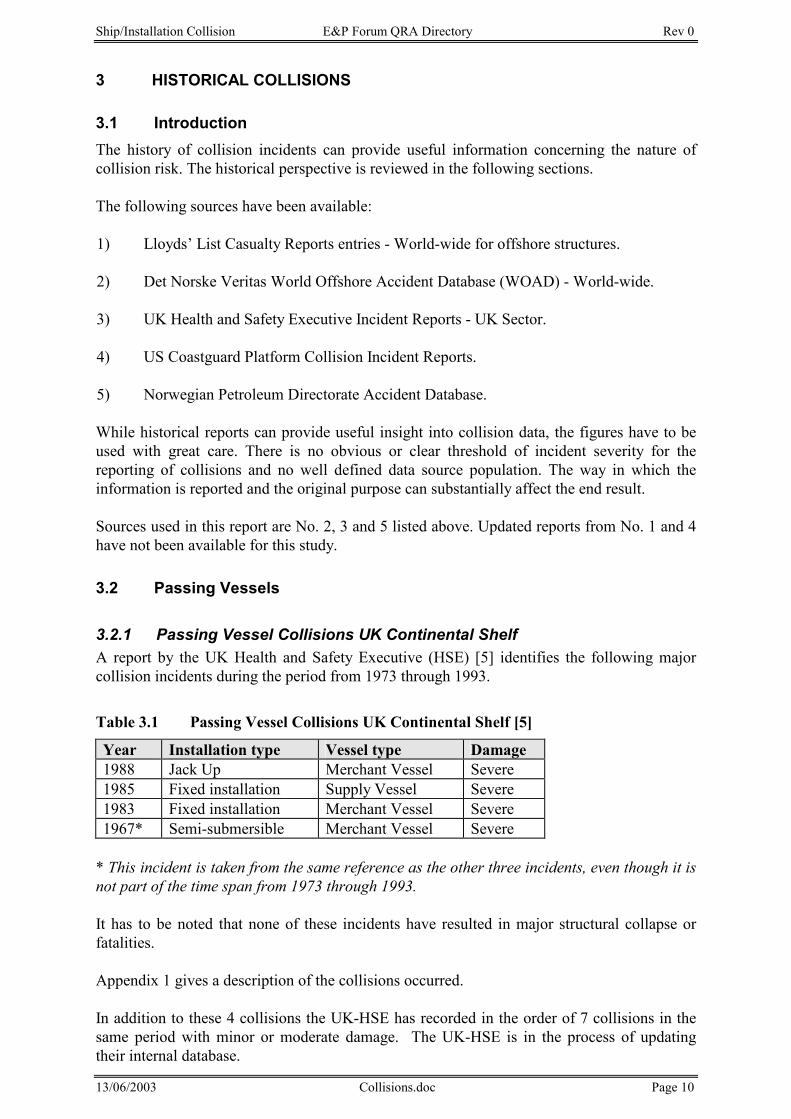
Ship/Installation Collision E&P Forum QRA Directory Rev 0
13/06/2003 Collisions.doc Page 10
3 HISTORICAL COLLISIONS
3.1 Introduction The history of collision incidents can provide useful information concerning the nature of collision risk. The historical perspective is reviewed in the following sections. The following sources have been available:
1) Lloyds’ List Casualty Reports entries - World-wide for offshore structures. 2) Det Norske Veritas World Offshore Accident Database (WOAD) - World-wide. 3) UK Health and Safety Executive Incident Reports - UK Sector. 4) US Coastguard Platform Collision Incident Reports. 5) Norwegian Petroleum Directorate Accident Database. While historical reports can provide useful insight into collision data, the figures have to be used with great care. There is no obvious or clear threshold of incident severity for the reporting of collisions and no well defined data source population. The way in which the information is reported and the original purpose can substantially affect the end result. Sources used in this report are No. 2, 3 and 5 listed above. Updated reports from No. 1 and 4 have not been available for this study.
3.2 Passing Vessels
3.2.1 Passing Vessel Collisions UK Continental Shelf A report by the UK Health and Safety Executive (HSE) [5] identifies the following major collision incidents during the period from 1973 through 1993.
Table 3.1 Passing Vessel Collisions UK Continental Shelf [5]
Year Installation type Vessel type Damage 1988 Jack Up Merchant Vessel Severe 1985 Fixed installation Supply Vessel Severe 1983 Fixed installation Merchant Vessel Severe 1967* Semi-submersible Merchant Vessel Severe
* This incident is taken from the same reference as the other three incidents, even though it is not part of the time span from 1973 through 1993. It has to be noted that none of these incidents have resulted in major structural collapse or fatalities. Appendix 1 gives a description of the collisions occurred. In addition to these 4 collisions the UK-HSE has recorded in the order of 7 collisions in the same period with minor or moderate damage. The UK-HSE is in the process of updating their internal database.
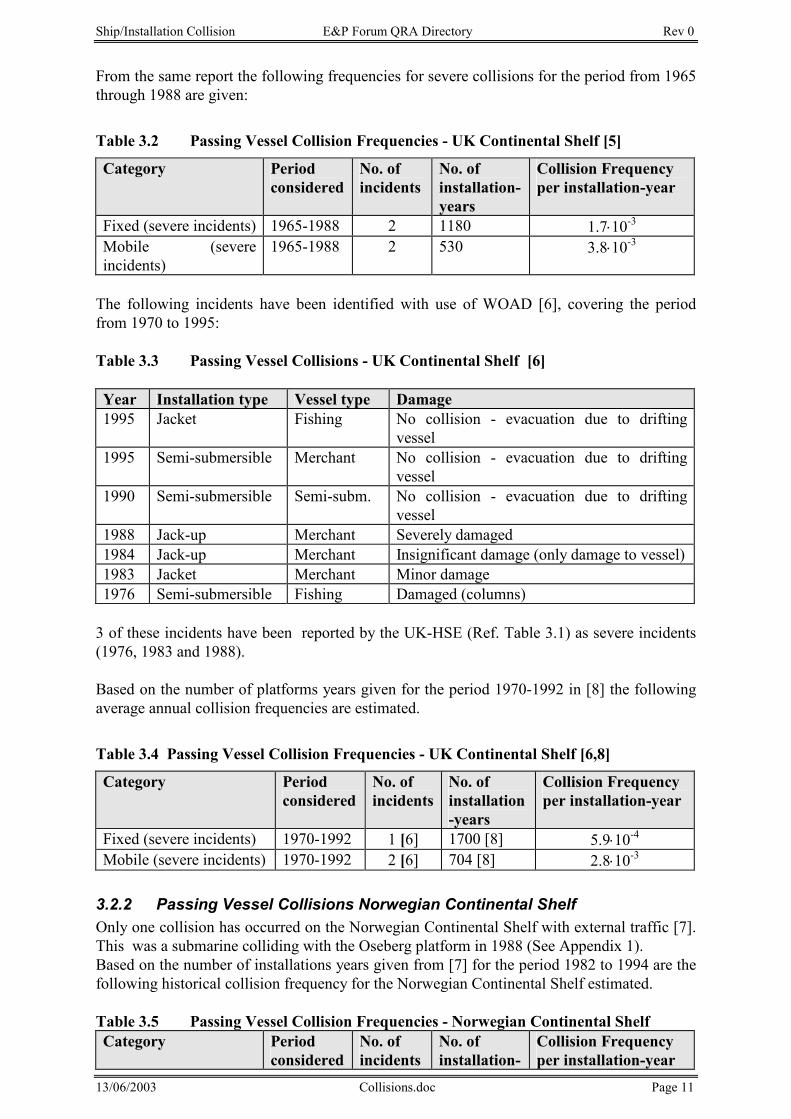
Ship/Installation Collision E&P Forum QRA Directory Rev 0
13/06/2003 Collisions.doc Page 11
From the same report the following frequencies for severe collisions for the period from 1965 through 1988 are given:
Table 3.2 Passing Vessel Collision Frequencies - UK Continental Shelf [5]
Category Period considered
No. of incidents
No. of installation-years
Collision Frequency per installation-year
Fixed (severe incidents) 1965-1988 2 1180 1.7⋅10-3 Mobile (severe incidents)
1965-1988 2 530 3.8⋅10-3
The following incidents have been identified with use of WOAD [6], covering the period from 1970 to 1995: Table 3.3 Passing Vessel Collisions - UK Continental Shelf [6] Year Installation type Vessel type Damage 1995 Jacket Fishing No collision - evacuation due to drifting
vessel 1995 Semi-submersible Merchant No collision - evacuation due to drifting
vessel 1990 Semi-submersible Semi-subm. No collision - evacuation due to drifting
vessel 1988 Jack-up Merchant Severely damaged 1984 Jack-up Merchant Insignificant damage (only damage to vessel) 1983 Jacket Merchant Minor damage 1976 Semi-submersible Fishing Damaged (columns)
3 of these incidents have been reported by the UK-HSE (Ref. Table 3.1) as severe incidents (1976, 1983 and 1988). Based on the number of platforms years given for the period 1970-1992 in [8] the following average annual collision frequencies are estimated.
Table 3.4 Passing Vessel Collision Frequencies - UK Continental Shelf [6,8]
Category Period considered
No. of incidents
No. of installation-years
Collision Frequency per installation-year
Fixed (severe incidents) 1970-1992 1 [6] 1700 [8] 5.9⋅10-4 Mobile (severe incidents) 1970-1992 2 [6] 704 [8] 2.8⋅10-3
3.2.2 Passing Vessel Collisions Norwegian Continental Shelf Only one collision has occurred on the Norwegian Continental Shelf with external traffic [7]. This was a submarine colliding with the Oseberg platform in 1988 (See Appendix 1). Based on the number of installations years given from [7] for the period 1982 to 1994 are the following historical collision frequency for the Norwegian Continental Shelf estimated. Table 3.5 Passing Vessel Collision Frequencies - Norwegian Continental Shelf Category Period
consideredNo. of incidents
No. of installation-
Collision Frequency per installation-year
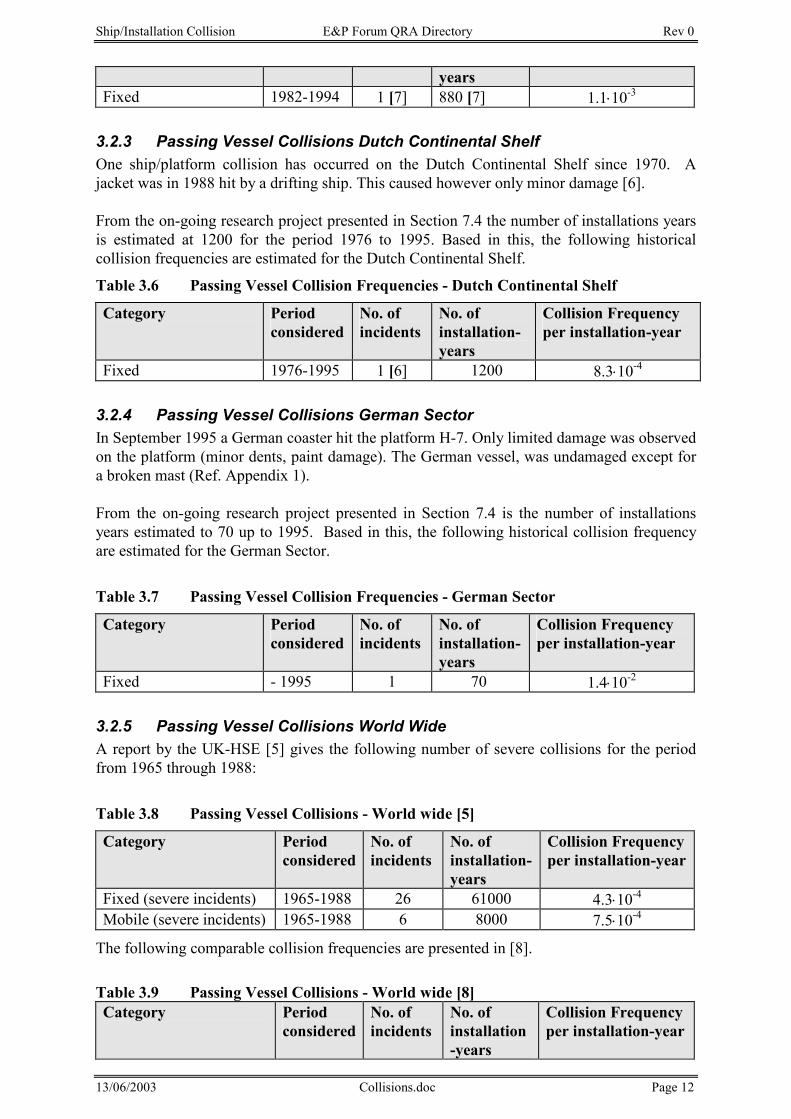
Ship/Installation Collision E&P Forum QRA Directory Rev 0
13/06/2003 Collisions.doc Page 12
years Fixed 1982-1994 1 [7] 880 [7] 1.1⋅10-3
3.2.3 Passing Vessel Collisions Dutch Continental Shelf One ship/platform collision has occurred on the Dutch Continental Shelf since 1970. A jacket was in 1988 hit by a drifting ship. This caused however only minor damage [6]. From the on-going research project presented in Section 7.4 the number of installations years is estimated at 1200 for the period 1976 to 1995. Based in this, the following historical collision frequencies are estimated for the Dutch Continental Shelf.
Table 3.6 Passing Vessel Collision Frequencies - Dutch Continental Shelf
Category Period considered
No. of incidents
No. of installation-years
Collision Frequency per installation-year
Fixed 1976-1995 1 [6] 1200 8.3⋅10-4
3.2.4 Passing Vessel Collisions German Sector In September 1995 a German coaster hit the platform H-7. Only limited damage was observed on the platform (minor dents, paint damage). The German vessel, was undamaged except for a broken mast (Ref. Appendix 1). From the on-going research project presented in Section 7.4 is the number of installations years estimated to 70 up to 1995. Based in this, the following historical collision frequency are estimated for the German Sector.
Table 3.7 Passing Vessel Collision Frequencies - German Sector
Category Period considered
No. of incidents
No. of installation-years
Collision Frequency per installation-year
Fixed - 1995 1 70 1.4⋅10-2
3.2.5 Passing Vessel Collisions World Wide A report by the UK-HSE [5] gives the following number of severe collisions for the period from 1965 through 1988:
Table 3.8 Passing Vessel Collisions - World wide [5]
Category Period considered
No. of incidents
No. of installation-years
Collision Frequency per installation-year
Fixed (severe incidents) 1965-1988 26 61000 4.3⋅10-4 Mobile (severe incidents) 1965-1988 6 8000 7.5⋅10-4
The following comparable collision frequencies are presented in [8]. Table 3.9 Passing Vessel Collisions - World wide [8] Category Period
consideredNo. of incidents
No. of installation-years
Collision Frequency per installation-year
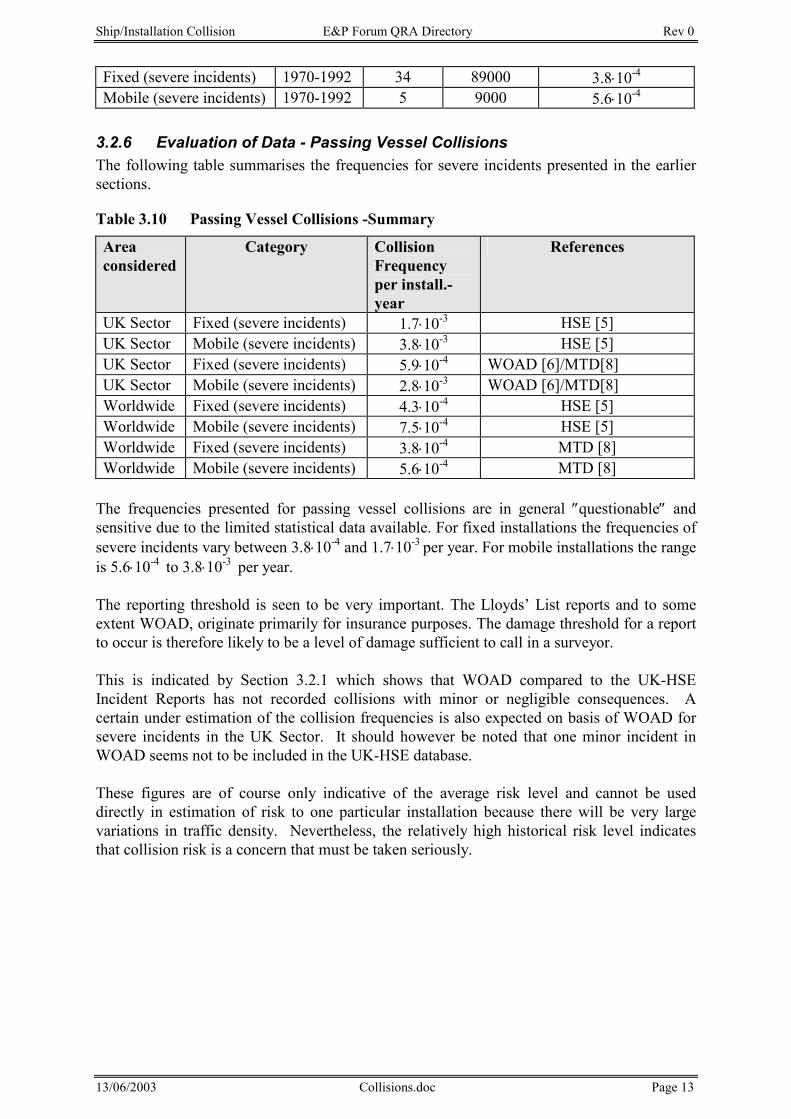
Ship/Installation Collision E&P Forum QRA Directory Rev 0
13/06/2003 Collisions.doc Page 13
Fixed (severe incidents) 1970-1992 34 89000 3.8⋅10-4 Mobile (severe incidents) 1970-1992 5 9000 5.6⋅10-4
3.2.6 Evaluation of Data - Passing Vessel Collisions The following table summarises the frequencies for severe incidents presented in the earlier sections.
Table 3.10 Passing Vessel Collisions -Summary
Area considered
Category Collision Frequency per install.-year
References
UK Sector Fixed (severe incidents) 1.7⋅10-3 HSE [5] UK Sector Mobile (severe incidents) 3.8⋅10-3 HSE [5] UK Sector Fixed (severe incidents) 5.9⋅10-4 WOAD [6]/MTD[8] UK Sector Mobile (severe incidents) 2.8⋅10-3 WOAD [6]/MTD[8] Worldwide Fixed (severe incidents) 4.3⋅10-4 HSE [5] Worldwide Mobile (severe incidents) 7.5⋅10-4 HSE [5] Worldwide Fixed (severe incidents) 3.8⋅10-4 MTD [8] Worldwide Mobile (severe incidents) 5.6⋅10-4 MTD [8]
The frequencies presented for passing vessel collisions are in general ″questionable″ and sensitive due to the limited statistical data available. For fixed installations the frequencies of severe incidents vary between 3.8⋅10-4 and 1.7⋅10-3 per year. For mobile installations the range is 5.6⋅10-4 to 3.8⋅10-3 per year. The reporting threshold is seen to be very important. The Lloyds’ List reports and to some extent WOAD, originate primarily for insurance purposes. The damage threshold for a report to occur is therefore likely to be a level of damage sufficient to call in a surveyor. This is indicated by Section 3.2.1 which shows that WOAD compared to the UK-HSE Incident Reports has not recorded collisions with minor or negligible consequences. A certain under estimation of the collision frequencies is also expected on basis of WOAD for severe incidents in the UK Sector. It should however be noted that one minor incident in WOAD seems not to be included in the UK-HSE database. These figures are of course only indicative of the average risk level and cannot be used directly in estimation of risk to one particular installation because there will be very large variations in traffic density. Nevertheless, the relatively high historical risk level indicates that collision risk is a concern that must be taken seriously.
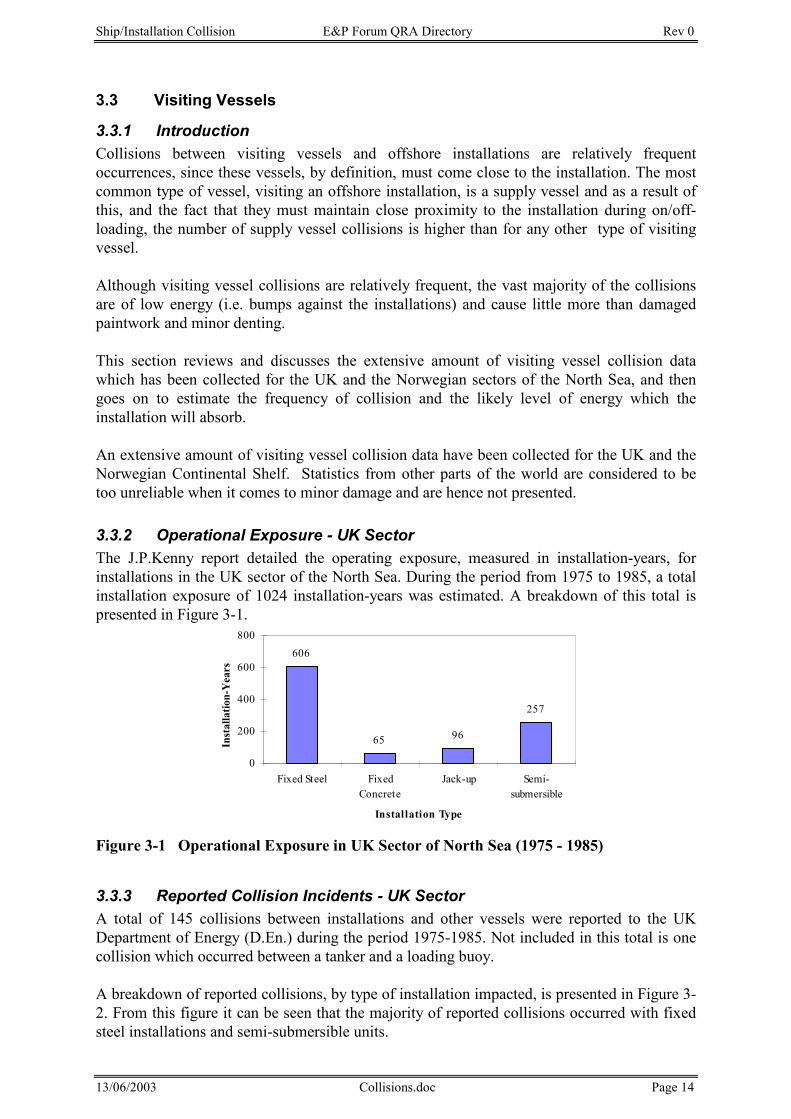
Ship/Installation Collision E&P Forum QRA Directory Rev 0
13/06/2003 Collisions.doc Page 14
3.3 Visiting Vessels
3.3.1 Introduction Collisions between visiting vessels and offshore installations are relatively frequent occurrences, since these vessels, by definition, must come close to the installation. The most common type of vessel, visiting an offshore installation, is a supply vessel and as a result of this, and the fact that they must maintain close proximity to the installation during on/off-loading, the number of supply vessel collisions is higher than for any other type of visiting vessel. Although visiting vessel collisions are relatively frequent, the vast majority of the collisions are of low energy (i.e. bumps against the installations) and cause little more than damaged paintwork and minor denting. This section reviews and discusses the extensive amount of visiting vessel collision data which has been collected for the UK and the Norwegian sectors of the North Sea, and then goes on to estimate the frequency of collision and the likely level of energy which the installation will absorb. An extensive amount of visiting vessel collision data have been collected for the UK and the Norwegian Continental Shelf. Statistics from other parts of the world are considered to be too unreliable when it comes to minor damage and are hence not presented.
3.3.2 Operational Exposure - UK Sector The J.P.Kenny report detailed the operating exposure, measured in installation-years, for installations in the UK sector of the North Sea. During the period from 1975 to 1985, a total installation exposure of 1024 installation-years was estimated. A breakdown of this total is presented in Figure 3-1.
606
65 96
257
0
200
400
600
800
Fixed Steel FixedConcrete
Jack-up Semi-submersible
Installation Type
Inst
alla
tion-
Yea
rs
Figure 3-1 Operational Exposure in UK Sector of North Sea (1975 - 1985)
3.3.3 Reported Collision Incidents - UK Sector A total of 145 collisions between installations and other vessels were reported to the UK Department of Energy (D.En.) during the period 1975-1985. Not included in this total is one collision which occurred between a tanker and a loading buoy. A breakdown of reported collisions, by type of installation impacted, is presented in Figure 3-2. From this figure it can be seen that the majority of reported collisions occurred with fixed steel installations and semi-submersible units.
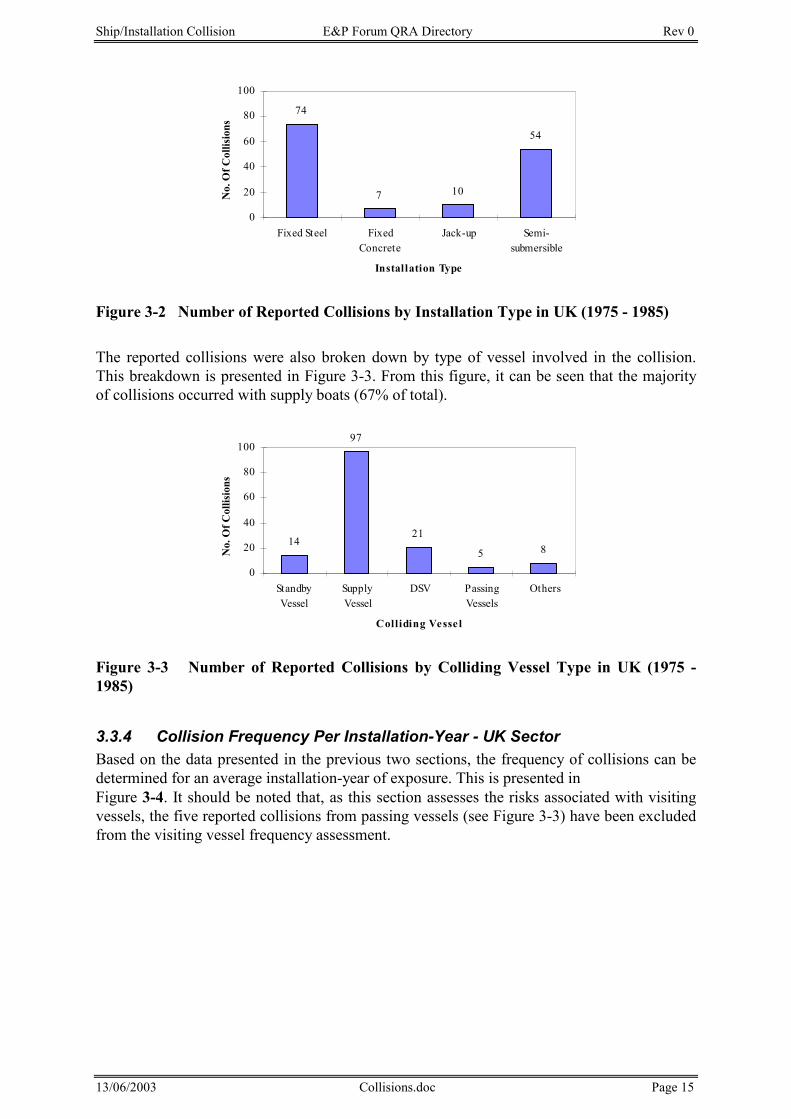
Ship/Installation Collision E&P Forum QRA Directory Rev 0
13/06/2003 Collisions.doc Page 15
74
7 10
54
0
20
40
60
80
100
Fixed Steel FixedConcrete
Jack-up Semi-submersible
Installation Type
No.
OfC
ollis
ions
Figure 3-2 Number of Reported Collisions by Installation Type in UK (1975 - 1985) The reported collisions were also broken down by type of vessel involved in the collision. This breakdown is presented in Figure 3-3. From this figure, it can be seen that the majority of collisions occurred with supply boats (67% of total).
14
97
21
5 8
0
20
40
60
80
100
StandbyVessel
SupplyVessel
DSV PassingVessels
Others
Colliding Vesse l
No.
OfC
ollis
ions
Figure 3-3 Number of Reported Collisions by Colliding Vessel Type in UK (1975 - 1985)
3.3.4 Collision Frequency Per Installation-Year - UK Sector Based on the data presented in the previous two sections, the frequency of collisions can be determined for an average installation-year of exposure. This is presented in Figure 3-4. It should be noted that, as this section assesses the risks associated with visiting vessels, the five reported collisions from passing vessels (see Figure 3-3) have been excluded from the visiting vessel frequency assessment.
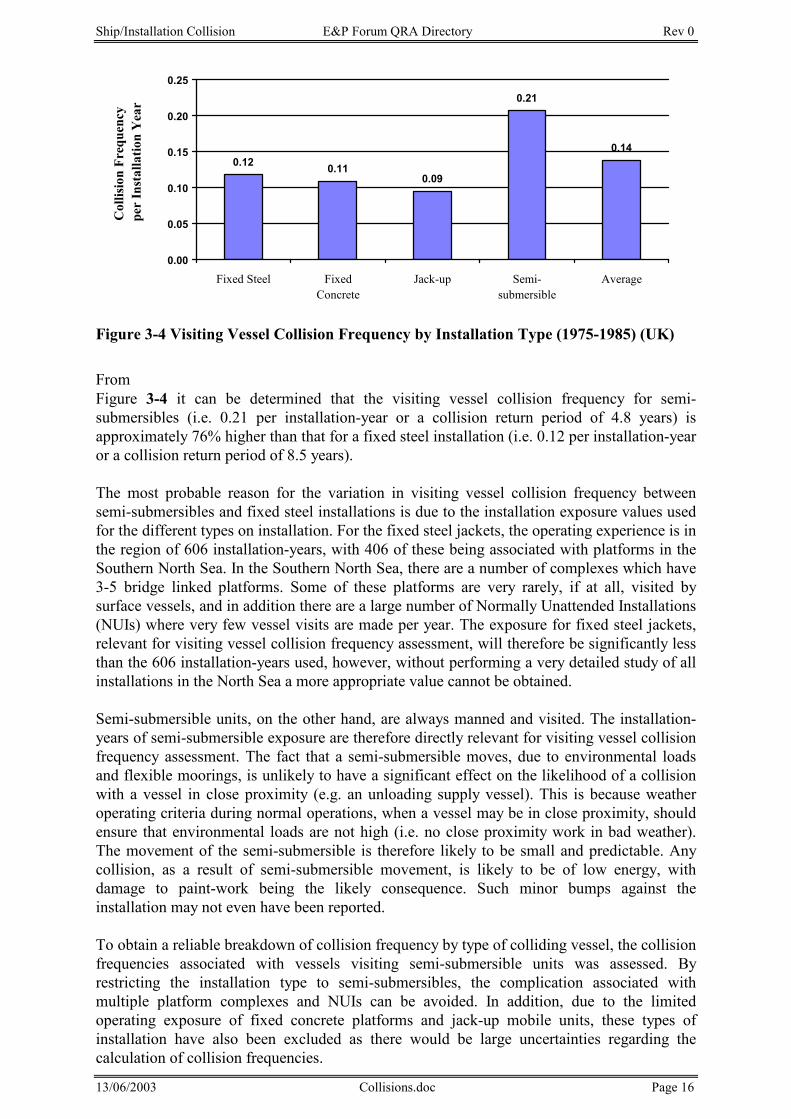
Ship/Installation Collision E&P Forum QRA Directory Rev 0
13/06/2003 Collisions.doc Page 16
0.12 0.110.09
0.21
0.14
0.00
0.05
0.10
0.15
0.20
0.25
Fixed Steel FixedConcrete
Jack-up Semi-submersible
Average
Col
lisio
nFr
eque
ncy
per
Inst
alla
tion
Yea
r
Figure 3-4 Visiting Vessel Collision Frequency by Installation Type (1975-1985) (UK)
From Figure 3-4 it can be determined that the visiting vessel collision frequency for semi-submersibles (i.e. 0.21 per installation-year or a collision return period of 4.8 years) is approximately 76% higher than that for a fixed steel installation (i.e. 0.12 per installation-year or a collision return period of 8.5 years). The most probable reason for the variation in visiting vessel collision frequency between semi-submersibles and fixed steel installations is due to the installation exposure values used for the different types on installation. For the fixed steel jackets, the operating experience is in the region of 606 installation-years, with 406 of these being associated with platforms in the Southern North Sea. In the Southern North Sea, there are a number of complexes which have 3-5 bridge linked platforms. Some of these platforms are very rarely, if at all, visited by surface vessels, and in addition there are a large number of Normally Unattended Installations (NUIs) where very few vessel visits are made per year. The exposure for fixed steel jackets, relevant for visiting vessel collision frequency assessment, will therefore be significantly less than the 606 installation-years used, however, without performing a very detailed study of all installations in the North Sea a more appropriate value cannot be obtained. Semi-submersible units, on the other hand, are always manned and visited. The installation-years of semi-submersible exposure are therefore directly relevant for visiting vessel collision frequency assessment. The fact that a semi-submersible moves, due to environmental loads and flexible moorings, is unlikely to have a significant effect on the likelihood of a collision with a vessel in close proximity (e.g. an unloading supply vessel). This is because weather operating criteria during normal operations, when a vessel may be in close proximity, should ensure that environmental loads are not high (i.e. no close proximity work in bad weather). The movement of the semi-submersible is therefore likely to be small and predictable. Any collision, as a result of semi-submersible movement, is likely to be of low energy, with damage to paint-work being the likely consequence. Such minor bumps against the installation may not even have been reported. To obtain a reliable breakdown of collision frequency by type of colliding vessel, the collision frequencies associated with vessels visiting semi-submersible units was assessed. By restricting the installation type to semi-submersibles, the complication associated with multiple platform complexes and NUIs can be avoided. In addition, due to the limited operating exposure of fixed concrete platforms and jack-up mobile units, these types of installation have also been excluded as there would be large uncertainties regarding the calculation of collision frequencies.
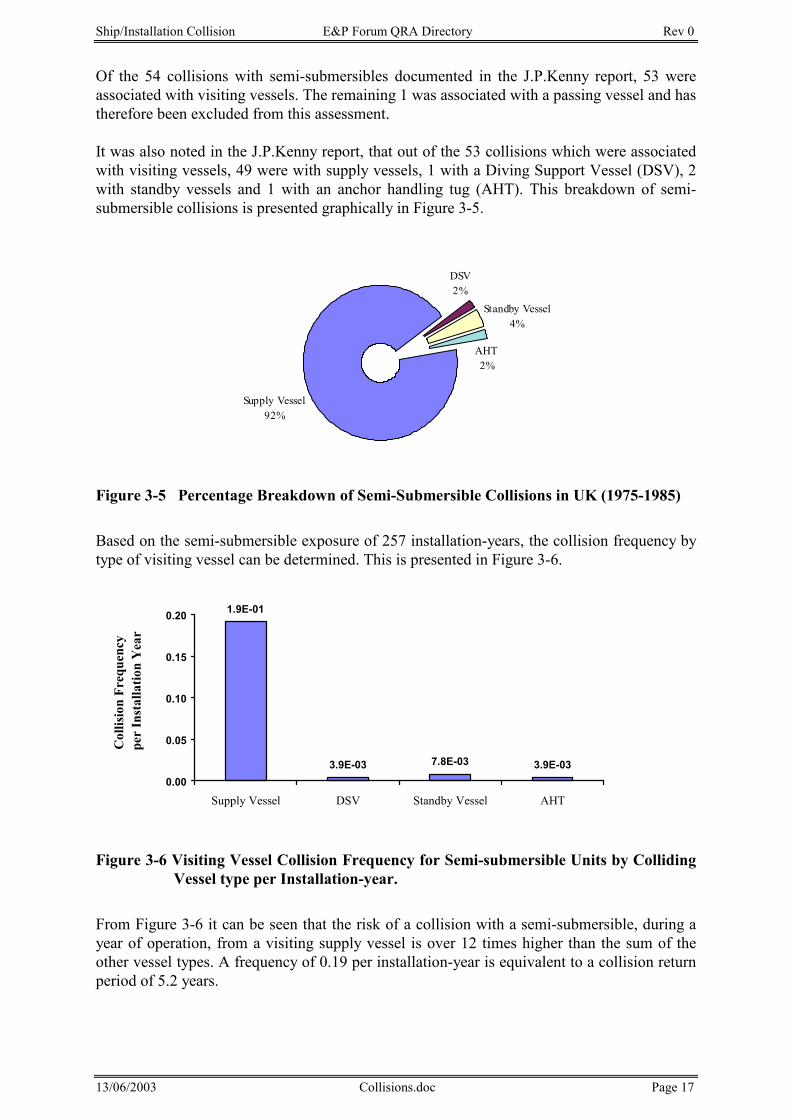
Ship/Installation Collision E&P Forum QRA Directory Rev 0
13/06/2003 Collisions.doc Page 17
Of the 54 collisions with semi-submersibles documented in the J.P.Kenny report, 53 were associated with visiting vessels. The remaining 1 was associated with a passing vessel and has therefore been excluded from this assessment. It was also noted in the J.P.Kenny report, that out of the 53 collisions which were associated with visiting vessels, 49 were with supply vessels, 1 with a Diving Support Vessel (DSV), 2 with standby vessels and 1 with an anchor handling tug (AHT). This breakdown of semi-submersible collisions is presented graphically in Figure 3-5.
Supply Vessel92%
AHT2%
Standby Vessel4%
DSV2%
Figure 3-5 Percentage Breakdown of Semi-Submersible Collisions in UK (1975-1985)
Based on the semi-submersible exposure of 257 installation-years, the collision frequency by type of visiting vessel can be determined. This is presented in Figure 3-6.
1.9E-01
3.9E-03 7.8E-03 3.9E-030.00
0.05
0.10
0.15
0.20
Supply Vessel DSV Standby Vessel AHT
Col
lisio
nFr
eque
ncy
per
Inst
alla
tion
Yea
r
Figure 3-6 Visiting Vessel Collision Frequency for Semi-submersible Units by Colliding Vessel type per Installation-year.
From Figure 3-6 it can be seen that the risk of a collision with a semi-submersible, during a year of operation, from a visiting supply vessel is over 12 times higher than the sum of the other vessel types. A frequency of 0.19 per installation-year is equivalent to a collision return period of 5.2 years.
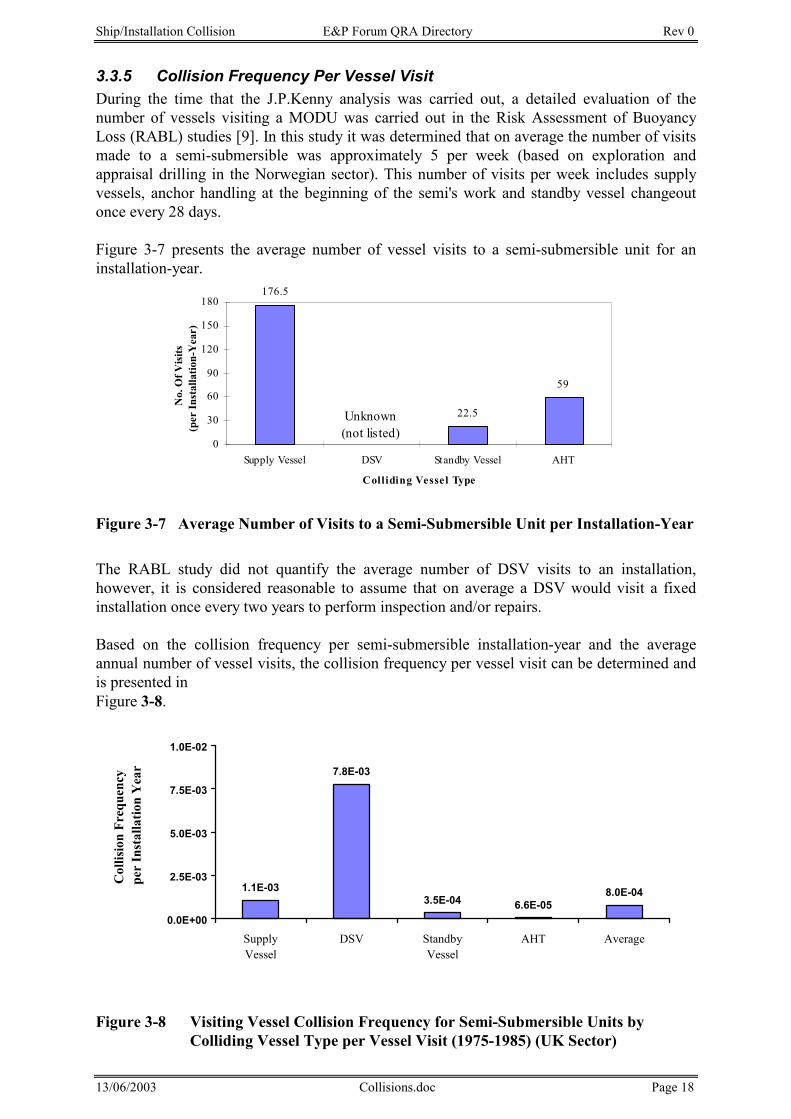
Ship/Installation Collision E&P Forum QRA Directory Rev 0
13/06/2003 Collisions.doc Page 18
3.3.5 Collision Frequency Per Vessel Visit During the time that the J.P.Kenny analysis was carried out, a detailed evaluation of the number of vessels visiting a MODU was carried out in the Risk Assessment of Buoyancy Loss (RABL) studies [9]. In this study it was determined that on average the number of visits made to a semi-submersible was approximately 5 per week (based on exploration and appraisal drilling in the Norwegian sector). This number of visits per week includes supply vessels, anchor handling at the beginning of the semi's work and standby vessel changeout once every 28 days. Figure 3-7 presents the average number of vessel visits to a semi-submersible unit for an installation-year.
176.5
22.5
59
0
30
60
90
120
150
180
Supply Vessel DSV Standby Vessel AHT
Colliding Vessel Type
No.
OfV
isits
(per
Inst
alla
tion-
Yea
r)
Unknown(not listed)
Figure 3-7 Average Number of Visits to a Semi-Submersible Unit per Installation-Year
The RABL study did not quantify the average number of DSV visits to an installation, however, it is considered reasonable to assume that on average a DSV would visit a fixed installation once every two years to perform inspection and/or repairs. Based on the collision frequency per semi-submersible installation-year and the average annual number of vessel visits, the collision frequency per vessel visit can be determined and is presented in Figure 3-8.
1.1E-03
7.8E-03
3.5E-04 6.6E-058.0E-04
0.0E+00
2.5E-03
5.0E-03
7.5E-03
1.0E-02
SupplyVessel
DSV StandbyVessel
AHT Average
Col
lisio
nFr
eque
ncy
per
Inst
alla
tion
Yea
r
Figure 3-8 Visiting Vessel Collision Frequency for Semi-Submersible Units by Colliding Vessel Type per Vessel Visit (1975-1985) (UK Sector)
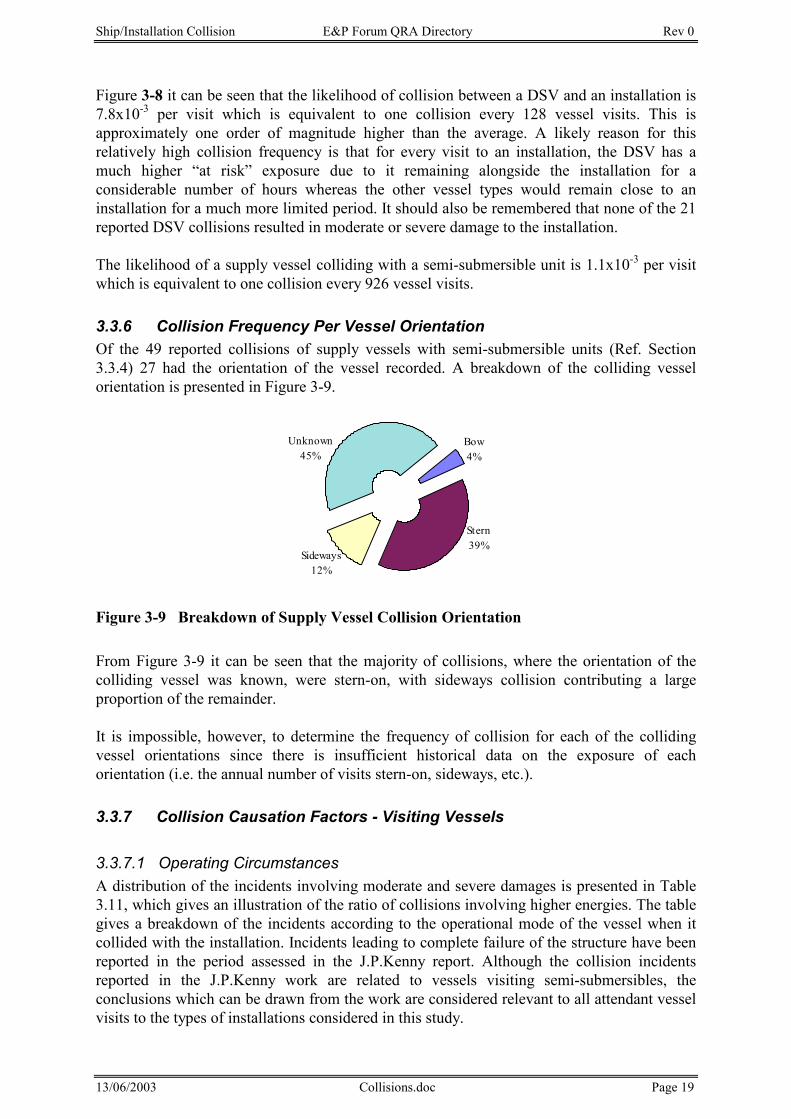
Ship/Installation Collision E&P Forum QRA Directory Rev 0
13/06/2003 Collisions.doc Page 19
Figure 3-8 it can be seen that the likelihood of collision between a DSV and an installation is 7.8x10⁻³ per visit which is equivalent to one collision every 128 vessel visits. This is approximately one order of magnitude higher than the average. A likely reason for this relatively high collision frequency is that for every visit to an installation, the DSV has a much higher “at risk” exposure due to it remaining alongside the installation for a considerable number of hours whereas the other vessel types would remain close to an installation for a much more limited period. It should also be remembered that none of the 21 reported DSV collisions resulted in moderate or severe damage to the installation. The likelihood of a supply vessel colliding with a semi-submersible unit is 1.1x10⁻³ per visit which is equivalent to one collision every 926 vessel visits.
3.3.6 Collision Frequency Per Vessel Orientation Of the 49 reported collisions of supply vessels with semi-submersible units (Ref. Section 3.3.4) 27 had the orientation of the vessel recorded. A breakdown of the colliding vessel orientation is presented in Figure 3-9.
Bow4%
Stern39%
Sideways12%
Unknown45%
Figure 3-9 Breakdown of Supply Vessel Collision Orientation From Figure 3-9 it can be seen that the majority of collisions, where the orientation of the colliding vessel was known, were stern-on, with sideways collision contributing a large proportion of the remainder. It is impossible, however, to determine the frequency of collision for each of the colliding vessel orientations since there is insufficient historical data on the exposure of each orientation (i.e. the annual number of visits stern-on, sideways, etc.).
3.3.7 Collision Causation Factors - Visiting Vessels
3.3.7.1 Operating Circumstances A distribution of the incidents involving moderate and severe damages is presented in Table 3.11, which gives an illustration of the ratio of collisions involving higher energies. The table gives a breakdown of the incidents according to the operational mode of the vessel when it collided with the installation. Incidents leading to complete failure of the structure have been reported in the period assessed in the J.P.Kenny report. Although the collision incidents reported in the J.P.Kenny work are related to vessels visiting semi-submersibles, the conclusions which can be drawn from the work are considered relevant to all attendant vessel visits to the types of installations considered in this study.
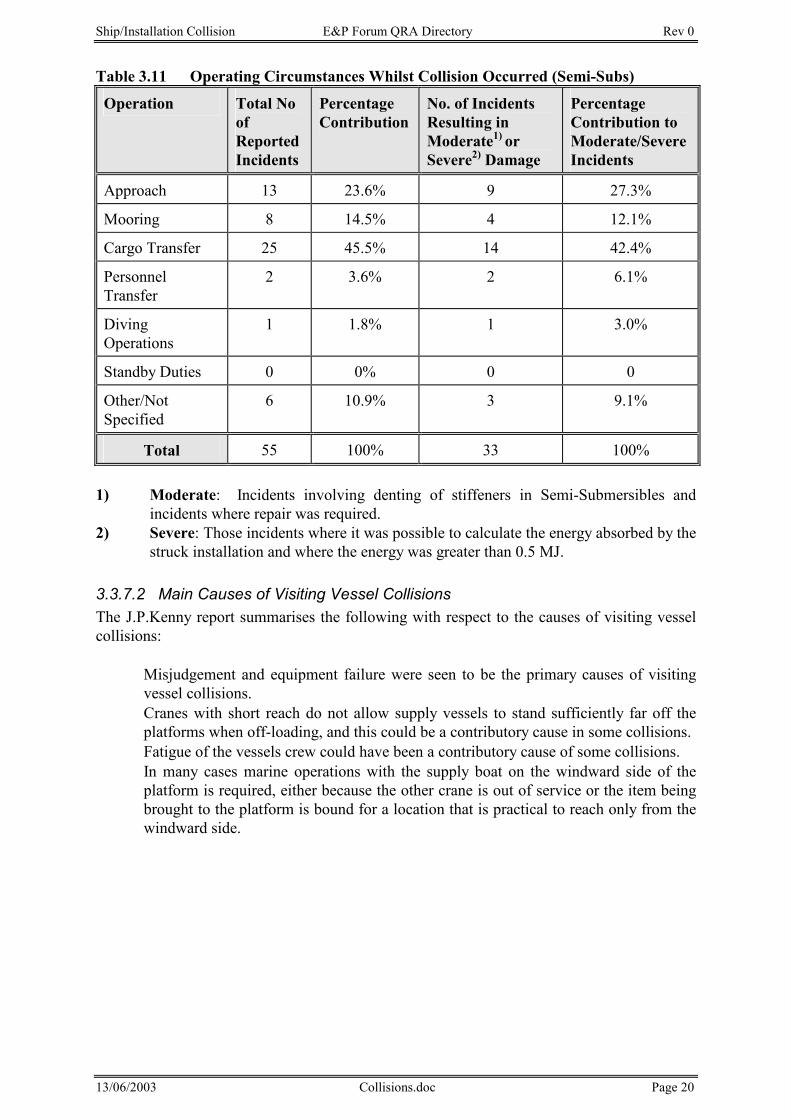
Ship/Installation Collision E&P Forum QRA Directory Rev 0
13/06/2003 Collisions.doc Page 20
Table 3.11 Operating Circumstances Whilst Collision Occurred (Semi-Subs)
Operation Total No of Reported Incidents
Percentage Contribution
No. of Incidents Resulting in Moderate1) or Severe2) Damage
Percentage Contribution to Moderate/Severe Incidents
Approach 13 23.6% 9 27.3%
Mooring 8 14.5% 4 12.1%
Cargo Transfer 25 45.5% 14 42.4%
Personnel Transfer
2 3.6% 2 6.1%
Diving Operations
1 1.8% 1 3.0%
Standby Duties 0 0% 0 0
Other/Not Specified
6 10.9% 3 9.1%
Total 55 100% 33 100%
1) Moderate: Incidents involving denting of stiffeners in Semi-Submersibles and incidents where repair was required.
2) Severe: Those incidents where it was possible to calculate the energy absorbed by the struck installation and where the energy was greater than 0.5 MJ.
3.3.7.2 Main Causes of Visiting Vessel Collisions The J.P.Kenny report summarises the following with respect to the causes of visiting vessel collisions: • Misjudgement and equipment failure were seen to be the primary causes of visiting
vessel collisions. • Cranes with short reach do not allow supply vessels to stand sufficiently far off the
platforms when off-loading, and this could be a contributory cause in some collisions. • Fatigue of the vessels crew could have been a contributory cause of some collisions. • In many cases marine operations with the supply boat on the windward side of the
platform is required, either because the other crane is out of service or the item being brought to the platform is bound for a location that is practical to reach only from the windward side.
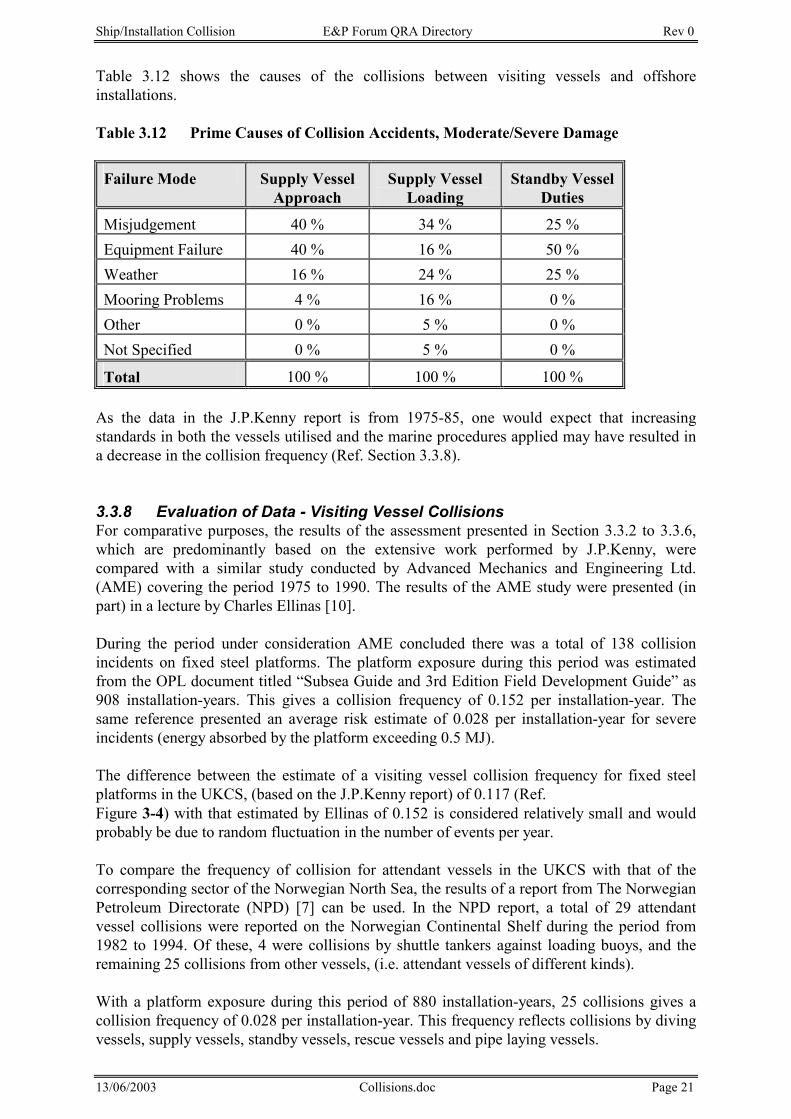
Ship/Installation Collision E&P Forum QRA Directory Rev 0
13/06/2003 Collisions.doc Page 21
Table 3.12 shows the causes of the collisions between visiting vessels and offshore installations. Table 3.12 Prime Causes of Collision Accidents, Moderate/Severe Damage
Failure Mode Supply Vessel Approach
Supply Vessel Loading
Standby Vessel Duties
Misjudgement 40 % 34 % 25 % Equipment Failure 40 % 16 % 50 % Weather 16 % 24 % 25 % Mooring Problems 4 % 16 % 0 % Other 0 % 5 % 0 % Not Specified 0 % 5 % 0 %
Total 100 % 100 % 100 %
As the data in the J.P.Kenny report is from 1975-85, one would expect that increasing standards in both the vessels utilised and the marine procedures applied may have resulted in a decrease in the collision frequency (Ref. Section 3.3.8).
3.3.8 Evaluation of Data - Visiting Vessel Collisions For comparative purposes, the results of the assessment presented in Section 3.3.2 to 3.3.6, which are predominantly based on the extensive work performed by J.P.Kenny, were compared with a similar study conducted by Advanced Mechanics and Engineering Ltd. (AME) covering the period 1975 to 1990. The results of the AME study were presented (in part) in a lecture by Charles Ellinas [10]. During the period under consideration AME concluded there was a total of 138 collision incidents on fixed steel platforms. The platform exposure during this period was estimated from the OPL document titled “Subsea Guide and 3rd Edition Field Development Guide” as 908 installation-years. This gives a collision frequency of 0.152 per installation-year. The same reference presented an average risk estimate of 0.028 per installation-year for severe incidents (energy absorbed by the platform exceeding 0.5 MJ). The difference between the estimate of a visiting vessel collision frequency for fixed steel platforms in the UKCS, (based on the J.P.Kenny report) of 0.117 (Ref. Figure 3-4) with that estimated by Ellinas of 0.152 is considered relatively small and would probably be due to random fluctuation in the number of events per year. To compare the frequency of collision for attendant vessels in the UKCS with that of the corresponding sector of the Norwegian North Sea, the results of a report from The Norwegian Petroleum Directorate (NPD) [7] can be used. In the NPD report, a total of 29 attendant vessel collisions were reported on the Norwegian Continental Shelf during the period from 1982 to 1994. Of these, 4 were collisions by shuttle tankers against loading buoys, and the remaining 25 collisions from other vessels, (i.e. attendant vessels of different kinds). With a platform exposure during this period of 880 installation-years, 25 collisions gives a collision frequency of 0.028 per installation-year. This frequency reflects collisions by diving vessels, supply vessels, standby vessels, rescue vessels and pipe laying vessels.
Ship/Installation Collision E&P Forum QRA Directory Rev 0
13/06/2003 Collisions.doc Page 22
The structural damage to the platforms has in general been small or insignificant, with the exception of six collisions causing expensive structural repair work. The reason for the considerable difference between the collisions frequencies found for the UK and Norwegian Sectors (0.117 and 0.028 per annum respectively) is unclear. However, following a review of incident reports carried out by the NPD [7], the reason for the difference in frequency is not due to lack of reporting of Norwegian offshore collisions. Some of the difference may be accounted to different attendant vessel operation procedures, mooring techniques, allowable weather criteria, etc. It should be noted that the statistics from the Norwegian Sector are from the period 1982-1994 and for the UK Sector 1975-1985 and 1975-1990. The difference in periods, 10 years versus 25 years and the improved incident reporting and operating standards over time could account for the difference. A major development of the supply and standby vessels has taken place from the first generation to the present, modern vessels. Aspects which may be mentioned, are:
• improved man/machine system
• improved manoeuvring characteristics
• machinery/electrical back-up systems
• more reliable components
• thruster power available
• introduction of cranes with wider operating ranges
• the size of the supply vessel's working area
Platform type (jacket, Con-deep, Semi-Sub., etc.), distances to structural elements, alternative working areas related to different wind directions, etc. will also influence the risk of collision. These factors have to be considered case by case. However, no obvious trend in the annual risk estimates for incidents to platforms is seen from AME [10] which presents the annual incident risk for each year over the period considered. It is however worth noting that the NPD collision frequency of 0.028 per installation-year is identical to that presented by Ellinas for collisions with a platform absorbed energy in excess of 0.5 MJ. This indicates that there may be a possible inconsistency in the reporting criteria (e.g. terminology) between the two reporting systems.
Ship/Installation Collision E&P Forum QRA Directory Rev 0
13/06/2003 Collisions.doc Page 23
4 COLLISION FREQUENCY MODELLING
4.1 Introduction This Section gives an overview over which factors which should be considered for collision frequency assessment. The basis for collision risk assessment will be ship traffic data. This could be based on site specific traffic surveys or available traffic databases.
4.2 Ship/Installation Collision Frequency Modelling
4.2.1 Important Factors Affecting Collision Frequency The modelling of collision risk is based on the factors that will influence the collision process, i.e. those factors which will affect the probability of a collision as well as the consequences. Generally, these can be described as :
• Location specific factors. • Rig/platform specific features. • Traffic behaviour. The collision risk will be more or less proportional to the traffic density. It is therefore important to model the actual traffic pattern(s) in the area studied.
The main factors in each of these groups and their influence on the collision frequency are summarised in Table 4.1.
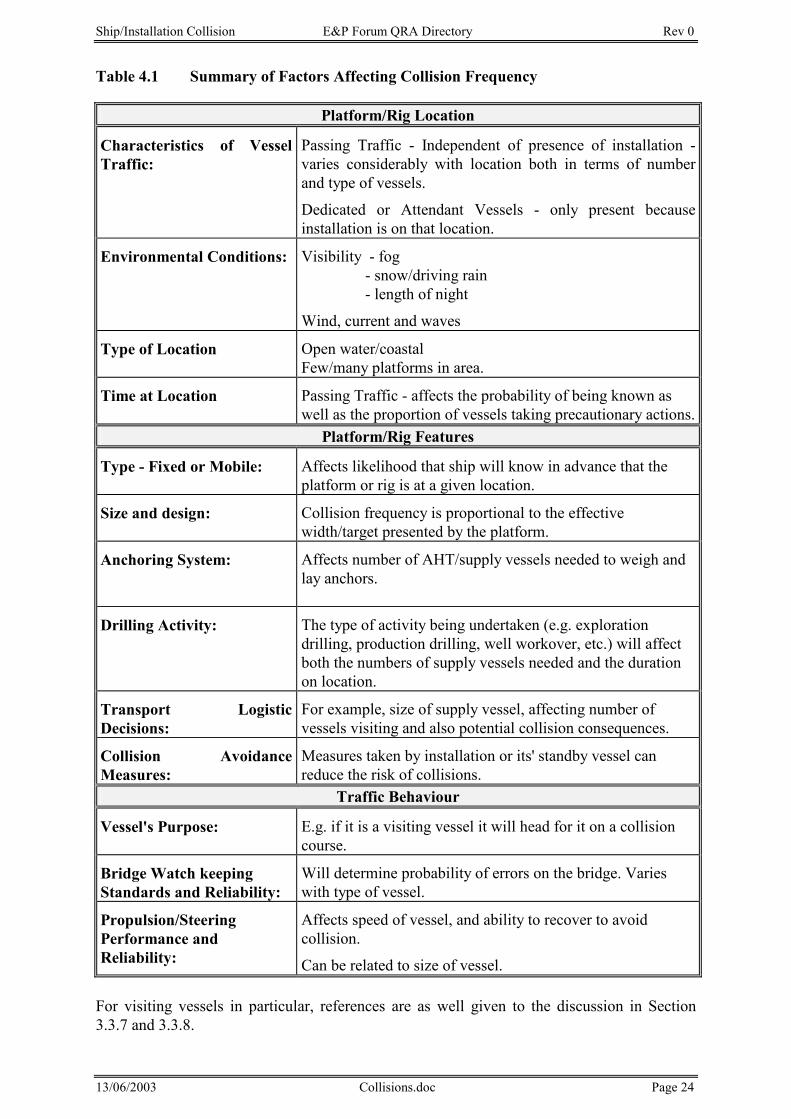
Ship/Installation Collision E&P Forum QRA Directory Rev 0
13/06/2003 Collisions.doc Page 24
Table 4.1 Summary of Factors Affecting Collision Frequency
Platform/Rig Location
Characteristics of Vessel Traffic:
Passing Traffic - Independent of presence of installation -varies considerably with location both in terms of number and type of vessels.
Dedicated or Attendant Vessels - only present because installation is on that location.
Environmental Conditions: Visibility - fog - snow/driving rain - length of night
Wind, current and waves
Type of Location Open water/coastal Few/many platforms in area.
Time at Location Passing Traffic - affects the probability of being known as well as the proportion of vessels taking precautionary actions.
Platform/Rig Features
Type - Fixed or Mobile: Affects likelihood that ship will know in advance that the platform or rig is at a given location.
Size and design: Collision frequency is proportional to the effective width/target presented by the platform.
Anchoring System: Affects number of AHT/supply vessels needed to weigh and lay anchors.
Drilling Activity: The type of activity being undertaken (e.g. exploration drilling, production drilling, well workover, etc.) will affect both the numbers of supply vessels needed and the duration on location.
Transport Logistic Decisions:
For example, size of supply vessel, affecting number of vessels visiting and also potential collision consequences.
Collision Avoidance Measures:
Measures taken by installation or its' standby vessel can reduce the risk of collisions.
Traffic Behaviour
Vessel's Purpose: E.g. if it is a visiting vessel it will head for it on a collision course.
Bridge Watch keeping Standards and Reliability:
Will determine probability of errors on the bridge. Varies with type of vessel.
Propulsion/Steering Performance and Reliability:
Affects speed of vessel, and ability to recover to avoid collision.
Can be related to size of vessel.
For visiting vessels in particular, references are as well given to the discussion in Section 3.3.7 and 3.3.8.
Ship/Installation Collision E&P Forum QRA Directory Rev 0
13/06/2003 Collisions.doc Page 25
4.2.2 Collision Frequency Models According to MaTSU(Marine Technology Support Unit) [11] three models are currently available for predicting the collision frequency of a ship with an offshore platform located in either the North Sea or the Irish Sea. Two are commercially available. The third model is the property of the DGSM (Directorate General of Shipping and Maritime Affairs - the Netherlands). The models have been used extensively within the UK, Norway and the Netherlands to help quantify the risk to an offshore platform from the ship collision hazard. Comparative studies performed for the UK-HSE (OSD) in the UK revealed significant variations in the collision frequencies predicted by the 2 commercial models [11]. 4.3 Vessel Traffic Pattern and Volume 4.3.1 General The traffic volume is probably the parameter which most directly can be based on observations and which can be treated statistically without having to apply analytical considerations or engineering judgement. This is therefore also the parameter which requires the least engineering effort in terms of modelling but will require considerable data gathering effort if the information is not already available. Any database also needs to be updated regularly. Seagoing traffic patterns invariably change with time. To some extent, such changes can be foreseen, but a certain element of unpredictability will always be present. For this reason, it may be wise to perform spot checks whenever a detailed risk analysis is performed or updated. In Section 4.3.2, some factors which are likely to affect the traffic volume have been identified and are discussed briefly. There is no general rule as to how large the influence of each factor will be, this will depend on the platform location and will vary. Nevertheless, these factors may be used as a check list when performing a risk analysis. The discussion gives an indication of influence each factor may have on traffic volume.
4.3.2 Factors Affecting the Traffic Volume The most important factor which will affect the traffic volume are changes in the activity level in the ports which generate traffic into the area in question. In particular for small routes, such changes may have a significant effect on the traffic volume. Many routes in the North Sea have traffic volumes of less than 1000 vessels annually and even if the traffic increases with only one passage per day, the increase in the traffic volume will still be about one third of a route with such a traffic volume. Such changes should therefore be taken into consideration. In most cases, the risk is calculated on an annual basis, and seasonal variations are thus of little importance. However, if one is interested in the risk level during only a limited period, e.g. in order to assess the risk for an installation period or another operation, variations over the year should be assumed.These variations may have several reasons:
• Some routes may be operated during only a part of the year. Typical of these are ferry routes.
• Due to generally worse weather conditions during the winter there may be differences in choice of route.
• In some specific cases certain ship traffic may be reduced during parts of the year.
Ship/Installation Collision E&P Forum QRA Directory Rev 0
13/06/2003 Collisions.doc Page 26
These aspects should be taken into consideration when the traffic volumes for different routes or areas are estimated. In some cases, such seasonal variations are defined in the routes presented. An effect which is similar to the weather routing effect is the effect of the vessel size. Larger vessels may tend to choose different courses from smaller vessels, either because the water depth is limited or because larger vessels are less affected by bad weather and thus do not have to take such considerations into account. A particular weather related effect is the possibility that routes may be constantly deviated due to prevailing winds and current. This has not been taken into account when the route pattern was established, but may be considered. However, this effect is likely to be marginal because the vessels will correct their courses regularly. If a route passes very close to a platform, the effect may be of some importance because a larger proportion of the vessels than otherwise would be expected may choose to pass the platform on the leeward side.
4.3.3 How to get Traffic Data The three collision frequency models considered by MaTSU in [11] (Ref. Section 4.2.2) have as well integrated traffic databases. Other traffic databases do exist and are also commercially available. A traffic database (traffic volume, traffic pattern, ship sizes, ship speeds, etc.) could be established for a certain project based on the following sources (this could be necessary if traffic databases for the specific area are considered not to be of adequate quality, not updated or not existing):
• Data from Lloyds Maritime Information Services (or similar) to determine the number
of merchant vessel movements as well as the types and sizes. • Information on the movements of ferries, shuttle tankers and offshore vessels (supply
and standby vessels) as provided by ferry and offshore operators respectively. • Traffic surveys carried out by standby vessels, dedicated survey vessels and platform
and shore based radar systems, to determine the positions of the different routes as they pass through survey locations.
• Information provided by the Coastguard, the defence and/or harbour authorities. • Information provided by mariners and vessel passage plans
Several data sources should be combined in order to determine the route patterns.
Ship/Installation Collision E&P Forum QRA Directory Rev 0
13/06/2003 Collisions.doc Page 27
5 COLLISION CONSEQUENCES
5.1 General This datasheet puts emphasis on the determination of the likelihood of various types of collision for a range of vessel and installation combinations. The consequences in the event of a collision are not covered in detail here. Consequence analysis would be on a case specific basis and take into account: • Installation type: 1) Fixed: steel, concrete, tension leg etc, 2) Jack-up, 3) Semi-
submersible • Impact duration compared with the natural period of the installation motion • Mass, velocity, impact direction and energy absorbtion characteristics of the colliding
vessel and impacted installation • Structural response of the vessel and installation • Potential escalation events following initial impact (eg loss of containment, fire,
explosion, evacuation, escape and rescue) covered in other datasheets.
Ship/Installation Collision E&P Forum QRA Directory Rev 0
13/06/2003 Collisions.doc Page 28
6 RISK REDUCING MEASURES Risk reducing measures and their effect has been considered in many research projects, among them [12] and an ongoing UK HSE project (Ref. Section 7.3).
6.1 Use of Risk Reducing Measures Risk reducing measures comprise probability reducing as well as consequence reducing measures, including contingency measures. Priority should be given to risk reducing measures which can detect the potential for collision as early as possible and which can contribute to avoiding the collision. (For example, a warning of a potential collision as early as possible via a collision warning system on the platform and/or standby.) This is often also the most effective way to reduce the collision risk. Reducing the consequences of a collision, primarily by increasing the impact resistance of the platform will, in many cases, require significant effort and investment to be effective.
6.2 Overview of Risk Reducing Measures The effect of different risk reducing measures can most readily be identified by looking at the modelling which has been used for the different vessel groups. • Powered passing • Drifting passing and drifting nearby • Powered nearby • Floating Unit in Drift A systematic approach to identification of risk reducing measures will be to look at the different parameters modelled and see whether it is possible to affect the parameters to reduce the risk.
Ship/Installation Collision E&P Forum QRA Directory Rev 0
13/06/2003 Collisions.doc Page 29
7 RESEARCH AND DEVELOPMENT PROJECTS
7.1 Introduction Currently there are three known ongoing research and development projects related to collision risk in the North Sea.
7.2 UK Continental Shelf Shipping Traffic Database A joint industry project started early 1995 to create a database of shipping patterns on the UK Continental Shelf (UKCS). It is sponsored by the UK Department of Transport, UK Offshore Operators Association (UKOOA) and the UK Health and Safety Executive (HSE). Vessel traffic data is being collected by standby vessels, platform and onshore based radar systems throughout the UKCS, supported by information from Lloyds’ port logs of vessel movements across Europe. The first and main phase of the project, which was to establish a traffic database, was completed in January 1996 [13]. There were several objectives for establishing the database. First of all it is desirable to know where the major shipping routes are concentrated around UK waters allowing for assessments of environmental risks associated with shipping. This way the determination of the best locations for rescue, salvage and counter pollution resources around the UK can be done. Another objective is to establish the location of major shipping routes in relation to future oil and gas developments. The HSE wishes to establish a reliable database that can be used to predict the risks associated with collisions between passing vessels and offshore installations. This will provide some standardisation to the industry and encourage operators to obtain an understanding of the traffic patterns around their offshore installations and use this to evaluate risk and develop emergency plans and resources to manage the risk. The database which is commercially available, will be updated annually to ensure that it remains reliable and up to date. The work planned for next phase includes establishment of chart plots, further traffic surveys to be carried out and analysed, and collections of further information on offshore field related traffic.
7.3 The Effectiveness of Collision Control & Avoidance Systems This project is carried out for the HSE. Several topics are considered. The first task is identification and review of systems currently utilised by duty holders on the UKCS to identify and control the threat posed by shipping, and identification of any other systems in use world-wide or other transport sectors where a collision threat exists. The prime accident causation factors in collision scenarios are determined, and it is identified how a general collision avoidance system may intervene. A qualitative review of the effectiveness of these systems upon the causation factors is done, followed by a quantification of the effectiveness. Finally an evaluation of the systems identified is performed, to see how they could improve or complement any of the systems currently in use.
Ship/Installation Collision E&P Forum QRA Directory Rev 0
13/06/2003 Collisions.doc Page 30
7.4 Comparison of ship-platform collision frequency models. The background for this study is that regulatory bodies covering the different international sectors of the North Sea would like to develop a standardised risk assessment method to guarantee consistency in the safety management. This is based on the fact that ship collision risk is one of the major external factors contributing to the risk to an offshore installation, and that a critical review of the existing collision models has revealed large differences between the models. The project, which is sponsored by several authorities around the North Sea.
Ship/Installation Collision E&P Forum QRA Directory Rev 0
13/06/2003 Collisions.doc Page 31
8 REFERENCES
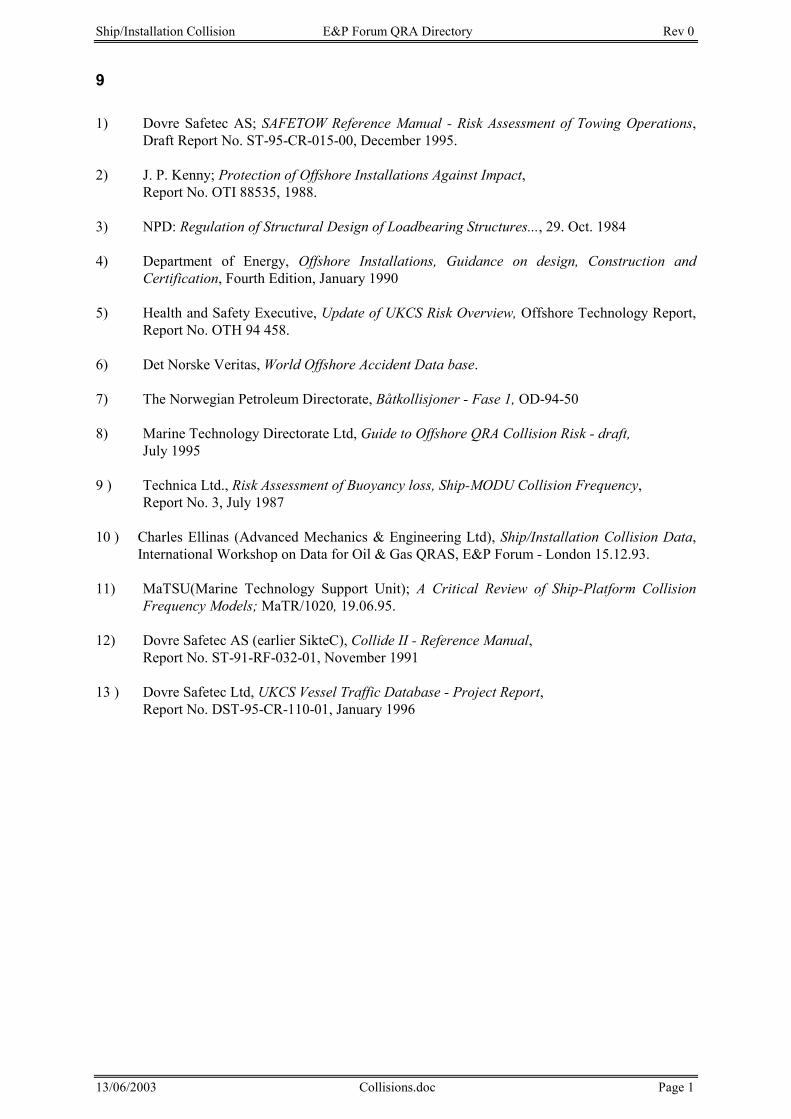
Ship/Installation Collision E&P Forum QRA Directory Rev 0
13/06/2003 Collisions.doc Page 1
9
1) Dovre Safetec AS; SAFETOW Reference Manual - Risk Assessment of Towing Operations,Draft Report No. ST-95-CR-015-00, December 1995.
2) J. P. Kenny; Protection of Offshore Installations Against Impact,
Report No. OTI 88535, 1988. 3) NPD: Regulation of Structural Design of Loadbearing Structures..., 29. Oct. 1984 4) Department of Energy, Offshore Installations, Guidance on design, Construction and
Certification, Fourth Edition, January 1990 5) Health and Safety Executive, Update of UKCS Risk Overview, Offshore Technology Report,
Report No. OTH 94 458.
6) Det Norske Veritas, World Offshore Accident Data base.
7) The Norwegian Petroleum Directorate, Båtkollisjoner - Fase 1, OD-94-50 8) Marine Technology Directorate Ltd, Guide to Offshore QRA Collision Risk - draft, July 1995 9 ) Technica Ltd., Risk Assessment of Buoyancy loss, Ship-MODU Collision Frequency,
Report No. 3, July 1987 10 ) Charles Ellinas (Advanced Mechanics & Engineering Ltd), Ship/Installation Collision Data,
International Workshop on Data for Oil & Gas QRAS, E&P Forum - London 15.12.93. 11) MaTSU(Marine Technology Support Unit); A Critical Review of Ship-Platform Collision Frequency Models; MaTR/1020, 19.06.95. 12) Dovre Safetec AS (earlier SikteC), Collide II - Reference Manual,
Report No. ST-91-RF-032-01, November 1991 13 ) Dovre Safetec Ltd, UKCS Vessel Traffic Database - Project Report,
Report No. DST-95-CR-110-01, January 1996
Extreme Weather Risk E&P Forum QRA Directory Rev 0
21/03/97 Extweath.doc Page1
EXTREME WEATHER RISK
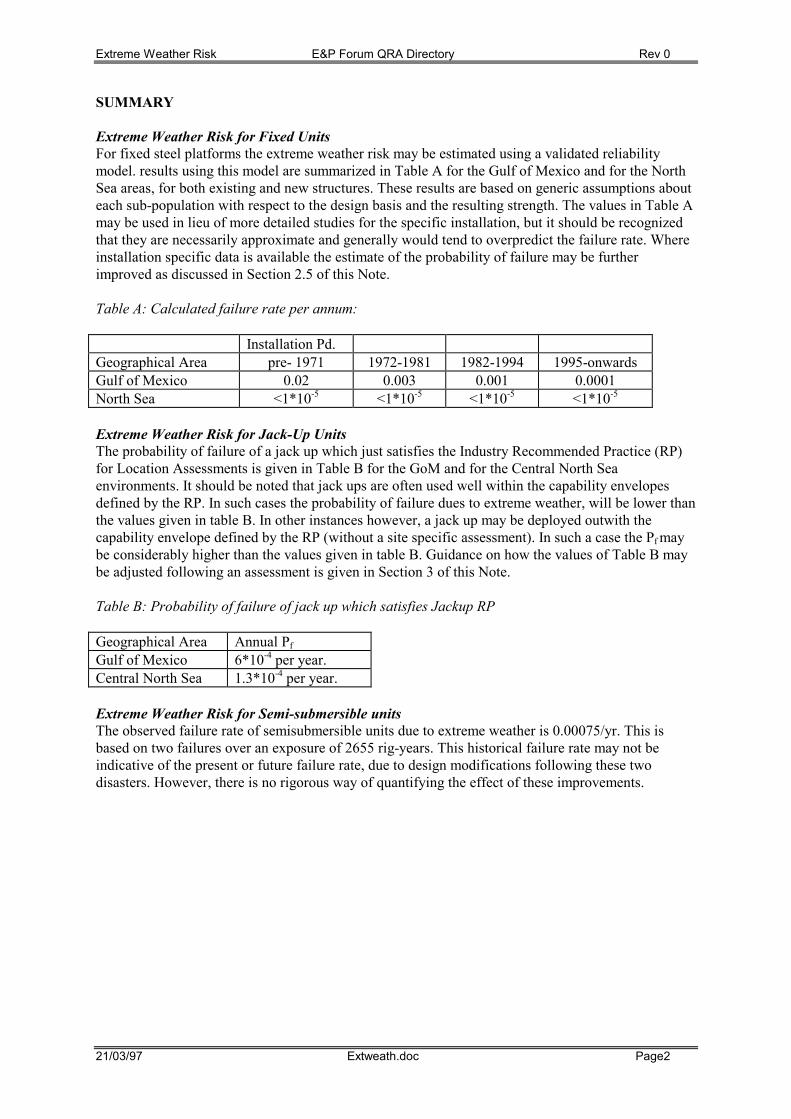
Extreme Weather Risk E&P Forum QRA Directory Rev 0
21/03/97 Extweath.doc Page2
SUMMARY Extreme Weather Risk for Fixed Units For fixed steel platforms the extreme weather risk may be estimated using a validated reliability model. results using this model are summarized in Table A for the Gulf of Mexico and for the North Sea areas, for both existing and new structures. These results are based on generic assumptions about each sub-population with respect to the design basis and the resulting strength. The values in Table A may be used in lieu of more detailed studies for the specific installation, but it should be recognized that they are necessarily approximate and generally would tend to overpredict the failure rate. Where installation specific data is available the estimate of the probability of failure may be further improved as discussed in Section 2.5 of this Note. Table A: Calculated failure rate per annum:
Installation Pd. Geographical Area pre- 1971 1972-1981 1982-1994 1995-onwards Gulf of Mexico 0.02 0.003 0.001 0.0001 North Sea <1*10-5 <1*10-5 <1*10-5 <1*10-5
Extreme Weather Risk for Jack-Up Units The probability of failure of a jack up which just satisfies the Industry Recommended Practice (RP) for Location Assessments is given in Table B for the GoM and for the Central North Sea environments. It should be noted that jack ups are often used well within the capability envelopes defined by the RP. In such cases the probability of failure dues to extreme weather, will be lower than the values given in table B. In other instances however, a jack up may be deployed outwith the capability envelope defined by the RP (without a site specific assessment). In such a case the Pf may be considerably higher than the values given in table B. Guidance on how the values of Table B may be adjusted following an assessment is given in Section 3 of this Note. Table B: Probability of failure of jack up which satisfies Jackup RP Geographical Area Annual Pf
Gulf of Mexico 6*10-4 per year. Central North Sea 1.3*10-4 per year.
Extreme Weather Risk for Semi-submersible units The observed failure rate of semisubmersible units due to extreme weather is 0.00075/yr. This is based on two failures over an exposure of 2655 rig-years. This historical failure rate may not be indicative of the present or future failure rate, due to design modifications following these two disasters. However, there is no rigorous way of quantifying the effect of these improvements.
Extreme Weather Risk E&P Forum QRA Directory Rev 0
21/03/97 Extweath.doc Page3
1. SCOPE This data sheet is concerned with the quantification of the probability of failure of offshore installations due to extreme weather. The installation types covered are classified as Fixed Units, Jack-Ups and Semi-submersibles. Fixed Units refers primarily to fixed steel, space frame structures. The great majority of offshore installations fall in this category. Concrete installations are not explicitly addressed. For jack up units the emphasis is on quantifying the probability of failure nits which satisfy the current Industry Recommended Practice for location assessment of jack-ups. For semi-subs the failure rate is primarily based on the historical performance of drilling and accommodation units.
Extreme Weather Risk E&P Forum QRA Directory Rev 0
21/03/97 Extweath.doc Page4
2. EXTREME WEATHER RISK FOR FIXED UNITS
2.1 Fixed Platform Exposure and Accident Statistics
This section presents data on the expected failure rate of fixed offshore installations due to extreme weather. The failure rate for a given installation depends, among other factors, on the design standard used, the metocean design conditions, fabrication practices and the geographical area. The design standards and practices have changed significantly over time and hence the existing population of fixed offshore platforms is not a homogeneous one. Historical statistics on failure rates (derived from existing databases such as WOAD, ref. 1) can be useful provided the data relates to a population which is reasonably homogeneous, that the exposure period is significant and the data source is reliable. Moreover, if for a given homogeneous population the number of failures is zero, it means that a historical failure rate can not be estimated with any degree of confidence. for such populations a calibrated/validated predictive model provides the only sound basis for predicting failure rates. Such a model is available (see ref.2) and is used here after a review of the historical performance. Exposure statistics for the Gulf of Mexico (GoM) and the North Sea areas have been extracted from WOAD and are summarized in Table 1. It is seen that the experience base in the GoM (72272 platform-years over the period 1970-1993) is considerably larger than in the North Sea. Table 1: Fixed Platform exposure statistics Geographical Area Platform-Years
(1970-1979) Platform Years (1980-1993)
Platform Years (1970-1993)
No. of Platforms (1993)
Gulf of Mexico 21531 50741 72272 3955 North Sea 389 3087 3476 356 Worldwide 23304 73051 96255 6349
Information on platform failures can also be obtained from WOAD for failures which occurred after 1970. A more complete record of platform failures over the entire period of offshore activity, (1974-1993) is available in the Final Report on the Hurricane Andrew JIP (ref. 3) and is summarized in Table 2 below. Table 2: Fixed Platform Failure statistics (excluding caissons) Geographical Area Installation Period No. of failures Gulf of Mexico 1947-1973 61 Gulf of Mexico 1974-1993 0 North Sea 1965-1993 0
A total of 61 platforms have collapsed due to severe weather over the entire period of offshore activity (1947-1993). It is important to note that all these platforms were installed in the GoM before 1973. The majority of collapses occurred in 4 hurricanes, namely, hurricane Hilda (1964, 14 failure), Betsy (1965, 8 failures), Camille (1969, 3 failures) and hurricane Andrew (1992, 25 failures). In addition to these there have been about as many caisson failures; however, caissons have been excluded from the failure statistics because they have not, generally, been designed to the same standard as space frame structures. For consistency caissons should also be excluded from the exposure statistics given in Table 1; Information to do this accurately is not readily available but it is estimated that doing so would reduce the exposure in the GoM from 72272 pl.-yrs. to about 55000 pl.-years over the period 1970-1993.
Extreme Weather Risk E&P Forum QRA Directory Rev 0
21/03/97 Extweath.doc Page5
2.2 Historical failure rates Fig. 1 taken from ref. 2 shows how the design load level has changed over time in the GoM and the N Sea. It is seen that the population of GoM platforms is far from homogeneous from the point of view of design load level. the entire GoM population may be conveniently subdivided into four sub-populations each of which can be regarded as homogeneous. It should be pointed out that this is an idealization because there exist some differences among US operators. However, these differences are not very significant. A notable difference between GoM and North Sea is that all design load levels (relative to the 100-year load) in the North Sea are considerably higher than in the GoM. Inevitably, there will exist some variability in the reliability level within a single population, for instance an 8-legged structure has different reserve strength characteristics to a 4-legged structure. Also the UK provisions (SHE Guidance, ref. 4) are somewhat different from the Norwegian provisions (NOD Regulations, ref. 5). The most significant change in the design load level took place in the GoM around 1970-72 with the introduction of API RP (ref. 6). As a result of these changes the design load level increased by a factor of about 2 (see Fig. 1) and the deck elevation was raised by about aft. This led to a profound improvement in structural reliability as evidenced by the failure statistics. Out of the 61 structures which collapsed over the period 1947-1993, 60 are known to have installed before 1971. For the remaining one structure the situation is not clear. This is platform (Ship Shoal 119) which was installed in 1973 and was found leaning by 10 de after hurricane Andrew (see ref. 3). The design basis of this structure is not known. It could have been designed using the pre-1971 practice or the post -1972 practice or something in-between. Using the above data the failure rate for each population is indicated in Table 3, in terms of the number of recorded failures within each population and the approximate number of platform-years of exposure. It is stressed that the platform-years of exposure, given in Table 3, is necessarily approximate because (I) caissons were excluded from the original WOAD exposure statistics in an approximate manner and (II) because the WOAD data is given in terms of platform-years of exposure over a given period, whereas we need to partition the data as a function of installation periods rather than exposure period. However, this approximation is not very important, because it will be seen below that the historical rates are not directly usable. Table 3: Fixed Platform historical performance and exposure statistics
Geographical Area Installation Period 1947-1971 1972-1981 1982-1994 1995 onwards
Gulf of Mexico 60/2000 (*) 1/30000 (?) 0/10000 0/60 North Sea 0/300 0/2500 0/1000 0/20
(*) = in the notation x/y, x represents the number of failures of structures installed over this period and y represents the approximate number of pl. -yr. of exposure of this population up to 1993. (?) = there is a question mark regarding the design basis of this structure (Ship Shoal 119) which was installed in 1973 and was found leaning by 10 de after hurricane Andrew. If it was designed using the pre-1971 design recipe it should, strictly, be in the first class rather than the second.
Extreme Weather Risk E&P Forum QRA Directory Rev 0
21/03/97 Extweath.doc Page6
From Table 3 it becomes evident that for six out of the eight sub-populations it is NOT possible to estimate a historical failure rate because the number of failures within these populations was zero. Ahistorical failure rate can be calculated for the early (pre-1971) GoM structures. Within this population there have been about 60 structural collapses over an exposure period of about 20000 platform-years. This leads to a historical failure rate of 60/20000 = 0.3% or 1 in 333 platform-yr.. The above failure rate is based on a large number of failures and hence may be considered rather reliable. However, one should bear in mind that the majority of failures have occurred in 4 hurricanes and hence the intensity of these hurricanes, their path and the density of platforms in this path influence the failure rate. The only other population for which a historical failure rate can be estimated is the GoM structures installed over the period 1972-1981. It is estimated that this population experienced an exposure of about 30000 platform-years with only one failure. On the basis of the above evidence the observed failure rate for this population is 3*10-5/yr. Because there was only one failure the estimate is unreliable, being very much dependent on the intensity of this single hurricane. Thus the observed failure rate of 3*10-5/yr calculated above cannot be relied upon. A more rigorous approach is to use the experience in severe hurricanes, such as hurricane Andrew, to validate(or calibrate) a predictive model. Such a predictive model is described in ref. 2 and used below. 2.3 Key elements of predictive model for failure rate of fixed platforms Research and development work carried out over the last 5 years in the area of structural reliability of fixed platforms has resulted in a technological breakthrough. The main contributors to this breakthrough are: • availability of reliable, long records of metocean conditions at an offshore location, derived from
hindcast models. This enables accurate determination of the joint occurrence of waves, currents and winds and the probability of exceedance of such combinations.
• improved models for a probabilistic description of wave loading have been derived and validated by comparing predictions with measurements from the Tern Monitoring System.
• The ultimate Strength of an offshore structure can now be evaluated accurately using non-linear finite element programs such as USFOS. The uncertainty in system strength is better understood and accounted for.
• integration of the above models within a reliability framework enables estimation of the annual probability of failure of the structure due to extreme storms.
The reliability model described in ref. 2 incorporates all of the above features and has been shown to give realistic predictions. However, reliability analysis remains a difficult subject and models with inadequacies in one or more of the above areas can give very misleading results. This is why it is quite important to use a consistent and validated model such as that given in ref. 2. 2.4 Failure rate of fixed platforms based on reliability models
The reliability model whose key features have been described above can provide rather accurate predictions of the reliability of a given installation. Results of generic reliability analyses are presented in Table 4A below, for each of the eight populations discussed above. These may be used in lieu of more detailed studies for the specific installation, but it should be recognized that they are necessarily approximate and generally would tend to overpredict the failure rate. The underlying generic assumptions with respect to platform loading are given in Fig. 1. The generic model with respect to platform ultimate strength has been revised slightly from that given in ref. 2 as follows: RSR = Reseve Strength Ratio =Ultimate Strength/Design Environmental Load
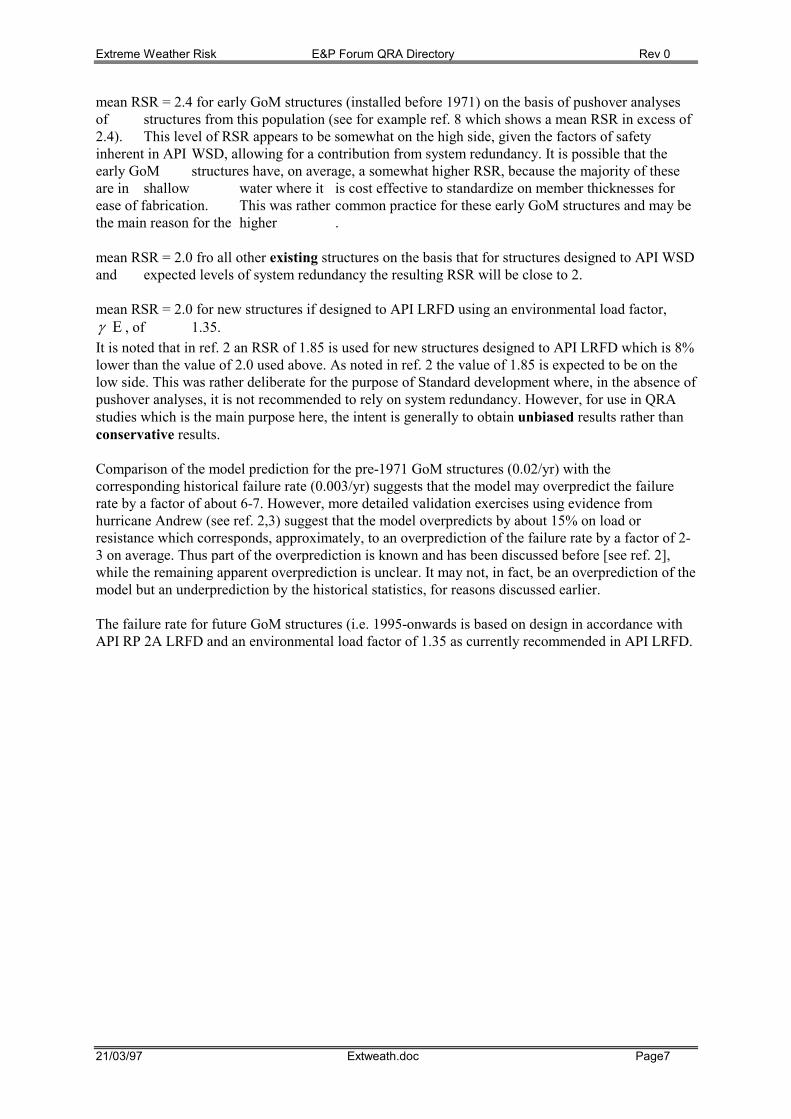
Extreme Weather Risk E&P Forum QRA Directory Rev 0
21/03/97 Extweath.doc Page7
mean RSR = 2.4 for early GoM structures (installed before 1971) on the basis of pushover analyses of structures from this population (see for example ref. 8 which shows a mean RSR in excess of 2.4). This level of RSR appears to be somewhat on the high side, given the factors of safety inherent in API WSD, allowing for a contribution from system redundancy. It is possible that the early GoM structures have, on average, a somewhat higher RSR, because the majority of these are in shallow water where it is cost effective to standardize on member thicknesses for ease of fabrication. This was rather common practice for these early GoM structures and may be the main reason for the higher . mean RSR = 2.0 fro all other existing structures on the basis that for structures designed to API WSD and expected levels of system redundancy the resulting RSR will be close to 2. mean RSR = 2.0 for new structures if designed to API LRFD using an environmental load factor, γ Ε , of 1.35. It is noted that in ref. 2 an RSR of 1.85 is used for new structures designed to API LRFD which is 8% lower than the value of 2.0 used above. As noted in ref. 2 the value of 1.85 is expected to be on the low side. This was rather deliberate for the purpose of Standard development where, in the absence of pushover analyses, it is not recommended to rely on system redundancy. However, for use in QRA studies which is the main purpose here, the intent is generally to obtain unbiased results rather than conservative results. Comparison of the model prediction for the pre-1971 GoM structures (0.02/yr) with the corresponding historical failure rate (0.003/yr) suggests that the model may overpredict the failure rate by a factor of about 6-7. However, more detailed validation exercises using evidence from hurricane Andrew (see ref. 2,3) suggest that the model overpredicts by about 15% on load or resistance which corresponds, approximately, to an overprediction of the failure rate by a factor of 2-3 on average. Thus part of the overprediction is known and has been discussed before [see ref. 2], while the remaining apparent overprediction is unclear. It may not, in fact, be an overprediction of the model but an underprediction by the historical statistics, for reasons discussed earlier. The failure rate for future GoM structures (i.e. 1995-onwards is based on design in accordance with API RP 2A LRFD and an environmental load factor of 1.35 as currently recommended in API LRFD.
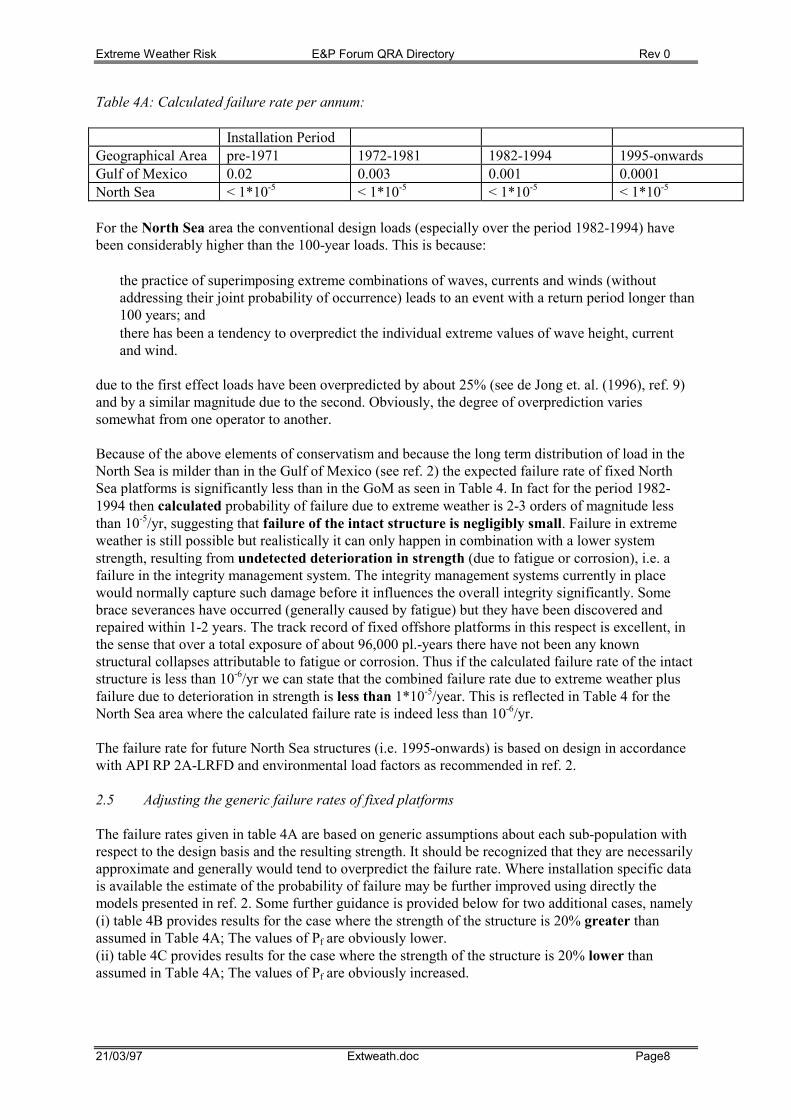
Extreme Weather Risk E&P Forum QRA Directory Rev 0
21/03/97 Extweath.doc Page8
Table 4A: Calculated failure rate per annum:
Installation Period Geographical Area pre-1971 1972-1981 1982-1994 1995-onwards Gulf of Mexico 0.02 0.003 0.001 0.0001 North Sea < 1*10-5 < 1*10-5 < 1*10-5 < 1*10-5
For the North Sea area the conventional design loads (especially over the period 1982-1994) have been considerably higher than the 100-year loads. This is because: • the practice of superimposing extreme combinations of waves, currents and winds (without
addressing their joint probability of occurrence) leads to an event with a return period longer than 100 years; and
• there has been a tendency to overpredict the individual extreme values of wave height, current and wind.
due to the first effect loads have been overpredicted by about 25% (see de Jong et. al. (1996), ref. 9) and by a similar magnitude due to the second. Obviously, the degree of overprediction varies somewhat from one operator to another. Because of the above elements of conservatism and because the long term distribution of load in the North Sea is milder than in the Gulf of Mexico (see ref. 2) the expected failure rate of fixed North Sea platforms is significantly less than in the GoM as seen in Table 4. In fact for the period 1982-1994 then calculated probability of failure due to extreme weather is 2-3 orders of magnitude less than 10-5/yr, suggesting that failure of the intact structure is negligibly small. Failure in extreme weather is still possible but realistically it can only happen in combination with a lower system strength, resulting from undetected deterioration in strength (due to fatigue or corrosion), i.e. a failure in the integrity management system. The integrity management systems currently in place would normally capture such damage before it influences the overall integrity significantly. Some brace severances have occurred (generally caused by fatigue) but they have been discovered and repaired within 1-2 years. The track record of fixed offshore platforms in this respect is excellent, in the sense that over a total exposure of about 96,000 pl.-years there have not been any known structural collapses attributable to fatigue or corrosion. Thus if the calculated failure rate of the intact structure is less than 10-6/yr we can state that the combined failure rate due to extreme weather plus failure due to deterioration in strength is less than 1*10-5/year. This is reflected in Table 4 for the North Sea area where the calculated failure rate is indeed less than 10-6/yr. The failure rate for future North Sea structures (i.e. 1995-onwards) is based on design in accordance with API RP 2A-LRFD and environmental load factors as recommended in ref. 2. 2.5 Adjusting the generic failure rates of fixed platforms
The failure rates given in table 4A are based on generic assumptions about each sub-population with respect to the design basis and the resulting strength. It should be recognized that they are necessarily approximate and generally would tend to overpredict the failure rate. Where installation specific data is available the estimate of the probability of failure may be further improved using directly the models presented in ref. 2. Some further guidance is provided below for two additional cases, namely (i) table 4B provides results for the case where the strength of the structure is 20% greater than assumed in Table 4A; The values of Pf are obviously lower. (ii) table 4C provides results for the case where the strength of the structure is 20% lower than assumed in Table 4A; The values of Pf are obviously increased.
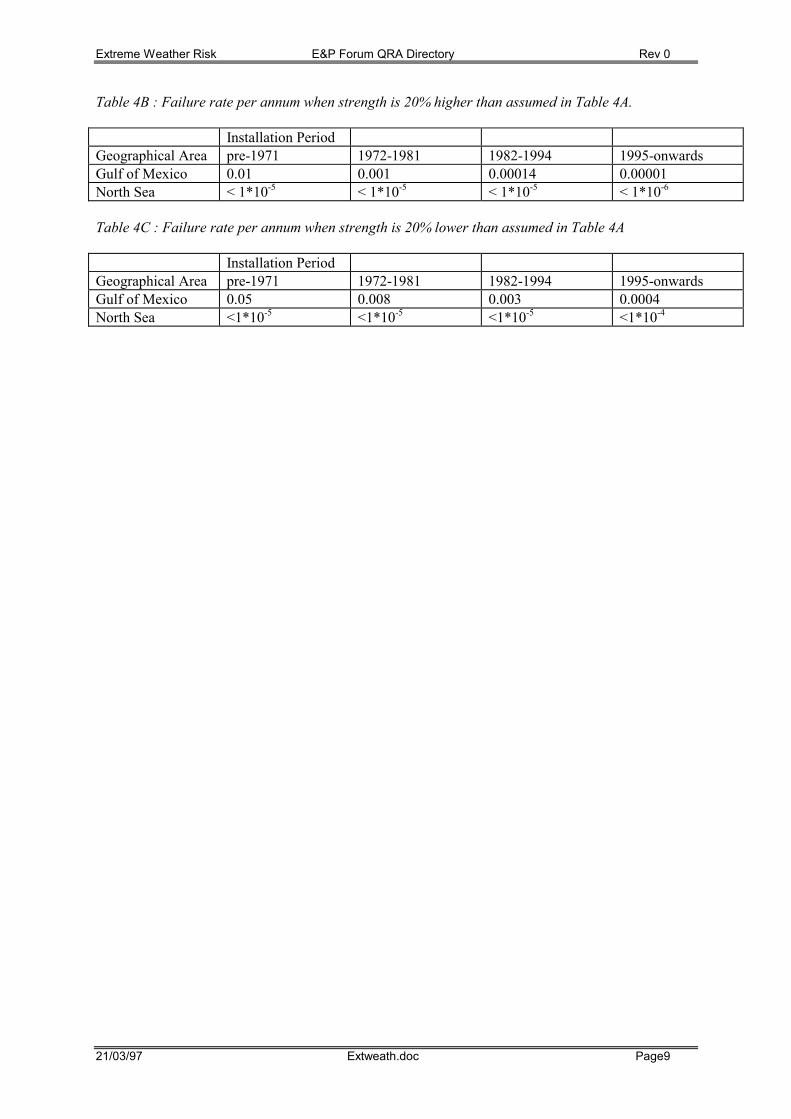
Extreme Weather Risk E&P Forum QRA Directory Rev 0
21/03/97 Extweath.doc Page9
Table 4B : Failure rate per annum when strength is 20% higher than assumed in Table 4A.
Installation Period Geographical Area pre-1971 1972-1981 1982-1994 1995-onwards Gulf of Mexico 0.01 0.001 0.00014 0.00001 North Sea < 1*10-5 < 1*10-5 < 1*10-5 < 1*10-6
Table 4C : Failure rate per annum when strength is 20% lower than assumed in Table 4A
Installation Period Geographical Area pre-1971 1972-1981 1982-1994 1995-onwards Gulf of Mexico 0.05 0.008 0.003 0.0004 North Sea <1*10-5 <1*10-5 <1*10-5 <1*10-4
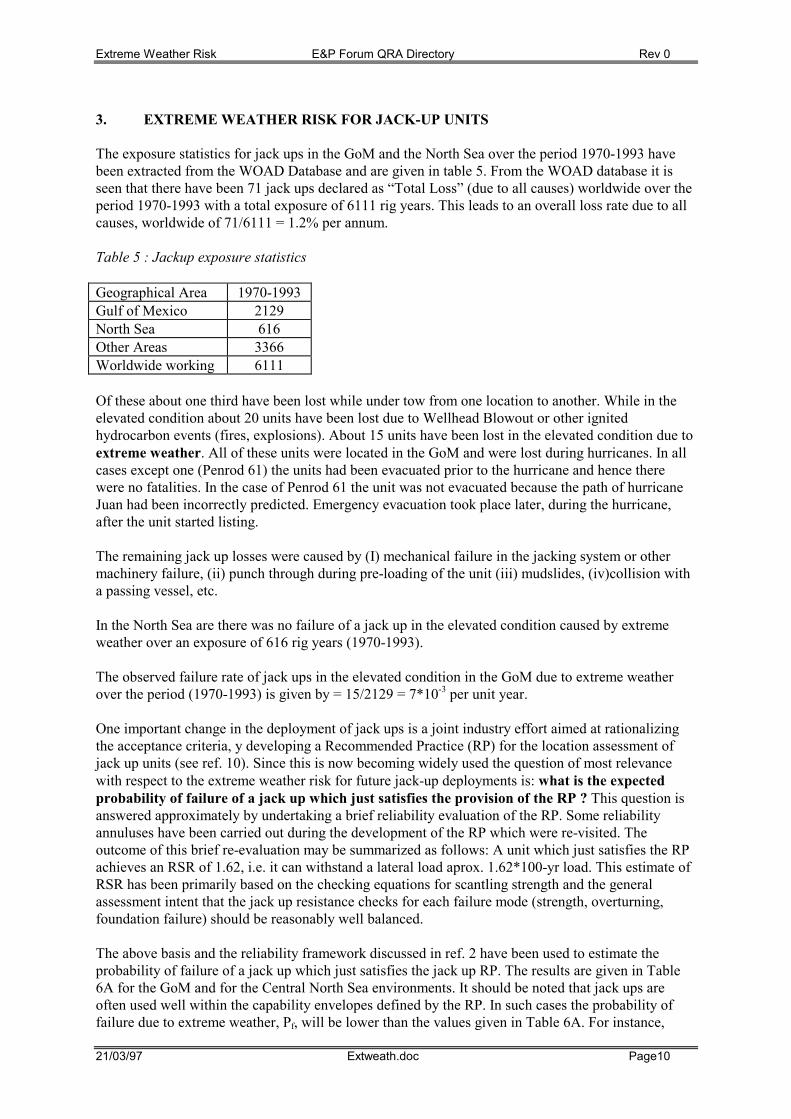
Extreme Weather Risk E&P Forum QRA Directory Rev 0
21/03/97 Extweath.doc Page10
3. EXTREME WEATHER RISK FOR JACK-UP UNITS The exposure statistics for jack ups in the GoM and the North Sea over the period 1970-1993 have been extracted from the WOAD Database and are given in table 5. From the WOAD database it is seen that there have been 71 jack ups declared as “Total Loss” (due to all causes) worldwide over the period 1970-1993 with a total exposure of 6111 rig years. This leads to an overall loss rate due to all causes, worldwide of 71/6111 = 1.2% per annum. Table 5 : Jackup exposure statistics Geographical Area 1970-1993 Gulf of Mexico 2129 North Sea 616 Other Areas 3366 Worldwide working 6111
Of these about one third have been lost while under tow from one location to another. While in the elevated condition about 20 units have been lost due to Wellhead Blowout or other ignited hydrocarbon events (fires, explosions). About 15 units have been lost in the elevated condition due to extreme weather. All of these units were located in the GoM and were lost during hurricanes. In all cases except one (Penrod 61) the units had been evacuated prior to the hurricane and hence there were no fatalities. In the case of Penrod 61 the unit was not evacuated because the path of hurricane Juan had been incorrectly predicted. Emergency evacuation took place later, during the hurricane, after the unit started listing. The remaining jack up losses were caused by (I) mechanical failure in the jacking system or other machinery failure, (ii) punch through during pre-loading of the unit (iii) mudslides, (iv)collision with a passing vessel, etc. In the North Sea are there was no failure of a jack up in the elevated condition caused by extreme weather over an exposure of 616 rig years (1970-1993). The observed failure rate of jack ups in the elevated condition in the GoM due to extreme weather over the period (1970-1993) is given by = 15/2129 = 7*10-3 per unit year. One important change in the deployment of jack ups is a joint industry effort aimed at rationalizing the acceptance criteria, y developing a Recommended Practice (RP) for the location assessment of jack up units (see ref. 10). Since this is now becoming widely used the question of most relevance with respect to the extreme weather risk for future jack-up deployments is: what is the expected probability of failure of a jack up which just satisfies the provision of the RP ? This question is answered approximately by undertaking a brief reliability evaluation of the RP. Some reliability annuluses have been carried out during the development of the RP which were re-visited. The outcome of this brief re-evaluation may be summarized as follows: A unit which just satisfies the RP achieves an RSR of 1.62, i.e. it can withstand a lateral load aprox. 1.62*100-yr load. This estimate of RSR has been primarily based on the checking equations for scantling strength and the general assessment intent that the jack up resistance checks for each failure mode (strength, overturning, foundation failure) should be reasonably well balanced. The above basis and the reliability framework discussed in ref. 2 have been used to estimate the probability of failure of a jack up which just satisfies the jack up RP. The results are given in Table 6A for the GoM and for the Central North Sea environments. It should be noted that jack ups are often used well within the capability envelopes defined by the RP. In such cases the probability of failure due to extreme weather, Pf, will be lower than the values given in Table 6A. For instance,
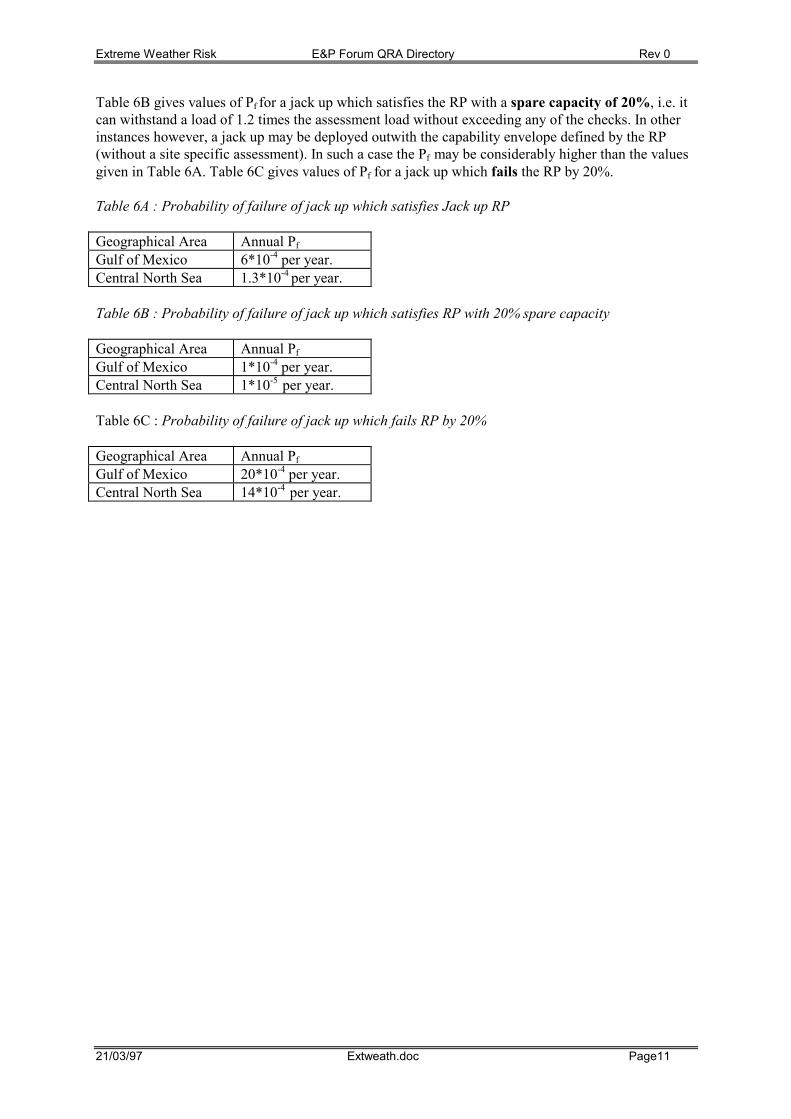
Extreme Weather Risk E&P Forum QRA Directory Rev 0
21/03/97 Extweath.doc Page11
Table 6B gives values of Pf for a jack up which satisfies the RP with a spare capacity of 20%, i.e. it can withstand a load of 1.2 times the assessment load without exceeding any of the checks. In other instances however, a jack up may be deployed outwith the capability envelope defined by the RP (without a site specific assessment). In such a case the Pf may be considerably higher than the values given in Table 6A. Table 6C gives values of Pf for a jack up which fails the RP by 20%. Table 6A : Probability of failure of jack up which satisfies Jack up RP Geographical Area Annual Pf
Gulf of Mexico 6*10-4 per year. Central North Sea 1.3*10-4 per year.
Table 6B : Probability of failure of jack up which satisfies RP with 20% spare capacity Geographical Area Annual Pf
Gulf of Mexico 1*10-4 per year. Central North Sea 1*10-5 per year.
Table 6C : Probability of failure of jack up which fails RP by 20% Geographical Area Annual Pf
Gulf of Mexico 20*10-4 per year. Central North Sea 14*10-4 per year.
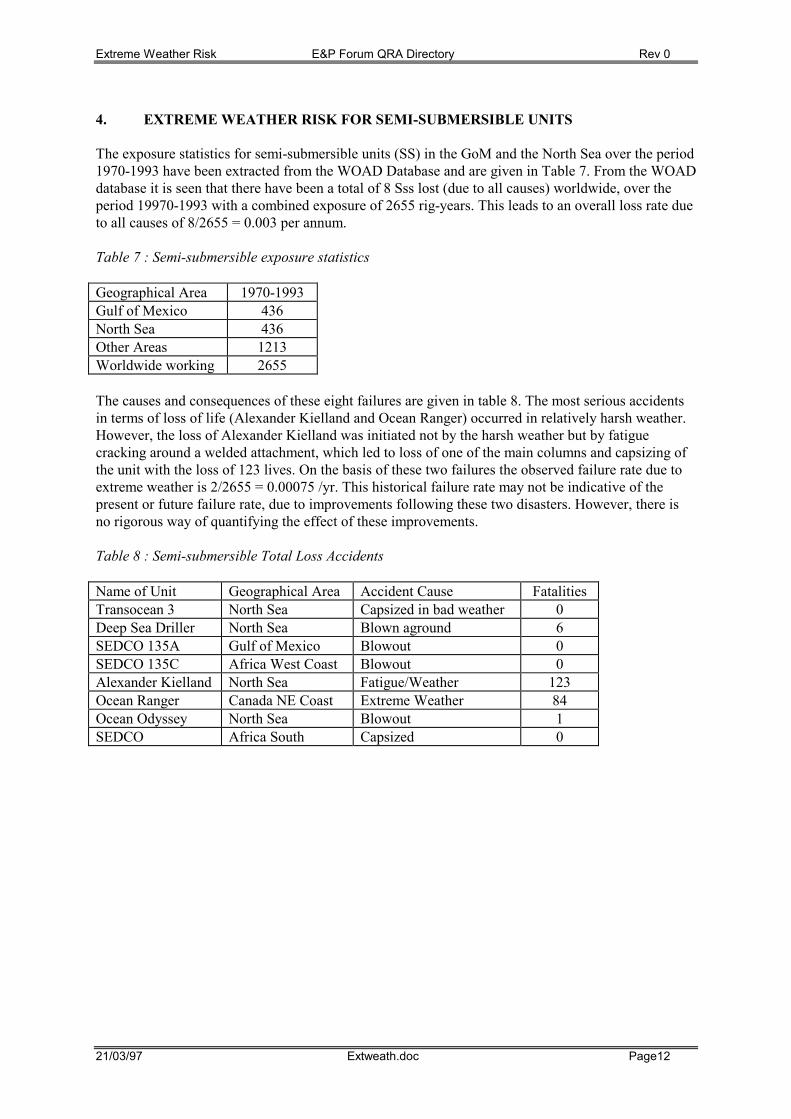
Extreme Weather Risk E&P Forum QRA Directory Rev 0
21/03/97 Extweath.doc Page12
4. EXTREME WEATHER RISK FOR SEMI-SUBMERSIBLE UNITS The exposure statistics for semi-submersible units (SS) in the GoM and the North Sea over the period 1970-1993 have been extracted from the WOAD Database and are given in Table 7. From the WOAD database it is seen that there have been a total of 8 Sss lost (due to all causes) worldwide, over the period 19970-1993 with a combined exposure of 2655 rig-years. This leads to an overall loss rate due to all causes of 8/2655 = 0.003 per annum. Table 7 : Semi-submersible exposure statistics
Geographical Area 1970-1993 Gulf of Mexico 436 North Sea 436 Other Areas 1213 Worldwide working 2655
The causes and consequences of these eight failures are given in table 8. The most serious accidents in terms of loss of life (Alexander Kielland and Ocean Ranger) occurred in relatively harsh weather. However, the loss of Alexander Kielland was initiated not by the harsh weather but by fatigue cracking around a welded attachment, which led to loss of one of the main columns and capsizing of the unit with the loss of 123 lives. On the basis of these two failures the observed failure rate due to extreme weather is 2/2655 = 0.00075 /yr. This historical failure rate may not be indicative of the present or future failure rate, due to improvements following these two disasters. However, there is no rigorous way of quantifying the effect of these improvements. Table 8 : Semi-submersible Total Loss Accidents Name of Unit Geographical Area Accident Cause Fatalities Transocean 3 North Sea Capsized in bad weather 0 Deep Sea Driller North Sea Blown aground 6 SEDCO 135A Gulf of Mexico Blowout 0 SEDCO 135C Africa West Coast Blowout 0 Alexander Kielland North Sea Fatigue/Weather 123 Ocean Ranger Canada NE Coast Extreme Weather 84 Ocean Odyssey North Sea Blowout 1 SEDCO Africa South Capsized 0
Extreme Weather Risk E&P Forum QRA Directory Rev 0
21/03/97 Extweath.doc Page13
REFERENCES
1.WOAD (1994) “Worldwide Offshore Accident Databank”, Statistical Report, 1994, Det Norske Veritas, Hovic, Norway. 2. Efthymiou, M., van de Graaf J.W., Tromans, P.S. and Hines, I.M.,(1996), Reliability Based Criteria for Fixed Steel Offshore Platforms, OMAE 96-462, Florence, Italy, June 1996. 3. PMB Engineering Inc., (1993), “Hurricane Andrew - Effects on Offshore Platforms”, Joint Industry Project, Phase I Final Report, October 1993. 4. HSE (1990), “Offshore Installations: Guidance on Design, Construction and Certification”, HMSO, 4th Edition, London, 1990 5. NPD (1992), “Regulations concerning Load-bearing Structures in the Petroleum Activity”, Norwegian Petroleum Directorate, Stravanger, Norway. 6. API RP2A WSD, “Recommended Practice for Planning Designind and constructing fixed Offshore Platforms - WSD”, APIRP2A-WSD, 1st - 20th Edition, American Petroleum Institute, Washington D.C. 7. API EP2A LRFD (1993), “Recommended Practice for Planning Designing and Constructing Fixed Iffshore Platforms - LRFFD”, API RP 2A-LRFD, First Edition, July 1993, American Petroleum Institute, Washington D.C. 8. van de Graaf J.W., Efthymiou, M. and Tromans, P.S. (1993) “Implied reliability levels for RP 2A LRFD from studies of North Sea Platforms “, Conference on API RP 2A -LRFD, Society for Underwater Technology, December 1993, London. 9. de Jong, P.R., Vugts, J.H. and Gudmestad, O.T. (1996), “Extreme Hydrodynamic Load Calculations for Fixed Steel Structures”, OMAE (96-420), Florence, Italy, June 1996. 10. SNAME, (2994), “Recommended Practice for Site Assessment of Mobile Jack up Units”, SNAME Technical and Research Bulletin, First Edition, May 1994, New Jersey, USA.
Extreme Weather Risk E&P Forum QRA Directory Rev 0
21/03/97 Extweath.doc Page14
HF in the Calculation of Loss E&P Forum Qra Datasheet Directory Rev 0 of Containment Frequencies
13/06/03 HFINLCF2.DOC Page 1
HUMAN FACTORS IN THE CALCULATION OF LOSS
OF CONTAINMENT FREQUENCIES
HF in the Calculation of Loss E&P Forum Qra Datasheet Directory Rev 0 of Containment Frequencies
13/06/03 HFINLCF2.DOC Page 2
TABLE OF CONTENTS
GLOSSARY OF TERMS & ABBREVIATIONS ------------------------------------------------- 3
1 INTRODUCTION-------------------------------------------------------------------------------------- 4
2 SCOPE -------------------------------------------------------------------------------------------------- 5
3 APPLICATION ---------------------------------------------------------------------------------------- 5
4 CALCULATING RELEASE FREQUENCIES USING FAULT TREE ANALYSIS --- 6 Description---------------------------------------------------------------------------------------------------------------------6 Data Sources-------------------------------------------------------------------------------------------------------------------9
5 MODIFYING GENERIC LOSS OF CONTAINMENT FREQUENCIES--------------- 14 Description------------------------------------------------------------------------------------------------------------------- 14 Data Sources----------------------------------------------------------------------------------------------------------------- 15 Framework for Understanding How Management Exerts An Influence on LOC Frequencies--------------------------------------------------------------------------- 19 Reviewing a Safety Management System for Calculating a Modification of Risk Factor -------------------------------------------------------------------------- 19
6 ONGOING RESEARCH -------------------------------------------------------------------------- 19
7 REFERENCES -------------------------------------------------------------------------------------- 20
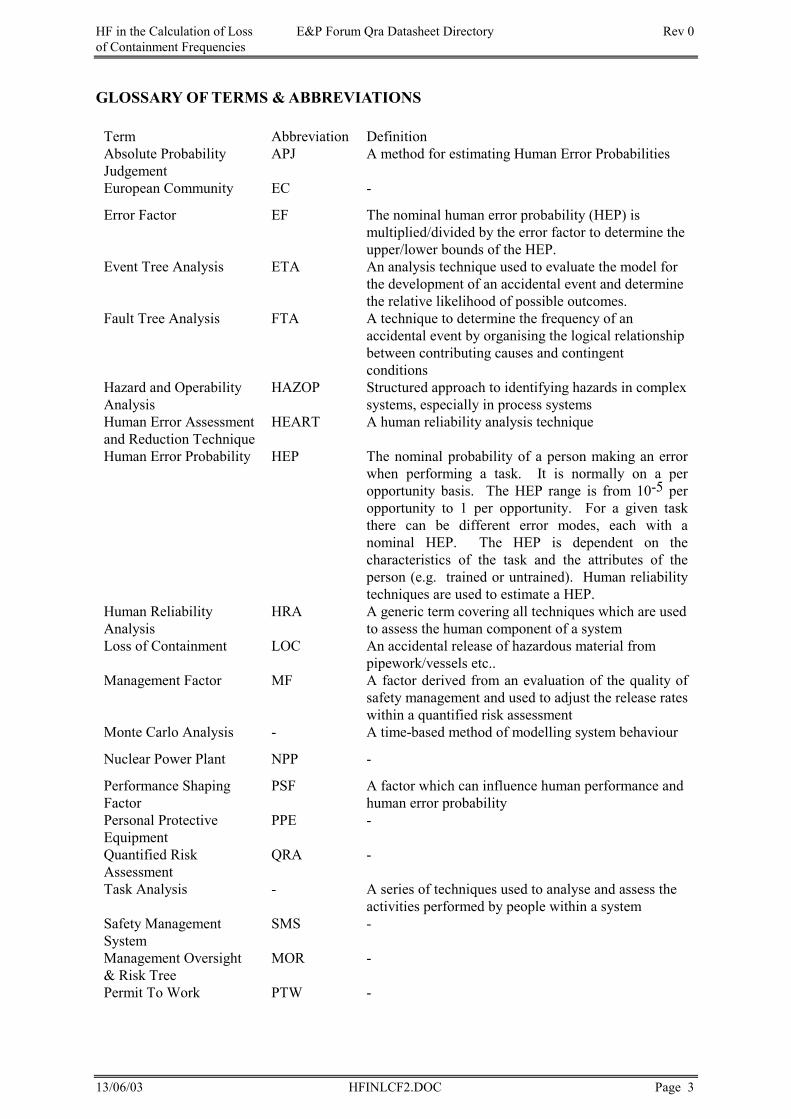
HF in the Calculation of Loss E&P Forum Qra Datasheet Directory Rev 0 of Containment Frequencies
13/06/03 HFINLCF2.DOC Page 3
GLOSSARY OF TERMS & ABBREVIATIONS
Term Abbreviation Definition Absolute Probability Judgement
APJ A method for estimating Human Error Probabilities
European Community EC -
Error Factor EF The nominal human error probability (HEP) is multiplied/divided by the error factor to determine the upper/lower bounds of the HEP.
Event Tree Analysis ETA An analysis technique used to evaluate the model for the development of an accidental event and determine the relative likelihood of possible outcomes.
Fault Tree Analysis FTA A technique to determine the frequency of an accidental event by organising the logical relationship between contributing causes and contingent conditions
Hazard and Operability Analysis
HAZOP Structured approach to identifying hazards in complex systems, especially in process systems
Human Error Assessment and Reduction Technique
HEART A human reliability analysis technique
Human Error Probability HEP The nominal probability of a person making an error when performing a task. It is normally on a per opportunity basis. The HEP range is from 10-5 per opportunity to 1 per opportunity. For a given task there can be different error modes, each with a nominal HEP. The HEP is dependent on the characteristics of the task and the attributes of the person (e.g. trained or untrained). Human reliability techniques are used to estimate a HEP.
Human Reliability Analysis
HRA A generic term covering all techniques which are used to assess the human component of a system
Loss of Containment LOC An accidental release of hazardous material from pipework/vessels etc..
Management Factor MF A factor derived from an evaluation of the quality of safety management and used to adjust the release rates within a quantified risk assessment
Monte Carlo Analysis - A time-based method of modelling system behaviour
Nuclear Power Plant NPP -
Performance Shaping Factor
PSF A factor which can influence human performance and human error probability
Personal Protective Equipment
PPE -
Quantified Risk Assessment
QRA -
Task Analysis - A series of techniques used to analyse and assess the activities performed by people within a system
Safety Management System
SMS -
Management Oversight & Risk Tree
MOR -
Permit To Work PTW -
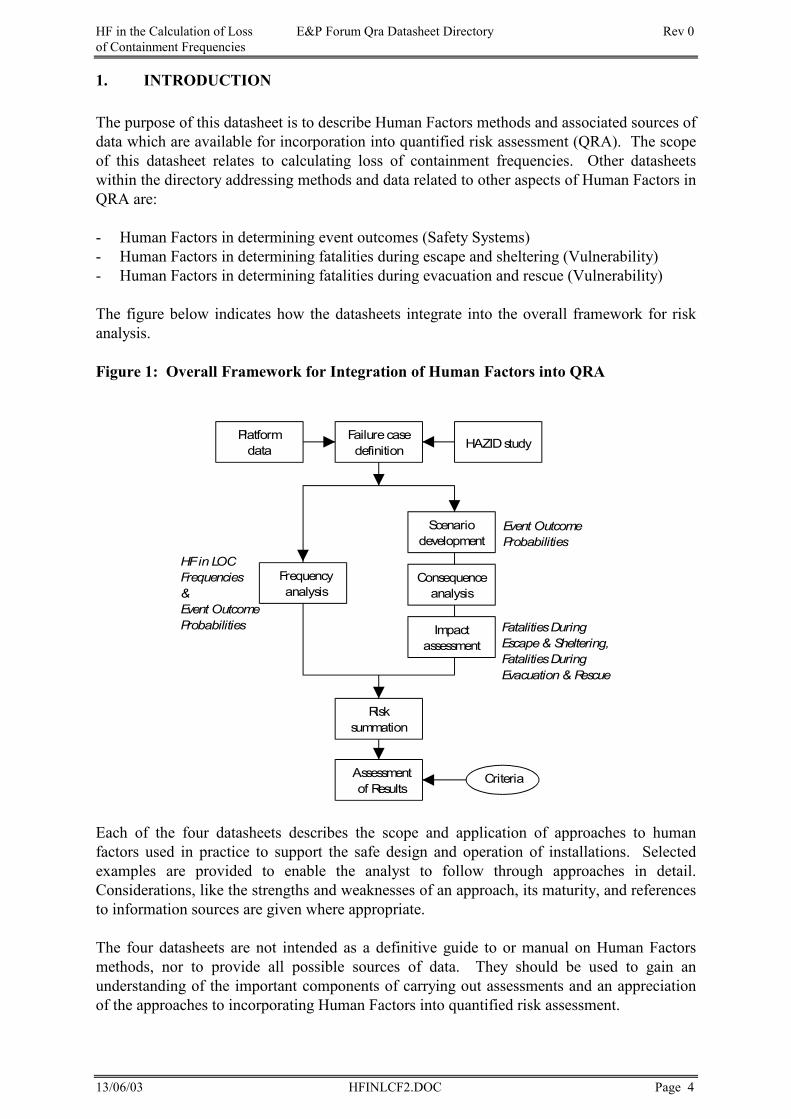
HF in the Calculation of Loss E&P Forum Qra Datasheet Directory Rev 0 of Containment Frequencies
13/06/03 HFINLCF2.DOC Page 4
1. INTRODUCTION The purpose of this datasheet is to describe Human Factors methods and associated sources of data which are available for incorporation into quantified risk assessment (QRA). The scope of this datasheet relates to calculating loss of containment frequencies. Other datasheets within the directory addressing methods and data related to other aspects of Human Factors in QRA are: - Human Factors in determining event outcomes (Safety Systems) - Human Factors in determining fatalities during escape and sheltering (Vulnerability) - Human Factors in determining fatalities during evacuation and rescue (Vulnerability) The figure below indicates how the datasheets integrate into the overall framework for risk analysis. Figure 1: Overall Framework for Integration of Human Factors into QRA
Platformdata
Failurecasedefinition HAZIDstudy
Frequencyanalysis
Scenariodevelopment
Consequenceanalysis
Impactassessment
Risksummation
Assessmentof Results
Criteria
Event OutcomeProbabilities
HFin LOCFrequencies&Event OutcomeProbabilities FatalitiesDuring
Escape& Sheltering,FatalitiesDuringEvacuation& Rescue
Each of the four datasheets describes the scope and application of approaches to human factors used in practice to support the safe design and operation of installations. Selected examples are provided to enable the analyst to follow through approaches in detail. Considerations, like the strengths and weaknesses of an approach, its maturity, and references to information sources are given where appropriate. The four datasheets are not intended as a definitive guide to or manual on Human Factors methods, nor to provide all possible sources of data. They should be used to gain an understanding of the important components of carrying out assessments and an appreciation of the approaches to incorporating Human Factors into quantified risk assessment.
HF in the Calculation of Loss E&P Forum Qra Datasheet Directory Rev 0 of Containment Frequencies
13/06/03 HFINLCF2.DOC Page 5
2. SCOPE This datasheet describes how Human Factors methods can be used to estimate the human error component of loss of containment (LOC) frequencies. Generic LOC data used in QRA include all causes of releases, including human errors. LOC accident analysis enables an estimation of the relative contribution of human and equipment failure, at around 40%:60% [1]. For crane accidents (dropped object events), four sources of data enable the classification of the direct causes of crane accident in terms of human error and mechanical failure [2,3,4,5]. The ratio for distributing the failure frequency between human error and mechanical failure is 55%:45%. These data which identify the relative contribution of human and hardware failures are useful for benchmarking in fault tree analysis. It helps as a check on whether the analysis is giving results consistent with the historical data, which is particularly important when human failure probabilities in fault trees are derived primarily from expert judgement. There is a tendency to overestimate human error probabilities relative to the hardware failure estimates. One reason is that human error recovery mechanisms are often forgotten. For example, a maintenance error could be recovered by checking by the supervisor. This means that in FTA, many human errors should have an AND gate with error recovery failure. The latter would be 1 if there is no opportunity for error recovery. For a well designed error management system, the practice is to use an error recovery failure probability of 10-2.
Identification of management mechanisms which could have prevented or recovered unsafe conditions leading to Loss of Containment accidents, indicates that some 90% of LOC accidents are preventable. Prevention mechanisms are: identifying unsafe conditions through hazard review, task checking, routine testing and inspection, and Human Factors review, including associated follow-up actions. The data provide a statistical model which has been used as a basis for factoring Generic LOC data using a Modification of Risk Factor derived from an assessment of the quality of Safety Management. The modification factor for generic failure rates ranges between 0.1 and 100 for good and poor management respectively [6], but more typically between 0.5 and 10 in practice. In a study of 402 offshore LOC incidents, 47% originated in maintenance, 30% originated in design, 15% in operations, and 8% in construction. Of the maintenance failures, 65% were due to errors in performing maintenance and 35% failure to carry out the required activity. 3. APPLICATION In cases where the part played by the operator can be fairly well defined, unwanted events can be analysed by decomposition of human and technical failure causes using Fault Tree Analysis (FTA), particularly in cases where: 1. There is a new or modified system which has a significant role for operators; 2. First pass risk assessment indicates dominant risks which could have a significant human
error component; 3. Human Factors risk reduction measures are required; 4. Historical failure data do not exist or are not applicable to the initiating event(s) of
interest.
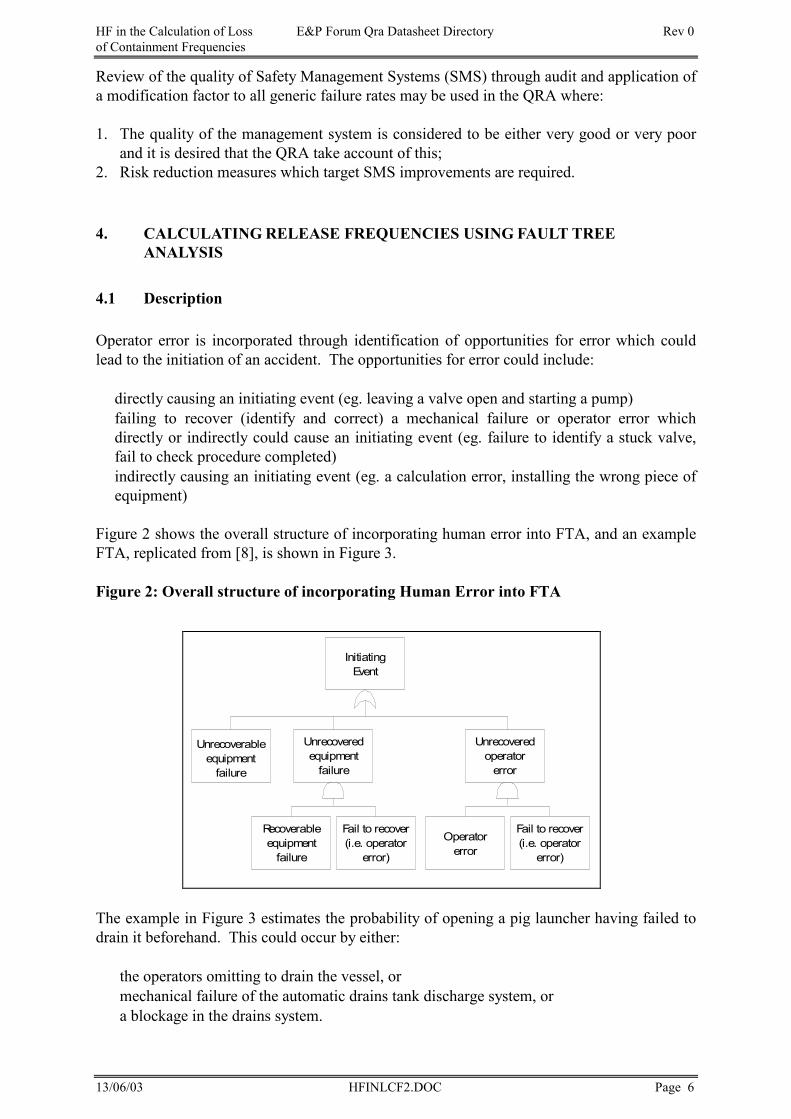
HF in the Calculation of Loss E&P Forum Qra Datasheet Directory Rev 0 of Containment Frequencies
13/06/03 HFINLCF2.DOC Page 6
Review of the quality of Safety Management Systems (SMS) through audit and application of a modification factor to all generic failure rates may be used in the QRA where: 1. The quality of the management system is considered to be either very good or very poor
and it is desired that the QRA take account of this; 2. Risk reduction measures which target SMS improvements are required.
4. CALCULATING RELEASE FREQUENCIES USING FAULT TREE ANALYSIS 4.1 Description Operator error is incorporated through identification of opportunities for error which could lead to the initiation of an accident. The opportunities for error could include: • directly causing an initiating event (eg. leaving a valve open and starting a pump) • failing to recover (identify and correct) a mechanical failure or operator error which
directly or indirectly could cause an initiating event (eg. failure to identify a stuck valve, fail to check procedure completed)
• indirectly causing an initiating event (eg. a calculation error, installing the wrong piece of equipment)
Figure 2 shows the overall structure of incorporating human error into FTA, and an example FTA, replicated from [8], is shown in Figure 3. Figure 2: Overall structure of incorporating Human Error into FTA
The example in Figure 3 estimates the probability of opening a pig launcher having failed to drain it beforehand. This could occur by either: • the operators omitting to drain the vessel, or • mechanical failure of the automatic drains tank discharge system, or • a blockage in the drains system.
InitiatingEvent
Unrecoverableequipment
failure
Unrecoveredequipment
failure
Unrecoveredoperator
error
Recoverableequipment
failure
Fail to recover(i.e. operator
error)
Fail to recover(i.e. operator
error)
Operatorerror
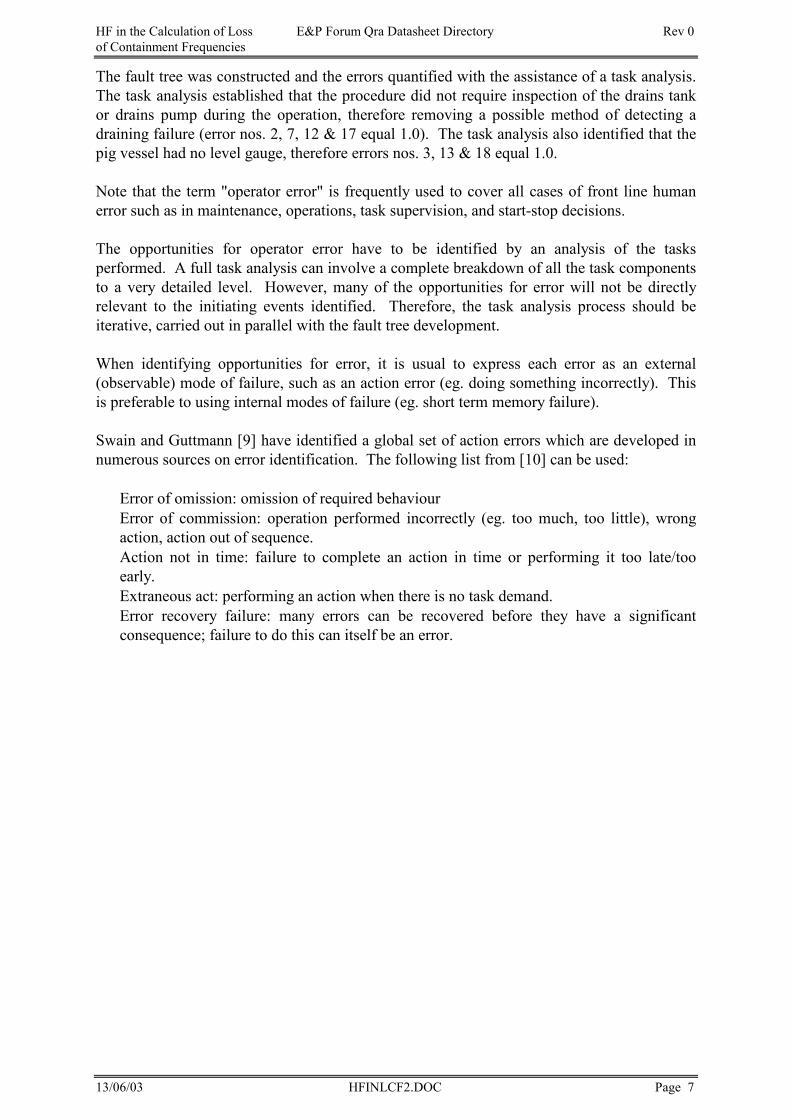
HF in the Calculation of Loss E&P Forum Qra Datasheet Directory Rev 0 of Containment Frequencies
13/06/03 HFINLCF2.DOC Page 7
The fault tree was constructed and the errors quantified with the assistance of a task analysis. The task analysis established that the procedure did not require inspection of the drains tank or drains pump during the operation, therefore removing a possible method of detecting a draining failure (error nos. 2, 7, 12 & 17 equal 1.0). The task analysis also identified that the pig vessel had no level gauge, therefore errors nos. 3, 13 & 18 equal 1.0. Note that the term "operator error" is frequently used to cover all cases of front line human error such as in maintenance, operations, task supervision, and start-stop decisions. The opportunities for operator error have to be identified by an analysis of the tasks performed. A full task analysis can involve a complete breakdown of all the task components to a very detailed level. However, many of the opportunities for error will not be directly relevant to the initiating events identified. Therefore, the task analysis process should be iterative, carried out in parallel with the fault tree development. When identifying opportunities for error, it is usual to express each error as an external (observable) mode of failure, such as an action error (eg. doing something incorrectly). This is preferable to using internal modes of failure (eg. short term memory failure). Swain and Guttmann [9] have identified a global set of action errors which are developed in numerous sources on error identification. The following list from [10] can be used: • Error of omission: omission of required behaviour • Error of commission: operation performed incorrectly (eg. too much, too little), wrong
action, action out of sequence. • Action not in time: failure to complete an action in time or performing it too late/too
early. • Extraneous act: performing an action when there is no task demand. • Error recovery failure: many errors can be recovered before they have a significant
consequence; failure to do this can itself be an error.
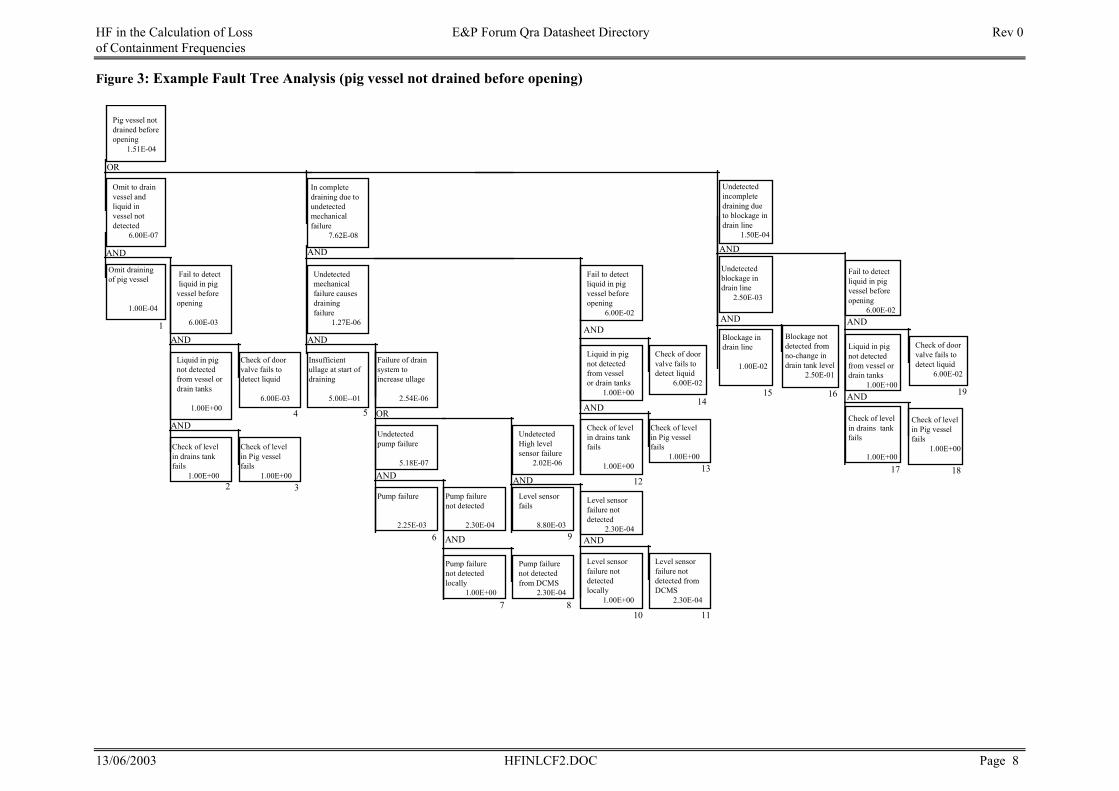
HF in the Calculation of Loss E&P Forum Qra Datasheet Directory Rev 0of Containment Frequencies
13/06/2003 HFINLCF2.DOC Page 8
Figure 3: Example Fault Tree Analysis (pig vessel not drained before opening)
Omit drainingof pig vessel
1.00E-04
Pig vessel notdrained beforeopening
1.51E-04
Omit to drainvessel andliquid invessel notdetected
6.00E-07
Fail to detectliquid in pig
vessel beforeopening
6.00E-03
Liquid in pignot detectedfrom vessel ordrain tanks
1.00E+00
Check of levelin drains tankfails
1.00E+00
Check of doorvalve fails todetect liquid
6.00E-03
Check of levelin Pig vesselfails
1.00E+00
In completedraining due toundetectedmechanicalfailure
7.62E-08
Undetectedmechanicalfailure causesdrainingfailure
1.27E-06
Insufficientullage at start ofdraining
5.00E--01
Failure of drainsystem toincrease ullage
2.54E-06
Undetectedpump failure
5.18E-07
Pump failure
2.25E-03
Pump failurenot detected
2.30E-04
Pump failurenot detectedlocally
1.00E+00
UndetectedHigh levelsensor failure
2.02E-06
Level sensorfails
8.80E-03
Pump failurenot detectedfrom DCMS
2.30E-04
Fail to detectliquid in pigvessel beforeopening
6.00E-02
Liquid in pignot detectedfrom vesselor drain tanks
1.00E+00
Check of levelin drains tankfails
1.00E+00
Level sensorfailure notdetected
2.30E-04
Level sensorfailure notdetectedlocally
1.00E+00
Level sensorfailure notdetected fromDCMS
2.30E-04
Check of levelin Pig vesselfails
1.00E+00
Undetectedincompletedraining dueto blockage indrain line
1.50E-04
Undetectedblockage indrain line
2.50E-03
Blockage indrain line
1.00E-02
Blockage notdetected fromno-change indrain tank level
2.50E-01
Check of doorvalve fails todetect liquid
6.00E-02
Fail to detectliquid in pigvessel beforeopening
6.00E-02
Liquid in pignot detectedfrom vessel ordrain tanks
1.00E+00
Check of levelin drains tankfails
1.00E+00
Check of levelin Pig vesselfails
1.00E+00
Check of doorvalve fails todetect liquid
6.00E-02
OR
OR
AND
ANDAND
AND
AND
AND
AND
AND
AND
AND
AND
AND
ANDAND
AND
1
2 3
4 5
6
7
9
8
1312
1110
1415 16
17
19
18
HF in the Calculation of Loss E&P Forum Qra Datasheet Directory Rev 0 of Containment Frequencies
13/06/2003 HFINLCF2.DOC Page 9
4.2 Data Sources The quantification of error, per demand, has been the subject of much debate. This is because historical data on human error frequencies are virtually non-existent. Human reliability assessment (HRA) methods have therefore been developed. A general text book on HRA is presented in [11]. One source which provides a comparison of HRA methods is the "Human Reliability Assessors Guide" [12]. This study identified Absolute Probability Judgement (APJ) as one of the most effective methods of Human Reliability Assessment. The APJ method uses informed (e.g. from experimental data) or expert judgement (eg. human reliability specialists and operations experts supported by judgement aids or data benchmarks) to assign a generic error probability to identified opportunities for error. The judgement must be supported by assumptions which can later be used as a basis for making recommendations as to how the error probabilities can be reduced. Generic error probabilities from [13] have been used in Absolute Probability Judgement (see Table 1). These probabilities were derived from expert judgement supported by a psychological scaling technique. Uninformed guessing of human error probabilities should not be equated with APJ. Relevant expertise, accepted sources of data, and appropriate documentation of the method of arriving at the data point are required. The quantification process must take account of important features in the task context, such as situation novelty, or time on task, which may increase or decrease the likelihood of error. These identified 'Performance Shaping Factors' can be used to modify nominal error probabilities. The PSFs of interest in the petrochemical industry can be grouped into a small number of areas. These are illustrated in Figure 4. Generic data on performance shaping factors are available [9,14].
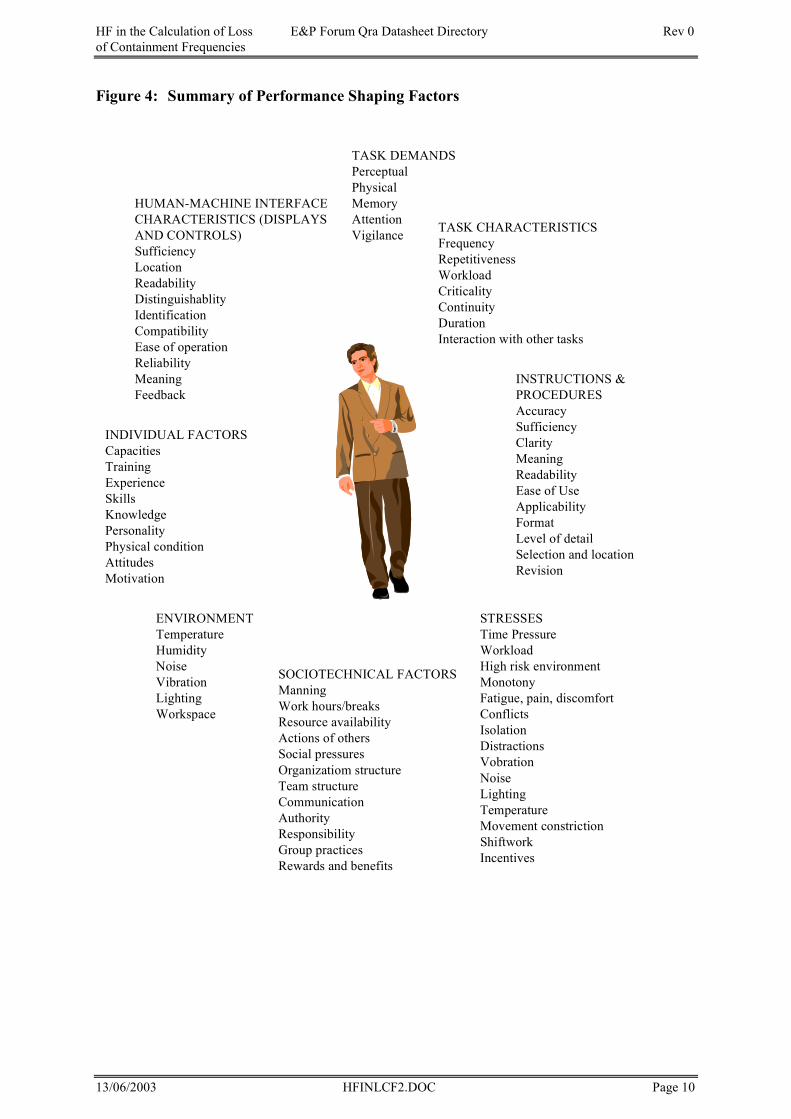
HF in the Calculation of Loss E&P Forum Qra Datasheet Directory Rev 0 of Containment Frequencies
13/06/2003 HFINLCF2.DOC Page 10
Figure 4: Summary of Performance Shaping Factors
TASK DEMANDSPerceptualPhysicalMemoryAttentionVigilance TASK CHARACTERISTICS
FrequencyRepetitivenessWorkloadCriticalityContinuityDurationInteraction with other tasks
INSTRUCTIONS &PROCEDURESAccuracySufficiencyClarityMeaningReadabilityEase of UseApplicabilityFormatLevel of detailSelection and locationRevision
STRESSESTime PressureWorkloadHigh risk environmentMonotonyFatigue, pain, discomfortConflictsIsolationDistractionsVobrationNoiseLightingTemperatureMovement constrictionShiftworkIncentives
SOCIOTECHNICAL FACTORSManningWork hours/breaksResource availabilityActions of othersSocial pressuresOrganizatiom structureTeam structureCommunicationAuthorityResponsibilityGroup practicesRewards and benefits
ENVIRONMENTTemperatureHumidityNoiseVibrationLightingWorkspace
INDIVIDUAL FACTORSCapacitiesTrainingExperienceSkillsKnowledgePersonalityPhysical conditionAttitudesMotivation
HUMAN-MACHINE INTERFACECHARACTERISTICS (DISPLAYSAND CONTROLS)SufficiencyLocationReadabilityDistinguishablityIdentificationCompatibilityEase of operationReliabilityMeaningFeedback
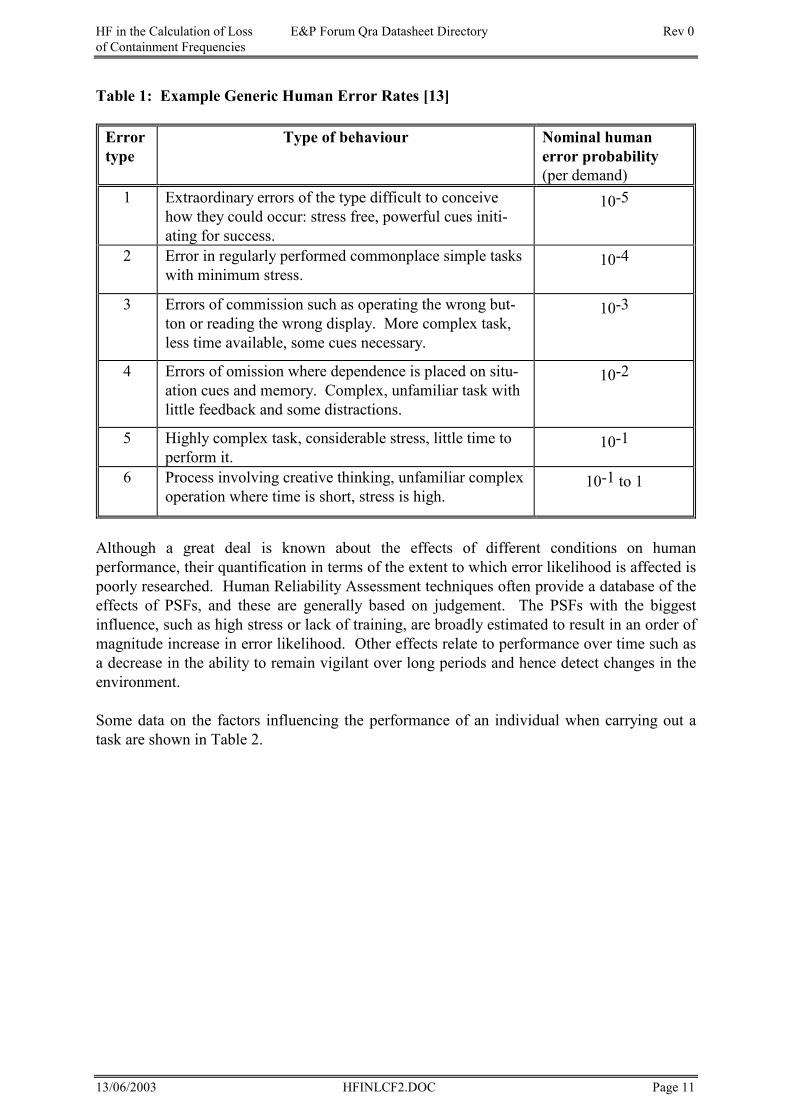
HF in the Calculation of Loss E&P Forum Qra Datasheet Directory Rev 0 of Containment Frequencies
13/06/2003 HFINLCF2.DOC Page 11
Table 1: Example Generic Human Error Rates [13]
Error type
Type of behaviour Nominal human error probability (per demand)
1 Extraordinary errors of the type difficult to conceive how they could occur: stress free, powerful cues initi-ating for success.
10-5
2 Error in regularly performed commonplace simple tasks with minimum stress.
10-4
3 Errors of commission such as operating the wrong but-ton or reading the wrong display. More complex task, less time available, some cues necessary.
10-3
4 Errors of omission where dependence is placed on situ-ation cues and memory. Complex, unfamiliar task with little feedback and some distractions.
10-2
5 Highly complex task, considerable stress, little time to perform it.
10-1
6 Process involving creative thinking, unfamiliar complex operation where time is short, stress is high.
10-1 to 1
Although a great deal is known about the effects of different conditions on human performance, their quantification in terms of the extent to which error likelihood is affected is poorly researched. Human Reliability Assessment techniques often provide a database of the effects of PSFs, and these are generally based on judgement. The PSFs with the biggest influence, such as high stress or lack of training, are broadly estimated to result in an order of magnitude increase in error likelihood. Other effects relate to performance over time such as a decrease in the ability to remain vigilant over long periods and hence detect changes in the environment. Some data on the factors influencing the performance of an individual when carrying out a task are shown in Table 2.
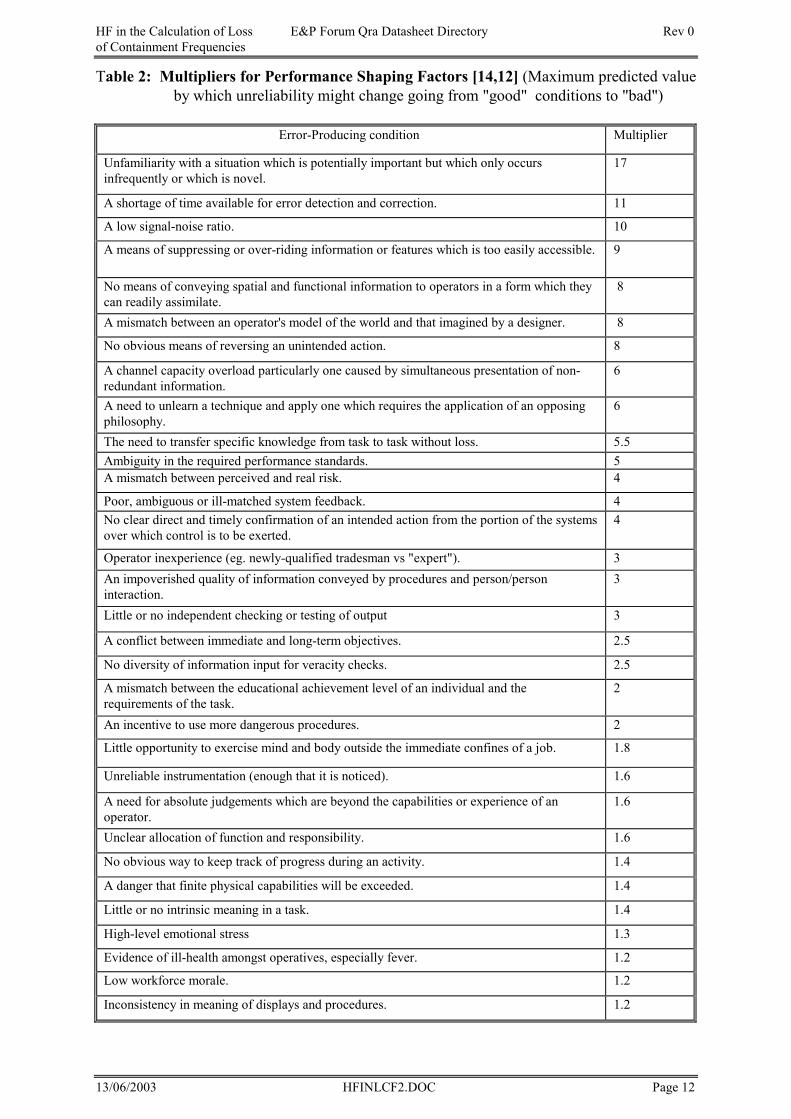
HF in the Calculation of Loss E&P Forum Qra Datasheet Directory Rev 0 of Containment Frequencies
13/06/2003 HFINLCF2.DOC Page 12
Table 2: Multipliers for Performance Shaping Factors [14,12] (Maximum predicted value by which unreliability might change going from "good" conditions to "bad")
Error-Producing condition Multiplier
Unfamiliarity with a situation which is potentially important but which only occurs infrequently or which is novel.
17
A shortage of time available for error detection and correction. 11
A low signal-noise ratio. 10
A means of suppressing or over-riding information or features which is too easily accessible. 9
No means of conveying spatial and functional information to operators in a form which they can readily assimilate.
8
A mismatch between an operator's model of the world and that imagined by a designer. 8
No obvious means of reversing an unintended action. 8
A channel capacity overload particularly one caused by simultaneous presentation of non-redundant information.
6
A need to unlearn a technique and apply one which requires the application of an opposing philosophy.
6
The need to transfer specific knowledge from task to task without loss. 5.5 Ambiguity in the required performance standards. 5 A mismatch between perceived and real risk. 4
Poor, ambiguous or ill-matched system feedback. 4 No clear direct and timely confirmation of an intended action from the portion of the systems over which control is to be exerted.
4
Operator inexperience (eg. newly-qualified tradesman vs "expert"). 3 An impoverished quality of information conveyed by procedures and person/person interaction.
3
Little or no independent checking or testing of output 3
A conflict between immediate and long-term objectives. 2.5
No diversity of information input for veracity checks. 2.5
A mismatch between the educational achievement level of an individual and the requirements of the task.
2
An incentive to use more dangerous procedures. 2
Little opportunity to exercise mind and body outside the immediate confines of a job. 1.8
Unreliable instrumentation (enough that it is noticed). 1.6
A need for absolute judgements which are beyond the capabilities or experience of an operator.
1.6
Unclear allocation of function and responsibility. 1.6
No obvious way to keep track of progress during an activity. 1.4
A danger that finite physical capabilities will be exceeded. 1.4
Little or no intrinsic meaning in a task. 1.4
High-level emotional stress 1.3
Evidence of ill-health amongst operatives, especially fever. 1.2
Low workforce morale. 1.2
Inconsistency in meaning of displays and procedures. 1.2
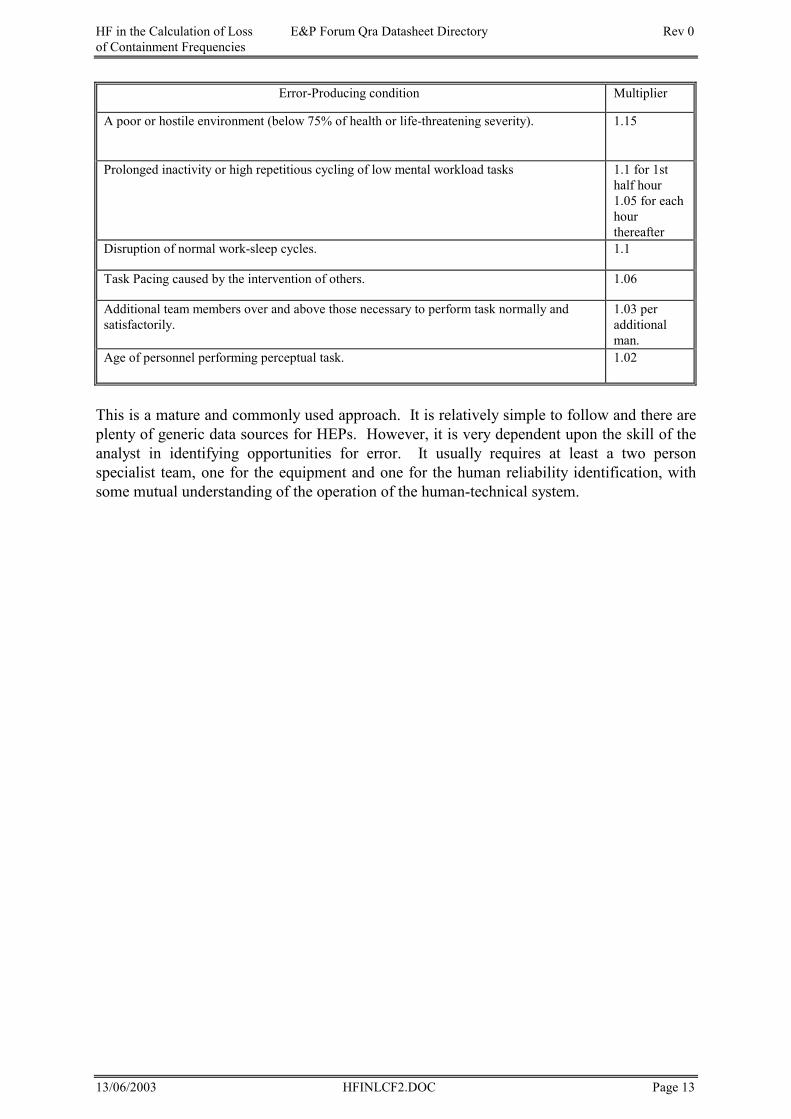
HF in the Calculation of Loss E&P Forum Qra Datasheet Directory Rev 0 of Containment Frequencies
13/06/2003 HFINLCF2.DOC Page 13
Error-Producing condition Multiplier
A poor or hostile environment (below 75% of health or life-threatening severity). 1.15
Prolonged inactivity or high repetitious cycling of low mental workload tasks 1.1 for 1st half hour 1.05 for each hour thereafter
Disruption of normal work-sleep cycles. 1.1
Task Pacing caused by the intervention of others. 1.06
Additional team members over and above those necessary to perform task normally and satisfactorily.
1.03 per additional man.
Age of personnel performing perceptual task. 1.02
This is a mature and commonly used approach. It is relatively simple to follow and there are plenty of generic data sources for HEPs. However, it is very dependent upon the skill of the analyst in identifying opportunities for error. It usually requires at least a two person specialist team, one for the equipment and one for the human reliability identification, with some mutual understanding of the operation of the human-technical system.
HF in the Calculation of Loss E&P Forum Qra Datasheet Directory Rev 0 of Containment Frequencies
13/06/2003 HFINLCF2.DOC Page 14
5. MODIFYING GENERIC LOSS OF CONTAINMENT FREQUENCIES 5.1 Description Examination of major accidents shows management failures to be prevalent in the following organisational areas [18]: • Poor control of communication and coordination:
- between shifts; - upward from front line personnel to higher management in the organisational
hierarchy and downward in terms of implementing safety policy and standards throughout the line of management (particularly in a many-tiered organisation);
- between different functional groups (eg. between operations and maintenance, between mechanical and electrical);
- between geographically separated groups; - in inter-organisational grouping (particularly where roles and responsibilities
overlap) such as in the use of sub-contractors, or in an operation which requires the coordination of multiple groups within the same operational "space";
- in heeding warnings (which is one of the important manifestations of the above where the indicators of latent failures within an organisation become lost or buried).
• Inadequate control of pressures:
- in minimising group or social pressures - in controlling the influence of workload and time pressures - of production - of conflicting objectives (eg. causing diversion of effort away from safety
considerations) • Inadequacies in control of human and equipment resources:
- where there is sharing of resources (where different groups operate on the same equipment), coupled with communication problems. Eg. Lack of a permit-to-work (PTW) system.
- where personnel competencies are inadequate for the job or there is a shortage of staff
- particularly where means of communication are inadequate - where equipment and information (eg. at the man-machine or in support
documentation) are inadequate to do the job • Rigidity in system norms such that systems do not exist to:
- adequately assess the effects and requirements of change (eg. a novel situation arises, new equipment is introduced)
- upgrade and implement procedures in the event of change - ensure that the correct procedures are being implemented and followed - intervene when assumptions made by front line personnel are at odds with the
status of the system - control the informal learning processes which maintain organisational rigidity
These are types of failure which can be addressed in a Safety Management System (SMS) audit to derive a rating of the management system.
HF in the Calculation of Loss E&P Forum Qra Datasheet Directory Rev 0 of Containment Frequencies
13/06/2003 HFINLCF2.DOC Page 15
5.2 Data Sources In a study of accidents in the chemical processing industry sponsored by the UK Health and Safety Executive, around 1000 loss of containment accidents from pipework and vessels on onshore chemical and petrochemical plants were analysed, and the direct and underlying causes of failure were assessed [19, 20]. The underlying causes were defined in terms of a matrix which expressed (a) the activity in which the key failure occurred, and (b) the preventive mechanism failure (i.e. what management did not do to prevent or rectify the error). The preventive mechanisms are described below. Hazard study (of design or as-built)
Hazard studies of design, such as hazard and operability studies (HAZOP), should recover design errors and potential operational or maintenance errors to the extent they fall within the scope of the review. Some underlying causes of failure will be recoverable at the as-built stage such as certain layout aspects or wrong locations of equipment. Hazard study covers: - inadequacies or failures in conducting an appropriate hazard study of design; - failure to follow-up recommendations of the HAZOP or other hazard study. Human factors review
This category specifically refers to cases of failure to recover those underlying causes of unsafe conditions which resulted in human errors within the operator or fitter - hardware system, including interfaces and procedures. These errors are of the type that can be addressed with a Human Factors oriented review. The unrecovered errors will be information processing or action errors in the following categories: - failure to follow procedures due to poor procedural design, poor communication, lack of
detail in PTW, inadequate resources, inadequate training, etc.; - recognition failures due to inadequate plant or equipment identification, or lack of
training, etc.; - inability or difficulty in carrying out actions due to poor location or design of controls. Task Checking
Checks, inspections and tests after tasks have been completed should identify errors such as installing equipment at the wrong location or failure to check that a system has been properly isolated as part of maintenance. Routine Checking
The above are all routine activities in the sense that they are part of a vigilance system on regular look-out for recoverable unsafe conditions in plant / process. These activities may be similar to the task checking category activities but they are not task driven. This category also includes failure to follow-up , given identification of an unsafe condition as part of routine test or inspection. Evidence for events that would be included in this category would be: - equipment in a state of disrepair; - inadequate routine inspection and testing
HF in the Calculation of Loss E&P Forum Qra Datasheet Directory Rev 0 of Containment Frequencies
13/06/2003 HFINLCF2.DOC Page 16
The distribution of failures is shown in Table 3 and 4 and graphically in Figure 5. Human factors aspects of maintenance and normal operations account for around 30% of LOC accidents (a similar proportion could have been prevented by a hazard study of the design (by HAZOP, QRA etc.). A study of 402 North Sea offshore industry release incidents, from a single operator, indicates results consistent with those obtained for the onshore plant pipework study [7].
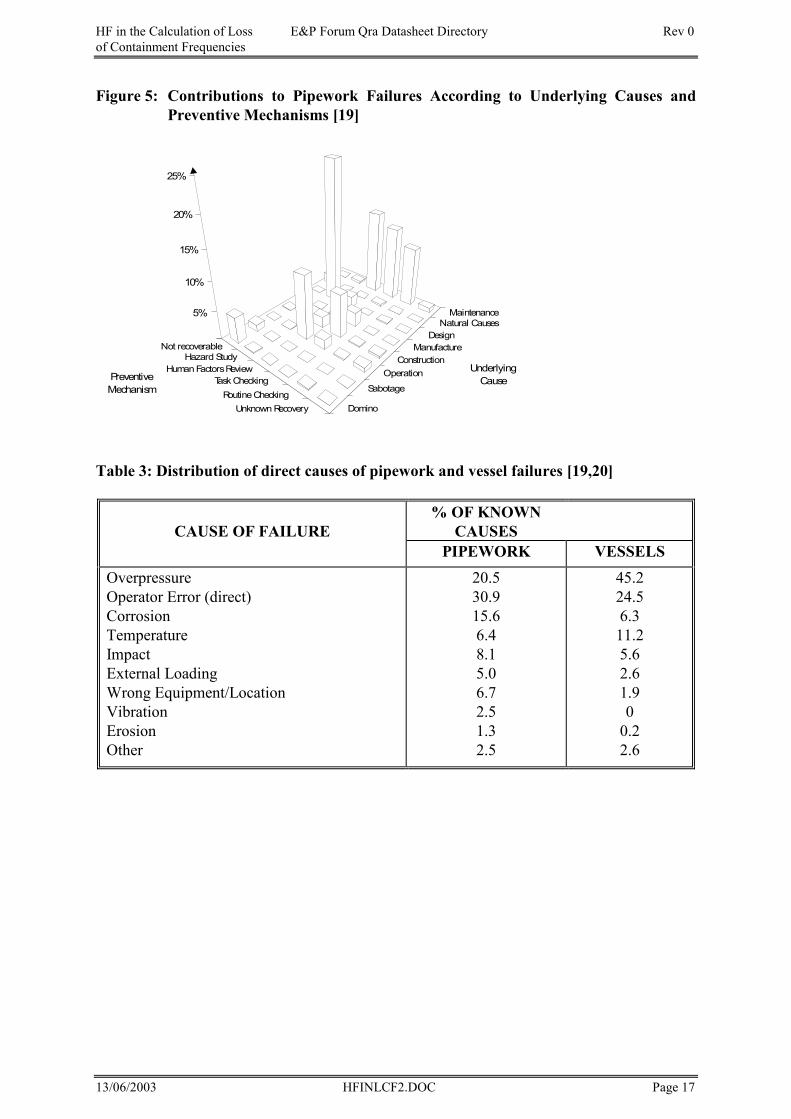
HF in the Calculation of Loss E&P Forum Qra Datasheet Directory Rev 0 of Containment Frequencies
13/06/2003 HFINLCF2.DOC Page 17
Figure 5: Contributions to Pipework Failures According to Underlying Causes and Preventive Mechanisms [19]
Maintenance
Design
ConstructionManufacture
Natural Causes
Sabotage
Domino
Operation
Not recoverableHazard Study
Human FactorsReviewTask Checking
RoutineCheckingUnknown Recovery
5%
10%
15%
20%
25%
PreventiveMechanism
UnderlyingCause
Table 3: Distribution of direct causes of pipework and vessel failures [19,20]
CAUSE OF FAILURE % OF KNOWN
CAUSES
PIPEWORK VESSELS
Overpressure Operator Error (direct) Corrosion Temperature Impact External Loading Wrong Equipment/Location Vibration Erosion Other
20.5 30.9 15.6 6.4 8.1 5.0 6.7 2.5 1.3 2.5
45.2 24.5 6.3 11.2 5.6 2.6 1.9 0
0.2 2.6
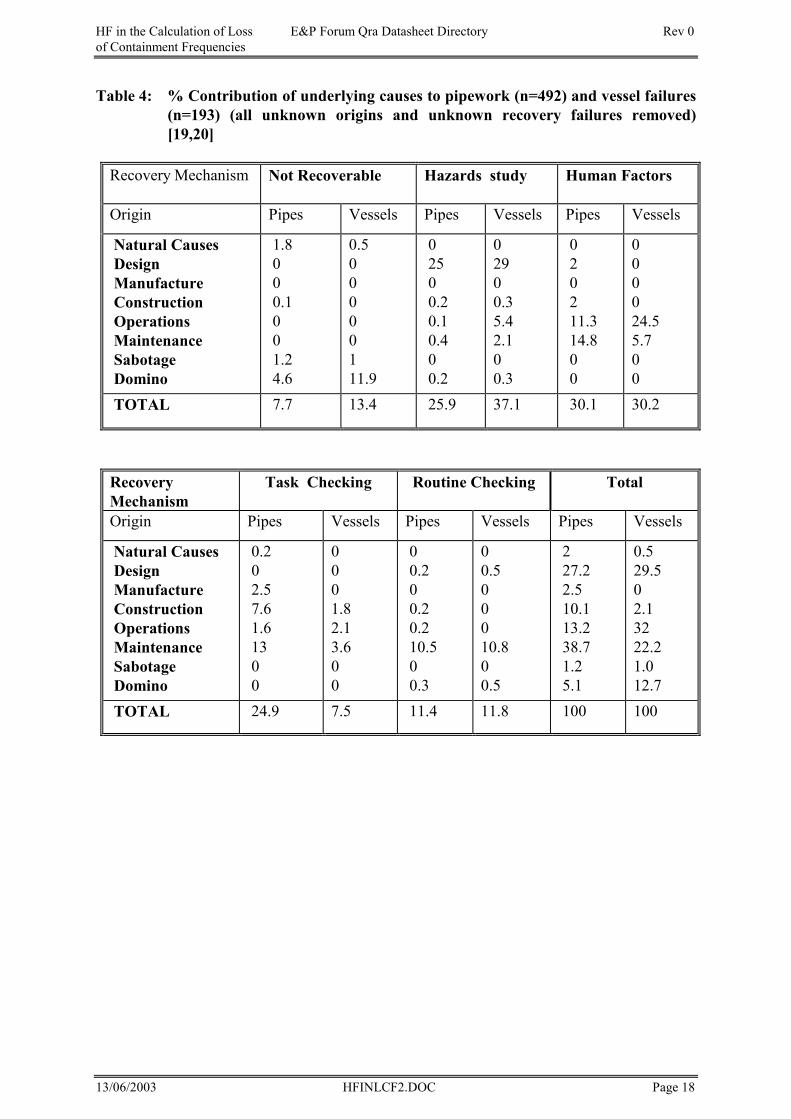
HF in the Calculation of Loss E&P Forum Qra Datasheet Directory Rev 0 of Containment Frequencies
13/06/2003 HFINLCF2.DOC Page 18
Table 4: % Contribution of underlying causes to pipework (n=492) and vessel failures (n=193) (all unknown origins and unknown recovery failures removed) [19,20]
Recovery Mechanism Not Recoverable Hazards study Human Factors
Origin Pipes Vessels Pipes Vessels Pipes Vessels
Natural Causes Design Manufacture Construction Operations Maintenance Sabotage Domino
1.8 0 0 0.1 0 0 1.2 4.6
0.5 00000111.9
0 25 0 0.2 0.1 0.4 0 0.2
029 00.3 5.4 2.1 00.3
0 2 0 2 11.3 14.8 0 0
000024.5 5.7 00
TOTAL 7.7 13.4 25.9 37.1 30.1 30.2
Recovery Mechanism
Task Checking Routine Checking Total
Origin Pipes Vessels Pipes Vessels Pipes Vessels
Natural Causes Design Manufacture Construction Operations Maintenance Sabotage Domino
0.2 0 2.5 7.6 1.6 13 0 0
0001.8 2.1 3.6 00
00.2 0 0.2 0.2 10.5 0 0.3
00.5 00010.8 00.5
2 27.2 2.5 10.1 13.2 38.7 1.2 5.1
0.5 29.5 02.1 32 22.2 1.0 12.7
TOTAL 24.9 7.5 11.4 11.8 100 100
HF in the Calculation of Loss E&P Forum Qra Datasheet Directory Rev 0 of Containment Frequencies
13/06/2003 HFINLCF2.DOC Page 19
5.3 How Management Exerts An Influence on LOC Frequencies
The key areas already mentioned for the control of loss of containment accidents, can be listed as follows (in order of importance for preventing pipework failures): • Hazard review of design • Human factors review of maintenance activities • Supervision and checking of maintenance tasks • Routine inspection and testing for maintenance • Human factors review of operations • Supervision and checking of construction/installation work • Hazard review (audit) of operations • Supervision and checking of operations 5.4 Reviewing a SMS to Calculate a Modification of Risk Factor
The complexity of safety management systems makes it necessary to have a structured and systematic approach to assessing their quality and adequacy. Any attempt to adjust or modify risk factors based on the outcome of an assessment of the Safety Management System must be approached with caution and should not be driven solely by the need to reduce calculated absolute risk levels (the QRA process will already take it into account many of the factors relating to safety management of the facility or activity). Notwithstanding, the assessment of whether risk factors may be adjusted up or down must be objective and impartial. This implies that such adjustments are only valid if based on wholly independent assessments of the relevant Safety Management System and Safety Case
6. ONGOING RESEARCH There is a continuing search for human error data, and there has been some sponsorship of this from the EC. Human Reliability Assessment techniques, and associated task analysis methods, are relatively mature and new developments here will not have a significant impact on current methodologies, simply offer refinements. Modification of risk is still state-of-the-art in terms of application. Techniques which are consistent in deriving objective MOR factors are under development. New ways of calculating top event frequencies using organisation and management influence pathways are being considered, but this is currently at the research stage.
HF in the Calculation of Loss E&P Forum Qra Datasheet Directory Rev 0 of Containment Frequencies
13/06/2003 HFINLCF2.DOC Page 20
7. REFERENCES [1] Hurst, N.W., Bellamy, L.J. and Geyer, T.A.W. (1991) A classification scheme for
pipework failures to include human and sociotechnical errors and their contribution to pipework failure frequencies. J. Hazardous Materials, 26 (1991) 159-186.
[2] Danos W., and Bennett L.E., Risk Analysis of Crane Accidents, U.S. Department
of the Interior/Minerals Management Service, OCS Report MMS 84-0056, 1984 [3] Butler A.J., An investigation into crane accidents, their causes and repair costs.
Building Research Establishment Report CP75/78, Department of the Environment, 1978
[4] Sutton R., and Towill D.R., A model of the crane operator as a man-machine
element, pp. 25-42 in Proceedings of the second European annual conference on human decision making and manual control, June 2-4, 1982, University of Bonn, poppelsdorfer Schloss. Forschungsinstitut fur Anthropotechnik (FGAN/FAT). Wachtberg - Werhoven, Federal Republic of Germany, 1982
[5] Wiken H., Offshore Crane Operations, Progress report no 1, Study of offshore
crane casualties in the North Sea. Det Norske Veritas Technical Report 78-633, 1978
[6] Muyselaar, A.J. and Bellamy, L.J. (1993). An audit technique for the evaluation
and management of risks. Paper presented at the CEC DGXI workshop on "Safety Management in the Process Industry", October 7-8 1993, Ravello, Italy.
[7] Four Elements (1993) report 2258 [8] Brabazon P.G., Gibson W.H., Tinline G., Leathley B.A., Practical Applications of
Human Factors Methods in Offshore Installation Design. Offshore South East Asia, 6-9 December, 1994
[9] Swain, A.D. and Guttmann, H.E. (1983), A Handbook of Human Reliability
Analyses with Emphasis on Nuclear Power Plant Applications, NUREG/CR-1298, Nuclear Regulatory Commission, Washington DC 20555.
[10] Bellamy, L.J. (1986) The Safety Management Factor: An Analysis of the Human
Error Aspects of the Bhopal Disaster. Safety and Reliability Society Symposium, 25 September 1986, Southport, UK.
[11] Kirwan B., A guide to practical human reliability assessment, Taylor & Francis,
1994, ISBN 07484-0111-3 [12] SRD/Humphreys, P. (ed.) (1988) Human Reliability Assessors Guide. Safety and
Reliability Directorate Publication RTS 88/95Q. Warrington: UK Atomic Energy Authority
HF in the Calculation of Loss E&P Forum Qra Datasheet Directory Rev 0 of Containment Frequencies
13/06/2003 HFINLCF2.DOC Page 21
[13] Hunns, D.M. and Daniels, B.K., The Method of Paired Comparisons, Proceedings 6th Symposium on Advances in Reliability Technology, Report NCSR R23 and R24, UK Atomic Energy Authority, 1980.
[14] Williams, J.C. (1988), A data-based method for assessing and reducing human
error to improve operational experience, In Proceedings of IEEE 4th Conference on Human Factors in Power Plants, Monterey, Calif., 6-9 June 1988.
[15] Whittingham, B. (1993) Human Factors in QRA - Data and Methodology. pp. 93-
118 in proceedings of the E&P Forum Workshop on Data in Oil and Gas Quantitative Risk Assessments, December 1993, Report no. 11.7/205 Jan 1994.
[16] Brown W et al., The qualification of human variability and its effect on nuclear
power plant risk, Brookhaven National Laboratory, Upton, NY, 1990 [17] Wong S et al., Risk sensitivity to human error in the LaSalle PRA, NUREG CR/-
5527, U.S. Nuclear Regulatory Commission, Washington, DC., 1990 [18] Bellamy, L.J., Wright, M.S. and Hurst, N.W. (1993) History and development of a
safety management system audit for incorporation into quantitative risk assessment. International process Safety Management Workshop, San Francisco, 22-24 September, AIChemE/CCPS.
[19] Bellamy, L.J., Geyer, T.A.W., and Astley, J.A.A. (1989) Evaluation of the human
contribution to pipework and in-line equipment failure frequencies. HSE Contract Research Report No. 89/15.
[20] Bellamy, L.J. and Geyer, T.A.W. (1991) Organisational, Management and Human
Factors in Quantified Risk Assessment. HSE Contract Research Report 33/1991.

HF in the Calculation of Loss E&P Forum Qra Datasheet Directory Rev 0 of Containment Frequencies
13/06/2003 HFINLCF2.DOC Page 22
Fire & Gas Detection E&P Forum Datasheet Directory Rev 0
13/06/2003 FIRE&G~1.DOC Page 1
FIRE AND GAS DETECTION
Fire & Gas Detection E&P Forum Datasheet Directory Rev 0
13/06/2003 FIRE&G~1.DOC Page 2
TABLE OF CONTENTS
LIST OF ABBREVIATIONS -------------------------------------------------------------------------- 3
1. INTRODUCTION------------------------------------------------------------------------------------- 4
2. RELIABILITY DATA -------------------------------------------------------------------------------- 5
2.1 Summary Reliability Data -------------------------------------------------------------------------------------------5
2.2 Reliability Parameter Definitions-----------------------------------------------------------------------------------5
3. DATA SOURCES FOR FIRE AND GAS DETECTION SYSTEM----------------------- 8
3.1 Data Sources------------------------------------------------------------------------------------------------------------8
3.2 Literature Survey---------------------------------------------------------------------------------------------------- 10 3.2.1 Compendex ----------------------------------------------------------------------------------------------------------- 11 3.2.2 CARL UnCover ------------------------------------------------------------------------------------------------------ 11 3.2.3 BIBSYS --------------------------------------------------------------------------------------------------------------- 11
4. ON-GOING RESEARCH------------------------------------------------------------------------- 11
5. REFERENCES ------------------------------------------------------------------------------------- 12
APPENDIX A - RELIABILITY DATA SHEETS------------------------------------------------A1
Fire & Gas Detection E&P Forum Datasheet Directory Rev 0
13/06/2003 FIRE&G~1.DOC Page 3
LIST OF ABBREVIATIONS
CPU Central Processing Unit
CSU Critical Safety Unavailability
ESD Emergency Shut Down
FGD Fire and Gas Detection
FTIR Fourier Transform Infrared
FTO Fail To Operate
IR InfraRed
LCC Life Cycle Cost
NC Non-Critical
NORSOK The Norwegian initiative to reduce development and operation cost for the offshore oil and gas industry. NORSOK have issued a number of technical standards.
OREDA Offshore Reliability Data
PDS-method Method for quantification of the safety and reliability performance of computer-based process safety systems, developed by SINTEF in the PDS-project.
PDS-project SINTEF-project “Reliability and Availability of Computer-Based Process Safety Systems” (Norwegian abbreviation)
PLC Programmable Logic Controller
SO Spurious Operation
STR Spurious Trip Rate
TÜV Technische Überwachungs Verein (Germany)
TIF Test Independent Failure
UV Ultraviolet
Fire & Gas Detection E&P Forum Datasheet Directory Rev 0
13/06/2003 FIRE&G~1.DOC Page 4
1. INTRODUCTION The objective of this datasheet is to identify data sources for fire and gas detection system components, and further to provide illustrative reliability data for such components. The report presents reliability data for fire and gas detection system components (Chapter 2 and Appendix B). Further, data sources for these type of components are identified and discussed (Chapter 3).
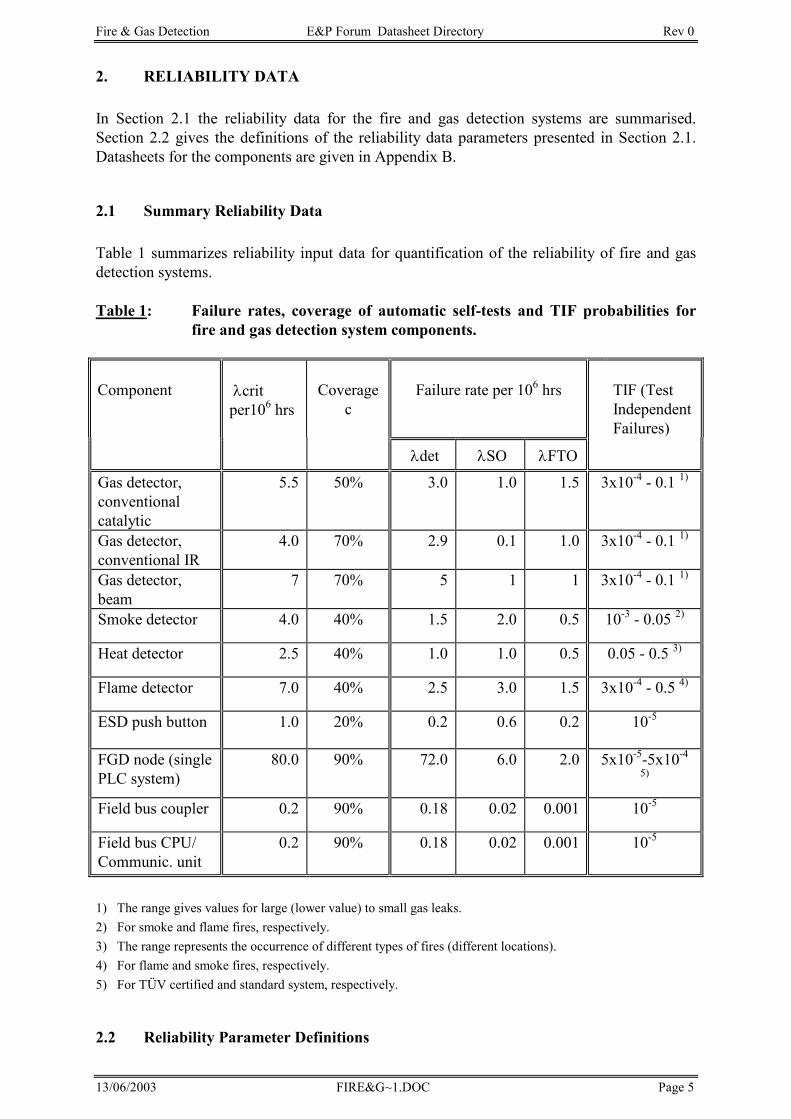
Fire & Gas Detection E&P Forum Datasheet Directory Rev 0
13/06/2003 FIRE&G~1.DOC Page 5
2. RELIABILITY DATA In Section 2.1 the reliability data for the fire and gas detection systems are summarised. Section 2.2 gives the definitions of the reliability data parameters presented in Section 2.1. Datasheets for the components are given in Appendix B.
2.1 Summary Reliability Data Table 1 summarizes reliability input data for quantification of the reliability of fire and gas detection systems. Table 1: Failure rates, coverage of automatic self-tests and TIF probabilities for
fire and gas detection system components.
Component λcrit per106 hrs
Coverage
cFailure rate per 106 hrs
TIF (Test Independent Failures)
λdet λSO λFTO
Gas detector, conventional catalytic
5.5 50% 3.0 1.0 1.5 3x10⁻⁴ - 0.1 1)
Gas detector, conventional IR
4.0 70% 2.9 0.1 1.0 3x10⁻⁴ - 0.1 1)
Gas detector, beam
7 70% 5 1 1 3x10⁻⁴ - 0.1 1)
Smoke detector 4.0 40% 1.5 2.0 0.5 10-3 - 0.05 2)
Heat detector 2.5 40% 1.0 1.0 0.5 0.05 - 0.5 3)
Flame detector 7.0 40% 2.5 3.0 1.5 3x10⁻⁴ - 0.5 4)
ESD push button 1.0 20% 0.2 0.6 0.2 10-5
FGD node (single PLC system)
80.0 90% 72.0 6.0 2.0 5x10⁻⁵-5x10⁻⁴ 5)
Field bus coupler 0.2 90% 0.18 0.02 0.001 10-5
Field bus CPU/ Communic. unit
0.2 90% 0.18 0.02 0.001 10-5
1) The range gives values for large (lower value) to small gas leaks. 2) For smoke and flame fires, respectively. 3) The range represents the occurrence of different types of fires (different locations). 4) For flame and smoke fires, respectively. 5) For TÜV certified and standard system, respectively.
2.2 Reliability Parameter Definitions
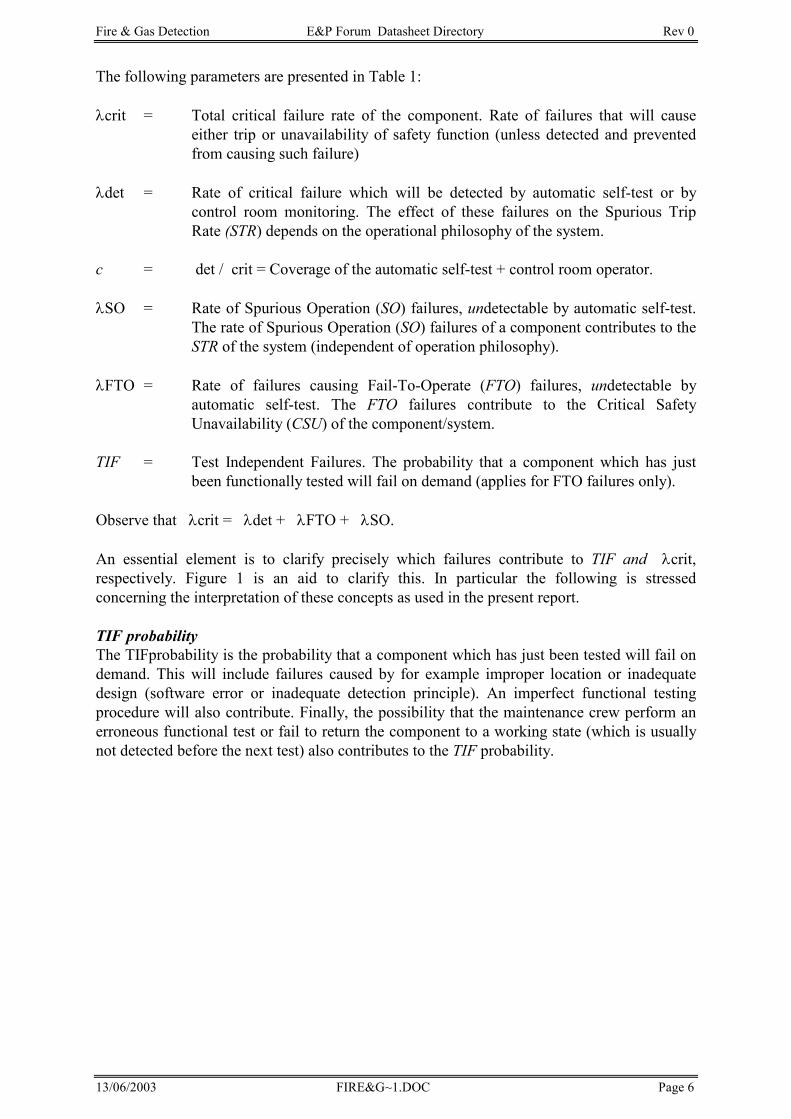
Fire & Gas Detection E&P Forum Datasheet Directory Rev 0
13/06/2003 FIRE&G~1.DOC Page 6
The following parameters are presented in Table 1: λcrit = Total critical failure rate of the component. Rate of failures that will cause
either trip or unavailability of safety function (unless detected and prevented from causing such failure)
λdet = Rate of critical failure which will be detected by automatic self-test or by
control room monitoring. The effect of these failures on the Spurious Trip Rate (STR) depends on the operational philosophy of the system.
c = det / crit = Coverage of the automatic self-test + control room operator.
λSO = Rate of Spurious Operation (SO) failures, undetectable by automatic self-test.
The rate of Spurious Operation (SO) failures of a component contributes to the STR of the system (independent of operation philosophy).
λFTO = Rate of failures causing Fail-To-Operate (FTO) failures, undetectable by
automatic self-test. The FTO failures contribute to the Critical Safety Unavailability (CSU) of the component/system.
TIF = Test Independent Failures. The probability that a component which has just
been functionally tested will fail on demand (applies for FTO failures only). Observe that λcrit = λdet + λFTO + λSO. An essential element is to clarify precisely which failures contribute to TIF and λcrit, respectively. Figure 1 is an aid to clarify this. In particular the following is stressed concerning the interpretation of these concepts as used in the present report. TIF probability The TIFprobability is the probability that a component which has just been tested will fail on demand. This will include failures caused by for example improper location or inadequate design (software error or inadequate detection principle). An imperfect functional testing procedure will also contribute. Finally, the possibility that the maintenance crew perform an erroneous functional test or fail to return the component to a working state (which is usually not detected before the next test) also contributes to the TIF probability.
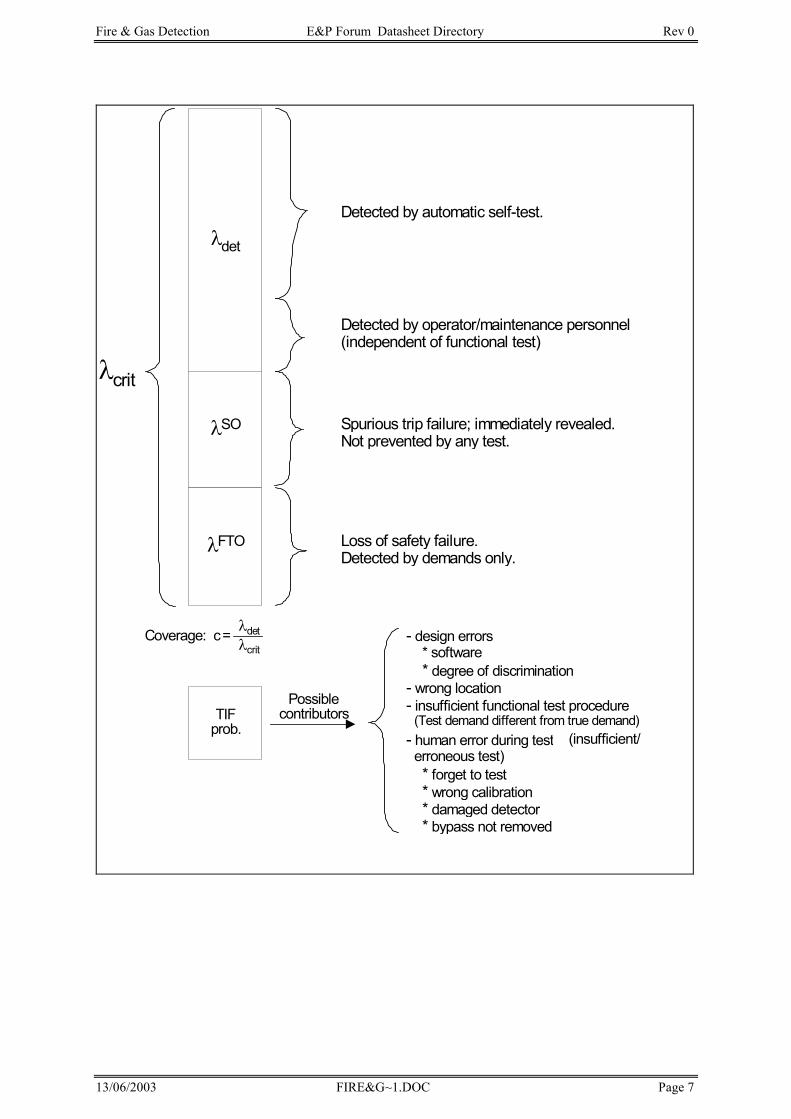
Fire & Gas Detection E&P Forum Datasheet Directory Rev 0
13/06/2003 FIRE&G~1.DOC Page 7
λdet
λSO
λFTO
Detected by operator/maintenance personnel(independent of functional test)
Coverage: c=
TIFprob.
- design errors* software* degree of discrimination
- wrong location- insufficient functional test procedure
(Test demand different from true demand)- human error during test (insufficient/erroneous test)
* forget to test* wrong calibration* damaged detector* bypass not removed
λcrit
λdetλcrit
Detected by automatic self-test.
Spurious trip failure; immediately revealed.Not prevented by any test.
Loss of safety failure.Detected by demands only.
Possiblecontributors
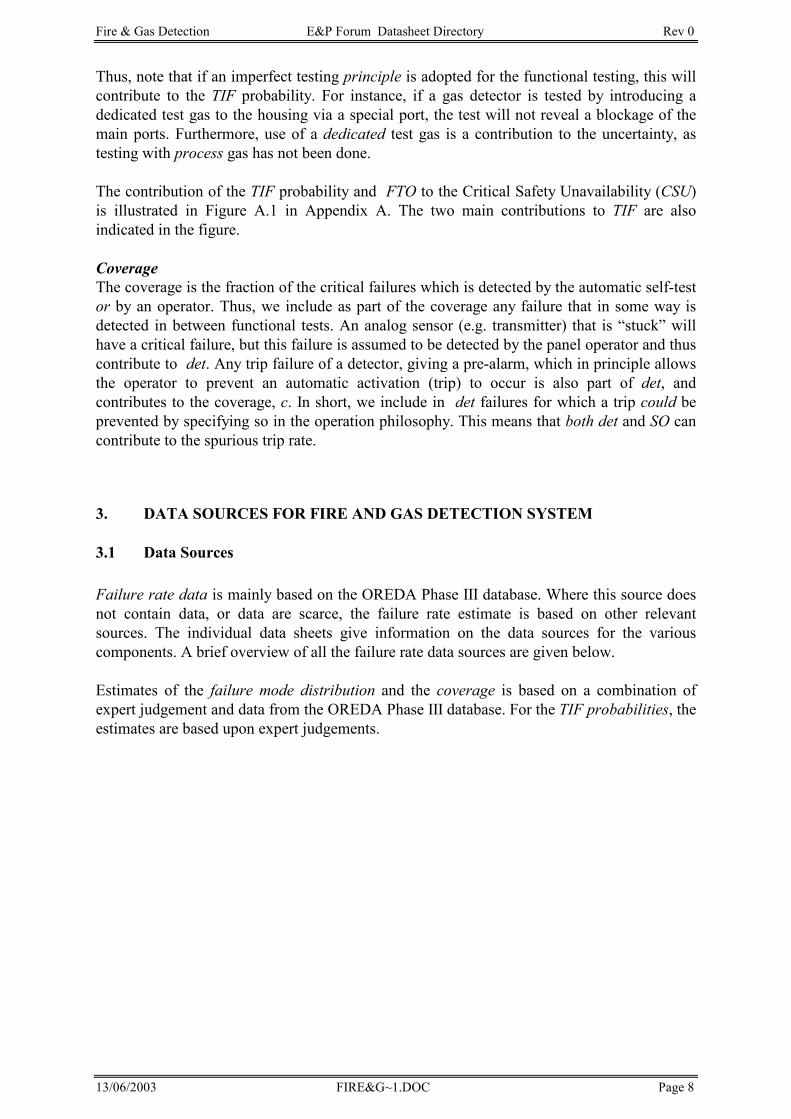
Fire & Gas Detection E&P Forum Datasheet Directory Rev 0
13/06/2003 FIRE&G~1.DOC Page 8
Thus, note that if an imperfect testing principle is adopted for the functional testing, this will contribute to the TIF probability. For instance, if a gas detector is tested by introducing a dedicated test gas to the housing via a special port, the test will not reveal a blockage of the main ports. Furthermore, use of a dedicated test gas is a contribution to the uncertainty, as testing with process gas has not been done. The contribution of the TIF probability and FTO to the Critical Safety Unavailability (CSU)is illustrated in Figure A.1 in Appendix A. The two main contributions to TIF are also indicated in the figure. Coverage The coverage is the fraction of the critical failures which is detected by the automatic self-test or by an operator. Thus, we include as part of the coverage any failure that in some way is detected in between functional tests. An analog sensor (e.g. transmitter) that is “stuck” will have a critical failure, but this failure is assumed to be detected by the panel operator and thus contribute to det. Any trip failure of a detector, giving a pre-alarm, which in principle allows the operator to prevent an automatic activation (trip) to occur is also part of det, and contributes to the coverage, c. In short, we include in det failures for which a trip could be prevented by specifying so in the operation philosophy. This means that both det and SO can contribute to the spurious trip rate.
3. DATA SOURCES FOR FIRE AND GAS DETECTION SYSTEM
3.1 Data Sources
Failure rate data is mainly based on the OREDA Phase III database. Where this source does not contain data, or data are scarce, the failure rate estimate is based on other relevant sources. The individual data sheets give information on the data sources for the various components. A brief overview of all the failure rate data sources are given below. Estimates of the failure mode distribution and the coverage is based on a combination of expert judgement and data from the OREDA Phase III database. For the TIF probabilities, the estimates are based upon expert judgements.
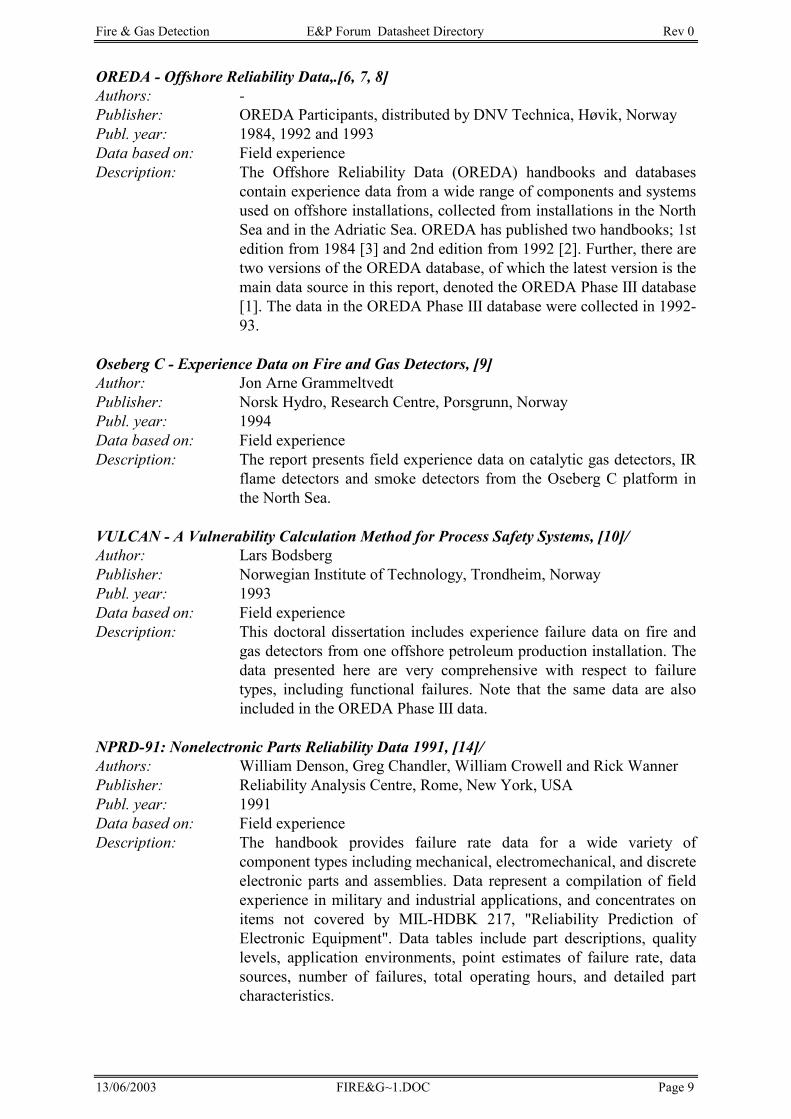
Fire & Gas Detection E&P Forum Datasheet Directory Rev 0
13/06/2003 FIRE&G~1.DOC Page 9
OREDA - Offshore Reliability Data,.[6, 7, 8] Authors: - Publisher: OREDA Participants, distributed by DNV Technica, Høvik, Norway Publ. year: 1984, 1992 and 1993 Data based on: Field experience Description: The Offshore Reliability Data (OREDA) handbooks and databases
contain experience data from a wide range of components and systems used on offshore installations, collected from installations in the North Sea and in the Adriatic Sea. OREDA has published two handbooks; 1st edition from 1984 [3] and 2nd edition from 1992 [2]. Further, there are two versions of the OREDA database, of which the latest version is the main data source in this report, denoted the OREDA Phase III database [1]. The data in the OREDA Phase III database were collected in 1992-93.
Oseberg C - Experience Data on Fire and Gas Detectors, [9] Author: Jon Arne Grammeltvedt Publisher: Norsk Hydro, Research Centre, Porsgrunn, Norway Publ. year: 1994Data based on: Field experience Description: The report presents field experience data on catalytic gas detectors, IR
flame detectors and smoke detectors from the Oseberg C platform in the North Sea.
VULCAN - A Vulnerability Calculation Method for Process Safety Systems, [10]/ Author: Lars Bodsberg Publisher: Norwegian Institute of Technology, Trondheim, Norway Publ. year: 1993Data based on: Field experience Description: This doctoral dissertation includes experience failure data on fire and
gas detectors from one offshore petroleum production installation. The data presented here are very comprehensive with respect to failure types, including functional failures. Note that the same data are also included in the OREDA Phase III data.
NPRD-91: Nonelectronic Parts Reliability Data 1991, [14]/ Authors: William Denson, Greg Chandler, William Crowell and Rick Wanner Publisher: Reliability Analysis Centre, Rome, New York, USA Publ. year: 1991Data based on: Field experience Description: The handbook provides failure rate data for a wide variety of
component types including mechanical, electromechanical, and discrete electronic parts and assemblies. Data represent a compilation of field experience in military and industrial applications, and concentrates on items not covered by MIL-HDBK 217, "Reliability Prediction of Electronic Equipment". Data tables include part descriptions, quality levels, application environments, point estimates of failure rate, data sources, number of failures, total operating hours, and detailed part characteristics.
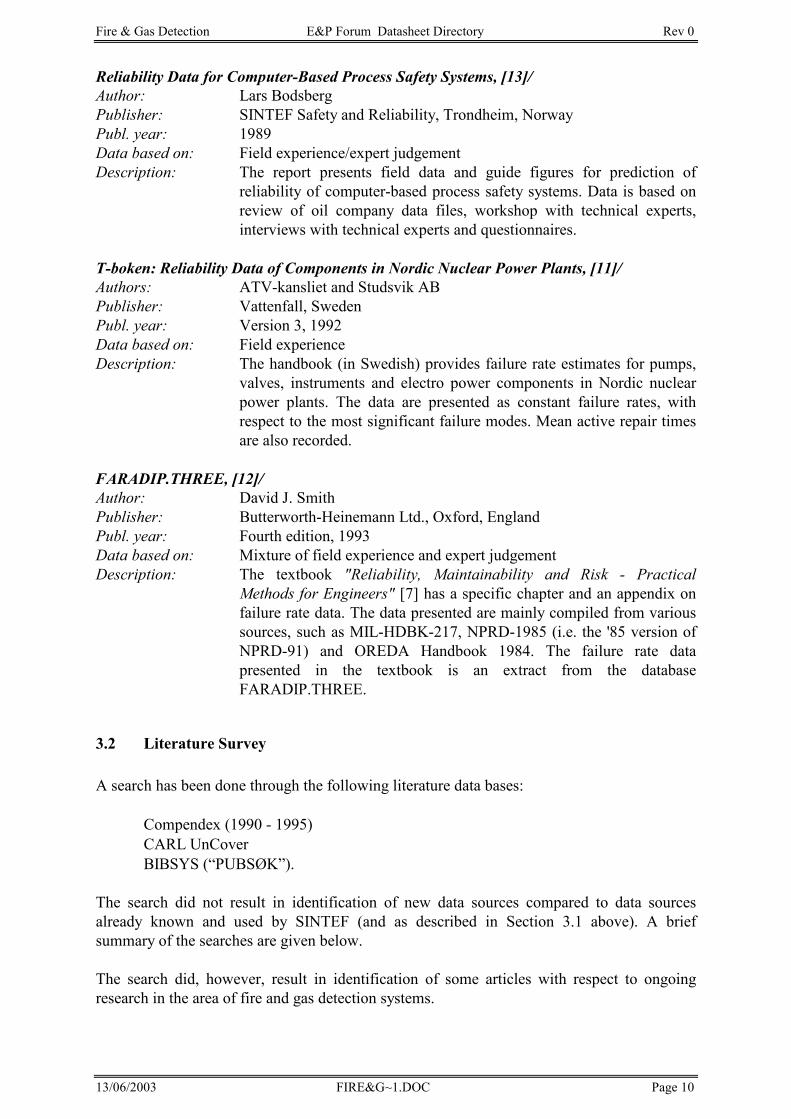
Fire & Gas Detection E&P Forum Datasheet Directory Rev 0
13/06/2003 FIRE&G~1.DOC Page 10
Reliability Data for Computer-Based Process Safety Systems, [13]/ Author: Lars Bodsberg Publisher: SINTEF Safety and Reliability, Trondheim, Norway Publ. year: 1989Data based on: Field experience/expert judgement Description: The report presents field data and guide figures for prediction of
reliability of computer-based process safety systems. Data is based on review of oil company data files, workshop with technical experts, interviews with technical experts and questionnaires.
T-boken: Reliability Data of Components in Nordic Nuclear Power Plants, [11]/ Authors: ATV-kansliet and Studsvik AB Publisher: Vattenfall, Sweden Publ. year: Version 3, 1992 Data based on: Field experience Description: The handbook (in Swedish) provides failure rate estimates for pumps,
valves, instruments and electro power components in Nordic nuclear power plants. The data are presented as constant failure rates, with respect to the most significant failure modes. Mean active repair times are also recorded.
FARADIP.THREE, [12]/ Author: David J. Smith Publisher: Butterworth-Heinemann Ltd., Oxford, England Publ. year: Fourth edition, 1993 Data based on: Mixture of field experience and expert judgement Description: The textbook "Reliability, Maintainability and Risk - Practical
Methods for Engineers" [7] has a specific chapter and an appendix on failure rate data. The data presented are mainly compiled from various sources, such as MIL-HDBK-217, NPRD-1985 (i.e. the '85 version of NPRD-91) and OREDA Handbook 1984. The failure rate data presented in the textbook is an extract from the database FARADIP.THREE.
3.2 Literature Survey A search has been done through the following literature data bases: • Compendex (1990 - 1995) • CARL UnCover • BIBSYS (“PUBSØK”). The search did not result in identification of new data sources compared to data sources already known and used by SINTEF (and as described in Section 3.1 above). A brief summary of the searches are given below. The search did, however, result in identification of some articles with respect to ongoing research in the area of fire and gas detection systems.
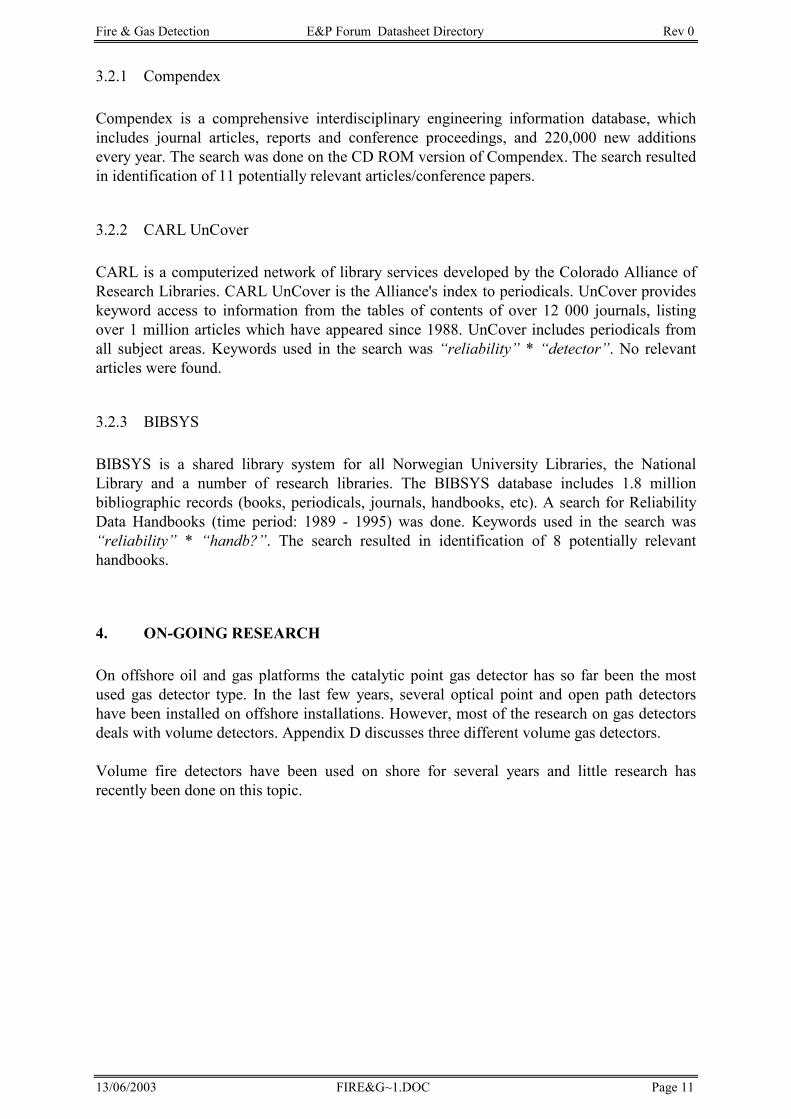
Fire & Gas Detection E&P Forum Datasheet Directory Rev 0
13/06/2003 FIRE&G~1.DOC Page 11
3.2.1 Compendex Compendex is a comprehensive interdisciplinary engineering information database, which includes journal articles, reports and conference proceedings, and 220,000 new additions every year. The search was done on the CD ROM version of Compendex. The search resulted in identification of 11 potentially relevant articles/conference papers.
3.2.2 CARL UnCover CARL is a computerized network of library services developed by the Colorado Alliance of Research Libraries. CARL UnCover is the Alliance's index to periodicals. UnCover provides keyword access to information from the tables of contents of over 12 000 journals, listing over 1 million articles which have appeared since 1988. UnCover includes periodicals from all subject areas. Keywords used in the search was “reliability” * “detector”. No relevant articles were found.
3.2.3 BIBSYS BIBSYS is a shared library system for all Norwegian University Libraries, the National Library and a number of research libraries. The BIBSYS database includes 1.8 million bibliographic records (books, periodicals, journals, handbooks, etc). A search for Reliability Data Handbooks (time period: 1989 - 1995) was done. Keywords used in the search was “reliability” * “handb?”. The search resulted in identification of 8 potentially relevant handbooks.
4. ON-GOING RESEARCH On offshore oil and gas platforms the catalytic point gas detector has so far been the most used gas detector type. In the last few years, several optical point and open path detectors have been installed on offshore installations. However, most of the research on gas detectors deals with volume detectors. Appendix D discusses three different volume gas detectors. Volume fire detectors have been used on shore for several years and little research has recently been done on this topic.
Fire & Gas Detection E&P Forum Datasheet Directory Rev 0
13/06/2003 FIRE&G~1.DOC Page 12
5. REFERENCES 1. Ragnar Aarø, Lars Bodsberg and Per Hokstad, Reliability Prediction Handbook.
Computer-Based Process Safety Systems. SINTEF Report STF75 A89023. 2. Lars Bodsberg and Per Hokstad, A System Approach to Reliability and Life-Cycle-
Cost for Process Safety Systems. To appear in IEEE Transactions on Reliability 1995. 3. Lars Bodsberg et al, Reliability and Quantification of Control and Safety Systems. The
PDS-II method. SINTEF Report STF75 A93064. 4. Common Requirements, SAFETY AND AUTOMATION SYSTEMS (SAS), Norsok
Standard, I-CR-002, Rev.1, December 1994. Distributed by NORSOK Standards Information Centre, OLF, P.O. box 547, N-4001 Stavanger.
5. Draft IEC 1508 - Functional Safety : Safety-Related Systems, International
Electrotechnical Commission, 1995. 6. OREDA Phase III, computer based database on topside equipment, OREDA
Participants (multiclient project on collection of offshore reliability data). 7. OREDA Handbook; Offshore Reliability Data Handbook, 2nd edition, OREDA
Participants (multiclient project on collection of offshore reliability data), 1992 8. OREDA Handbook; Offshore Reliability Data Handbook, 1st edition, OREDA
Participants (multiclient project on collection of offshore reliability data), 1984 9. Jon Arne Grammeltvedt, U&P; Oseberg C - Gjennomgang av erfaringsdata for
brann- og gassdetektorer på Oseberg C. Forslag til testintervaller for detektorene,report from Norsk Hydro, Research Centre Porsgrunn, 1994-07-28 (internal Norsk Hydro report in Norwegian).
10. Lars Bodsberg, VULCAN - A Vulnerability Calculation Method for Process Safety
Systems, Doctoral dissertation, Norwegian Institute of Technology, Dep. of Mathematical Sciences, Trondheim, 1993.
11. T-boken, Version 3: Tilförlitlighetsdata för komponenter i nordiska kraftreaktorer,
ATV-kansliet and Studsvik AB, publisehd by Vattenfall, Sweden, 1992 (in Swedish). 12. David J. Smith, Reliability, Maintainability and Risk - Practical Methods for
Engineers, Butterworth-Heinemann Ltd., Oxford, England, Fourth edition, 1993. 13. Lars Bodsberg, Reliability Data for Computer-Based Process Safety Systems, SINTEF
Report STF75 F89025, 1989. 14. William Denson et al., NPRD-91: Nonelectronic Parts Reliability Data 1991,
Reliability Analysis Center, Rome, New York, USA, 1991. 15. D. C. Strachan et al., Imaging of hydrocarbon vapours ad gases by infrared
thermography, J. Phys. E: Sci. instrum., No 18, 1985.
Fire & Gas Detection E&P Forum Datasheet Directory Rev 0
13/06/2003 FIRE&G~1.DOC Page 13
16. T. G. McRae and T. J. Kulp, Backscatter absorption gas imaging: a new technique for gas visualization, Applied Optics, Vol. 32, No. 21, 1993.
17. G. Thomas, OTIM - Passive Remote Gas Detector, Sensor Review, Vol. 14, No. 3,
1994. 18. S. M. Skippon and R. T. Short, Suitability of Flame Detectors for Offshore
Applications, Fire Safety Journal, No 21, 1993.
Fire & Gas Detection E&P Forum Datasheet Directory Rev 0
13/06/2003 FIRE&G~1.DOC A 1
Appendix A:
RELIABILITY DATA SHEETS
Fire & Gas Detection E&P Forum Datasheet Directory Rev 0
13/06/2003 FIRE&G~1.DOC A 2
Data Sheet Contents Page
Component Page Number
Gas Detector, Conventional Catalytic A - 3 Gas Detector, Conventional IR A - 4 Gas Detector, Beam A - 5 Smoke Detector, Conventional A - 6 Heat Detector, Conventional A - 7 Flame Detector, Conventional A - 8 ESD Push Button A - 9 FGD Node (single PLC system) A - 10 Field Bus Coupler A - 11 Field Bus CPU/Communication Unit A - 12
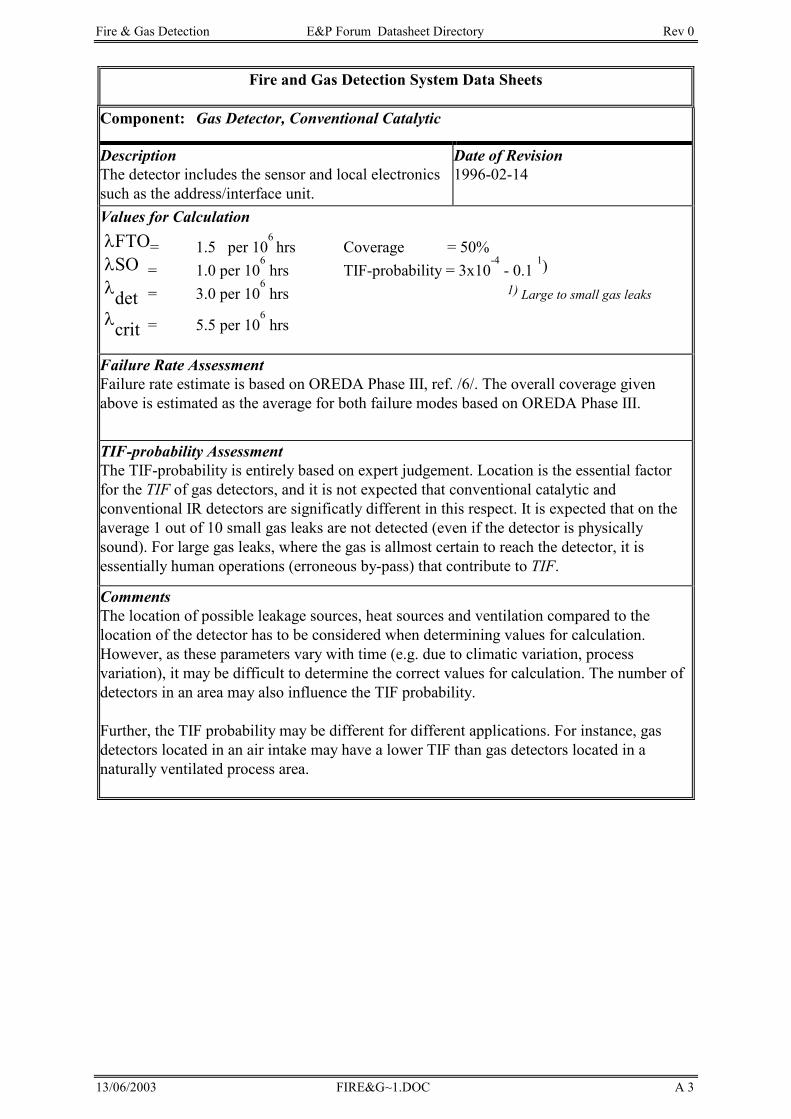
Fire & Gas Detection E&P Forum Datasheet Directory Rev 0
13/06/2003 FIRE&G~1.DOC A 3
Fire and Gas Detection System Data Sheets
Component: Gas Detector, Conventional Catalytic
DescriptionThe detector includes the sensor and local electronics such as the address/interface unit.
Date of Revision1996-02-14
Values for Calculation λFTO= 1.5 per 10
6hrs Coverage = 50%
λSO = 1.0 per 106
hrs TIF-probability = 3x10⁻⁴
- 0.1 1)
λdet = 3.0 per 106
hrs 1) Large to small gas leaks λcrit = 5.5 per 10
6hrs
Failure Rate Assessment Failure rate estimate is based on OREDA Phase III, ref. /6/. The overall coverage given above is estimated as the average for both failure modes based on OREDA Phase III.
TIF-probability Assessment The TIF-probability is entirely based on expert judgement. Location is the essential factor for the TIF of gas detectors, and it is not expected that conventional catalytic and conventional IR detectors are significatly different in this respect. It is expected that on the average 1 out of 10 small gas leaks are not detected (even if the detector is physically sound). For large gas leaks, where the gas is allmost certain to reach the detector, it is essentially human operations (erroneous by-pass) that contribute to TIF.
Comments The location of possible leakage sources, heat sources and ventilation compared to the location of the detector has to be considered when determining values for calculation. However, as these parameters vary with time (e.g. due to climatic variation, process variation), it may be difficult to determine the correct values for calculation. The number of detectors in an area may also influence the TIF probability. Further, the TIF probability may be different for different applications. For instance, gas detectors located in an air intake may have a lower TIF than gas detectors located in a naturally ventilated process area.
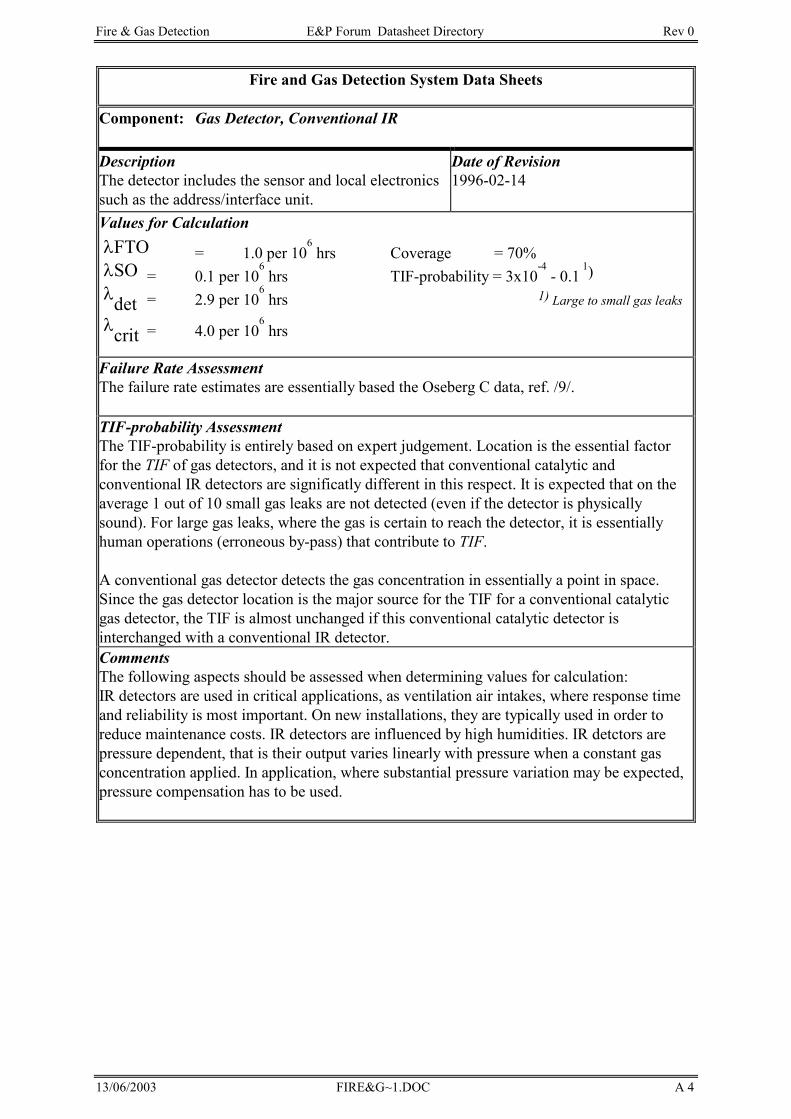
Fire & Gas Detection E&P Forum Datasheet Directory Rev 0
13/06/2003 FIRE&G~1.DOC A 4
Fire and Gas Detection System Data Sheets
Component: Gas Detector, Conventional IR
DescriptionThe detector includes the sensor and local electronics such as the address/interface unit.
Date of Revision1996-02-14
Values for Calculation λFTO = 1.0 per 10
6hrs Coverage = 70%
λSO = 0.1 per 106
hrs TIF-probability = 3x10⁻⁴
- 0.1 1)
λdet = 2.9 per 106
hrs 1) Large to small gas leaks λcrit = 4.0 per 10
6hrs
Failure Rate Assessment The failure rate estimates are essentially based the Oseberg C data, ref. /9/. TIF-probability Assessment The TIF-probability is entirely based on expert judgement. Location is the essential factor for the TIF of gas detectors, and it is not expected that conventional catalytic and conventional IR detectors are significatly different in this respect. It is expected that on the average 1 out of 10 small gas leaks are not detected (even if the detector is physically sound). For large gas leaks, where the gas is certain to reach the detector, it is essentially human operations (erroneous by-pass) that contribute to TIF.
A conventional gas detector detects the gas concentration in essentially a point in space. Since the gas detector location is the major source for the TIF for a conventional catalytic gas detector, the TIF is almost unchanged if this conventional catalytic detector is interchanged with a conventional IR detector. Comments The following aspects should be assessed when determining values for calculation: IR detectors are used in critical applications, as ventilation air intakes, where response time and reliability is most important. On new installations, they are typically used in order to reduce maintenance costs. IR detectors are influenced by high humidities. IR detctors are pressure dependent, that is their output varies linearly with pressure when a constant gas concentration applied. In application, where substantial pressure variation may be expected, pressure compensation has to be used.
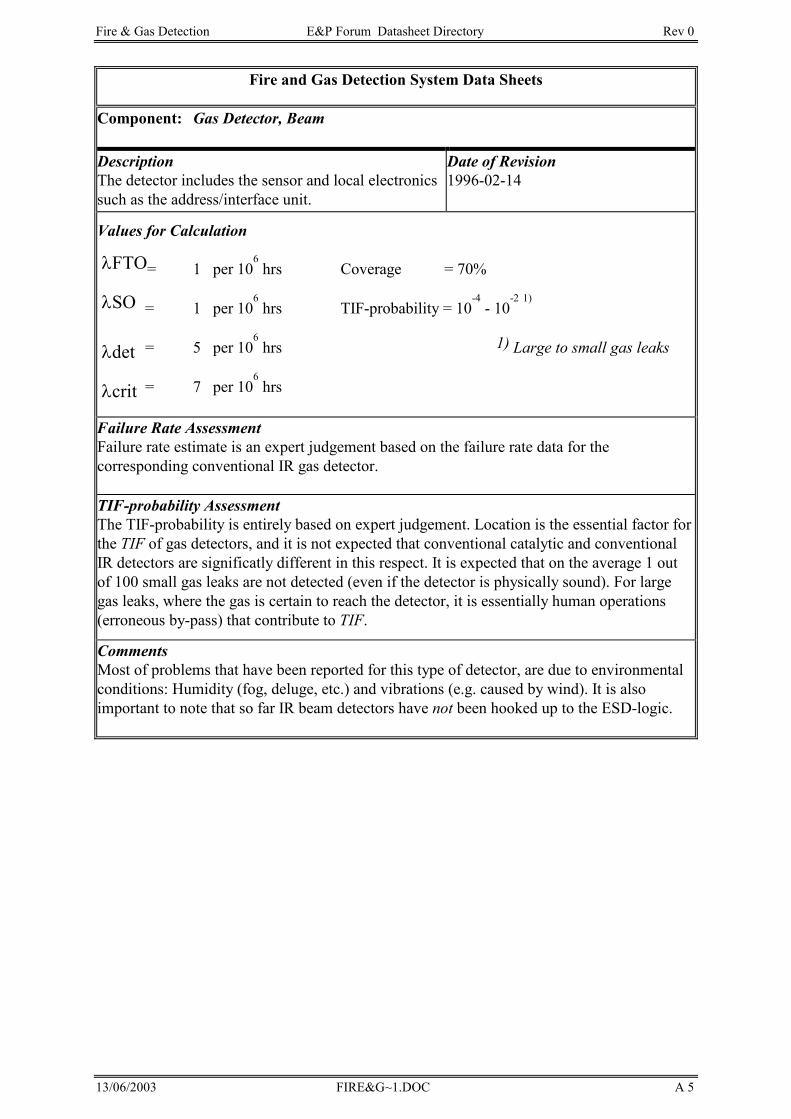
Fire & Gas Detection E&P Forum Datasheet Directory Rev 0
13/06/2003 FIRE&G~1.DOC A 5
Fire and Gas Detection System Data Sheets
Component: Gas Detector, Beam
DescriptionThe detector includes the sensor and local electronics such as the address/interface unit.
Date of Revision1996-02-14
Values for Calculation
λFTO= 1. per 106
hrs Coverage = 70%
λSO = 1. per 106
hrs TIF-probability = 10-4
- 10-2
1)
λdet = 5. per 106
hrs 1) Large to small gas leaks
λcrit = 7. per 106
hrs
Failure Rate Assessment Failure rate estimate is an expert judgement based on the failure rate data for the corresponding conventional IR gas detector. TIF-probability Assessment The TIF-probability is entirely based on expert judgement. Location is the essential factor for the TIF of gas detectors, and it is not expected that conventional catalytic and conventional IR detectors are significatly different in this respect. It is expected that on the average 1 out of 100 small gas leaks are not detected (even if the detector is physically sound). For large gas leaks, where the gas is certain to reach the detector, it is essentially human operations (erroneous by-pass) that contribute to TIF.
Comments Most of problems that have been reported for this type of detector, are due to environmental conditions: Humidity (fog, deluge, etc.) and vibrations (e.g. caused by wind). It is also important to note that so far IR beam detectors have not been hooked up to the ESD-logic.
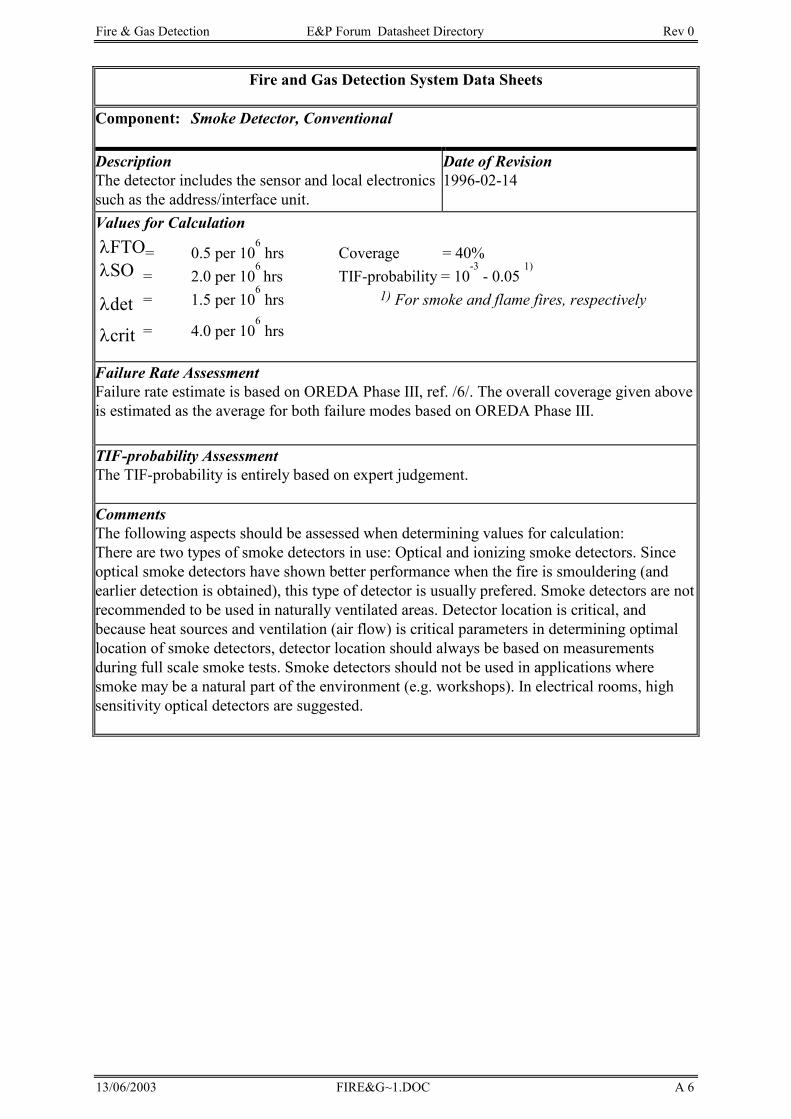
Fire & Gas Detection E&P Forum Datasheet Directory Rev 0
13/06/2003 FIRE&G~1.DOC A 6
Fire and Gas Detection System Data Sheets
Component: Smoke Detector, Conventional
DescriptionThe detector includes the sensor and local electronics such as the address/interface unit.
Date of Revision1996-02-14
Values for Calculation λFTO= 0.5 per 10
6hrs Coverage = 40%
λSO = 2.0 per 106
hrs TIF-probability = 10-3
- 0.05 1)
λdet = 1.5 per 106
hrs 1) For smoke and flame fires, respectively
λcrit = 4.0 per 106
hrs
Failure Rate Assessment Failure rate estimate is based on OREDA Phase III, ref. /6/. The overall coverage given above is estimated as the average for both failure modes based on OREDA Phase III. TIF-probability Assessment The TIF-probability is entirely based on expert judgement. Comments The following aspects should be assessed when determining values for calculation: There are two types of smoke detectors in use: Optical and ionizing smoke detectors. Since optical smoke detectors have shown better performance when the fire is smouldering (and earlier detection is obtained), this type of detector is usually prefered. Smoke detectors are not recommended to be used in naturally ventilated areas. Detector location is critical, and because heat sources and ventilation (air flow) is critical parameters in determining optimal location of smoke detectors, detector location should always be based on measurements during full scale smoke tests. Smoke detectors should not be used in applications where smoke may be a natural part of the environment (e.g. workshops). In electrical rooms, high sensitivity optical detectors are suggested.
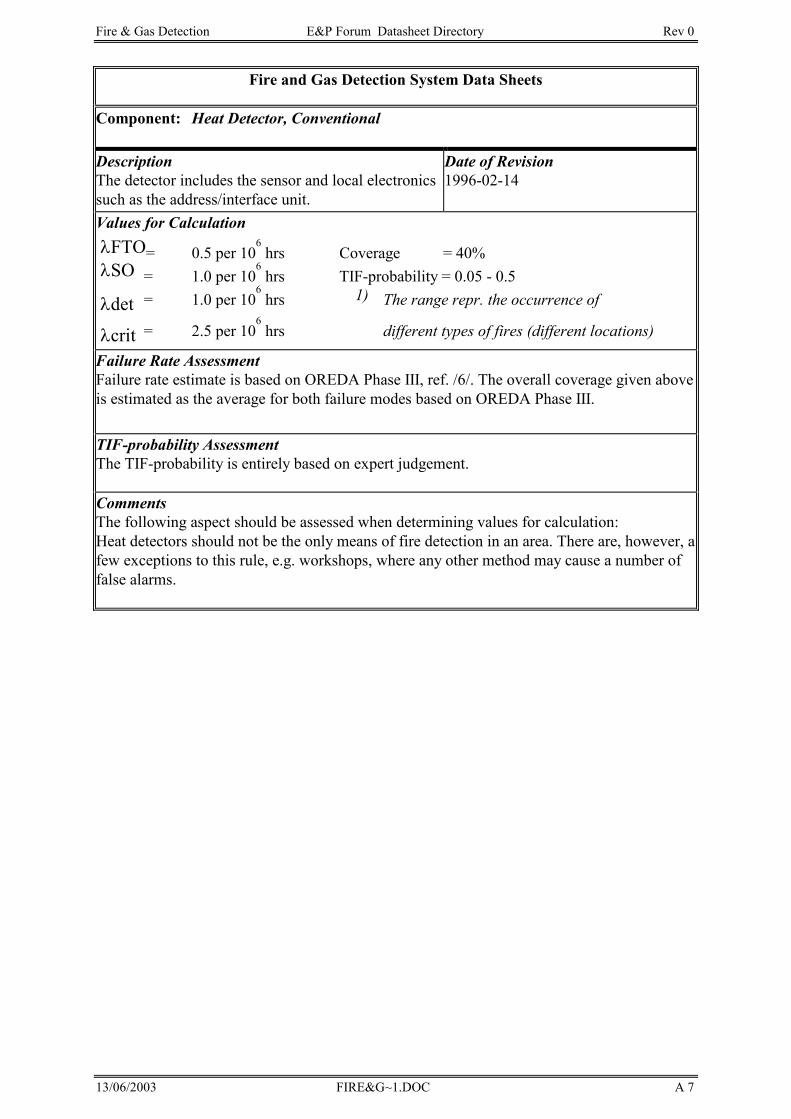
Fire & Gas Detection E&P Forum Datasheet Directory Rev 0
13/06/2003 FIRE&G~1.DOC A 7
Fire and Gas Detection System Data Sheets
Component: Heat Detector, Conventional
DescriptionThe detector includes the sensor and local electronics such as the address/interface unit.
Date of Revision1996-02-14
Values for Calculation λFTO= 0.5 per 10
6hrs Coverage = 40%
λSO = 1.0 per 106
hrs TIF-probability = 0.05 - 0.5
λdet = 1.0 per 106
hrs 1) The range repr. the occurrence of
λcrit = 2.5 per 106
hrs different types of fires (different locations)
Failure Rate Assessment Failure rate estimate is based on OREDA Phase III, ref. /6/. The overall coverage given above is estimated as the average for both failure modes based on OREDA Phase III.
TIF-probability Assessment The TIF-probability is entirely based on expert judgement. Comments The following aspect should be assessed when determining values for calculation: Heat detectors should not be the only means of fire detection in an area. There are, however, a few exceptions to this rule, e.g. workshops, where any other method may cause a number of false alarms.
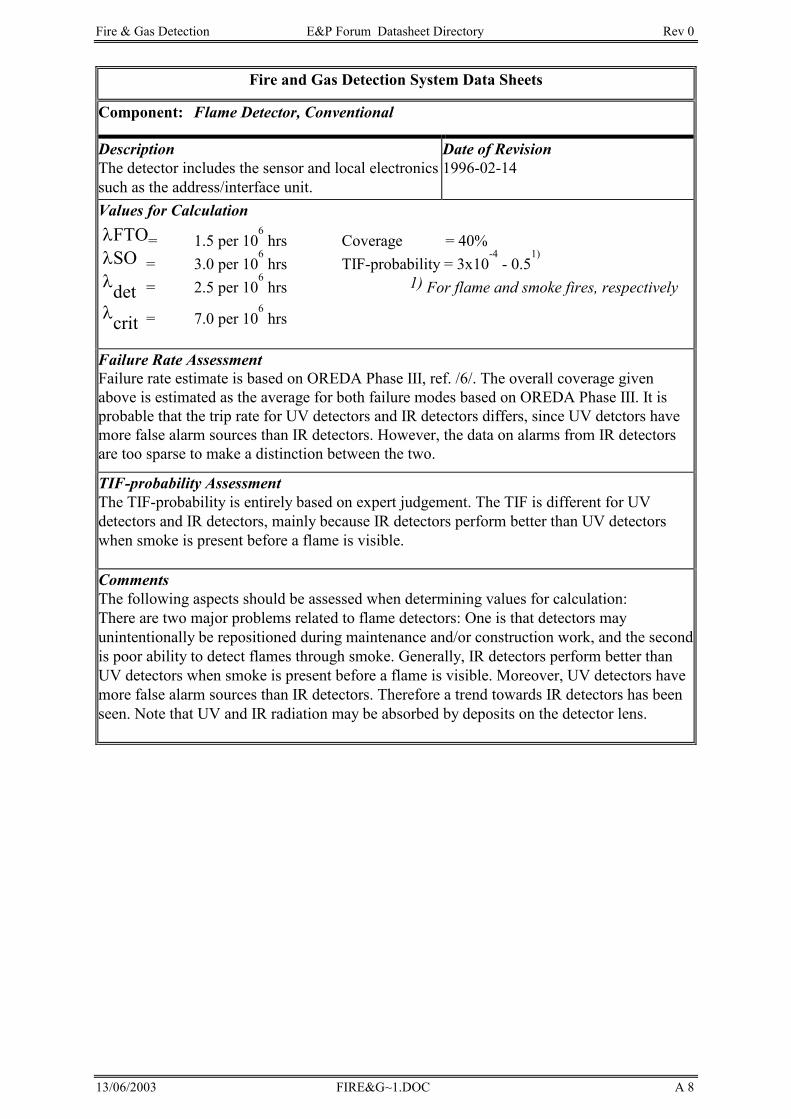
Fire & Gas Detection E&P Forum Datasheet Directory Rev 0
13/06/2003 FIRE&G~1.DOC A 8
Fire and Gas Detection System Data Sheets
Component: Flame Detector, Conventional
DescriptionThe detector includes the sensor and local electronics such as the address/interface unit.
Date of Revision1996-02-14
Values for Calculation λFTO= 1.5 per 10
6hrs Coverage = 40%
λSO = 3.0 per 106
hrs TIF-probability = 3x10⁻⁴
- 0.51)
λdet = 2.5 per 106
hrs 1) For flame and smoke fires, respectively λcrit = 7.0 per 10
6hrs
Failure Rate Assessment Failure rate estimate is based on OREDA Phase III, ref. /6/. The overall coverage given above is estimated as the average for both failure modes based on OREDA Phase III. It is probable that the trip rate for UV detectors and IR detectors differs, since UV detctors have more false alarm sources than IR detectors. However, the data on alarms from IR detectors are too sparse to make a distinction between the two.
TIF-probability Assessment The TIF-probability is entirely based on expert judgement. The TIF is different for UV detectors and IR detectors, mainly because IR detectors perform better than UV detectors when smoke is present before a flame is visible. Comments The following aspects should be assessed when determining values for calculation: There are two major problems related to flame detectors: One is that detectors may unintentionally be repositioned during maintenance and/or construction work, and the second is poor ability to detect flames through smoke. Generally, IR detectors perform better than UV detectors when smoke is present before a flame is visible. Moreover, UV detectors have more false alarm sources than IR detectors. Therefore a trend towards IR detectors has been seen. Note that UV and IR radiation may be absorbed by deposits on the detector lens.
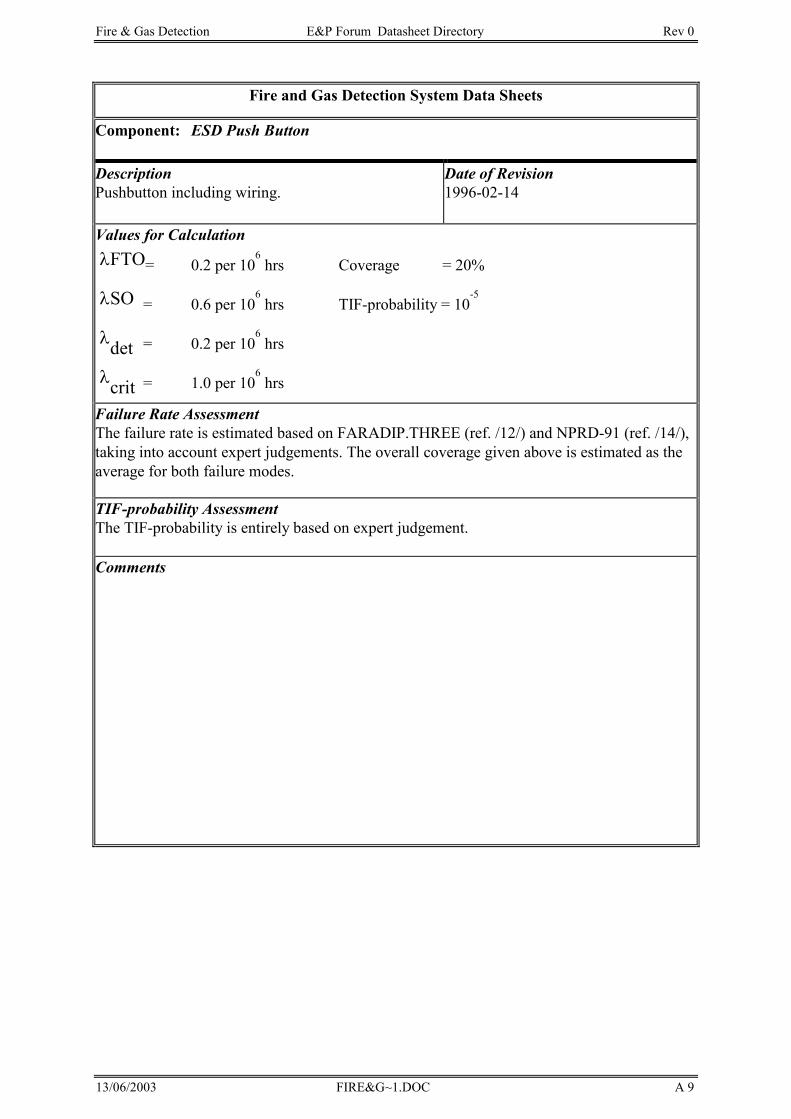
Fire & Gas Detection E&P Forum Datasheet Directory Rev 0
13/06/2003 FIRE&G~1.DOC A 9
Fire and Gas Detection System Data Sheets
Component: ESD Push Button
DescriptionPushbutton including wiring.
Date of Revision1996-02-14
Values for Calculation λFTO= 0.2 per 10
6hrs Coverage = 20%
λSO = 0.6 per 106
hrs TIF-probability = 10-5
λdet = 0.2 per 106
hrs
λcrit = 1.0 per 106
hrs
Failure Rate Assessment The failure rate is estimated based on FARADIP.THREE (ref. /12/) and NPRD-91 (ref. /14/), taking into account expert judgements. The overall coverage given above is estimated as the average for both failure modes.
TIF-probability Assessment The TIF-probability is entirely based on expert judgement. Comments
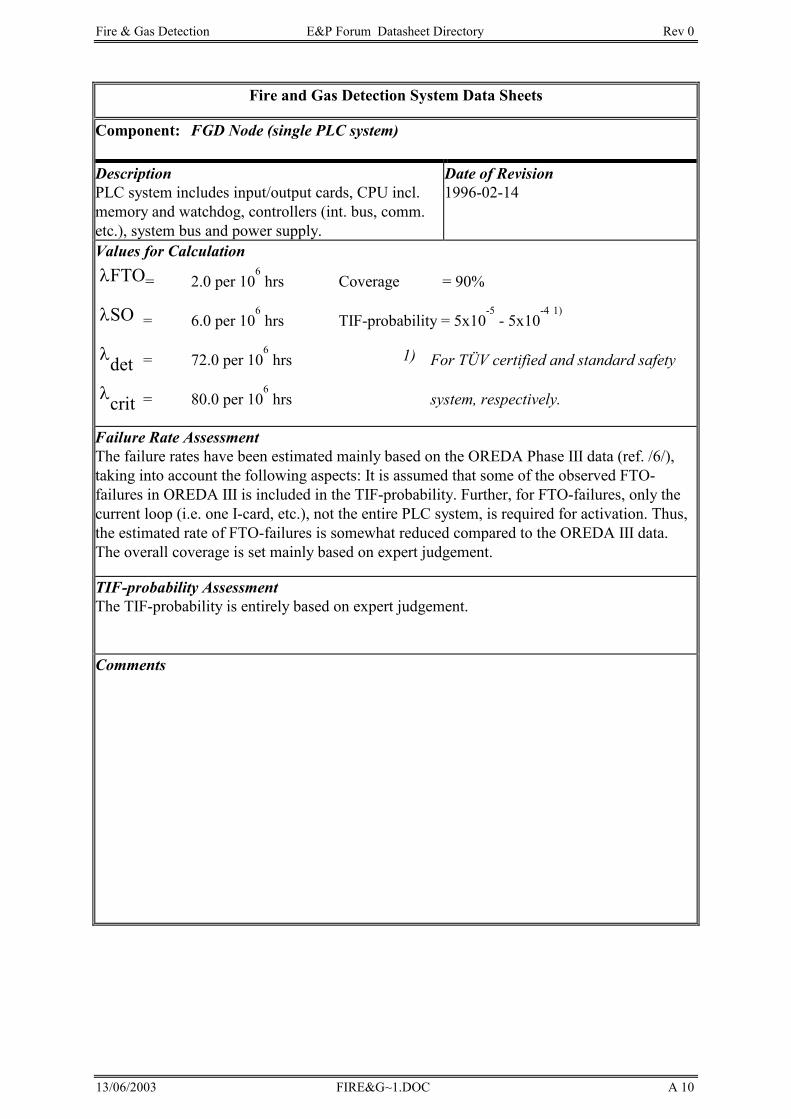
Fire & Gas Detection E&P Forum Datasheet Directory Rev 0
13/06/2003 FIRE&G~1.DOC A 10
Fire and Gas Detection System Data Sheets
Component: FGD Node (single PLC system)
DescriptionPLC system includes input/output cards, CPU incl. memory and watchdog, controllers (int. bus, comm. etc.), system bus and power supply.
Date of Revision 1996-02-14
Values for Calculation λFTO= 2.0 per 10
6hrs Coverage = 90%
λSO = 6.0 per 106
hrs TIF-probability = 5x10⁻⁵
- 5x10⁻⁴
1)
λdet = 72.0 per 106
hrs 1) For TÜV certified and standard safety λcrit = 80.0 per 10
6hrs system, respectively.
Failure Rate Assessment The failure rates have been estimated mainly based on the OREDA Phase III data (ref. /6/), taking into account the following aspects: It is assumed that some of the observed FTO-failures in OREDA III is included in the TIF-probability. Further, for FTO-failures, only the current loop (i.e. one I-card, etc.), not the entire PLC system, is required for activation. Thus, the estimated rate of FTO-failures is somewhat reduced compared to the OREDA III data. The overall coverage is set mainly based on expert judgement.
TIF-probability Assessment The TIF-probability is entirely based on expert judgement.
Comments
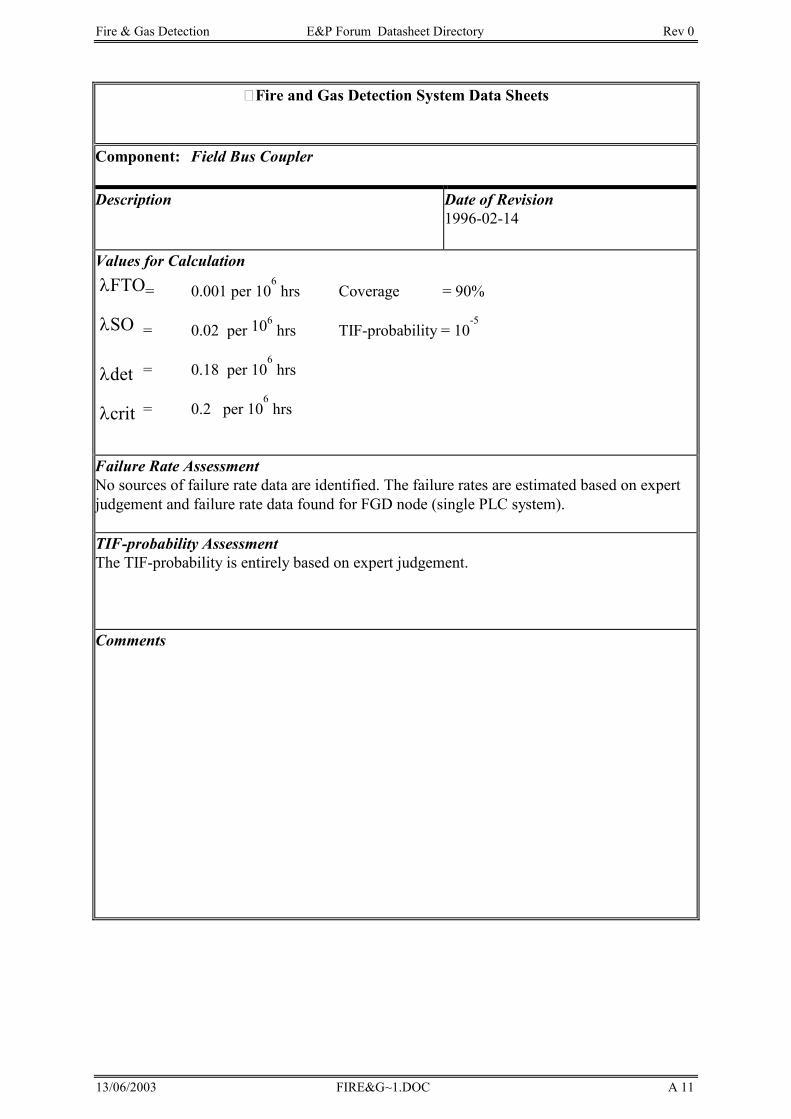
Fire & Gas Detection E&P Forum Datasheet Directory Rev 0
13/06/2003 FIRE&G~1.DOC A 11
�Fire and Gas Detection System Data Sheets
Component: Field Bus Coupler
Description Date of Revision1996-02-14
Values for Calculation λFTO= 0.001 per 10
6hrs Coverage = 90%
λSO = 0.02 per 106hrs TIF-probability = 10
-5
λdet = 0.18 per 106
hrs
λcrit = 0.2 per 106
hrs
Failure Rate Assessment No sources of failure rate data are identified. The failure rates are estimated based on expert judgement and failure rate data found for FGD node (single PLC system).
TIF-probability Assessment The TIF-probability is entirely based on expert judgement.
Comments
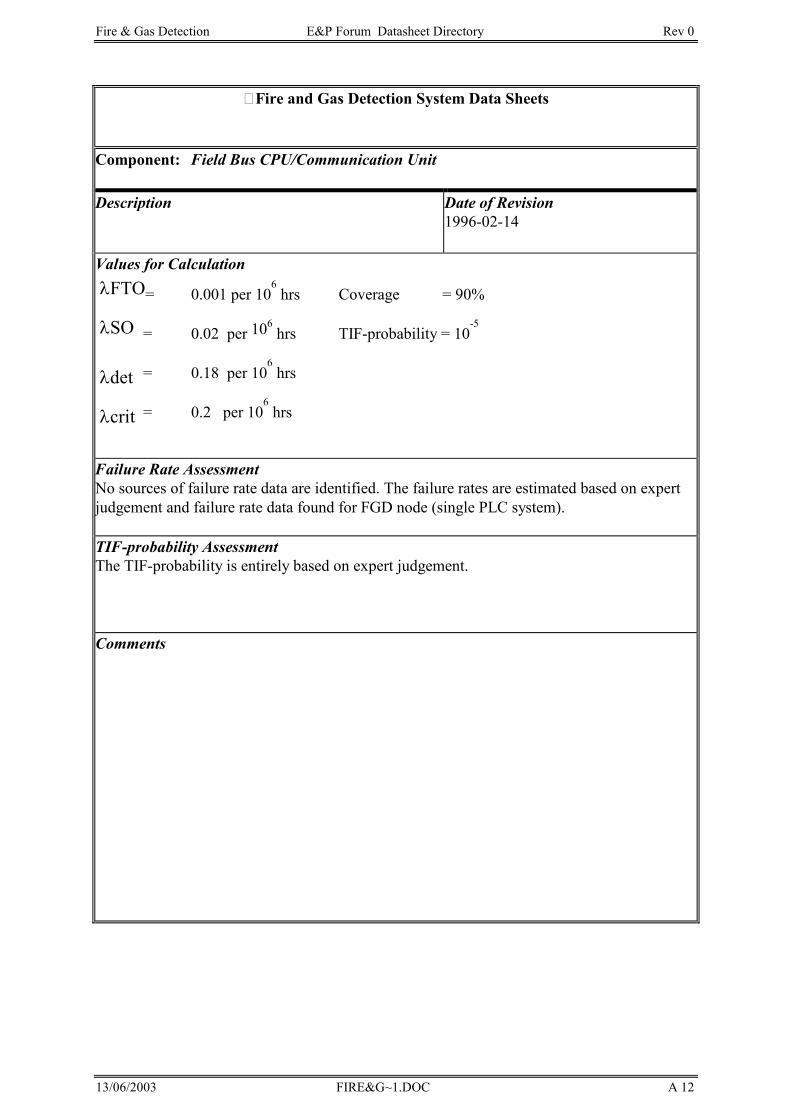
Fire & Gas Detection E&P Forum Datasheet Directory Rev 0
13/06/2003 FIRE&G~1.DOC A 12
�Fire and Gas Detection System Data Sheets
Component: Field Bus CPU/Communication Unit
Description Date of Revision1996-02-14
Values for Calculation λFTO= 0.001 per 10
6hrs Coverage = 90%
λSO = 0.02 per 106hrs TIF-probability = 10
-5
λdet = 0.18 per 106
hrs
λcrit = 0.2 per 106
hrs
Failure Rate Assessment No sources of failure rate data are identified. The failure rates are estimated based on expert judgement and failure rate data found for FGD node (single PLC system). TIF-probability Assessment The TIF-probability is entirely based on expert judgement.
Comments

Fire & Gas Detection E&P Forum Datasheet Directory Rev 0
13/06/2003 FIRE&G~1.DOC A 1
ESD and Blowdown E&P Forum QRA Directory Rev 0
13/06/2003 ESDBLOWD.DOC Page 1
ESD AND BLOWDOWN SYSTEMS
ESD and Blowdown E&P Forum QRA Directory Rev 0
13/06/2003 ESDBLOWD.DOC Page 2
TABLE OF CONTENTS
1. INTRODUCTION-------------------------------------------------------------------------------------3
1.1 Background -------------------------------------------------------------------------------------------------------------3
1.2 Reliability Analysis ---------------------------------------------------------------------------------------------------4
2. CONTROL AND SHUTDOWN SYSTEMS ---------------------------------------------------6
3. RISER ESD VALVE---------------------------------------------------------------------------------8
3.1 Reliability ---------------------------------------------------------------------------------------------------------------8
3.2 Vulnerability to Damage ------------------------------------------------------------------------------------------- 11
3.3 Speed of Response --------------------------------------------------------------------------------------------------- 11
4. SUBSEA ISOLATION VALVE ----------------------------------------------------------------- 12
4.1 Reliability ------------------------------------------------------------------------------------------------------------- 12
4.2 Vulnerability to Damage ------------------------------------------------------------------------------------------- 12
4.3 Speed of Response --------------------------------------------------------------------------------------------------- 12
5. TOPSIDES EMERGENCY SHUTDOWN (ESD) AND BLOWDOWN (BD) VALVES ------------------------------------------------------------------------------------------------- 13
5.1 Reliability ------------------------------------------------------------------------------------------------------------- 13
5.2 Vulnerability to Damage ------------------------------------------------------------------------------------------- 13
5.3 Speed of Response --------------------------------------------------------------------------------------------------- 13
6. SURFACE CONTROLLED SUBSURFACE SAFETY VALVES (SCSSV) --------- 14
6.1 Reliability ------------------------------------------------------------------------------------------------------------- 14
REFERENCES----------------------------------------------------------------------------------------- 15
Attachment 1 Handbooks 2 Databases 3 Textbooks
ESD and Blowdown E&P Forum QRA Directory Rev 0
13/06/2003 ESDBLOWD.DOC Page 3
ESD AND BLOWDOWN
1. INTRODUCTION
1.1 Background The Emergency Shutdown (ESD) and Blowdown (BD) systems on a hydrocarbon production facility provide a means for isolating and safely disposing of process inventories. These actions may be initiated as a precautionary or preventive measure, or in response to a hazardous situation. The latter would typically be a hydrocarbon release that has either been detected by plant personnel or a fire and gas detection system. Closure of ESD valves and opening blowdown valves limits the hydrocarbon inventory available to feed a hazardous release. This reduces to some extent the: • likelihood of ignition; • the severity of a fire if the release is ignited; • likelihood of catastrophic failure of plant. The effectiveness, or the performance, of these systems is defined by a number of factors: • Reliability • Vulnerability • Speed of response For an existing design these factors can be estimated and used as input for a QRA. For a new design a QRA might be carried out to determine what standard of performance is required by these valves in order to meet some higher level goals. An integrated approach to the management of hazards tends to go against the grain of the traditional prescriptive specification of shutdown systems. The draft IEC SC65A WG10 standard [4] and the draft prevention of Fire and Explosion and Emergency Response Regulations (UK) [5] together with a number of international and national standards are starting to promote a clear link between overall risk levels as predicted by QRA and the reliability required of safety systems. The required performance of these systems may vary between facilities and between different valves on the same facility. For example a very high performance may be required of the riser ESD valve due to the large inventory of hydrocarbons in the connecting pipelines. In some circumstances a subsea isolation valve may be installed to back-up the riser ESDV and provide a means of isolating the riser itself. This data sheet provides information on control and shutdown systems including three specific valve duties: • Riser ESD Valve • Subsea Isolation Valve • Process ESD and BD valves.
ESD and Blowdown E&P Forum QRA Directory Rev 0
13/06/2003 ESDBLOWD.DOC Page 4
Illustrative data are provided and the effectiveness, or performance, of these systems is discussed relative to reliability, vulnerability to damage and speed of response. This datasheet also includes in Attachment I a list of data sources where additional data on these systems can be found. The list also applies to data sources for general reliability studies on other components.
1.2 Reliability Analysis The best way to obtain reliability data is through statistical analysis of historical failure data (eg. from maintenance records) from the plant or process. However, the main difficulty is that such data may not be readily available, or may provide too small a sample to be statistically valid. If this is the case then generic data from published sources or databanks will have to be used. It is important to note that such data needs to be interpreted with care. The figures quoted are often aggregated averages of many failure modes; and the environmental conditions under which the data was collected may be different to the problem in hand. Another point to note is that the quality of the data varies from source to source and not all sources give specific failure modes and confidence bounds. Commonly used terms in Reliability Analysis are: Failure Rate - The ratio of the number of failures divided by the product of the item population and the average operating or calendar time. Failure rates may be quoted in failures per hour, failures per million hours or failures per year. ‘Operating time’ is the time in which the item is in its working state. ‘Calendar time’ generally represents the time interval between the start and the end of item monitoring period. Some sources give both failure rates for operating time and for calendar time. In this case, it is generally best to use the operating time failure rate if the component to be assessed will be operating continuously. If operation is intermittent, as with ESD and blowdown systems, the failure rate for calendar time may be more appropriate. Test Interval - the time between tests that will reveal a specified failure. Failure on demand - The probability that a given item will not perform the required function when called upon to do so. This quantity is dimensionless, unlike the failure rate which has dimensions of the number of events per unit time. It is important to distinguish between failure rates and failure on demand probability. The first is essentially the average number of failures over a period of time; the latter the probability of a specific failure event To a first approximation the probability of ‘failure on demand’ can be related to the ‘failure rate’ as follows: “failure on demand” = “failure rate” x “test interval”
2
For components which exhibit unrevealed failure states (e.g. pressure safety valves), the above equation determines the Fractional Dead Time (FDT).
ESD and Blowdown E&P Forum QRA Directory Rev 0
13/06/2003 ESDBLOWD.DOC Page 5
Failure modes - The description of the failed state of an item.
The definition of failure must be related to the task which the component is expected to perform. In some cases, only total failure of a component will be of interest. In other cases, degraded performance will need to be counted as a failure. The percentage of failures which has occurred in a specific failure mode is usually given. The failure rate for a given mode can then be calculated from the total failure rate multiplied by the failure mode percentage. Mean time between failures - MTBF is defined as the total measured operating time of a population of items divided by the total number of failures. The MTBF is the reciprocal of the failure rate. Common cause failure mode - when a system being analysed is made up of two or more components it is important to identify any common causes that could give failure in more than one component. If this is not done then the calculations could significantly over-state the reliability of the system. Some practical advice on the interrogation of databases is as follows: a) Care should be taken to use data of appropriate format (eg. do not confuse ‘failure on
demand’ with ‘failure rates’).
b) Failure data derived for continuously operating components should not be used for stand-by components if there are indications that conditions in the quiescent state are significantly different from those in the working state.
c) The data used should be derived from items operating under similar conditions whenever possible.
d) When only data derived from conditions different from those of the case studied are available, adjustments (stress factors) should be made to account for such differences.
e) The sources of the data used should be traceable. They should be quoted in the document containing the qualitative analysis.
f) The data used should be summarised in a table and their format clearly defined.
g) The choice of a value within a given range should be justified with qualitative arguments.
h) It is advisable to perform a sensitivity analysis to identify most significant components.
The potential for human error is present in all engineering systems, be it in the design, construction or operation phase. Therefore, human error needs to be considered when carrying out a quantitative reliability analysis. However, many data sources will have human error included as an implicit part of the causes of failure. If human error appears to form a significant component of the anlaysis, it should be assessed in more detail.
ESD and Blowdown E&P Forum QRA Directory Rev 0
13/06/2003 ESDBLOWD.DOC Page 6
The quantitative assessment of the likelihood of human error must be treated differently from that of a hardware and is a specialised field in its own right. 2. CONTROL AND SHUTDOWN SYSTEMS A list of data sources for control and shutdown system equipment failures is given in Attachment I. The main sources are handbooks and databanks. A key data source in the offshore hydrocarbon production industry is the "OREDA Handbook" [6]. A 2nd Edition of this handbook following Phases I and II of the OREDA project was published in 1992 and represents collated data of several oil companies operating in the Norwegian and UK sector of the North Sea as well as the Adriatic. Data collation is ongoing in Phase III of the project. This latest data can be accessed via the computerised database, [Offshore Reliability Data (OREDA); Joint Industry Project; AGIP, BP, Elf, Exxon, Norsk Hydro, PPCoN, Saga, Shell, Statoil, Total, SINTEF]. Two commonly used data sources used in conjunction with OREDA when addressing ESD/BD system reliability are: • "IEE Guide to the Collection and Presentation of Electrical, Electronic and Sensing
Component Reliability Data for Nuclear Power Generating Stations" issued by the Institute of Electrical and Electronic Engineers Inc [7];
• Non-Operating Reliability Databook issued by Reliability Analysis Centre [8]. Another prime data source is in-house records, which in some cases might be available for the specific system being analysed. For illustrative purposes, failure rates for common items in control and shutdown systems are given in Table 2.1.
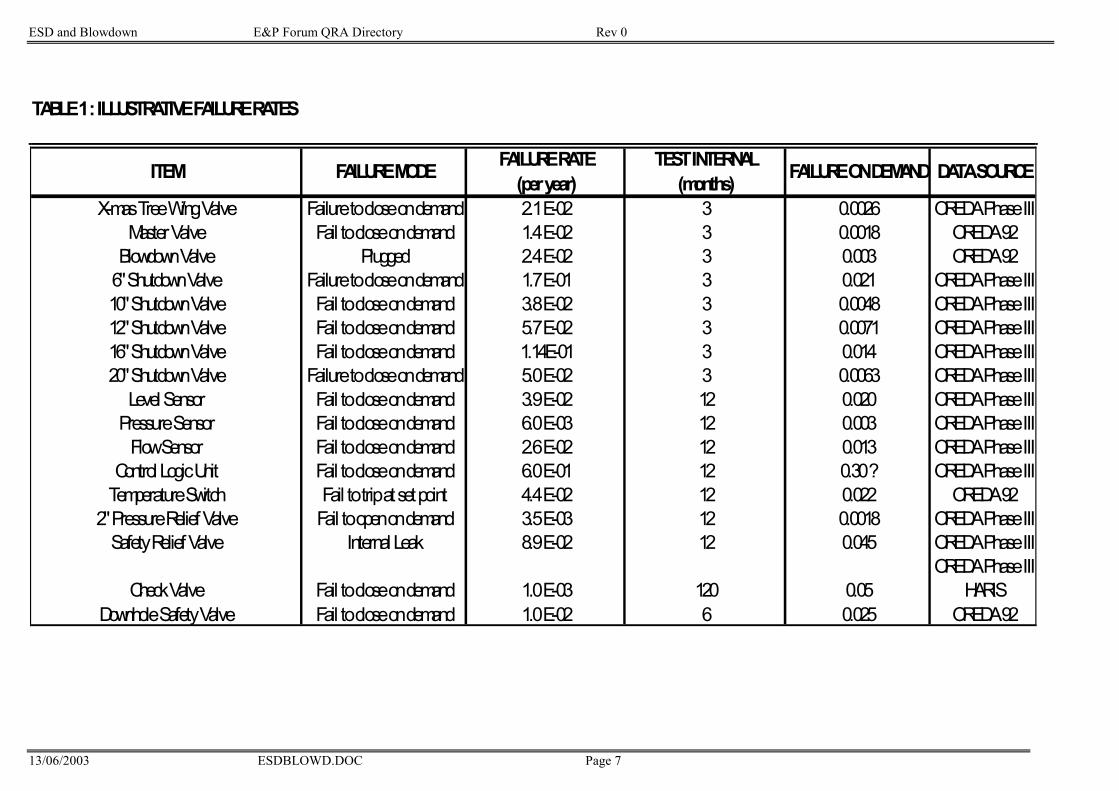
ESD and Blowdown E&P Forum QRA Directory Rev 0
13/06/2003 ESDBLOWD.DOC Page 7
TABLE1:ILLUSTRATIVEFAILURERATES
ITEM FAILUREMODE FAILURERATE(peryear)
TESTINTERNAL(months) FAILUREONDEMAND DATASOURCE
X-masTreeWingValve Failuretocloseondemand 2.1E-02 3 0.0026 OREDAPhaseIIIMasterValve Fail tocloseondemand 1.4E-02 3 0.0018 OREDA92
BlowdownValve Plugged 2.4E-02 3 0.003 OREDA926"ShutdownValve Failuretocloseondemand 1.7E-01 3 0.021 OREDAPhaseIII10"ShutdownValve Fail tocloseondemand 3.8E-02 3 0.0048 OREDAPhaseIII12"ShutdownValve Fail tocloseondemand 5.7E-02 3 0.0071 OREDAPhaseIII16"ShutdownValve Fail tocloseondemand 1.14E-01 3 0.014 OREDAPhaseIII20"ShutdownValve Failuretocloseondemand 5.0E-02 3 0.0063 OREDAPhaseIII
LevelSensor Fail tocloseondemand 3.9E-02 12 0.020 OREDAPhaseIIIPressureSensor Fail tocloseondemand 6.0E-03 12 0.003 OREDAPhaseIII
FlowSensor Fail tocloseondemand 2.6E-02 12 0.013 OREDAPhaseIIIControlLogicUnit Fail tocloseondemand 6.0E-01 12 0.30? OREDAPhaseIII
TemperatureSwitch Fail totripatsetpoint 4.4E-02 12 0.022 OREDA922"PressureReliefValve Fail toopenondemand 3.5E-03 12 0.0018 OREDAPhaseIII
SafetyReliefValve InternalLeak 8.9E-02 12 0.045 OREDAPhaseIIIOREDAPhaseIII
CheckValve Fail tocloseondemand 1.0E-03 120 0.05 HARISDownholeSafetyValve Fail tocloseondemand 1.0E-02 6 0.025 OREDA92
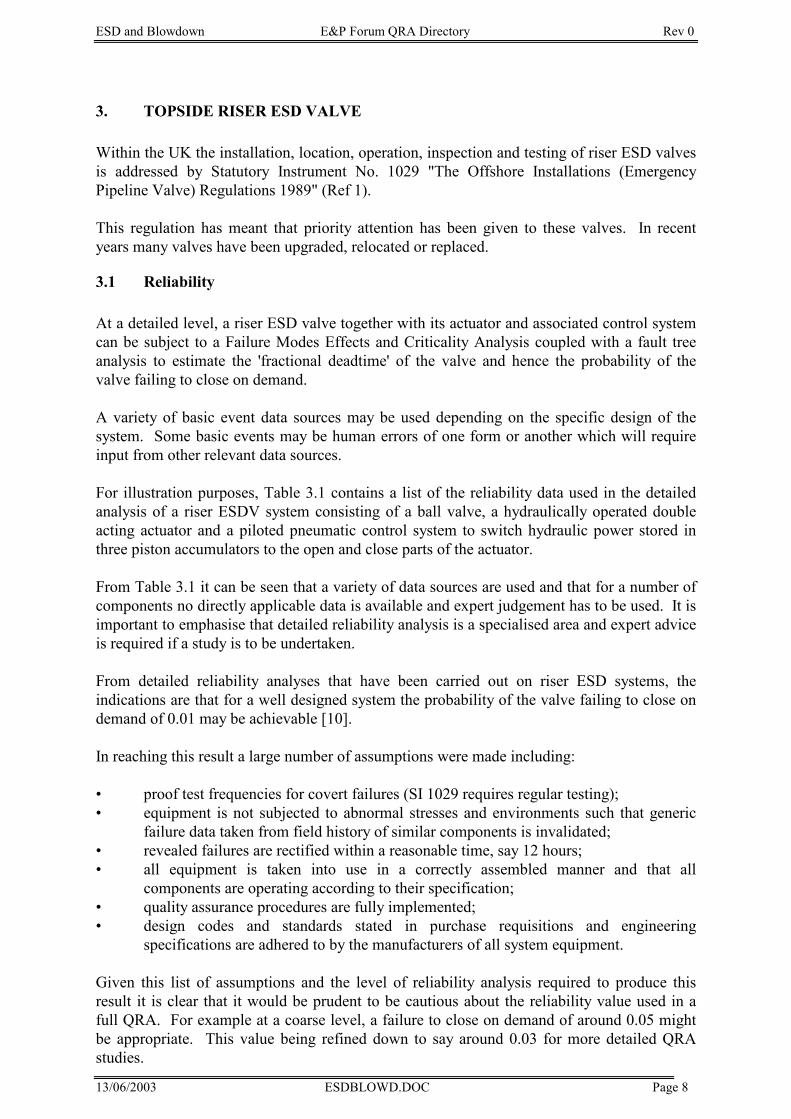
ESD and Blowdown E&P Forum QRA Directory Rev 0
13/06/2003 ESDBLOWD.DOC Page 8
3. TOPSIDE RISER ESD VALVE Within the UK the installation, location, operation, inspection and testing of riser ESD valves is addressed by Statutory Instrument No. 1029 "The Offshore Installations (Emergency Pipeline Valve) Regulations 1989" (Ref 1). This regulation has meant that priority attention has been given to these valves. In recent years many valves have been upgraded, relocated or replaced.
3.1 Reliability At a detailed level, a riser ESD valve together with its actuator and associated control system can be subject to a Failure Modes Effects and Criticality Analysis coupled with a fault tree analysis to estimate the 'fractional deadtime' of the valve and hence the probability of the valve failing to close on demand. A variety of basic event data sources may be used depending on the specific design of the system. Some basic events may be human errors of one form or another which will require input from other relevant data sources. For illustration purposes, Table 3.1 contains a list of the reliability data used in the detailed analysis of a riser ESDV system consisting of a ball valve, a hydraulically operated double acting actuator and a piloted pneumatic control system to switch hydraulic power stored in three piston accumulators to the open and close parts of the actuator. From Table 3.1 it can be seen that a variety of data sources are used and that for a number of components no directly applicable data is available and expert judgement has to be used. It is important to emphasise that detailed reliability analysis is a specialised area and expert advice is required if a study is to be undertaken. From detailed reliability analyses that have been carried out on riser ESD systems, the indications are that for a well designed system the probability of the valve failing to close on demand of 0.01 may be achievable [10]. In reaching this result a large number of assumptions were made including: • proof test frequencies for covert failures (SI 1029 requires regular testing); • equipment is not subjected to abnormal stresses and environments such that generic
failure data taken from field history of similar components is invalidated; • revealed failures are rectified within a reasonable time, say 12 hours; • all equipment is taken into use in a correctly assembled manner and that all
components are operating according to their specification; • quality assurance procedures are fully implemented; • design codes and standards stated in purchase requisitions and engineering
specifications are adhered to by the manufacturers of all system equipment. Given this list of assumptions and the level of reliability analysis required to produce this result it is clear that it would be prudent to be cautious about the reliability value used in a full QRA. For example at a coarse level, a failure to close on demand of around 0.05 might be appropriate. This value being refined down to say around 0.03 for more detailed QRA studies.
ESD and Blowdown E&P Forum QRA Directory Rev 0
13/06/2003 ESDBLOWD.DOC Page 9
A reliability as good as a demand failure of 0.01 would probably need to be justified using a detailed reliability analysis. SI 1029 also requires riser ESD valves to be regularly leak tested. The maximum acceptable leak threshold should ensure that leakage of the valve after it has been closed is not a significant issue.
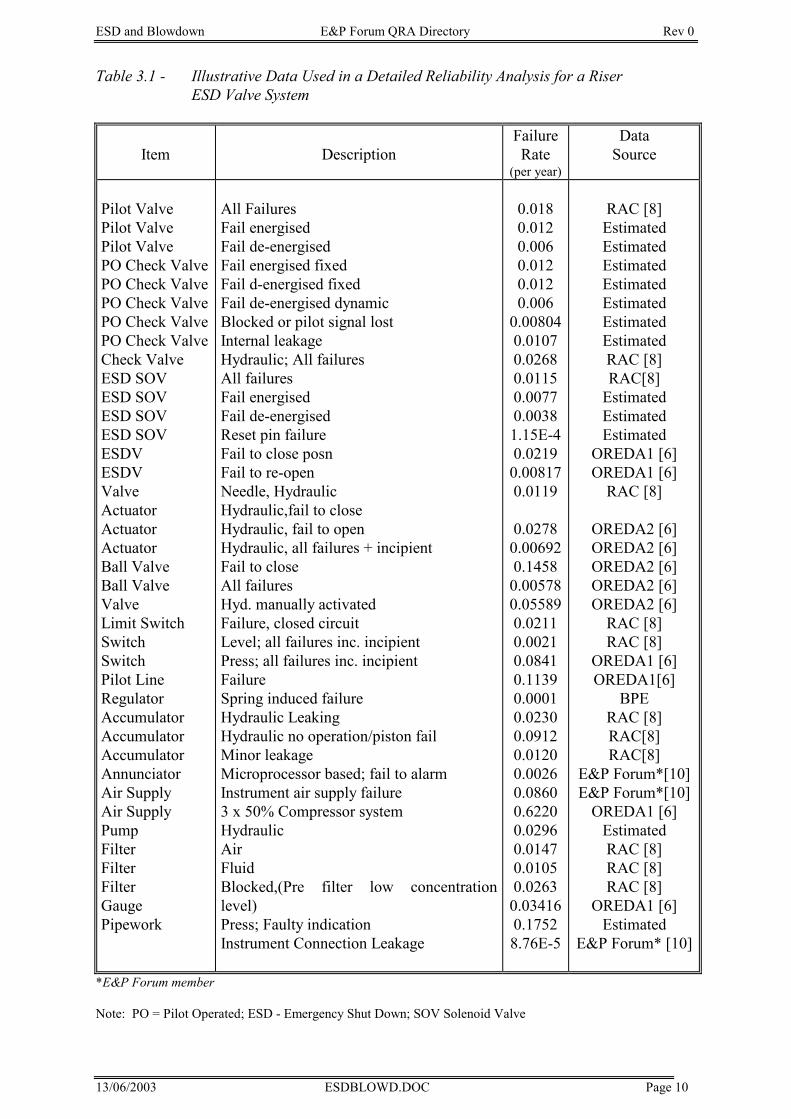
ESD and Blowdown E&P Forum QRA Directory Rev 0
13/06/2003 ESDBLOWD.DOC Page 10
Table 3.1 - Illustrative Data Used in a Detailed Reliability Analysis for a Riser ESD Valve System
Item
Description Failure Rate
(per year)
Data Source
Pilot Valve Pilot Valve Pilot Valve PO Check ValvePO Check ValvePO Check ValvePO Check ValvePO Check ValveCheck Valve ESD SOV ESD SOV ESD SOV ESD SOV ESDV ESDV Valve Actuator Actuator Actuator Ball Valve Ball Valve Valve Limit Switch Switch Switch Pilot Line Regulator Accumulator Accumulator Accumulator Annunciator Air Supply Air Supply Pump Filter Filter Filter Gauge Pipework
All Failures Fail energised Fail de-energised Fail energised fixed Fail d-energised fixed Fail de-energised dynamic Blocked or pilot signal lost Internal leakage Hydraulic; All failures All failures Fail energised Fail de-energised Reset pin failure Fail to close posn Fail to re-open Needle, Hydraulic Hydraulic,fail to close Hydraulic, fail to open Hydraulic, all failures + incipient Fail to close All failures Hyd. manually activated Failure, closed circuit Level; all failures inc. incipient Press; all failures inc. incipient Failure Spring induced failure Hydraulic Leaking Hydraulic no operation/piston fail Minor leakage Microprocessor based; fail to alarm Instrument air supply failure 3 x 50% Compressor system Hydraulic Air Fluid Blocked,(Pre filter low concentration level) Press; Faulty indication Instrument Connection Leakage
0.018 0.012 0.006 0.012 0.012 0.006
0.008040.0107 0.0268 0.0115 0.0077 0.0038 1.15E-4 0.0219 0.008170.0119
0.0278 0.006920.1458 0.005780.055890.0211 0.0021 0.0841 0.1139 0.0001 0.0230 0.0912 0.0120 0.0026 0.0860 0.6220 0.0296 0.0147 0.0105 0.0263 0.034160.1752 8.76E-5
RAC [8] Estimated Estimated Estimated Estimated Estimated Estimated Estimated RAC [8] RAC[8]
Estimated Estimated Estimated
OREDA1 [6] OREDA1 [6]
RAC [8]
OREDA2 [6] OREDA2 [6] OREDA2 [6] OREDA2 [6] OREDA2 [6]
RAC [8] RAC [8]
OREDA1 [6] OREDA1[6]
BPE RAC [8] RAC[8] RAC[8]
E&P Forum*[10] E&P Forum*[10]
OREDA1 [6] Estimated RAC [8] RAC [8] RAC [8]
OREDA1 [6] Estimated
E&P Forum* [10]
*E&P Forum member Note: PO = Pilot Operated; ESD - Emergency Shut Down; SOV Solenoid Valve
ESD and Blowdown E&P Forum QRA Directory Rev 0
13/06/2003 ESDBLOWD.DOC Page 11
Table 3.1 Notes: 1. Repair time for overt failures = 12 hours 2. Proof test frequencies for overt failures ESDV/Actuator full closure 6 monthly ESDV/Actuator part closure 6 monthly ESDV Control system 3 monthly Yellow Shutdowns 8 per year.
3.2 Vulnerability to Damage There are two types of damage that can occur: 1. The valve actuator or associated control system is damaged in such a way that the
valve fails to fully close in an emergency. 2. Once the valve is closed the valve is damaged in such a way that there is significant
internal leakage. The vulnerability to either type of damage is dependent on the specific design and protection of the valve, actuator and control system together with the specific hazards to which it might be exposed. A report providing an overview of the methods used by operators in the UK sector of the North Sea to protect ESVs from severe accident conditions is given in Ref. 2.
3.3 Speed of Response The speed of response is made up of a number of components: • detection time; • evaluation and decision to initiate time; • response time of the control system and valve. The two first components will depend largely on the degree of automation and the sequencing of ESD and BD actions. The third component will be driven largely by the size and type of valve and the size and type of the actuator. For liquid systems, surge consideration may also place limitations on the speed of closure. For an existing valve the time to close can be directly measured during proof testing. For a detailed design it should also be possible to make a reasonable estimate. A coarse rule of thumb is that it will take 1.5 seconds for every inch of pipeline diameter for a valve to close, e.g., a valve in a 10in line would take 15 seconds to close whilst a valve in a 36in line would take closer to one minute.
ESD and Blowdown E&P Forum QRA Directory Rev 0
13/06/2003 ESDBLOWD.DOC Page 12
4. SUBSEA ISOLATION VALVE
4.1 Reliability UKOOA/HSE sponsored a study on the reliability of subsea isolation systems (Ref. 3). This was an in-depth study and included actual experience with subsea isolation valves in the UK sector of the North Sea. For a single ball valve configuration the fractional deadtime was estimated at 1.2 x 10⁻² which means the probability of the valve failure to close on demand is 0.012 provided that the product of Hazard Rate x Fractional Deadtime is much less than 1. This ties in closely with the values quoted earlier for riser ESDVs. The control system, actuators and valves should also be fairly similar. As noted for the riser ESDVs, there are a large number of assumptions that need to be made in calculating these figures and consideration should be given to using slightly more conservative values. Leak testing of subsea isolation valves is more difficult than for riser ESDVs and hence over a period of time there is a possibility that there will be some degradation of sealing performance.
4.2 Vulnerability to Damage Unlike the riser ESDV a subsea isolation valve is not vulnerable to any topside accidents. The key concern is that the valve and associated actuator and control system is damaged by some form of impact, e.g., anchor, trawl net etc, causing it not to operate on demand.
4.3 Speed of Response Response time will be similar to riser ESDV though there may be a slight delay (e.g., a few seconds) in hydraulic control signals reaching the valve.
ESD and Blowdown E&P Forum QRA Directory Rev 0
13/06/2003 ESDBLOWD.DOC Page 13
5. TOPSIDES EMERGENCY SHUTDOWN (ESD) AND BLOWDOWN (BD) VALVES
5.1 Reliability OREDA is probably the best source of failure rate data on topsides emergency shutdown and blowdown valves. This data source can be used to estimate the reliability of valves of different size and service. An aggregate value across all sizes and service of hydraulically operated ESD valves is approximately 0.1 per year critical failures (fail to close or significant internal leakage when closed). Typically process ESDVs and their control system will be partially tested every three months and fully tested every six months. On this basis the probability of the valve failing to close on demand is again going to approach 0.01. Whilst there is not normally any form of internal leak testing for process ESD valves the reality will be that once blowdown has been initiated differential pressures across the ESD valves should not be particularly high. Again as with the riser ESDV and SSIV, if ESD or blowdown valve reliability is going to be included in a QRA it may be prudent to assume slightly more conservative values. For blowdown valves a lower failure rate is given in OREDA, but the population is very small. It may therefore be prudent to assume similar reliability as the ESDV.
5.2 Vulnerability to Damage Topside ESD valves and blowdown valves are subject to the same types of damage as described for riser ESD valve. However, unlike the riser ESD valve they are located in areas where they may be more vulnerable to damage and may have limited protection. A "fire-safe" valve is usually tested to API RP 6F. This confirms ability to reseal or stay tight after 15 or 30 minutes exposure to a pool fire. An ESDV may be required to withstand substantially longer exposure times or severities, or both. A detailed analysis should take these considerations into account.
5.3 Speed of Response As discussed previously, it is worth noting that in order to achieve a controlled shutdown and blowdown of the plant it is necessary to carefully sequence the closure and opening of various valves. The whole response may take a number of minutes. American Petroleum Institute RP521 para 3.16.1 recommends for the blowdown systems to reduce pressures to half the design pressure within 15 minutes.
ESD and Blowdown E&P Forum QRA Directory Rev 0
13/06/2003 ESDBLOWD.DOC Page 14
6. SURFACE CONTROLLED SUBSURFACE SAFETY VALVES (SCSSV)
6.1 Reliability The SCSSV is primarily a backup to the Xmas tree master valve. There are several situations which would prevent the SCSSV from acting as a safety barrier: 1. The valve is in a failed state, ie. it fails to close, it leaks when closed, or it fails to hold
in the nipple when closed. 2. The valve is removed because it has failed a test and is to be replaced. 3. The valve is removed because wireline work is going on beneath the valve. 4. Wireline operations are performed through the valve and the wire will prevent the
valve from closing properly. There are two fundamentally different types of SCSSV, a wireline retrievable valve and a tubing retrievable valve. In [9] SINTEF carried out a detailed reliability analysis of SCSSVs using data from 13 North Sea Fields. For the critical failures described in 1. above the estimated failure rates were: - Wireline Retrievable Valve 0.168 failures/year - Tubing Retrievable Valve 0.06 failures/year. It should be noted that these values are for the valves only and do not include the control systems. However, from the discussions on riser ESD valve reliability it is likely that the failure rate of the control systems will be significantly less than for the valve itself. The probability of failing to close on demand will be a function of the test interval. Assuming that each test includes fully closing the valve and carrying out a leak test the probability of critical failure is as follows: Type of Valves Test Interval
3 months 6 months 1 year
Wireline Retrievable Valve
0.021
0.042
0.084
Tubing Retrievable Valve
0.0075
0.015
0.03
It is assumed that the above failure probabilities do not include the likelihood of human error. As there is always a possibility that the valve may be left in a failed state following testing, it is important to ensure that these modes of failure are taken into account during any analysis. For failures described in 2-4, the unavailability of the SCSSV has to be looked at on a case by case basis.
ESD and Blowdown E&P Forum QRA Directory Rev 0
13/06/2003 ESDBLOWD.DOC Page 15
REFERENCES
1. Statutory Instrument 1989 No. 1029, The Offshore Installations (Emergency Pipeline Valve) Regulations 1989, HMSO (UK), June 1989.
2. Topside Emergency Shutdown Valve (ESV) Survivability, A Joint HSE-
OSD/UKOOA study in response to Cullen Recommendation 48, RABA/16405206/94/ISSUE 1, January 1994.
3. Subsea Isolation System Reliability and Cost Study, A joint HSE-OSD/UKOOA study
in response to Cullen Recommendation 46ii, April 1994. 4. International Electrotechnical Commission Standards Committee 65A Working Group
10, draft standard: Functional Safety, Part 2, Safety Related Systems, 1994. 5. The Offshore Installations (Prevention of Fire and Explosion and Emergency
Response) Regulations 199 , draft Regulations and Guidance, August 1994. 6. "Offshore Reliability Data Handbook", OREDA Steering Committee, PO Box 300, N-
1322, Hovik, Norway. 7. IEE Standard - 500 - 1984 "IEEE Guide to the Collection and Presentation of
Electrical, Electronic and Sensing Component Reliability Data for Nuclear Power Generating Stations", Wiley 1983, ISBN 0471807850.
8. "Non-operating Reliability Databook", Reliability Analysis Centre, PO Box 4700,
Rome, NY, 13440-8200 USA. 9. "Reliability of Surface Controlled Subsurface Safety Valves", SINTEF, 21/2/1983,
STF18 A83002. 10. E&P Forum members
ESD and Blowdown E&P Forum QRA Directory Rev 0
13/06/2003 ESDBLOWD.DOC Page 16
Attachment 1
1. HANDBOOKS 1.1 Overview
A limited number of unrestricted data handbooks are available which provide specific information in a structured format on failure rate, failure on demand rate, failure mode, etc. These handbooks form a good ready reference for the data required for a preliminary reliability study. The data is presented in a format suitable for direct use without any need for manipulation. Information is usually well indexed, allowing easy access to the specific data required. An important feature incorporated in most handbooks is the reference source from which the data were obtained. Brief details of the main handbooks are presented in Section 1.4 of this attachment. Keywords are provided to assist in identifying the most relevant handbook for a particular application. Details of the keywords are in Section 1.2 below. The handbooks listed in Section 1.4 comprise: a) Publications containing mainly generic data on components of diverse nature
(electrical, electronic, mechanical items). b) Publications giving data on a specific class of components (eg. electronic circuits
only). c) Textbooks which treat reliability techniques and which also contain a substantial
amount of data. d) Reports with sections containing a substantial amount of data.
1.2 Keywords
The content of data sources is described using the keywords shown in Table 1. The keywords are divided into several groups. The first group describes the item type and comprises the following keywords: a) Electrical - This describes all items powered by electricity and ranges from simple
switches and electrical motors to more complex systems such as electrical power systems or generators.
b) Electronic - This keyword also covers a wide range of items. It applies to computer or microprocessor systems, and most instrumentation (see below).
c) Mechanical - This keyword covers all equipment whose operation is based on mechanical and hydraulic principles. The items to which the keyword is applied range from relatively simple instrumentation (see below) such as pressure gauges to complex handling systems such as lifts or cranes. Machine tools, pipelines, conveyor belts and excavators are all examples of items to which this keyword is applicable.
d) Instrumentation - This keyword was added because of the specific function that instrumentation has in control systems. It covers electronic, mechanical and electrical instrumentation and can be coupled with these keywords to reduce the field of search.
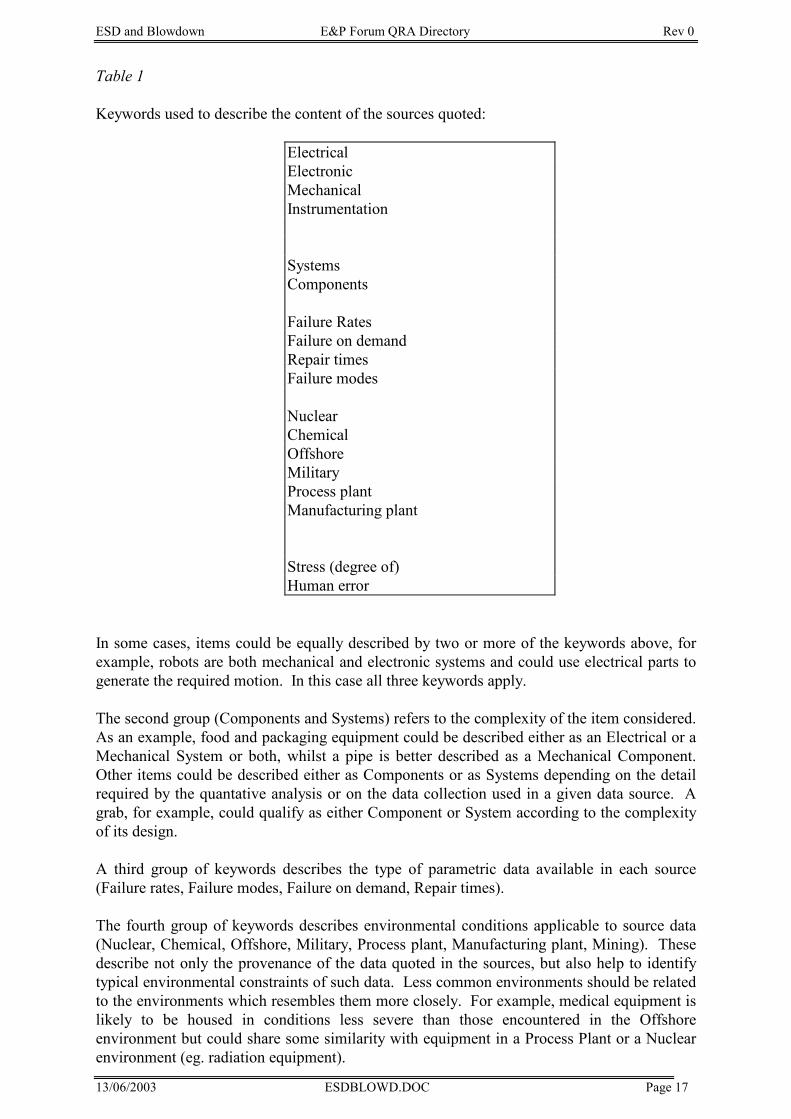
ESD and Blowdown E&P Forum QRA Directory Rev 0
13/06/2003 ESDBLOWD.DOC Page 17
Table 1 Keywords used to describe the content of the sources quoted:
Electrical Electronic Mechanical Instrumentation
Systems Components
Failure Rates Failure on demand Repair times Failure modes
Nuclear Chemical Offshore Military Process plant Manufacturing plant
Stress (degree of) Human error
In some cases, items could be equally described by two or more of the keywords above, for example, robots are both mechanical and electronic systems and could use electrical parts to generate the required motion. In this case all three keywords apply. The second group (Components and Systems) refers to the complexity of the item considered. As an example, food and packaging equipment could be described either as an Electrical or a Mechanical System or both, whilst a pipe is better described as a Mechanical Component. Other items could be described either as Components or as Systems depending on the detail required by the quantative analysis or on the data collection used in a given data source. A grab, for example, could qualify as either Component or System according to the complexity of its design. A third group of keywords describes the type of parametric data available in each source (Failure rates, Failure modes, Failure on demand, Repair times). The fourth group of keywords describes environmental conditions applicable to source data (Nuclear, Chemical, Offshore, Military, Process plant, Manufacturing plant, Mining). These describe not only the provenance of the data quoted in the sources, but also help to identify typical environmental constraints of such data. Less common environments should be related to the environments which resembles them more closely. For example, medical equipment is likely to be housed in conditions less severe than those encountered in the Offshore environment but could share some similarity with equipment in a Process Plant or a Nuclear environment (eg. radiation equipment).
ESD and Blowdown E&P Forum QRA Directory Rev 0
13/06/2003 ESDBLOWD.DOC Page 18
The keyword Stress (Degree of) refers to specific or generic operating conditions of the item; data-sources containing k-factors (see example below) are identified by this keyword. Finally, the keyword Human error indicates sources which can be used for human reliability assessment. An index listing the data sources to which each keyword is applicable is provided in Section 4 at the end of this document. 1.3 Example - How to use the keywords for a data search
The failure rate of a pressure transducer in a Process plant is required. The appropriate keywords are: 1. Electronic; 2. Instrumentation; 3. Failure rate; 4. Component; 5. Process plant. A quick scan of the indices reveals that most data sources contain items described by keywords 1 to 4. No handbook includes keyword 5. In this case, it is also appropriate to select handbooks which contain stress factors (keyword: Stress (degree of)) so that the Process environment can be taken into account applying stress factors to generic failure rates. The following handbooks include the keyword: Stress (degree of ): - HD1 : Electronic Reliability Data - IEE INSPEC; - HD6 : MOD 0041 Part 3; - HD9 : Mechanical Design System Handbook, K A Rothbart; - HD15: Reliability Technology, Green & Bourne. The following data banks also include 'Process plant' in their keywords: - DB1 : The SRD Reliability data bank; - DBS : The HARIS data bank.
1.4 List of handbooks The following list includes handbooks available in the UK. Most handbooks can be ordered from publishing houses; the list quotes the original publisher whenever possible.
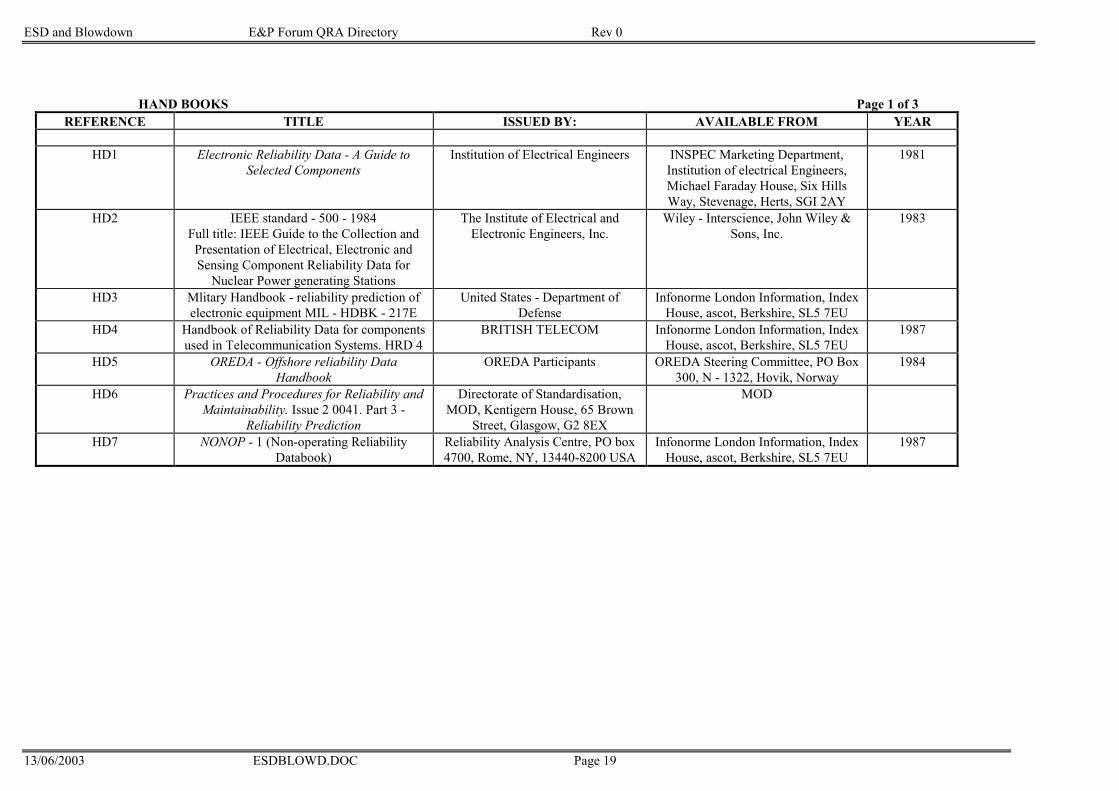
ESD and Blowdown E&P Forum QRA Directory Rev 0
13/06/2003 ESDBLOWD.DOC Page 19
HAND BOOKS Page 1 of 3REFERENCE TITLE ISSUED BY: AVAILABLE FROM YEAR
HD1 Electronic Reliability Data - A Guide toSelected Components
Institution of Electrical Engineers INSPEC Marketing Department,Institution of electrical Engineers,Michael Faraday House, Six HillsWay, Stevenage, Herts, SGI 2AY
1981
HD2 IEEE standard - 500 - 1984Full title: IEEE Guide to the Collection andPresentation of Electrical, Electronic andSensing Component Reliability Data for
Nuclear Power generating Stations
The Institute of Electrical andElectronic Engineers, Inc.
Wiley - Interscience, John Wiley &Sons, Inc.
1983
HD3 Mlitary Handbook - reliability prediction ofelectronic equipment MIL - HDBK - 217E
United States - Department ofDefense
Infonorme London Information, IndexHouse, ascot, Berkshire, SL5 7EU
HD4 Handbook of Reliability Data for componentsused in Telecommunication Systems. HRD 4
BRITISH TELECOM Infonorme London Information, IndexHouse, ascot, Berkshire, SL5 7EU
1987
HD5 OREDA - Offshore reliability DataHandbook
OREDA Participants OREDA Steering Committee, PO Box300, N - 1322, Hovik, Norway
1984
HD6 Practices and Procedures for Reliability andMaintainability. Issue 2 0041. Part 3 -
Reliability Prediction
Directorate of Standardisation,MOD, Kentigern House, 65 Brown
Street, Glasgow, G2 8EX
MOD
HD7 NONOP - 1 (Non-operating ReliabilityDatabook)
Reliability Analysis Centre, PO box4700, Rome, NY, 13440-8200 USA
Infonorme London Information, IndexHouse, ascot, Berkshire, SL5 7EU
1987
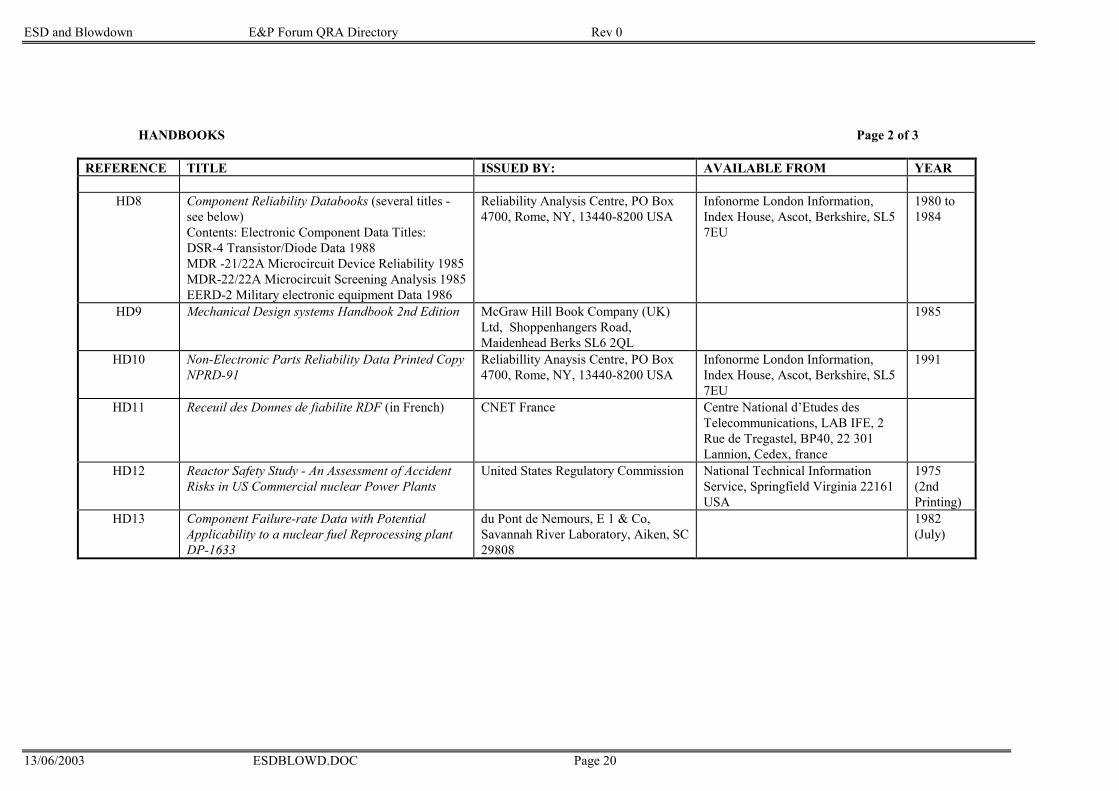
ESD and Blowdown E&P Forum QRA Directory Rev 0
13/06/2003 ESDBLOWD.DOC Page 20
HANDBOOKS Page 2 of 3
REFERENCE TITLE ISSUED BY: AVAILABLE FROM YEAR
HD8 Component Reliability Databooks (several titles -see below)Contents: Electronic Component Data Titles:DSR-4 Transistor/Diode Data 1988MDR -21/22A Microcircuit Device Reliability 1985MDR-22/22A Microcircuit Screening Analysis 1985EERD-2 Military electronic equipment Data 1986
Reliability Analysis Centre, PO Box4700, Rome, NY, 13440-8200 USA
Infonorme London Information,Index House, Ascot, Berkshire, SL57EU
1980 to1984
HD9 Mechanical Design systems Handbook 2nd Edition McGraw Hill Book Company (UK)Ltd, Shoppenhangers Road,Maidenhead Berks SL6 2QL
1985
HD10 Non-Electronic Parts Reliability Data Printed CopyNPRD-91
Reliabillity Anaysis Centre, PO Box4700, Rome, NY, 13440-8200 USA
Infonorme London Information,Index House, Ascot, Berkshire, SL57EU
1991
HD11 Receuil des Donnes de fiabilite RDF (in French) CNET France Centre National d’Etudes desTelecommunications, LAB IFE, 2Rue de Tregastel, BP40, 22 301Lannion, Cedex, france
HD12 Reactor Safety Study - An Assessment of AccidentRisks in US Commercial nuclear Power Plants
United States Regulatory Commission National Technical InformationService, Springfield Virginia 22161USA
1975(2ndPrinting)
HD13 Component Failure-rate Data with PotentialApplicability to a nuclear fuel Reprocessing plantDP-1633
du Pont de Nemours, E 1 & Co,Savannah River Laboratory, Aiken, SC29808
1982(July)
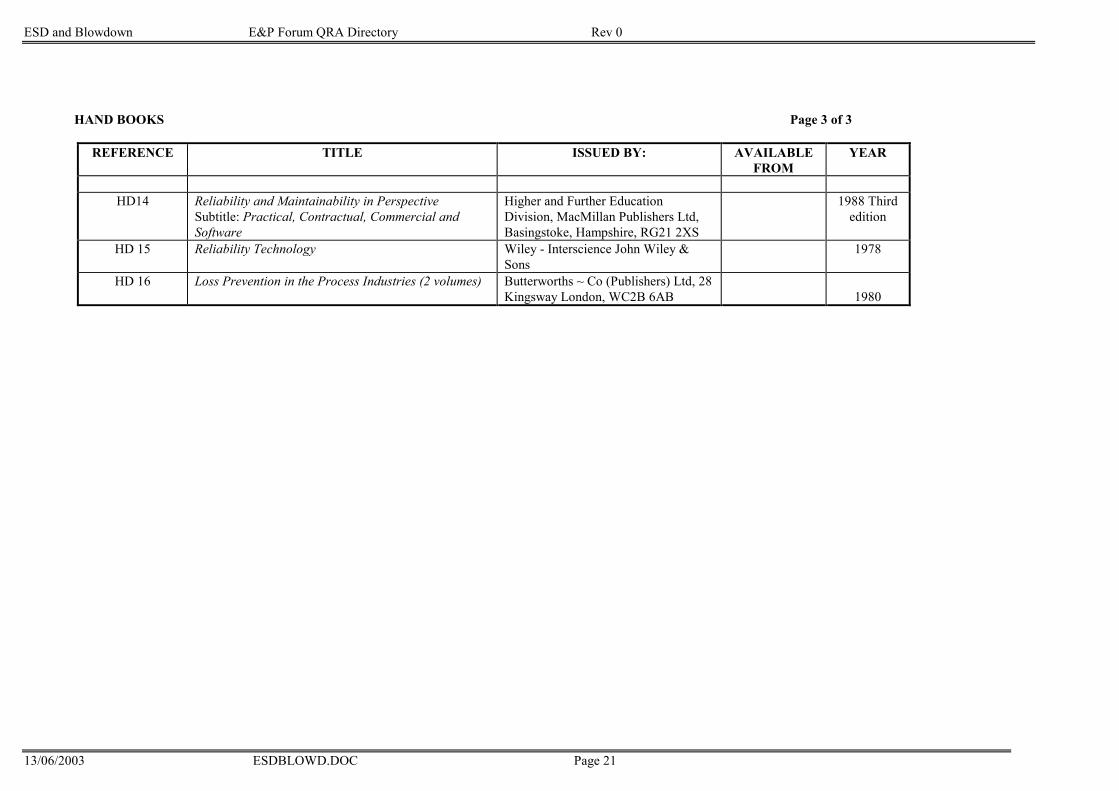
ESD and Blowdown E&P Forum QRA Directory Rev 0
13/06/2003 ESDBLOWD.DOC Page 21
HAND BOOKS Page 3 of 3
REFERENCE TITLE ISSUED BY: AVAILABLEFROM
YEAR
HD14 Reliability and Maintainability in PerspectiveSubtitle: Practical, Contractual, Commercial andSoftware
Higher and Further EducationDivision, MacMillan Publishers Ltd,Basingstoke, Hampshire, RG21 2XS
1988 Thirdedition
HD 15 Reliability Technology Wiley - Interscience John Wiley &Sons
1978
HD 16 Loss Prevention in the Process Industries (2 volumes) Butterworths ~ Co (Publishers) Ltd, 28Kingsway London, WC2B 6AB 1980
ESD and Blowdown E&P Forum QRA Directory Rev 0
13/06/2003 ESDBLOWD.DOC Page 22
Attachment 2
2. DATABANKS 2.1 Overview Most organisations concerned with quantitative reliability assessment studies maintain reliability data records in some form. Those described here are known to provide commercial data bank services to consultants and industry. For the purpose of this source book, a data bank is defined as a computerised set of parametric reliability data (ie failure rates, failure on demand rates, failure modes, etc) classified to permit systematic storage and retrieval of the information. Included here are data banks which are regularly updated. Also there are fixed data sets which may be provided with appropriate software to permit adjustment of the item failure rate for specific operational and environmental conditions. Brief details of the most important data banks are given below. As with the reliability data handbooks listed in the previous section, the keywords should help the user to identify the most relevant data bank for a specific application.
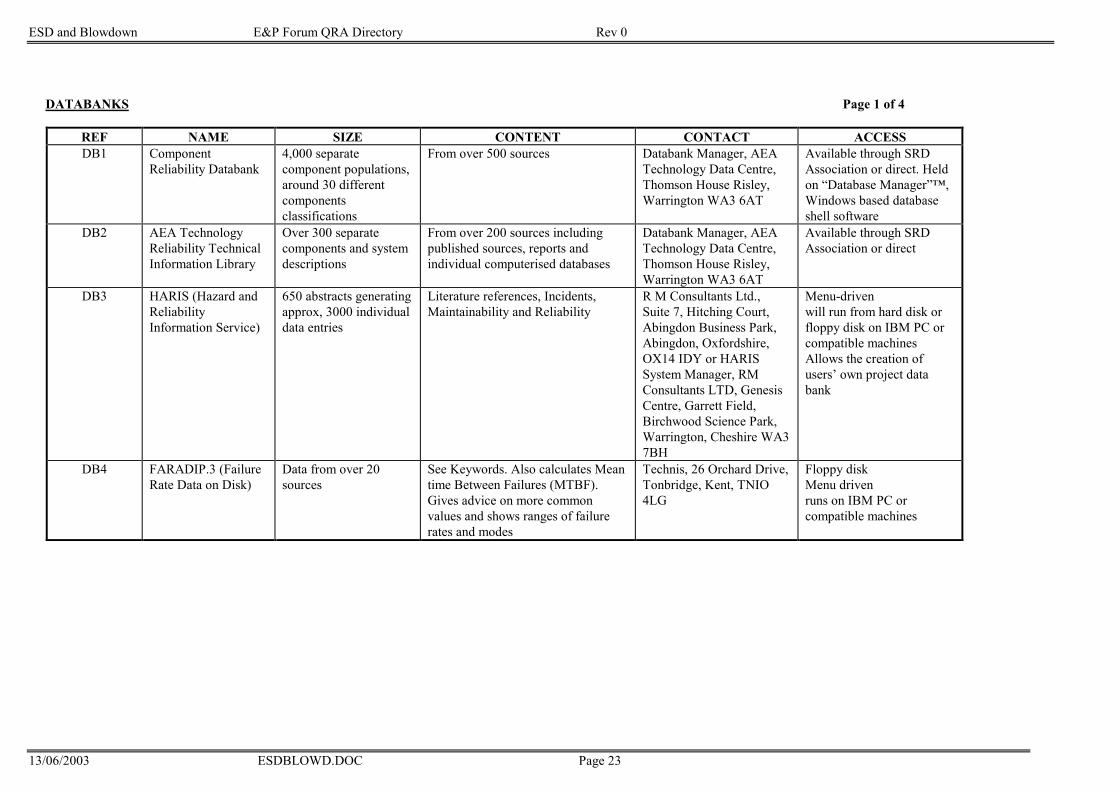
ESD and Blowdown E&P Forum QRA Directory Rev 0
13/06/2003 ESDBLOWD.DOC Page 23
DATABANKS Page 1 of 4
REF NAME SIZE CONTENT CONTACT ACCESSDB1 Component
Reliability Databank4,000 separatecomponent populations,around 30 differentcomponentsclassifications
From over 500 sources Databank Manager, AEATechnology Data Centre,Thomson House Risley,Warrington WA3 6AT
Available through SRDAssociation or direct. Heldon “Database Manager”™,Windows based databaseshell software
DB2 AEA TechnologyReliability TechnicalInformation Library
Over 300 separatecomponents and systemdescriptions
From over 200 sources includingpublished sources, reports andindividual computerised databases
Databank Manager, AEATechnology Data Centre,Thomson House Risley,Warrington WA3 6AT
Available through SRDAssociation or direct
DB3 HARIS (Hazard andReliabilityInformation Service)
650 abstracts generatingapprox, 3000 individualdata entries
Literature references, Incidents,Maintainability and Reliability
R M Consultants Ltd.,Suite 7, Hitching Court,Abingdon Business Park,Abingdon, Oxfordshire,OX14 IDY or HARISSystem Manager, RMConsultants LTD, GenesisCentre, Garrett Field,Birchwood Science Park,Warrington, Cheshire WA37BH
Menu-drivenwill run from hard disk orfloppy disk on IBM PC orcompatible machinesAllows the creation ofusers’ own project databank
DB4 FARADIP.3 (FailureRate Data on Disk)
Data from over 20sources
See Keywords. Also calculates Meantime Between Failures (MTBF).Gives advice on more commonvalues and shows ranges of failurerates and modes
Technis, 26 Orchard Drive,Tonbridge, Kent, TNIO4LG
Floppy diskMenu drivenruns on IBM PC orcompatible machines
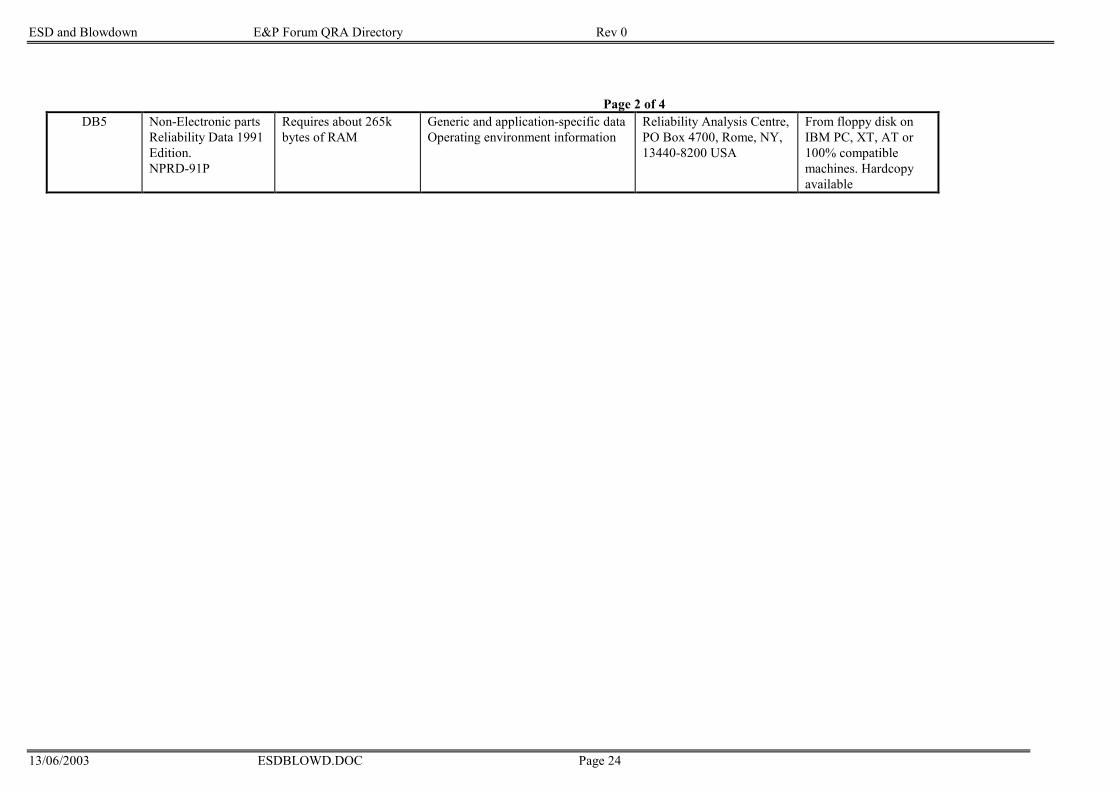
ESD and Blowdown E&P Forum QRA Directory Rev 0
13/06/2003 ESDBLOWD.DOC Page 24
Page 2 of 4DB5 Non-Electronic parts
Reliability Data 1991Edition.NPRD-91P
Requires about 265kbytes of RAM
Generic and application-specific dataOperating environment information
Reliability Analysis Centre,PO Box 4700, Rome, NY,13440-8200 USA
From floppy disk onIBM PC, XT, AT or100% compatiblemachines. Hardcopyavailable
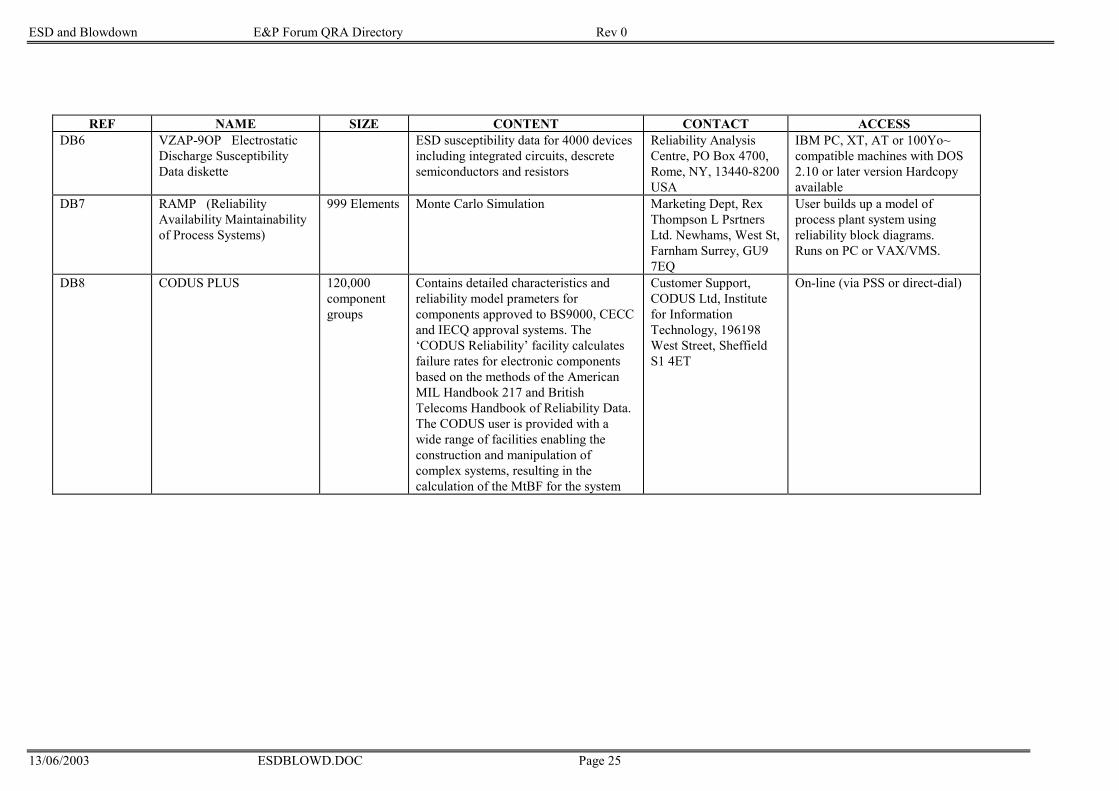
ESD and Blowdown E&P Forum QRA Directory Rev 0
13/06/2003 ESDBLOWD.DOC Page 25
REF NAME SIZE CONTENT CONTACT ACCESSDB6 VZAP-9OP Electrostatic
Discharge SusceptibilityData diskette
ESD susceptibility data for 4000 devicesincluding integrated circuits, descretesemiconductors and resistors
Reliability AnalysisCentre, PO Box 4700,Rome, NY, 13440-8200USA
IBM PC, XT, AT or 100Yo~compatible machines with DOS2.10 or later version Hardcopyavailable
DB7 RAMP (ReliabilityAvailability Maintainabilityof Process Systems)
999 Elements Monte Carlo Simulation Marketing Dept, RexThompson L PsrtnersLtd. Newhams, West St,Farnham Surrey, GU97EQ
User builds up a model ofprocess plant system usingreliability block diagrams.Runs on PC or VAX/VMS.
DB8 CODUS PLUS 120,000componentgroups
Contains detailed characteristics andreliability model prameters forcomponents approved to BS9000, CECCand IECQ approval systems. The‘CODUS Reliability’ facility calculatesfailure rates for electronic componentsbased on the methods of the AmericanMIL Handbook 217 and BritishTelecoms Handbook of Reliability Data.The CODUS user is provided with awide range of facilities enabling theconstruction and manipulation ofcomplex systems, resulting in thecalculation of the MtBF for the system
Customer Support,CODUS Ltd, Institutefor InformationTechnology, 196198West Street, SheffieldS1 4ET
On-line (via PSS or direct-dial)
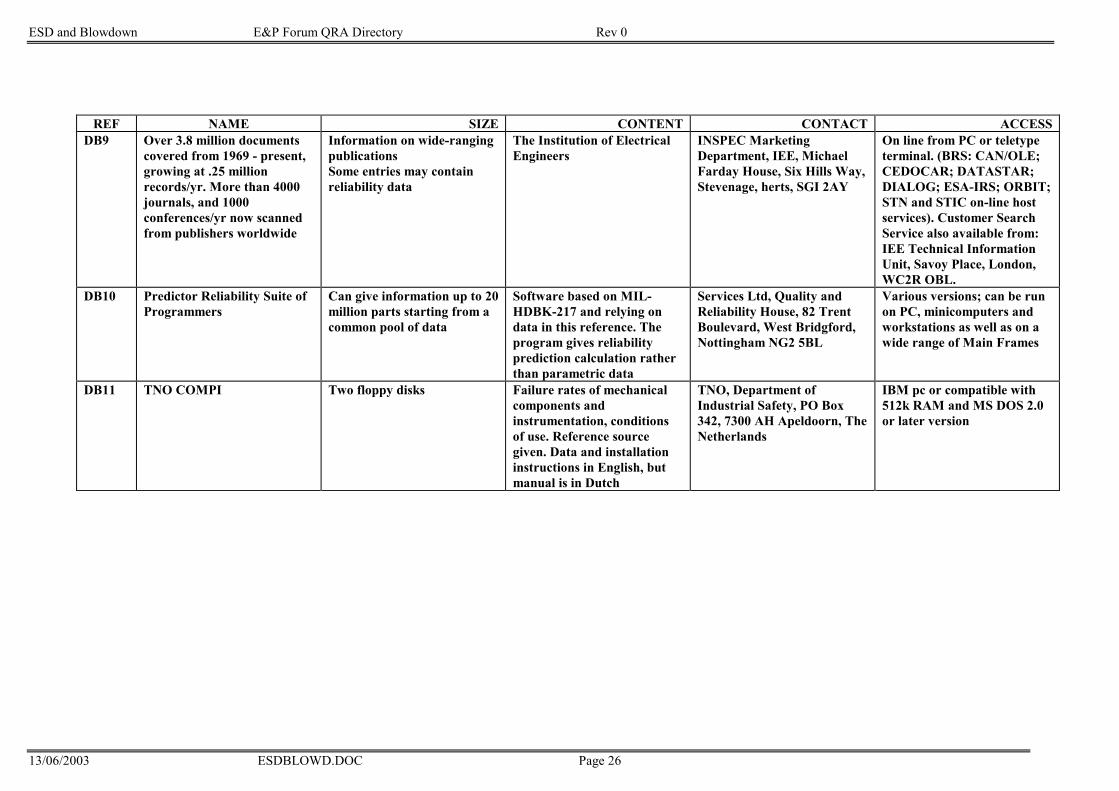
ESD and Blowdown E&P Forum QRA Directory Rev 0
13/06/2003 ESDBLOWD.DOC Page 26
REF NAME SIZE CONTENT CONTACT ACCESSDB9 Over 3.8 million documents
covered from 1969 - present,growing at .25 millionrecords/yr. More than 4000journals, and 1000conferences/yr now scannedfrom publishers worldwide
Information on wide-rangingpublicationsSome entries may containreliability data
The Institution of ElectricalEngineers
INSPEC MarketingDepartment, IEE, MichaelFarday House, Six Hills Way,Stevenage, herts, SGI 2AY
On line from PC or teletypeterminal. (BRS: CAN/OLE;CEDOCAR; DATASTAR;DIALOG; ESA-IRS; ORBIT;STN and STIC on-line hostservices). Customer SearchService also available from:IEE Technical InformationUnit, Savoy Place, London,WC2R OBL.
DB10 Predictor Reliability Suite ofProgrammers
Can give information up to 20million parts starting from acommon pool of data
Software based on MIL-HDBK-217 and relying ondata in this reference. Theprogram gives reliabilityprediction calculation ratherthan parametric data
Services Ltd, Quality andReliability House, 82 TrentBoulevard, West Bridgford,Nottingham NG2 5BL
Various versions; can be runon PC, minicomputers andworkstations as well as on awide range of Main Frames
DB11 TNO COMPI Two floppy disks Failure rates of mechanicalcomponents andinstrumentation, conditionsof use. Reference sourcegiven. Data and installationinstructions in English, butmanual is in Dutch
TNO, Department ofIndustrial Safety, PO Box342, 7300 AH Apeldoorn, TheNetherlands
IBM pc or compatible with512k RAM and MS DOS 2.0or later version
ESD and Blowdown E&P Forum QRA Directory Rev 0
13/06/2003 ESDBLOWD.DOC Page 27
Attachment 3
3. TEXTBOOKS (a) E J Henley and H Kumamoto - Reliability Engineering and Risk Assessment,
Prentice Hall 1981. ISBN 013 7722516 (b) R Billington and R N Allan - Reliability Evaluation of engineering Systems:
Concepts and Techniques, Pitman 1983. ISBN 0273084844 (c) J Davidson editor - The Reliability of mechanical Systems. Institute of Mechanical
Engineering Publications, Institute of Mechanical Engineers, London 1988. ISBN 0852986750
(d) Barlow R E and Proschan, F Wiley - mathematical Theory of Reliability, 1965. (e) Human Reliability Assessor's Guide, Humphreys, P, UKAEA, Safety and
Reliability Directorate, Culcheth, Warrington, Cheshire, UK 1988 (RTS 88/952) (f) Human error in Risk assessment. Brazendale, J, editor SRD/HSE R510. HMSO
London ISBN 0853563322 (g) Tolerability of risk from nuclear power stations HSE/HMSO London, 1988. ISBN
0118839829 (h) Mann, N R; Schafer, R E, and Singpurwila, N D, John Wiley and Son methods for
Statistical Analysis of Reliability and Life Data. 1974 (i) Programmable electronic systems in safety-related applications General Technical
Guidelines No 2. HMSO London ISBN 011 88 3906 3. (j) BS 4778: Parts 1: 1987 and 2: 1979 Quality Vocabulary. British Standards
Institution (k) Reliability of constructed or manufactured products, systems, equipments and
components. British Standards Institution BS 5760: Parts 1 : 1985, 2: 1981, 3: 1982 and 4: 1986
ESD and Blowdown E&P Forum QRA Directory Rev 0
13/06/2003 ESDBLOWD.DOC Page 27
Emergency Systems E&P Forum QRA Data Sheet Directory Rev 0
13/06/2003 EMERGSYS.DOC Page 11
EEMMEERRGGEENNCCYY SSYYSSTTEEMMSS
Emergency Systems E&P Forum QRA Data Sheet Directory Rev 0
13/06/2003 EMERGSYS.DOC Page 22
TTAABBLLEE OOFF CCOONNTTEENNTTSS
11.. IINNTTRROODDUUCCTTIIOONN ------------------------------------------------------------------------------------------------------------------------------------------------------------------------ 33
22.. DDAATTAA AAVVAAIILLAABBLLEE ------------------------------------------------------------------------------------------------------------------------------------------------------------------ 44
33.. EEMMEERRGGEENNCCYY SSYYSSTTEEMMSS SSUURRVVIIVVAABBIILLIITTYY AANNAALLYYSSIISS ---------------------------------------------------------------- 55
44.. RREEFFEERREENNCCEESS -------------------------------------------------------------------------------------------------------------------------------------------------------------------------------- 55
FFIIGGUURREE 11 -------------------------------------------------------------------------------------------------------------------------------------------------------------------------------------------------- 66
Emergency Systems E&P Forum QRA Data Sheet Directory Rev 0
13/06/2003 EMERGSYS.DOC Page 33
11.. IINNTTRROODDUUCCTTIIOONN
Table 1 below, includes a listing of Emergency Systems for a typical offshore facility. The Emergency Systems of an installation may be defined as those, which under certain accident circumstances, could be critical to the safety of personnel on board. Emergency systems are utilised for the prevention, control and mitigation of hazardous events. TTaabbllee 11:: LLiisstt ooff EEmmeerrggeennccyy SSyysstteemmss
• Fire and Gas Detection • HVAC, Heating, Ventilation and Air Conditioning
• Active Fire Protection • Communications: Internal & External • Passive Fire / Blast Protection • Power Supplies: Emergency and
Uninteruptable • Emergency Shut Down, ESD (Process and Risers)
• Emergency Lighting
• Blowout Prevention. • Instrument Air Supply • Blowdown • Control Room Interfaces • Evacuation, Escape & Rescue • Navigational Aids
Typical of the criticality of each Emergency System for an offshore manned platform is the need for that system to protect Temporary Refuges from major hazard accident and related escalation effects. Adequate protection of a Temporary Refuge will include its emergency access and egress facilities. This data sheet principally includes an overview of the analysis of Emergency Systems against accident conditions. Such an analysis is commonly referred to as "Emergency Systems Survivability Analysis" or ESSA.
Emergency Systems E&P Forum QRA Data Sheet Directory Rev 0
13/06/2003 EMERGSYS.DOC Page 44
22.. DDAATTAA AAVVAAIILLAABBLLEE
TTaabbllee 22:: RReellaatteedd DDiirreeccttoorryy DDaattaa SShheeeettss ffoorr CCeerrttaaiinn EEmmeerrggeennccyy SSyysstteemmss
Emergency System Data Sheet # Title
• Fire and Gas Detection 3.1 Fire and Gas Detection • Active Fire Protection 3.5
3.6 3.7
Fire Water Supply Fire Water Distribution Foam & Gaseous Systems
• Passive Fire / Blast Protection 5.2 Vulnerability of Plant • Emergency Shut Down, ESD (Process and Risers)
3.3 Emergency Shutdown & Blowdown
• Blowout Prevention. 3.2 Blowout Prevention & SSSV • Blowdown 3.3 Emergency Shutdown & Blowdown • Evacuation, Escape & Rescue 4 Evacuation, Escape & Rescue
A number of Emergency Systems, as listed and detailed in Table 1, are the subject of their own data sheets within this E&P Forum directory, see Table 2. Available data relating to Emergency Systems and their components are mainly confined to performance reliability of the type found in OREDA, Ref. 1. For those emergency systems not listed in Table 2, Ref. 1 contains data as follows: Section 4.3.6 General Alarm & Communication Systems Section 4.4.1 Electrical Systems: Power Generation Section 5.2.1 Utility Systems: Ventilation and Heating Systems In addition, the general reliability handbooks, databanks and textbooks listed under Attachment 1 of the ESD and Blowdown Systems Data sheet # 3.3, would be appropriate to the equipment of emergency systems. This type of data is appropriate for the assessment of the functional reliability and availability of such systems. The Vulnerability of Plant data sheet in this directory contains data for damage for certain equipment items under accident conditions. Such data could form a useful input to an assessment of emergency systems, as detailed below. A further aspect for analysis of the Emergency Systems is their performance and vulnerability under accident loading. No generic system level data is presently known of for this issue. This is hardly surprising considering the rare nature of real major hazard accidents. The implication is that for each installation, its Emergency Systems should be analysed on a case by case basis. See below. While Evacuation, Escape and Rescue (EER) Systems are included in the list it should be noted that they are usually covered by a specific safety and risk study.
Emergency Systems E&P Forum QRA Data Sheet Directory Rev 0
13/06/2003 EMERGSYS.DOC Page 55
33.. EEMMEERRGGEENNCCYY SSYYSSTTEEMMSS SSUURRVVIIVVAABBIILLIITTYY AANNAALLYYSSIISS
Generally, the main objective of an Emergency Systems Survivability Analysis (ESSA) is to determine the vulnerability of emergency systems to severe accident events. This is usually achieved by systematically assessing the effects of accidental events on the ability of Emergency Systems to perform their intended function. A detailed analysis of all parts of the emergency system for vulnerability is made. If it is identified that an essential emergency system might be lost or damaged, such that the system is prevented from operating for a minimum required time, then that system would be considered as being unacceptably vulnerable. The period of time during which Emergency Systems must adequately function depends on the requirements of the Escape and Evacuation programme but could also, for instance, be the endurance time set for the Temporary Refuge. An initial ESSA for a facility would involve the assumption of major hazard accident scenarios and initially a qualitative approach can be adopted for the analysis. The safety criticality of each particular emergency system is reviewed with respect to each particular hazard scenario. Key to the analysis is assessment of the following system features: Criticality, Fail safety, Vulnerability, Redundancy/Diversity. The process is outlined in Figure 1. Where, following initial ESSA, systems have been assessed as being unacceptably vulnerable, further more detailed risk assessment would be necessary. Such assessment may involve quantification of the expected frequencies of occurrence of the initial hazardous event and resultant loss of the system. Thus, enhancements may be shown to be required to the survivability of certain systems Rigorous application of ESSA is more usually confined to manned or occasionally manned offshore facilities for which risk to life from plant or other hazards is predicted as being relatively high. Nevertheless the principles can be readily applied to other offshore or even onshore facilities where, for instance, the potential asset value is high or the facility is critical to field production. ESSA is but one of the numerous studies that may be made to achieve an overall assessment of risks associated with a facility or activity, others being for example, Fire Risk Assessment and Evacuation, Escape and Rescue Assessment. Overlaps and commonalties between ESSA and these other studies will inevitably exist. Input to the performance prediction of systems and their components in adverse conditions may also be available from studies such as Hazard and Operability (HAZOP) and Failure Mode and Effect Criticality Analysis.
44.. RREEFFEERREENNCCEESS
1. OREDA. Offshore Reliability Data Handbook. DNV Technica. 2nd Edition. 1992. ISBN 82 515 0188 1.
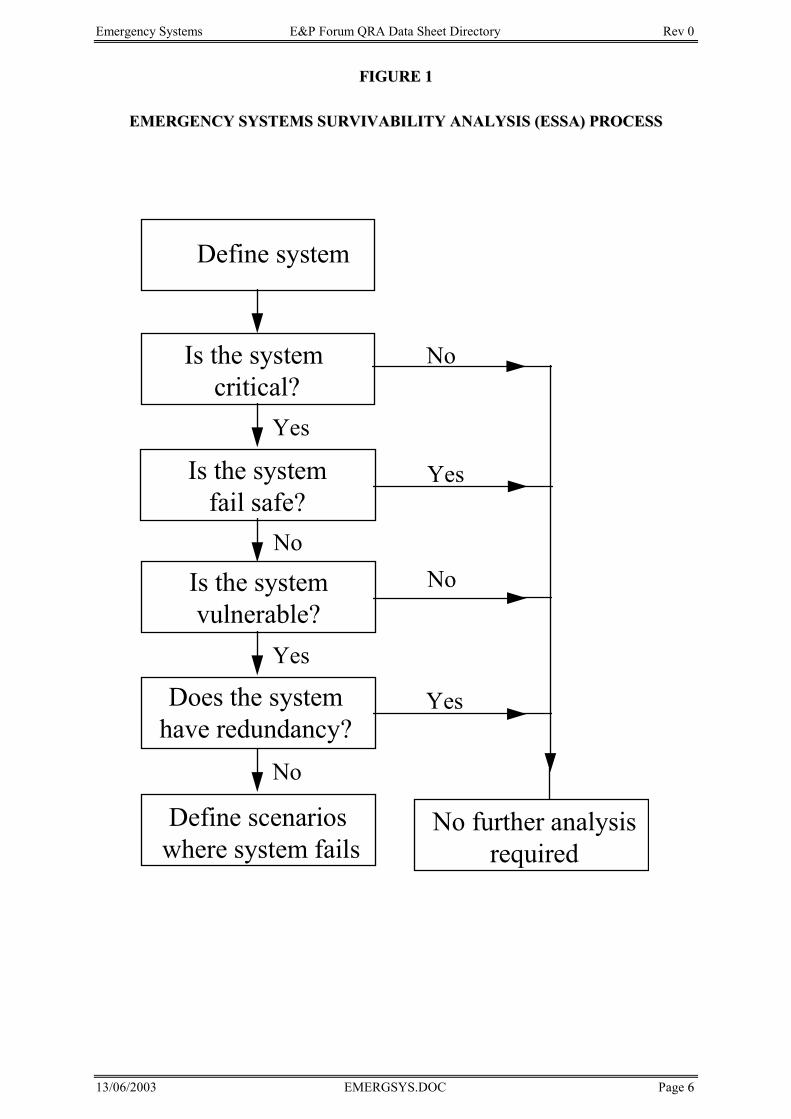
Emergency Systems E&P Forum QRA Data Sheet Directory Rev 0
13/06/2003 EMERGSYS.DOC Page 66
FFIIGGUURREE 11
EEMMEERRGGEENNCCYY SSYYSSTTEEMMSS SSUURRVVIIVVAABBIILLIITTYY AANNAALLYYSSIISS ((EESSSSAA)) PPRROOCCEESSSS
Define system
Is the system critical?
Is the systemfail safe?
Is the systemvulnerable?
Does the systemhave redundancy?
Define scenarios where system fails
No further analysisrequired
Yes
No
No
Yes
No
Yes
No
Yes

Emergency Systems E&P Forum QRA Data Sheet Directory Rev 0
13/06/2003 EMERGSYS.DOC Page 77
Blowout Prevention E&P Forum QRA Datasheet Directory Rev 0
13/06/03 BLWOUTPR.DOC Page 1
BLOWOUT PREVENTION EQUIPMENT
Blowout Prevention E&P Forum QRA Datasheet Directory Rev 0
13/06/03 BLWOUTPR.DOC Page 2
TABLE OF CONTENTS
1. SCOPE----------------------------------------------------------------------------------------------- 3 2. APPLICATION ------------------------------------------------------------------------------------- 3 3. DEFINITIONS -------------------------------------------------------------------------------------- 3 4. KEY DATA ------------------------------------------------------------------------------------------ 3
4.1 Key data, Subsea BOP systems -------------------------------------------------------------------------------------3 Data Tables --------------------------------------------------------------------------------------------------------------------5
4.2 Key data, Surface BOP systems----------------------------------------------------------------------------------- 12 Data Tables ------------------------------------------------------------------------------------------------------------------ 12
4.3 Key Data, Downhole Safety Valves (DHSV/SCSSV) --------------------------------------------------------- 19 Data Tables ------------------------------------------------------------------------------------------------------------------ 20
5. ONGOING RESEARCH ------------------------------------------------------------------------27 REFERENCES ------------------------------------------------------------------------------------------------------------- 28
APPENDIX 1 29
Blowout Prevention E&P Forum QRA Datasheet Directory Rev 0
13/06/03 BLWOUTPR.DOC Page 3
BLOWOUT PREVENTION
1. SCOPE The purpose of this datasheet is to provide failure data for the following blow-out prevention equipment: • Subsea BOPs • Surface BOPs • SCSSV The report also includes selected information that could be used to better understand the causes leading to loss of the primary barriers during well drilling. 2. APPLICATION The data presented are applicable for quantitative risk assessments (QRA) related to well drilling and production. 3. DEFINITIONS BOP Blowout preventer. Used for the blowout prevention during the drilling phase. SCSSV Surface Controlled Sub-surface Safety Valve. Used for downhole shut-in of
production and/or injection wells to avoid blowouts. 4. KEY DATA 4.1 Key data, Subsea BOP systems There has, during the years 1982 - 1990, been carried out a comprehensive reliability study of Subsea Blow-out Preventer (BOP) systems on behalf of various oil companies operating in the Norwegian Sector of the North Sea and the Norwegian Petroleum Directorate (NPD). The project has been divided into five phases, with final reporting after each phase. Main activities within each phase have been: Phase I Analysis of failure data from 61 wells and BOP system analysis. Phase II Analysis of failure data from 99 wells and mechanical evaluation of BOP components. Separate report on control systems reliability. Phase III Evaluation of BOP test procedures and operational control. Phase IV Analysis of failure data from 58 wells drilled by fairly new rigs. Evaluation of failure causes. Estimation of blow-out probabilities based on a fault tree model. Phase V Analysis of 47 exploration wells, drilled in the period 1987 - 1989. BOP failures and BOP tests were recorded and analysed. The data presented here are mainly based on the results from Phase V (/1/) of the study because a significant BOP reliability improvement was observed in the period from 1979 to 1986. Results from Phase II, III and IV serve as a reference for comments made related to the specific equipment.
Blowout Prevention E&P Forum QRA Datasheet Directory Rev 0
13/06/03 BLWOUTPR.DOC Page 4
Specific data background A total of 47 wells drilled in the Norwegian Sector of the North Sea have been reviewed. All wells were drilled in the period from 1987-01-01 to 1989-09-01. These 47 wells represent a total of 3023 rigdays or 2636 BOP-days. Included in rigdays is the time from the rig arrives the location and drops the anchors, until the last anchor is pulled prior to leaving the location. Included in BOP-days are all days from when the BOP is first landed on the wellhead, until it is pulled the last time. If the BOP is pulled anytime between first landing and last pulling, for any reason, these days are also included in the BOP-days. The data was collected from ten different subsea BOP stacks. All the stacks were 18 3/4 inch 10000 or 15000 psi stacks. For the failure recording period, the BOPs were function and pressure tested prior to running, after landing, after running casing and approximately once a week during drilling operation according to the NPD regulations that existed at that time. Current testing practice varies from the above due to changes in NPD testing regulations.
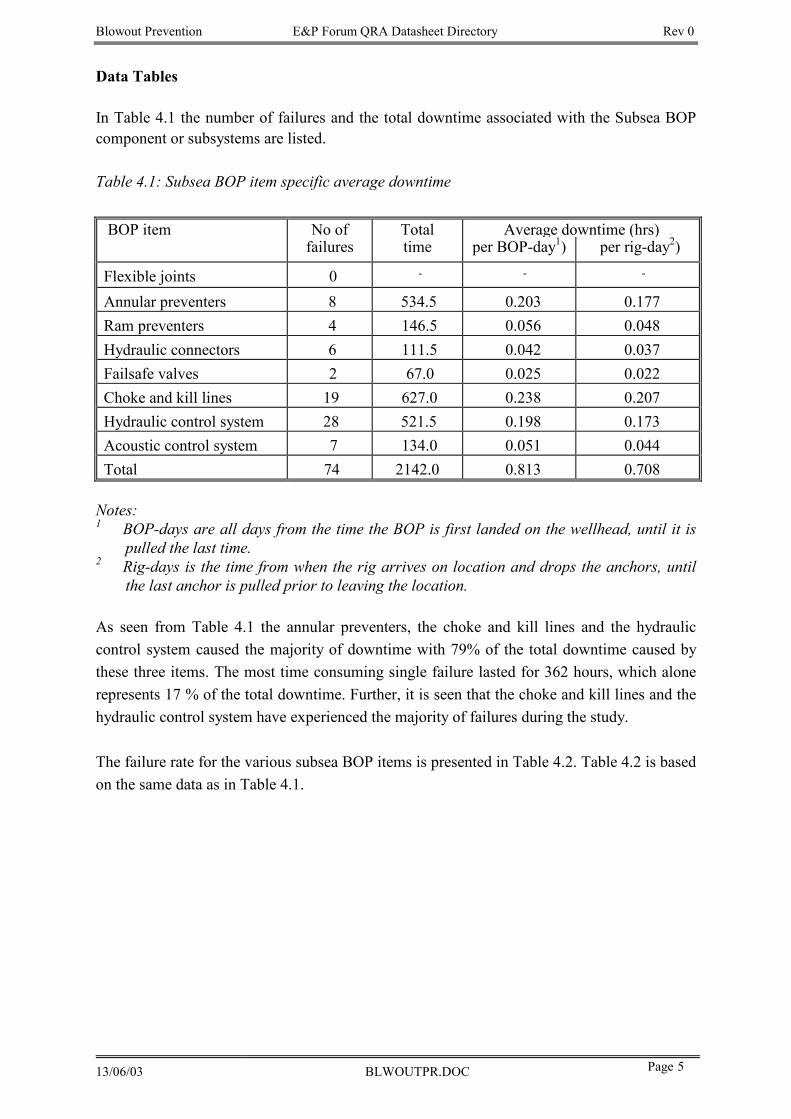
Blowout Prevention E&P Forum QRA Datasheet Directory Rev 0
13/06/03 BLWOUTPR.DOC Page 5
Data Tables In Table 4.1 the number of failures and the total downtime associated with the Subsea BOP component or subsystems are listed. Table 4.1: Subsea BOP item specific average downtime
BOP item No of Total Average downtime (hrs)failures time per BOP-day1) per rig-day2)
Flexible joints 0 - - -
Annular preventers 8 534.5 0.203 0.177Ram preventers 4 146.5 0.056 0.048Hydraulic connectors 6 111.5 0.042 0.037Failsafe valves 2 67.0 0.025 0.022Choke and kill lines 19 627.0 0.238 0.207
Hydraulic control system 28 521.5 0.198 0.173
Acoustic control system 7 134.0 0.051 0.044 Total 74 2142.0 0.813 0.708
Notes: 1 BOP-days are all days from the time the BOP is first landed on the wellhead, until it is
pulled the last time. 2 Rig-days is the time from when the rig arrives on location and drops the anchors, until
the last anchor is pulled prior to leaving the location. As seen from Table 4.1 the annular preventers, the choke and kill lines and the hydraulic control system caused the majority of downtime with 79% of the total downtime caused by these three items. The most time consuming single failure lasted for 362 hours, which alone represents 17 % of the total downtime. Further, it is seen that the choke and kill lines and the hydraulic control system have experienced the majority of failures during the study. The failure rate for the various subsea BOP items is presented in Table 4.2. Table 4.2 is based on the same data as in Table 4.1.
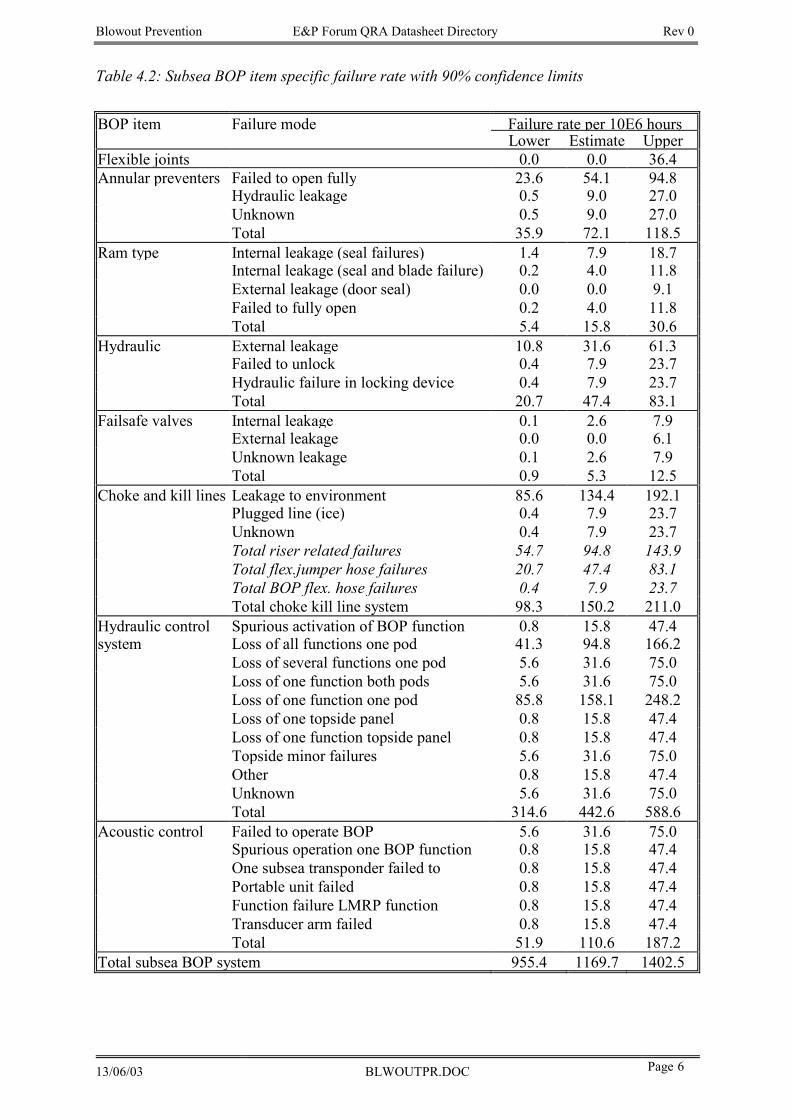
Blowout Prevention E&P Forum QRA Datasheet Directory Rev 0
13/06/03 BLWOUTPR.DOC Page 6
Table 4.2: Subsea BOP item specific failure rate with 90% confidence limits BOP item Failure mode Failure rate per 10E6 hours
Lower Estimate Upper Flexible joints 0.0 0.0 36.4Annular preventers Failed to open fully 23.6 54.1 94.8
Hydraulic leakage 0.5 9.0 27.0Unknown 0.5 9.0 27.0Total 35.9 72.1 118.5
Ram type Internal leakage (seal failures) 1.4 7.9 18.7Internal leakage (seal and blade failure) 0.2 4.0 11.8External leakage (door seal) 0.0 0.0 9.1Failed to fully open 0.2 4.0 11.8Total 5.4 15.8 30.6
Hydraulic External leakage 10.8 31.6 61.3Failed to unlock 0.4 7.9 23.7Hydraulic failure in locking device 0.4 7.9 23.7Total 20.7 47.4 83.1
Failsafe valves Internal leakage 0.1 2.6 7.9External leakage 0.0 0.0 6.1Unknown leakage 0.1 2.6 7.9Total 0.9 5.3 12.5
Choke and kill lines Leakage to environment 85.6 134.4 192.1Plugged line (ice) 0.4 7.9 23.7Unknown 0.4 7.9 23.7Total riser related failures 54.7 94.8 143.9Total flex.jumper hose failures 20.7 47.4 83.1Total BOP flex. hose failures 0.4 7.9 23.7Total choke kill line system 98.3 150.2 211.0
Hydraulic control Spurious activation of BOP function 0.8 15.8 47.4system Loss of all functions one pod 41.3 94.8 166.2
Loss of several functions one pod 5.6 31.6 75.0Loss of one function both pods 5.6 31.6 75.0Loss of one function one pod 85.8 158.1 248.2Loss of one topside panel 0.8 15.8 47.4Loss of one function topside panel 0.8 15.8 47.4Topside minor failures 5.6 31.6 75.0Other 0.8 15.8 47.4Unknown 5.6 31.6 75.0Total 314.6 442.6 588.6
Acoustic control Failed to operate BOP 5.6 31.6 75.0Spurious operation one BOP function 0.8 15.8 47.4One subsea transponder failed to 0.8 15.8 47.4Portable unit failed 0.8 15.8 47.4Function failure LMRP function 0.8 15.8 47.4Transducer arm failed 0.8 15.8 47.4Total 51.9 110.6 187.2
Total subsea BOP system 955.4 1169.7 1402.5
Blowout Prevention E&P Forum QRA Datasheet Directory Rev 0
13/06/03 BLWOUTPR.DOC Page 7
General comments to item specific trends in failure rates and down times
Flexible joints Ball joints are no longer used as flexible joints in floating drilling in the Norwegian sector of the North Sea. In Phase V of the study no flexible joint failures were observed. Phase V study and the earlier BOP studies show that the flexible joint principle is superior to the ball joint principle in terms of reliability. The only likely flexible joint failures today are failures introduced by a not completely horizontal wellhead and/or a systematic poor rig positioning. Annular preventers The non-critical failure mode "could not be fully opened" is dominating the annular preventer failure rate. Normally, this failure mode causes only minor operational problems. This failure type used to create a lot of trouble for one specific make. The problems have, however, been reduced from Phase IV to Phase V data. Annular preventer average downtime is significantly higher during the Phase V data collection than earlier. This increase is caused by one failure, which caused 362 hours rig downtime because it was very difficult to find the failure cause. Ram-type preventers Ram preventer performance has improved significantly from Phase II to Phase IV and V. Ram preventer failures seem to be relatively low today. The critical failures "Leakage through a closed ram preventer," and "Leakage to sea in bonnet sealing areas", were the most frequent failure types during Phase II of the data collection. A significant reduction in failure rate from Phase II to phase IV and V has been observed. The main causes for this reduction are improved preventive maintenance and some minor design modifications. It should be noted that during the Phase IV and V data collection, no failures in either variable or normal packer elements were observed (variable packers are commonly used in the North Sea today). Hydraulic connectors External leakage and improper locking/unlocking function are the most typical failures. The hydraulic connectors have experienced approximately the same failure rate and downtime in Phase IV and V of the study, which is a significant reduction compared to Phase II. This improvement is likely to be caused by improved maintenance and the introduction of derrick mounted heave compensators that are claimed to give more accurate BOP wellhead landings. It should, however, be noted that during Phase V of the study an external leakage in a wellhead connector was observed during a regular BOP test. From a safety point of view this failure is one of the most critical of all failures. Approximately 75% of the connector failures were observed on the wellhead connectors and 25% on the Lower Marine Riser Package (LMRP) connectors in all the data collections.
Failsafe valves
Blowout Prevention E&P Forum QRA Datasheet Directory Rev 0
13/06/03 BLWOUTPR.DOC Page 8
Failsafe valves have caused few problems during Phase V study compared to the earlier studies. During Phase IV, erosion in the sealing area causing the failure mode "Leakage in closed position" was the most frequent failure type. Valve design errors caused the majority of failures and downtime. During Phase IV this failure type also was observed on several valves simultaneously. In Phase II several external leakages were observed in the clamp connection between the inner valve and the BOP body. These failures seem now to be almost eliminated. Better designed line arrangement on the stack, and better valve to stack connections are believed to be the main reason for this improvement. Choke and kill lines Choke and kill line problems seem to cause more problems today than a few years ago. This may be caused by the fact that the average riser age was higher during Phase V of the study than Phase IV of the study. Another interesting fact is that during the earlier studies the failures were typically concentrated to some few rigs, while during Phase V of the study, no particular rig seems to have more riser problems than the other rigs. The majority of failures in the choke and kill lines are leakages to the environment in line connections. Plugged lines have also been observed. Hydraulic control systems Hydraulic control systems were producing rig downtime in the same order of magnitude during the Phase V study as both Phase II and IV. Pilot, shuttle and regulator valve failures in addition to hydraulic line leakages are the most typical failures. These failures are mostly affecting single BOP functions only. Other, more severe and relatively frequent, failures are burst or broken hydraulic control hose bundles. Frozen pilot lines were also observed during Phase II and Phase IV of the study. The failure rate has shown a decreasing tendency from Phase II to Phase IV and V. However, the average downtime is at the same level. Acoustic backup control systems Typical failures are failures in subsea or topside acoustic equipment preventing a proper acoustic communication between the rig and the BOP stack, in addition to failures in the subsea hydraulic equipment. No trend in acoustic control system reliability has been observed. Failure observation and criticality The BOP item specific failures from Table 4.1 have been observed as shown in Table 4.3 Table 4.3: Observation of Subsea BOP failures
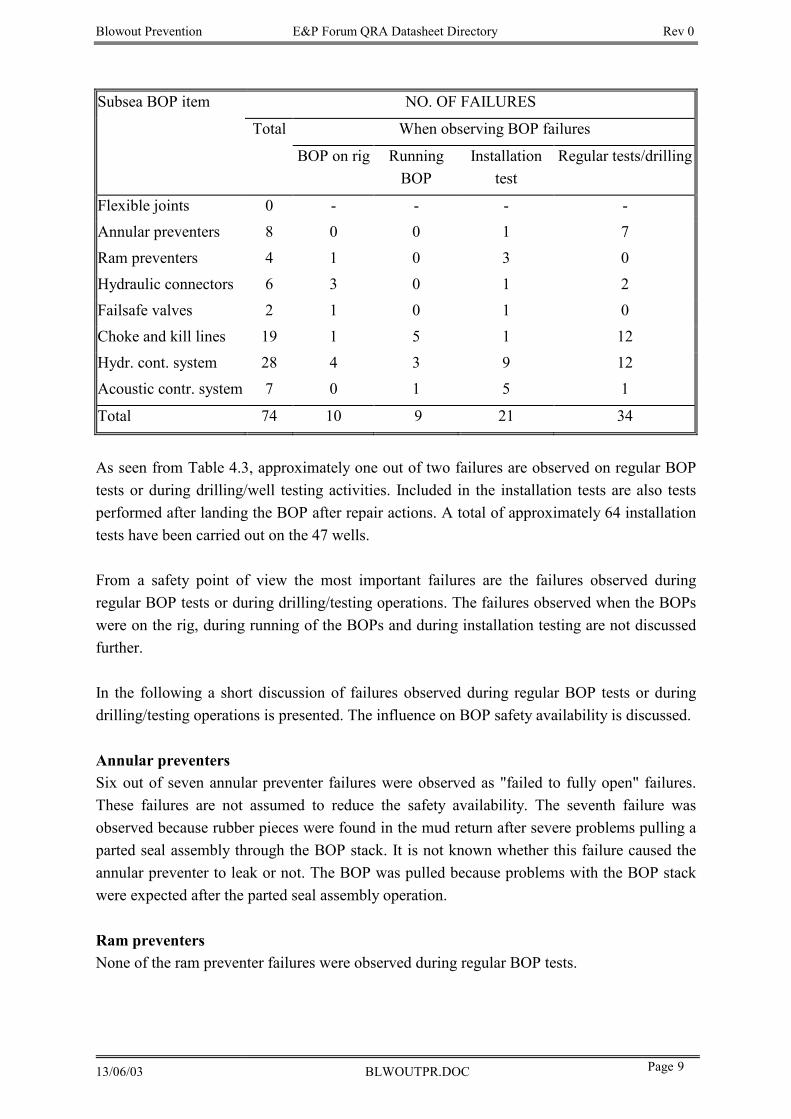
Blowout Prevention E&P Forum QRA Datasheet Directory Rev 0
13/06/03 BLWOUTPR.DOC Page 9
Subsea BOP item NO. OF FAILURES
Total When observing BOP failures
BOP on rig Running BOP
Installation test
Regular tests/drilling
Flexible joints 0 - - - -
Annular preventers 8 0 0 1 7
Ram preventers 4 1 0 3 0
Hydraulic connectors 6 3 0 1 2
Failsafe valves 2 1 0 1 0
Choke and kill lines 19 1 5 1 12
Hydr. cont. system 28 4 3 9 12
Acoustic contr. system 7 0 1 5 1
Total 74 10 9 21 34
As seen from Table 4.3, approximately one out of two failures are observed on regular BOP tests or during drilling/well testing activities. Included in the installation tests are also tests performed after landing the BOP after repair actions. A total of approximately 64 installation tests have been carried out on the 47 wells. From a safety point of view the most important failures are the failures observed during regular BOP tests or during drilling/testing operations. The failures observed when the BOPs were on the rig, during running of the BOPs and during installation testing are not discussed further. In the following a short discussion of failures observed during regular BOP tests or during drilling/testing operations is presented. The influence on BOP safety availability is discussed. Annular preventers Six out of seven annular preventer failures were observed as "failed to fully open" failures. These failures are not assumed to reduce the safety availability. The seventh failure was observed because rubber pieces were found in the mud return after severe problems pulling a parted seal assembly through the BOP stack. It is not known whether this failure caused the annular preventer to leak or not. The BOP was pulled because problems with the BOP stack were expected after the parted seal assembly operation. Ram preventers None of the ram preventer failures were observed during regular BOP tests.
Blowout Prevention E&P Forum QRA Datasheet Directory Rev 0
13/06/03 BLWOUTPR.DOC Page 10
Hydraulic connectors The most critical of all failures observed during Phase V was a leakage in the wellhead connector during a regular BOP test. The other hydraulic connector failure was a failure in LMRP locking hydraulics. This was not a critical failure. The LMRP locking function could still be controlled. Failsafe valves None of the failsafe valve failures were observed during regular BOP tests. Choke and kill lines A total of twelve choke and kill line failures were observed during regular BOP tests or regular BOP operations. Seven of these failures were associated with riser attached line connections, and five in the moonpool flexible jumper hoses. All these failures will reduce the BOP safety availability. However, the most important factor is that these failures will cause extra problems if the well hydrostatic pressure has to be stabilized. Hydraulic control system A total of twelve control system failures was observed during regular BOP tests, or during normal drilling operations. Of these failures, three failures can be regarded as insignificant with respect to safety. Four failures caused “loss of BOP control on one pod”. These failures were all caused by leakage/rupture in pod main supply line. Two failures caused “loss of one BOP function on both pods”. These failures were caused by a failure in the shuttle valve or hydraulic line from the shuttle valve to the BOP function. Three failures caused “loss of one BOP function on one pod”. These problems were caused by pilot valve failures. Acoustic control system failures On the acoustic control system only one failure was observed during regular BOP tests. One out of two subsea transducers failed, the other remained in good condition. However, it seems that the acoustic control systems in general get a stepmotherly treatment. It is likely that more failures occur in these systems than reported in the daily drilling reports.
4.1.1.1 Data Source The data is from reference [1]: Holand, P.: “Subsea BOP Systems, Reliability and Testing Phase V, revision 1" SINTEF report STF 75 A89054, Trondheim, Norway 1995 4.1.1.2 Range Included in the subsea BOP system are the following components/subsystems: 1. Flexible joint 2. Upper and lower annular preventer 3. Lower marine riser package (LMRP) connector, wellhead connector 4. Shear, upper, middle and lower pipe ram 5. Six failsafe choke and kill valves
Blowout Prevention E&P Forum QRA Datasheet Directory Rev 0
13/06/03 BLWOUTPR.DOC Page 11
6. Choke and kill lines, which includes riser integral lines and flexible jumper hoses in the rig moon pool
7. Hydraulic control system including control lines and topside control panels 8. Acoustic control system including topside panels and transmitting/receiving equipment. A BOP failure is defined as a failure associated with one of the above compo-nents/subsystems. The failure specific downtime is the total time lost in conjunction with each failure. The downtime includes the time from the preparation for the restoration starts, until the failure is repaired and the drilling is at the same level as when starting the preparation. For instance if the BOP failure requires the BOP to be pulled, the time included to set and drill the cement plugs, are included in the downtime. 4.1.1.3 Availability Data about the subsea BOP failures is not easily available from any public or oil company sources. This type of information has to be collected one by one from the oil companies/drilling contractor files. 4.1.1.4 Strengths The data presented here is the newest available data. 4.1.1.5 Limitations The failure data has been collected during normal drilling operation, i.e., they have not been collected for situations were the BOPs have needed to act to close in a well kick. 4.1.1.6 Applicability The subsea BOP reliability data can be used as input for drilling risk analyses, or drilling regularity studies. 4.1.1.7 Estimating Frequencies When calculating BOP failure rates, it is assumed that the times between BOP failures are exponentially distributed. The standard estimate for the BOP failure rate λ^ is:
λ τ∧ = =Number of failures
Number of operational hoursn
The uncertainty of the estimate λ^ can be measured by a 90% confidence interval. When ndenotes number of failures and t the exposure value the uncertainty of the estimate, is given by: If the number of failures n > 0, a 90% confidence interval is calculated by: Lower limit: L
12 0.95, 2n = λ χτ
Upper limit: H1
2 0.05, 2(n+1) = λ χτ
If the number of failures n = 0, a 90% confidence interval is calculated by: Lower limit: L = 0λ
Blowout Prevention E&P Forum QRA Datasheet Directory Rev 0
13/06/03 BLWOUTPR.DOC Page 12
Upper limit: H1
2 0.10, 2 = λ χτ
where ce,z denotes the upper 100 % percentile of the Chi-squared distribution with z degrees of freedom. The meaning with the 90% confidence intervals is that the frequencies are a member of the interval with a probability of 90%, i.e., the probability that the frequency is lying outside the interval is 10%. 4.1.1.8 Comparative statistics When reviewing all the data from Phase I to Phase V of the study it is observed that subsea BOP reliability has improved during the 1980’s. Therefore Phase V of the study is more likely to represent the subsea BOP reliability today than the previous study. The OREDA Handbook, 2nd edition [5] does also include subsea BOP reliability data. These data were transferred from the first edition of the OREDA Handbook. The basis for the reliability data in this book is a subset of the subsea BOP reliability data collected during Phase II of the subsea BOP reliability project. Due to the above mentioned reliability improvement, these data are thereby not as relevant as the data presented here. 4.2 Key data, Surface BOP systems 4.2.1 Data Tables Two main types of failure data are presented: - installation failure - failure during operation An installation failure is a failure observed during the installation test, i.e., the test after installing the BOP the first time or after subsequent installations. If pipe rams have been changed, the test of the changed ram is also regarded as an installation test. Installation failures will generally not represent a threat to safety. Failures during operation may represent a threat to safety, depending on the failure mode. These are failures observed during regular testing or during drilling operations. The surface BOP reliability data (/6/) has been collected by reviewing daily drilling reports for 53 development wells drilled from three different North Sea platforms in the period 1987 - 1991.
When drilling a development well, normally a Low Pressure BOP is used for the shallow section of the well and a High Pressure (HP) BOP is used for the deeper sections of the well. The low pressure stacks were typically approximately 21 inches and rated to 2000 or 3000 psi of pressure. The high pressure stacks were typically 13 5/8 inches and rated to 5000 or 10 000 psi of pressure. In total three low pressure stacks and three high pressure stacks were included in the study.
Blowout Prevention E&P Forum QRA Datasheet Directory Rev 0
13/06/03 BLWOUTPR.DOC Page 13
Table 4.4 presents an overview of surface BOP item specific no. of failures and down times.
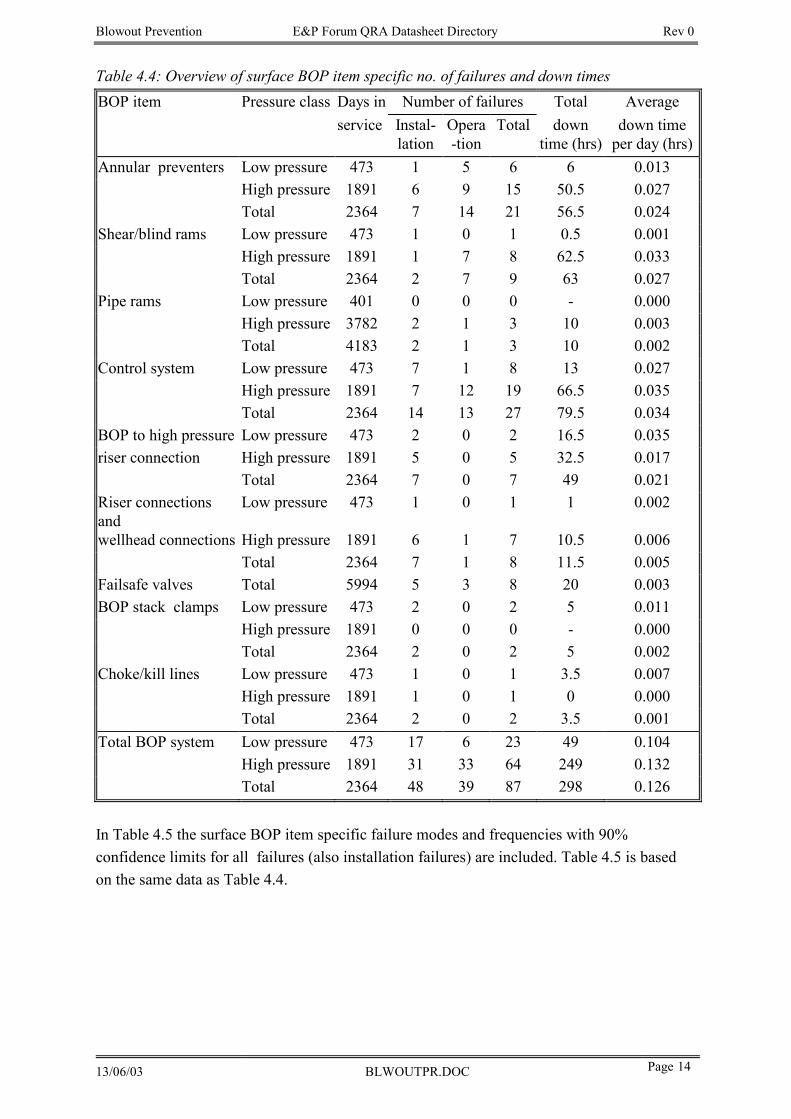
Blowout Prevention E&P Forum QRA Datasheet Directory Rev 0
13/06/03 BLWOUTPR.DOC Page 14
Table 4.4: Overview of surface BOP item specific no. of failures and down times BOP item Pressure class Days in Number of failures Total Average
service Instal-lation
Opera-tion
Total down time (hrs)
down time per day (hrs)
Annular preventers Low pressure 473 1 5 6 6 0.013 High pressure 1891 6 9 15 50.5 0.027 Total 2364 7 14 21 56.5 0.024
Shear/blind rams Low pressure 473 1 0 1 0.5 0.001 High pressure 1891 1 7 8 62.5 0.033 Total 2364 2 7 9 63 0.027
Pipe rams Low pressure 401 0 0 0 - 0.000 High pressure 3782 2 1 3 10 0.003 Total 4183 2 1 3 10 0.002
Control system Low pressure 473 7 1 8 13 0.027 High pressure 1891 7 12 19 66.5 0.035 Total 2364 14 13 27 79.5 0.034
BOP to high pressure Low pressure 473 2 0 2 16.5 0.035 riser connection High pressure 1891 5 0 5 32.5 0.017
Total 2364 7 0 7 49 0.021 Riser connections and
Low pressure 473 1 0 1 1 0.002
wellhead connections High pressure 1891 6 1 7 10.5 0.006 Total 2364 7 1 8 11.5 0.005
Failsafe valves Total 5994 5 3 8 20 0.003 BOP stack clamps Low pressure 473 2 0 2 5 0.011
High pressure 1891 0 0 0 - 0.000 Total 2364 2 0 2 5 0.002
Choke/kill lines Low pressure 473 1 0 1 3.5 0.007 High pressure 1891 1 0 1 0 0.000 Total 2364 2 0 2 3.5 0.001
Total BOP system Low pressure 473 17 6 23 49 0.104 High pressure 1891 31 33 64 249 0.132 Total 2364 48 39 87 298 0.126
In Table 4.5 the surface BOP item specific failure modes and frequencies with 90% confidence limits for all failures (also installation failures) are included. Table 4.5 is based on the same data as Table 4.4.
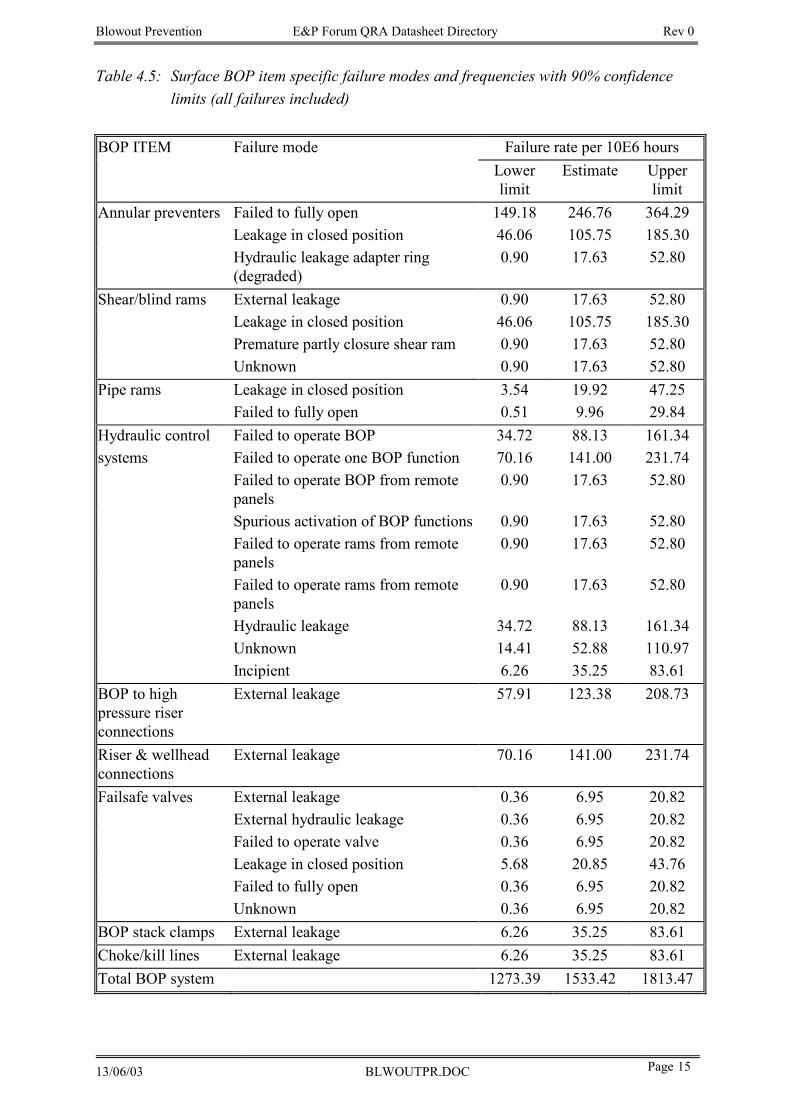
Blowout Prevention E&P Forum QRA Datasheet Directory Rev 0
13/06/03 BLWOUTPR.DOC Page 15
Table 4.5: Surface BOP item specific failure modes and frequencies with 90% confidence limits (all failures included)
BOP ITEM Failure mode Failure rate per 10E6 hours
Lower limit
Estimate Upper limit
Annular preventers Failed to fully open 149.18 246.76 364.29 Leakage in closed position 46.06 105.75 185.30 Hydraulic leakage adapter ring (degraded)
0.90 17.63 52.80
Shear/blind rams External leakage 0.90 17.63 52.80 Leakage in closed position 46.06 105.75 185.30 Premature partly closure shear ram 0.90 17.63 52.80 Unknown 0.90 17.63 52.80
Pipe rams Leakage in closed position 3.54 19.92 47.25 Failed to fully open 0.51 9.96 29.84
Hydraulic control Failed to operate BOP 34.72 88.13 161.34 systems Failed to operate one BOP function 70.16 141.00 231.74
Failed to operate BOP from remote panels
0.90 17.63 52.80
Spurious activation of BOP functions 0.90 17.63 52.80 Failed to operate rams from remote panels
0.90 17.63 52.80
Failed to operate rams from remote panels
0.90 17.63 52.80
Hydraulic leakage 34.72 88.13 161.34 Unknown 14.41 52.88 110.97 Incipient 6.26 35.25 83.61
BOP to high pressure riser connections
External leakage 57.91 123.38 208.73
Riser & wellhead connections
External leakage 70.16 141.00 231.74
Failsafe valves External leakage 0.36 6.95 20.82 External hydraulic leakage 0.36 6.95 20.82 Failed to operate valve 0.36 6.95 20.82 Leakage in closed position 5.68 20.85 43.76 Failed to fully open 0.36 6.95 20.82 Unknown 0.36 6.95 20.82
BOP stack clamps External leakage 6.26 35.25 83.61 Choke/kill lines External leakage 6.26 35.25 83.61 Total BOP system 1273.39 1533.42 1813.47
Blowout Prevention E&P Forum QRA Datasheet Directory Rev 0
13/06/03 BLWOUTPR.DOC Page 16
Overall Comments to the BOP Reliability Failure probability For surface BOPs, more than 50% of the BOP failures observed are installation failures. Installation failures have been observed for all the BOP component/subsystems. Nearly all failures observed on the HP riser and connections to BOP and wellhead are observed during installation testing. These failures are rare during normal operations. In addition, a relatively large percentage of the failures of the other components is observed during installation testing. If not taking failure criticality into consideration when comparing the overall Mean Time Between Failures (MTBFs) for surface BOPs with the overall MTBFs for subsea BOPs (including installation failures), it is observed that surface BOPs fail more often than subsea BOPs. If disregarding the installation failures for both subsea and surface BOPs, surface BOPs also fail more often. The annular preventers, the control system and the shear/blind rams are responsible for the majority of the BOP failures when disregarding the installation failures. Downtime caused by BOP failures The total downtime caused by BOP failures is nearly 300 hours. The installation failures caused approximately 50% of this downtime. Compared to subsea BOPs the average downtime per day in service is low. For subsea BOPs the average downtime caused by BOP failures were 0.81 hours per BOP day in service (/1/), and for surface BOPs it is 0.13 hours per BOP day in service. This difference is reasonable since maintenance actions on surface BOPs are significantly easier to carry out than on subsea BOPs. The shear/blind rams, the control system and the annular preventers are responsible for the majority of the downtime caused by BOP failures when disregarding the installation failures. Failure criticality Several failures of a BOP barrier were observed for the surface BOPs. Such failures seldom occur on subsea BOPs. These failures were: - BOP control system failed to operate one or several BOP functions - Shear/blind rams leaked in closed position (4 failures) - Annular preventers leaked in closed position (5 failures)
Blowout Prevention E&P Forum QRA Datasheet Directory Rev 0
13/06/03 BLWOUTPR.DOC Page 17
The main reasons for the relatively high frequency of the above failures are believed to be: - One of the observed operators has a control system with very low reliability - Surface BOP control systems have no redundancy (subsea BOP control has a lot of
redundancy) - Inadequate preventive maintenance or weak design of one of the shear/blind ram
preventers - Inadequate preventive maintenance of annular preventers For surface BOPs, more than 50% of the BOP failures observed are installation failures. Installation failures have been observed for all the BOP component/subsystems. Nearly all failures observed on the HP riser and connections to BOP and wellhead are observed during installation testing. These failures are rare during normal operations. In addition, a relatively large percentage of the failures of the other components is observed during installation testing. 4.2.1.1 Data Source The reliability data included is from reference /6/ Holand, P. “Reliability of Surface Blow-out preventers (BOPs)” STF75 A91037 In total 53 wells were included in the data collection study. 35 of these wells were new wells, while the remaining 18 wells were redrilled (side-tracking old well) . When collecting reliability data only the well "drilling" period has been included. The well "drilling" period for the two well types is defined in Figure 4.1. As seen from Figure 4.1, the period where completion activities are carried out is not included. Further, for redrilled wells the period where the tubing is pulled and the old casing is pulled or milled is not included (milling window in old casing is included). Note that for some redrilled wells also the 13 5/8" casing is pulled or milled out. For these redrilled wells the low pressure BOP (LP BOP) stacks are used when drilling the hole for the new 13 5/8" casing. This period is hence included in the data material (not included in Figure 4.1). The BOP operational periods refer to the periods where the HP BOPs and/or the LP BOPs have been used within the drilling period defined in Figure 4.1.
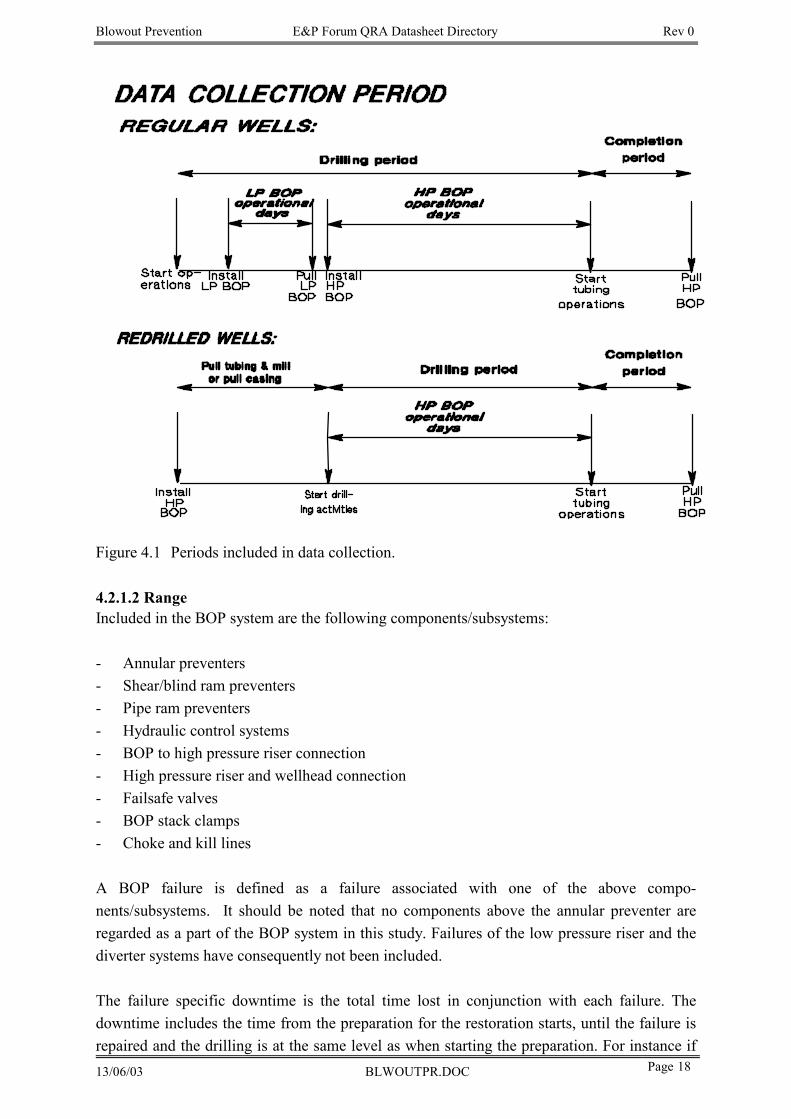
Blowout Prevention E&P Forum QRA Datasheet Directory Rev 0
13/06/03 BLWOUTPR.DOC Page 18
Figure 4.1 Periods included in data collection. 4.2.1.2 Range Included in the BOP system are the following components/subsystems: - Annular preventers - Shear/blind ram preventers - Pipe ram preventers - Hydraulic control systems - BOP to high pressure riser connection - High pressure riser and wellhead connection - Failsafe valves - BOP stack clamps - Choke and kill lines A BOP failure is defined as a failure associated with one of the above compo-nents/subsystems. It should be noted that no components above the annular preventer are regarded as a part of the BOP system in this study. Failures of the low pressure riser and the diverter systems have consequently not been included. The failure specific downtime is the total time lost in conjunction with each failure. The downtime includes the time from the preparation for the restoration starts, until the failure is repaired and the drilling is at the same level as when starting the preparation. For instance if
Blowout Prevention E&P Forum QRA Datasheet Directory Rev 0
13/06/03 BLWOUTPR.DOC Page 19
the BOP failure requires the BOP to be disconnected, the time included to set and drill the cement plugs, are included in the downtime. Downtime is the total drilling time lost in connection with restoring a BOP failure. To assess the failure criticality with respect to blow-out safety it has been recorded whether the failure was observed during "normal" BOP testing/operation or during the installation test. 4.2.1.3 Availability Data about the BOP failures is not easily available from any public or oil company sources. This type of information has to be collected one by one from the oil companies/drilling contractor files. 4.2.1.4 Strengths The data presented here is the only reliability data regarding surface BOP reliability. 4.2.1.5 Limitations The failure data has been collected during normal drilling operation, i.e., they have not been collected for situations were the BOPs have needed to act to close in a well kick. 4.2.1.6 Applicability The surface BOP reliability data can be used as input for drilling risk analyses. 4.2.1.7 Estimating frequencies See section 4.1.1.7. 4.2.1.8 Comparative Statistics Not relevant
4.3 Key Data, Downhole Safety Valves (DHSV/SCSSV) The surface controlled subsurface safety valve (SCSSV) in a normal production well completion is considered the most important primary safety barrier. The SCSSV is frequently also called a downhole safety valve (DHSV). The objective of the SINTEF studies on SCSSVs has been to collect and analyse data with the view of obtaining reliability improvement and provide reliability data for risk and reliability analysis. The results include MTTF estimates for all major valve models from the different manufacturers, failure mode distributions and a discussion of valve failure mechanisms and failure causes. The SCSSV reliability study has been carried out in four phases since 1983 and is the most comprehensive database in its kind world-wide. Table 4.6 below shows some key historical parameters for these studies.
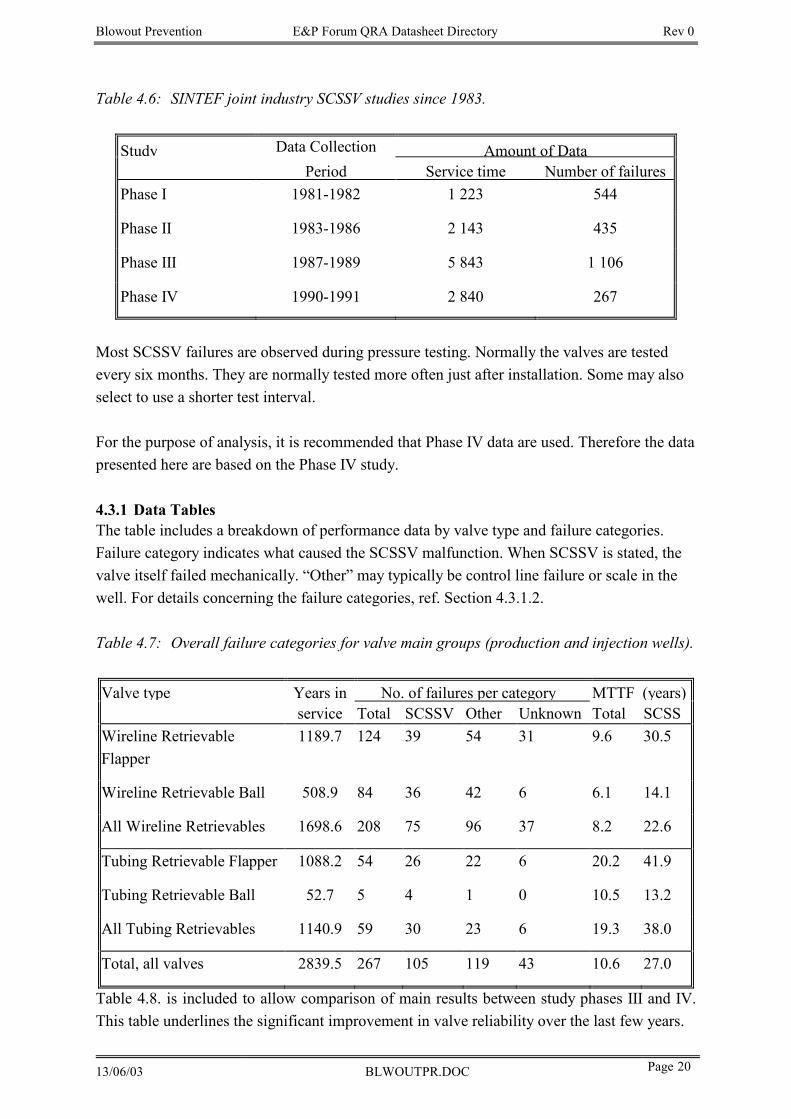
Blowout Prevention E&P Forum QRA Datasheet Directory Rev 0
13/06/03 BLWOUTPR.DOC Page 20
Table 4.6: SINTEF joint industry SCSSV studies since 1983.
Study Data Collection Amount of DataPeriod Service time Number of failures
Phase I 1981-1982 1 223 544
Phase II 1983-1986 2 143 435
Phase III 1987-1989 5 843 1 106
Phase IV 1990-1991 2 840 267
Most SCSSV failures are observed during pressure testing. Normally the valves are tested every six months. They are normally tested more often just after installation. Some may also select to use a shorter test interval. For the purpose of analysis, it is recommended that Phase IV data are used. Therefore the data presented here are based on the Phase IV study. 4.3.1 Data Tables The table includes a breakdown of performance data by valve type and failure categories. Failure category indicates what caused the SCSSV malfunction. When SCSSV is stated, the valve itself failed mechanically. “Other” may typically be control line failure or scale in the well. For details concerning the failure categories, ref. Section 4.3.1.2. Table 4.7: Overall failure categories for valve main groups (production and injection wells).
Valve type Years in No. of failures per category MTTF (years)service Total SCSSV Other Unknown Total SCSS
Wireline Retrievable Flapper
1189.7 124 39 54 31 9.6 30.5
Wireline Retrievable Ball 508.9 84 36 42 6 6.1 14.1
All Wireline Retrievables 1698.6 208 75 96 37 8.2 22.6
Tubing Retrievable Flapper 1088.2 54 26 22 6 20.2 41.9
Tubing Retrievable Ball 52.7 5 4 1 0 10.5 13.2
All Tubing Retrievables 1140.9 59 30 23 6 19.3 38.0
Total, all valves 2839.5 267 105 119 43 10.6 27.0
Table 4.8. is included to allow comparison of main results between study phases III and IV. This table underlines the significant improvement in valve reliability over the last few years.
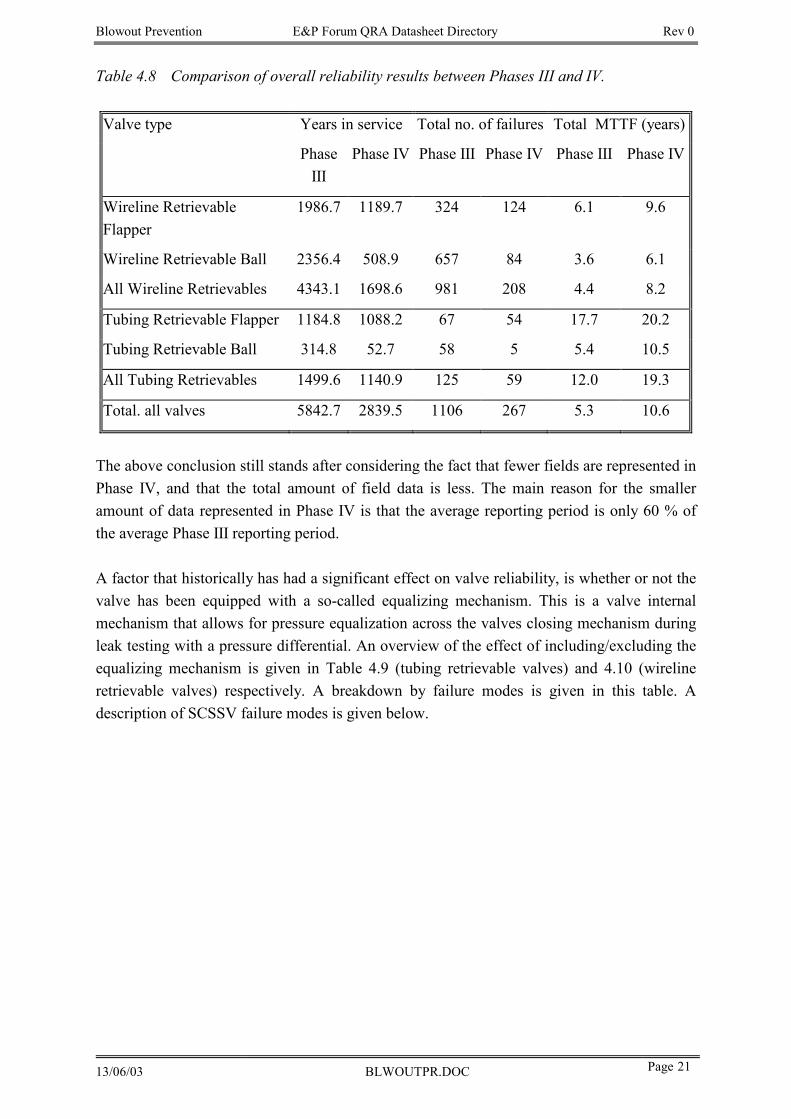
Blowout Prevention E&P Forum QRA Datasheet Directory Rev 0
13/06/03 BLWOUTPR.DOC Page 21
Table 4.8 Comparison of overall reliability results between Phases III and IV. Valve type Years in service Total no. of failures Total MTTF (years)
Phase III
Phase IV Phase III Phase IV Phase III Phase IV
Wireline Retrievable Flapper
1986.7 1189.7 324 124 6.1 9.6
Wireline Retrievable Ball 2356.4 508.9 657 84 3.6 6.1
All Wireline Retrievables 4343.1 1698.6 981 208 4.4 8.2
Tubing Retrievable Flapper 1184.8 1088.2 67 54 17.7 20.2
Tubing Retrievable Ball 314.8 52.7 58 5 5.4 10.5
All Tubing Retrievables 1499.6 1140.9 125 59 12.0 19.3
Total. all valves 5842.7 2839.5 1106 267 5.3 10.6
The above conclusion still stands after considering the fact that fewer fields are represented in Phase IV, and that the total amount of field data is less. The main reason for the smaller amount of data represented in Phase IV is that the average reporting period is only 60 % of the average Phase III reporting period. A factor that historically has had a significant effect on valve reliability, is whether or not the valve has been equipped with a so-called equalizing mechanism. This is a valve internal mechanism that allows for pressure equalization across the valves closing mechanism during leak testing with a pressure differential. An overview of the effect of including/excluding the equalizing mechanism is given in Table 4.9 (tubing retrievable valves) and 4.10 (wireline retrievable valves) respectively. A breakdown by failure modes is given in this table. A description of SCSSV failure modes is given below.
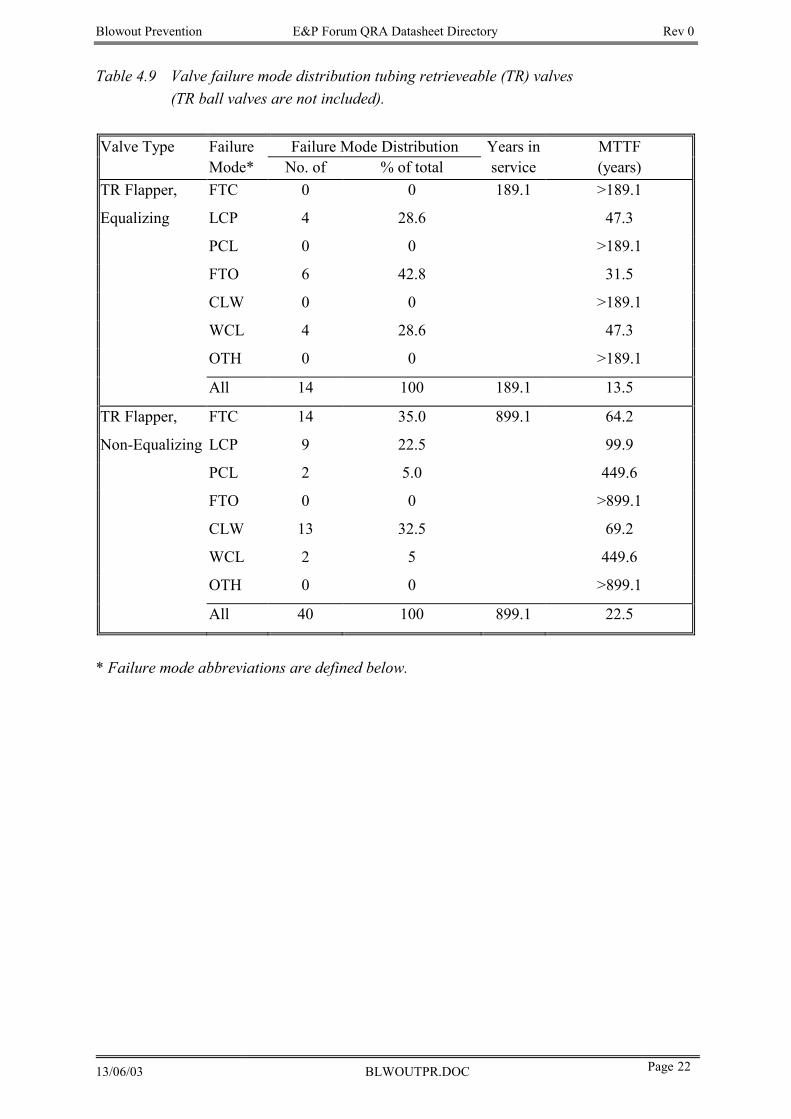
Blowout Prevention E&P Forum QRA Datasheet Directory Rev 0
13/06/03 BLWOUTPR.DOC Page 22
Table 4.9 Valve failure mode distribution tubing retrieveable (TR) valves (TR ball valves are not included). Valve Type Failure Failure Mode Distribution Years in MTTF
Mode* No. of % of total service (years) TR Flapper, FTC 0 0 189.1 >189.1
Equalizing LCP 4 28.6 47.3
PCL 0 0 >189.1
FTO 6 42.8 31.5
CLW 0 0 >189.1
WCL 4 28.6 47.3
OTH 0 0 >189.1
All 14 100 189.1 13.5
TR Flapper, FTC 14 35.0 899.1 64.2
Non-Equalizing LCP 9 22.5 99.9
PCL 2 5.0 449.6
FTO 0 0 >899.1
CLW 13 32.5 69.2
WCL 2 5 449.6
OTH 0 0 >899.1
All 40 100 899.1 22.5
* Failure mode abbreviations are defined below.
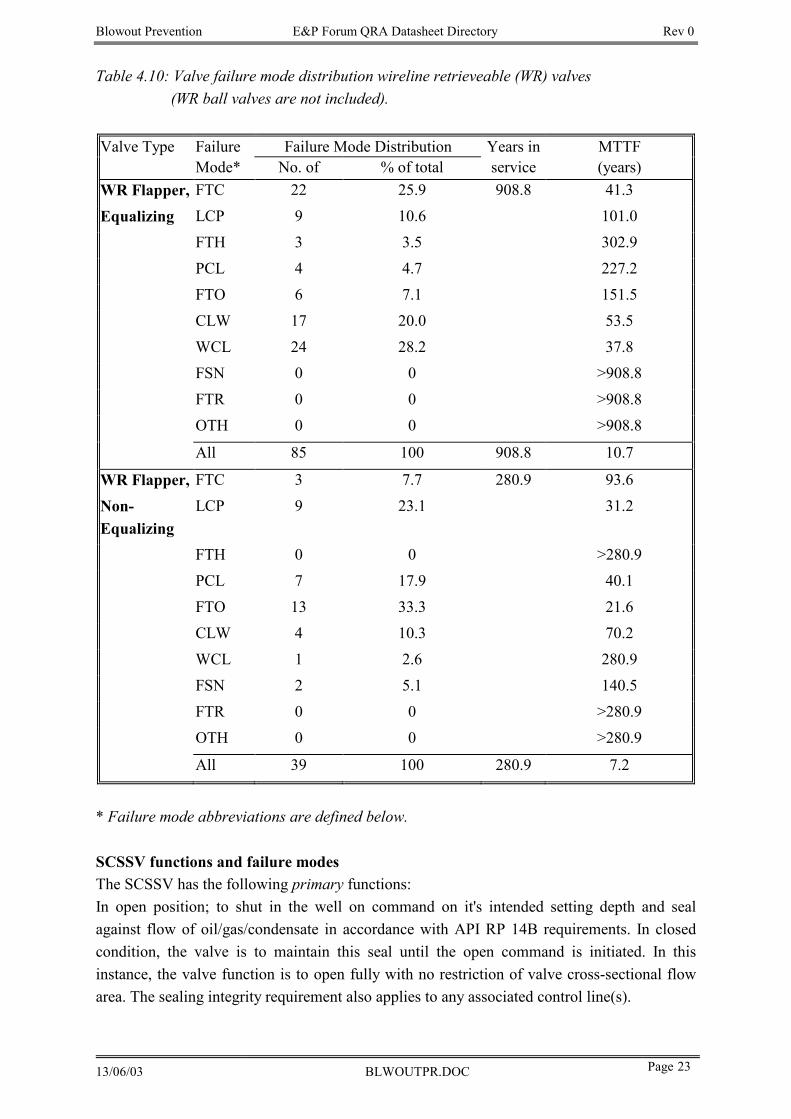
Blowout Prevention E&P Forum QRA Datasheet Directory Rev 0
13/06/03 BLWOUTPR.DOC Page 23
Table 4.10: Valve failure mode distribution wireline retrieveable (WR) valves (WR ball valves are not included). Valve Type Failure Failure Mode Distribution Years in MTTF
Mode* No. of % of total service (years) WR Flapper, FTC 22 25.9 908.8 41.3
Equalizing LCP 9 10.6 101.0
FTH 3 3.5 302.9
PCL 4 4.7 227.2
FTO 6 7.1 151.5
CLW 17 20.0 53.5
WCL 24 28.2 37.8
FSN 0 0 >908.8
FTR 0 0 >908.8
OTH 0 0 >908.8
All 85 100 908.8 10.7
WR Flapper, FTC 3 7.7 280.9 93.6
Non-Equalizing
LCP 9 23.1 31.2
FTH 0 0 >280.9
PCL 7 17.9 40.1
FTO 13 33.3 21.6
CLW 4 10.3 70.2
WCL 1 2.6 280.9
FSN 2 5.1 140.5
FTR 0 0 >280.9
OTH 0 0 >280.9
All 39 100 280.9 7.2
* Failure mode abbreviations are defined below. SCSSV functions and failure modes The SCSSV has the following primary functions: In open position; to shut in the well on command on it's intended setting depth and seal against flow of oil/gas/condensate in accordance with API RP 14B requirements. In closed condition, the valve is to maintain this seal until the open command is initiated. In this instance, the valve function is to open fully with no restriction of valve cross-sectional flow area. The sealing integrity requirement also applies to any associated control line(s).
Blowout Prevention E&P Forum QRA Datasheet Directory Rev 0
13/06/03 BLWOUTPR.DOC Page 24
Also, secondary functions may be integrated into the valve. The objective of these secondary functions is to transfer the valve to a state where the primary functions are restored. Examples of such secondary functions are: • Temporary lockout • Permanent lockout • Accommodating and establishing control fluid communication with insert valve This defines the following failure modes relating to the primary and secondary valve functions: Primary function failure modesWith the valve in open position, the following failure modes apply: • Failure to close on command (FTC) • Premature closure of valve (PCL) • Control line to well communication (CLW) • Fail to set in nipple (FSN) The following failure modes apply with the valve closed: • Leakage in closed position (LCP) • Failure to open on command (FTO) • Well to control line communication (WCL) • Fail to hold in nipple (FTH) Secondary function failure modesThe following failure modes apply with the valve in open or closed position: • Failure to shift isolation sleeve • Premature shifting of isolation sleeve • Inadvertent activation of temporarily locked-out valve • Inadvertent closure of permanently locked out valve • Inadvertent permanent lockout • Failure to activate the valve remotely • Failure to activate the valve by wireline tools • Failure to lockout the valve remotely • Failure to lockout the valve by wireline tools • Failure to release lock (FTR) All SCSSV failures, where either the primary or secondary function of the valve is affected are registered in the SINTEF studies. In general, if multiple failures are experienced, e.g. a LCP failure followed by a FTO failure during testing, the most critical detected failure is quoted. This is justified from the primary function definition for the valve. However, it is
Blowout Prevention E&P Forum QRA Datasheet Directory Rev 0
13/06/03 BLWOUTPR.DOC Page 25
suggested that all verified failures are reported in cases where multiple failures are observed. Note also that in cases of multiple failures on one valve, only one failure will be registered for calculations of failure rates/MTTF. The failure reporting format in SINTEFs SCSSV software uses primary function failure modes. Phase IV has identified a great number of failures that can be directly related to valve secondary functions, typically frequent failures of the communication feature for WR valves that is included in many TR valves. 4.3.1.1 Data source The reliability data included is from /9/ Molnes, E., Sundet, I., Vatn, J.: "Reliability of Surface Controlled Subsurface Safety Valves -Phase IV". SINTEF Report STF75 F91038. 4.3.1.2 Range Unless otherwise explicitly stated in result presentation tables, the SCSSV reliability data covers the entire SCSSV system, including: • Surface control system • Control line(s) • Valve including actuating mechanism • Lock (wireline retrievable valves only) • Lockout/insert valve mechanism and communication feature (when applicable) • Equalizing mechanism (when applicable) In some cases, result presentation tables are split into the following failure categories: • SCSSV failures • Other • Unknown The category SCSSV failures includes cases where the failure is directly attributable to the valve itself. The Other category includes the following cases: • Control line leak/blockage • Other control system failure • Wireline job/tool induced failure • Other operation induced failure • Scale • Other well deposits • Nipple/lock failure • Human failure SCSSV malfunctions where no information with respect to failure cause exist, have been classified as unknown. These may contain hidden information on any one of the other failure classes.
Blowout Prevention E&P Forum QRA Datasheet Directory Rev 0
13/06/03 BLWOUTPR.DOC Page 26
When evaluating SCSSV system performance, e.g., in safety and reliability studies, it is important to base calculations on the total, observed failure rate - irrespective of failure class. When comparing valve specific performance, both total and SCSSV related MTTF should be considered. Detailed information for such comparisons can be found in /8/, or in the more recent /9/. 4.3.1.3 Availability The data has been collected directly from oil companies with subsequent input from SCSSV manufacturers through joint industry research projects. The processed reliability data are initially released on a limited availability basis to the funding oil companies and manufacturers involved. After a confidentiality period of three years, the data became publicly available. A similar publication philosophy is likely also for future SINTEF studies on SCSSV (and other well completion equipment) reliability. 4.3.1.4 Strengths The SCSSV data presented herein is the most comprehensive data source known for this item world-wide. The close interaction with the contributing oil companies and the manufacturers during data collection and analysis greatly adds to the quality of these results. 4.3.1.5 Limitations The data has been analysed assuming that the exponential distribution applies. This assumption holds considering the data as a whole, and for large samples of data. However, when looking at data layers in isolation, data subsets can be found where the Weibull distribution more accurately reflects the failure distribution. This is typically the case in situations where extreme corrosion is present, showing a distinct wear-out effect on the lifetime of the valves. 4.3.1.6 Applicability The SCSSV reliability data can be used as input to risk analysis for production installations, as well as for conceptual comparison of alternative SCSSV configurations. To allow for more detailed comparison between specific SCSSV models/makes, refer to /9/.
Blowout Prevention E&P Forum QRA Datasheet Directory Rev 0
13/06/03 BLWOUTPR.DOC Page 27
4.3.1.7 Estimating frequencies The MTTF values given in Tables 4.7 - 4.10 can be transformed to Failure rate per 10E6 hours by the following expression: Failure rate per 10E6 hours = 10E6 / (MTTF * 24 * 365)
4.3.1.8 Comparative statistics None Relevant.
5. ONGOING RESEARCH The fall 1995 SINTEF will start a new project concerning reliability of deep-water subsea BOPs. The project “Reliability of Well Completion Equipment - Phase II” is currently ongoing, with funding from 13 oil companies. The report including the latest updated SCSSV reliability statistics is scheduled for release at the end of October 1995. A three year confidentiality clause applies for this report, causing the report to be available to the public from October 1998. This project will include reliability data also for other vital completion equipment, such as tubing hangers, annulus safety systems, production packers, seal assemblies, etc.
Blowout Prevention E&P Forum QRA Datasheet Directory Rev 0
13/06/03 BLWOUTPR.DOC Page 28
REFERENCES
1. Holand, P.: “Subsea BOP Systems, Reliability and Testing Phase V, revision 1" SINTEF report STF 75 A89054, Trondheim, Norway 1995
2. Holand, P.: "Subsea Blow-out-Preventer Systems: Reliability and testing". SPE Drilling
Engineering, SPE 17083, December 1991 3. Holand, P.: "Reliability of Subsea BOP Systems". IADC, European Well Conference, June
11 - 13 1991, Stavanger 4. Rausand, M., Engen, G.: "Reliability of Subsea BOP Systems". OTC 4444 Offshore
Technology Conference, Houston 1983. 5. “OREDA, Offshore Reliability Data, 2nd edition", DNV Technica, Høvik, Norway 1992 6. Holand, P. “Reliability of Surface Blow-out preventers (BOPs)” STF75 A91037 7. Holand, P. "Offshore Blow-outs, Data for Riak Assessment" ASME paper no. OMAE - 95
- 133, presented at the OMAE conference in Copenhagen, June 18 - 24, 1995 8. Molnes, E., et.al.: "Reliability of Surface Controlled Subsurface Safety Valves - Phase III".
SINTEF Report STF75 F89030. 9. Molnes, E., Sundet, I., Vatn, J.: "Reliability of Surface Controlled Subsurface Safety
Valves -Phase IV". SINTEF Report STF75 F91038.
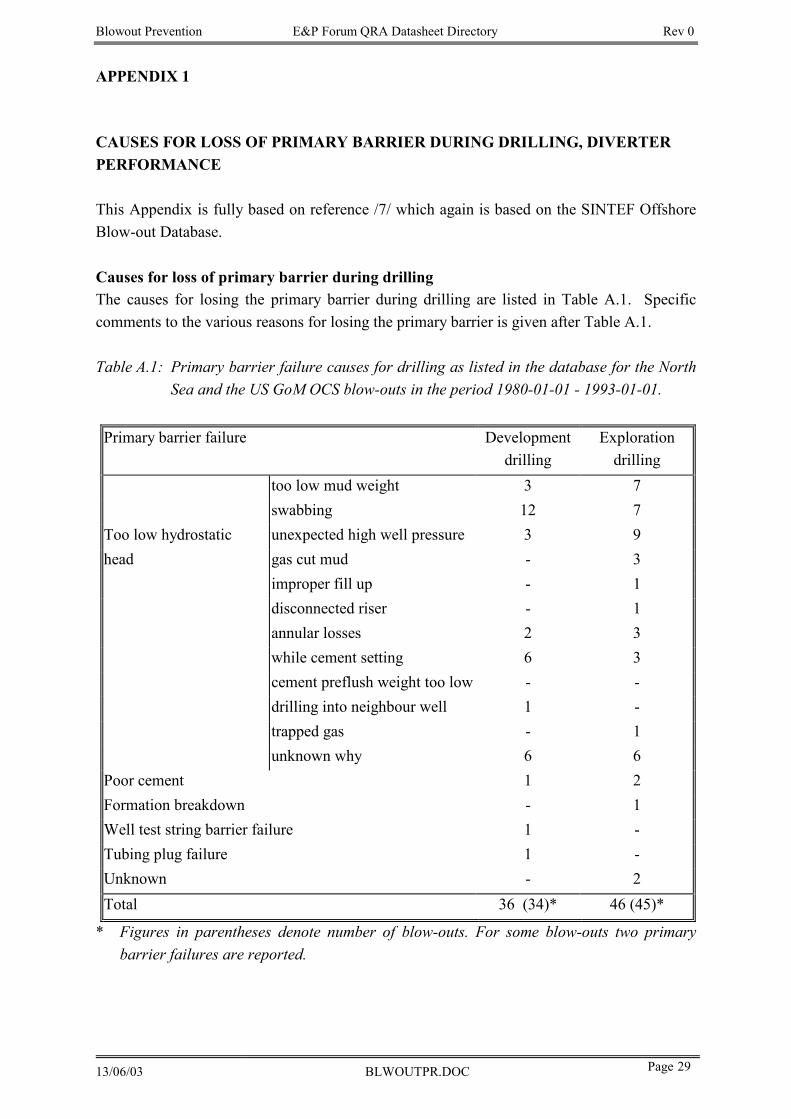
Blowout Prevention E&P Forum QRA Datasheet Directory Rev 0
13/06/03 BLWOUTPR.DOC Page 29
APPENDIX 1
CAUSES FOR LOSS OF PRIMARY BARRIER DURING DRILLING, DIVERTER PERFORMANCE
This Appendix is fully based on reference /7/ which again is based on the SINTEF Offshore Blow-out Database. Causes for loss of primary barrier during drilling The causes for losing the primary barrier during drilling are listed in Table A.1. Specific comments to the various reasons for losing the primary barrier is given after Table A.1. Table A.1: Primary barrier failure causes for drilling as listed in the database for the North Sea and the US GoM OCS blow-outs in the period 1980-01-01 - 1993-01-01. Primary barrier failure Development
drilling Exploration
drilling too low mud weight 3 7 swabbing 12 7
Too low hydrostatic unexpected high well pressure 3 9 head gas cut mud - 3
improper fill up - 1 disconnected riser - 1 annular losses 2 3 while cement setting 6 3 cement preflush weight too low - -drilling into neighbour well 1 - trapped gas - 1 unknown why 6 6
Poor cement 1 2 Formation breakdown - 1 Well test string barrier failure 1 - Tubing plug failure 1 - Unknown - 2 Total 36 (34)* 46 (45)*
* Figures in parentheses denote number of blow-outs. For some blow-outs two primary barrier failures are reported.
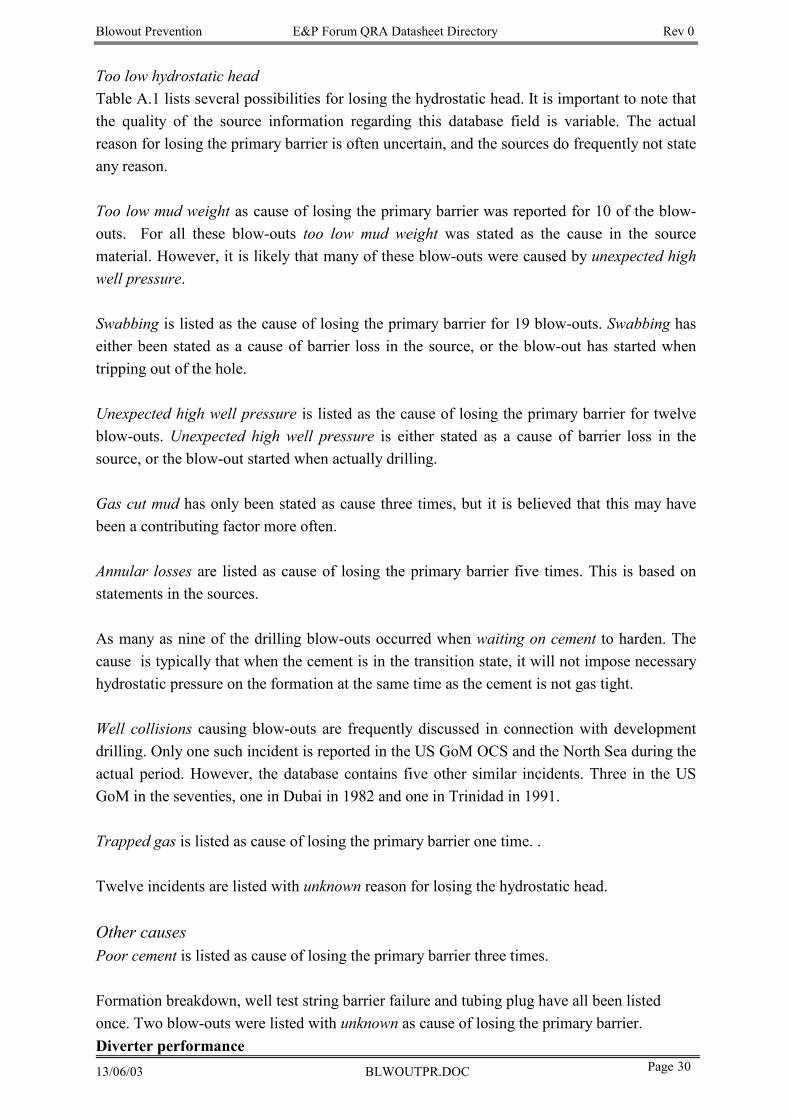
Blowout Prevention E&P Forum QRA Datasheet Directory Rev 0
13/06/03 BLWOUTPR.DOC Page 30
Too low hydrostatic head Table A.1 lists several possibilities for losing the hydrostatic head. It is important to note that the quality of the source information regarding this database field is variable. The actual reason for losing the primary barrier is often uncertain, and the sources do frequently not state any reason. Too low mud weight as cause of losing the primary barrier was reported for 10 of the blow-outs. For all these blow-outs too low mud weight was stated as the cause in the source material. However, it is likely that many of these blow-outs were caused by unexpected high well pressure.
Swabbing is listed as the cause of losing the primary barrier for 19 blow-outs. Swabbing has either been stated as a cause of barrier loss in the source, or the blow-out has started when tripping out of the hole. Unexpected high well pressure is listed as the cause of losing the primary barrier for twelve blow-outs. Unexpected high well pressure is either stated as a cause of barrier loss in the source, or the blow-out started when actually drilling. Gas cut mud has only been stated as cause three times, but it is believed that this may have been a contributing factor more often. Annular losses are listed as cause of losing the primary barrier five times. This is based on statements in the sources. As many as nine of the drilling blow-outs occurred when waiting on cement to harden. The cause is typically that when the cement is in the transition state, it will not impose necessary hydrostatic pressure on the formation at the same time as the cement is not gas tight. Well collisions causing blow-outs are frequently discussed in connection with development drilling. Only one such incident is reported in the US GoM OCS and the North Sea during the actual period. However, the database contains five other similar incidents. Three in the US GoM in the seventies, one in Dubai in 1982 and one in Trinidad in 1991. Trapped gas is listed as cause of losing the primary barrier one time. . Twelve incidents are listed with unknown reason for losing the hydrostatic head. Other causes Poor cement is listed as cause of losing the primary barrier three times. Formation breakdown, well test string barrier failure and tubing plug have all been listed once. Two blow-outs were listed with unknown as cause of losing the primary barrier. Diverter performance
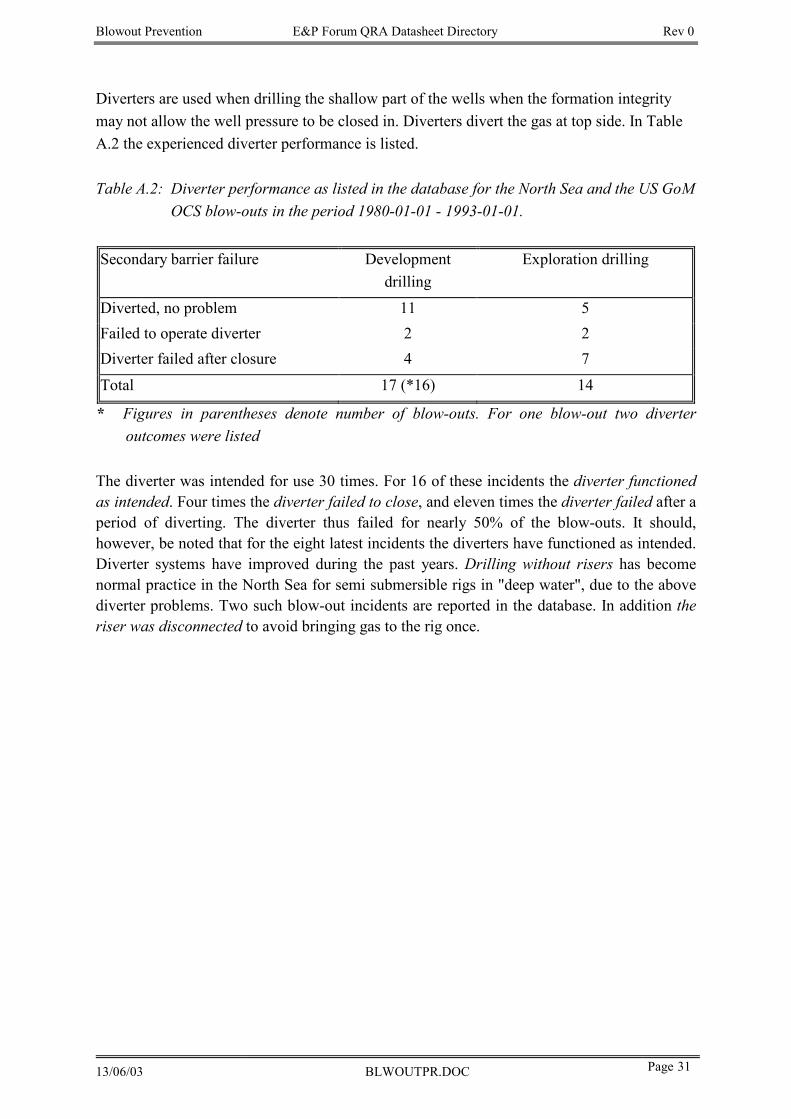
Blowout Prevention E&P Forum QRA Datasheet Directory Rev 0
13/06/03 BLWOUTPR.DOC Page 31
Diverters are used when drilling the shallow part of the wells when the formation integrity may not allow the well pressure to be closed in. Diverters divert the gas at top side. In Table A.2 the experienced diverter performance is listed. Table A.2: Diverter performance as listed in the database for the North Sea and the US GoM OCS blow-outs in the period 1980-01-01 - 1993-01-01. Secondary barrier failure Development
drilling Exploration drilling
Diverted, no problem 11 5 Failed to operate diverter 2 2 Diverter failed after closure 4 7
Total 17 (*16) 14
* Figures in parentheses denote number of blow-outs. For one blow-out two diverter outcomes were listed
The diverter was intended for use 30 times. For 16 of these incidents the diverter functioned as intended. Four times the diverter failed to close, and eleven times the diverter failed after a period of diverting. The diverter thus failed for nearly 50% of the blow-outs. It should, however, be noted that for the eight latest incidents the diverters have functioned as intended. Diverter systems have improved during the past years. Drilling without risers has become normal practice in the North Sea for semi submersible rigs in "deep water", due to the above diverter problems. Two such blow-out incidents are reported in the database. In addition the riser was disconnected to avoid bringing gas to the rig once.
Blowout Prevention E&P Forum QRA Datasheet Directory Rev 0
13/06/03 BLWOUTPR.DOC Page 1
Active Fire Protection E&P Forum QRA Directory Rev 0
13/06/2003 FIREPROT.DOC Page 1
ACTIVE FIRE PROTECTION SYSTEMS
Active Fire Protection E&P Forum QRA Directory Rev 0
13/06/2003 FIREPROT.DOC Page 2
TABLE OF CONTENTS
1. INTRODUCTION .............................................................................................3 1.1 Scope ............................................................................................................3
1.2 System and component reliability data limitations ...........................................3 1.3 System failure mechanisms .............................................................................3 1.4 Datasheet limitations ......................................................................................3 1.5 Terminology ..................................................................................................4 1.6 Cross-referencing with other datasheets .........................................................4
2. ACTIVE FIRE PROTECTION SYSTEMS ........................................................5 3. FIREWATER SUPPLY ....................................................................................6 3.1 Pumps ...........................................................................................................6
3.2 Reservoirs .....................................................................................................7 3.3 Generators and motors ..................................................................................7 3.4 Design considerations ....................................................................................8 3.5 Vulnerability to fire/explosion ........................................................................8 4. FIREWATER DISTRIBUTION .......................................................................10 4.1 Valves ..........................................................................................................10 4.2 Mains ...........................................................................................................10 5. FIREWATER APPLICATION ........................................................................11
5.1 Sprinkler systems .........................................................................................11 5.2 Deluge systems ............................................................................................11 5.3 Design considerations .................................................................................11 5.4 Vulnerability to fire/explosion ......................................................................12 6. FOAM SYSTEMS ..........................................................................................13
6.1 Design considerations ...................................................................................13 6.2 Vulnerability to fire/explosion .......................................................................13 7. GASEOUS SYSTEMS ...................................................................................14
7.1 Halon systems ..............................................................................................14 7.2 CO2 systems .................................................................................................14 7.3 Design considerations ...................................................................................14 7.4 Vulnerability to fire/explosion .......................................................................15 8. REFERENCES and BIBLIOGRAPHY ...........................................................16
8.1 References ...................................................................................................16 8.2 Bibliography .................................................................................................16
Active Fire Protection E&P Forum QRA Directory Rev 0
13/06/2003 FIREPROT.DOC Page 3
1. INTRODUCTION
1.1 Scope This datasheet provides information about failure rates of active fire protection systems and their component parts. These include water supply, distribution and application systems, foam mixing and supply systems, and gaseous systems. 1.2 System and component reliability data limitations
The reliability of active fire protection systems is difficult to determine: by their nature they are not routinely operated, and although function testing is likely in most cases to be frequent it will normally be restricted to specific components and not whole systems. In some cases, manufacturers may be a source of reliability data for their systems, although these must obviously be treated with caution. Many of the components used have a wider application than purely in fire protection systems, and consequently more data on reliability are available. However, most of the data presented here are based on limited datasets and the quoted rates have wide confidence limits. Failure rate data for components is generally quoted on a time basis, whereas for fire systems rates are required to be known on a demand basis. Building a picture of overall system reliability from limited data on component parts may introduce errors. 1.3 System failure mechanisms The real test of system reliability is the success rate in extinguishing fires, and this is the information which a risk analyst will be trying to determine. There are several fault mechanisms which may lead to ultimate failure in this respect: • system design. Fires may be outside the design capacity of the extinguishing system,
either intentionally or not. Systems are generally designed to standard codes, not on an assessed risk basis
• management system failure, for example if fire compartments are breached in
modification work and not correctly reinstated • human error may lead to system failure, for example if fire doors are left open • failure caused by the event itself, for example fire impingement on control cables, or
missile damage to pipework in an explosion • component failure. Any of the components of a system may fail and lead to the
ultimate failure of the system. 1.4 Datasheet limitations This datasheet only contains information on failure rates arising from this last failure mechanism. It follows that analysts using these data must exercise caution, and be aware that analyses performed solely on the basis of the figures presented here are unlikely to be complete. Qualitative information is provided for each system on design considerations and vulnerability to fire and explosion to assist the analyst in assessing overall reliability.
Active Fire Protection E&P Forum QRA Directory Rev 0
13/06/2003 FIREPROT.DOC Page 4
1.5 Terminology The terms used in this datasheet have the following meanings: • failure per demand - fail to start/operate when required • failure per 106 operating hours - fail whilst running/operating • failure per 106 (calendar) hours - all failures. 1.6 Cross-referencing with other datasheets As noted in paragraph 1.2, many of the components of fire protection systems are used in other systems. The following datasheets may provide additional information for the particular system under assessment: • Storage tanks • Process releases • Vulnerability of plant.
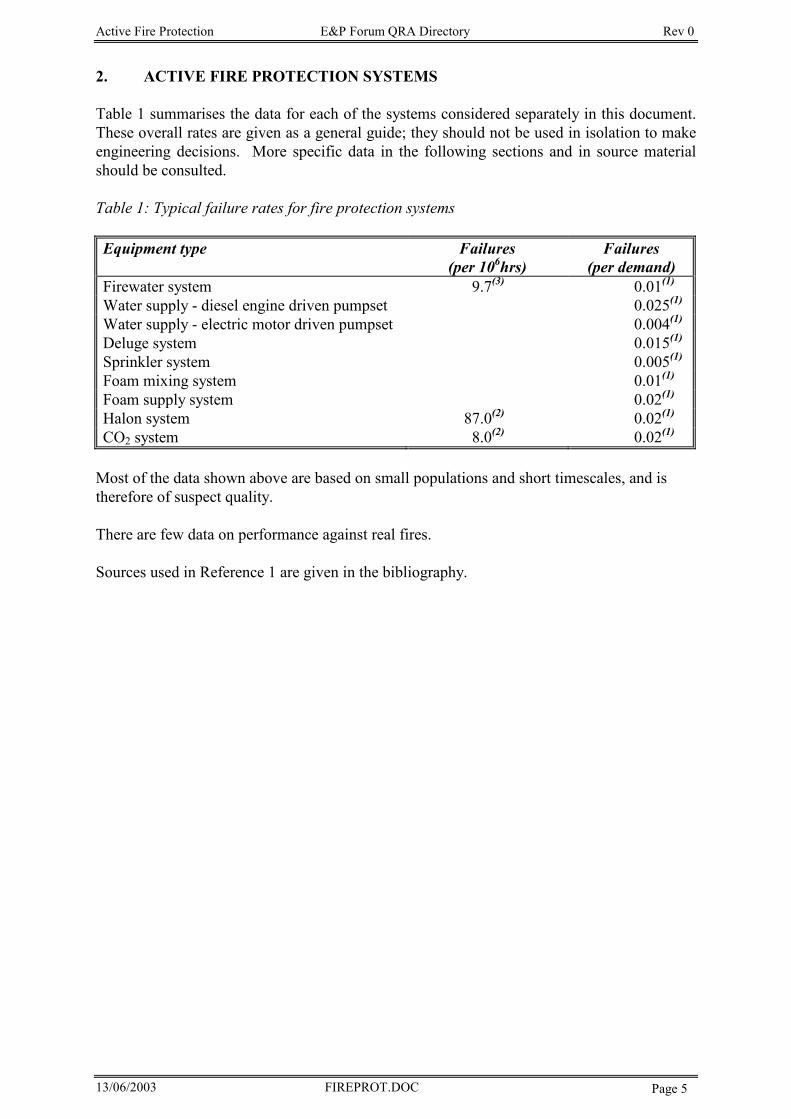
Active Fire Protection E&P Forum QRA Directory Rev 0
13/06/2003 FIREPROT.DOC Page 5
2. ACTIVE FIRE PROTECTION SYSTEMS
Table 1 summarises the data for each of the systems considered separately in this document. These overall rates are given as a general guide; they should not be used in isolation to make engineering decisions. More specific data in the following sections and in source material should be consulted. Table 1: Typical failure rates for fire protection systems Equipment type Failures
(per 106hrs) Failures
(per demand) Firewater system 9.7(3) 0.01(1) Water supply - diesel engine driven pumpset 0.025(1) Water supply - electric motor driven pumpset 0.004(1) Deluge system 0.015(1) Sprinkler system 0.005(1) Foam mixing system 0.01(1) Foam supply system 0.02(1) Halon system 87.0(2) 0.02(1) CO2 system 8.0(2) 0.02(1)
Most of the data shown above are based on small populations and short timescales, and is therefore of suspect quality. There are few data on performance against real fires. Sources used in Reference 1 are given in the bibliography.
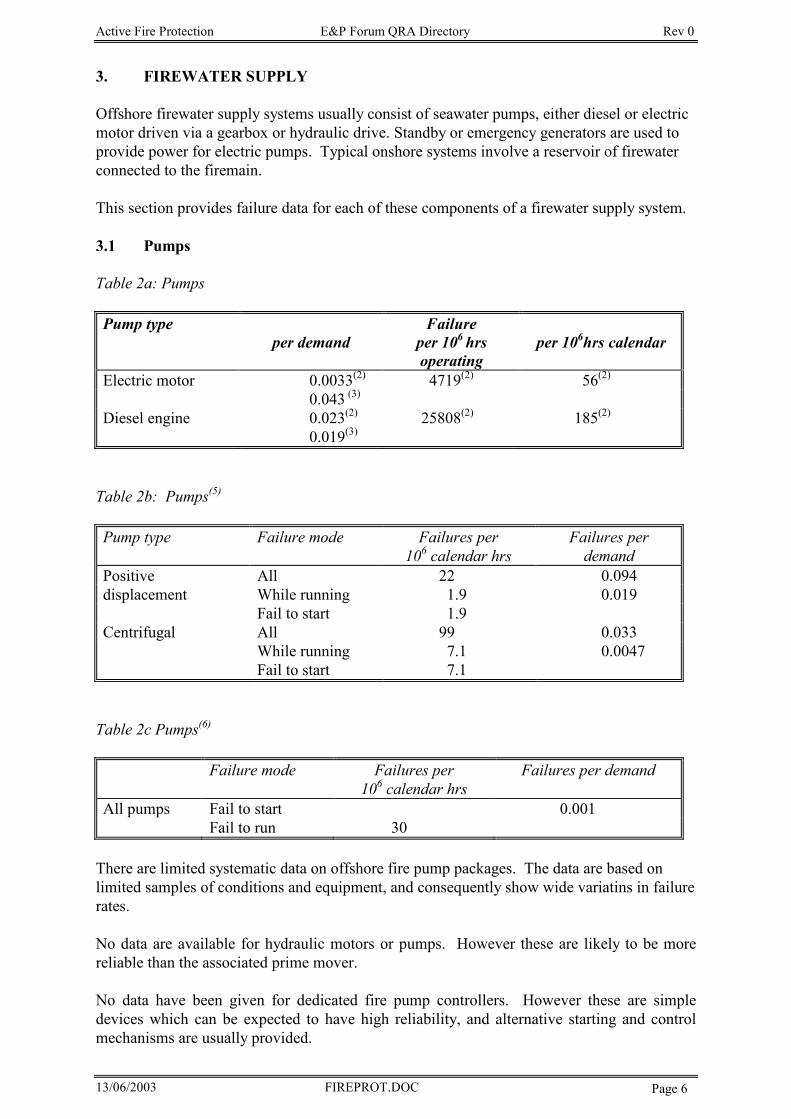
Active Fire Protection E&P Forum QRA Directory Rev 0
13/06/2003 FIREPROT.DOC Page 6
3. FIREWATER SUPPLY Offshore firewater supply systems usually consist of seawater pumps, either diesel or electric motor driven via a gearbox or hydraulic drive. Standby or emergency generators are used to provide power for electric pumps. Typical onshore systems involve a reservoir of firewater connected to the firemain. This section provides failure data for each of these components of a firewater supply system.
3.1 Pumps Table 2a: Pumps Pump type
per demand Failure
per 106 hrs operating
per 106hrs calendar
Electric motor 0.0033(2) 4719(2) 56(2) 0.043 (3)
Diesel engine 0.023(2) 25808(2) 185(2) 0.019(3)
Table 2b: Pumps(5)
Pump type Failure mode Failures per 106 calendar hrs
Failures per demand
Positive All 22 0.094 displacement While running 1.9 0.019
Fail to start 1.9 Centrifugal All 99 0.033
While running 7.1 0.0047 Fail to start 7.1
Table 2c Pumps(6)
Failure mode Failures per 106 calendar hrs
Failures per demand
All pumps Fail to start 0.001 Fail to run 30
There are limited systematic data on offshore fire pump packages. The data are based on limited samples of conditions and equipment, and consequently show wide variatins in failure rates. No data are available for hydraulic motors or pumps. However these are likely to be more reliable than the associated prime mover. No data have been given for dedicated fire pump controllers. However these are simple devices which can be expected to have high reliability, and alternative starting and control mechanisms are usually provided.
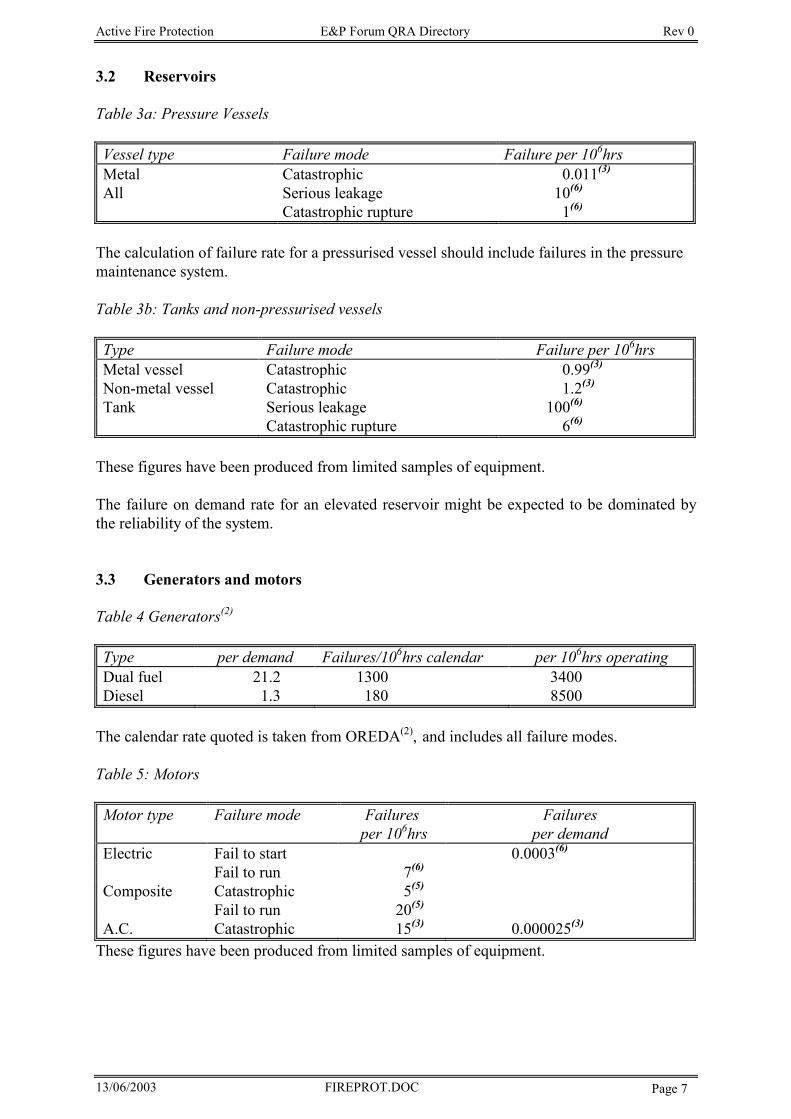
Active Fire Protection E&P Forum QRA Directory Rev 0
13/06/2003 FIREPROT.DOC Page 7
3.2 Reservoirs Table 3a: Pressure Vessels Vessel type Failure mode Failure per 106hrs Metal Catastrophic 0.011(3) All Serious leakage 10(6)
Catastrophic rupture 1(6)
The calculation of failure rate for a pressurised vessel should include failures in the pressure maintenance system. Table 3b: Tanks and non-pressurised vessels Type Failure mode Failure per 106hrs Metal vessel Catastrophic 0.99(3) Non-metal vessel Catastrophic 1.2(3) Tank Serious leakage 100(6)
Catastrophic rupture 6(6)
These figures have been produced from limited samples of equipment. The failure on demand rate for an elevated reservoir might be expected to be dominated by the reliability of the system.
3.3 Generators and motors
Table 4 Generators(2)
Type per demand Failures/106hrs calendar per 106hrs operating Dual fuel 21.2 1300 3400 Diesel 1.3 180 8500
The calendar rate quoted is taken from OREDA(2), and includes all failure modes.
Table 5: Motors
Motor type Failure mode Failures per 106hrs
Failures per demand
Electric Fail to start 0.0003(6) Fail to run 7(6)
Composite Catastrophic 5(5) Fail to run 20(5)
A.C. Catastrophic 15(3) 0.000025(3) These figures have been produced from limited samples of equipment.
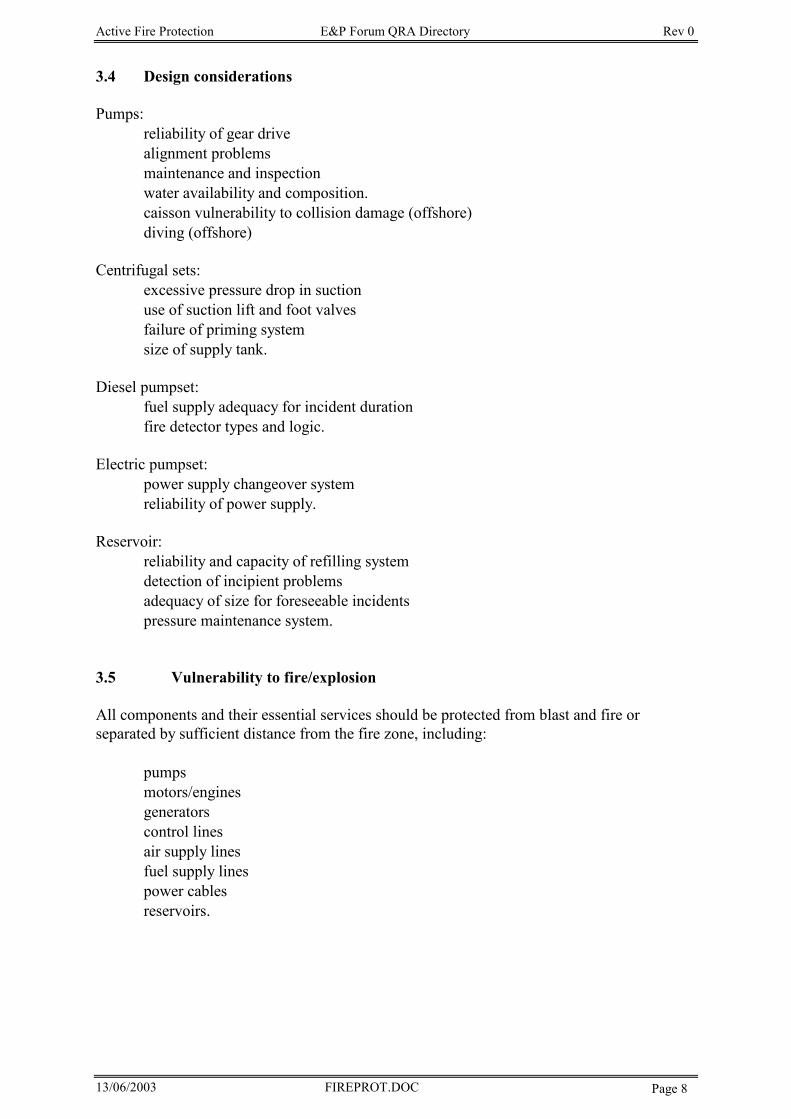
Active Fire Protection E&P Forum QRA Directory Rev 0
13/06/2003 FIREPROT.DOC Page 8
3.4 Design considerations Pumps: • reliability of gear drive • alignment problems • maintenance and inspection • water availability and composition. • caisson vulnerability to collision damage (offshore) • diving (offshore) Centrifugal sets: • excessive pressure drop in suction • use of suction lift and foot valves • failure of priming system • size of supply tank. Diesel pumpset: • fuel supply adequacy for incident duration • fire detector types and logic. Electric pumpset: • power supply changeover system • reliability of power supply. Reservoir: • reliability and capacity of refilling system • detection of incipient problems • adequacy of size for foreseeable incidents • pressure maintenance system.
3.5 Vulnerability to fire/explosion All components and their essential services should be protected from blast and fire or separated by sufficient distance from the fire zone, including: • pumps • motors/engines • generators • control lines • air supply lines • fuel supply lines • power cables • reservoirs.
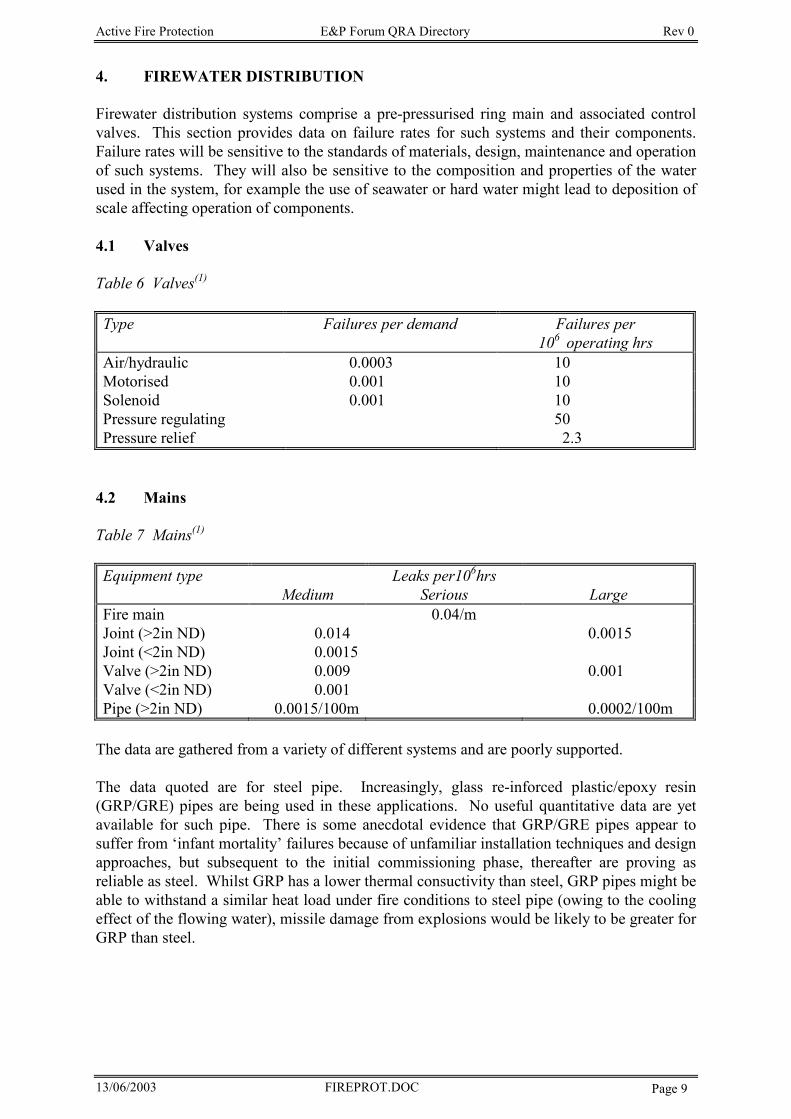
Active Fire Protection E&P Forum QRA Directory Rev 0
13/06/2003 FIREPROT.DOC Page 9
4. FIREWATER DISTRIBUTION
Firewater distribution systems comprise a pre-pressurised ring main and associated control valves. This section provides data on failure rates for such systems and their components. Failure rates will be sensitive to the standards of materials, design, maintenance and operation of such systems. They will also be sensitive to the composition and properties of the water used in the system, for example the use of seawater or hard water might lead to deposition of scale affecting operation of components. 4.1 Valves Table 6 Valves(1)
Type Failures per demand Failures per
106 operating hrs Air/hydraulic 0.0003 10 Motorised 0.001 10 Solenoid 0.001 10 Pressure regulating 50 Pressure relief 2.3
4.2 Mains Table 7 Mains(1)
Equipment type Medium
Leaks per106hrs Serious
Large
Fire main 0.04/m Joint (>2in ND) 0.014 0.0015 Joint (<2in ND) 0.0015 Valve (>2in ND) 0.009 0.001 Valve (<2in ND) 0.001 Pipe (>2in ND) 0.0015/100m 0.0002/100m
The data are gathered from a variety of different systems and are poorly supported. The data quoted are for steel pipe. Increasingly, glass re-inforced plastic/epoxy resin (GRP/GRE) pipes are being used in these applications. No useful quantitative data are yet available for such pipe. There is some anecdotal evidence that GRP/GRE pipes appear to suffer from ‘infant mortality’ failures because of unfamiliar installation techniques and design approaches, but subsequent to the initial commissioning phase, thereafter are proving as reliable as steel. Whilst GRP has a lower thermal consuctivity than steel, GRP pipes might be able to withstand a similar heat load under fire conditions to steel pipe (owing to the cooling effect of the flowing water), missile damage from explosions would be likely to be greater for GRP than steel.
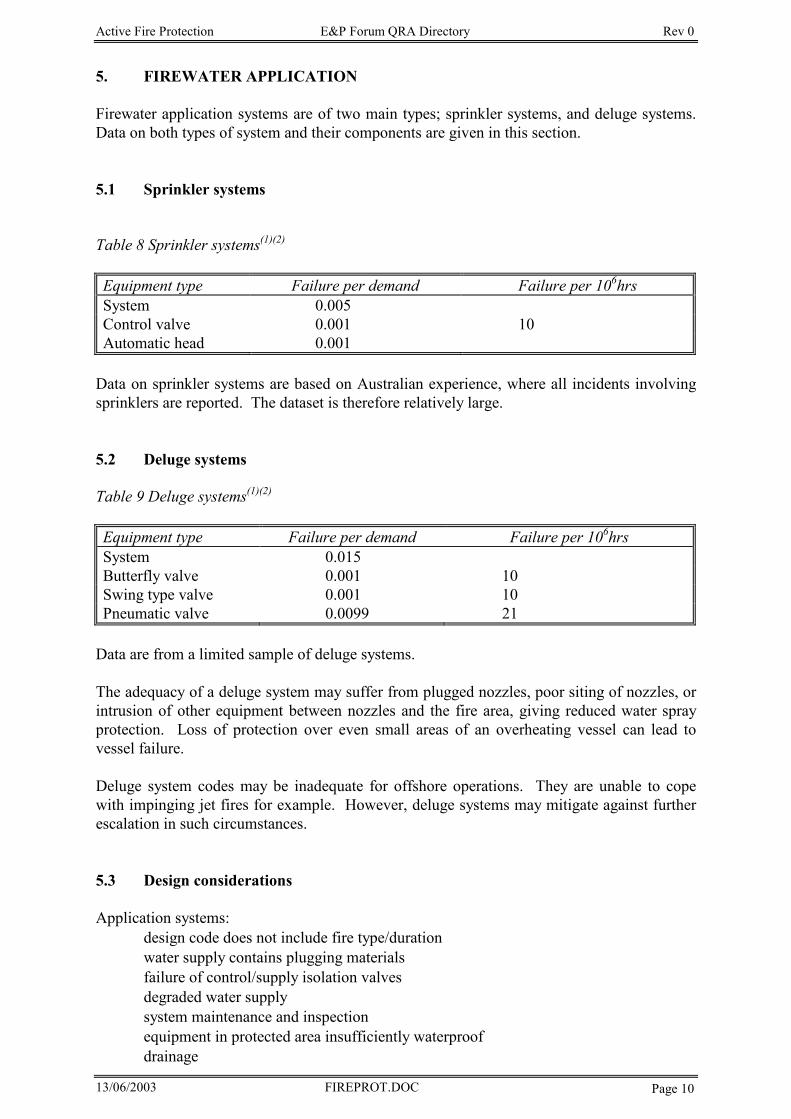
Active Fire Protection E&P Forum QRA Directory Rev 0
13/06/2003 FIREPROT.DOC Page 10
5. FIREWATER APPLICATION Firewater application systems are of two main types; sprinkler systems, and deluge systems. Data on both types of system and their components are given in this section.
5.1 Sprinkler systems
Table 8 Sprinkler systems(1)(2)
Equipment type Failure per demand Failure per 106hrs System 0.005 Control valve 0.001 10 Automatic head 0.001
Data on sprinkler systems are based on Australian experience, where all incidents involving sprinklers are reported. The dataset is therefore relatively large.
5.2 Deluge systems Table 9 Deluge systems(1)(2)
Equipment type Failure per demand Failure per 106hrs System 0.015 Butterfly valve 0.001 10 Swing type valve 0.001 10 Pneumatic valve 0.0099 21
Data are from a limited sample of deluge systems. The adequacy of a deluge system may suffer from plugged nozzles, poor siting of nozzles, or intrusion of other equipment between nozzles and the fire area, giving reduced water spray protection. Loss of protection over even small areas of an overheating vessel can lead to vessel failure. Deluge system codes may be inadequate for offshore operations. They are unable to cope with impinging jet fires for example. However, deluge systems may mitigate against further escalation in such circumstances.
5.3 Design considerations Application systems: • design code does not include fire type/duration • water supply contains plugging materials • failure of control/supply isolation valves • degraded water supply • system maintenance and inspection • equipment in protected area insufficiently waterproof • drainage
Active Fire Protection E&P Forum QRA Directory Rev 0
13/06/2003 FIREPROT.DOC Page 11
In most cases, problems are far less acute with sprinkler systems. Sprinkler systems: • inadequate flushing • mechanical damage to frangible element • pre-action valve fails to open Deluge systems: • nozzle positioning/orientation • simultaneous operation of other deluge systems • water hammer causing valve tripping
5.4 Vulnerability to fire/explosion Pipework and nozzles are vulnerable to blast and missile damage, which may cause loss of system effectiveness. Control lines and power cables are also vulnerable, and may need protecting.
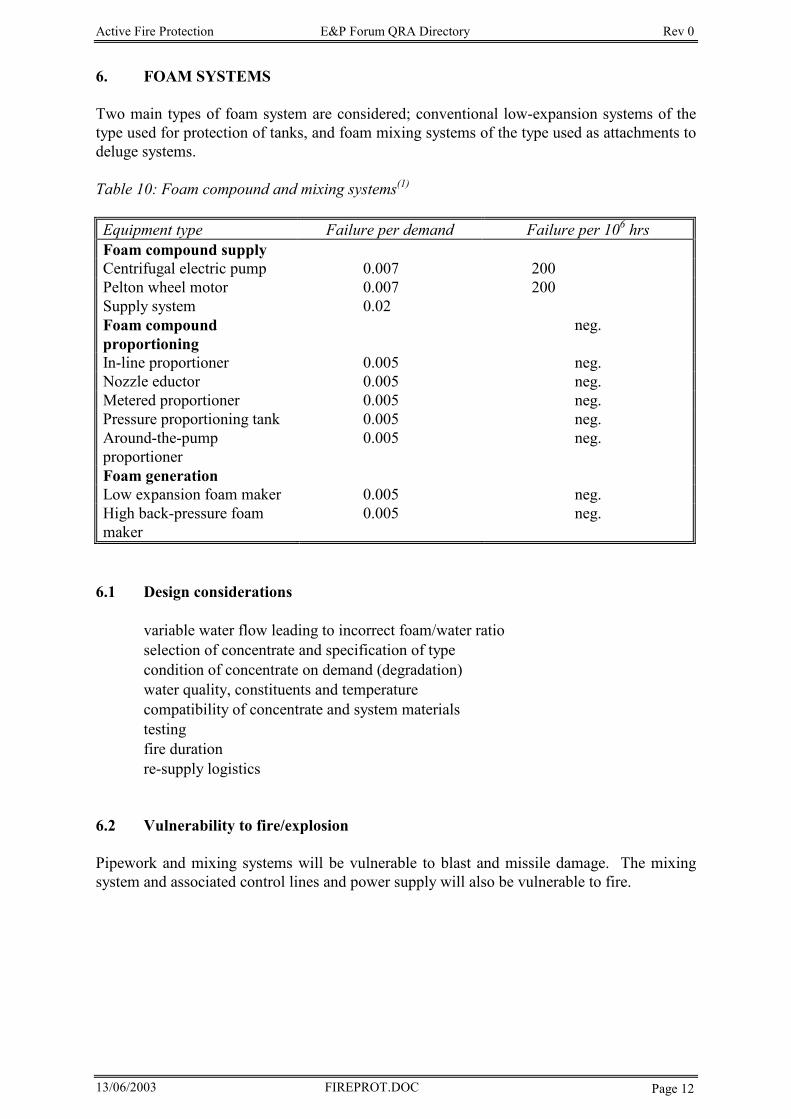
Active Fire Protection E&P Forum QRA Directory Rev 0
13/06/2003 FIREPROT.DOC Page 12
6. FOAM SYSTEMS Two main types of foam system are considered; conventional low-expansion systems of the type used for protection of tanks, and foam mixing systems of the type used as attachments to deluge systems.
Table 10: Foam compound and mixing systems(1)
Equipment type Failure per demand Failure per 106 hrs Foam compound supply Centrifugal electric pump 0.007 200 Pelton wheel motor 0.007 200 Supply system 0.02 Foam compound proportioning
neg.
In-line proportioner 0.005 neg. Nozzle eductor 0.005 neg. Metered proportioner 0.005 neg. Pressure proportioning tank 0.005 neg. Around-the-pump proportioner
0.005 neg.
Foam generation Low expansion foam maker 0.005 neg. High back-pressure foam maker
0.005 neg.
6.1 Design considerations • variable water flow leading to incorrect foam/water ratio • selection of concentrate and specification of type • condition of concentrate on demand (degradation) • water quality, constituents and temperature • compatibility of concentrate and system materials • testing • fire duration • re-supply logistics
6.2 Vulnerability to fire/explosion Pipework and mixing systems will be vulnerable to blast and missile damage. The mixing system and associated control lines and power supply will also be vulnerable to fire.
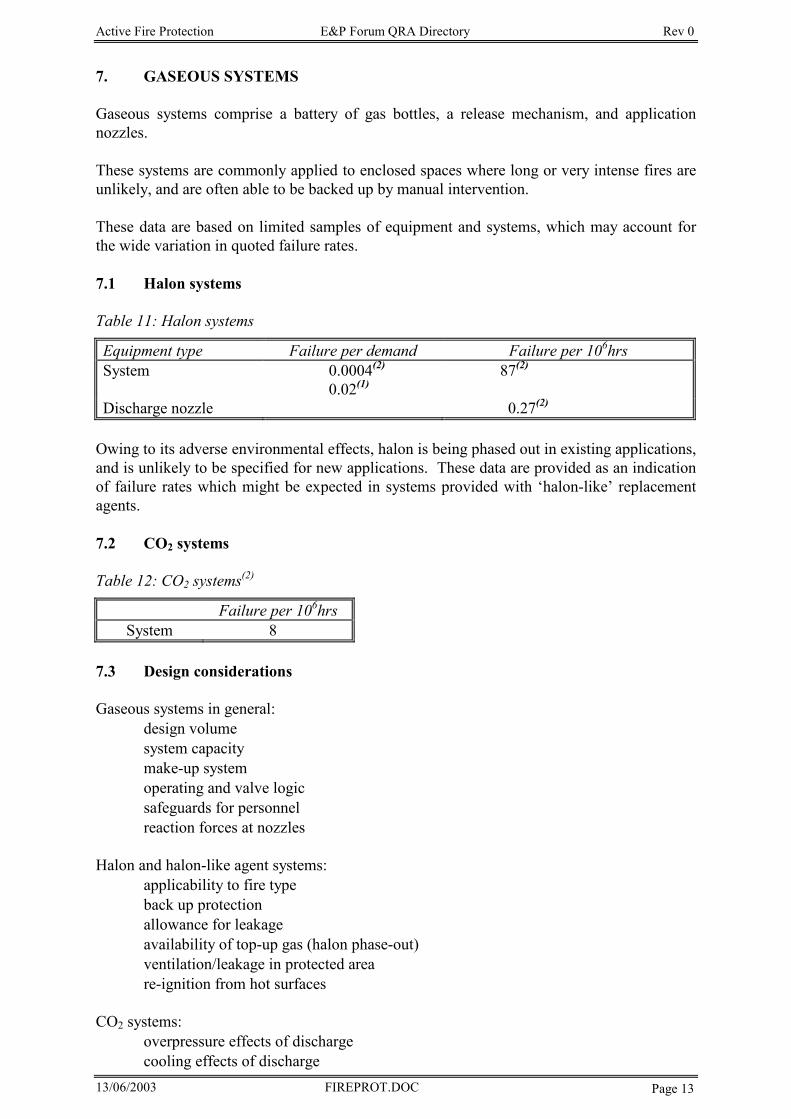
Active Fire Protection E&P Forum QRA Directory Rev 0
13/06/2003 FIREPROT.DOC Page 13
7. GASEOUS SYSTEMS Gaseous systems comprise a battery of gas bottles, a release mechanism, and application nozzles. These systems are commonly applied to enclosed spaces where long or very intense fires are unlikely, and are often able to be backed up by manual intervention.
These data are based on limited samples of equipment and systems, which may account for the wide variation in quoted failure rates. 7.1 Halon systems Table 11: Halon systems
Equipment type Failure per demand Failure per 106hrs System 0.0004(2)
0.02(1) 87(2)
Discharge nozzle 0.27(2)
Owing to its adverse environmental effects, halon is being phased out in existing applications, and is unlikely to be specified for new applications. These data are provided as an indication of failure rates which might be expected in systems provided with ‘halon-like’ replacement agents. 7.2 CO2 systems Table 12: CO2 systems(2)
Failure per 106hrs System 8
7.3 Design considerations Gaseous systems in general: • design volume • system capacity • make-up system • operating and valve logic • safeguards for personnel • reaction forces at nozzles Halon and halon-like agent systems: • applicability to fire type • back up protection • allowance for leakage • availability of top-up gas (halon phase-out) • ventilation/leakage in protected area • re-ignition from hot surfaces CO2 systems: • overpressure effects of discharge • cooling effects of discharge
Active Fire Protection E&P Forum QRA Directory Rev 0
13/06/2003 FIREPROT.DOC Page 14
7.4 Vulnerability to fire/explosion The situations in which gaseous systems are deployed should give rise to limited risks from blast. Detection, control signal and power lines are all vulnerable to fire damage.
Active Fire Protection E&P Forum QRA Directory Rev 0
13/06/2003 FIREPROT.DOC Page 15
8. REFERENCES AND BIBLIOGRAPHY
8.1 References
1. E&P Forum member 2. Offshore reliability data: OREDA-92 OREDA participants, 2nd edition 1992 Distributed by DNV Technica, Høvik, Norway 3. Guideline for process equipment reliability data American Institute of Chemical Engineers, New York 1989 4. DJ Campbell et al Reliability analysis of underground fire water piping at the Paducah gaseous diffusion
plant JBF Associates, Knoxville,Tennessee 1990 5. Guide to the collection and presentation of electrical, electronic, sensing component,
and mechanical equipment reliability data for nuclear power generating stations Institution of Electrical and Electronic Engineers, London 1983 6. Cremer and Warner Ltd Risk analysis of six potentially hazardous industrial objects in the Rijnmond area - a pilot study for the Covo steering committee D. Reidel Publishing, Dordrecht, Holland 1982
8.2 Bibliography KW Blything The fire hazards and counter measures for the protection of pressurized LPG storage on industrial sites
SRD R 263, July 1983
HF Martz On broadening failure rate distributions in PRA uncertainty analyses Risk Analysis, Vol. 4, No. 1, 1984
M Finucane and D Pinkney
Reliability of fire protection and detection systems Proceedings of 2nd international conference on fire engineering and loss prevention in
offshore petrochemical and other hazardous applications BHRA, Brighton, 1989
FP Lees Loss prevention in the process industries Butterworth, 1980
Active Fire Protection E&P Forum QRA Directory Rev 0
13/06/2003 FIREPROT.DOC Page 16
HW Marriott Automatic sprinkler performance in Australia and New Zealand 1886-1968 Australian Fire Protection Association, 1971
An assessment of the reliability of automatic sprinkler systems
UKAEA, Report SRS/ASG/1015, 1972
FS Ashmore The design and integrity of deluge systems Conference on contingency planning for the offshore industry IBC Technical Services, 1989
Active Fire Protection E&P Forum QRA Directory Rev 0
13/06/2003 FIREPROT.DOC Page 1

HF in the Determination E&P Forum QRA Datasheet Directory Rev 0 of Event Outcomes
13/06/2003 HFINDEO2.DOC Page 1
HUMAN FACTORS IN THE DETERMINATION OF EVENT OUTCOMES
HF in the Determination E&P Forum QRA Datasheet Directory Rev 0 of Event Outcomes
13/06/2003 HFINDEO2.DOC Page 2
TABLE OF CONTENTS
GLOSSARY OF TERMS & ABBREVIATIONS ------------------------------------------------- 3
1 INTRODUCTION-------------------------------------------------------------------------------------- 4
2 SCOPE -------------------------------------------------------------------------------------------------- 5
3 APPLICATION ---------------------------------------------------------------------------------------- 5
4 INCORPORATING HUMAN ACTIONS IN EVENT TREE MODELLING-------------- 6
Description-------------------------------------------------------------------------------------------------------------------6
Data Sources-----------------------------------------------------------------------------------------------------------------6
Availability of Data --------------------------------------------------------------------------------------------------------9
Strengths of the Method --------------------------------------------------------------------------------------------------9
5 SIMULATING HUMAN CONTRIBUTION TO EVENT MITIGATION ------------------- 9
Description ------------------------------------------------------------------------------------------------------------------9
6 EXAMPLE OF EVENT MITIGATION INCLUDING OPERATOR TASKS ----------- 10
Scenario -------------------------------------------------------------------------------------------------------------------- 10
Task Analysis ------------------------------------------------------------------------------------------------------------- 10
Human Errors ------------------------------------------------------------------------------------------------------------ 10
Time to perform tasks --------------------------------------------------------------------------------------------------- 11
Results ---------------------------------------------------------------------------------------------------------------------- 14
7 ONGOING RESEARCH -------------------------------------------------------------------------- 14
8 REFERENCES -------------------------------------------------------------------------------------- 14
HF in the Determination E&P Forum QRA Datasheet Directory Rev 0 of Event Outcomes
13/06/2003 HFINDEO2.DOC Page 3
GLOSSARY OF TERMS & ABBREVIATIONS Term Abbreviation Definition
Absolute Probability Judgement
APJ A method for estimating Human Error Probabilities.
Error Factor EF The nominal Human Error Probability (HEP) is multiplied or divided by the error factor to determine the upper or lower bounds respectively of the HEP.
Event Tree Analysis ETA An analysis technique used to evaluate and model the development of an accidental event and determine the relative likelihood of the possible outcomes.
Fault Tree Analysis FTA A technique to determine the frequency of an accidental event by organising the logical relationship between contributing causes and contingent conditions.
Human Error Assessment and Reduction Technique
HEART A human reliability analysis technique.
Human Error Probability
HEP The nominal probability of a person making an error when performing a task. It is normally on a per opportunity basis. The HEP range is from 10-5 per opportunity to 1 per opportunity. For a given task there can be different error modes, each with a nominal HEP. The HEP is dependent on the characteristics of the task and the attributes of the person (e.g. trained or untrained). Human reliability techniques are used to estimate a HEP.
Human Reliability Analysis
HRA A generic term covering all techniques which are used to assess the human component of a system.
Monte Carlo Analysis - A time based method of modelling system behaviour.
Performance Shaping Factor
PSF A factor which can influence human performance and human error probability.
Quantified Risk Assessment
QRA -
Task Analysis - A series of techniques used to analyse and assess the activities performed by people within a system.
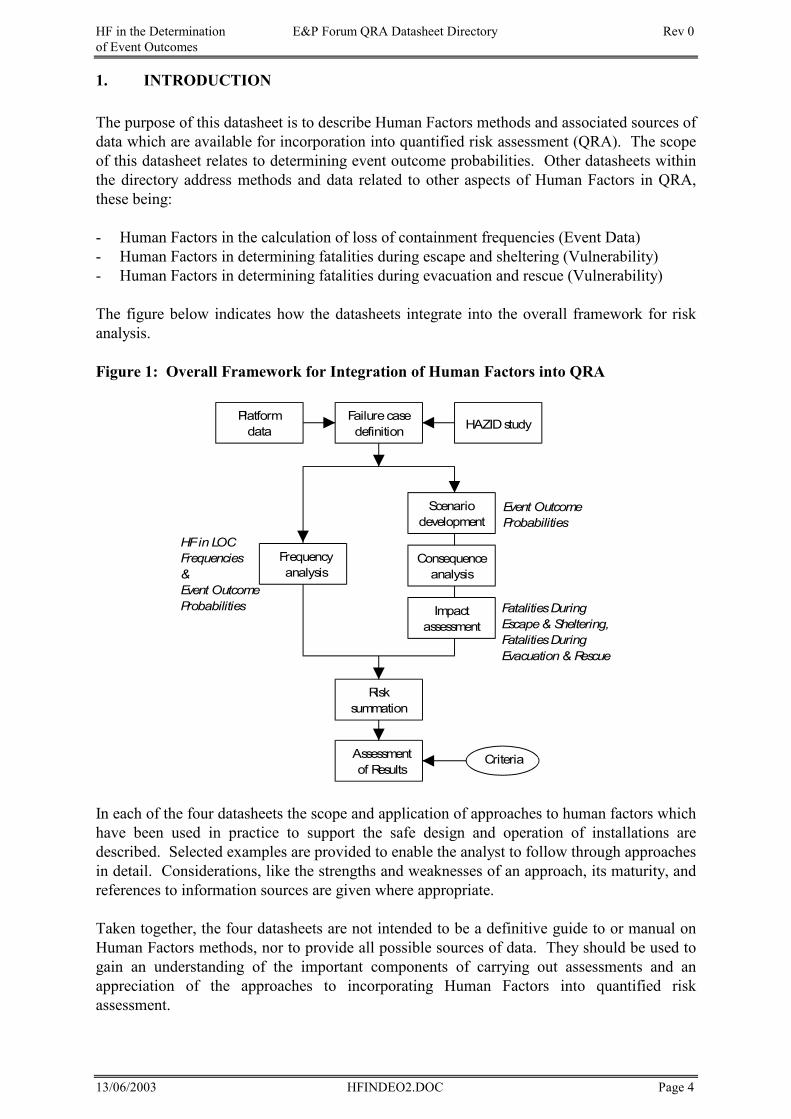
HF in the Determination E&P Forum QRA Datasheet Directory Rev 0 of Event Outcomes
13/06/2003 HFINDEO2.DOC Page 4
1. INTRODUCTION The purpose of this datasheet is to describe Human Factors methods and associated sources of data which are available for incorporation into quantified risk assessment (QRA). The scope of this datasheet relates to determining event outcome probabilities. Other datasheets within the directory address methods and data related to other aspects of Human Factors in QRA, these being: - Human Factors in the calculation of loss of containment frequencies (Event Data) - Human Factors in determining fatalities during escape and sheltering (Vulnerability) - Human Factors in determining fatalities during evacuation and rescue (Vulnerability) The figure below indicates how the datasheets integrate into the overall framework for risk analysis. Figure 1: Overall Framework for Integration of Human Factors into QRA
In each of the four datasheets the scope and application of approaches to human factors which have been used in practice to support the safe design and operation of installations are described. Selected examples are provided to enable the analyst to follow through approaches in detail. Considerations, like the strengths and weaknesses of an approach, its maturity, and references to information sources are given where appropriate. Taken together, the four datasheets are not intended to be a definitive guide to or manual on Human Factors methods, nor to provide all possible sources of data. They should be used to gain an understanding of the important components of carrying out assessments and an appreciation of the approaches to incorporating Human Factors into quantified risk assessment.
Platformdata
Failurecasedefinition HAZIDstudy
Frequencyanalysis
Scenariodevelopment
Consequenceanalysis
Impactassessment
Risksummation
Assessmentof Results
Criteria
Event OutcomeProbabilities
HFin LOCFrequencies&Event OutcomeProbabilities FatalitiesDuring
Escape& Sheltering,FatalitiesDuringEvacuation& Rescue
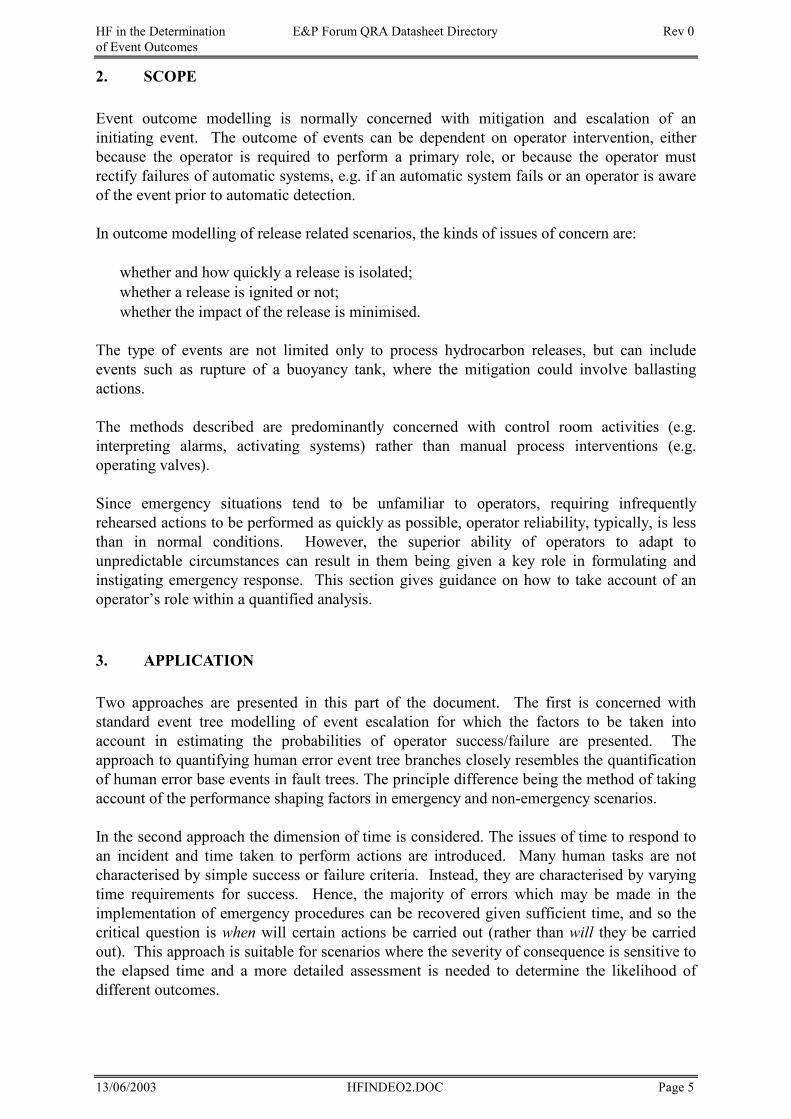
HF in the Determination E&P Forum QRA Datasheet Directory Rev 0 of Event Outcomes
13/06/2003 HFINDEO2.DOC Page 5
2. SCOPE Event outcome modelling is normally concerned with mitigation and escalation of an initiating event. The outcome of events can be dependent on operator intervention, either because the operator is required to perform a primary role, or because the operator must rectify failures of automatic systems, e.g. if an automatic system fails or an operator is aware of the event prior to automatic detection. In outcome modelling of release related scenarios, the kinds of issues of concern are: • whether and how quickly a release is isolated; • whether a release is ignited or not; • whether the impact of the release is minimised. The type of events are not limited only to process hydrocarbon releases, but can include events such as rupture of a buoyancy tank, where the mitigation could involve ballasting actions. The methods described are predominantly concerned with control room activities (e.g. interpreting alarms, activating systems) rather than manual process interventions (e.g. operating valves). Since emergency situations tend to be unfamiliar to operators, requiring infrequently rehearsed actions to be performed as quickly as possible, operator reliability, typically, is less than in normal conditions. However, the superior ability of operators to adapt to unpredictable circumstances can result in them being given a key role in formulating and instigating emergency response. This section gives guidance on how to take account of an operator’s role within a quantified analysis.
3. APPLICATION Two approaches are presented in this part of the document. The first is concerned with standard event tree modelling of event escalation for which the factors to be taken into account in estimating the probabilities of operator success/failure are presented. The approach to quantifying human error event tree branches closely resembles the quantification of human error base events in fault trees. The principle difference being the method of taking account of the performance shaping factors in emergency and non-emergency scenarios. In the second approach the dimension of time is considered. The issues of time to respond to an incident and time taken to perform actions are introduced. Many human tasks are not characterised by simple success or failure criteria. Instead, they are characterised by varying time requirements for success. Hence, the majority of errors which may be made in the implementation of emergency procedures can be recovered given sufficient time, and so the critical question is when will certain actions be carried out (rather than will they be carried out). This approach is suitable for scenarios where the severity of consequence is sensitive to the elapsed time and a more detailed assessment is needed to determine the likelihood of different outcomes.
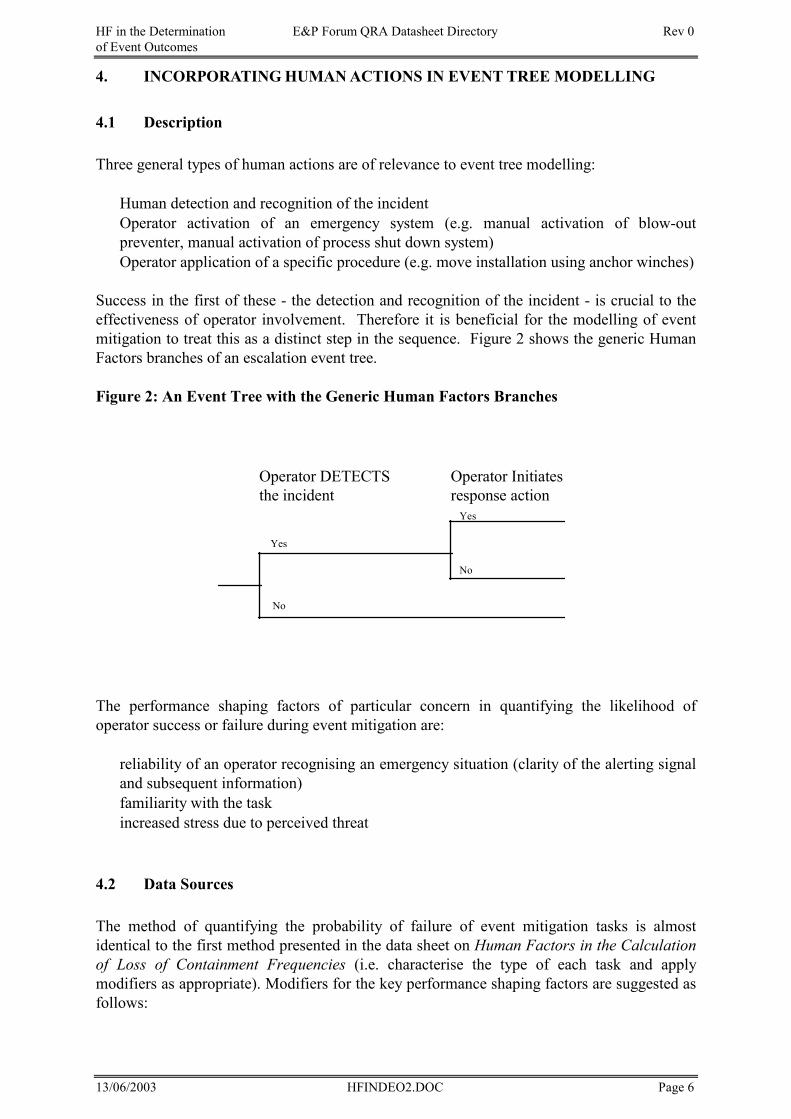
HF in the Determination E&P Forum QRA Datasheet Directory Rev 0 of Event Outcomes
13/06/2003 HFINDEO2.DOC Page 6
4. INCORPORATING HUMAN ACTIONS IN EVENT TREE MODELLING 4.1 Description Three general types of human actions are of relevance to event tree modelling: • Human detection and recognition of the incident • Operator activation of an emergency system (e.g. manual activation of blow-out
preventer, manual activation of process shut down system) • Operator application of a specific procedure (e.g. move installation using anchor winches) Success in the first of these - the detection and recognition of the incident - is crucial to the effectiveness of operator involvement. Therefore it is beneficial for the modelling of event mitigation to treat this as a distinct step in the sequence. Figure 2 shows the generic Human Factors branches of an escalation event tree. Figure 2: An Event Tree with the Generic Human Factors Branches
Operator DETECTS Operator Initiatesthe incident response action
Yes
Yes
No
No
The performance shaping factors of particular concern in quantifying the likelihood of operator success or failure during event mitigation are: • reliability of an operator recognising an emergency situation (clarity of the alerting signal
and subsequent information) • familiarity with the task • increased stress due to perceived threat
4.2 Data Sources The method of quantifying the probability of failure of event mitigation tasks is almost identical to the first method presented in the data sheet on Human Factors in the Calculation of Loss of Containment Frequencies (i.e. characterise the type of each task and apply modifiers as appropriate). Modifiers for the key performance shaping factors are suggested as follows:
HF in the Determination E&P Forum QRA Datasheet Directory Rev 0 of Event Outcomes
13/06/2003 HFINDEO2.DOC Page 7
Modifier for clarity of warning signal
If the signal is clear, highly attention gaining, and very difficult to confuse with any other type of signal (including a false alarm) and the required action by an operator is do nothing more than acknowledge it, the likelihood of an operator error is small (in the region of 10-4 to 10-5 per demand). Increasing the complexity of warning signals, therefore requiring the operator to interpret a pattern of signals, raises the likelihood of error. From the HEART technique (see data sheet - Human Factors in Calculation of Loss of Containment Frequencies) the effect of a "low signal to noise ratio" (i.e. signal masked by competing signals, or of low strength in terms of perceptibility) can increase the likelihood of misdiagnosis by up to a factor of 10. An additional performance shaping factor of concern is the false alarm frequency. Data on human behaviour in fires in buildings shows that 80% - 90% of people assume a fire alarm to be false in the first instance (see data sheet - Human Factors in Estimating Fatalities during Escape and Sheltering). Importantly, these data do not show that emergency procedures are not followed, rather they indicate that there is likely to be a delay in emergency response, most probably due to confirmation being sought. This aspect of emergency response is difficult to take account of within event tree modelling. If an event tree is constructed with multiple detection branches (e.g. immediate human detection, short delay human detection, long delay human detection) the relative weightings of the branches could and should take account of the false alarm rate. Data showing the effect of different false alarm rates is not available, requiring judgements to be made by the analyst. Modifiers for operator familiarity with the task and increased stress due to perceived threat
Due to the low probability of emergency events operators can have little familiarity with the tasks that they have to perform. This results in increased likelihood of error. Stress also increases the likelihood of error. A table of modifiers is provided in Table 1 below [1]. In selecting an error probability, account can be taken of the type and quality of training of operators. For example, sufficiently frequent and realistic simulation of emergencies should increase the familiarity of operators with such situations and thereby reduce error rates. However, a definitive relationship between error rate in an actual incident and either frequency or quality of simulation training cannot be provided.
HF in the Determination E&P Forum QRA Datasheet Directory Rev 0 of Event Outcomes
13/06/2003 HFINDEO2.DOC Page 8
Table 1 Modifications of estimated human error probabilities (HEPs) for the effects of stress and experience levels. [1]
Stress Level Modifiers (Multipliers) of Nominal HEPs
Skilled Novice
Very low (Very low task load) 2 2
Optimum (Optimum task load):
Step-by-step task† 1 1
Dynamic task† 1 2
Moderately high (Heavy task load):
Step-by-step task† 2 4
Dynamic task† 5 10
Extremely High (Threat stress):
Step-by-step task† 5 10
Diagnosis task Error probability = 0.25
(EF = 5)
Error probability = 0.5 (EF = 5)
† Step-by-step tasks are routine procedural tasks. Dynamic tasks involve a higher degree of man-machine interaction such as monitoring and controlling several functions simultaneously. For comparison, the HEART techniques [2] suggests a factor of 17 as the maximum increase in error likelihood due to "unfamiliarity with a situation which is potentially important but which only occurs infrequently or which is novel". Where an operator is to perform a number of tasks as part of a predefined procedure the analyst must decide whether to apply the modifier to some or all of the errors which may be made in following the procedure. It can be argued that the modifier should be applied once (i.e. to the procedure as a whole) rather than to each error, since the tasks are inherently linked by the procedure rather than being independent actions. Table 2 provides error probabilities for critical steps in procedure based response by a control room team [1].
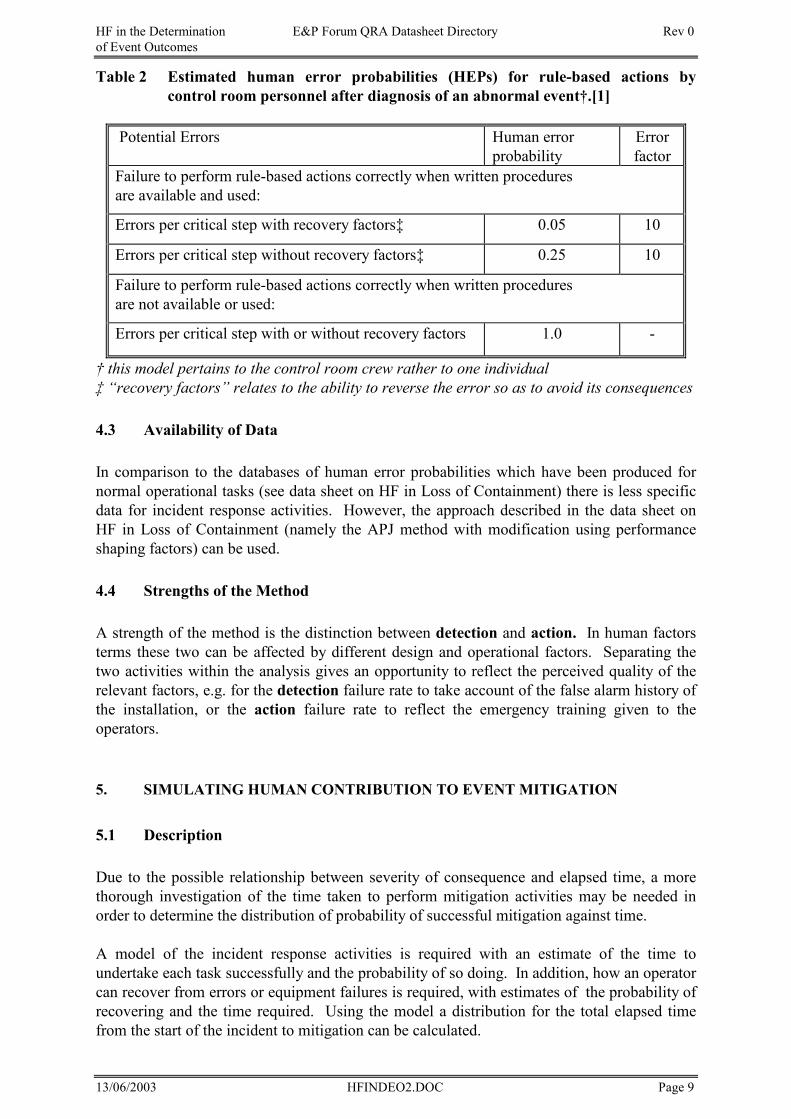
HF in the Determination E&P Forum QRA Datasheet Directory Rev 0 of Event Outcomes
13/06/2003 HFINDEO2.DOC Page 9
Table 2 Estimated human error probabilities (HEPs) for rule-based actions by control room personnel after diagnosis of an abnormal event†.[1]
Potential Errors Human error probability
Error factor
Failure to perform rule-based actions correctly when written procedures are available and used:
Errors per critical step with recovery factors‡ 0.05 10
Errors per critical step without recovery factors‡ 0.25 10
Failure to perform rule-based actions correctly when written procedures are not available or used:
Errors per critical step with or without recovery factors 1.0 -
† this model pertains to the control room crew rather to one individual ‡ “recovery factors” relates to the ability to reverse the error so as to avoid its consequences
4.3 Availability of Data In comparison to the databases of human error probabilities which have been produced for normal operational tasks (see data sheet on HF in Loss of Containment) there is less specific data for incident response activities. However, the approach described in the data sheet on HF in Loss of Containment (namely the APJ method with modification using performance shaping factors) can be used. 4.4 Strengths of the Method A strength of the method is the distinction between detection and action. In human factors terms these two can be affected by different design and operational factors. Separating the two activities within the analysis gives an opportunity to reflect the perceived quality of the relevant factors, e.g. for the detection failure rate to take account of the false alarm history of the installation, or the action failure rate to reflect the emergency training given to the operators.
5. SIMULATING HUMAN CONTRIBUTION TO EVENT MITIGATION 5.1 Description Due to the possible relationship between severity of consequence and elapsed time, a more thorough investigation of the time taken to perform mitigation activities may be needed in order to determine the distribution of probability of successful mitigation against time. A model of the incident response activities is required with an estimate of the time to undertake each task successfully and the probability of so doing. In addition, how an operator can recover from errors or equipment failures is required, with estimates of the probability of recovering and the time required. Using the model a distribution for the total elapsed time from the start of the incident to mitigation can be calculated.
HF in the Determination E&P Forum QRA Datasheet Directory Rev 0 of Event Outcomes
13/06/2003 HFINDEO2.DOC Page 10
6. EXAMPLE OF EVENT MITIGATION INCLUDING OPERATOR TASKS This example demonstrates the method of analysing the human involvement in event mitigation. The data in this example and the results should not be transferred to other situations as case by case evaluation is required. 6.1 Scenario A mobile installation is anchored in position with the ability to manoeuvre using winches. In the event of a sub-sea gas release the procedure is to use the winches to move the installation to a safe distance from gas plume. The consequence analysis will have calculated, for a number of release scenarios, the probability that the installation will need to move off station and the time available to do so. Therefore, to complete the analysis it is necessary to estimate the time taken to move the installation a safe distance. 6.2 Task Analysis An analysis of the tasks would be performed to identify the key human tasks. For this event the key tasks are assumed to be: - recognise the event - ensure sufficient power is available to operate the winches (it is assumed that sufficient
power is not available initially) - determine the direction to move the installation - operate the winches so as to slacken and reel in opposing winches 6.3 Human Errors In conjunction with the task analysis the key human errors would be identified. For this example the following task errors are taken to be the dominant failures and corresponding probabilities per operation are shown (Table 3).
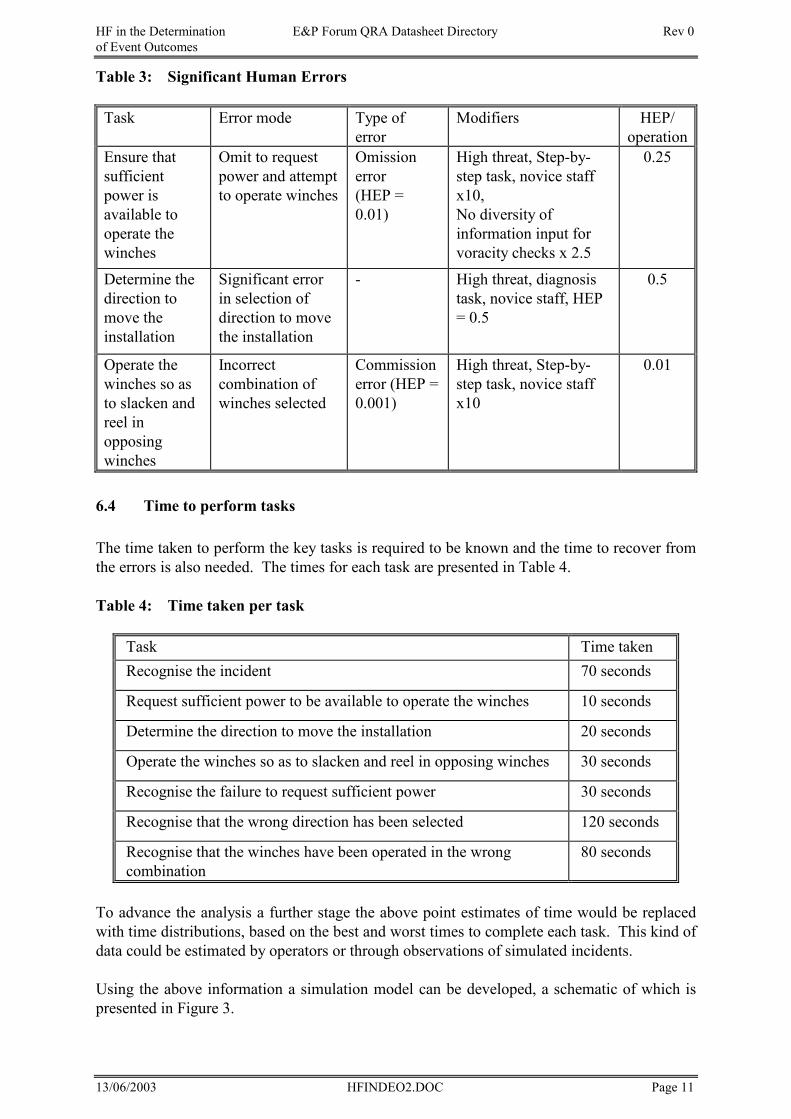
HF in the Determination E&P Forum QRA Datasheet Directory Rev 0 of Event Outcomes
13/06/2003 HFINDEO2.DOC Page 11
Table 3: Significant Human Errors
Task Error mode Type of error
Modifiers HEP/ operation
Ensure that sufficient power is available to operate the winches
Omit to request power and attempt to operate winches
Omission error (HEP = 0.01)
High threat, Step-by-step task, novice staff x10, No diversity of information input for voracity checks x 2.5
0.25
Determine the direction to move the installation
Significant error in selection of direction to move the installation
- High threat, diagnosis task, novice staff, HEP = 0.5
0.5
Operate the winches so as to slacken and reel in opposing winches
Incorrect combination of winches selected
Commission error (HEP = 0.001)
High threat, Step-by-step task, novice staff x10
0.01
6.4 Time to perform tasks The time taken to perform the key tasks is required to be known and the time to recover from the errors is also needed. The times for each task are presented in Table 4. Table 4: Time taken per task
Task Time taken Recognise the incident 70 seconds
Request sufficient power to be available to operate the winches 10 seconds
Determine the direction to move the installation 20 seconds
Operate the winches so as to slacken and reel in opposing winches 30 seconds
Recognise the failure to request sufficient power 30 seconds
Recognise that the wrong direction has been selected 120 seconds
Recognise that the winches have been operated in the wrong combination
80 seconds
To advance the analysis a further stage the above point estimates of time would be replaced with time distributions, based on the best and worst times to complete each task. This kind of data could be estimated by operators or through observations of simulated incidents. Using the above information a simulation model can be developed, a schematic of which is presented in Figure 3.
HF in the Determination E&P Forum QRA Datasheet Directory Rev 0 of Event Outcomes
13/06/2003 HFINDEO2.DOC Page 12
6.5 Additional information Estimates of the following are needed to compute the results: • Time taken for power to reach sufficient level to operate winches (assumed to be 45
seconds) • Time taken for winches to move the installation to the safest position (assumed to be 200
seconds if no errors are made, 240 seconds if the winches were initially operated incorrectly, 300 seconds if the wrong direction was chosen initially)
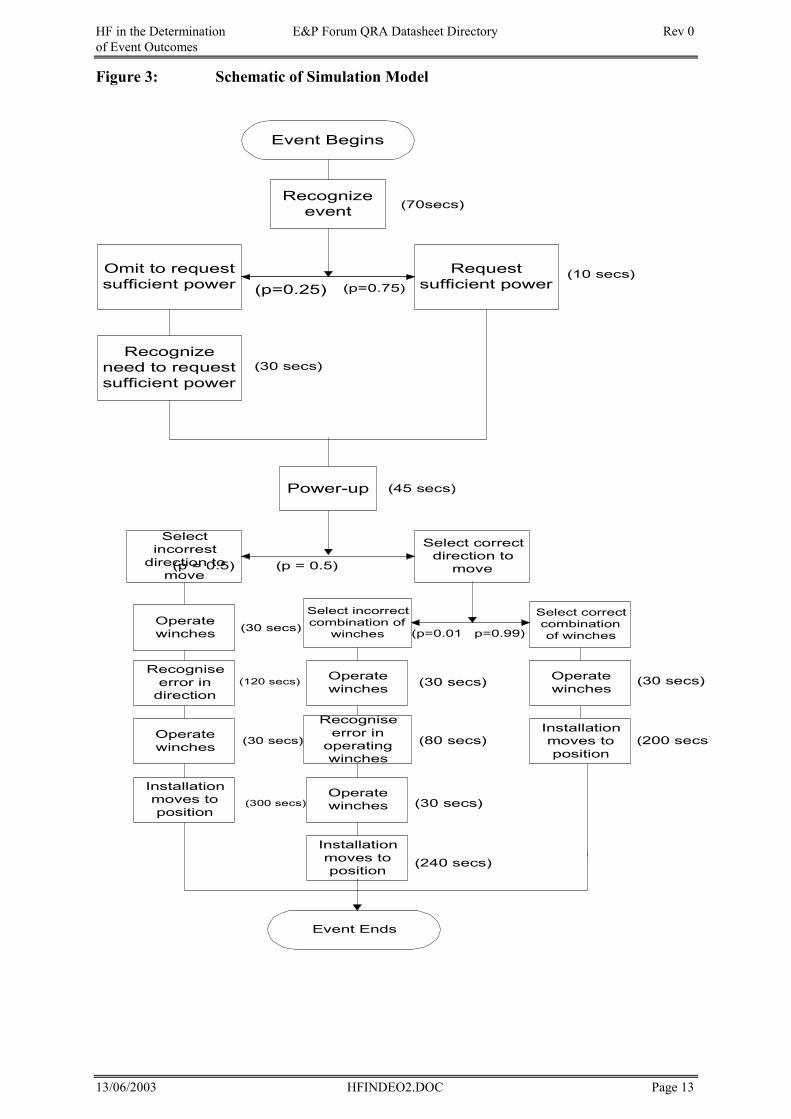
HF in the Determination E&P Forum QRA Datasheet Directory Rev 0 of Event Outcomes
13/06/2003 HFINDEO2.DOC Page 13
Figure 3: Schematic of Simulation Model
Event Begins
Recognizeevent
Requestsufficient power
Omit to requestsufficient power
Recognizeneed to requestsufficient power
Power-up
Selectincorrest
direction tomove
Select correctdirection to
move
Select incorrectcombination of
winches
Recogniseerror in
operatingwinches
Operatewinches
Installationmoves toposition
Operatewinches
Installationmoves toposition
Select correctcombinationof winches
Operatewinches
Installationmoves toposition
Operatewinches
Recogniseerror in
direction
Operatewinches
Event Ends
(70secs)
(p=0.25) (p=0.75)(10 secs)
(30 secs)
(45 secs)
(p = 0.5) (p = 0.5)
(30 secs)
(120 secs)
(30 secs)
(300 secs)
(30 secs)
(80 secs)
(30 secs)
(240 secs)
(30 secs)
(200 secs)
(p=0.01 p=0.99)
HF in the Determination E&P Forum QRA Datasheet Directory Rev 0 of Event Outcomes
13/06/2003 HFINDEO2.DOC Page 14
6.6 Results The distribution of times to move the installation can be calculated using the above model by summing the task times along each path in accordance with the branch probabilities The results, presented in Table 5, indicate that the time taken falls into two bands - one band below 600 seconds, and the other at more than 800 seconds. Table 5: Results of the Simulation Example
Time to move installation to safest position Cumulative probability
575 seconds 0.371
595 seconds 0.495
765 seconds 0.499
785 seconds 0.500
865 seconds 0.875
885 seconds 1
Therefore, for a scenario in which the installation has 750 seconds to move to safety, the probability of it doing so would be taken to be assigned 0.495 (without interpolation of the results).
7. ONGOING RESEARCH A number of lines of research are being pursued to investigate the human role in event mitigation including the methods to improve decision making in emergencies and the key characteristics of offshore personnel, particularly the Offshore Installation Manager. Development of QRA support tools is ongoing, with a general objective to improve the modelling of event detection, including operator detection, and response reliability.
8. REFERENCES [1] Swain, A.D. and Guttmann, H.E., A Handbook of Human Reliability Analyses with
Emphasis on Nuclear Power Plant Applications, NUREG/CR-1298, Nuclear Regulatory Commission, Washington DC 20555, 1983.
[2] Williams, J.C., (1988) A data-based method for assessing and reducing human error to improve operational experience, In Proceedings of IEEE 4th Conference on Human Factors in Power Plants, Monterey, Calif., 6-9 June 1988.
HF in the Determination E&P Forum QRA Datasheet Directory Rev 0 of Event Outcomes
13/06/2003 HFINDEO2.DOC Page 15

Vulnerability of Humans E&P Forum QRA Datasheet Directory Rev 0
13/06/2003 VULNHUM.DOC Page 1
VULNERABILITY OF HUMANS
Vulnerability of Humans E&P Forum QRA Datasheet Directory Rev 0
13/06/2003 VULNHUM.DOC Page 2
TABLE OF CONTENTS
1. SUMMARY------------------------------------------------------------------------------------------------ 3
2. KEY DATA ------------------------------------------------------------------------------------------------ 4 Heat Radiation ------------------------------------------------------------------------------------------------------------------4 Overpressure---------------------------------------------------------------------------------------------------------------------6 Carbon Dioxide------------------------------------------------------------------------------------------------------------------7 Hydrogen Sulfide ---------------------------------------------------------------------------------------------------------------8 Protective Clothing for Human Survival in the North Sea--------------------------------------------------------- 11 Cause of Death in Survivable Helicopter Accidents------------------------------------------------------------------ 11 Probit Models------------------------------------------------------------------------------------------------------------------ 12
3. ONGOING RESEARCH ---------------------------------------------------------------------------- 16
REFERENCES-------------------------------------------------------------------------------------------- 17
Vulnerability of Humans E&P Forum QRA Datasheet Directory Rev 0
13/06/2003 VULNHUM.DOC Page 3
1. SUMMARY
This data sheet gives information regarding conditions at which humans might be adversely impacted by the following: • Heat Radiation • Blast Overpressure • Increased concentrations of Carbon Dioxide • Increased concentrations of Hydrogen Sulfide The information includes the effect of heat radiation based on thermal radiation intensity and exposure time, effects of overpressure as a result of a vapor cloud explosion, and toxicity data for carbon dioxide and hydrogen sulfide. This data sheet also provides information pertaining to protective clothing in relation to offshore search and rescue operations and the cause of death in survivable helicopter accidents. Finally, probit models are provided as one method to estimate the severity of personnel injuries in some of the above mentioned events.
The following are common abbreviations used to describe toxic or hazardous exposure: ACGIH American Conference of Governmental Industrial Hygienists NIOSH National Institute for Occupational Safety and Health OSHA Occupational Safety and Health Administration REL Recommended Exposure Limit TLV Threshold Limit Value TWA Time-weighted Average concentration for a normal 8-hour workday and 40 hour workweek to
which nearly all workers may be repeatedly exposed, day after day, without adverse effect STEL Short Term Exposure Limit is the maximum concentration to which workers can be exposed for
a period of up to 15 min continuously and which should not be repeated more than 4 times per day with at least 60 mins between successive exposures
C Ceiling is the concentration which should not be exceeded even instantaneously LCLo Lethal Concentration Low - lowest concentration of material reported to have caused death
in humans LCL50 Lethal Concentration - concentration of airborne material the inhalation of which results in death
of 50% of the test group IDLH Immediately Dangerous to Life and Health is the maximum concentration from which one could
escape within 30 min. without any escape-imparing symptoms or any irreversible effect PEL Permissible Exposure Limit Pk Peak hmn Human ihl Inhalation mam mammal pph/min Concentration in parts per hundred/minute of exposure ppm/min Concentration in parts per million/minute of exposure ERPG Emergency Response Planning Guidelines TLV Threshold Limit Value REL Recommended Exposure Limit EEGL Emergency Exposure Guideline Level CEGL Continuous Exposure Guideline Level
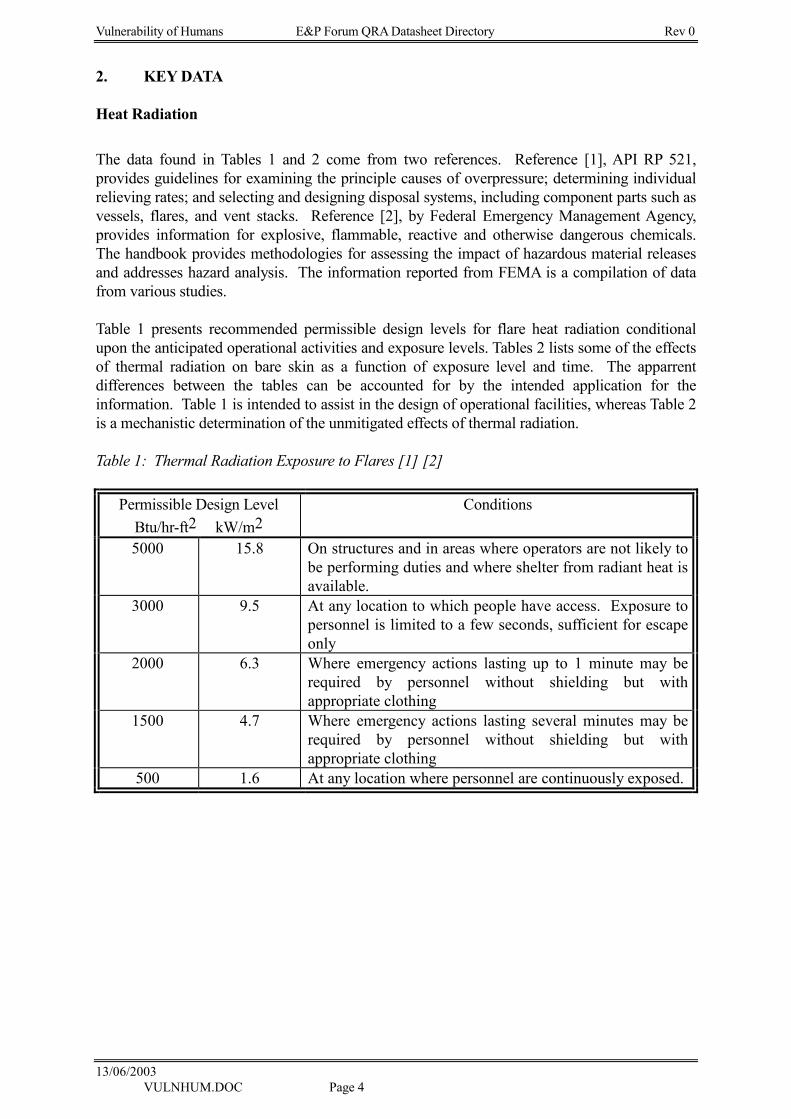
Vulnerability of Humans E&P Forum QRA Datasheet Directory Rev 0
13/06/2003 VULNHUM.DOC Page 4
2. KEY DATA Heat Radiation
The data found in Tables 1 and 2 come from two references. Reference [1], API RP 521, provides guidelines for examining the principle causes of overpressure; determining individual relieving rates; and selecting and designing disposal systems, including component parts such as vessels, flares, and vent stacks. Reference [2], by Federal Emergency Management Agency, provides information for explosive, flammable, reactive and otherwise dangerous chemicals. The handbook provides methodologies for assessing the impact of hazardous material releases and addresses hazard analysis. The information reported from FEMA is a compilation of data from various studies. Table 1 presents recommended permissible design levels for flare heat radiation conditional upon the anticipated operational activities and exposure levels. Tables 2 lists some of the effects of thermal radiation on bare skin as a function of exposure level and time. The apparrent differences between the tables can be accounted for by the intended application for the information. Table 1 is intended to assist in the design of operational facilities, whereas Table 2 is a mechanistic determination of the unmitigated effects of thermal radiation. Table 1: Thermal Radiation Exposure to Flares [1] [2]
Permissible Design Level Btu/hr-ft2 kW/m2
Conditions
5000 15.8 On structures and in areas where operators are not likely to be performing duties and where shelter from radiant heat is available.
3000 9.5 At any location to which people have access. Exposure to personnel is limited to a few seconds, sufficient for escape only
2000 6.3 Where emergency actions lasting up to 1 minute may be required by personnel without shielding but with appropriate clothing
1500 4.7 Where emergency actions lasting several minutes may be required by personnel without shielding but with appropriate clothing
500 1.6 At any location where personnel are continuously exposed.
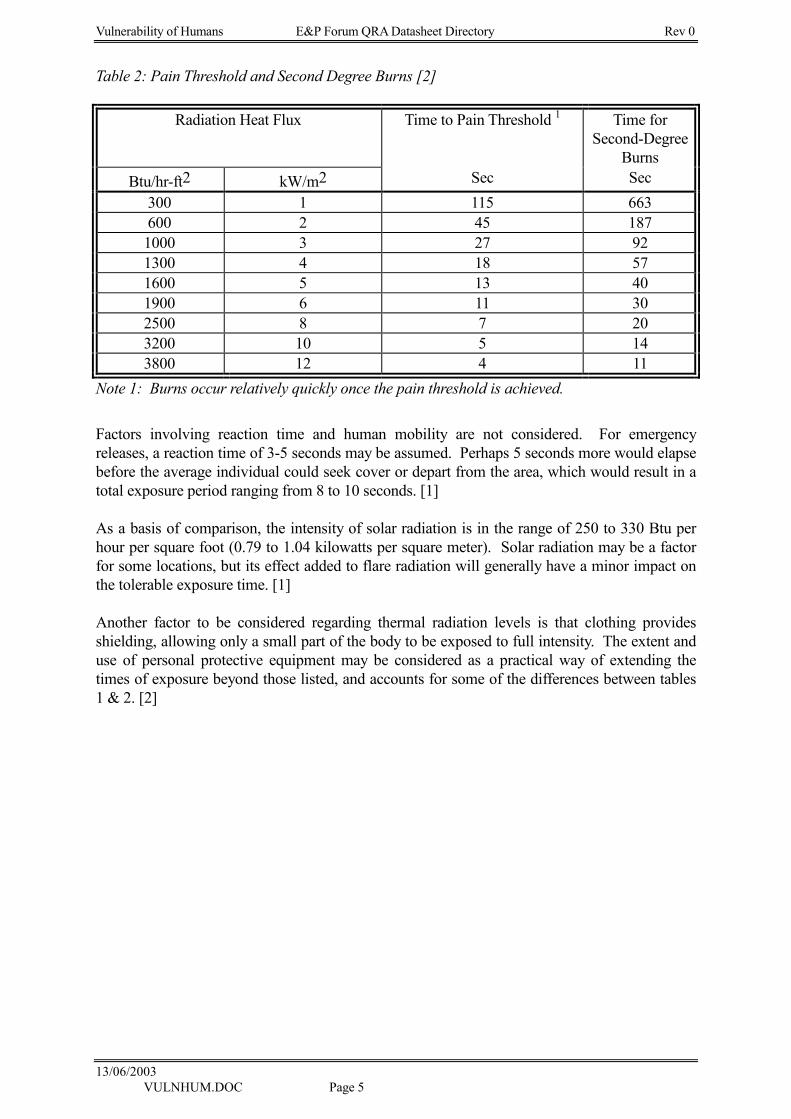
Vulnerability of Humans E&P Forum QRA Datasheet Directory Rev 0
13/06/2003 VULNHUM.DOC Page 5
Table 2: Pain Threshold and Second Degree Burns [2]
Radiation Heat Flux Time to Pain Threshold 1 Time for Second-Degree
Burns Btu/hr-ft2 kW/m2 Sec Sec
300 1 115 663 600 2 45 187 1000 3 27 92 1300 4 18 57 1600 5 13 40 1900 6 11 30 2500 8 7 20 3200 10 5 14 3800 12 4 11
Note 1: Burns occur relatively quickly once the pain threshold is achieved.
Factors involving reaction time and human mobility are not considered. For emergency releases, a reaction time of 3-5 seconds may be assumed. Perhaps 5 seconds more would elapse before the average individual could seek cover or depart from the area, which would result in a total exposure period ranging from 8 to 10 seconds. [1] As a basis of comparison, the intensity of solar radiation is in the range of 250 to 330 Btu per hour per square foot (0.79 to 1.04 kilowatts per square meter). Solar radiation may be a factor for some locations, but its effect added to flare radiation will generally have a minor impact on the tolerable exposure time. [1] Another factor to be considered regarding thermal radiation levels is that clothing provides shielding, allowing only a small part of the body to be exposed to full intensity. The extent and use of personal protective equipment may be considered as a practical way of extending the times of exposure beyond those listed, and accounts for some of the differences between tables 1 & 2. [2]
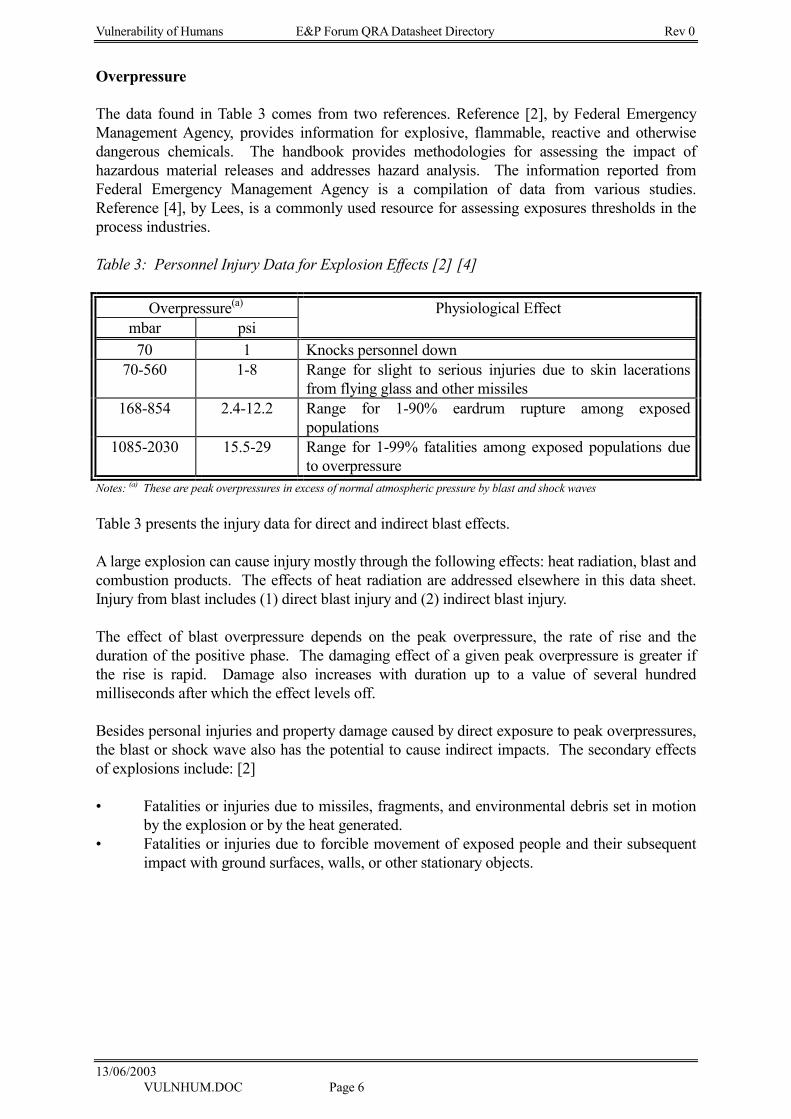
Vulnerability of Humans E&P Forum QRA Datasheet Directory Rev 0
13/06/2003 VULNHUM.DOC Page 6
Overpressure The data found in Table 3 comes from two references. Reference [2], by Federal Emergency Management Agency, provides information for explosive, flammable, reactive and otherwise dangerous chemicals. The handbook provides methodologies for assessing the impact of hazardous material releases and addresses hazard analysis. The information reported from Federal Emergency Management Agency is a compilation of data from various studies. Reference [4], by Lees, is a commonly used resource for assessing exposures thresholds in the process industries. Table 3: Personnel Injury Data for Explosion Effects [2] [4]
Overpressure(a) Physiological Effect mbar psi
70 1 Knocks personnel down 70-560 1-8 Range for slight to serious injuries due to skin lacerations
from flying glass and other missiles 168-854 2.4-12.2 Range for 1-90% eardrum rupture among exposed
populations 1085-2030 15.5-29 Range for 1-99% fatalities among exposed populations due
to overpressure Notes: (a) These are peak overpressures in excess of normal atmospheric pressure by blast and shock waves
Table 3 presents the injury data for direct and indirect blast effects. A large explosion can cause injury mostly through the following effects: heat radiation, blast and combustion products. The effects of heat radiation are addressed elsewhere in this data sheet. Injury from blast includes (1) direct blast injury and (2) indirect blast injury.
The effect of blast overpressure depends on the peak overpressure, the rate of rise and the duration of the positive phase. The damaging effect of a given peak overpressure is greater if the rise is rapid. Damage also increases with duration up to a value of several hundred milliseconds after which the effect levels off. Besides personal injuries and property damage caused by direct exposure to peak overpressures, the blast or shock wave also has the potential to cause indirect impacts. The secondary effects of explosions include: [2] • Fatalities or injuries due to missiles, fragments, and environmental debris set in motion by the explosion or by the heat generated. • Fatalities or injuries due to forcible movement of exposed people and their subsequent impact with ground surfaces, walls, or other stationary objects.
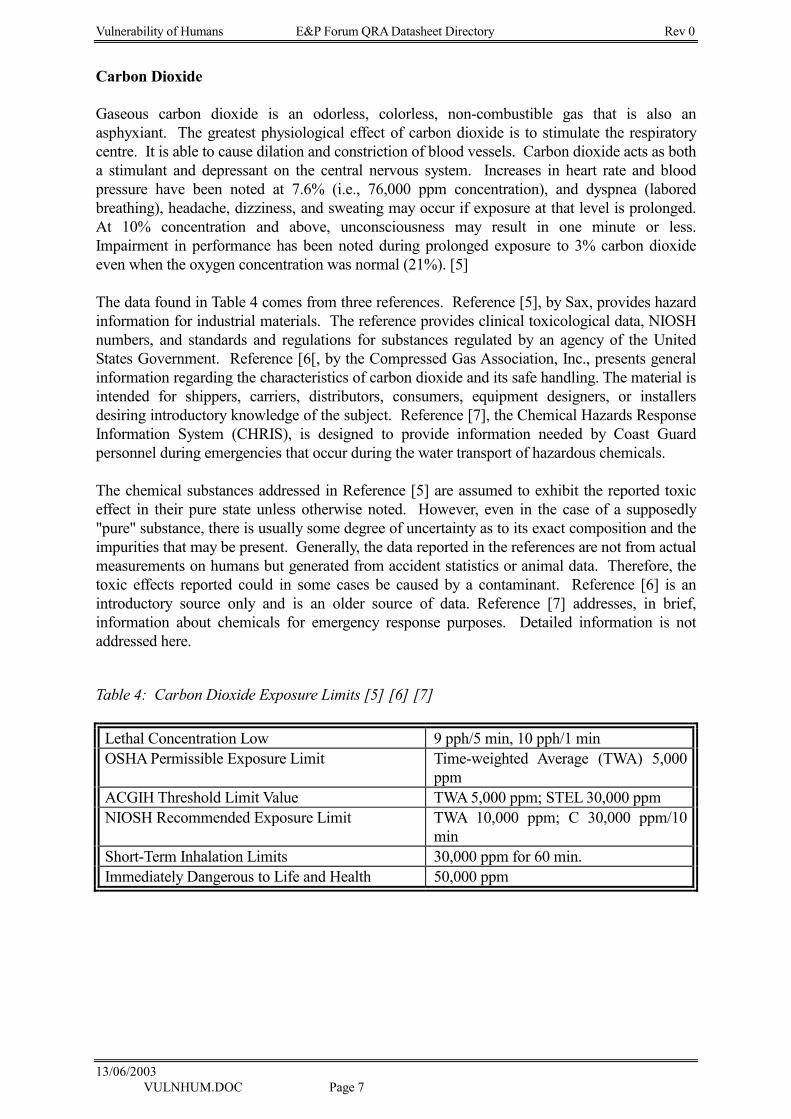
Vulnerability of Humans E&P Forum QRA Datasheet Directory Rev 0
13/06/2003 VULNHUM.DOC Page 7
Carbon Dioxide Gaseous carbon dioxide is an odorless, colorless, non-combustible gas that is also an asphyxiant. The greatest physiological effect of carbon dioxide is to stimulate the respiratory centre. It is able to cause dilation and constriction of blood vessels. Carbon dioxide acts as both a stimulant and depressant on the central nervous system. Increases in heart rate and blood pressure have been noted at 7.6% (i.e., 76,000 ppm concentration), and dyspnea (labored breathing), headache, dizziness, and sweating may occur if exposure at that level is prolonged. At 10% concentration and above, unconsciousness may result in one minute or less. Impairment in performance has been noted during prolonged exposure to 3% carbon dioxide even when the oxygen concentration was normal (21%). [5] The data found in Table 4 comes from three references. Reference [5], by Sax, provides hazard information for industrial materials. The reference provides clinical toxicological data, NIOSH numbers, and standards and regulations for substances regulated by an agency of the United States Government. Reference [6[, by the Compressed Gas Association, Inc., presents general information regarding the characteristics of carbon dioxide and its safe handling. The material is intended for shippers, carriers, distributors, consumers, equipment designers, or installers desiring introductory knowledge of the subject. Reference [7], the Chemical Hazards Response Information System (CHRIS), is designed to provide information needed by Coast Guard personnel during emergencies that occur during the water transport of hazardous chemicals. The chemical substances addressed in Reference [5] are assumed to exhibit the reported toxic effect in their pure state unless otherwise noted. However, even in the case of a supposedly "pure" substance, there is usually some degree of uncertainty as to its exact composition and the impurities that may be present. Generally, the data reported in the references are not from actual measurements on humans but generated from accident statistics or animal data. Therefore, the toxic effects reported could in some cases be caused by a contaminant. Reference [6] is an introductory source only and is an older source of data. Reference [7] addresses, in brief, information about chemicals for emergency response purposes. Detailed information is not addressed here.
Table 4: Carbon Dioxide Exposure Limits [5] [6] [7]
Lethal Concentration Low 9 pph/5 min, 10 pph/1 min OSHA Permissible Exposure Limit Time-weighted Average (TWA) 5,000
ppm ACGIH Threshold Limit Value TWA 5,000 ppm; STEL 30,000 ppm NIOSH Recommended Exposure Limit TWA 10,000 ppm; C 30,000 ppm/10
min Short-Term Inhalation Limits 30,000 ppm for 60 min. Immediately Dangerous to Life and Health 50,000 ppm
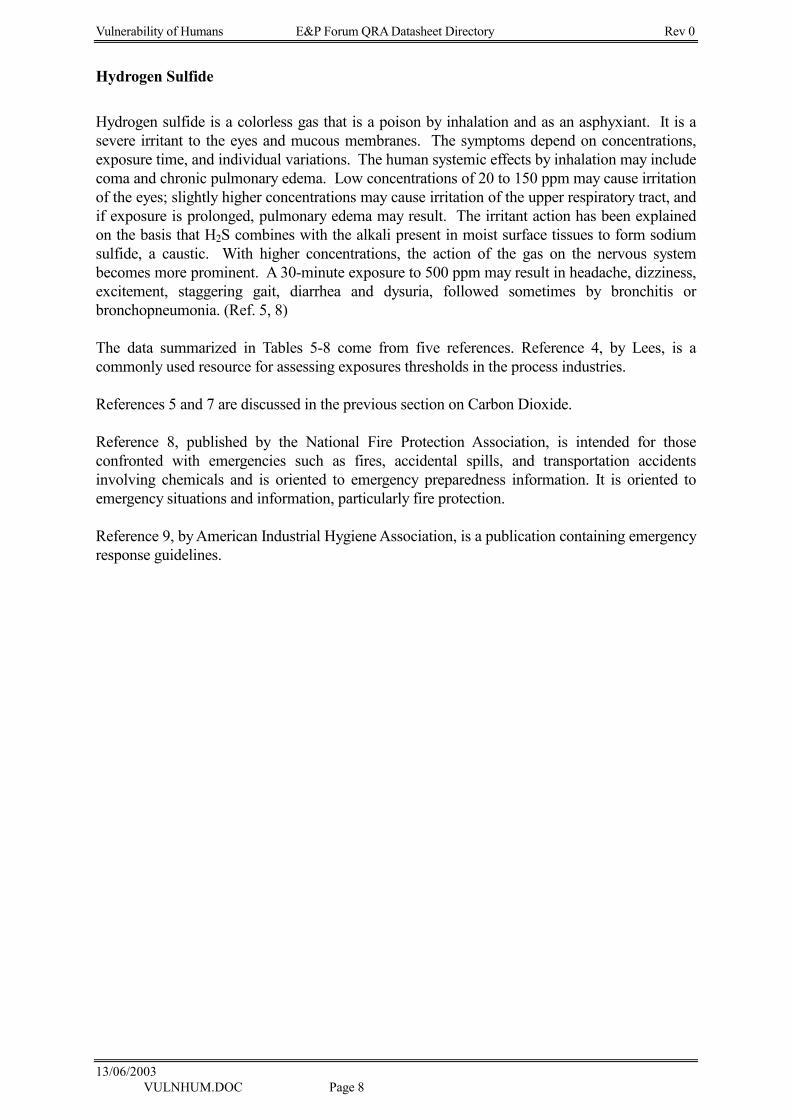
Vulnerability of Humans E&P Forum QRA Datasheet Directory Rev 0
13/06/2003 VULNHUM.DOC Page 8
Hydrogen Sulfide
Hydrogen sulfide is a colorless gas that is a poison by inhalation and as an asphyxiant. It is a severe irritant to the eyes and mucous membranes. The symptoms depend on concentrations, exposure time, and individual variations. The human systemic effects by inhalation may include coma and chronic pulmonary edema. Low concentrations of 20 to 150 ppm may cause irritation of the eyes; slightly higher concentrations may cause irritation of the upper respiratory tract, and if exposure is prolonged, pulmonary edema may result. The irritant action has been explained on the basis that H2S combines with the alkali present in moist surface tissues to form sodium sulfide, a caustic. With higher concentrations, the action of the gas on the nervous system becomes more prominent. A 30-minute exposure to 500 ppm may result in headache, dizziness, excitement, staggering gait, diarrhea and dysuria, followed sometimes by bronchitis or bronchopneumonia. (Ref. 5, 8)
The data summarized in Tables 5-8 come from five references. Reference 4, by Lees, is a commonly used resource for assessing exposures thresholds in the process industries. References 5 and 7 are discussed in the previous section on Carbon Dioxide. Reference 8, published by the National Fire Protection Association, is intended for those confronted with emergencies such as fires, accidental spills, and transportation accidents involving chemicals and is oriented to emergency preparedness information. It is oriented to emergency situations and information, particularly fire protection. Reference 9, by American Industrial Hygiene Association, is a publication containing emergency response guidelines.
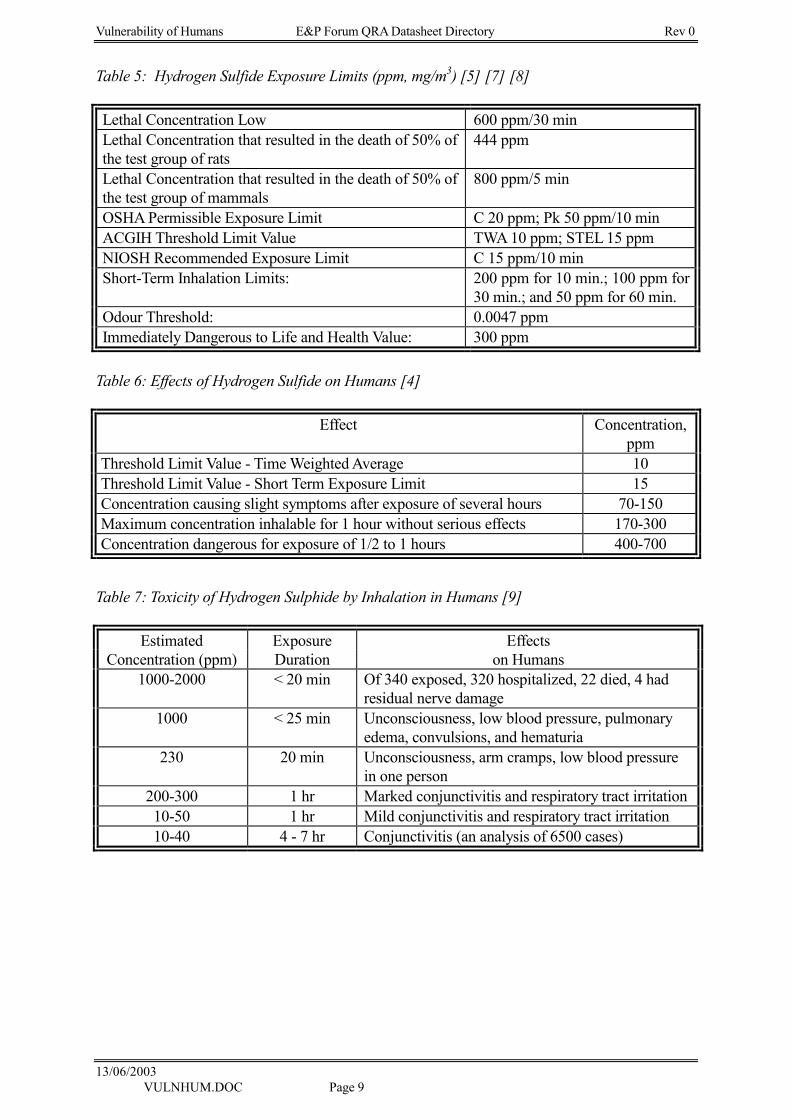
Vulnerability of Humans E&P Forum QRA Datasheet Directory Rev 0
13/06/2003 VULNHUM.DOC Page 9
Table 5: Hydrogen Sulfide Exposure Limits (ppm, mg/m3) [5] [7] [8] Lethal Concentration Low 600 ppm/30 min Lethal Concentration that resulted in the death of 50% of the test group of rats
444 ppm
Lethal Concentration that resulted in the death of 50% of the test group of mammals
800 ppm/5 min
OSHA Permissible Exposure Limit C 20 ppm; Pk 50 ppm/10 min ACGIH Threshold Limit Value TWA 10 ppm; STEL 15 ppm NIOSH Recommended Exposure Limit C 15 ppm/10 min Short-Term Inhalation Limits: 200 ppm for 10 min.; 100 ppm for
30 min.; and 50 ppm for 60 min. Odour Threshold: 0.0047 ppm Immediately Dangerous to Life and Health Value: 300 ppm
Table 6: Effects of Hydrogen Sulfide on Humans [4]
Effect Concentration, ppm
Threshold Limit Value - Time Weighted Average 10 Threshold Limit Value - Short Term Exposure Limit 15 Concentration causing slight symptoms after exposure of several hours 70-150 Maximum concentration inhalable for 1 hour without serious effects 170-300 Concentration dangerous for exposure of 1/2 to 1 hours 400-700
Table 7: Toxicity of Hydrogen Sulphide by Inhalation in Humans [9]
Estimated Exposure Effects Concentration (ppm) Duration on Humans
1000-2000 < 20 min Of 340 exposed, 320 hospitalized, 22 died, 4 had residual nerve damage
1000 < 25 min Unconsciousness, low blood pressure, pulmonary edema, convulsions, and hematuria
230 20 min Unconsciousness, arm cramps, low blood pressure in one person
200-300 1 hr Marked conjunctivitis and respiratory tract irritation 10-50 1 hr Mild conjunctivitis and respiratory tract irritation 10-40 4 - 7 hr Conjunctivitis (an analysis of 6500 cases)
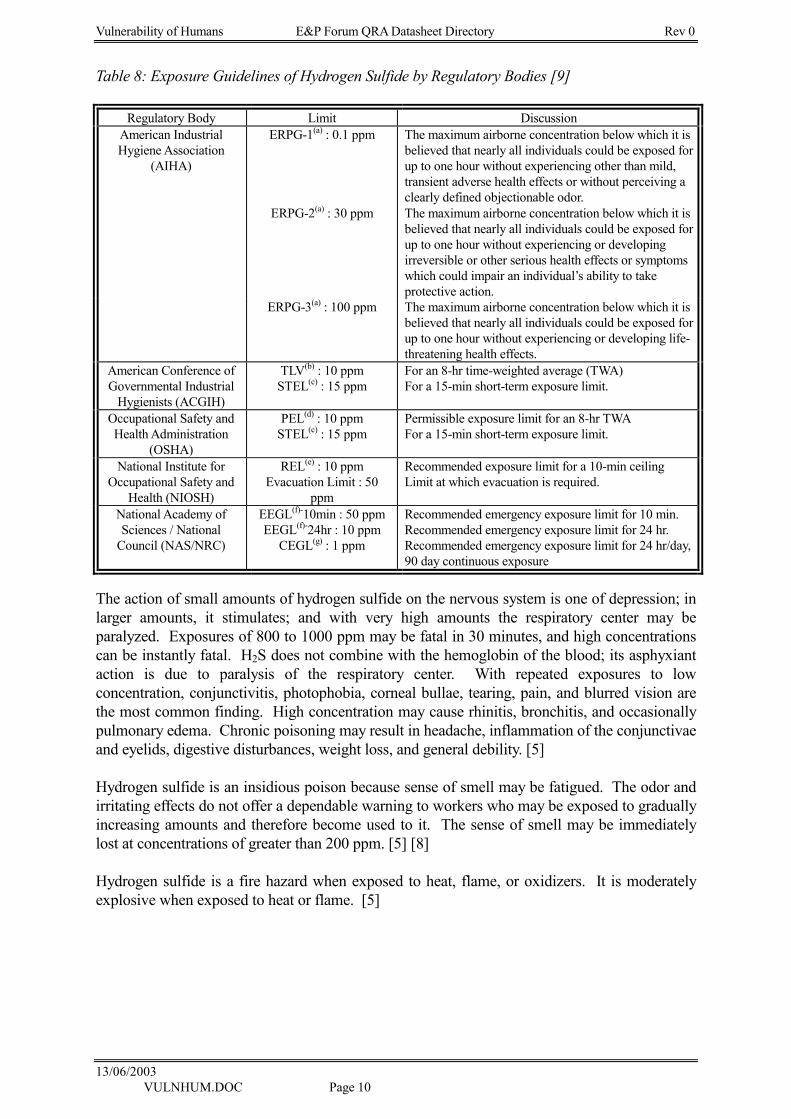
Vulnerability of Humans E&P Forum QRA Datasheet Directory Rev 0
13/06/2003 VULNHUM.DOC Page 10
Table 8: Exposure Guidelines of Hydrogen Sulfide by Regulatory Bodies [9]
Regulatory Body Limit Discussion American Industrial Hygiene Association
(AIHA)
ERPG-1(a) : 0.1 ppm The maximum airborne concentration below which it is believed that nearly all individuals could be exposed for up to one hour without experiencing other than mild, transient adverse health effects or without perceiving a clearly defined objectionable odor.
ERPG-2(a) : 30 ppm The maximum airborne concentration below which it is believed that nearly all individuals could be exposed for up to one hour without experiencing or developing irreversible or other serious health effects or symptoms which could impair an individual’s ability to take protective action.
ERPG-3(a) : 100 ppm The maximum airborne concentration below which it is believed that nearly all individuals could be exposed for up to one hour without experiencing or developing life-threatening health effects.
American Conference of Governmental Industrial
Hygienists (ACGIH)
TLV(b) : 10 ppm STEL(c) : 15 ppm
For an 8-hr time-weighted average (TWA) For a 15-min short-term exposure limit.
Occupational Safety and Health Administration
(OSHA)
PEL(d) : 10 ppm STEL(c) : 15 ppm
Permissible exposure limit for an 8-hr TWA For a 15-min short-term exposure limit.
National Institute for Occupational Safety and
Health (NIOSH)
REL(e) : 10 ppm Evacuation Limit : 50
ppm
Recommended exposure limit for a 10-min ceiling Limit at which evacuation is required.
National Academy of Sciences / National
Council (NAS/NRC)
EEGL(f)-10min : 50 ppm EEGL(f)-24hr : 10 ppm
CEGL(g) : 1 ppm
Recommended emergency exposure limit for 10 min. Recommended emergency exposure limit for 24 hr. Recommended emergency exposure limit for 24 hr/day, 90 day continuous exposure
The action of small amounts of hydrogen sulfide on the nervous system is one of depression; in larger amounts, it stimulates; and with very high amounts the respiratory center may be paralyzed. Exposures of 800 to 1000 ppm may be fatal in 30 minutes, and high concentrations can be instantly fatal. H2S does not combine with the hemoglobin of the blood; its asphyxiant action is due to paralysis of the respiratory center. With repeated exposures to low concentration, conjunctivitis, photophobia, corneal bullae, tearing, pain, and blurred vision are the most common finding. High concentration may cause rhinitis, bronchitis, and occasionally pulmonary edema. Chronic poisoning may result in headache, inflammation of the conjunctivae and eyelids, digestive disturbances, weight loss, and general debility. [5] Hydrogen sulfide is an insidious poison because sense of smell may be fatigued. The odor and irritating effects do not offer a dependable warning to workers who may be exposed to gradually increasing amounts and therefore become used to it. The sense of smell may be immediately lost at concentrations of greater than 200 ppm. [5] [8] Hydrogen sulfide is a fire hazard when exposed to heat, flame, or oxidizers. It is moderately explosive when exposed to heat or flame. [5]
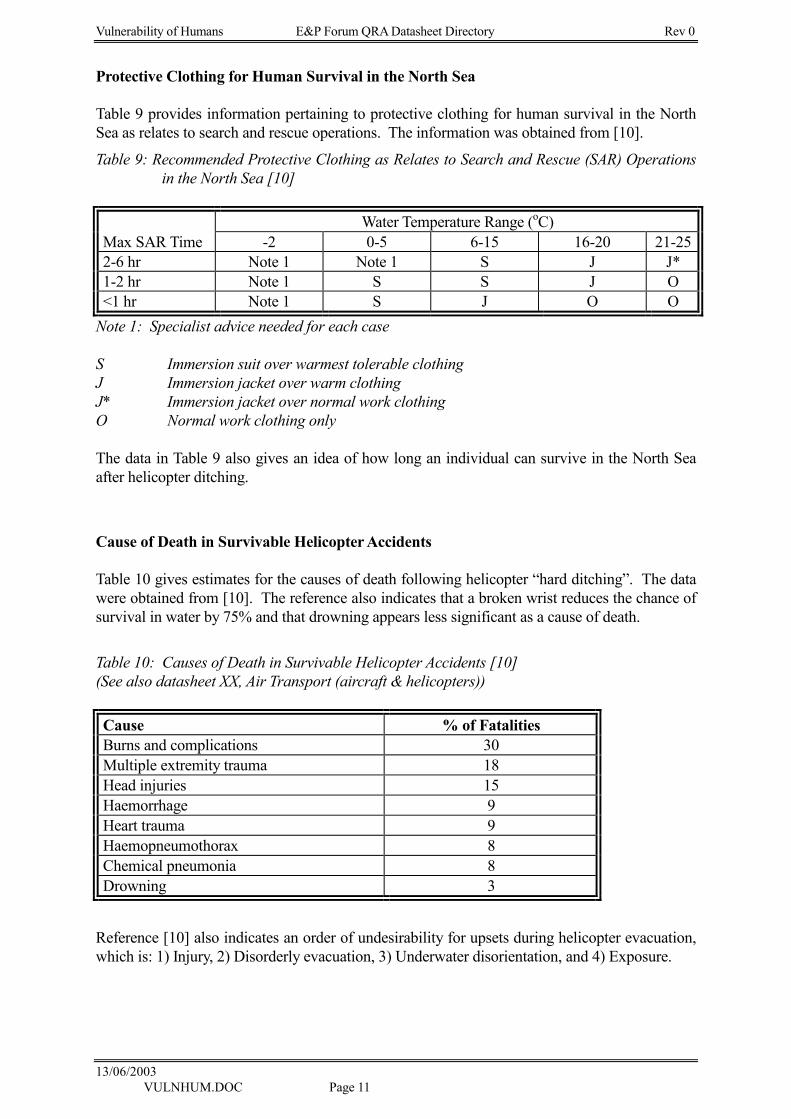
Vulnerability of Humans E&P Forum QRA Datasheet Directory Rev 0
13/06/2003 VULNHUM.DOC Page 11
Protective Clothing for Human Survival in the North Sea Table 9 provides information pertaining to protective clothing for human survival in the North Sea as relates to search and rescue operations. The information was obtained from [10].
Table 9: Recommended Protective Clothing as Relates to Search and Rescue (SAR) Operations in the North Sea [10]
Water Temperature Range (oC)
Max SAR Time -2 0-5 6-15 16-20 21-252-6 hr Note 1 Note 1 S J J* 1-2 hr Note 1 S S J O <1 hr Note 1 S J O O
Note 1: Specialist advice needed for each case S Immersion suit over warmest tolerable clothing J Immersion jacket over warm clothing J* Immersion jacket over normal work clothing O Normal work clothing only The data in Table 9 also gives an idea of how long an individual can survive in the North Sea after helicopter ditching.
Cause of Death in Survivable Helicopter Accidents
Table 10 gives estimates for the causes of death following helicopter “hard ditching”. The data were obtained from [10]. The reference also indicates that a broken wrist reduces the chance of survival in water by 75% and that drowning appears less significant as a cause of death.
Table 10: Causes of Death in Survivable Helicopter Accidents [10] (See also datasheet XX, Air Transport (aircraft & helicopters)) Cause % of Fatalities Burns and complications 30 Multiple extremity trauma 18 Head injuries 15 Haemorrhage 9 Heart trauma 9 Haemopneumothorax 8 Chemical pneumonia 8 Drowning 3
Reference [10] also indicates an order of undesirability for upsets during helicopter evacuation, which is: 1) Injury, 2) Disorderly evacuation, 3) Underwater disorientation, and 4) Exposure.
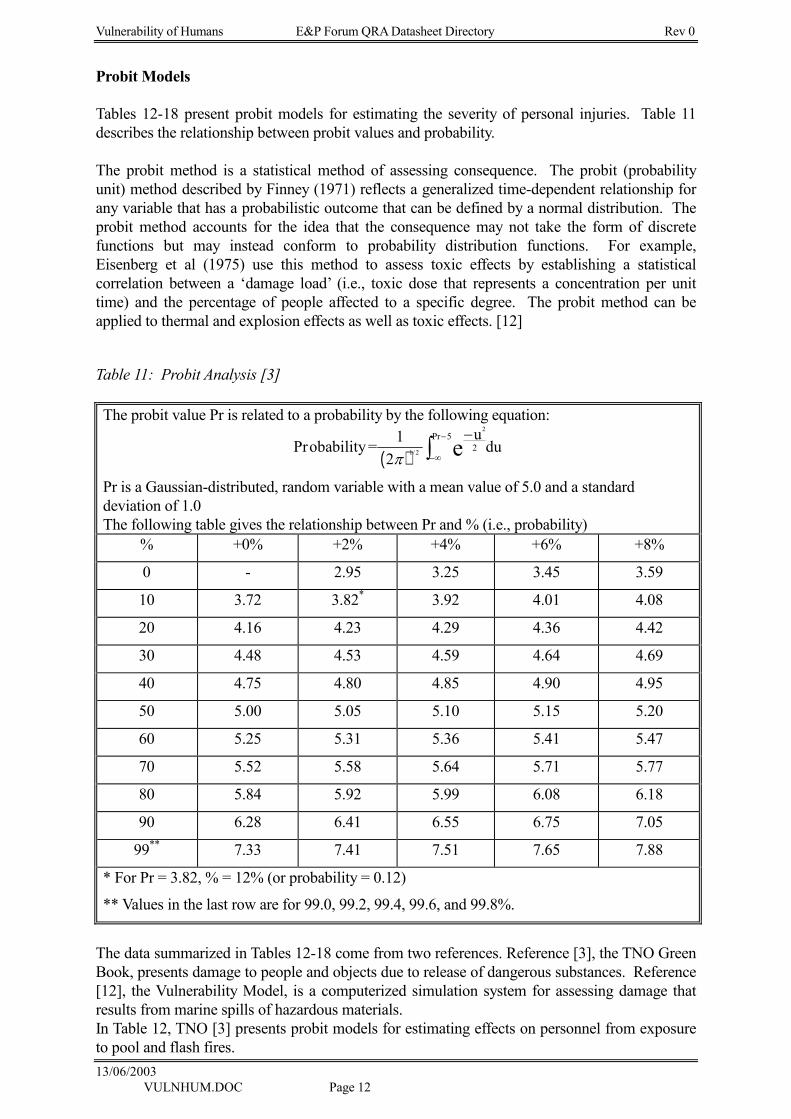
Vulnerability of Humans E&P Forum QRA Datasheet Directory Rev 0
13/06/2003 VULNHUM.DOC Page 12
Probit Models
Tables 12-18 present probit models for estimating the severity of personal injuries. Table 11 describes the relationship between probit values and probability. The probit method is a statistical method of assessing consequence. The probit (probability unit) method described by Finney (1971) reflects a generalized time-dependent relationship for any variable that has a probabilistic outcome that can be defined by a normal distribution. The probit method accounts for the idea that the consequence may not take the form of discrete functions but may instead conform to probability distribution functions. For example, Eisenberg et al (1975) use this method to assess toxic effects by establishing a statistical correlation between a ‘damage load’ (i.e., toxic dose that represents a concentration per unit time) and the percentage of people affected to a specific degree. The probit method can be applied to thermal and explosion effects as well as toxic effects. [12]
Table 11: Probit Analysis [3]
The probit value Pr is related to a probability by the following equation:
( )Pr =obability 1
2u
du1/ 2
2
2Pr 5
eπ−
−∞
−
∫Pr is a Gaussian-distributed, random variable with a mean value of 5.0 and a standard deviation of 1.0 The following table gives the relationship between Pr and % (i.e., probability)
% +0% +2% +4% +6% +8%
0 - 2.95 3.25 3.45 3.59
10 3.72 3.82* 3.92 4.01 4.08
20 4.16 4.23 4.29 4.36 4.42
30 4.48 4.53 4.59 4.64 4.69
40 4.75 4.80 4.85 4.90 4.95
50 5.00 5.05 5.10 5.15 5.20
60 5.25 5.31 5.36 5.41 5.47
70 5.52 5.58 5.64 5.71 5.77
80 5.84 5.92 5.99 6.08 6.18
90 6.28 6.41 6.55 6.75 7.05
99** 7.33 7.41 7.51 7.65 7.88
* For Pr = 3.82, % = 12% (or probability = 0.12)
** Values in the last row are for 99.0, 99.2, 99.4, 99.6, and 99.8%.
The data summarized in Tables 12-18 come from two references. Reference [3], the TNO Green Book, presents damage to people and objects due to release of dangerous substances. Reference [12], the Vulnerability Model, is a computerized simulation system for assessing damage that results from marine spills of hazardous materials. In Table 12, TNO [3] presents probit models for estimating effects on personnel from exposure to pool and flash fires.
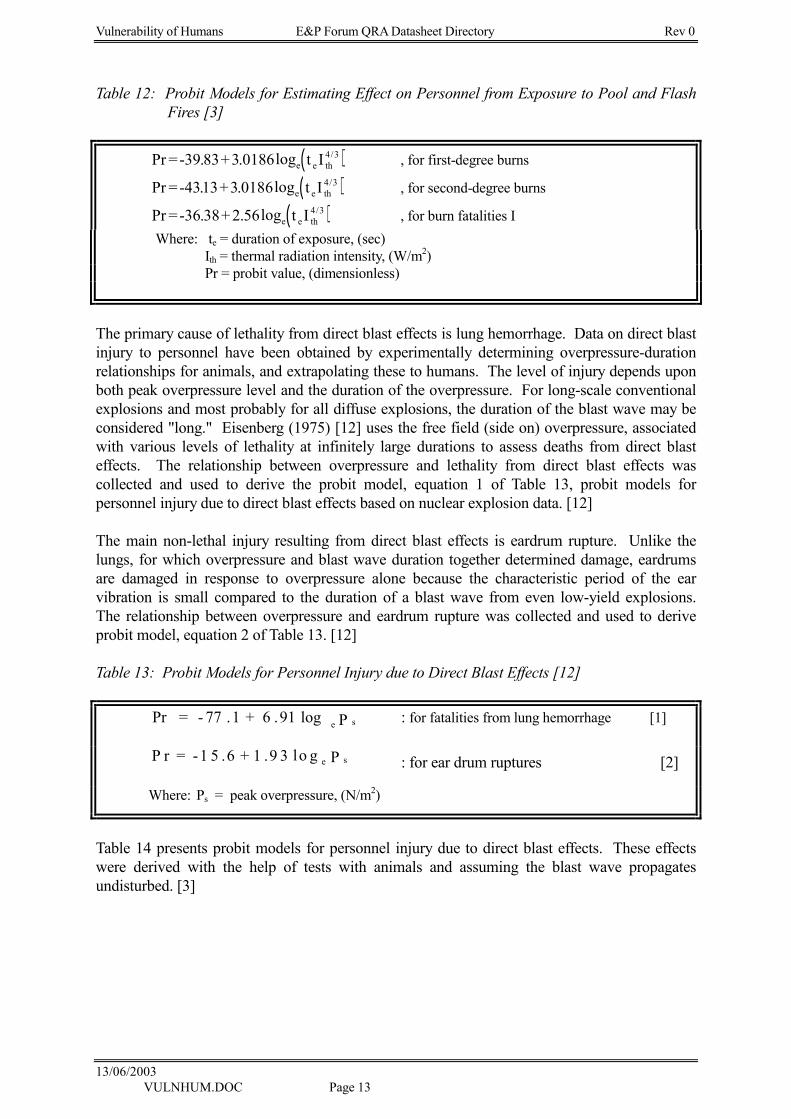
Vulnerability of Humans E&P Forum QRA Datasheet Directory Rev 0
13/06/2003 VULNHUM.DOC Page 13
Table 12: Probit Models for Estimating Effect on Personnel from Exposure to Pool and Flash
Fires [3]
( )Pr =-39. + . loge83 3 0186 t Ie th4/3 , for first-degree burns
( )Pr =-43. + . loge13 3 0186 t Ie th4/3 , for second-degree burns
( )Pr =-36. + . loge38 2 56 t Ie th4/3 , for burn fatalities I
Where: te = duration of exposure, (sec) Ith = thermal radiation intensity, (W/m2)Pr = probit value, (dimensionless)
The primary cause of lethality from direct blast effects is lung hemorrhage. Data on direct blast injury to personnel have been obtained by experimentally determining overpressure-duration relationships for animals, and extrapolating these to humans. The level of injury depends upon both peak overpressure level and the duration of the overpressure. For long-scale conventional explosions and most probably for all diffuse explosions, the duration of the blast wave may be considered "long." Eisenberg (1975) [12] uses the free field (side on) overpressure, associated with various levels of lethality at infinitely large durations to assess deaths from direct blast effects. The relationship between overpressure and lethality from direct blast effects was collected and used to derive the probit model, equation 1 of Table 13, probit models for personnel injury due to direct blast effects based on nuclear explosion data. [12] The main non-lethal injury resulting from direct blast effects is eardrum rupture. Unlike the lungs, for which overpressure and blast wave duration together determined damage, eardrums are damaged in response to overpressure alone because the characteristic period of the ear vibration is small compared to the duration of a blast wave from even low-yield explosions. The relationship between overpressure and eardrum rupture was collected and used to derive probit model, equation 2 of Table 13. [12] Table 13: Probit Models for Personnel Injury due to Direct Blast Effects [12]
Pr = - 77 .1 + 6 .91 elog sP : for fatalities from lung hemorrhage [1]
P r = -1 5 .6 + 1 .9 3 lo g Pe s : for ear drum ruptures [2]
Where: Ps = peak overpressure, (N/m2)
Table 14 presents probit models for personnel injury due to direct blast effects. These effects were derived with the help of tests with animals and assuming the blast wave propagates undisturbed. [3]
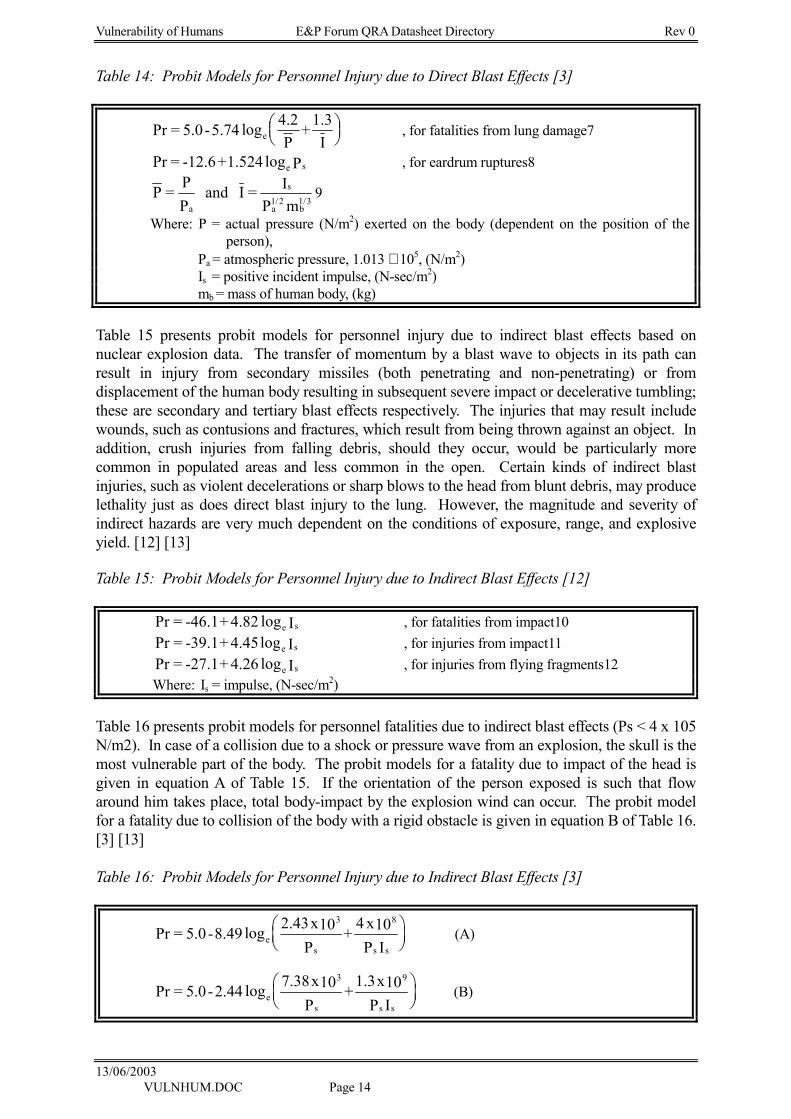
Vulnerability of Humans E&P Forum QRA Datasheet Directory Rev 0
13/06/2003 VULNHUM.DOC Page 14
Table 14: Probit Models for Personnel Injury due to Direct Blast Effects [3]
Pr = 5.0-5.74 log 4.2P
+ 1.3Ie
, for fatalities from lung damage7
Pr = -12.6+1.524 log Pe s , for eardrum ruptures8
P = PP
and I = IP ma
s
a1/2
b1/3
9
Where: P = actual pressure (N/m2) exerted on the body (dependent on the position of the person),
Pa = atmospheric pressure, 1.013 × 10⁵, (N/m2)Is = positive incident impulse, (N-sec/m2)mb = mass of human body, (kg)
Table 15 presents probit models for personnel injury due to indirect blast effects based on nuclear explosion data. The transfer of momentum by a blast wave to objects in its path can result in injury from secondary missiles (both penetrating and non-penetrating) or from displacement of the human body resulting in subsequent severe impact or decelerative tumbling; these are secondary and tertiary blast effects respectively. The injuries that may result include wounds, such as contusions and fractures, which result from being thrown against an object. In addition, crush injuries from falling debris, should they occur, would be particularly more common in populated areas and less common in the open. Certain kinds of indirect blast injuries, such as violent decelerations or sharp blows to the head from blunt debris, may produce lethality just as does direct blast injury to the lung. However, the magnitude and severity of indirect hazards are very much dependent on the conditions of exposure, range, and explosive yield. [12] [13] Table 15: Probit Models for Personnel Injury due to Indirect Blast Effects [12]
Pr = -46.1+ 4.82 log Ie s , for fatalities from impact10 Pr = -39.1+ 4.45log Ie s , for injuries from impact11 Pr = -27.1+ 4.26 log Ie s , for injuries from flying fragments12 Where: Is = impulse, (N-sec/m2)
Table 16 presents probit models for personnel fatalities due to indirect blast effects (Ps < 4 x 10⁵ N/m2). In case of a collision due to a shock or pressure wave from an explosion, the skull is the most vulnerable part of the body. The probit models for a fatality due to impact of the head is given in equation A of Table 15. If the orientation of the person exposed is such that flow around him takes place, total body-impact by the explosion wind can occur. The probit model for a fatality due to collision of the body with a rigid obstacle is given in equation B of Table 16. [3] [13] Table 16: Probit Models for Personnel Injury due to Indirect Blast Effects [3]
Pr = 5.0 -8.49 log 2.43x10P
+ 4 x10P I
e
3
s
8
s s
(A)
Pr = 5.0-2.44 log 7.38x10P
+ 1.3x10P I
e
3
s
9
s s
(B)
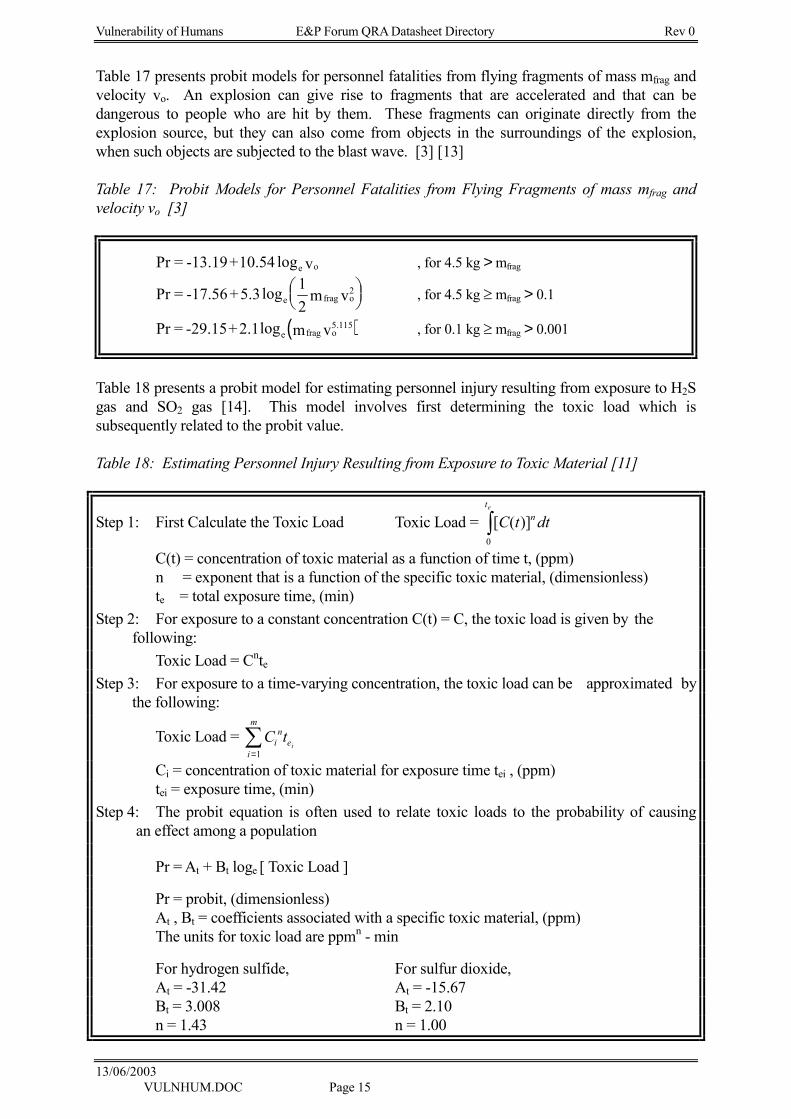
Vulnerability of Humans E&P Forum QRA Datasheet Directory Rev 0
13/06/2003 VULNHUM.DOC Page 15
Table 17 presents probit models for personnel fatalities from flying fragments of mass mfrag and velocity vo. An explosion can give rise to fragments that are accelerated and that can be dangerous to people who are hit by them. These fragments can originate directly from the explosion source, but they can also come from objects in the surroundings of the explosion, when such objects are subjected to the blast wave. [3] [13] Table 17: Probit Models for Personnel Fatalities from Flying Fragments of mass mfrag and velocity vo [3]
Pr = -13.19+10.54 log ve o , for 4.5 kg > mfrag
Pr = -17.56+5.3log 12
m v e frag o2
, for 4.5 kg ≥ mfrag > 0.1
( )Pr = -29.15+2.1log m ve frag o5.115 , for 0.1 kg ≥ mfrag > 0.001
Table 18 presents a probit model for estimating personnel injury resulting from exposure to H2Sgas and SO2 gas [14]. This model involves first determining the toxic load which is subsequently related to the probit value. Table 18: Estimating Personnel Injury Resulting from Exposure to Toxic Material [11]
Step 1: First Calculate the Toxic Load Toxic Load = [ ( )]C t dtnte
0∫
C(t) = concentration of toxic material as a function of time t, (ppm) n = exponent that is a function of the specific toxic material, (dimensionless) te = total exposure time, (min)
Step 2: For exposure to a constant concentration C(t) = C, the toxic load is given by the following:
Toxic Load = CnteStep 3: For exposure to a time-varying concentration, the toxic load can be approximated by
the following:
Toxic Load = C tin
ei
m
i=∑
1
Ci = concentration of toxic material for exposure time tei , (ppm) tei = exposure time, (min)
Step 4: The probit equation is often used to relate toxic loads to the probability of causing an effect among a population
Pr = At + Bt loge [ Toxic Load ]
Pr = probit, (dimensionless) At , Bt = coefficients associated with a specific toxic material, (ppm) The units for toxic load are ppmn - min
For hydrogen sulfide, For sulfur dioxide, At = -31.42 At = -15.67 Bt = 3.008 Bt = 2.10 n = 1.43 n = 1.00
Vulnerability of Humans E&P Forum QRA Datasheet Directory Rev 0
13/06/2003 VULNHUM.DOC Page 16
3. ONGOING RESEARCH
An E&P Forum member has initiated an effort to collate the current and relevant data on human vulnerability. The study intends to have leading consultants in the field search available sources for impairment and fatality thresholds for a variety of parameters. Such parameters will include: • Blast Overpressure • Heat Radiation • Increased concentrations of Carbon Dioxide • Increased concentrations of Carbon Monoxide • Reduced concentrations of Oxygen • Heat build-up (i.e., indoors as opposed to heat radiation such as within a temporary
refuge) • Hydrogen Sulfide • Toxic Products of Combustion/Smoke Particles • Hydrogen Fluoride • Carbonyl Fluoride • Phosgene
HSE / W.S. Atkins are currently undertaking additional research into the vulnerability of building occupants to explosion events.
Vulnerability of Humans E&P Forum QRA Datasheet Directory Rev 0
13/06/2003 VULNHUM.DOC Page 17
REFERENCES
1. American Petroleum Institute (API), Guide for Pressure-Relieving and Depressuring Systems, Recommended Practice 521, Third Edition, API, Washington, D.C., November 1990. 2. Federal Emergency Management Agency, Handbook of Chemical Hazard Analysis Procedures, available from Federal Emergency Management Agency, Publications Office, 500 C Street, SW, Washington, D. C. 20472. 3. Methods for the Determination of Possible Damage to People and Objects Resulting From Releases of Hazardous Materials (TNO Green Book)," CPR 16E, The Netherlands Organization of Applied Scientific Research, Voorburg, December 1989. 4. F. P. Lees, Loss Prevention in the Process Industries, Volume 1, ISBN 0-0408- 010604-2, Butterworths, London and Boston, 1980. 5. N. Irving Sax and Richard J. Lewis, Sr., Dangerous Properties of Industrial Materials, Seventh Edition, 3 Volume, 1989, published by Van Nostrand Reinhold, New York, NY, ISBN 0-442-28020-3. 6. Carbon Dioxide, CGA G-6 - 1984, Compressed Gas Association, Inc., Fourth Edition, 1989. 7. CHRIS Hazardous Chemical Data, U.S. Department of Transportation, United States Coast Guard, Commandant Instruction M16465.12A. 8. Fire Protection Guide on Hazardous Materials, 10th Edition, page 49-101 NFPA, published by National Fire Protection Association, 1991. 9. Emergency Response Planning Guidelines, American Industrial Hygiene Association, November 1991. 10. E&P Forum Member Source. 11. Chemical Process Quantitative Risk Analysis, Center for Chemical Process Safety of the American Institute of Chemical Engineers, 1989. 12. N. A. Eisenberg, C.J. Lynch, and R. J. Breeding, Vulnerability Model - A Simulation System for Assessing Damage Resulting from Marine Spills, CG-D-136-75 (NTIS ADA-015-245), Prepared by Enviro Control, Inc., for the U.S. Coast Guard, Office of Research and Development, June 1975. 13. Hazard Evaluation Consequence Analysis Methods, training course, JBF Associates, Inc. 1994. 14. Guidelines for Chemical Process Quantitative Risk Analysis, ISBN 0-8169-0402-2, published by the Center for Chemical Process Safety of the American Institute of Chemical Engineers, 1989.

Vulnerability of Humans E&P Forum QRA Datasheet Directory Rev 0
13/06/2003 VULNHUM.DOC Page 18

Vulnerability of Plant/Structures E&P Forum QRA Datasheet Directory Rev 0
13/06/2003 VULNPLNT.DOC Page 1
VULNERABILITY OF PLANT/STRUCTURE
Vulnerability of Plant/Structures E&P Forum QRA Datasheet Directory Rev 0
13/06/2003 VULNPLNT.DOC Page 2
TABLE OF CONTENTS
1. SUMMARY -------------------------------------------------------------------------------------------- 3
1.1 Scope ---------------------------------------------------------------------------------------------------------------------3
1.2 Application--------------------------------------------------------------------------------------------------------------3
2. THERMAL RESPONSE OF STRUCTURES------------------------------------------------- 4
2.1 Data ----------------------------------------------------------------------------------------------------------------------4
2.2 Discussion ---------------------------------------------------------------------------------------------------------------5
3. EXPLOSION RESPONSE OF STRUCTURES---------------------------------------------- 6
3.1 Data ----------------------------------------------------------------------------------------------------------------------6
3.2 Effects Of Explosion Overpressure On Passive Fire Protection (PFP)--------------------------------------9
3.3 Discussion ---------------------------------------------------------------------------------------------------------------9
4. MISSILE LOADING ------------------------------------------------------------------------------- 10
4.1 Data -------------------------------------------------------------------------------------------------------------------- 10
5. ONGOING RESEARCH-------------------------------------------------------------------------- 12
6. REFERENCES ------------------------------------------------------------------------------------ 13
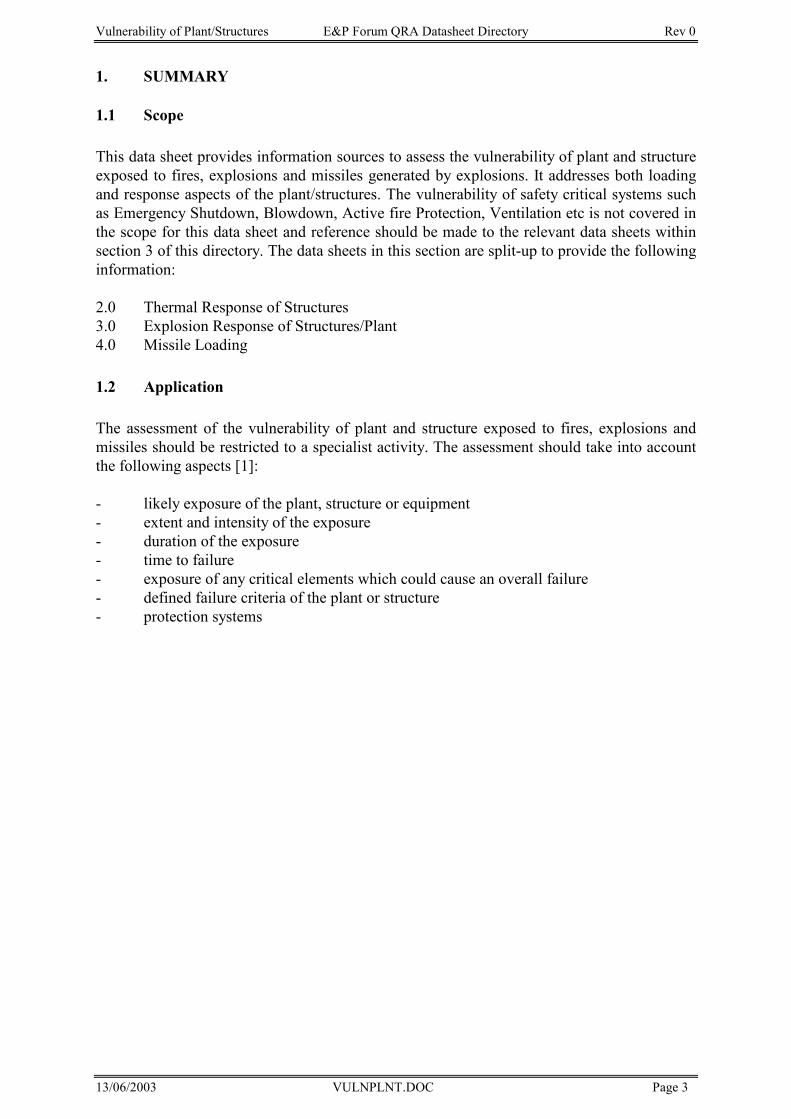
Vulnerability of Plant/Structures E&P Forum QRA Datasheet Directory Rev 0
13/06/2003 VULNPLNT.DOC Page 3
1. SUMMARY
1.1 Scope This data sheet provides information sources to assess the vulnerability of plant and structure exposed to fires, explosions and missiles generated by explosions. It addresses both loading and response aspects of the plant/structures. The vulnerability of safety critical systems such as Emergency Shutdown, Blowdown, Active fire Protection, Ventilation etc is not covered in the scope for this data sheet and reference should be made to the relevant data sheets within section 3 of this directory. The data sheets in this section are split-up to provide the following information: 2.0 Thermal Response of Structures 3.0 Explosion Response of Structures/Plant 4.0 Missile Loading 1.2 Application The assessment of the vulnerability of plant and structure exposed to fires, explosions and missiles should be restricted to a specialist activity. The assessment should take into account the following aspects [1]: - likely exposure of the plant, structure or equipment - extent and intensity of the exposure - duration of the exposure - time to failure - exposure of any critical elements which could cause an overall failure - defined failure criteria of the plant or structure - protection systems
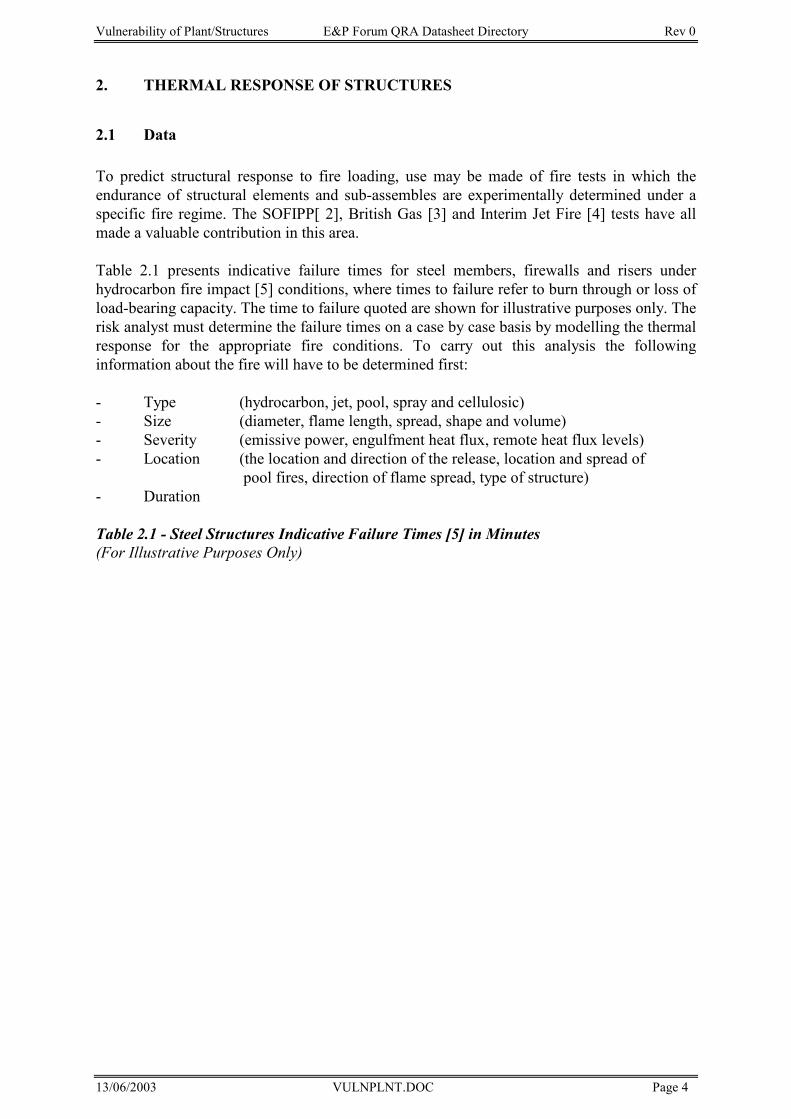
Vulnerability of Plant/Structures E&P Forum QRA Datasheet Directory Rev 0
13/06/2003 VULNPLNT.DOC Page 4
2. THERMAL RESPONSE OF STRUCTURES
2.1 Data To predict structural response to fire loading, use may be made of fire tests in which the endurance of structural elements and sub-assembles are experimentally determined under a specific fire regime. The SOFIPP[ 2], British Gas [3] and Interim Jet Fire [4] tests have all made a valuable contribution in this area. Table 2.1 presents indicative failure times for steel members, firewalls and risers under hydrocarbon fire impact [5] conditions, where times to failure refer to burn through or loss of load-bearing capacity. The time to failure quoted are shown for illustrative purposes only. The risk analyst must determine the failure times on a case by case basis by modelling the thermal response for the appropriate fire conditions. To carry out this analysis the following information about the fire will have to be determined first: - Type (hydrocarbon, jet, pool, spray and cellulosic) - Size (diameter, flame length, spread, shape and volume) - Severity (emissive power, engulfment heat flux, remote heat flux levels) - Location (the location and direction of the release, location and spread of pool fires, direction of flame spread, type of structure) - Duration Table 2.1 - Steel Structures Indicative Failure Times [5] in Minutes (For Illustrative Purposes Only)
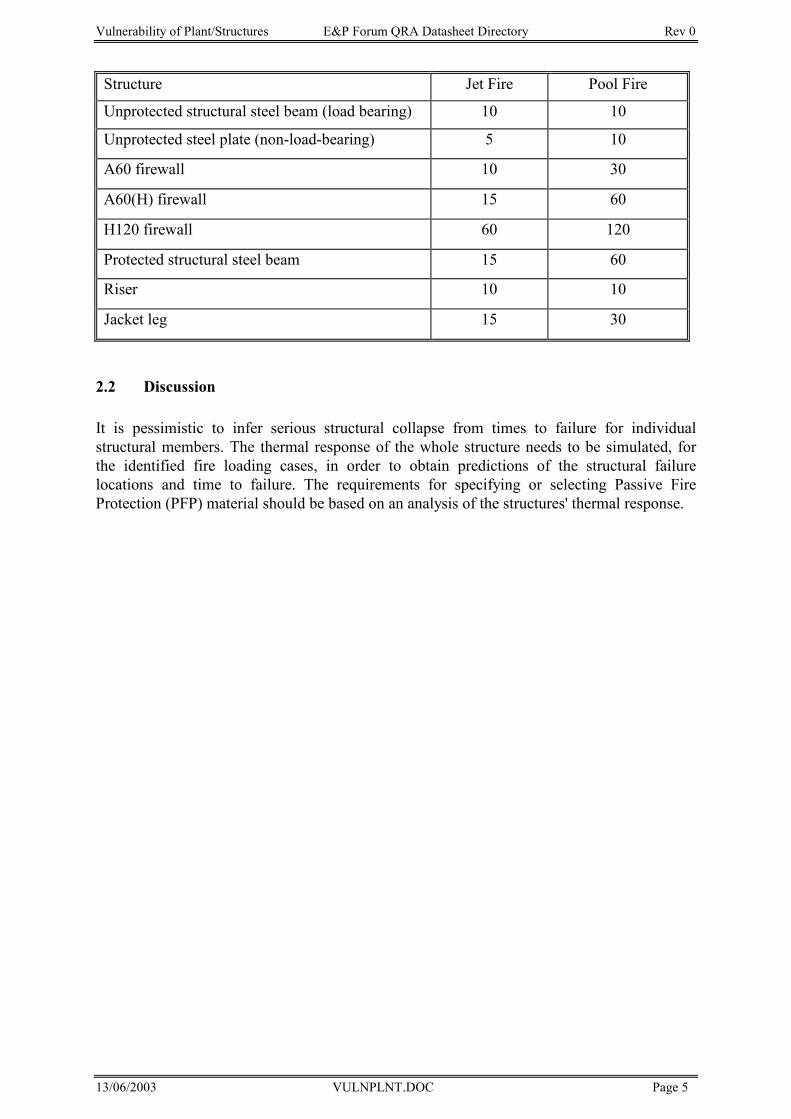
Vulnerability of Plant/Structures E&P Forum QRA Datasheet Directory Rev 0
13/06/2003 VULNPLNT.DOC Page 5
Structure Jet Fire Pool Fire
Unprotected structural steel beam (load bearing) 10 10
Unprotected steel plate (non-load-bearing) 5 10
A60 firewall 10 30
A60(H) firewall 15 60
H120 firewall 60 120
Protected structural steel beam 15 60
Riser 10 10
Jacket leg 15 30
2.2 Discussion It is pessimistic to infer serious structural collapse from times to failure for individual structural members. The thermal response of the whole structure needs to be simulated, for the identified fire loading cases, in order to obtain predictions of the structural failure locations and time to failure. The requirements for specifying or selecting Passive Fire Protection (PFP) material should be based on an analysis of the structures' thermal response.
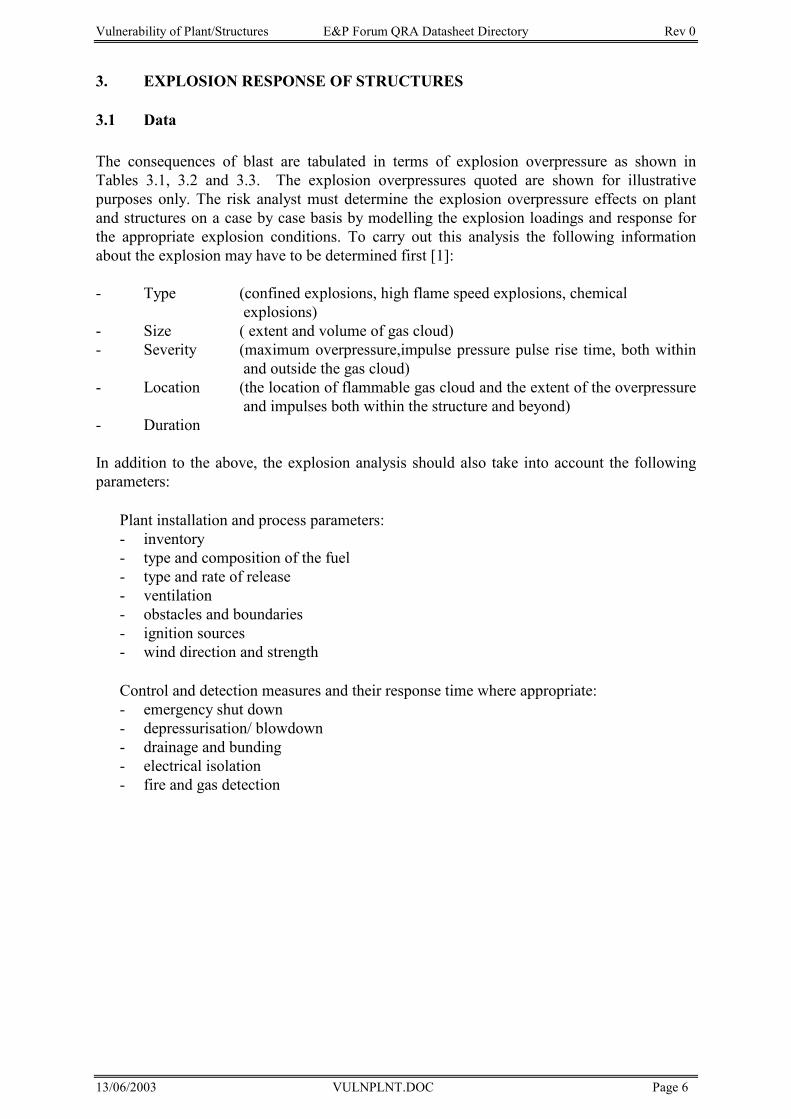
Vulnerability of Plant/Structures E&P Forum QRA Datasheet Directory Rev 0
13/06/2003 VULNPLNT.DOC Page 6
3. EXPLOSION RESPONSE OF STRUCTURES
3.1 Data The consequences of blast are tabulated in terms of explosion overpressure as shown in Tables 3.1, 3.2 and 3.3. The explosion overpressures quoted are shown for illustrative purposes only. The risk analyst must determine the explosion overpressure effects on plant and structures on a case by case basis by modelling the explosion loadings and response for the appropriate explosion conditions. To carry out this analysis the following information about the explosion may have to be determined first [1]: - Type (confined explosions, high flame speed explosions, chemical explosions) - Size ( extent and volume of gas cloud) - Severity (maximum overpressure,impulse pressure pulse rise time, both within
and outside the gas cloud) - Location (the location of flammable gas cloud and the extent of the overpressure and impulses both within the structure and beyond) - Duration In addition to the above, the explosion analysis should also take into account the following parameters: • Plant installation and process parameters:
- inventory - type and composition of the fuel - type and rate of release - ventilation - obstacles and boundaries - ignition sources - wind direction and strength
• Control and detection measures and their response time where appropriate:
- emergency shut down - depressurisation/ blowdown - drainage and bunding - electrical isolation - fire and gas detection
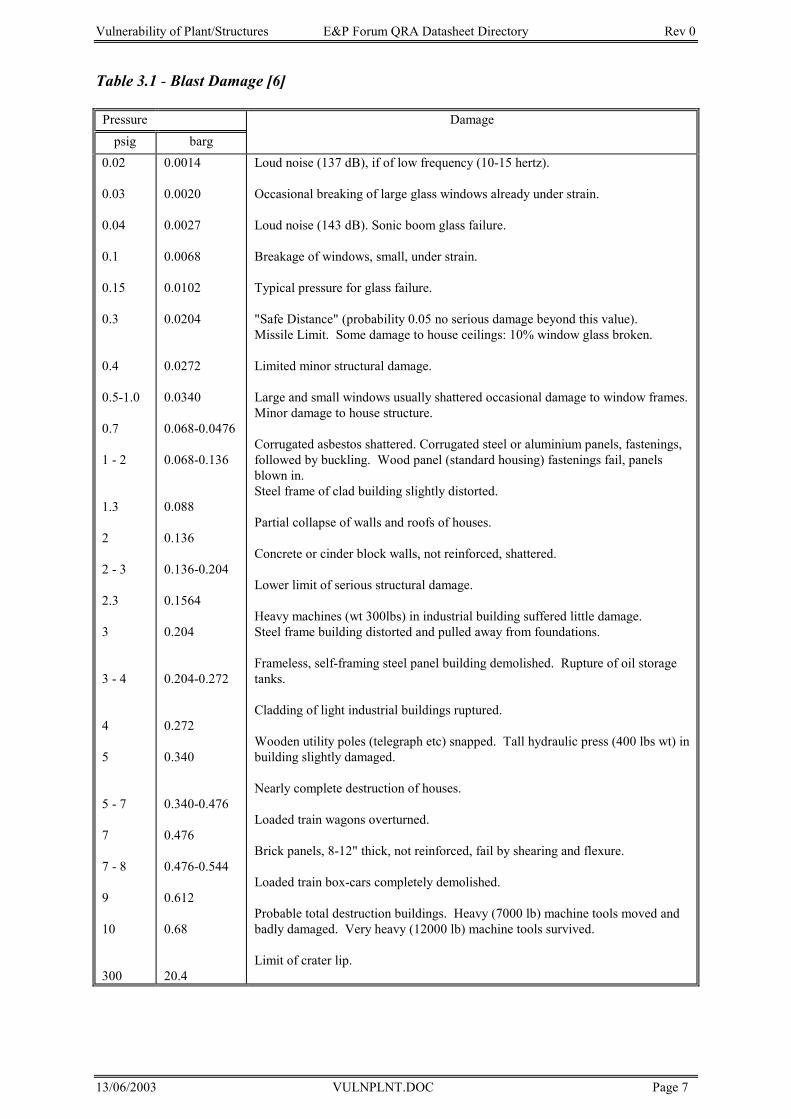
Vulnerability of Plant/Structures E&P Forum QRA Datasheet Directory Rev 0
13/06/2003 VULNPLNT.DOC Page 7
Table 3.1 - Blast Damage [6]
Pressure Damage
psig barg 0.02 0.03 0.04 0.1 0.15 0.3
0.4 0.5-1.0 0.7 1 - 2
1.3 2
2 - 3
2.3 3
3 - 4
4
5
5 - 7
7
7 - 8
9
10
300
0.0014 0.0020 0.0027 0.0068 0.0102 0.0204
0.0272 0.0340 0.068-0.0476 0.068-0.136
0.088 0.136 0.136-0.204 0.1564 0.204
0.204-0.272
0.272 0.340
0.340-0.476 0.476 0.476-0.544 0.612 0.68
20.4
Loud noise (137 dB), if of low frequency (10-15 hertz). Occasional breaking of large glass windows already under strain. Loud noise (143 dB). Sonic boom glass failure. Breakage of windows, small, under strain. Typical pressure for glass failure. "Safe Distance" (probability 0.05 no serious damage beyond this value). Missile Limit. Some damage to house ceilings: 10% window glass broken. Limited minor structural damage. Large and small windows usually shattered occasional damage to window frames. Minor damage to house structure. Corrugated asbestos shattered. Corrugated steel or aluminium panels, fastenings, followed by buckling. Wood panel (standard housing) fastenings fail, panels blown in. Steel frame of clad building slightly distorted. Partial collapse of walls and roofs of houses. Concrete or cinder block walls, not reinforced, shattered. Lower limit of serious structural damage. Heavy machines (wt 300lbs) in industrial building suffered little damage. Steel frame building distorted and pulled away from foundations. Frameless, self-framing steel panel building demolished. Rupture of oil storage tanks. Cladding of light industrial buildings ruptured. Wooden utility poles (telegraph etc) snapped. Tall hydraulic press (400 lbs wt) in building slightly damaged. Nearly complete destruction of houses. Loaded train wagons overturned. Brick panels, 8-12" thick, not reinforced, fail by shearing and flexure. Loaded train box-cars completely demolished. Probable total destruction buildings. Heavy (7000 lb) machine tools moved and badly damaged. Very heavy (12000 lb) machine tools survived. Limit of crater lip.
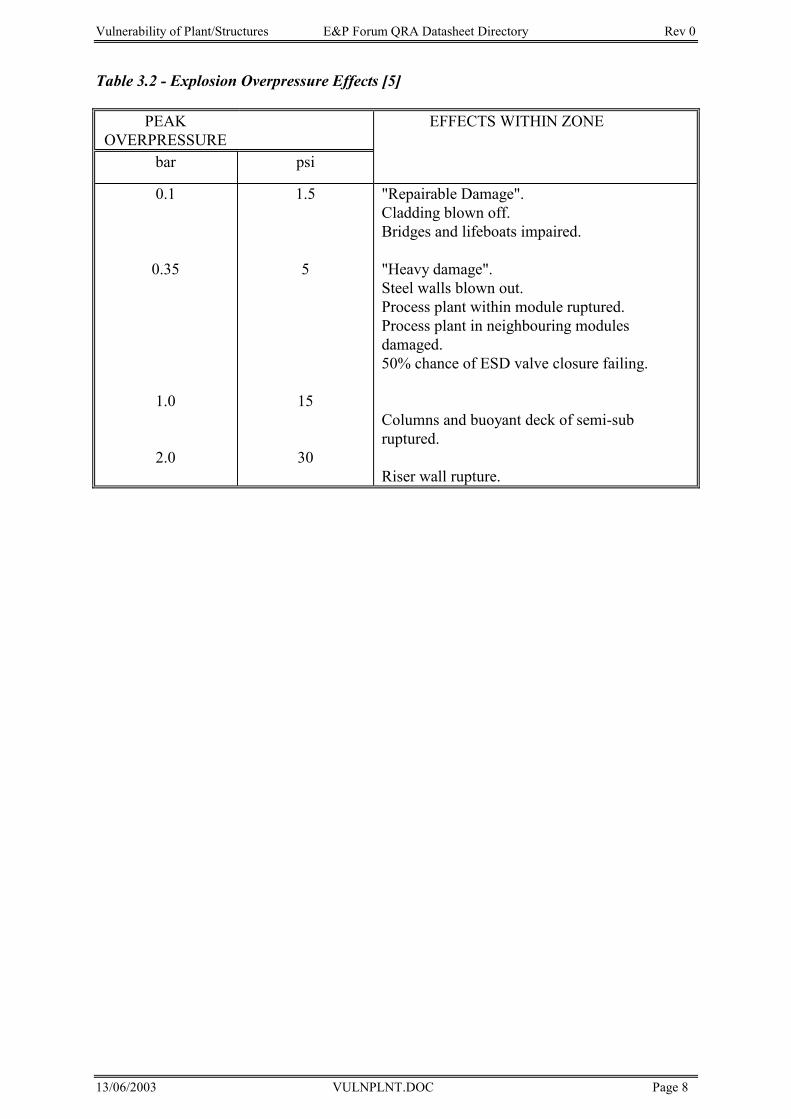
Vulnerability of Plant/Structures E&P Forum QRA Datasheet Directory Rev 0
13/06/2003 VULNPLNT.DOC Page 8
Table 3.2 - Explosion Overpressure Effects [5]
PEAK OVERPRESSURE
EFFECTS WITHIN ZONE
bar psi
0.1
0.35
1.0
2.0
1.5
5
15
30
"Repairable Damage". Cladding blown off. Bridges and lifeboats impaired. "Heavy damage". Steel walls blown out. Process plant within module ruptured. Process plant in neighbouring modules damaged. 50% chance of ESD valve closure failing.
Columns and buoyant deck of semi-sub ruptured. Riser wall rupture.
Vulnerability of Plant/Structures E&P Forum QRA Datasheet Directory Rev 0
13/06/2003 VULNPLNT.DOC Page 9
3.2 Effects Of Explosion Overpressure On Passive Fire Protection (PFP) In many cases, a fire event will be preceded by an explosion. The explosion overpressure may be insufficient to damage the structure but may be strong enough to dislodge the PFP. If the fireproofing is damaged or disbonded by the explosion, then the structural steel will not be adequately fire protected. It is critical for the applied passive fire protection to be able to withstand the predicted explosion overpressure. If the PFP loses its ability to remain effective following an explosion, then the escalation potential associated with the event should be taken into consideration.
3.3 Discussion The explosion response of the whole structure needs to be simulated, for the identified explosion overpressure cases, in order to obtain predictions of the structural failure locations. The analysis should consider the following points: • overall and local loads e.g. direct loads on blast walls and blast reaction forces on
plant/structure and any redistribution of externally applied or internally transmitted loads.
• dynamic response, both local and global.
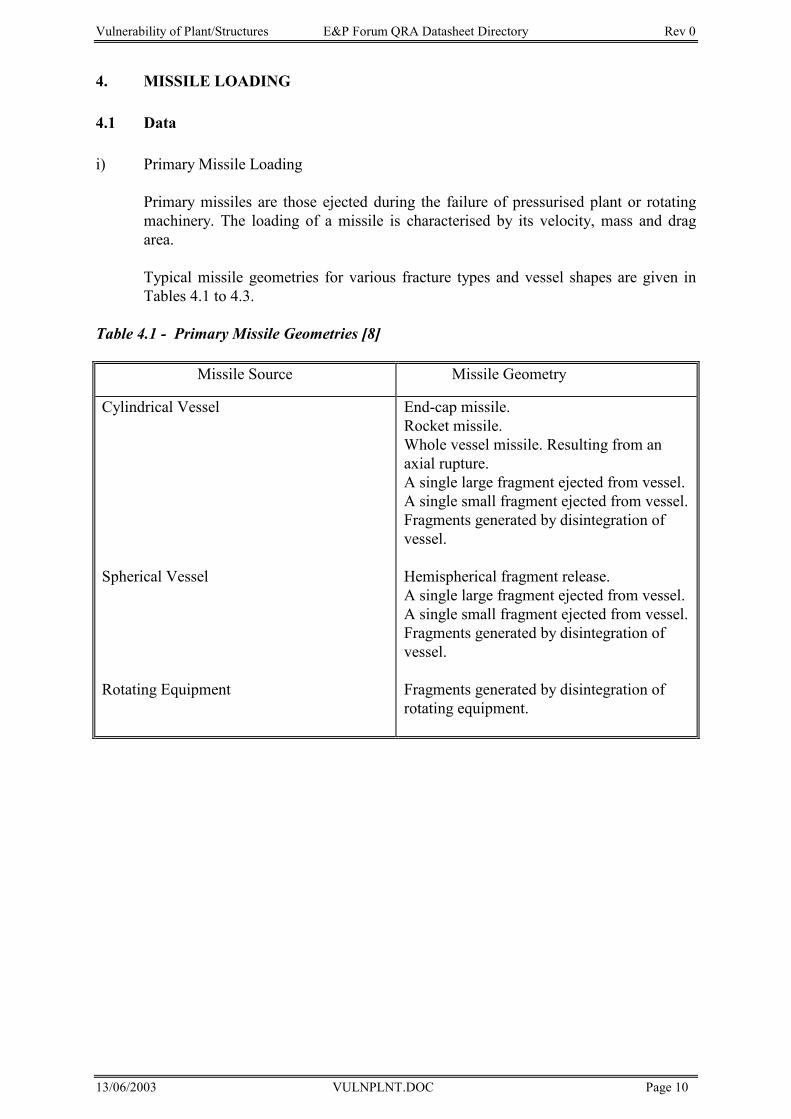
Vulnerability of Plant/Structures E&P Forum QRA Datasheet Directory Rev 0
13/06/2003 VULNPLNT.DOC Page 10
4. MISSILE LOADING 4.1 Data i) Primary Missile Loading
Primary missiles are those ejected during the failure of pressurised plant or rotating machinery. The loading of a missile is characterised by its velocity, mass and drag area. Typical missile geometries for various fracture types and vessel shapes are given in Tables 4.1 to 4.3.
Table 4.1 - Primary Missile Geometries [8]
Missile Source Missile Geometry
Cylindrical Vessel
Spherical Vessel
Rotating Equipment
End-cap missile. Rocket missile. Whole vessel missile. Resulting from an axial rupture. A single large fragment ejected from vessel. A single small fragment ejected from vessel. Fragments generated by disintegration of vessel. Hemispherical fragment release. A single large fragment ejected from vessel. A single small fragment ejected from vessel. Fragments generated by disintegration of vessel. Fragments generated by disintegration of rotating equipment.
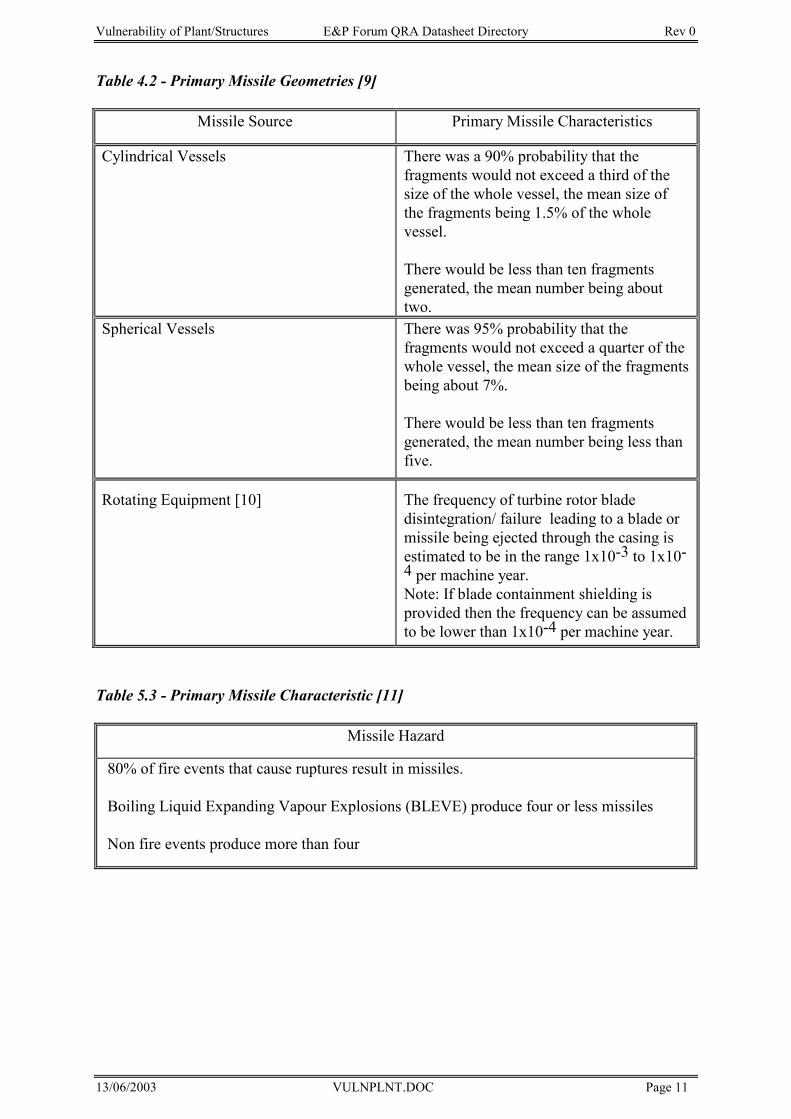
Vulnerability of Plant/Structures E&P Forum QRA Datasheet Directory Rev 0
13/06/2003 VULNPLNT.DOC Page 11
Table 4.2 - Primary Missile Geometries [9]
Missile Source Primary Missile Characteristics
Cylindrical Vessels There was a 90% probability that the fragments would not exceed a third of the size of the whole vessel, the mean size of the fragments being 1.5% of the whole vessel. There would be less than ten fragments generated, the mean number being about two.
Spherical Vessels There was 95% probability that the fragments would not exceed a quarter of the whole vessel, the mean size of the fragments being about 7%. There would be less than ten fragments generated, the mean number being less than five.
Rotating Equipment [10] The frequency of turbine rotor blade disintegration/ failure leading to a blade or missile being ejected through the casing is estimated to be in the range 1x10⁻³ to 1x10⁻⁴ per machine year. Note: If blade containment shielding is provided then the frequency can be assumed to be lower than 1x10⁻⁴ per machine year.
Table 5.3 - Primary Missile Characteristic [11]
Missile Hazard
80% of fire events that cause ruptures result in missiles. Boiling Liquid Expanding Vapour Explosions (BLEVE) produce four or less missiles Non fire events produce more than four
Vulnerability of Plant/Structures E&P Forum QRA Datasheet Directory Rev 0
13/06/2003 VULNPLNT.DOC Page 12
5. ONGOING RESEARCH The Steel Construction Institute, Blast and Fire Engineering Projects for Topside Structures - Phase 2. HSE / W.S. Atkins, Vulnerability of Building Occupants to Explosion Events.
Vulnerability of Plant/Structures E&P Forum QRA Datasheet Directory Rev 0
13/06/2003 VULNPLNT.DOC Page 13
6. REFERENCES 1. Guidelines for Fire and Explosion Hazard Management. UKOOA, May 1995. 2. Shell Offshore Flame Impingement Protection Programme, Shell Research Ltd 1990. 3. Cowley, L.T and Pritchard, M.J., Large Scale Natural Gas and LPG Jet Fires and
Thermal Impact on Structures, Paper 3.5, GASTECH90, Amsterdam, December 1990. 4. Interim Jet Fire Tests. Offshore Technology Report, OTO 93-028. 5. OCB/Technica(1988), Comparative Safety Evaluation of Arrangements for Accommodating Personnel Offshore, Technica Report C1577, Department of Energy Report OTN-88-175, December 1988. 6. Clancy, VJ. Diagnostic Features of Explosion Damage. 6th Int. Meeting of Forensic Sciences, Edinburgh 1972. 7. Wells, GL.Safety in Process Plant Design, George Godwin, 1980. ISBN 0711455066. 8. Baum, MR. Preliminary Design Guidelines for Fragment Velocity and the Extent of
the Hazard Zone, Journal of Pressure Vessel, 110, 169-177,1988. 9. Neilson, AJ. Procedures for the Design of Impact Protection of Offshore Risers and E.S.Vs. UKAEA (ed),1990. 10. Lees, FP. Loss Prevention in Process Industries, Butterworth, 1990. 11. Holden, PL. Assessment of Missile Hazards: Review of Incident Experience Relevant to Major Hazard Plants, SRD/R477, 1988.

Vulnerability of Plant/Structures E&P Forum QRA Datasheet Directory Rev 0
13/06/2003 VULNPLNT.DOC Page 14
Evacuation, Escape and Rescue E&P Forum QRA Data Sheet Directory Rev 0
13/06/2003 EVACRESC.DOC Page 1
EVACUATION, ESCAPE AND RESCUE
Evacuation, Escape and Rescue E&P Forum QRA Data Sheet Directory Rev 0
13/06/2003 EVACRESC.DOC Page 2
TABLE OF CONTENTS
1. INTRODUCTION------------------------------------------------------------------------------------- 3
1.1 Scope ---------------------------------------------------------------------------------------------------------------------3
1.2 Application--------------------------------------------------------------------------------------------------------------3
2. DATA AVAILABLE---------------------------------------------------------------------------------- 4
2.1 Frequency of Platform Evacuation---------------------------------------------------------------------------------4
2.2 Availability of Escape Routes to Muster Areas ------------------------------------------------------------------4
2.3 Lifeboat Embarkation ------------------------------------------------------------------------------------------------5
2.4 Lifeboat Evacuation---------------------------------------------------------------------------------------------------5
2.5 Escape by Sea Entry --------------------------------------------------------------------------------------------------6
2.6 Onshore Data-----------------------------------------------------------------------------------------------------------6
3. DEVELOPMENTS IN EVACUATION, ESCAPE & RESCUE---------------------------- 7
4. REFERENCES --------------------------------------------------------------------------------------- 8
APPENDIX 1 GENERIC STAGES OF EER -------------------------------------------------- 10
APPENDIX 2 TEMPSC EVACUATION -------------------------------------------------------- 11
APPENDIX 3 HELICOPTER EVACUATION ------------------------------------------------- 13
APPENDIX 4 DETERMINING PROBABILITY OF EVACUATION SUCCESS------ 14
APPENDIX 5 OPERABILITY OF EER METHODS UNDER VARIOUS ACCIDENT CIRCUMSTANCES---------------------------------------------------------------- 15
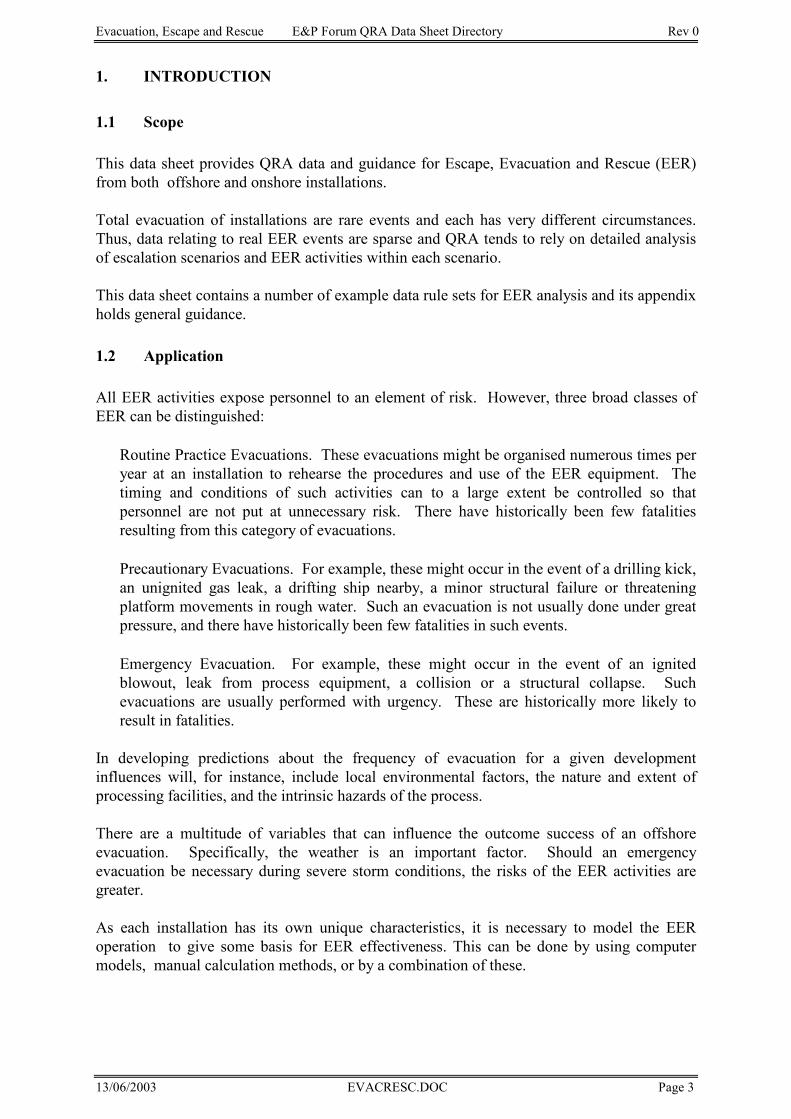
Evacuation, Escape and Rescue E&P Forum QRA Data Sheet Directory Rev 0
13/06/2003 EVACRESC.DOC Page 3
1. INTRODUCTION 1.1 Scope This data sheet provides QRA data and guidance for Escape, Evacuation and Rescue (EER) from both offshore and onshore installations. Total evacuation of installations are rare events and each has very different circumstances. Thus, data relating to real EER events are sparse and QRA tends to rely on detailed analysis of escalation scenarios and EER activities within each scenario. This data sheet contains a number of example data rule sets for EER analysis and its appendix holds general guidance. 1.2 Application All EER activities expose personnel to an element of risk. However, three broad classes of EER can be distinguished: • Routine Practice Evacuations. These evacuations might be organised numerous times per
year at an installation to rehearse the procedures and use of the EER equipment. The timing and conditions of such activities can to a large extent be controlled so that personnel are not put at unnecessary risk. There have historically been few fatalities resulting from this category of evacuations.
• Precautionary Evacuations. For example, these might occur in the event of a drilling kick,
an unignited gas leak, a drifting ship nearby, a minor structural failure or threatening platform movements in rough water. Such an evacuation is not usually done under great pressure, and there have historically been few fatalities in such events.
• Emergency Evacuation. For example, these might occur in the event of an ignited
blowout, leak from process equipment, a collision or a structural collapse. Such evacuations are usually performed with urgency. These are historically more likely to result in fatalities.
In developing predictions about the frequency of evacuation for a given development influences will, for instance, include local environmental factors, the nature and extent of processing facilities, and the intrinsic hazards of the process. There are a multitude of variables that can influence the outcome success of an offshore evacuation. Specifically, the weather is an important factor. Should an emergency evacuation be necessary during severe storm conditions, the risks of the EER activities are greater. As each installation has its own unique characteristics, it is necessary to model the EER operation to give some basis for EER effectiveness. This can be done by using computer models, manual calculation methods, or by a combination of these.
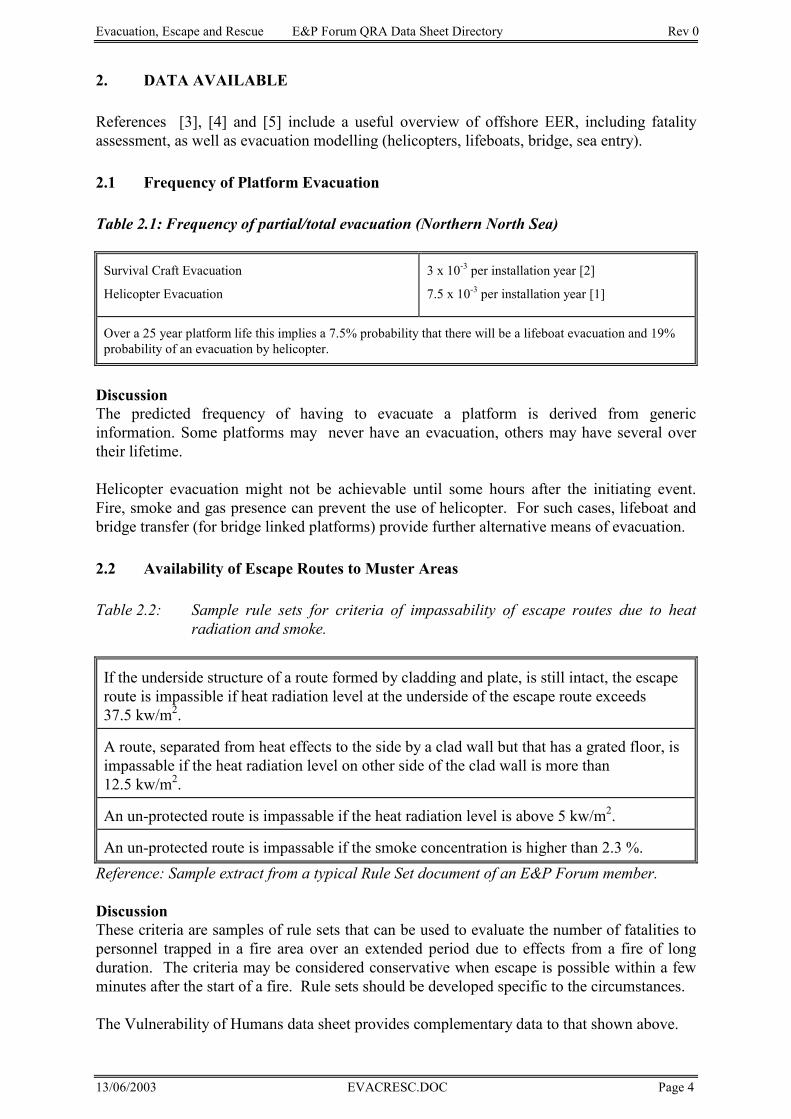
Evacuation, Escape and Rescue E&P Forum QRA Data Sheet Directory Rev 0
13/06/2003 EVACRESC.DOC Page 4
2. DATA AVAILABLE References [3], [4] and [5] include a useful overview of offshore EER, including fatality assessment, as well as evacuation modelling (helicopters, lifeboats, bridge, sea entry). 2.1 Frequency of Platform Evacuation Table 2.1: Frequency of partial/total evacuation (Northern North Sea)
Survival Craft Evacuation
Helicopter Evacuation
3 x 10⁻³ per installation year [2]
7.5 x 10⁻³ per installation year [1]
Over a 25 year platform life this implies a 7.5% probability that there will be a lifeboat evacuation and 19% probability of an evacuation by helicopter.
Discussion The predicted frequency of having to evacuate a platform is derived from generic information. Some platforms may never have an evacuation, others may have several over their lifetime. Helicopter evacuation might not be achievable until some hours after the initiating event. Fire, smoke and gas presence can prevent the use of helicopter. For such cases, lifeboat and bridge transfer (for bridge linked platforms) provide further alternative means of evacuation. 2.2 Availability of Escape Routes to Muster Areas Table 2.2: Sample rule sets for criteria of impassability of escape routes due to heat
radiation and smoke.
If the underside structure of a route formed by cladding and plate, is still intact, the escape route is impassible if heat radiation level at the underside of the escape route exceeds 37.5 kw/m2.
A route, separated from heat effects to the side by a clad wall but that has a grated floor, is impassable if the heat radiation level on other side of the clad wall is more than 12.5 kw/m2.
An un-protected route is impassable if the heat radiation level is above 5 kw/m2.
An un-protected route is impassable if the smoke concentration is higher than 2.3 %. Reference: Sample extract from a typical Rule Set document of an E&P Forum member.
Discussion These criteria are samples of rule sets that can be used to evaluate the number of fatalities to personnel trapped in a fire area over an extended period due to effects from a fire of long duration. The criteria may be considered conservative when escape is possible within a few minutes after the start of a fire. Rule sets should be developed specific to the circumstances. The Vulnerability of Humans data sheet provides complementary data to that shown above.
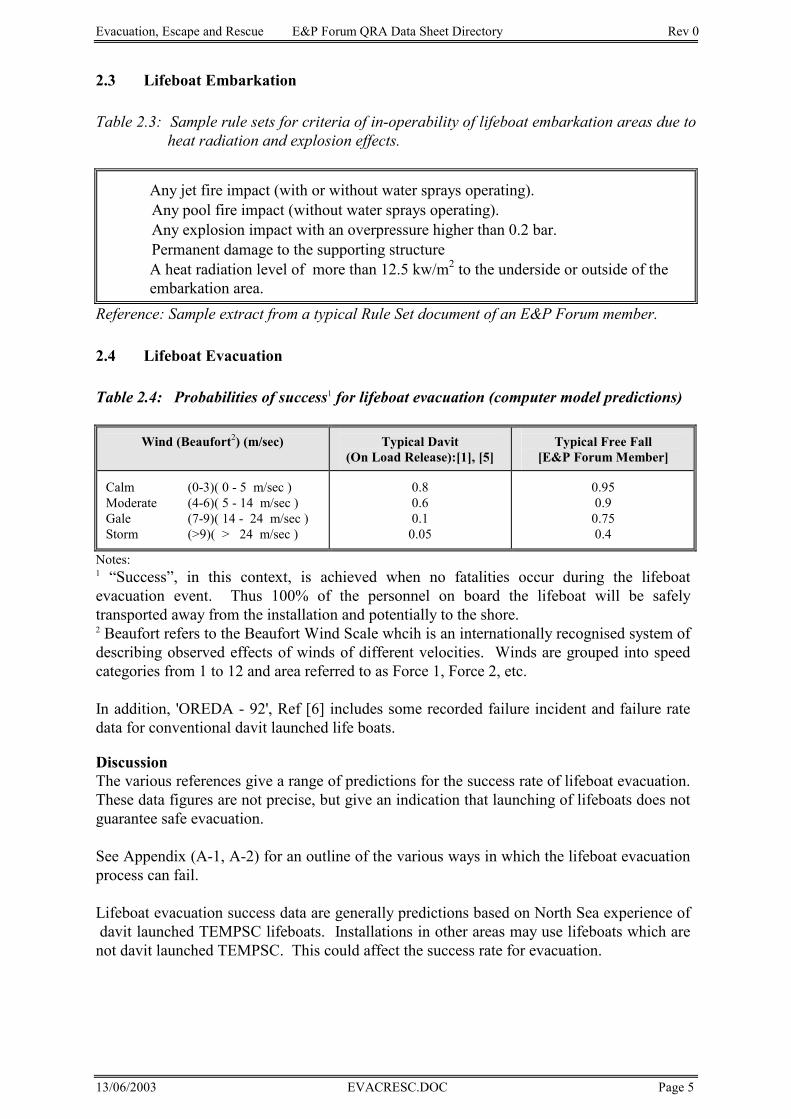
Evacuation, Escape and Rescue E&P Forum QRA Data Sheet Directory Rev 0
13/06/2003 EVACRESC.DOC Page 5
2.3 Lifeboat Embarkation Table 2.3: Sample rule sets for criteria of in-operability of lifeboat embarkation areas due to
heat radiation and explosion effects.
• Any jet fire impact (with or without water sprays operating). • Any pool fire impact (without water sprays operating). • Any explosion impact with an overpressure higher than 0.2 bar. • Permanent damage to the supporting structure • A heat radiation level of more than 12.5 kw/m2 to the underside or outside of the
embarkation area. Reference: Sample extract from a typical Rule Set document of an E&P Forum member.
2.4 Lifeboat Evacuation
Table 2.4: Probabilities of success1 for lifeboat evacuation (computer model predictions)
Wind (Beaufort2) (m/sec) Typical Davit (On Load Release):[1], [5]
Typical Free Fall [E&P Forum Member]
Calm (0-3)( 0 - 5 m/sec ) Moderate (4-6)( 5 - 14 m/sec ) Gale (7-9)( 14 - 24 m/sec ) Storm (>9)( > 24 m/sec )
0.8 0.6 0.1
0.05
0.95 0.9
0.75 0.4
Notes: 1 “Success”, in this context, is achieved when no fatalities occur during the lifeboat evacuation event. Thus 100% of the personnel on board the lifeboat will be safely transported away from the installation and potentially to the shore. 2 Beaufort refers to the Beaufort Wind Scale whcih is an internationally recognised system of describing observed effects of winds of different velocities. Winds are grouped into speed categories from 1 to 12 and area referred to as Force 1, Force 2, etc. In addition, 'OREDA - 92', Ref [6] includes some recorded failure incident and failure rate data for conventional davit launched life boats.
Discussion The various references give a range of predictions for the success rate of lifeboat evacuation. These data figures are not precise, but give an indication that launching of lifeboats does not guarantee safe evacuation. See Appendix (A-1, A-2) for an outline of the various ways in which the lifeboat evacuation process can fail. Lifeboat evacuation success data are generally predictions based on North Sea experience of davit launched TEMPSC lifeboats. Installations in other areas may use lifeboats which are not davit launched TEMPSC. This could affect the success rate for evacuation.
Evacuation, Escape and Rescue E&P Forum QRA Data Sheet Directory Rev 0
13/06/2003 EVACRESC.DOC Page 6
2.5 Escape by Sea Entry Table 2.5.1: Sample rule set for immediate fatality probability due to jumping to sea from
North Sea topsides equipment.
Fatality Probability.
0.1 Reference: Sample extract from a typical Rule Set document of an E&P Forum member.
Note: Does not allow for use of tertiary devices, such as rope ladders etc., or distance to sea. There are insufficient data on the use of liferafts to give reliable figures for the probability of fatality when these devices are available. Table 2.5.2: Sample rule set for fatality probability upon entering the sea to escape (North
Sea data)
No stand-by vessel present. Weather conditions averaged.
Pfataility
0.8
Stand-by vessel(s) present. Calm Weather (Wind 0 - 5 m/s)
No or Low Fire Effects at Sea Level 0.06 High Fire Effects at Sea Level 0.15
Moderate Weather (Wind 5 - 12 m/s) 0.22 Severe Weather (Wind >12 m/s) 0.92
Reference: Sample extract from a typical Rule Set document of an E&P Forum member.
Notes: • Probabilities cover full scope of evacuation: entering sea; remaining at sea surface;
rescue. • Personnel making a sea entry expected to be wearing survival suit and life-jacket. • Above data does not differentiate sea temperature effects on personnel survival rate. In
reality, personnel survival time immersed in sea, depends on local sea temperatures and generic human endurance times.
2.6 Onshore Data Assuming personnel have survived the initial events, personnel EER from onshore facilities tends to be less complex and of inherently lower risk. Qualitative analysis, geared towards provision of suitable escape routes and appropriate rescue and medical contingency planning, will normally be adequate.
Evacuation, Escape and Rescue E&P Forum QRA Data Sheet Directory Rev 0
13/06/2003 EVACRESC.DOC Page 7
3. DEVELOPMENTS IN EVACUATION, ESCAPE & RESCUE Whatever offshore evacuation technique is used, two areas are developing to improve the success of EER. Firstly there is the development of concept, specification and performance of Temporary Refuges. Secondly, there is increased allowance for human factors, comprising command, control, human behaviour and ergonomics in the design of equipment, procedures etc. A number of innovative EER systems are in various stages of development. Several systems have been adopted by operators as risk reduction measures and best available means for EER. Examples of these innovative systems can generally be grouped into the following categories: • TEMPSC assist systems • Individual Person Escape Devices • Multiple Personnel Escape Devices. Levels of operational testing and experience for each particular system varies. Due to their relatively limited application, there is little or no data currently available.
Evacuation, Escape and Rescue E&P Forum QRA Data Sheet Directory Rev 0
13/06/2003 EVACRESC.DOC Page 8
4. REFERENCES [1] K. Sykes, "Summary of conclusions drawn from reports produced by, or made
available to, the Emergency Evacuation of Offshore Installations Steering Group", MaTSU, January 1986.
[2] Technica report OTH 88 8285, "Escape II - Risk Assessment of Emergency
Evacuation from Offshore Installations", HMSO, ISBN 0-11-412920-7, 1988. [3] D. Robertson, "Escape III - The Evaluation of Survival Craft Availability in Platform
Evacuation", Technica Ltd., International Offshore Safety Conference, London 1987. [4] Section 9 + Appendix 7 of "Comparative Safety Evaluation of Arrangements for
Accommodating Personnel Offshore", UK Department of Energy Report, October 1988.
[5] "Risk Assessment of Emergency Evacuation from Offshore Installation" Technica
Report F 158. Prepared for DoE. November 1983 [6] OREDA. Offshore Reliability Data Handbook. DNV Technica. 2nd Edition. 1993.
ISBN 82 515 0188 1.
Evacuation, Escape and Rescue E&P Forum QRA Data Sheet Directory Rev 0
13/06/2003 EVACRESC.DOC Page 9
APPENDIX
GENERAL GUIDANCE
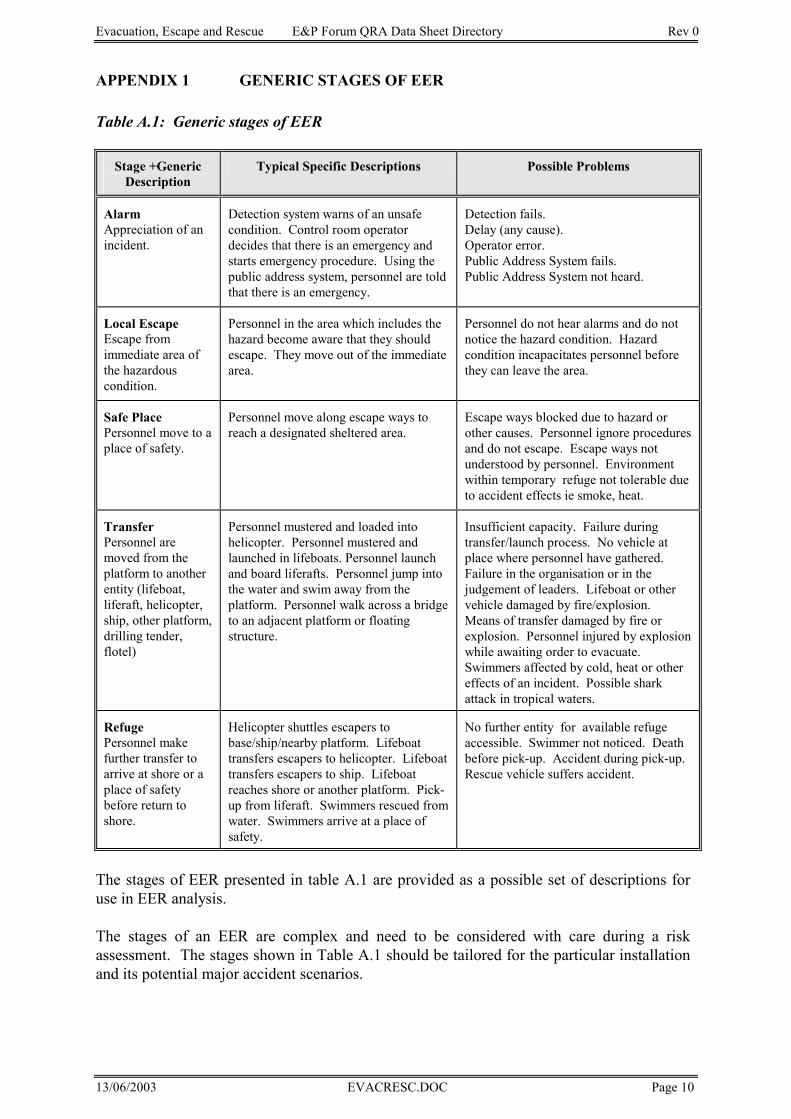
Evacuation, Escape and Rescue E&P Forum QRA Data Sheet Directory Rev 0
13/06/2003 EVACRESC.DOC Page 10
APPENDIX 1 GENERIC STAGES OF EER Table A.1: Generic stages of EER
Stage +Generic Description
Typical Specific Descriptions Possible Problems
Alarm Appreciation of an incident.
Detection system warns of an unsafe condition. Control room operator decides that there is an emergency and starts emergency procedure. Using the public address system, personnel are told that there is an emergency.
Detection fails. Delay (any cause). Operator error. Public Address System fails. Public Address System not heard.
Local Escape Escape from immediate area of the hazardous condition.
Personnel in the area which includes the hazard become aware that they should escape. They move out of the immediate area.
Personnel do not hear alarms and do not notice the hazard condition. Hazard condition incapacitates personnel before they can leave the area.
Safe Place Personnel move to a place of safety.
Personnel move along escape ways to reach a designated sheltered area.
Escape ways blocked due to hazard or other causes. Personnel ignore procedures and do not escape. Escape ways not understood by personnel. Environment within temporary refuge not tolerable due to accident effects ie smoke, heat.
Transfer Personnel are moved from the platform to another entity (lifeboat, liferaft, helicopter, ship, other platform, drilling tender, flotel)
Personnel mustered and loaded into helicopter. Personnel mustered and launched in lifeboats. Personnel launch and board liferafts. Personnel jump into the water and swim away from the platform. Personnel walk across a bridge to an adjacent platform or floating structure.
Insufficient capacity. Failure during transfer/launch process. No vehicle at place where personnel have gathered. Failure in the organisation or in the judgement of leaders. Lifeboat or other vehicle damaged by fire/explosion. Means of transfer damaged by fire or explosion. Personnel injured by explosion while awaiting order to evacuate. Swimmers affected by cold, heat or other effects of an incident. Possible shark attack in tropical waters.
Refuge Personnel make further transfer to arrive at shore or a place of safety before return to shore.
Helicopter shuttles escapers to base/ship/nearby platform. Lifeboat transfers escapers to helicopter. Lifeboat transfers escapers to ship. Lifeboat reaches shore or another platform. Pick-up from liferaft. Swimmers rescued from water. Swimmers arrive at a place of safety.
No further entity for available refuge accessible. Swimmer not noticed. Death before pick-up. Accident during pick-up. Rescue vehicle suffers accident.
The stages of EER presented in table A.1 are provided as a possible set of descriptions for use in EER analysis. The stages of an EER are complex and need to be considered with care during a risk assessment. The stages shown in Table A.1 should be tailored for the particular installation and its potential major accident scenarios.
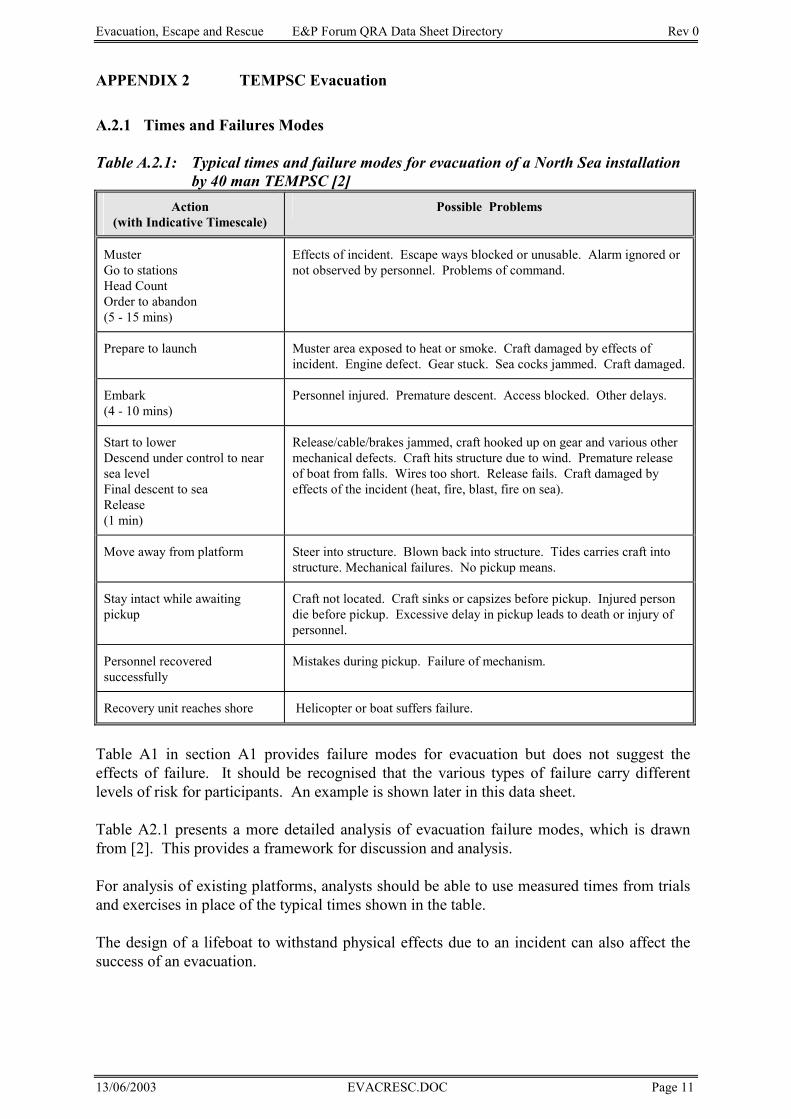
Evacuation, Escape and Rescue E&P Forum QRA Data Sheet Directory Rev 0
13/06/2003 EVACRESC.DOC Page 11
APPENDIX 2 TEMPSC Evacuation A.2.1 Times and Failures Modes
Table A.2.1: Typical times and failure modes for evacuation of a North Sea installation
by 40 man TEMPSC [2] Action
(with Indicative Timescale) Possible Problems
Muster Go to stations Head Count Order to abandon (5 - 15 mins)
Effects of incident. Escape ways blocked or unusable. Alarm ignored or not observed by personnel. Problems of command.
Prepare to launch Muster area exposed to heat or smoke. Craft damaged by effects of incident. Engine defect. Gear stuck. Sea cocks jammed. Craft damaged.
Embark (4 - 10 mins)
Personnel injured. Premature descent. Access blocked. Other delays.
Start to lower Descend under control to near sea level Final descent to sea Release (1 min)
Release/cable/brakes jammed, craft hooked up on gear and various other mechanical defects. Craft hits structure due to wind. Premature release of boat from falls. Wires too short. Release fails. Craft damaged by effects of the incident (heat, fire, blast, fire on sea).
Move away from platform Steer into structure. Blown back into structure. Tides carries craft into structure. Mechanical failures. No pickup means.
Stay intact while awaiting pickup
Craft not located. Craft sinks or capsizes before pickup. Injured person die before pickup. Excessive delay in pickup leads to death or injury of personnel.
Personnel recovered successfully
Mistakes during pickup. Failure of mechanism.
Recovery unit reaches shore Helicopter or boat suffers failure.
Table A1 in section A1 provides failure modes for evacuation but does not suggest the effects of failure. It should be recognised that the various types of failure carry different levels of risk for participants. An example is shown later in this data sheet. Table A2.1 presents a more detailed analysis of evacuation failure modes, which is drawn from [2]. This provides a framework for discussion and analysis. For analysis of existing platforms, analysts should be able to use measured times from trials and exercises in place of the typical times shown in the table. The design of a lifeboat to withstand physical effects due to an incident can also affect the success of an evacuation.
Evacuation, Escape and Rescue E&P Forum QRA Data Sheet Directory Rev 0
13/06/2003 EVACRESC.DOC Page 12
A.2.2 Factors affecting Probability of Successful Launch of TEMPSC. Reference: E&P Forum member.
The offshore oil and gas industry has seen effort to improve the design, hardware and management of EER issues. Such improvements will achieve a reduction in risk for personnel. For example, TEMPSC design and operations improvement studies have covered: • Onload / Offload release mechanism • Clearance / Offset of the lifeboat from the installation • Lifeboats mounted at right angles to the structure or at its corners so as to allow a straight
course away from the structure. • Improved vessel manoeuverability. • Better visibility for Lifeboat Coxwain • Better maintenance of Lifeboat Launch Mechanisms. • More consideration given to the practicalities of recovering personnel from lifeboats. • Improved impact resistance of lifeboats
Evacuation, Escape and Rescue E&P Forum QRA Data Sheet Directory Rev 0
13/06/2003 EVACRESC.DOC Page 13
APPENDIX 3 HELICOPTER EVACUATION Reference: E&P Forum member.
Use of helicopter to evacuate is only possible in situations where both helicopter and helideck are available. Some potential major accident scenarios, would make it very dangerous to utilise helicopter transportation. Heat, smoke and flames from fires tend to propagate upwards and can impair a helideck facility. Helicopter evacuation is often more available for performing precautionary evacuations. Any evaluation of helicopter options must include an assessment of: O The time scale of the supposed incident.
O The possible timing of the incident in relation to the availability of helicopters and crew (i.e. day or night).
O The defined evacuation plan i.e. shore, to ships or other platforms.
O The possible problems in the escape, mustering and loading process.
Evacuation, Escape and Rescue E&P Forum QRA Data Sheet Directory Rev 0
13/06/2003 EVACRESC.DOC Page 14
APPENDIX 4 DETERMINING PROBABILITY OF EVACUATION SUCCESS Reference: E&P Forum member.
The actual success rates at each stage of the process of EER for a defined group of personnel can be translated into an overall success rate. Stages of EER may be defined as follows. Probabilities of personnel: O identifying alarm = P1
O making local escape = P2
O reaching safe place = P3
O effecting transfer (from safe place to away from platform) = P4
O reaching refuge = P5 As an example only, suppose we are considering escape of 5 people working in a process area in which there is a rapidly developing fire. It is assumed that evacuation is by lifeboat. Weather conditions may be any of those observed at this location. There is a good back up organisation to retrieve personnel after they have transferred to lifeboats. O P1 = 0.95 (Visual and thorough alarm system).
O P2 = 0.80 (Fire effects may overcome personnel).
O P3 = 0.98 (Good escape routes unlikely to be blocked).
O P4 = 0.85 (to include allowance for possibility of becoming trapped at the safe place. Also includes derivation for lifeboat launching weighted for different weather conditions).
O P5 = 0.90 (Emergency organisation for the platform retrieves personnel. Success is good except in poor weather).
Overall Success = 0.57 for 5 people in the area where the incident takes place. Note that the chance can be improved to 0.75 if people can stay on the platform.
Evacuation, Escape and Rescue E&P Forum QRA Data Sheet Directory Rev 0
13/06/2003 EVACRESC.DOC Page 15
APPENDIX 5 OPERABILITY OF EER METHODS UNDER VARIOUS ACCIDENT CIRCUMSTANCES
Table A.5: Operability rating of evacuation / escape methods under various accident
circumstances: hazards, evacuation time, weather.
Types of
Hazard
Evacuation Time
Weather Evacuation
Radiant
Heat
Gas / H2S /
Smoke
< 15 mins
< 60 mins
< 180 mins
Calm
Mod
Severe
Helicopter
2 2 2 / 2 8 / 2 9 / 9 9 9 5Primary
Bridge
5 5 9 / 9 9 / 9 9 / 9 9 9 7
Direct Marine
5 5 2 / 2 9 / 5 9 / 9 9 8 3TEMPSC
Protected Access 9 9 9 / 7 9 / 9 N/A
9 6 1
Unprotected Access
3 3 7 / 7 9 / 9 N/A
9 6 1
Tertiary Liferaft, Ropes, Jump etc.
2 2 8 / 8 N/A
N/A
3 2 0
Reference: via E&P Forum member. Notes: Ratings: Lowest = 0 , Highest = 9 The above ratings are based on how operable the various methods of evacuation / escape are expected to be under different accident circumstances of hazard, evacuation time and weather. A N/A mark indicates that alternative methods of evacuation / escape would be used in these circumstances. Two marks are given for the evacuation times based on the separate cases of total People on Board (PoB) = 20 and total PoB = 200 respectively (ie 8 / 2 refers to 8 for a 20 man installation, 2 for a 200 man installation). Table A.5.2: EER Success Rates
Types of Evacuation Historical Success Rates
Helicopter
Low (1) PRIMARY
Bridge
High
Direct Marine
N/A (2) TEMPSC
Protected Access
N/A
Unprotected Access
Low Tertiary
Liferafts, Ropes, Jumping etc
Low
Reference: via E&P Forum member.
Notes: Ranking Categories: High / Medium / Low 1) Helicopters have not generally been available in time for emergency evacuations. 2) No data, as these are more recent developments and are not widely deployed offshore
as yet. Discussion Tables A.5.1 and A.5.2 are provided to aid estimates of EER systems effectiveness under different accident circumstances. The data is qualitative estimate of the applicability and success rates for different types of EER equipment.
Evacuation, Escape and Rescue E&P Forum QRA Data Sheet Directory Rev 0
13/06/2003 EVACRESC.DOC Page 1
HF in the Assessment of E&P Forum QRA Datasheet Directory Rev 0 Fatalities during Escape & Sheltering
13/06/2003 HFINESC.DOC Page 1
HUMAN FACTORS IN THE ASSESSMENT OF FATALITIES DURING ESCAPE & SHELTERING
HF in the Assessment of E&P Forum QRA Datasheet Directory Rev 0 Fatalities during Escape & Sheltering
13/06/2003 HFINESC.DOC Page 2
TABLE OF CONTENTS
GLOSSARY OF TERMS & ABBREVIATIONS ------------------------------------------------- 3
1 INTRODUCTION-------------------------------------------------------------------------------------- 4
2 SCOPE -------------------------------------------------------------------------------------------------- 5
3 APPLICATION ---------------------------------------------------------------------------------------- 5
4 OVERVIEW OF METHODS FOR CALCULATING FATALITY RATES FROM EXPOSURE TO FIRE, EXPLOSION AND TOXIC HAZARDS ----------------------------- 6
5 METHODS FOR CALCULATING THE PROBABILITY OF EXPOSURE AND DURATION OF EXPOSURE TO A HAZARD (WHILE ESCAPING TO THE TEMPORARY REFUGE (TR))----------------------------------------------------------------------- 7
Description ------------------------------------------------------------------------------------------------------------------7
Data Sources ----------------------------------------------------------------------------------------------------------------9 Reliability and time to respond to alarms (e.g. time to initiate escape to a TR)---------------------------------9 Speed of movement of personnel -------------------------------------------------------------------------------------- 11 Choice of route----------------------------------------------------------------------------------------------------------- 11 Performance in the use of personal protective equipment (PPE) - reliability of success in using PPE and time to use PPE ---------------------------------------------------------------------------------------------------------- 12 Allowing for degradation in human performance due to exposure to a toxic or thermal hazard---------- 13
Availability of Data ------------------------------------------------------------------------------------------------------ 14
Strengths of the Method ------------------------------------------------------------------------------------------------ 14
Limitations of the Method---------------------------------------------------------------------------------------------- 14
6 ONGOING RESEARCH -------------------------------------------------------------------------- 15
7 REFERENCES -------------------------------------------------------------------------------------- 15
HF in the Assessment of E&P Forum QRA Datasheet Directory Rev 0 Fatalities during Escape & Sheltering
13/06/2003 HFINESC.DOC Page 3
GLOSSARY OF TERMS & ABBREVIATIONS
Term Abbreviation Definition Escalation - The progress of an incident following the initial event
in which the damage, injuries or fatalities caused may increase
Escape - The process of personnel leaving the vicinity of an incident and making their way to a safe location. For an offshore installation the safe location is designated the Temporary Refuge
Evacuation - A term used to describe the process of leaving the offshore installation in response to an emergency in order to reach a place of permanent safety
Human Reliability Analysis
HRA A generic term covering all techniques which are used to assess the human component of a system
Performance Shaping Factor
PSF A factor which can influence human performance and human error probability
Personal Protective Equipment
PPE -
Quantified Risk Assessment
QRA -
Rescue - Following evacuation, this is the recovery of personnel to a place of permanent safety
Task Analysis - A series of techniques used to analyse and assess the activities performed by people within a system
Temporary Refuge TR Term used to define a location on an offshore installation where personnel can gain protection, for a finite time, from a hazard
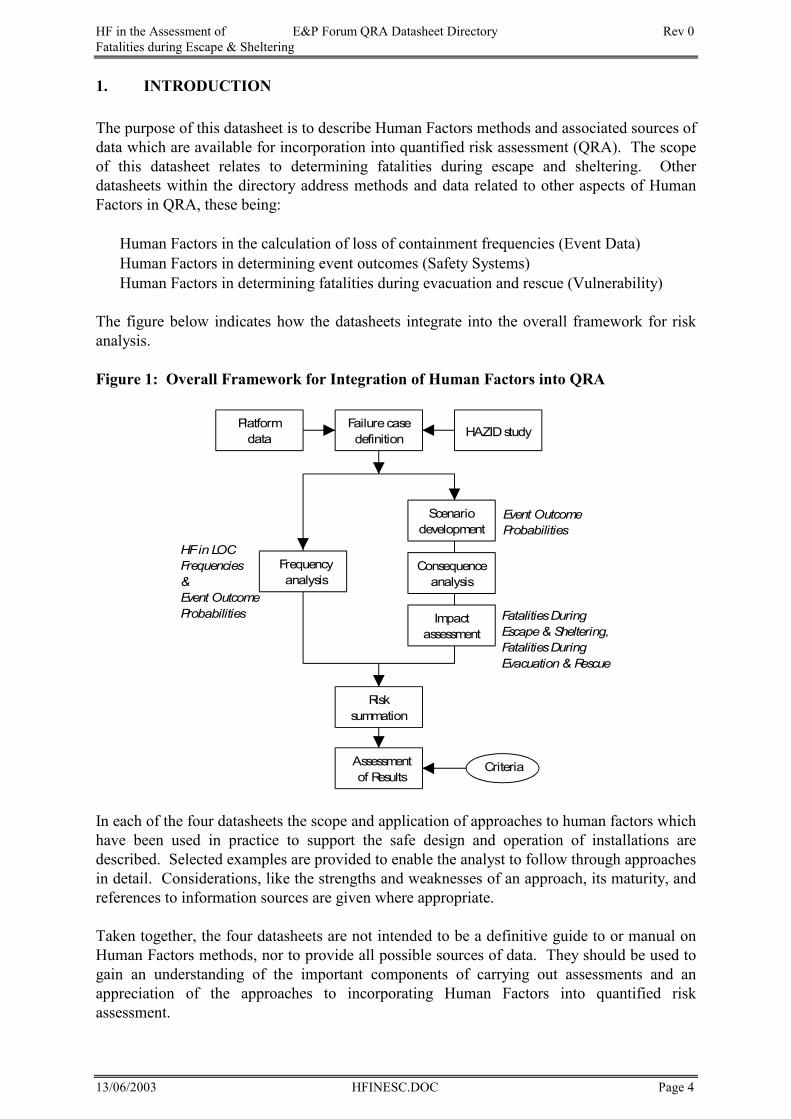
HF in the Assessment of E&P Forum QRA Datasheet Directory Rev 0 Fatalities during Escape & Sheltering
13/06/2003 HFINESC.DOC Page 4
1. INTRODUCTION
The purpose of this datasheet is to describe Human Factors methods and associated sources of data which are available for incorporation into quantified risk assessment (QRA). The scope of this datasheet relates to determining fatalities during escape and sheltering. Other datasheets within the directory address methods and data related to other aspects of Human Factors in QRA, these being:
• Human Factors in the calculation of loss of containment frequencies (Event Data) • Human Factors in determining event outcomes (Safety Systems) • Human Factors in determining fatalities during evacuation and rescue (Vulnerability) The figure below indicates how the datasheets integrate into the overall framework for risk analysis. Figure 1: Overall Framework for Integration of Human Factors into QRA
In each of the four datasheets the scope and application of approaches to human factors which have been used in practice to support the safe design and operation of installations are described. Selected examples are provided to enable the analyst to follow through approaches in detail. Considerations, like the strengths and weaknesses of an approach, its maturity, and references to information sources are given where appropriate. Taken together, the four datasheets are not intended to be a definitive guide to or manual on Human Factors methods, nor to provide all possible sources of data. They should be used to gain an understanding of the important components of carrying out assessments and an appreciation of the approaches to incorporating Human Factors into quantified risk assessment.
Platformdata
Failurecasedefinition HAZIDstudy
Frequencyanalysis
Scenariodevelopment
Consequenceanalysis
Impactassessment
Risksummation
Assessmentof Results
Criteria
Event OutcomeProbabilities
HFin LOCFrequencies&Event OutcomeProbabilities FatalitiesDuring
Escape& Sheltering,FatalitiesDuringEvacuation& Rescue
HF in the Assessment of E&P Forum QRA Datasheet Directory Rev 0 Fatalities during Escape & Sheltering
13/06/2003 HFINESC.DOC Page 5
2. SCOPE
This datasheet deals with the Human Factors issues which have a significant bearing on the safety of personnel during escape and sheltering. Methods and data are presented for assessing the likelihood of fatalities as events progress.
The term "escape" is considered to cover the movement of personnel from their initial location (at the time of the event) to a place of safety. The term "sheltering" is considered to cover the time spent by personnel within the place of safety. In the UK offshore regulations, this place of safety is termed the Temporary Refuge (TR).
In estimating fatalities, assessment of the likelihood of personnel being exposed to the hazard and the effect of exposure are required. For hydrocarbon releases the hazards of concern are thermal radiation, explosion overpressure or toxic gas/smoke, for which the methods of assessing the effect of exposure can include the use of tolerability thresholds or Probit equations (see datasheet on Human Vulnerability). The estimation of the likelihood of personnel being exposed to a hazard during the escape and sheltering phases involves both event consequence modelling (e.g. fire propagation, temporary refuge impairment etc.) and human behaviour modelling. In an offshore situation the behaviours of interest include: • time taken to initiate escape • speed of movement to the temporary refuge • choice of route so as to minimise exposure • use of protective equipment. Statistics for a QRA must be derived by interpreting data taken from a number of sources. Particular factors to be taken into account in deriving the statistics are: • the reliability of response to alarms and the effect of false alarm frequency on response
behaviour; • characteristic behaviour patterns in life threatening situations; • changes in behaviour when exposed to a hazard. 3. APPLICATION Fatalities during escape and sheltering can be divided into three sub-categories, e.g. • immediate fatalities - personnel who are in close proximity in the initial stages of the
event • escape fatalities - personnel who are not initially in close proximity but become exposed
to the event as they attempt to reach a temporary refuge • sheltering fatalities - personnel who are exposed to a hazard while sheltering in the
temporary refuge. The first section (section 4) gives a brief overview of the issues in calculating fatalities from exposure to thermal, fire and explosion hazards. The second section (section 5), for the estimation of the likelihood of exposure to a hazard, is predominantly relevant to the first two categories of fatalities.
HF in the Assessment of E&P Forum QRA Datasheet Directory Rev 0 Fatalities during Escape & Sheltering
13/06/2003 HFINESC.DOC Page 6
4. OVERVIEW OF METHODS FOR CALCULATING FATALITY RATES FROM EXPOSURE TO FIRE, EXPLOSION AND TOXIC HAZARDS
In a scenario which involves exposing personnel to a fire hazard a simple approach is to use the thermal radiation contours calculated as part of the consequence analysis to define the locations where personnel would die. For toxic hazards a similar approach can be used by assessing the concentration in each location occupied by personnel. This method requires recourse to the data on the effect of the substance on people. A more sophisticated approach, which can be used for overpressure, toxic or thermal hazards is to determine the dose received over time and use a probit equation to relate the dose to fatality likelihood. Relevant data can be found in the datasheet on Human Vulnerability.
HF in the Assessment of E&P Forum QRA Datasheet Directory Rev 0 Fatalities during Escape & Sheltering
13/06/2003 HFINESC.DOC Page 7
5. METHODS FOR CALCULATING THE PROBABILITY OF EXPOSURE AND DURATION OF EXPOSURE TO A HAZARD (WHILE ESCAPING TO THE TEMPORARY REFUGE (TR)) 5.1 Description Following an incident, there is a possibility that personnel will become exposed to a hazard as they escape to safety. Exposure may be severe enough to cause death. Human Factor issues such as route selection decisions can dominate the likelihood of exposure. The kind of statistical estimates required in an assessment of escape performance are: • the length of time before personnel receive a warning about the event • the likelihood of personnel being in the proximity of the event • the time it takes to get to a safe location (i.e. the TR) • the steps taken to avoid the hazard while moving to the TR. This includes:
- choice of route to avoid a hazard - using protective equipment to isolate the person from the hazard (such as using
breathing apparatus in a toxic cloud) An analyst cannot expect to find universally applicable historical data with which to assess escape performance as this is location specific. For example, in regard to the question of how likely it is that personnel will be in the vicinity of an event, the analyst should consider the types of activities which take place on the installation. A review should consider whether the alarm could be masked by other noises, and the procedures followed to investigate an alarm, which may involve an operator being sent to inspect the area. Using the layout of the installation and details of the incident (such as availability of escape ways, level of hazard) software tools can be used to assist in certain aspects of escape evaluation. Most commonly they are used in the calculation of the time taken for personnel to reach predefined points of safety. The approaches used by the models differ and the scope for using them to estimate escape fatalities varies. Models which may be suitable for applying to offshore installations include: EGRESS [42], MUSTER [43], EVACNET+ [44], SPECS [45], EXIT89 [13]. A simple method for estimating the likelihood of personnel becoming exposed to a hazard is to model the structure as a 3-D grid of cells and then consider, for an event in a specific area, the likelihood of personnel entering the incident area as they make their way to a TR (see figure 2).
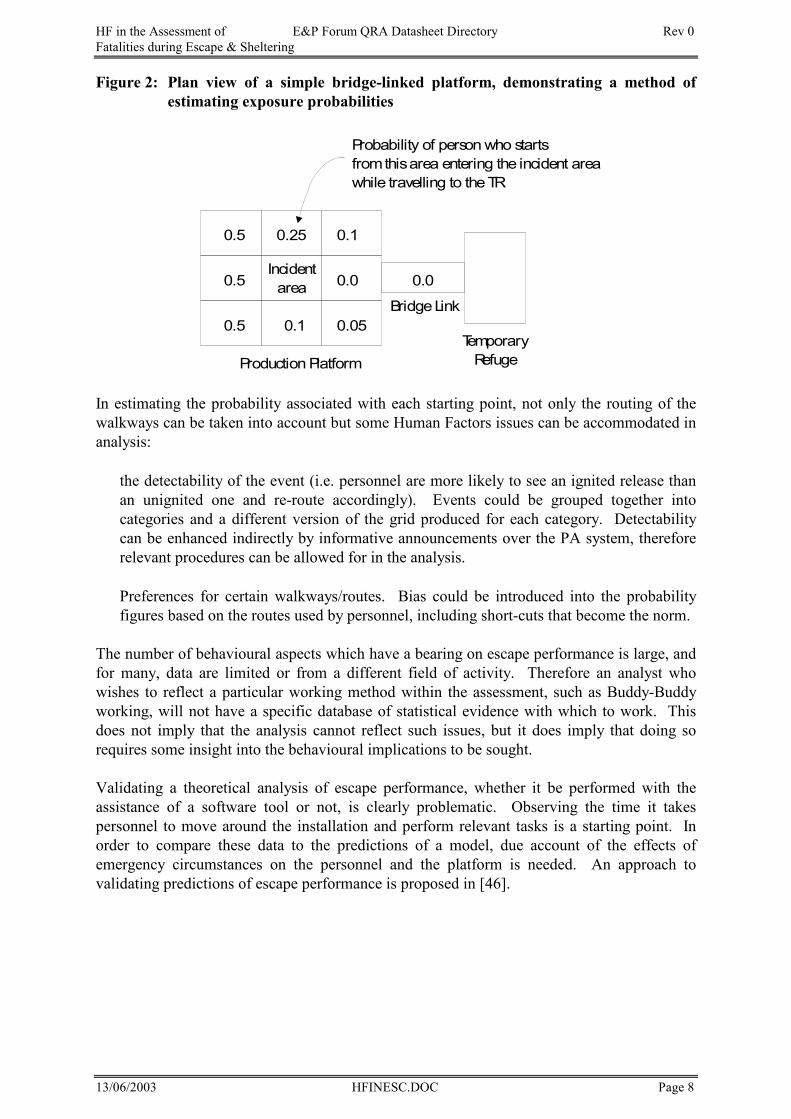
HF in the Assessment of E&P Forum QRA Datasheet Directory Rev 0 Fatalities during Escape & Sheltering
13/06/2003 HFINESC.DOC Page 8
Figure 2: Plan view of a simple bridge-linked platform, demonstrating a method of estimating exposure probabilities
In estimating the probability associated with each starting point, not only the routing of the walkways can be taken into account but some Human Factors issues can be accommodated in analysis: • the detectability of the event (i.e. personnel are more likely to see an ignited release than
an unignited one and re-route accordingly). Events could be grouped together into categories and a different version of the grid produced for each category. Detectability can be enhanced indirectly by informative announcements over the PA system, therefore relevant procedures can be allowed for in the analysis.
• Preferences for certain walkways/routes. Bias could be introduced into the probability
figures based on the routes used by personnel, including short-cuts that become the norm. The number of behavioural aspects which have a bearing on escape performance is large, and for many, data are limited or from a different field of activity. Therefore an analyst who wishes to reflect a particular working method within the assessment, such as Buddy-Buddy working, will not have a specific database of statistical evidence with which to work. This does not imply that the analysis cannot reflect such issues, but it does imply that doing so requires some insight into the behavioural implications to be sought. Validating a theoretical analysis of escape performance, whether it be performed with the assistance of a software tool or not, is clearly problematic. Observing the time it takes personnel to move around the installation and perform relevant tasks is a starting point. In order to compare these data to the predictions of a model, due account of the effects of emergency circumstances on the personnel and the platform is needed. An approach to validating predictions of escape performance is proposed in [46].
TemporaryRefugeProduction Platform
Incidentarea
0.5 0.25 0.1
0.00.5
0.5 0.1 0.05
0.0
BridgeLink
Probability of person who startsfromthisarea entering the incident areawhile travelling to theTR
HF in the Assessment of E&P Forum QRA Datasheet Directory Rev 0 Fatalities during Escape & Sheltering
13/06/2003 HFINESC.DOC Page 9
Data Sources This section contains a collection of data, drawn from a large number of sources, which have been found to be useful in helping to make judgements about probable patterns of behaviour during escape. The data cover: • reliability and time to respond to alarms • speed of movement of personnel • choice of route • performance in the use of personal protective equipment • degradation in human performance due to exposure to a toxic or thermal hazard Since emergency situations are rare and beyond the experience of most people, making it difficult for analysts to relate to the circumstances, it is appropriate to present actual, observed, data. A recurring theme in the analysis of emergencies is an over optimistic view of human performance. Reference to as much actual experience as possible is a useful means of gauging expected performance.
Reliability and time to respond to alarms (e.g. time to initiate escape to a TR)
The reliability of response to alarms is a key issue in the assessment of mustering performance. A large amount of data has been collected in regard to the factors which affect behaviour following an alarm signal. The findings indicate that the two dominant factors are: • previous experience of alarms (false alarms) • confirmatory signals (such as smoke, fire, noise) Data from building evacuations, where a high proportion of fire alarm signals is false, indicate that a significant proportion of people are likely to seek confirmation before commencing escape. Further data to enable the factors affecting false alarm rate and response behaviour to be identified are not available. It is expected that in the offshore environment the proportion of personnel seeking confirmation before commencing escape would be less than suggested by the data in Table 1 because of training and an awareness of the potential danger.
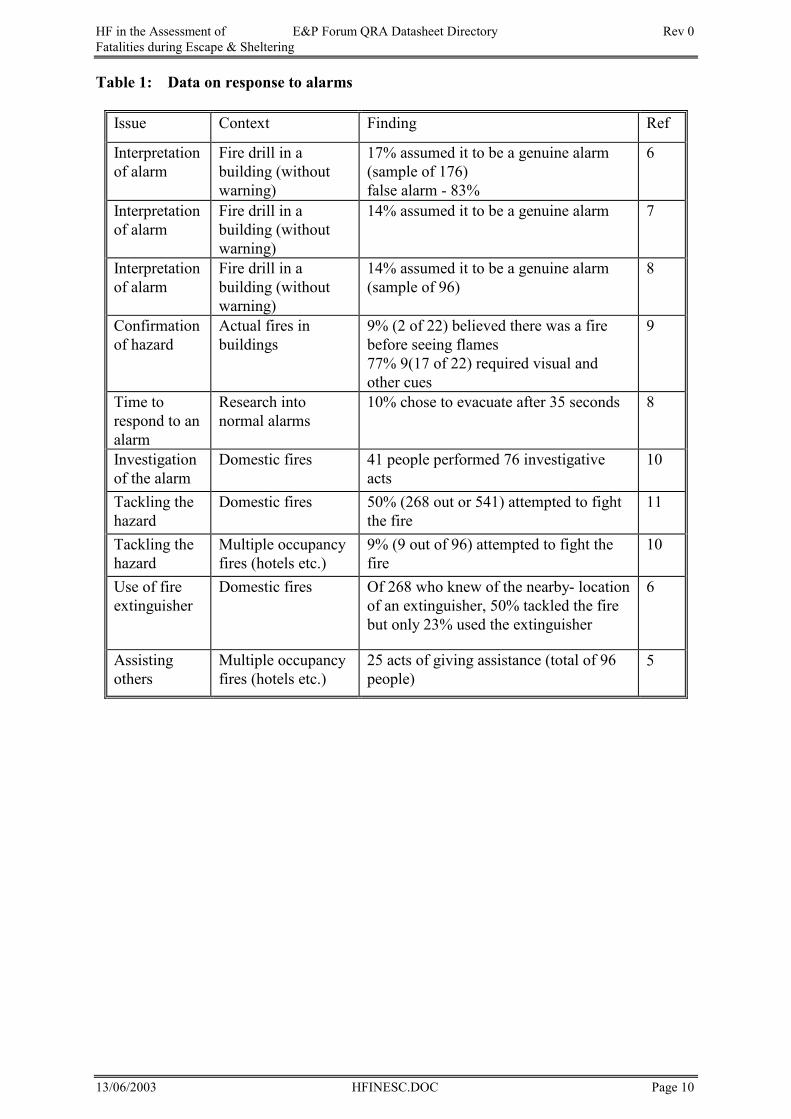
HF in the Assessment of E&P Forum QRA Datasheet Directory Rev 0 Fatalities during Escape & Sheltering
13/06/2003 HFINESC.DOC Page 10
Table 1: Data on response to alarms
Issue Context Finding Ref
Interpretation of alarm
Fire drill in a building (without warning)
17% assumed it to be a genuine alarm (sample of 176) false alarm - 83%
6
Interpretation of alarm
Fire drill in a building (without warning)
14% assumed it to be a genuine alarm 7
Interpretation of alarm
Fire drill in a building (without warning)
14% assumed it to be a genuine alarm (sample of 96)
8
Confirmation of hazard
Actual fires in buildings
9% (2 of 22) believed there was a fire before seeing flames 77% 9(17 of 22) required visual and other cues
9
Time to respond to an alarm
Research into normal alarms
10% chose to evacuate after 35 seconds 8
Investigation of the alarm
Domestic fires 41 people performed 76 investigative acts
10
Tackling the hazard
Domestic fires 50% (268 out or 541) attempted to fight the fire
11
Tackling the hazard
Multiple occupancy fires (hotels etc.)
9% (9 out of 96) attempted to fight the fire
10
Use of fire extinguisher
Domestic fires Of 268 who knew of the nearby- location of an extinguisher, 50% tackled the fire but only 23% used the extinguisher
6
Assisting others
Multiple occupancy fires (hotels etc.)
25 acts of giving assistance (total of 96 people)
5
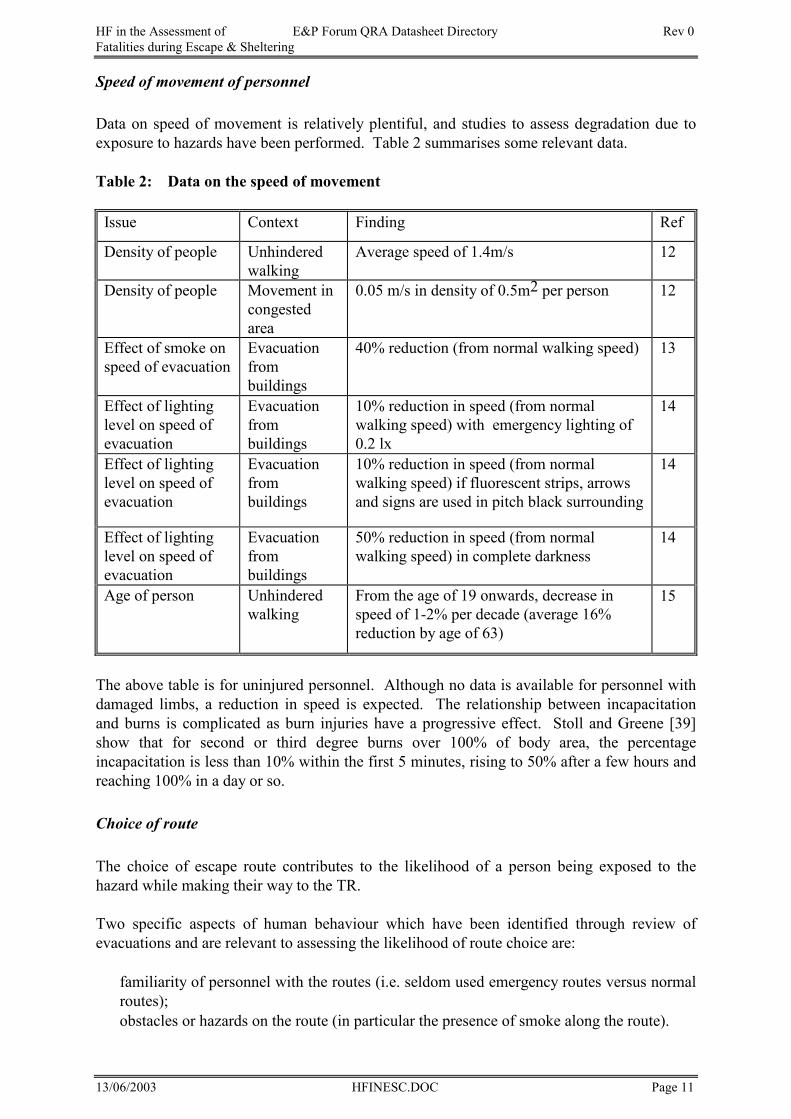
HF in the Assessment of E&P Forum QRA Datasheet Directory Rev 0 Fatalities during Escape & Sheltering
13/06/2003 HFINESC.DOC Page 11
Speed of movement of personnel Data on speed of movement is relatively plentiful, and studies to assess degradation due to exposure to hazards have been performed. Table 2 summarises some relevant data. Table 2: Data on the speed of movement
Issue Context Finding Ref
Density of people Unhindered walking
Average speed of 1.4m/s 12
Density of people Movement in congested area
0.05 m/s in density of 0.5m2 per person 12
Effect of smoke on speed of evacuation
Evacuation from buildings
40% reduction (from normal walking speed) 13
Effect of lighting level on speed of evacuation
Evacuation from buildings
10% reduction in speed (from normal walking speed) with emergency lighting of 0.2 lx
14
Effect of lighting level on speed of evacuation
Evacuation from buildings
10% reduction in speed (from normal walking speed) if fluorescent strips, arrows and signs are used in pitch black surrounding
14
Effect of lighting level on speed of evacuation
Evacuation from buildings
50% reduction in speed (from normal walking speed) in complete darkness
14
Age of person Unhindered walking
From the age of 19 onwards, decrease in speed of 1-2% per decade (average 16% reduction by age of 63)
15
The above table is for uninjured personnel. Although no data is available for personnel with damaged limbs, a reduction in speed is expected. The relationship between incapacitation and burns is complicated as burn injuries have a progressive effect. Stoll and Greene [39] show that for second or third degree burns over 100% of body area, the percentage incapacitation is less than 10% within the first 5 minutes, rising to 50% after a few hours and reaching 100% in a day or so.
Choice of route
The choice of escape route contributes to the likelihood of a person being exposed to the hazard while making their way to the TR. Two specific aspects of human behaviour which have been identified through review of evacuations and are relevant to assessing the likelihood of route choice are: • familiarity of personnel with the routes (i.e. seldom used emergency routes versus normal
routes); • obstacles or hazards on the route (in particular the presence of smoke along the route).
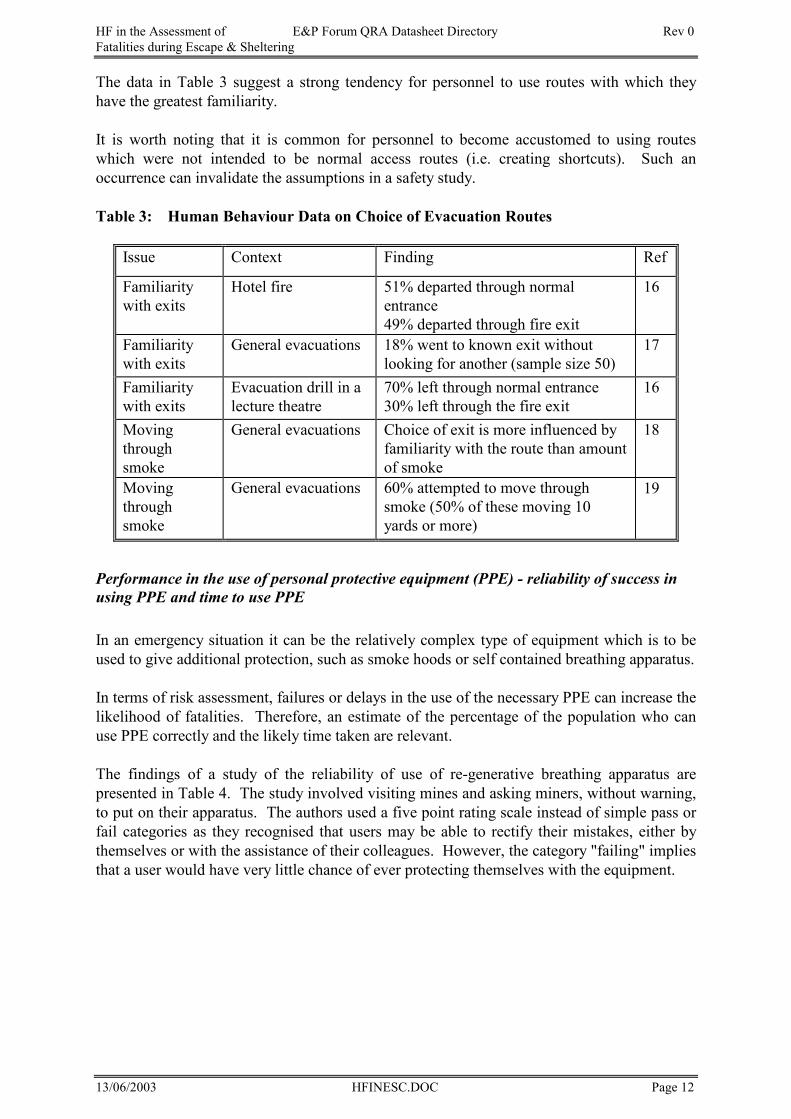
HF in the Assessment of E&P Forum QRA Datasheet Directory Rev 0 Fatalities during Escape & Sheltering
13/06/2003 HFINESC.DOC Page 12
The data in Table 3 suggest a strong tendency for personnel to use routes with which they have the greatest familiarity. It is worth noting that it is common for personnel to become accustomed to using routes which were not intended to be normal access routes (i.e. creating shortcuts). Such an occurrence can invalidate the assumptions in a safety study. Table 3: Human Behaviour Data on Choice of Evacuation Routes
Issue Context Finding Ref
Familiarity with exits
Hotel fire 51% departed through normal entrance 49% departed through fire exit
16
Familiarity with exits
General evacuations 18% went to known exit without looking for another (sample size 50)
17
Familiarity with exits
Evacuation drill in a lecture theatre
70% left through normal entrance 30% left through the fire exit
16
Moving through smoke
General evacuations Choice of exit is more influenced by familiarity with the route than amount of smoke
18
Moving through smoke
General evacuations 60% attempted to move through smoke (50% of these moving 10 yards or more)
19
Performance in the use of personal protective equipment (PPE) - reliability of success in using PPE and time to use PPE
In an emergency situation it can be the relatively complex type of equipment which is to be used to give additional protection, such as smoke hoods or self contained breathing apparatus. In terms of risk assessment, failures or delays in the use of the necessary PPE can increase the likelihood of fatalities. Therefore, an estimate of the percentage of the population who can use PPE correctly and the likely time taken are relevant. The findings of a study of the reliability of use of re-generative breathing apparatus are presented in Table 4. The study involved visiting mines and asking miners, without warning, to put on their apparatus. The authors used a five point rating scale instead of simple pass or fail categories as they recognised that users may be able to rectify their mistakes, either by themselves or with the assistance of their colleagues. However, the category "failing" implies that a user would have very little chance of ever protecting themselves with the equipment.
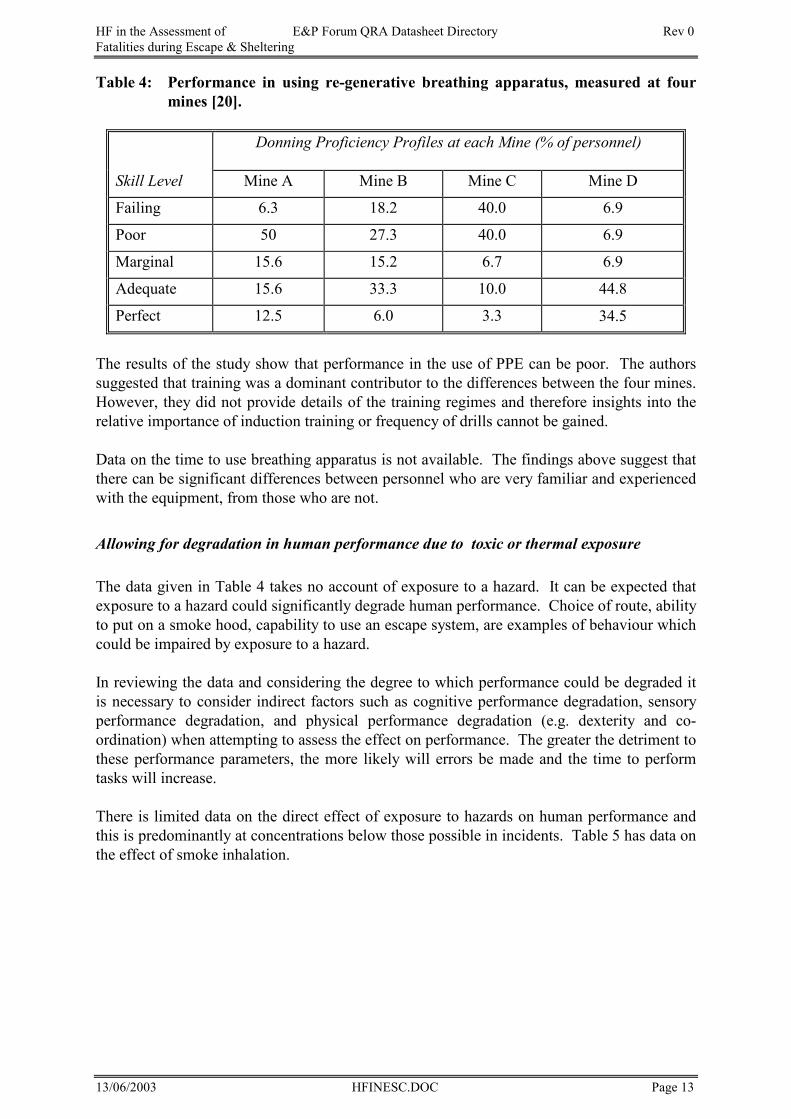
HF in the Assessment of E&P Forum QRA Datasheet Directory Rev 0 Fatalities during Escape & Sheltering
13/06/2003 HFINESC.DOC Page 13
Table 4: Performance in using re-generative breathing apparatus, measured at four mines [20].
Donning Proficiency Profiles at each Mine (% of personnel)
Skill Level Mine A Mine B Mine C Mine D
Failing 6.3 18.2 40.0 6.9
Poor 50 27.3 40.0 6.9
Marginal 15.6 15.2 6.7 6.9
Adequate 15.6 33.3 10.0 44.8
Perfect 12.5 6.0 3.3 34.5
The results of the study show that performance in the use of PPE can be poor. The authors suggested that training was a dominant contributor to the differences between the four mines. However, they did not provide details of the training regimes and therefore insights into the relative importance of induction training or frequency of drills cannot be gained. Data on the time to use breathing apparatus is not available. The findings above suggest that there can be significant differences between personnel who are very familiar and experienced with the equipment, from those who are not.
Allowing for degradation in human performance due to toxic or thermal exposure
The data given in Table 4 takes no account of exposure to a hazard. It can be expected that exposure to a hazard could significantly degrade human performance. Choice of route, ability to put on a smoke hood, capability to use an escape system, are examples of behaviour which could be impaired by exposure to a hazard. In reviewing the data and considering the degree to which performance could be degraded it is necessary to consider indirect factors such as cognitive performance degradation, sensory performance degradation, and physical performance degradation (e.g. dexterity and co-ordination) when attempting to assess the effect on performance. The greater the detriment to these performance parameters, the more likely will errors be made and the time to perform tasks will increase. There is limited data on the direct effect of exposure to hazards on human performance and this is predominantly at concentrations below those possible in incidents. Table 5 has data on the effect of smoke inhalation.
HF in the Assessment of E&P Forum QRA Datasheet Directory Rev 0 Fatalities during Escape & Sheltering
13/06/2003 HFINESC.DOC Page 14
Table 5: Data on the effect of exposure to smoke on cognitive abilities
Issue Context Finding Ref
Cognitive abilities
Effect of exposure to smoke on simple arithmetic tasks
100% accuracy at 0.1 l/m 58% accuracy at 1.2 l/m
21
Referring to the data on the effects of Hydrogen Sulphide (see datasheet on Human Vulnerability) it is clear that a person’s ability to see will be impaired, and it is possible that cognitive abilities will be hampered as exposure increases. It is these types of inferences which are necessary in assessing the effect of exposure on escape performance and with due regard to PPE requirements. A viable approach is to assume that a fraction of the lethal concentration is sufficient to disrupt cognitive abilities. A common choice is to use 15% of the LC50 value as a threshold where the rate of decision errors is significantly increased. 5.3 Availability of Data Although the above tables show that there is data relevant to escape performance, most of the data is not from the offshore environment specifically. However, trends indicated by the data (e.g. the effect of false alarms) are meaningful and relevant. 5.4 Strengths of the Method The approach to calculating escape fatalities is relatively straightforward - estimate how many personnel are exposed and then use the data in the Human Vulnerability datasheet to calculate fatality numbers. Unfortunately the complexity of human behaviour introduces uncertainties into the exposure estimates and there is a tendency to rely on coarse models of behaviour. However, the data in this section provide the analyst with an indicative means of taking account of installation specific issues in a relatively simple way: • what level of false alarm rate does the platform have? • which routes are used by personnel (including shortcuts)? • is personal protective equipment required to be used? • what effect would the specific hazard have on escape performance? 5.5 Limitations of the Method It is common for the modelling of escape performance in QRA to treat personnel as independent entities. However, it is known that group behaviour, such as an individual taking the lead and directing others, has a significant role in dictating the choice of actions and the outcome of escape performance. The above data does not take account of this facet of behaviour.
HF in the Assessment of E&P Forum QRA Datasheet Directory Rev 0 Fatalities during Escape & Sheltering
13/06/2003 HFINESC.DOC Page 15
6. ONGOING RESEARCH Tools to model the escape process and derive fatality estimates attempt to take account of the dominant factors affecting behaviour. A continuing objective is to create tools which integrate the dynamic modelling of the event to the modelling of escape behaviour.
7. REFERENCES [1] Reidel, D. (1982) Risk analysis of Six Potentially Hazardous Industrial Objects in the
Rijnmond Area: A Pilot Study, A report to the Rijnmond Public Authority, Dordrecht ("The COVO Study").
[2] Not used [3] Not used [4] Not used [5] Not used [6] Pauls, J. (1980) Building Evacuation: research findings and recommendations in Fires
and Human Behaviour (Ed. D. Canter), John Wiley & Sons, Chichester, p251-275. [7] Tong, D. & Canter, D. (1985) The decision to evacuate: A study of the motivations which
contribute to evacuation in the event of fire Fire Safety Journal, 9, 257-265. [8] Bellamy, L.J., et al. (1990) Experimental programme to investigate informative fire
warning characteristics for motivating fast evacuation, Building Research Establishment, Garston, Watford, U.K.
[9] Edelman, H. & Bichman, E. (1980) A model of behaviour in fires applied to a nursing
home fire in Fires and Human Behaviour (Ed. Canter, D.) 181-204, Chichester: Wiley. [10] Canter, D. (1980) (ed) Fires and Human Behaviour, Chichester: Wiley. [11] Canter, D. (1984) Studies of human behaviour in fire: empirical results and their
implications for education and design. Building Research Establishment, Garston, Watford, U.K.
[12] Fruin, J.J. (1970) Designing for pedestrians - A level of service concept. Ph.D.
Dissertation, The Polytechnic Institute of Brooklyn, June, 1970. [13] Fahy R.F., EXIT89: an evacuation model for high-rise buildings. In: Fire Safety Science
- proceedings of the third international symposium, London. Elsevier, 1991, p 815-823, ISBN 1851667199
[14] Krockeide, G. (1988) An introduction to luminous escape systems in Safety in the Built
Environment (Ed. Sime, J.D.) p 134-146. [15] Himann, Cunningham, Rechnitzer & Paterson, 1988
HF in the Assessment of E&P Forum QRA Datasheet Directory Rev 0 Fatalities during Escape & Sheltering
13/06/2003 HFINESC.DOC Page 16
[16] Sime (1985a) Movement towards the unfamiliar: Person and place affiliation in a fire entrapment setting Environment and Behaviour, 17:6, 697-724.
[17] Sixsmith, A.J., Sixsmith, J.A. & Canter, D.V. (1988) When is a door not a door? A
study of evacuation route identification in a large shopping mall in Safety in the Built Environment (Ed. Sime, J.D.) 62-74, E&FN SPON, London, 1988.
[18] Horiuchi, S., Murozaki, Y. & Hokuso, A. (1986) A case study of fire and evacuation in a
multi-purpose office building, Osaka, Japan in Fire Safety Science: Proceedings of the first International Symposium (Eds C.E.Grant & P.J.Pagni) Washington DC, Hemisphere Publishing Corp., Washington DC.
[19] Wood (1972) The behaviour of people in fires. Fire research Note 953. Borehamwood:
Fire Research Station. UK. [20] Kovac, J.G., Vaught, C., Branich Jr., M.J., Probability of making a successful mine
escape while wearing a self-contained self rescuer, Journal of the International Society for Respiratory Protection, Vol 10, Issue 4.
[21] Tadhisa & Yamada (1988) [22] Not used [23] Not used [24] US National Institute for Occupational Safety and Health (1977) Criteria for a
recommended standard occupational exposure to Hydrogen Sulphide, DHEW (NIOSH) Publication Number 77-158.
[25] Yant, W.P., 1930. Hydrogen Sulphide in Industry: Occurrence, Effects and Treatment in,
American Journal of Public Health, 20, p 598. [26] Patty, F.A., Ed. (1963) Hydrogen Sulphide, in Industrial Hygiene and Toxicology,
Volume 2 New York: Interscience. [27] Evans, C.L., 1967. The toxicity of Hydrogen Sulphide and other Sulphides in Journal of
Experimental Physiology, 52 (3), p 231. [28] Ahlborg, G., (1951) Hydrogen Sulphide Poisoning in Shale Oil Industry in Arfch.
Industrial Hygiene and Occupational Medecine, 3, p 247. [29] Gafafer, W.M. Ed. (1964) Hydrogen Sulphide, in Occupational Diseases: A Guide to
their Recognition, Public Health Service Publication. No. 1097, US Department of Health, Education and Welfare, Washington, DC, p 163.
[30] Poda, G.A., (1966) Hydrogen Sulphide can be Handled Safely in Arch. Environmental
Health, 12, p 795. [31] Jones, J.P., (1975) Hazards of Hydrogen Sulphide Gas, Selected Papers from the 23rd
Annual Gas Measurement Institute, 16.
HF in the Assessment of E&P Forum QRA Datasheet Directory Rev 0 Fatalities during Escape & Sheltering
13/06/2003 HFINESC.DOC Page 17
[32] American Conference of Governmental Industrial Hygienists, (1980) Hydrogen Sulphide in Documentation of the Threshold Limit Values, 4th Edition, ACGIH, Cincinnati, p 225.
[33] Elkins, H.B., (1952) Hydrogen Sulphide in The Chemistry of Industrial Toxicology,
New York: John Wiley & Sons, p 95 & 232. [34] Johnstone, R.T. and Saunders, W.B. (Eds.) (1960) Noxious Gases: Hydrogen Sulphide
(H2S) in Occupational Diseases and Industrial Medicine, W.B. Saunders, Philadelphia, p 115.
[35] Haggard, H.W., 1928. The Toxicology of Hydrogen Sulphide, Journal of Industrial
Hygiene, 7, p 113 [36] Eisenberg et al., (1975) Vulnerability Model. A Simulation Systems for Assessing
Damage Resulting from Marine Spills. Nat. Tech. Service Report, AD-A015-245, Springfield, VA
[37] Not used [38] Herd C.J., Jones R.H., Lewis K., Evacuation, escape and rescue analysis by integrated
risk assessment. In: Risk analysis in the offshore industry II, Aberdeen, 25-27 March 1991. IBC Technical Services.
[39] Stoll A.M. and Greene L.C., Relationship between pain and tissue damage due to
thermal radiation. J. Appl. Physiol., vol.14, p373, 1959 [40] Not used [41] Crossthwaite, P.J., Fitzpatrick, R.D., Hurst, N.W. Risk assessment for the siting of
developments near liquefied petroleum gas installations, IChemE Symposium Series 110 [42] Ketchell N., et al, When and how will people muster. In: Response to incidents offshore,
8-9 June 1993, Aberdeen, IBC Technical Services [43] MUSTER, DNV Technica [44] Kisko T.M., Francis R.L., Noble C.R., EVACNET+ User’s Guide, Gainesville, Florida:
University of Florida Department of Industrial and Systems Engineering, April 1984 [45] Evacuation Model, Railway Gazette International, Vol 149, no 10, October 1993, p. 713 [46] Jack M., King D., Practical validation of installation evacuation, escape and rescue
(EER) systems. In: Response to incidents offshore, 8-9 June 1993, Aberdeen, IBC Technical Services.
HF in the Assessment of E&P Forum QRA Datasheet Directory Rev 0 Fatalities during Escape & Sheltering
13/06/2003 HFINESC.DOC Page 18
HF in the Assessment of E&P Forum QRA Datasheet Directory Rev 0 Fatalities during Evacuation & Rescue
13/06/2003 HFINEVAC.DOC Page 1
HUMAN FACTORS IN THE ASSESSMENT OF FATALITIES DURING EVACUATION AND RESCUE (OFFSHORE FACILITIES)
HF in the Assessment of E&P Forum QRA Datasheet Directory Rev 0 Fatalities during Evacuation & Rescue
13/06/2003 HFINEVAC.DOC Page 2
TABLE OF CONTENTS
GLOSSARY OF TERMS & ABBREVIATIONS ------------------------------------------------- 3
1 INTRODUCTION-------------------------------------------------------------------------------------- 4
2 SCOPE -------------------------------------------------------------------------------------------------- 5
3 APPLICATION ---------------------------------------------------------------------------------------- 6
4 ESTIMATING THE PROPORTION OF PERSONNEL WHO ARE UNABLE TO USE PARTICULAR EVACUATION SYSTEMS------------------------------------------------- 6
4.1 Description --------------------------------------------------------------------------------------------------------------6
4.2 Data Sources------------------------------------------------------------------------------------------------------------7
4.3 Availability of Data-------------------------------------------------------------------------------------------------- 10
5 HUMAN FACTORS IN LIFEBOAT EVACUATION MODELLING--------------------- 11
5.1 Description ------------------------------------------------------------------------------------------------------------ 11
5.2 Data Sources---------------------------------------------------------------------------------------------------------- 11
5.3 Availability of Data-------------------------------------------------------------------------------------------------- 13
5.4 Strengths of the Method-------------------------------------------------------------------------------------------- 13
5.5 Limitations of the Method ----------------------------------------------------------------------------------------- 13
6 ESTIMATING FATALITIES DURING EVACUATION BY OTHER MEANS ------- 17
6.1 Description ------------------------------------------------------------------------------------------------------------ 17
6.2 Data Sources---------------------------------------------------------------------------------------------------------- 17
7 ONGOING RESEARCH -------------------------------------------------------------------------- 18
8 REFERENCES -------------------------------------------------------------------------------------- 19
HF in the Assessment of E&P Forum QRA Datasheet Directory Rev 0 Fatalities during Evacuation & Rescue
13/06/2003 HFINEVAC.DOC Page 3
GLOSSARY OF TERMS & ABBREVIATIONS Term Abbreviation Definition Escape - The process of personnel leaving the vicinity of an
incident and making their way to a safe location. For an offshore installation the safe location is designated the Temporary Refuge
Evacuation - A term used to describe the process of leaving the offshore installation in response to an emergency in order to reach a place of permanent safety
Human Error Probability
HEP The nominal probability of a person making an error when performing a task. It is normally on a per opportunity basis. The HEP range is from 10-5 per opportunity to 1 per opportunity. For a given task there can be different error modes, each with a nominal HEP. The HEP is dependent on the characteristics of the task and the attributes of the person (e.g. trained or untrained). Human reliability techniques are used to estimate a HEP
Human Reliability Analysis
HRA A generic term covering all techniques which are used to assess the human component of a system
Offshore Installation Manager
OIM Person in charge of an offshore installation
Personal Protective Equipment
PPE -
Quantified Risk Assessment
QRA -
Rescue - Following evacuation, this is the recovery of personnel to a place of permanent safety
Task Analysis - A series of techniques used to analyse and assess the activities performed by people within a system
Totally Enclosed Motor Propelled Survival Craft
TEMPSC A type of lifeboat which satisfies certain requirements specified by the International Maritime Organisation
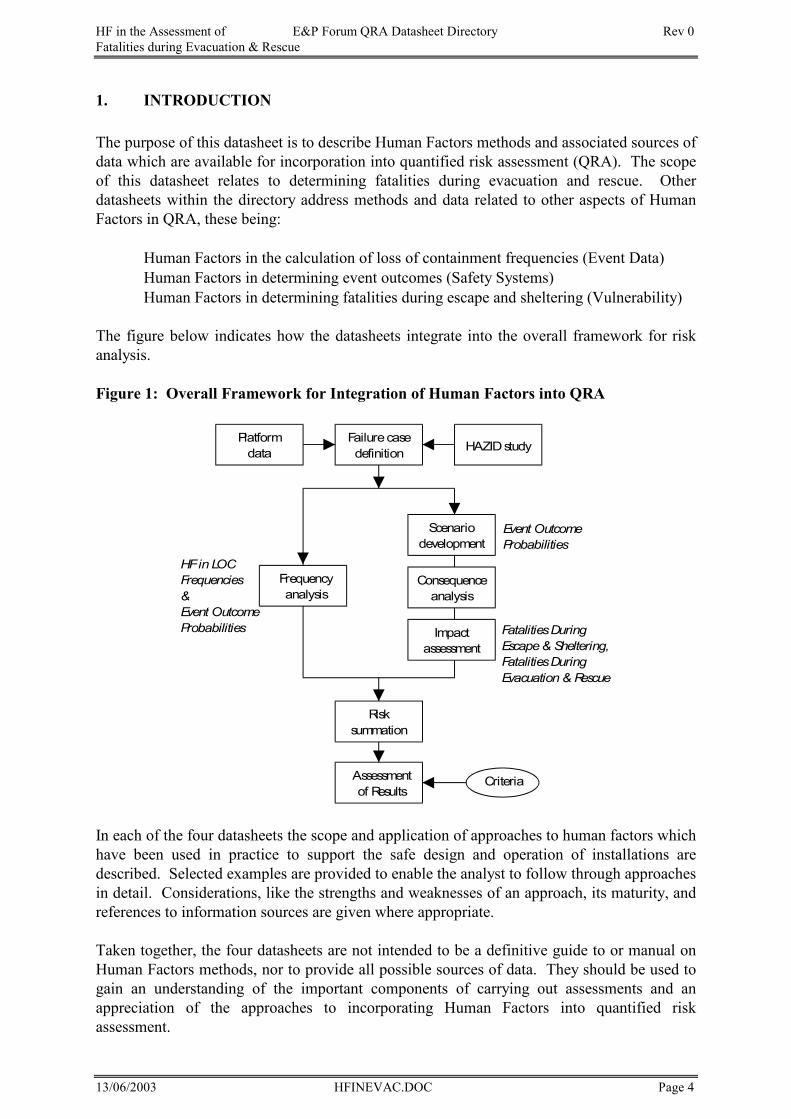
HF in the Assessment of E&P Forum QRA Datasheet Directory Rev 0 Fatalities during Evacuation & Rescue
13/06/2003 HFINEVAC.DOC Page 4
1. INTRODUCTION The purpose of this datasheet is to describe Human Factors methods and associated sources of data which are available for incorporation into quantified risk assessment (QRA). The scope of this datasheet relates to determining fatalities during evacuation and rescue. Other datasheets within the directory address methods and data related to other aspects of Human Factors in QRA, these being: • Human Factors in the calculation of loss of containment frequencies (Event Data) • Human Factors in determining event outcomes (Safety Systems) • Human Factors in determining fatalities during escape and sheltering (Vulnerability) The figure below indicates how the datasheets integrate into the overall framework for risk analysis.
Figure 1: Overall Framework for Integration of Human Factors into QRA
In each of the four datasheets the scope and application of approaches to human factors which have been used in practice to support the safe design and operation of installations are described. Selected examples are provided to enable the analyst to follow through approaches in detail. Considerations, like the strengths and weaknesses of an approach, its maturity, and references to information sources are given where appropriate. Taken together, the four datasheets are not intended to be a definitive guide to or manual on Human Factors methods, nor to provide all possible sources of data. They should be used to gain an understanding of the important components of carrying out assessments and an appreciation of the approaches to incorporating Human Factors into quantified risk assessment.
Platformdata
Failurecasedefinition HAZIDstudy
Frequencyanalysis
Scenariodevelopment
Consequenceanalysis
Impactassessment
Risksummation
Assessmentof Results
Criteria
Event OutcomeProbabilities
HFin LOCFrequencies&Event OutcomeProbabilities FatalitiesDuring
Escape& Sheltering,FatalitiesDuringEvacuation& Rescue
HF in the Assessment of E&P Forum QRA Datasheet Directory Rev 0 Fatalities during Evacuation & Rescue
13/06/2003 HFINEVAC.DOC Page 5
2. SCOPE This datasheet is concerned with taking account of human performance in the use of evacuation systems other than helicopter evacuation. It supplements the data sheet on Evacuation, Escape and Rescue.
In modelling evacuation the QRA analyst is interested in estimating the proportion of personnel who survive. Therefore, the analyst needs to make judgements about: • the proportion who use each of the various evacuation options, • of those who use a system, how many would be killed when using it, • the proportion who would be killed during rescue. The main difficulty for an analyst is the scarcity of data, increasing the emphasis on judgement. This is also a problem for providing data on the pertinent Human Factors issues. Although the lack of data is a hindrance, the information in this datasheet is able to provide some assistance to making the required judgements. Not surprisingly there are a number of Human Factors issues in evacuation. For there to be a need to evacuate implies that the perceived threat to life is considerable. Consequently the behaviour of personnel will be greatly affected by the stress of the situation such that: • the choice of actions is unlikely to be systematically thought through or weighed-up
against all others • over-hasty decisions may be made based on incomplete and insufficient information • personnel will begin “running on automatic”. There will be a reduction in the
intellectual level, with personnel resorting to familiar actions • personnel will focus on the immediate task at hand to the exclusion of others and their
ability to take on board new information will be reduced • personnel may exhibit rigidity in problem solving, e.g. concentrating on one solution
even though it does not work • performance on seemingly simple tasks will be greatly affected. Tasks requiring
manual dexterity will be very much more difficult and require more time to complete than in normal circumstances
These points are pertinent to the performance of the person in overall charge, referred to here as the Offshore Installation Manager (OIM). As the person with the role of evaluating the incident and choosing if, how and when to evacuate, the decisions of the OIM can influence the outcome. The OIM could evaluate the conditions on the installation correctly and order an evacuation at the most opportune moment. However, the OIM could also: • delay the evacuation, or fail to give the command to evacuate incurring greater
fatalities than necessary • give the order to evacuate when there is no need to do so and therefore expose the
personnel to unnecessary risks • choose the wrong mode of evacuation. The OIM needs to have decision criteria with which to judge the situation in order to choose a strategy. Ambiguity in the criteria and uncertainty or inaccuracies in the information
HF in the Assessment of E&P Forum QRA Datasheet Directory Rev 0 Fatalities during Evacuation & Rescue
13/06/2003 HFINEVAC.DOC Page 6
available introduce the chance of a non-optimum strategy being selected. In addition, the stress of the situation will affect the behaviour of the OIM, and exposure to smoke or other toxic substances can affect his cognitive performance (see datasheet on Human Vulnerability), adding weight to the argument that the OIM will not always choose the optimum strategy.
3. APPLICATION There are three sections to this datasheet. The first is concerned with restrictions in the use of evacuation systems. Although it is not possible to provide a definitive statement on the proportion of personnel who could not use an evacuation system, the section lists the Human Factors issues relevant to the limitations of using, or not using an evacuation system. The second section is concerned with Human Factors issues which could be included in the modelling of lifeboat evacuation. It is normal to model lifeboat evacuation as a sequence of stages, with failures (and fatalities) possible in each stage. Although modelling of lifeboat evacuation [1] has provided useful data, it is focused on hardware failures and the effect of sea states on evacuation performance. An aspect which is not well addressed is the likelihood of the evacuation being jeopardised by human failures. It is this aspect which is addressed here. The third section is concerned with fatalities from other modes of evacuation (other than lifeboat), which involve personnel entering and needing to be recovered from the sea.
4. ESTIMATING THE PROPORTION OF PERSONNEL WHO ARE UNABLE TO USE PARTICULAR EVACUATION SYSTEMS
4.1 Description If all personnel are able to use an evacuation system, i.e. there are no aspects of the system which they are unable to use, fit into, pass through, etc., the system is available to 100% of the population. If there are demands made which a person cannot meet, it is unavailable to that person. For example, in the evacuation from the Alexander Kjelland, one man had to leave his lifejacket behind in order to get through a hatch when the lifeboat capsized [2] - the hatch was not big enough. Unfortunately the size of the man was not reported, permitting the conclusion to be made that he must have been a "giant of a man". This may not have been the case. Excluding the anecdotal evidence above, there is very little directly useful data covering the issues raised in this section. Therefore the issues are unlikely to be addressed specifically in an analysis. It may be argued that they are covered by assumptions in the evacuation modelling (e.g. assumptions about the proportion of personnel jumping into the sea rather than using a lifeboat). There are three components to the availability of escape and evacuation equipment: • Physical dimensions of the system (e.g. seat dimensions preventing largest proportion
of personnel from using a lifeboat) • Physical strength requirements for operating the system (e.g. using controls, opening
lifeboat hatches)
HF in the Assessment of E&P Forum QRA Datasheet Directory Rev 0 Fatalities during Evacuation & Rescue
13/06/2003 HFINEVAC.DOC Page 7
• Physical and mental tolerances required by the system (e.g. tolerances to motions of a lifeboat, willingness to use the system)
It would be hoped that any system in use on an installation had been selected so as to accommodate all able-bodied users. The availability of systems to injured personnel is more difficult to quantify. Lifeboats can carry one or two stretchers, with freefall boats having a place to fix a flat stretcher or having specially shaped stretchers to strap into a seat. The ability of the injured person to withstand the motions of the boat depend more on the nature of the injuries than on the design of the lifeboat.
4.2 Data Sources Although the extent of data on evacuation and escape equipment is very limited, this section is included in order to give a framework for considering availability. The focus is on lifeboat systems but the principal concerns are appropriate for other types of equipment. The section is divided into three: • anthropometric restrictions • physiological restrictions • psychological restrictions Anthropometric Restrictions
The measurement of body size (anthropometry) has a long history and much effort has been expended in cataloguing every conceivable dimension. Unfortunately, although the results of this work can be illuminating, it is difficult to use a list of specific measurements to critically review complex work spaces and draw conclusions about anthropometric problems. Also, it is possible for a person to quite literally squeeze through a space which, according to their “static” measurements, they should not be able to pass. Researchers are beginning to compile “dynamic” measurements for specific work spaces to overcome this inaccuracy. At present, for the type of tasks in lifeboat evacuation for which there may be difficulties due to body size (Table 1) the only type of documented data is “static” anthropometric data as presented in Table 2. Table 1: Anthropometric Restrictions
Task Issues/Concerns Data
Passing through entry hatch
- Space for entry or exit through hatch. - Wearing of survival clothing.
Anthropometric data (see table 2)
Fitting into seat - Population extremes (smallest and largest) in terms of proportions unable to use straps or fit into seats. - Wearing of survival clothing.
Designed for 70 kg person
To make an anthropometric assessment of the evacuation systems on an installation, the analyst is advised to use more direct methods: check whether there have been problems during drills or organise trials to test the systems.
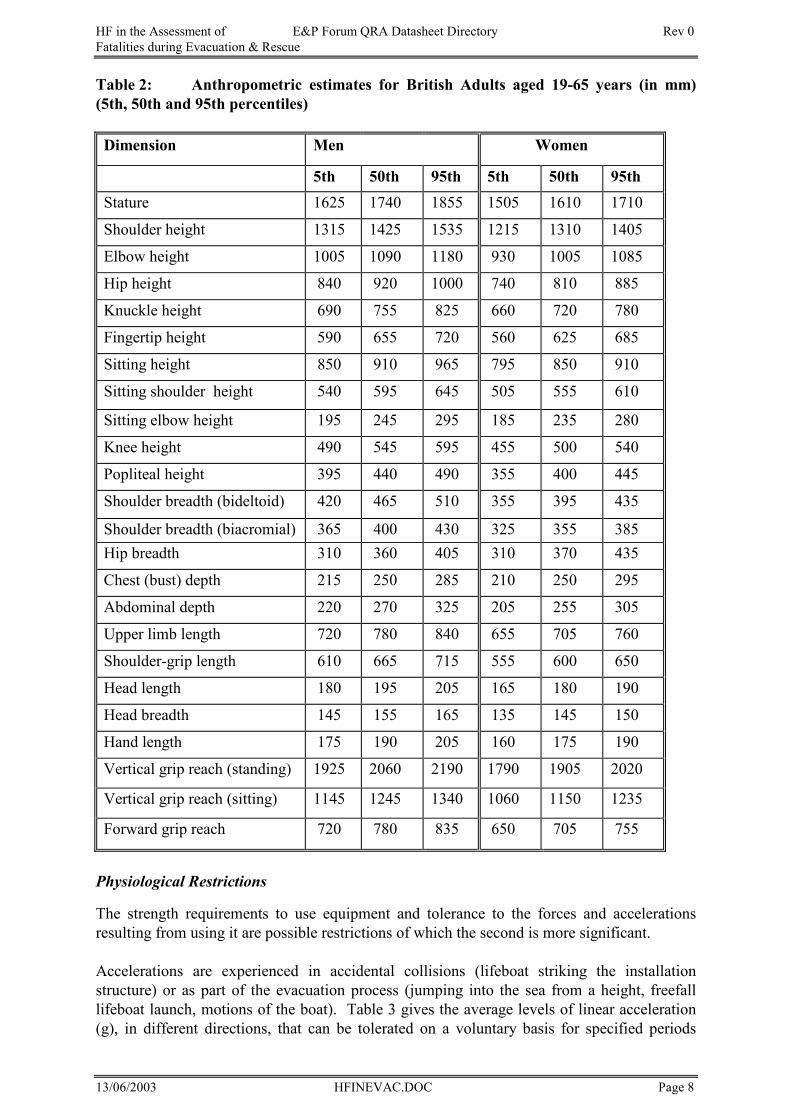
HF in the Assessment of E&P Forum QRA Datasheet Directory Rev 0 Fatalities during Evacuation & Rescue
13/06/2003 HFINEVAC.DOC Page 8
Table 2: Anthropometric estimates for British Adults aged 19-65 years (in mm) (5th, 50th and 95th percentiles) Dimension Men Women
5th 50th 95th 5th 50th 95th Stature 1625 1740 1855 1505 1610 1710
Shoulder height 1315 1425 1535 1215 1310 1405
Elbow height 1005 1090 1180 930 1005 1085
Hip height 840 920 1000 740 810 885
Knuckle height 690 755 825 660 720 780
Fingertip height 590 655 720 560 625 685
Sitting height 850 910 965 795 850 910
Sitting shoulder height 540 595 645 505 555 610
Sitting elbow height 195 245 295 185 235 280
Knee height 490 545 595 455 500 540
Popliteal height 395 440 490 355 400 445
Shoulder breadth (bideltoid) 420 465 510 355 395 435
Shoulder breadth (biacromial) 365 400 430 325 355 385 Hip breadth 310 360 405 310 370 435
Chest (bust) depth 215 250 285 210 250 295
Abdominal depth 220 270 325 205 255 305
Upper limb length 720 780 840 655 705 760
Shoulder-grip length 610 665 715 555 600 650
Head length 180 195 205 165 180 190
Head breadth 145 155 165 135 145 150
Hand length 175 190 205 160 175 190
Vertical grip reach (standing) 1925 2060 2190 1790 1905 2020
Vertical grip reach (sitting) 1145 1245 1340 1060 1150 1235
Forward grip reach 720 780 835 650 705 755
Physiological Restrictions
The strength requirements to use equipment and tolerance to the forces and accelerations resulting from using it are possible restrictions of which the second is more significant. Accelerations are experienced in accidental collisions (lifeboat striking the installation structure) or as part of the evacuation process (jumping into the sea from a height, freefall lifeboat launch, motions of the boat). Table 3 gives the average levels of linear acceleration (g), in different directions, that can be tolerated on a voluntary basis for specified periods
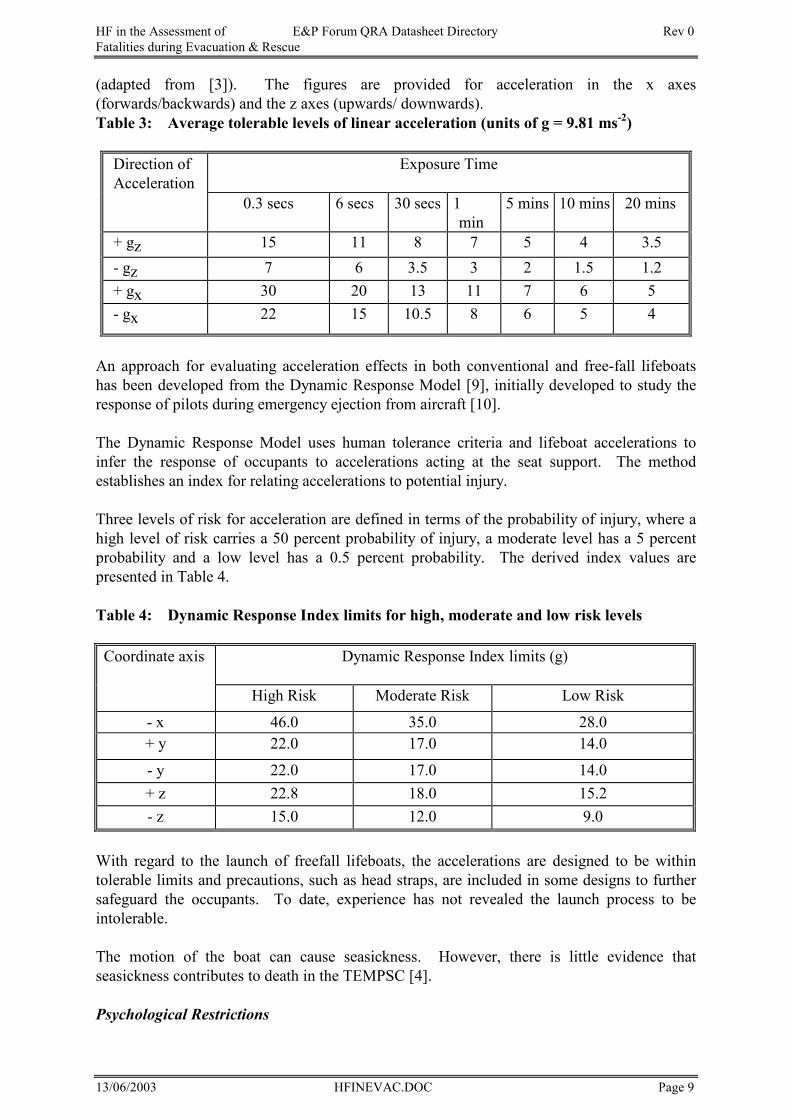
HF in the Assessment of E&P Forum QRA Datasheet Directory Rev 0 Fatalities during Evacuation & Rescue
13/06/2003 HFINEVAC.DOC Page 9
(adapted from [3]). The figures are provided for acceleration in the x axes (forwards/backwards) and the z axes (upwards/ downwards). Table 3: Average tolerable levels of linear acceleration (units of g = 9.81 ms-2)
Direction of Acceleration
Exposure Time
0.3 secs 6 secs 30 secs 1min
5 mins 10 mins 20 mins
+ gz 15 11 8 7 5 4 3.5 - gz 7 6 3.5 3 2 1.5 1.2+ gx 30 20 13 11 7 6 5 - gx 22 15 10.5 8 6 5 4
An approach for evaluating acceleration effects in both conventional and free-fall lifeboats has been developed from the Dynamic Response Model [9], initially developed to study the response of pilots during emergency ejection from aircraft [10]. The Dynamic Response Model uses human tolerance criteria and lifeboat accelerations to infer the response of occupants to accelerations acting at the seat support. The method establishes an index for relating accelerations to potential injury. Three levels of risk for acceleration are defined in terms of the probability of injury, where a high level of risk carries a 50 percent probability of injury, a moderate level has a 5 percent probability and a low level has a 0.5 percent probability. The derived index values are presented in Table 4. Table 4: Dynamic Response Index limits for high, moderate and low risk levels
Coordinate axis
Dynamic Response Index limits (g)
High Risk Moderate Risk Low Risk
- x 46.0 35.0 28.0+ y 22.0 17.0 14.0
- y 22.0 17.0 14.0 + z 22.8 18.0 15.2- z 15.0 12.0 9.0
With regard to the launch of freefall lifeboats, the accelerations are designed to be within tolerable limits and precautions, such as head straps, are included in some designs to further safeguard the occupants. To date, experience has not revealed the launch process to be intolerable. The motion of the boat can cause seasickness. However, there is little evidence that seasickness contributes to death in the TEMPSC [4]. Psychological Restrictions
HF in the Assessment of E&P Forum QRA Datasheet Directory Rev 0 Fatalities during Evacuation & Rescue
13/06/2003 HFINEVAC.DOC Page 10
The use of relatively new evacuation technology, in particular freefall lifeboats, has raised the issue of the willingness of personnel to use evacuation systems. Discussions with training centres give large differences ranging from no recorded refusals to as many as 1 in a 100. Reasons for refusals include concern over prior back pain/injury. It is suggested that the refusal rate among personnel would vary with the type of emergency event on the installation and with the prevailing weather conditions. Refusals are likely to increase in poor weather conditions, but decrease with increasing perceived danger from the incident.
4.3 Availability of Data As has been stated above, data and information about the availability of evacuation systems is sparse. An analyst may find some useful information within reports on drills or exercises conducted on the installation.
HF in the Assessment of E&P Forum QRA Datasheet Directory Rev 0 Fatalities during Evacuation & Rescue
13/06/2003 HFINEVAC.DOC Page 11
5. HUMAN FACTORS IN LIFEBOAT EVACUATION MODELLING
5.1 Description A study on behalf of the Department of Energy [3] provided the data for a model of lifeboat evacuation from offshore installations by traditional davit launched totally enclosed motor propelled survival craft (TEMPSC). The approach taken was to model the evacuation process as a sequence of steps, with all steps needing to be completed successfully for the occupants to reach safety without injury. The model could be used to derive installation specific fatality statistics. As well as estimating the probability of human errors the consequences of those errors must be distinguished. In the worst case errors can cause the loss of the boat, while others may mean that the boat cannot depart but its occupants can leave to use another boat or another mode of evacuation, or that the evacuation can continue by the occupants using secondary systems (such as manually releasing hooks). This ability to recover from a failure is important in the modelling of evacuation. Software models are available for assessing lifeboat evacuation, examples being ESCAPE and FARLIFE. The ESCAPE programme [11] is based on the Department of Energy study [3]. The FARLIFE programme [12] is a time based simulator which can use the same data and can include operational errors within the model.
5.2 Data Sources Time to perform tasks
Time based modelling requires data on the times to perform tasks such as embarking, releasing hooks etc. The types of tasks which may be included in the modelling, with suggested times, are listed in Table 5. The required data on task times could be derived from monitoring practice drills, although performance in emergency conditions is likely to be different and allowance for the stress and possible confusion of the situation should be factored into the figures. Factors which affect time to complete tasks are: • % loading of the lifeboat. For most craft the space per person makes the cabin
cramped when nearing full loading. Therefore the time taken to embark is not linearly related to the percentage loading (e.g. 100% of capacity will take more than twice the time to load 50% of capacity).
• presence of trained crew. The crew have specific roles to play which includes checking the boat, controlling the embarkation and operating the controls and other lifeboat systems during descent and departure. The lack of a trained crew would extend the time required to evacuate and increase the probability of errors being made.
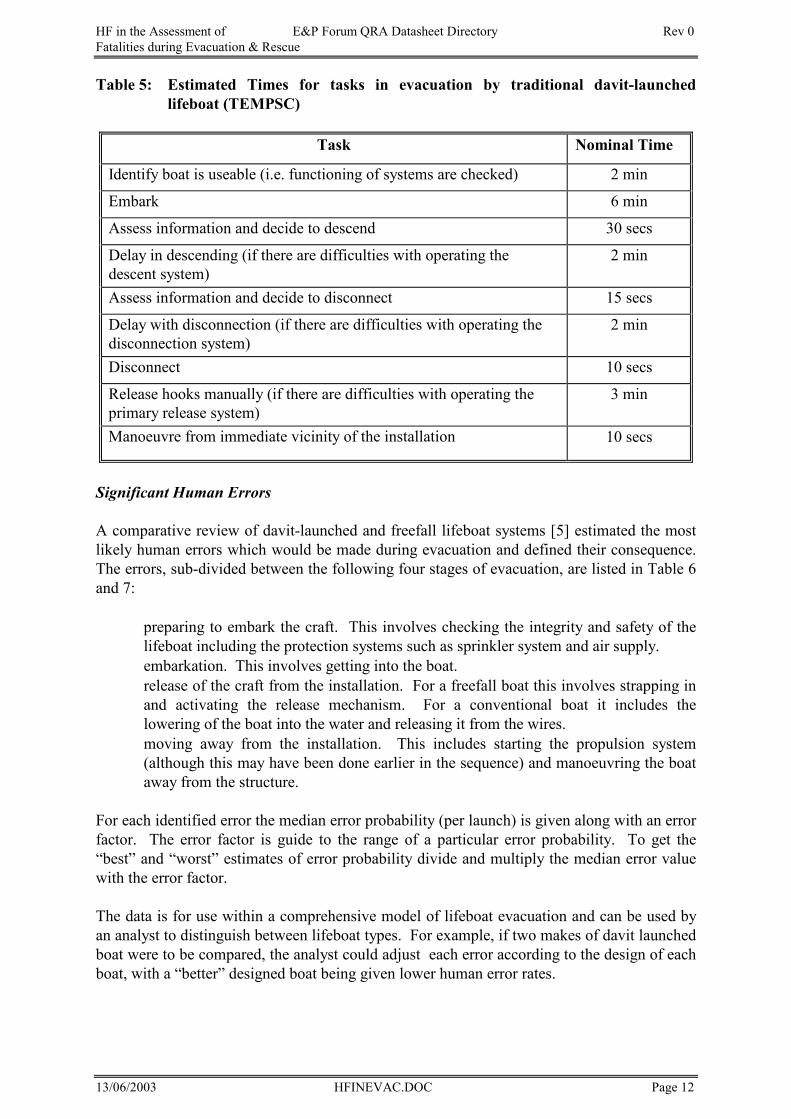
HF in the Assessment of E&P Forum QRA Datasheet Directory Rev 0 Fatalities during Evacuation & Rescue
13/06/2003 HFINEVAC.DOC Page 12
Table 5: Estimated Times for tasks in evacuation by traditional davit-launched lifeboat (TEMPSC)
Task Nominal Time
Identify boat is useable (i.e. functioning of systems are checked) 2 min
Embark 6 min
Assess information and decide to descend 30 secs
Delay in descending (if there are difficulties with operating the descent system)
2 min
Assess information and decide to disconnect 15 secs
Delay with disconnection (if there are difficulties with operating the disconnection system)
2 min
Disconnect 10 secs
Release hooks manually (if there are difficulties with operating the primary release system)
3 min
Manoeuvre from immediate vicinity of the installation 10 secs
Significant Human Errors
A comparative review of davit-launched and freefall lifeboat systems [5] estimated the most likely human errors which would be made during evacuation and defined their consequence. The errors, sub-divided between the following four stages of evacuation, are listed in Table 6 and 7: • preparing to embark the craft. This involves checking the integrity and safety of the
lifeboat including the protection systems such as sprinkler system and air supply. • embarkation. This involves getting into the boat. • release of the craft from the installation. For a freefall boat this involves strapping in
and activating the release mechanism. For a conventional boat it includes the lowering of the boat into the water and releasing it from the wires.
• moving away from the installation. This includes starting the propulsion system (although this may have been done earlier in the sequence) and manoeuvring the boat away from the structure.
For each identified error the median error probability (per launch) is given along with an error factor. The error factor is guide to the range of a particular error probability. To get the “best” and “worst” estimates of error probability divide and multiply the median error value with the error factor. The data is for use within a comprehensive model of lifeboat evacuation and can be used by an analyst to distinguish between lifeboat types. For example, if two makes of davit launched boat were to be compared, the analyst could adjust each error according to the design of each boat, with a “better” designed boat being given lower human error rates.
HF in the Assessment of E&P Forum QRA Datasheet Directory Rev 0 Fatalities during Evacuation & Rescue
13/06/2003 HFINEVAC.DOC Page 13
5.3 Availability of Data If possible the times for lifeboat evacuation should be based on drills on the actual installation and factored to take account of emergency conditions. The human error probabilities for lifeboat evacuation performance are based on expert judgement.
5.4 Strengths of the Method Since lifeboat evacuation is normally chosen only when other options are unavailable (e.g. helicopter evacuation, remain until the event is over) it is probable that there will be limited time available to get the lifeboat away from the platform before some life threatening event occurs. Therefore, the time taken to evacuate should be modelled. In the best case the evacuation will be performed smoothly, without delays. However, the data provided enables a model to take account of delays due to difficulties or errors made in the launching process.
5.5 Limitations of the Method The amount of detail which can be incorporated into the modelling of lifeboat evacuation may make it necessary to develop or acquire a software tool in order to do so. Uncertainties in the assumptions such as the proportion of fatalities during recovery from the lifeboat by helicopter or to a standby vessel (which could be assumed to be up to 5%) can mean that a refined model of lifeboat evacuation is not merited.
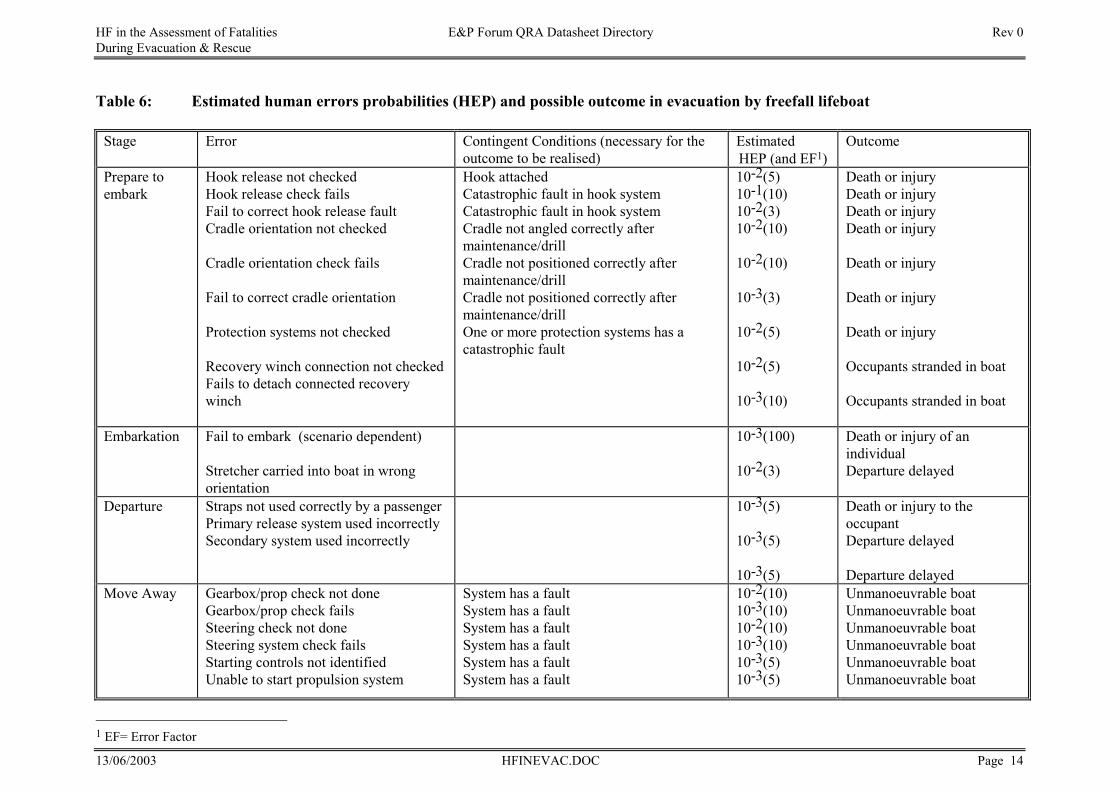
HF in the Assessment of Fatalities E&P Forum QRA Datasheet Directory Rev 0During Evacuation & Rescue
13/06/2003 HFINEVAC.DOC Page 14
Table 6: Estimated human errors probabilities (HEP) and possible outcome in evacuation by freefall lifeboat
Stage Error Contingent Conditions (necessary for theoutcome to be realised)
EstimatedHEP (and EF1)
Outcome
Prepare toembark
Hook release not checkedHook release check failsFail to correct hook release faultCradle orientation not checked
Cradle orientation check fails
Fail to correct cradle orientation
Protection systems not checked
Recovery winch connection not checkedFails to detach connected recoverywinch
Hook attachedCatastrophic fault in hook systemCatastrophic fault in hook systemCradle not angled correctly aftermaintenance/drillCradle not positioned correctly aftermaintenance/drillCradle not positioned correctly aftermaintenance/drillOne or more protection systems has acatastrophic fault
10-2(5)10-1(10)10-2(3)10-2(10)
10-2(10)
10-3(3)
10-2(5)
10-2(5)
10-3(10)
Death or injuryDeath or injuryDeath or injuryDeath or injury
Death or injury
Death or injury
Death or injury
Occupants stranded in boat
Occupants stranded in boat
Embarkation Fail to embark (scenario dependent)
Stretcher carried into boat in wrongorientation
10-3(100)
10-2(3)
Death or injury of anindividualDeparture delayed
Departure Straps not used correctly by a passengerPrimary release system used incorrectlySecondary system used incorrectly
10-3(5)
10-3(5)
10-3(5)
Death or injury to theoccupantDeparture delayed
Departure delayedMove Away Gearbox/prop check not done
Gearbox/prop check failsSteering check not doneSteering system check failsStarting controls not identifiedUnable to start propulsion system
System has a faultSystem has a faultSystem has a faultSystem has a faultSystem has a faultSystem has a fault
10-2(10)10-3(10)10-2(10)10-3(10)10-3(5)10-3(5)
Unmanoeuvrable boatUnmanoeuvrable boatUnmanoeuvrable boatUnmanoeuvrable boatUnmanoeuvrable boatUnmanoeuvrable boat
1 EF= Error Factor
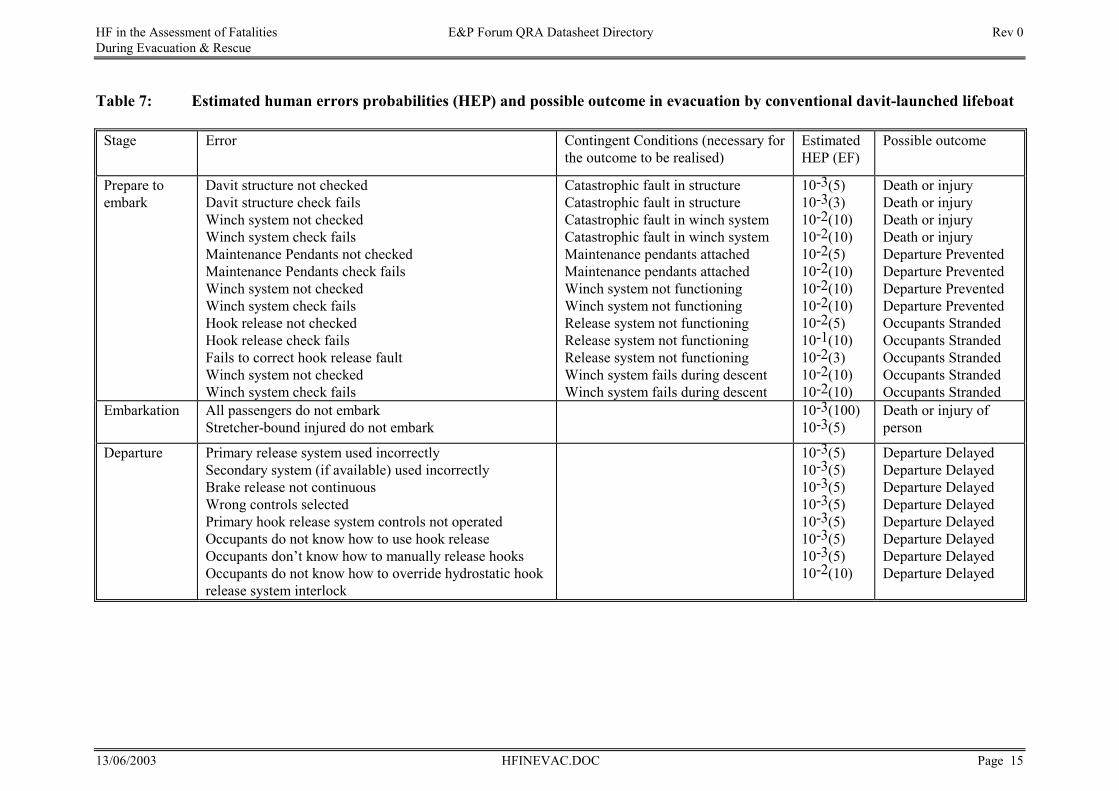
HF in the Assessment of Fatalities E&P Forum QRA Datasheet Directory Rev 0During Evacuation & Rescue
13/06/2003 HFINEVAC.DOC Page 15
Table 7: Estimated human errors probabilities (HEP) and possible outcome in evacuation by conventional davit-launched lifeboat
Stage Error Contingent Conditions (necessary forthe outcome to be realised)
EstimatedHEP (EF)
Possible outcome
Prepare toembark
Davit structure not checkedDavit structure check failsWinch system not checkedWinch system check failsMaintenance Pendants not checkedMaintenance Pendants check failsWinch system not checkedWinch system check failsHook release not checkedHook release check failsFails to correct hook release faultWinch system not checkedWinch system check fails
Catastrophic fault in structureCatastrophic fault in structureCatastrophic fault in winch systemCatastrophic fault in winch systemMaintenance pendants attachedMaintenance pendants attachedWinch system not functioningWinch system not functioningRelease system not functioningRelease system not functioningRelease system not functioningWinch system fails during descentWinch system fails during descent
10-3(5)10-3(3)10-2(10)10-2(10)10-2(5)10-2(10)10-2(10)10-2(10)10-2(5)10-1(10)10-2(3)10-2(10)10-2(10)
Death or injuryDeath or injuryDeath or injuryDeath or injuryDeparture PreventedDeparture PreventedDeparture PreventedDeparture PreventedOccupants StrandedOccupants StrandedOccupants StrandedOccupants StrandedOccupants Stranded
Embarkation All passengers do not embarkStretcher-bound injured do not embark
10-3(100)10-3(5)
Death or injury ofperson
Departure Primary release system used incorrectlySecondary system (if available) used incorrectlyBrake release not continuousWrong controls selectedPrimary hook release system controls not operatedOccupants do not know how to use hook releaseOccupants don’t know how to manually release hooksOccupants do not know how to override hydrostatic hookrelease system interlock
10-3(5)10-3(5)10-3(5)10-3(5)10-3(5)10-3(5)10-3(5)10-2(10)
Departure DelayedDeparture DelayedDeparture DelayedDeparture DelayedDeparture DelayedDeparture DelayedDeparture DelayedDeparture Delayed
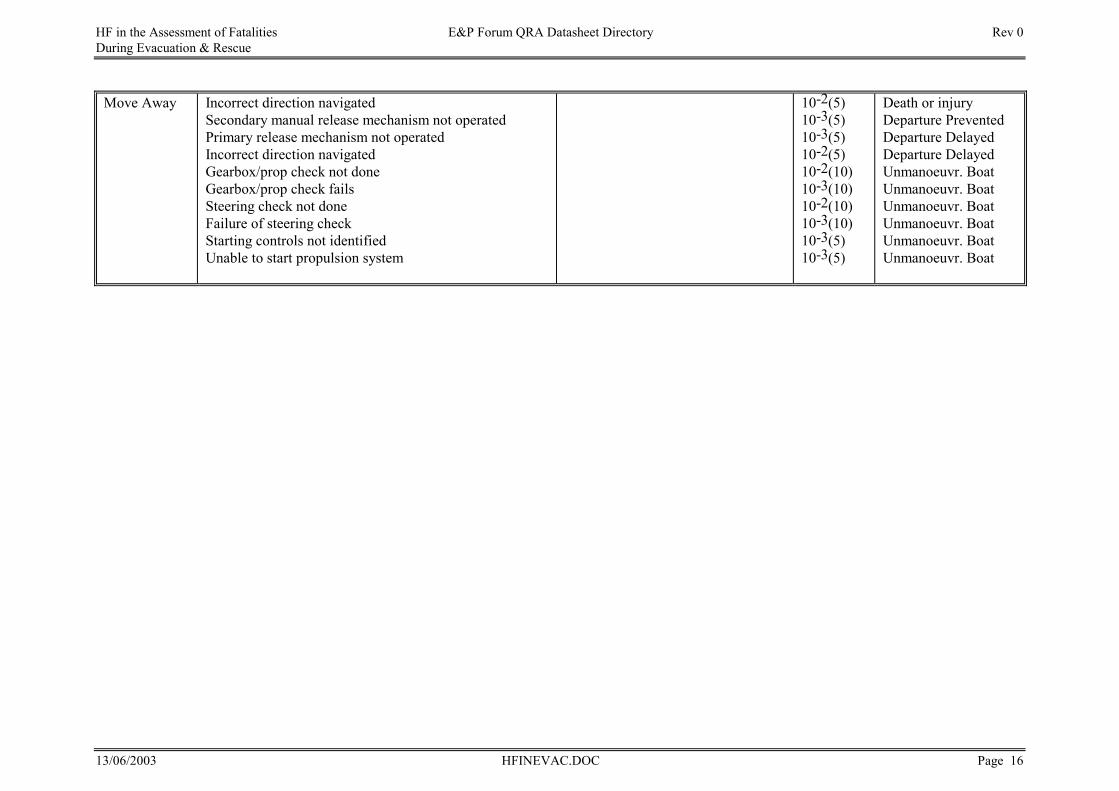
HF in the Assessment of Fatalities E&P Forum QRA Datasheet Directory Rev 0During Evacuation & Rescue
13/06/2003 HFINEVAC.DOC Page 16
Move Away Incorrect direction navigatedSecondary manual release mechanism not operatedPrimary release mechanism not operatedIncorrect direction navigatedGearbox/prop check not doneGearbox/prop check failsSteering check not doneFailure of steering checkStarting controls not identifiedUnable to start propulsion system
10-2(5)10-3(5)10-3(5)10-2(5)10-2(10)10-3(10)10-2(10)10-3(10)10-3(5)10-3(5)
Death or injuryDeparture PreventedDeparture DelayedDeparture DelayedUnmanoeuvr. BoatUnmanoeuvr. BoatUnmanoeuvr. BoatUnmanoeuvr. BoatUnmanoeuvr. BoatUnmanoeuvr. Boat
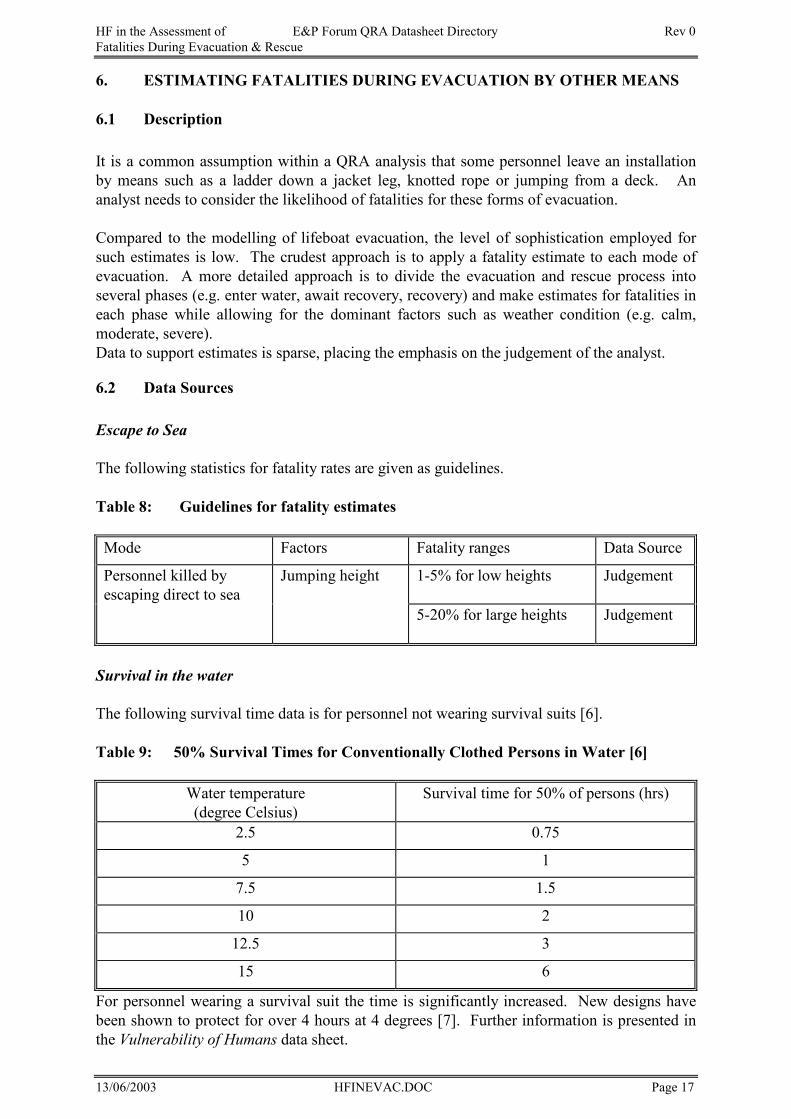
HF in the Assessment of E&P Forum QRA Datasheet Directory Rev 0Fatalities During Evacuation & Rescue
13/06/2003 HFINEVAC.DOC Page 17
6. ESTIMATING FATALITIES DURING EVACUATION BY OTHER MEANS
6.1 Description It is a common assumption within a QRA analysis that some personnel leave an installation by means such as a ladder down a jacket leg, knotted rope or jumping from a deck. An analyst needs to consider the likelihood of fatalities for these forms of evacuation. Compared to the modelling of lifeboat evacuation, the level of sophistication employed for such estimates is low. The crudest approach is to apply a fatality estimate to each mode of evacuation. A more detailed approach is to divide the evacuation and rescue process into several phases (e.g. enter water, await recovery, recovery) and make estimates for fatalities in each phase while allowing for the dominant factors such as weather condition (e.g. calm, moderate, severe). Data to support estimates is sparse, placing the emphasis on the judgement of the analyst.
6.2 Data Sources Escape to Sea
The following statistics for fatality rates are given as guidelines. Table 8: Guidelines for fatality estimates
Mode Factors Fatality ranges Data Source
Personnel killed by escaping direct to sea
Jumping height 1-5% for low heights
Judgement
5-20% for large heights
Judgement
Survival in the water
The following survival time data is for personnel not wearing survival suits [6]. Table 9: 50% Survival Times for Conventionally Clothed Persons in Water [6]
Water temperature (degree Celsius)
Survival time for 50% of persons (hrs)
2.5 0.75
5 1
7.5 1.5
10 2
12.5 3
15 6
For personnel wearing a survival suit the time is significantly increased. New designs have been shown to protect for over 4 hours at 4 degrees [7]. Further information is presented in the Vulnerability of Humans data sheet.
HF in the Assessment of E&P Forum QRA Datasheet Directory Rev 0Fatalities During Evacuation & Rescue
13/06/2003 HFINEVAC.DOC Page 18
For the QRA analyst a key concern will be the number who have successfully donned survival suits and life jackets before entering the water. Given that personnel who escape to sea are unlikely to have had much time to prepare for their escape, the likelihood of them putting on the safety clothing will be dependent on its accessibility. The analyst should consider whether the equipment is provided at the probable points of alighting the platform or whether they are stowed in remote lockers. Recovery from the sea
A review of the performance of attendant vessels in emergencies offshore [8] suggests that the success for recovering personnel from the sea ranges between approx. 10% to 95% depending on the type of vessel and weather conditions.
7. ONGOING RESEARCH Design of evacuation systems are evolving to meet the demands of the offshore sector. Significant changes, such as the freefall lifeboat or the addition of orientation mechanisms to traditional lifeboats (e.g. PROD - Preferred Orientation and Displacement System, TOES - TEMPSC Orientation and Evacuation System), pose problems for the QRA analyst as they have no reference data on which to base assumptions.
HF in the Assessment of E&P Forum QRA Datasheet Directory Rev 0Fatalities During Evacuation & Rescue
13/06/2003 HFINEVAC.DOC Page 19
8. REFERENCES [1] Technica (1983) Risk Assessment of Emergency Evacuation from Offshore Installations
A study carried out for the UK Department of Energy, Technica-F.158, November 1983. [2] Bignell, V. and Fortune, J. (1984) Understanding systems failures Milton Keynes: Open
University Press. [3] Sanders, M.S. and McCormick, E.J (1987). Human Factors in Engineering and Design.
Ch17 pp 486-517 6th Edition, McGraw-Hill International Editions 1987. [4] Landolt, J. P. Ph.D., B.Eng., Monaco, C. B.Eng. (1989), Seasickness in Occupants of
Totally-Enclosed Motor-Propelled Survival Craft (TEMPSC), Defence & Civil Institute of Environmental Medicine, Department of National Defence -
CANADA, 1133 Sheppard Avenue West, P.O. Box 2000, Downsview Ontario [5] Four Elements (1993) Freefall versus davit launched lifeboats: Human Factors study,
project ref 2334 [6] Golden FstC: Hypothermia a Problem for North Sea Industries. Jou. Soc. Occup. Med.
26, 85-88, 1976 [7] Health and Safety at Work, Tolley Publishing Co Ltd, Croydon, vol 13, no 12, 1991. [8] Technica, The Performance of Attendant Vessels in Emergencies Offshore, A study
carried out for the UK Department of Energy, OTH 97 274, 1987 [9] Brinkley, J.W (1984). Personnel Protection concepts for advanced escape system design
AGARD conference proceedings, Human Factors Consideration in High Performance Aircraft, pp6-1 - 6-12.
[10] Nelson, J.K., Hirsch, T.J. and Phillips, N.S (1989). Evaluation of Occupant
accelerations in lifeboats. Journal of Offshore Mechanics and Arctic Engineering pp344-349, Vol III, November 1989.
[11] ESCAPE, DNV Technica [12] FARLIFE, Four Elements, 1993

HF in the Assessment of E&P Forum QRA Datasheet Directory Rev 0Fatalities During Evacuation & Rescue
13/06/2003 HFINEVAC.DOC Page 20


![QRA Technical Guidance - National Environment Agency · QRA Technical Guidance [Revision No: 1] [Date of Revision: 31st March 2016] Contents 1 QRA Study](https://img.pdfslide.net/doc/110x75/5ace3a7d7f8b9a1d328b8ec2/qra-technical-guidance-national-environment-technical-guidance-revision-no-1.jpg)

![QRA Technical Guidance - National Environment … QRA Technical Guidance [Revision No: 3] [Date of Revision: 9th November 2016] Contents 1 QRA Study 2 2 Hazard Identification](https://img.pdfslide.net/doc/110x75/5afd2f647f8b9a3234914282/qra-technical-guidance-national-environment-qra-technical-guidance-revision.jpg)