Embed Size (px)
Citation preview
E. Reimer, U. Cubasch, A. Claußnitzer, I. LangerP. Névir
Institut für Meteorologie Freie Universität Berlin
Statistical-dynamical methods for scale dependent model evaluation and short term
precipitation forecasting (STAMPF / FU-Berlin)
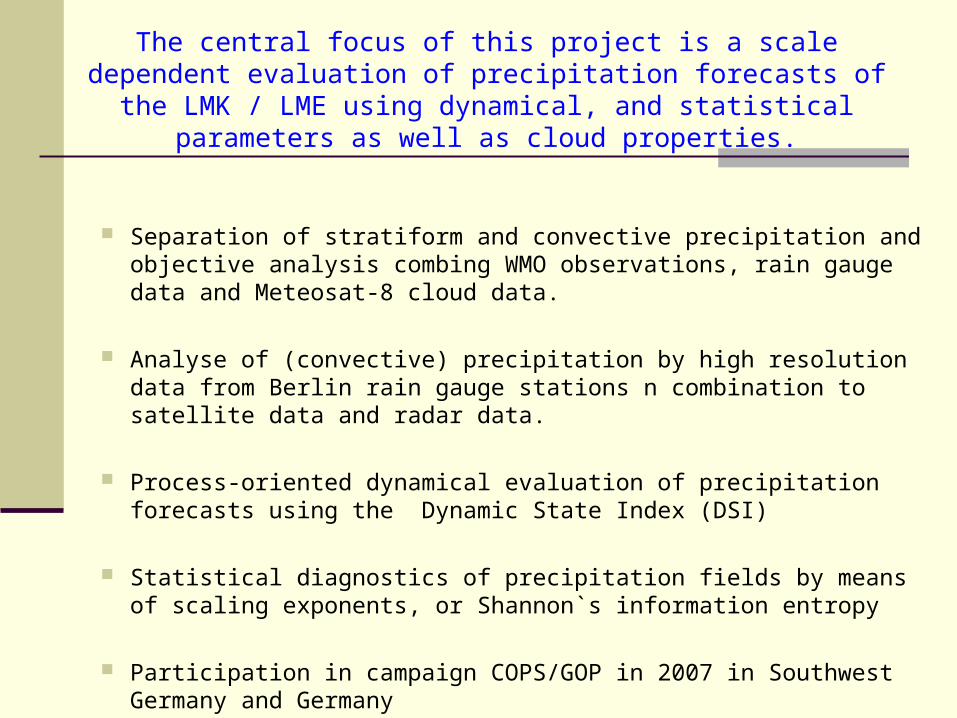
Separation of stratiform and convective precipitation and objective analysis combing WMO observations, rain gauge data and Meteosat-8 cloud data.
Analyse of (convective) precipitation by high resolution data from Berlin rain gauge stations n combination to satellite data and radar data.
Process-oriented dynamical evaluation of precipitation forecasts using the Dynamic State Index (DSI)
Statistical diagnostics of precipitation fields by means of scaling exponents, or Shannon`s information entropy
Participation in campaign COPS/GOP in 2007 in Southwest Germany and Germany
The central focus of this project is a scale dependent evaluation of precipitation forecasts of the LMK / LME using dynamical, and
statistical parameters as well as cloud properties.
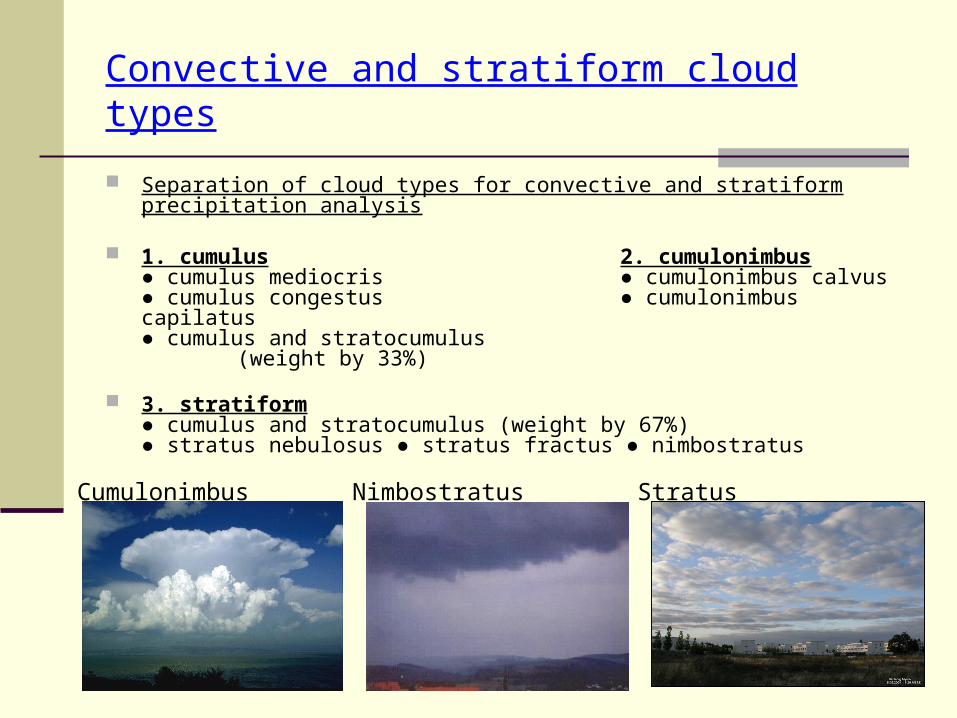
Convective and stratiform cloud types
Separation of cloud types for convective and stratiform precipitation analysis
1. cumulus 2. cumulonimbus● cumulus mediocris ● cumulonimbus calvus● cumulus congestus ● cumulonimbus capilatus● cumulus and stratocumulus
(weight by 33%)
3. stratiform● cumulus and stratocumulus (weight by 67%) ● stratus nebulosus ● stratus fractus ● nimbostratus
StratusNimbostratusCumulonimbus
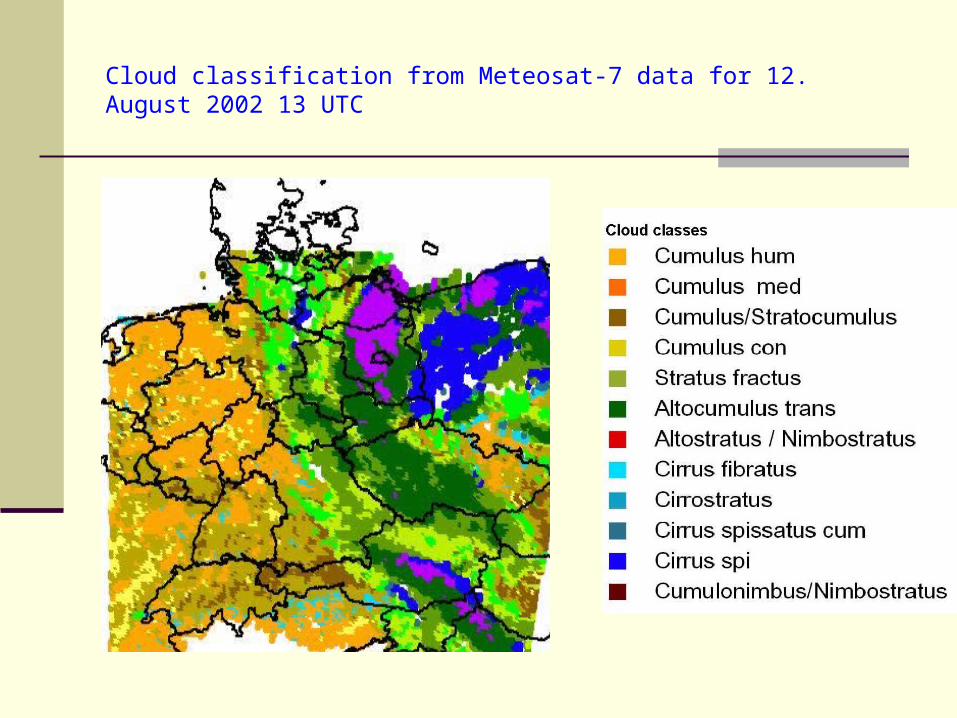
Cloud classification from Meteosat-7 data for 12. August 2002 13 UTC
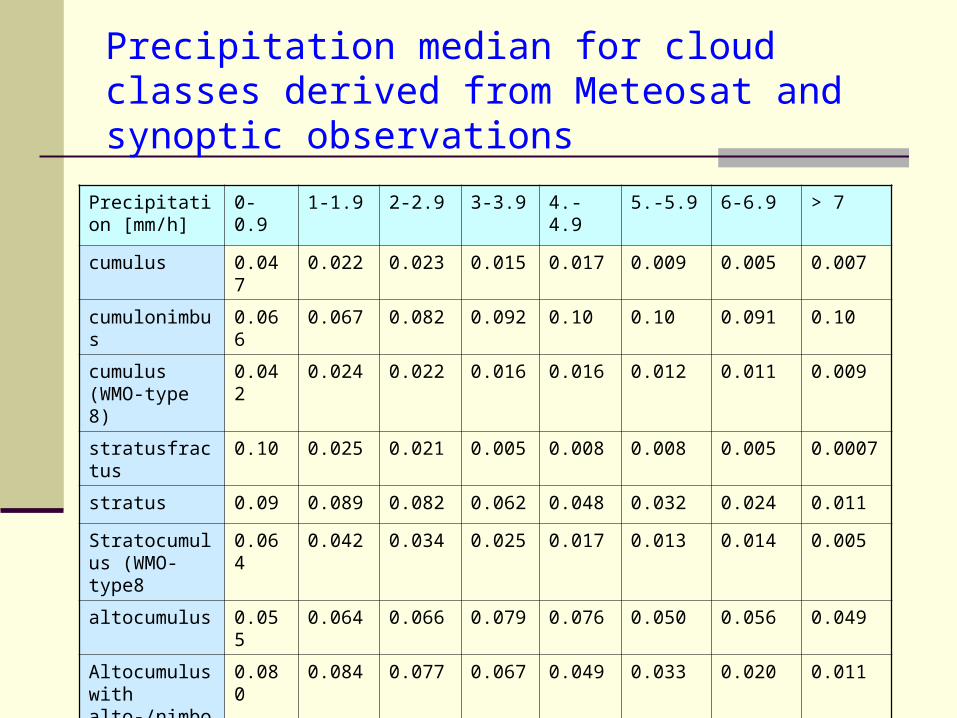
Precipitation median for cloud classes derived from Meteosat and synoptic observations
Precipitation [mm/h]
0-0.9 1-1.9 2-2.9 3-3.9 4.-4.9 5.-5.9 6-6.9 > 7
cumulus 0.047 0.022 0.023 0.015 0.017 0.009 0.005 0.007
cumulonimbus 0.066 0.067 0.082 0.092 0.10 0.10 0.091 0.10
cumulus (WMO-type 8)
0.042 0.024 0.022 0.016 0.016 0.012 0.011 0.009
stratusfractus 0.10 0.025 0.021 0.005 0.008 0.008 0.005 0.0007
stratus 0.09 0.089 0.082 0.062 0.048 0.032 0.024 0.011
Stratocumulus (WMO-type8
0.064 0.042 0.034 0.025 0.017 0.013 0.014 0.005
altocumulus 0.055 0.064 0.066 0.079 0.076 0.050 0.056 0.049
Altocumulus with alto-/nimbostratus
0.080 0.084 0.077 0.067 0.049 0.033 0.020 0.011
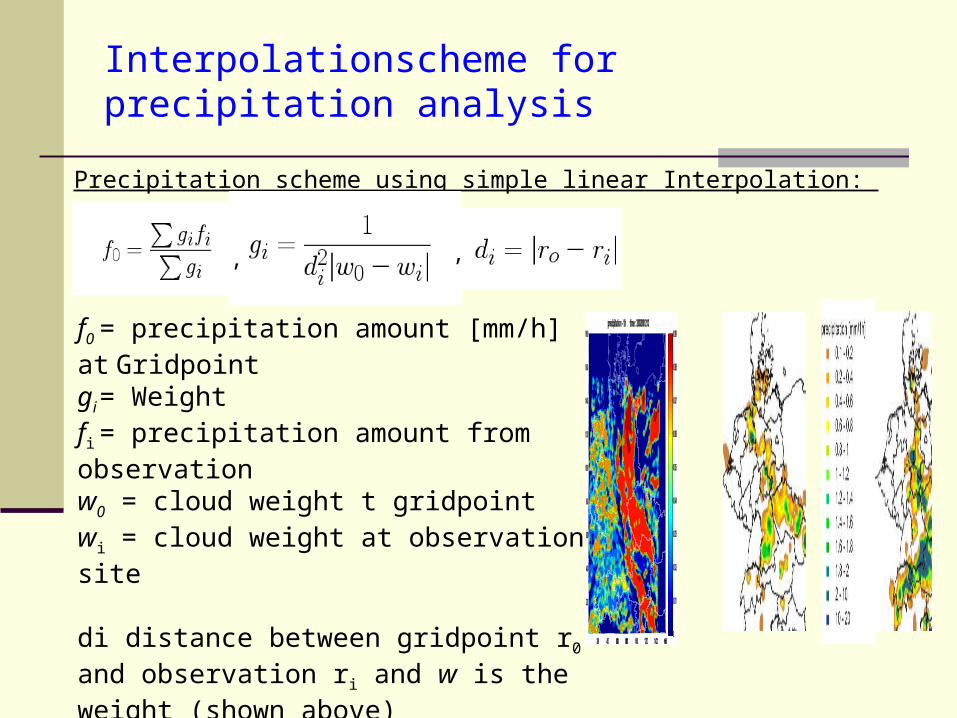
Interpolationscheme for precipitation analysis
Precipitation scheme using simple linear Interpolation:
, ,
f0 = precipitation amount [mm/h] at Gridpointgi = Weightfi = precipitation amount from observationw0 = cloud weight t gridpointwi = cloud weight at observation site
di distance between gridpoint r0 and observation ri and w is the weight (shown above)
next step: statistical analysis scheme
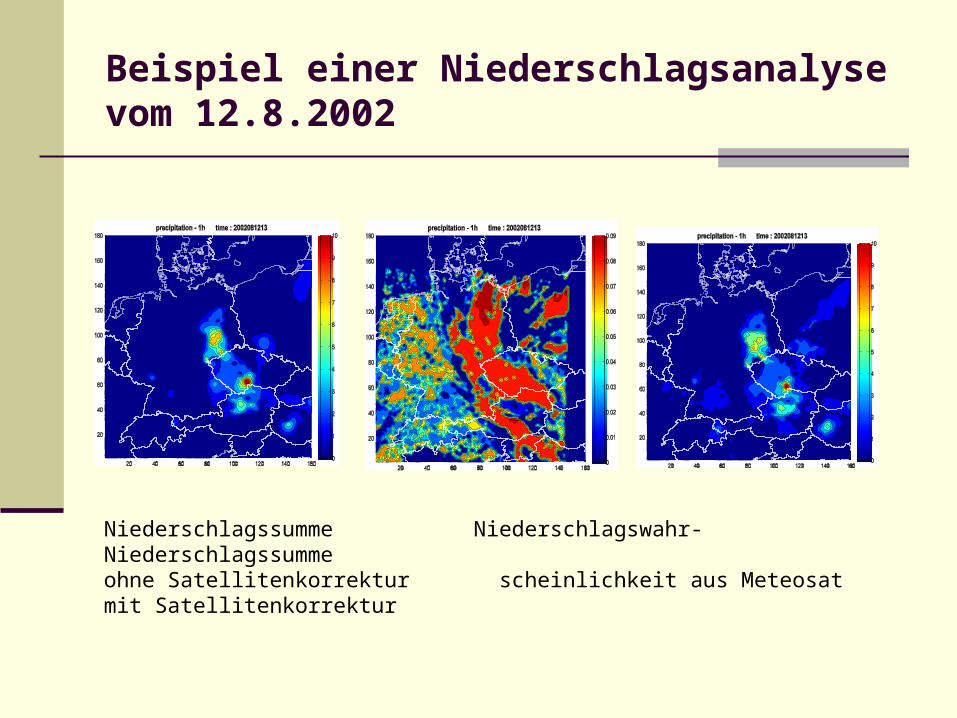
Beispiel einer Niederschlagsanalyse vom 12.8.2002
Niederschlagssumme Niederschlagswahr- Niederschlagssumme ohne Satellitenkorrektur scheinlichkeit aus Meteosat mit Satellitenkorrektur
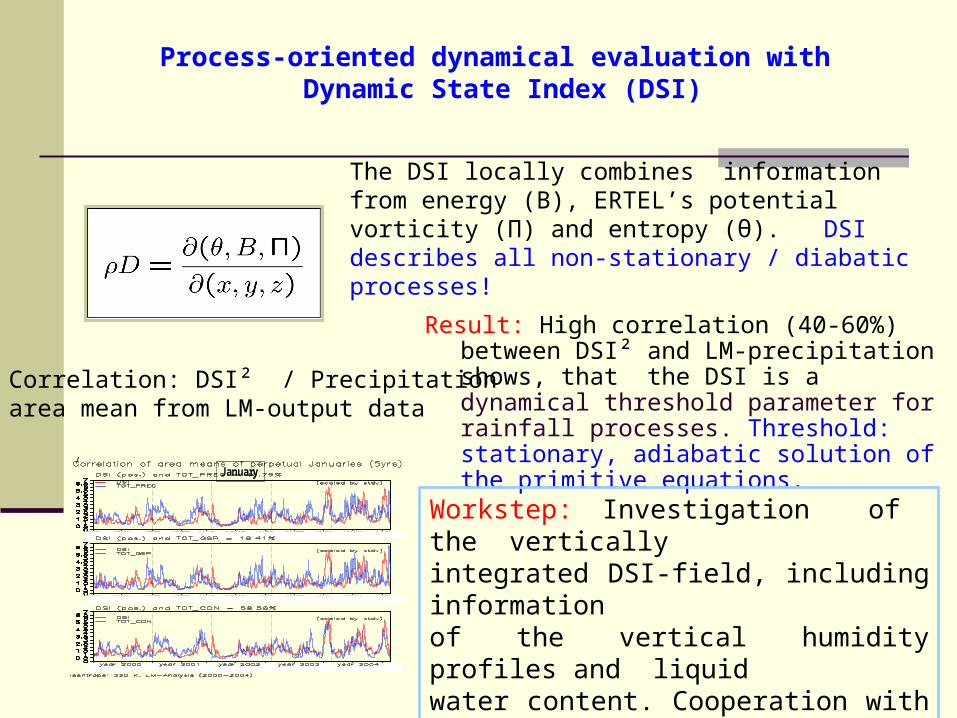
Process-oriented dynamical evaluation with Dynamic State Index (DSI)
The DSI locally combines information from energy (B), ERTEL’s potential vorticity (Π) and entropy (θ). DSI describes all non-stationary / diabatic processes!
January7
Result: High correlation (40-60%) between DSI² and LM-precipitation shows, that the DSI is a dynamical threshold parameter for rainfall processes. Threshold: stationary, adiabatic solution of the primitive equations.
Workstep: Investigation of the verticallyintegrated DSI-field, including informationof the vertical humidity profiles and liquidwater content. Cooperation with „QUEST“
Correlation: DSI² / Precipitationarea mean from LM-output data
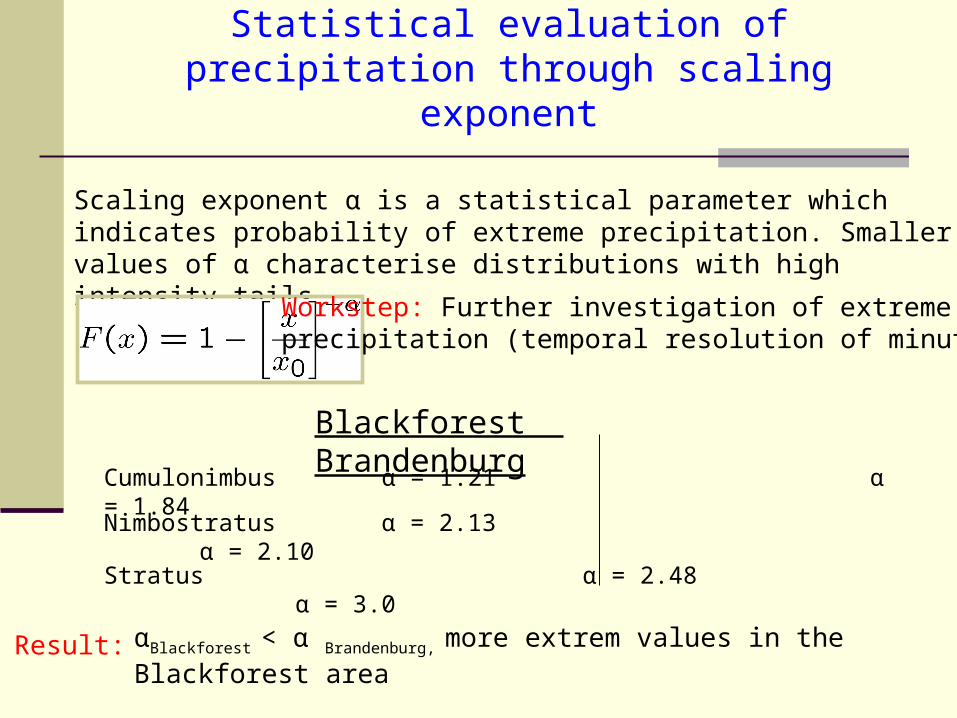
Statistical evaluation of precipitation through scaling exponent
Scaling exponent α is a statistical parameter which indicates probability of extreme precipitation. Smaller values of α characterise distributions with high intensity tails.
Cumulonimbus α = 1.21 α = 1.84
Nimbostratus α = 2.13 α = 2.10
Stratus α = 2.48 α = 3.0
Result:
Workstep: Further investigation of extremeprecipitation (temporal resolution of minutes)
Blackforest Brandenburg
αBlackforest < α Brandenburg, more extrem values in the Blackforest area
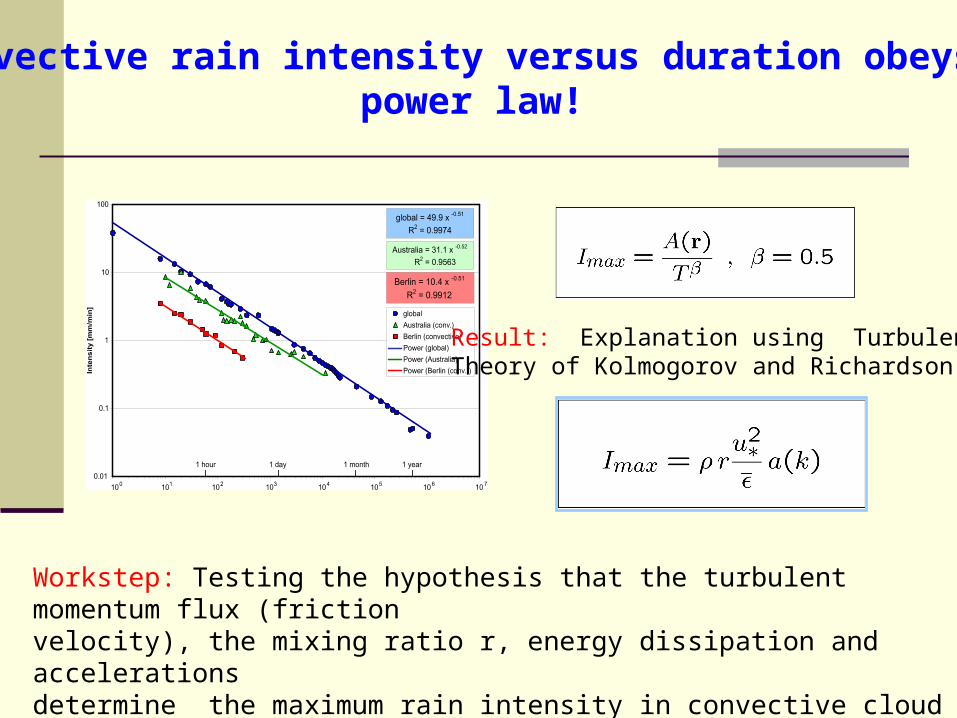
Convective rain intensity versus duration obeys apower law!
Result: Explanation using TurbulenceTheory of Kolmogorov and Richardson
Workstep: Testing the hypothesis that the turbulent momentum flux (frictionvelocity), the mixing ratio r, energy dissipation and accelerations determine the maximum rain intensity in convective cloud layers (COPS).
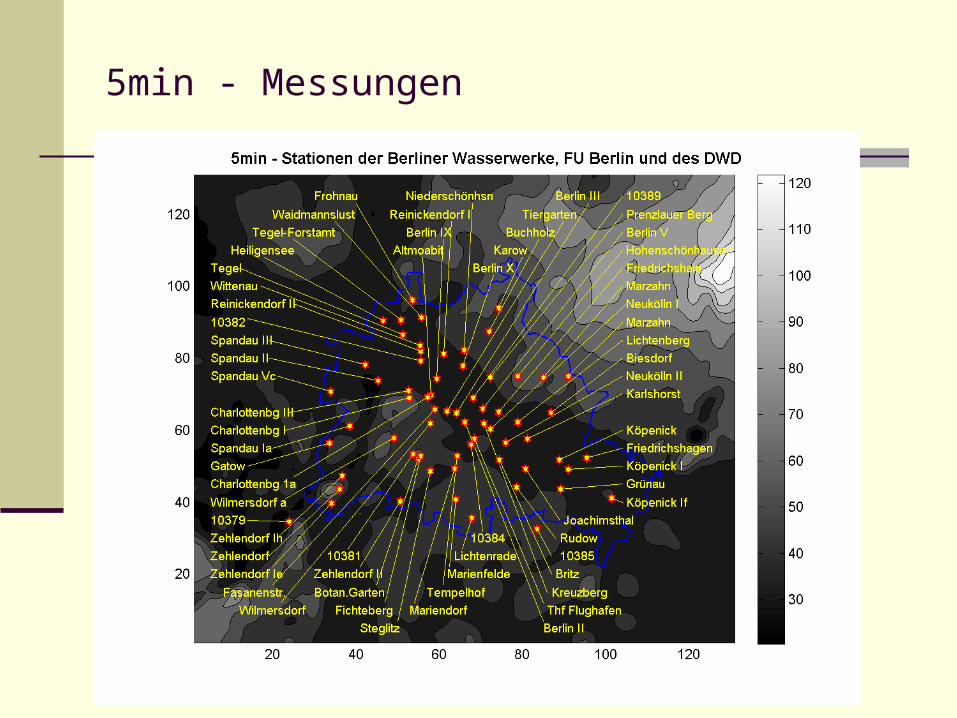
5min - Messungen
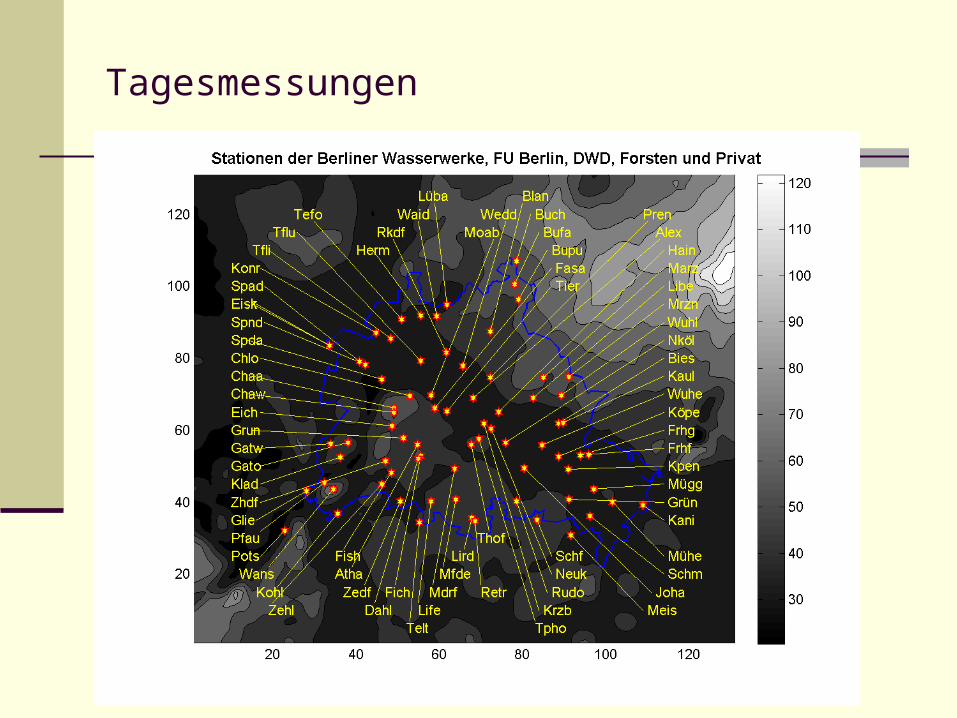
Tagesmessungen
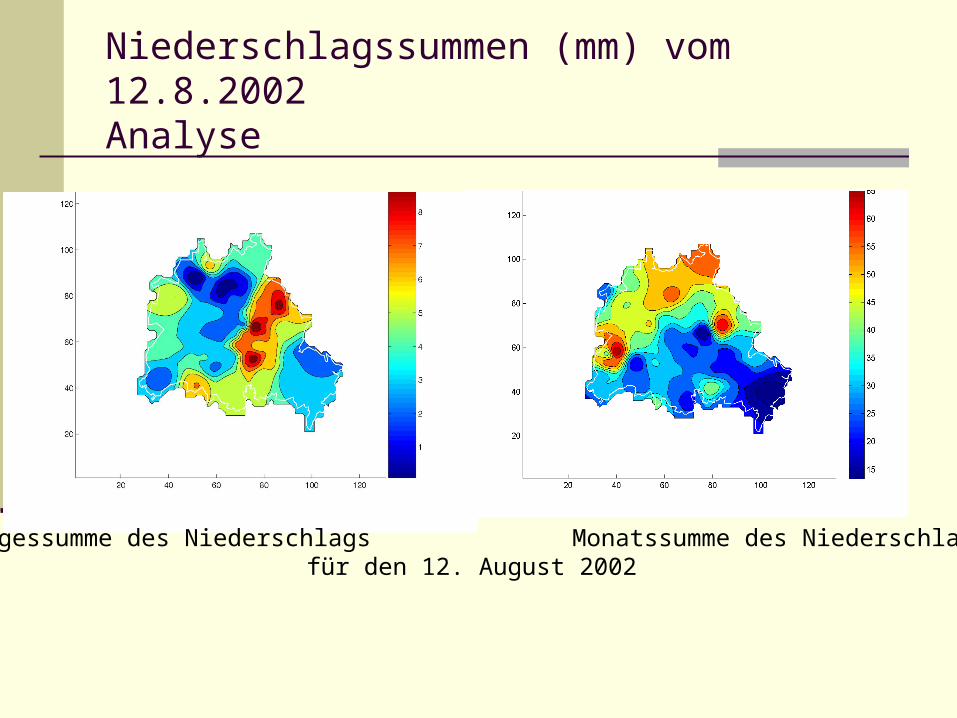
Niederschlagssummen (mm) vom 12.8.2002Analyse
Tagessumme des Niederschlags Monatssumme des Niederschlagsfür den 12. August 2002

Arbeiten und Aussicht
Weitere Aufbereitung der Berliner Niederschlagsdaten 2006 und 2007
Kontrolle der Niederschlagsmessungen über 5-Minuten- und Tagessummen
Verwendung der Radarechos für die Analyse der 5-Minutensummen im 500m bis 1km Gitter
Auswertung der Intensitäten für verschiedene Zeitintervalle
Teilnahme an GOP
Berücksichtigung der Windprofile aus dem LMK und Beobachtungen
Einbeziehung von Niederschlagsprofilen vom Vertikalradar (Peters, Hamburg) für 2007
Vergleich der Messungen und Radardaten mit LMK (2,8km Gitter) des DWD für 2002 jetzt und 2007

Danke
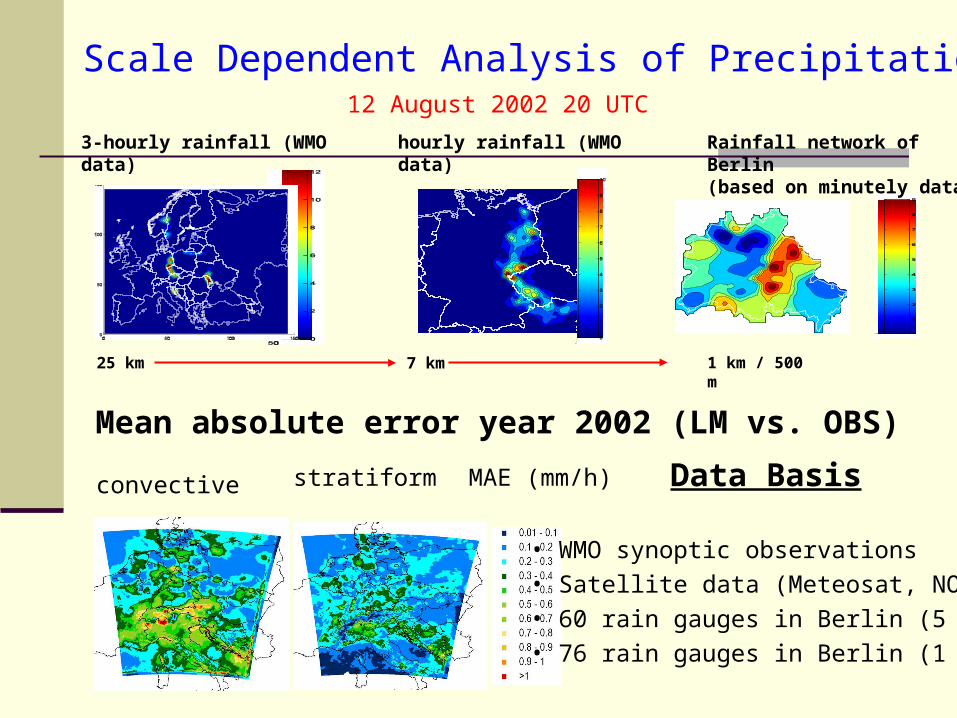
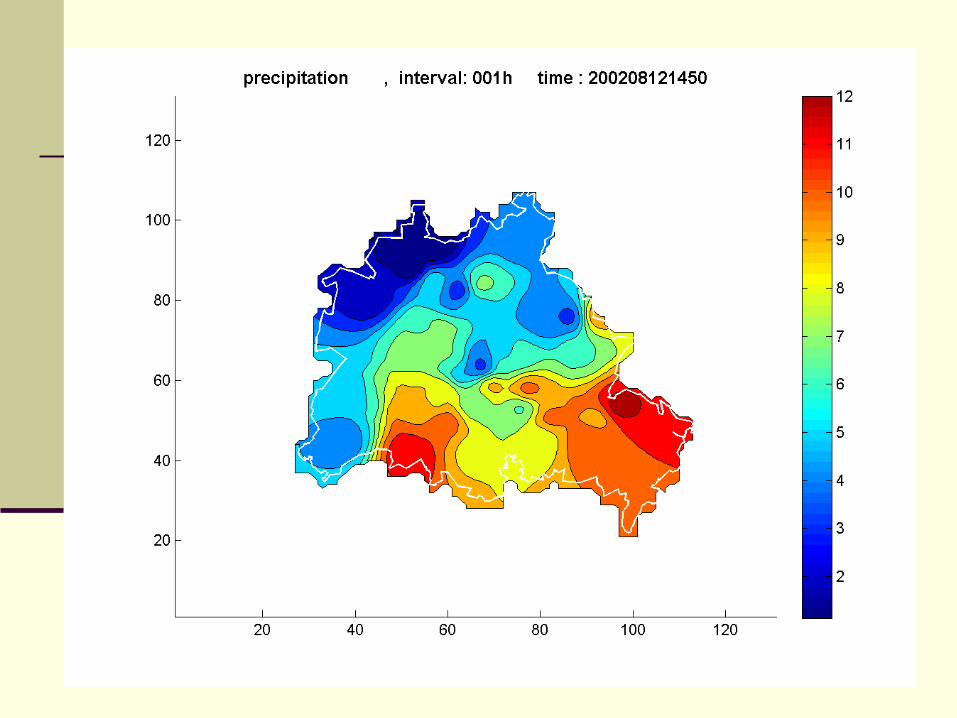
12 August 2002 20 UTC
25 km 1 km / 500 m7 km
3-hourly rainfall (WMO data) hourly rainfall (WMO data) Rainfall network of Berlin(based on minutely data)
Scale Dependent Analysis of Precipitation
convective stratiform
Mean absolute error year 2002 (LM vs. OBS)
• WMO synoptic observations• Satellite data (Meteosat, NOAA)• 60 rain gauges in Berlin (5 min)• 76 rain gauges in Berlin (1 day)
MAE (mm/h) Data Basis
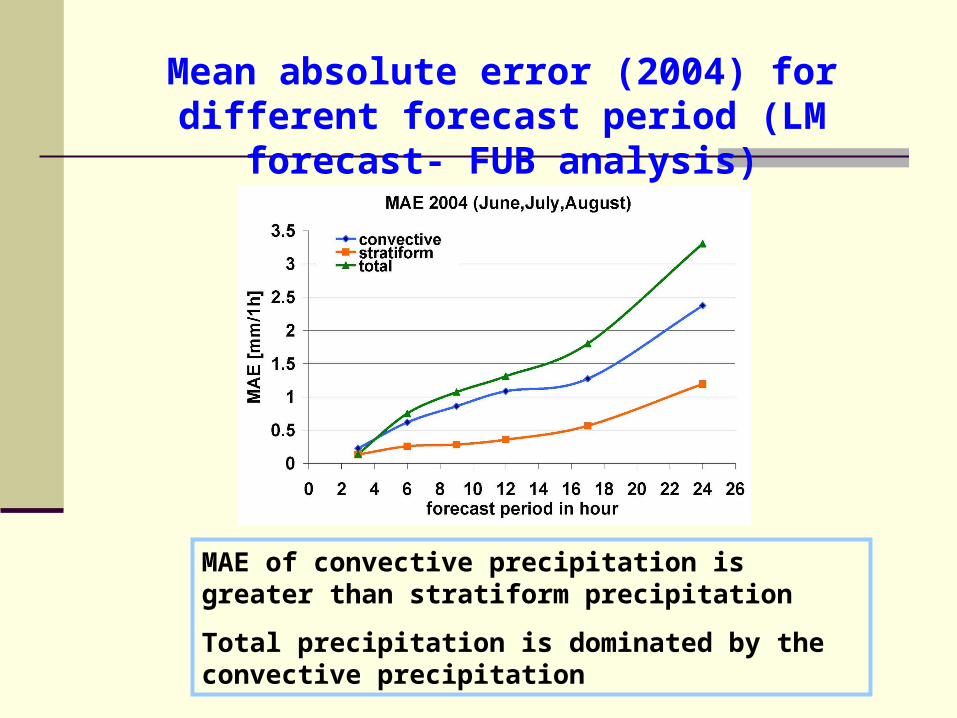
Mean absolute error (2004) for different forecast period (LM forecast- FUB analysis)
MAE of convective precipitation is greater than stratiform precipitation
Total precipitation is dominated by the convective precipitation
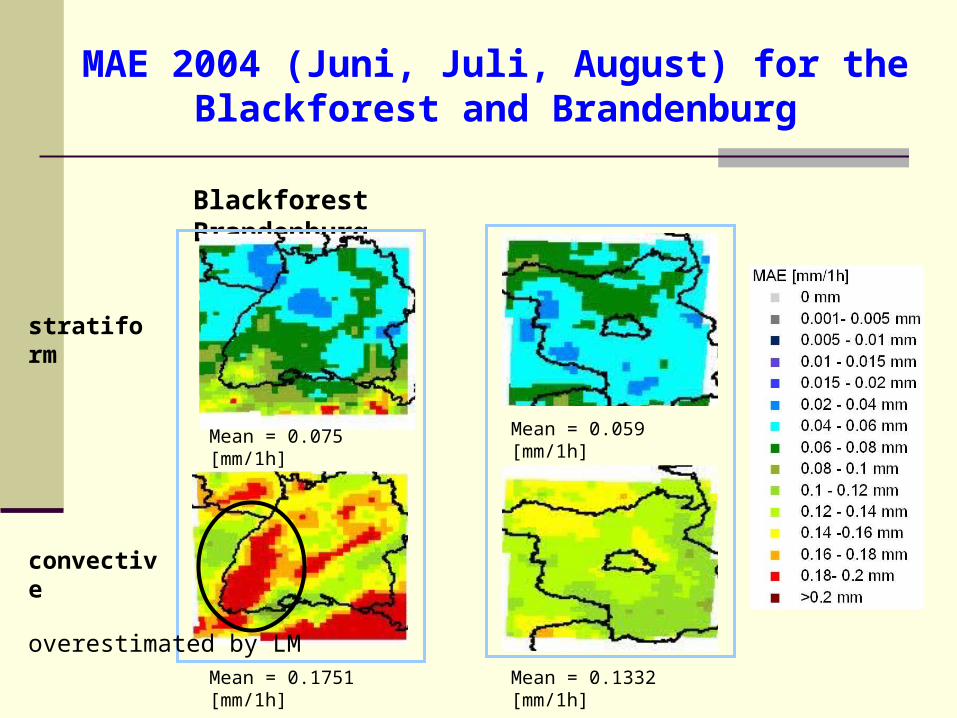
Blackforest Brandenburg
stratiform
convective
MAE 2004 (Juni, Juli, August) for the Blackforest and Brandenburg
overestimated by LM
Mean = 0.075 [mm/1h]
Mean = 0.1751 [mm/1h]
Mean = 0.059 [mm/1h]
Mean = 0.1332 [mm/1h]
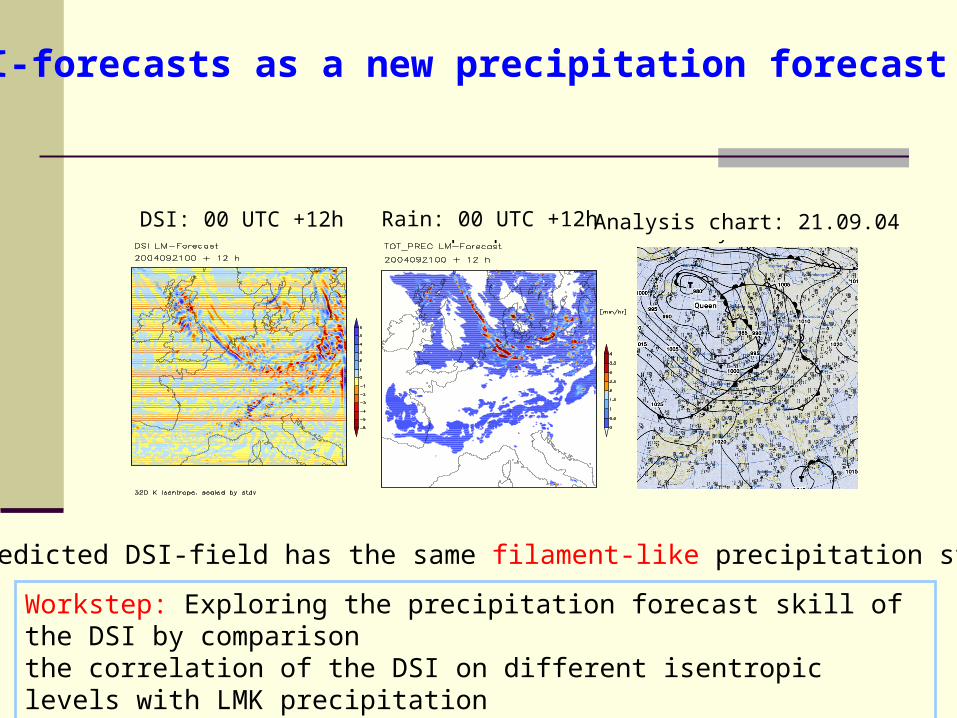
DSI total precipitation analysis chartDSI: 00 UTC +12h Rain: 00 UTC +12h Analysis chart: 21.09.04
Workstep: Exploring the precipitation forecast skill of the DSI by comparisonthe correlation of the DSI on different isentropic levels with LMK precipitationforecasts. / This workstep will also be extended to the special case studies.
Result: Predicted DSI-field has the same filament-like precipitation structures.
DSI-forecasts as a new precipitation forecast tool