Embed Size (px)
Citation preview

e-Sense Organic Portal Manual

Subject to change without notice. Version3_20191003
This manual is divided into two parts to cover both how to create a building in the portal environment, and how to navigate in the portal and read statistics. If you do not have administration privileges, only a more basic level, some parts of the manual may be redundant.
e-Sense Organic Portal set-up
Introduction to the technology ________________________________________ 3-5
Portal installation and commissioning _____________________________________ 6
Create a building _________________________________________________ 7-8
Add a Gateway to the portal ___________________________________________ 8
Add nodes _____________________________________________________ 9
Location of deployed nodes in the portal __________________________________ 10-11
ELMT emergency light functions ________________________________________ 11
Group name “Tag” ________________________________________________ 12
Schedule functions ________________________________________________ 13
e-Sense Organic Portal for end users
Preparations before you can use the portal ___________________________________ 14
Login and homepage _______________________________________________ 15
Statistics and analysis functions ______________________________________ 16–20
Sensor nodes ________________________________________________ 21–22
Contents

3Subject to change without notice. Version3_20191003
The e-Sense Organic Portal is an easy-to-use interface for daily operation. Communications with instal-lations are created via a gateway using Organic G3 sensor nodes. The purpose of this manual is to provide a step by step guide of the process in order to create a connected installation. This applies both to the on-site functions for the connection of all nodes as well as the creation of the portal including all preparatory de-tails.
Introduction to the technology
e-Sense Organic’s cloud-based analysis and lighting control platform allows users to monitor and control their lighting installation remotely. The portal is accessible via web browsers (Chrome and Safari are re-commended). All installed sensor nodes collect, store and communicate data about presence (so-called Heat Mapping), and energy consumption.
The solution is a decentralised RF network (mesh). When the sensor node is started a network is created, which by default has the following properties:• Automatic installation (mesh formed as soon as the sensor nodes are energised)• Self-optimising (automatically takes and adapts to the most appropriate route to the Gateway device)• Self-healing network communication• Improved ability to avoid communication interference
Each sensor node uses Wirepas as a proprietary communications protocol to communicate. This communi-cation transmits information from one node to another node using 27 distributed channels using frequency hopping spectrum. Each sensor node can self-optimise its search for an e-Sense Organic IoT-gateway. Each IoT-gateway comes ready configured to connect via the Internet to the e-Sense Organic’s web-based portal.
The architecture is explained in the image below.
e-Sense Organic Portal

4 Subject to change without notice. Version3_20191003
Each IoT-gateway must be in the communications range of at least one sensor node, i.e. within 5 metres in direct view. Each sensor node has the ability to connect to any gateway within the communications range, if there are multiple IoT-gateways close by. An IoT-gateway can in turn be connected to any DHCP network (Building specific) to forward and receive information from the e-Sense Organic Portal.
Fagerhult recommends using either Google Chrome or Safari. Make sure to have these installed on the computer and tablet to be used.
The factory setting on the gateway is set to DHCP addressing. And if there are no special circumstances you can continue to use this setting and add nodes. If a static IP address is required, contact Fagerhult for sup-port.
Refer to the following ports (inbound & outbound) with services accessing thoser ports; If an IoT gateway is required to be installed on your site that has restricted access or firewall setup, you may need to contact network administrator before installation to allow gateways the appropriate access permissions.
Portal installation and commissioning
Commissioning of the portal uses a solution that includes the following functions based on the requirements for each individual installation.
• Create a building in the portal (contact Fagerhult for access)
• Add a gateway to the portal
• IP addressing of gateways
• Placement of nodes on the drawing
On account of the independent installation of a gateway, it is advisable to energise the device at least 2 hours prior to commissioning nodes.
Prior to any type of installation, complete the following:
• Luminaires with sensors must be installed according to the e-Sense Organic manual.• The gateway installed correctly in accordance with this manual, energised and connected to a network
with an Internet connection.• Access to the installation’s floor plan, preferably with luminaire placement for positioning nodes, and
the gateway’s ID that can be read on the back of the device or the packaging it was delivered in.
NETWORK REQUIREMENTSREMOTE HOST PROTOCOL PORTntp.ubuntu.com UDP 123geoip.ubuntu.com TCP/HTTPS 443login.ubuntu.com TCP/HTTPS 443api.snapcraft.io TCP/HTTPS 443dashboard.snapcraft.io TCP/HTTPS 443fastly.cdn.snapcraft.io TCP/HTTPS 443provision.rigado.com TCP/HTTPS 443api.rigado.com TCP/HTTPS 443a2fyopewinh1f.iot.us-west-2.amazonaws.com TCP/HTTPS 8883
https://portal.organicresponse.comTCP/HTTPSTCP/MQTTUDP
4438883123
http://a2bghq9neujukx.iot.ap-northeast1.amazonaws.com/TCP/HTTPSTCP/MQTTUDP
4438883123
The gateway is suitably placed as centrally as possible in the ligh-ting installation.
If multiple gateways are requi-red (> 150 nodes), these should be distributed proportionally for the best possible communication with two or more networks.

5Subject to change without notice. Version3_20191003
To create a building, contact your Fagerhult representative with information about the building:
• Name of building• Address• Photo (not required)• Email address of at least one person for admin access• Pictures/drawings in JPEG format. The file name is entered in lowercase, no spaces or special characters,
and images may be a maximum of 1 Mb in size.
Create a building
AdministrationAn installation is suitable to make fully complete before the handover of the project, i.e. as part of the com-missioning process. Parameters can be changed in any step to reflect all relevant changes, and these para-meters can include:
Building Create/edit an appropriate name, specify an address, time zone, and add a photograph of the building.
IoT-gatewayAdd, remove, or update a gateway in the building. Use the gateway’s installation guide and the portal com-missioning guide for a detailed process and how to achieve this.
FloorsAdd/Remove floor plans after importing a drawing into a building. Remember that a changed floor plan can result in the loss of correct placement of some previously installed nodes on the drawing.
UsersAn administrator can invite other users with their LinkedIn email addresses. This page also lists current users with their access permissions.

6 Subject to change without notice. Version3_20191003
Create floors in the building with the right name and other information. Place the mouse over the box with the camera icon to add a photo of the floor plan. The format must be JPEG max 1 Mb.Remember to click on “add floors” to add floor plans and click “update” if you make changes.
Click on the building to be processed. Here you will see an empty floor plan that needs to be put into opera-tion. Click on the Floors link on the right and on “manage floors”
Building and creating floor plansThe building/link where you create floor plan is provided by Fagerhult. Approval is obtained th-rough access in an email from the Organic Response Portal.Log in to https://portal.organicresponse.com, have a prepared Linkedin account and an email add-ress that Fagerhult has linked to the building. The buildings that you have been given access to will be shown here. The picture example shows two buildings.

7Subject to change without notice. Version3_20191003
Provide access to users for “online” configuration. Access can be a simplified form at the same level as the app, based on the user’s Linkedin account associated with an email address. Different roles can be assigned to those who wish to have access to the building. Remember that there is no division between the different floor plans.
Access permissions
Assigning access permissions that can be created for different users. Works for administrators.
• All – administrator access check all available permissions.
• View – only possible to read information in the portal.
• Statistics – access to analysis and statistics.
• High resolution analysis – GDPR (Global Data Protection Regulation) provides end-user availability to enable/disable high-resolution data along with the portal’s direct function.
• Control light – ability to control light remotely.
• Nodes – access to node data, make changes e.g. add, edit floor drawings/delete, or tag nodes. Note that this permission is bound internally for the ability to tag nodes.
• Floors – Add or change floor plans.
• Gateways – add or edit gateway data.
• Tags – create and assign tags, note that this is associated with the permission for this.
Users

8 Subject to change without notice. Version3_20191003
Add a Gateway to the portal
Select “Wirepass” from the dropdown menu next to the Gateway if it is not already selected.
The following information needs to be specified for the Gateway: • Name of the gateway. Can be a name or number, placement in the building or similar.• The address of the gateway. Enter the ID address found on the back of the device or the shipping
packaging (see the previous picture).• If a static IP address is to be used - delete “default/Auto Network”, specify the subnet mask and
network IP address.• It is possible to use DNS address if there is a need of this, otherwise leave in default mode.
1
2
• Users – permission to add or change permissions for another user.
• Roles – the ability to access the permission menu for others, create and/or edit permissions.
• Building – access to building function, useful for more than one building for the same end customer.
• Schedules – access to a calendar and the ability to create, edit and add schedules for lighting systems.
• Emergency lighting – access to emergency lighting menu.
• Maintenance and maintenance updates – both need to be checked to receive maintenance updates for each floor plan via email address. The email is sent automatically when a node reports whether it has been disconnected, is incorrect, or similar.

9Subject to change without notice. Version3_20191003
Click on “Edit Nodes” as shown below.
Start positioning nodes on the drawing. At this point, you should have an updated drawing that ensures luminaire placement is correct. Analysis and statistics are based on the correct placement of the nodes.
Remember to save the installation with the “Save” icon.
Using the “Undo” and “Discard” icons you can delete the latest or delete all nodes since the last time the portal was saved.
When all nodes are positioned and saved, it is time for installation on site.
4
It is appropriate to position all nodes on inserted drawings in advance, please use a computer for this, it is easier than using a tablet. On the computer you also get “hints” about function when the mouse hovers over the icons. This saves a lot of time when you activate nodes on site.
Select “Sensor Nodes” from the main menu.
Add nodes
1
2
3

10 Subject to change without notice. Version3_20191003
You place and connect nodes in a portal by sending an IR message to the node via the e-Sense Organic dongle which is inserted in the headphone jack of the tablet. This function gets the sensor to send a radio message to the Gateway and onto the portal, and registers the position of the node on the drawing.
Even if each sensor node has the ability to connect to an IoT-gateway and then be found in the portal, the portal requires the nodes to be physically programmed to associate the information within the portal to this particular node. This process is called commissioning and connects physical nodes to a given location on the drawing and floor plan.
The procedure is as follows:
Go to the right floor in the right building. Click on the “Map Nodes” icon.
Place the dongle in the headphone jack. NOTE! Make sure the volume is set to max. Lock the screen so that it does not turn the display mode.
All nodes are initially marked grey. This means that they are not mapped on the drawing.
If you are using a laptop, you can place the cursor over a node to display information that it is not mapped.
Mapping positioned nodes in the portal
1
2
3

11Subject to change without notice. Version3_20191003
Click an appropriate node in the portal and point the dongle towards the node in the luminaire. When it flashes red 3-5 times, this indicates that it has been mapped. The node on the drawing will change colour to white (may take a few seconds).
If you now place cursor over the node, it will display information that it is mapped.
Luminaires with integrated emergency lighting will have a different symbol. Detection occurs automatically by the node if an emergency light unit is connected in parallel with the driver in the luminaire.
Other information from a node under “mapping”:
If the symbol on the drawing changes to blue, this indicates that the node has still not been mapped. Wait at least 1-2 minutes before trying again.
Ensure that only one node is mapped, otherwise this can create a conflict between nodes and er-rors in the analysis in the portal. A correctly mapped node turns white and prior to this the sensor flashes red 3-5 times.
Nodes that have been duplicated will be indicated in red. Click one of these nodes, and the following information will be displayed:
DO YOU WANT TO UNMAP THE SELECTED NODE?
Select OK or CANCEL.
An “unmapped” node displays information if you select it. The node in the image is not fully pro-grammed, recently added, or has lost contact with the Gateway. Redo the mapping procedure on the previous page.
4
5
6

12 Subject to change without notice. Version3_20191003
You can group nodes to make it easier to determine their function. For example, allocating luminaires with integrated emergency lighting in the same tag name in the portal makes operation easier and clearer. This does not affect the function of the node, but only promotes clarity.
You can create tag names according to your own wishes. The most common names used in an office are cor-ridor, meeting room, open-plan, and emergency lighting.
Tag name (group)
Add node to group nameDelete group name “Tag”Adjust settings for group name “Tag”Create new group name
Select a node by clicking it (blue ring is high-lighted around the node), and available infor-mation will be displayed. You can now select “tag” and give the node a group association from the list on the right. You can also create your own groups (tags) by entering informa-tion under “Create a new tag” and end with “add tag”. Select nodes that are to be associa-ted with the new tag, one at a time, end with “save”.

13Subject to change without notice. Version3_20191003
Create a new schedule function.
Displays the status of the function. Enabled, disabled, or paused.
Name, select a time and weekday for the event.
Shows the event over time.
Save, reset, or delete an event.
Specify the light level, dim function, modes, or scene selection previously programmed in the node/zone via the app and dongle.
Here you can define the floor plan that the event should be active on.
Here you can start, stop and pause an event.
1
2
3
4
5
6
7
8
12 3 4
5
6
7
8
Many lighting systems have a need for automatic control based on time and day. This may be switching on lighting in a corridor, stairwell, etc. and e-Sense Organic can easily tailor such functions. You can always go back and adjust the settings that have been made. Since you also name the schedule function, you can easily see what function it performs.
Rules for schedule functionsEach schedule can have as many rules as needed, with the ability to choose between different functions:• Maximum light – as a percentage from 0 % to 100 %• Minimum light – as a percentage from 0 % to 100 %• Low light level – as a percentage from 0 % till 100 %• Dwell time – in time from 1 minute up to 60 minutes• Low light time – in time from 1 minute up to 60 minutes• Personality – all profiles available for the system• Scenario – one of eight scenes
Schedule functions (advanced function)

14 Subject to change without notice. Version3_20191003
Emergency lighting functions can only be used for luminaires with emergency lighting devices installed in luminaires. The function is automatically found by the Organic nodes, and is displayed in the portal with a special icon. Emergency light devices are reported according to standard IEC62386-202 1.0 self-testing emergency lighting devices (type 1).
It is useful to group emergency lighting luminaires under the tag. This gives you a simpler overview of the test status for each device in the context of other devices.
Implementation:• Choose a floor plan• "Emergency Lighting"• “Groups”• Schedule function• Report with printout
Move on to the next floor plan.
ELMT Emergency lighting functions (advanced function)

15Subject to change without notice. Version3_20191003
The e-Sense Organic Portal is an easy-to-use interface for daily operation. This manual provides a quick walkth-rough of the various functions and how to read statistics.
To do before you can use the portal
The e-Sense Organic portal is a secure online platform that can only be opened by licensed persons. The follo-wing must be confirmed before you can log in:
The portal can be opened with a LinkedIn account (www.linkedin.com), which is necessary to become an approved user via Fagerhult. If you do not have an account, go to LinkedIn’s website to create one.
If you do not yet have an account, or have received an invite from Fagerhult, please contact Fagerhult to gain access.
In your web browser, either Chrome or Safari is recommended, type https://portal.organicresponse.com.
Done!
e-Sense Organic Portal for end users
1
2
3
4

16 Subject to change without notice. Version3_20191003
The first time you open the portal, you must fill in the information previously described. Type in the email address and password used for the LinkedIn account.
Login and homepage
Once you have logged in, you will be taken to the homepage. From here you can navigate to the building to which the portal belongs. If you have several buildings, they will all be visible here. You can always return to this page quickly by clicking the Organic logo at the top left corner of the screen.
Lighting levelluminaire
17Subject to change without notice. Version3_20191003
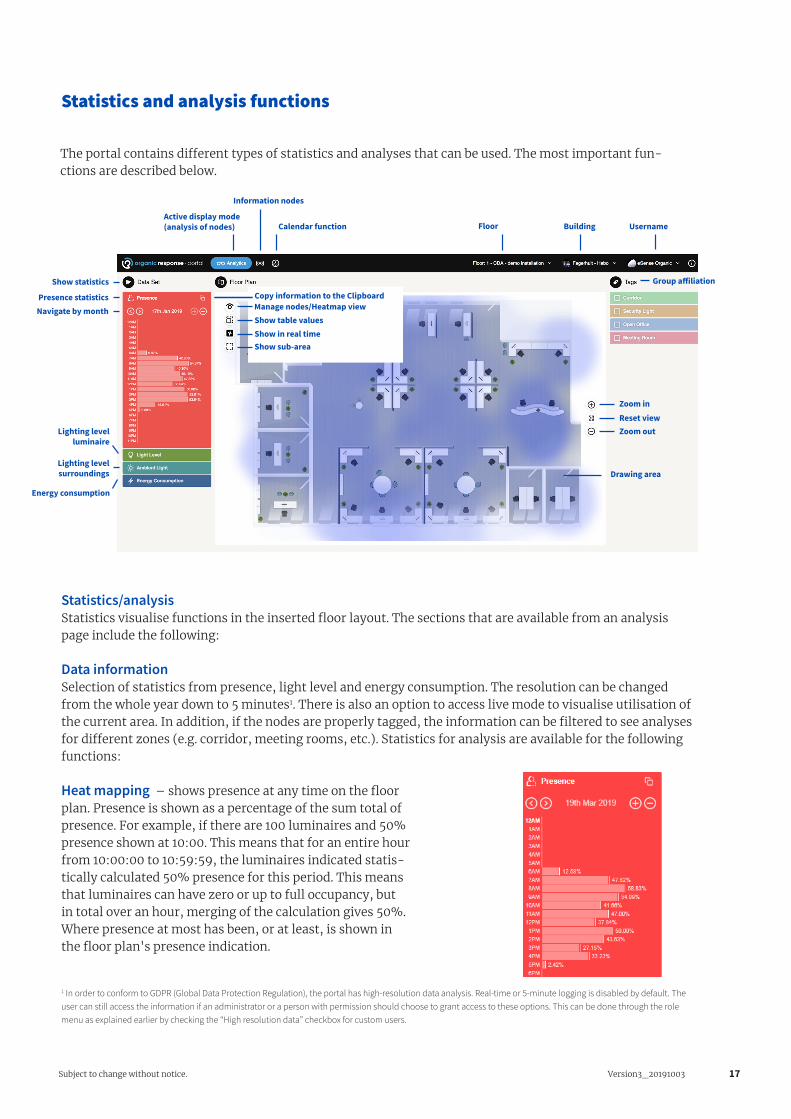
The portal contains different types of statistics and analyses that can be used. The most important fun-ctions are described below.
Statistics and analysis functions
Username
Zoom in
Information nodes
Calendar function
Show statistics
Reset view
Active display mode (analysis of nodes)
Presence statistics
Lighting levelluminaire
Zoom out
Floor
Navigate by month
Lighting level surroundings Drawing area
Group affiliation
Building
Energy consumption
Copy information to the Clipboard
Show table valuesShow in real timeShow sub-area
Manage nodes/Heatmap view
Statistics/analysisStatistics visualise functions in the inserted floor layout. The sections that are available from an analysis page include the following:
Data informationSelection of statistics from presence, light level and energy consumption. The resolution can be changed from the whole year down to 5 minutes1. There is also an option to access live mode to visualise utilisation of the current area. In addition, if the nodes are properly tagged, the information can be filtered to see analyses for different zones (e.g. corridor, meeting rooms, etc.). Statistics for analysis are available for the following functions:
Heat mapping – shows presence at any time on the floor plan. Presence is shown as a percentage of the sum total of presence. For example, if there are 100 luminaires and 50% presence shown at 10:00. This means that for an entire hour from 10:00:00 to 10:59:59, the luminaires indicated statis-tically calculated 50% presence for this period. This means that luminaires can have zero or up to full occupancy, but in total over an hour, merging of the calculation gives 50%. Where presence at most has been, or at least, is shown in the floor plan's presence indication.
1 In order to conform to GDPR (Global Data Protection Regulation), the portal has high-resolution data analysis. Real-time or 5-minute logging is disabled by default. The user can still access the information if an administrator or a person with permission should choose to grant access to these options. This can be done through the role menu as explained earlier by checking the “High resolution data” checkbox for custom users.

18 Subject to change without notice. Version3_20191003
Light level -Percentage levels measured over any period of time against the total consumption of luminaires. Take the example above again and at the same time show light levels as 75 %. This could be translated as 100 luminaires: Either 75 luminaires of 100 were at 100 % light level during that time period or that all 100 luminaires were at 75 % lighting level for this time period2.
Energy consumption - in kWh for any period of time. The standard calculation is based on a 40 W luminaire. The lu-minaires can be assigned a more accurate consumption in the Nodes menu on the right side of the display view.
All information can be viewed in the following resolution:• Year – data is divided into months.• Month – data is divided into days.• Days – data is divided into hours.• Hours – Data is divided into 5-minute intervals.
2 Note: All values shown above are only an indication of available information from luminaires.

19Subject to change without notice. Version3_20191003
The selected functions are specified on the following pages.
1 2 3 4
5
6
789
9
10
11
12
Click this icon to easily access the homepage.
Choose from Analysis Functions/Sensor Nodes/Calendar Function
Select floor
Select building or building settings
Function icons for floors in display mode
1
2
3
4
5
1 2 3 4
1 Icon to lock in display mode
2 Display mode of installed nodes
3 Show “Heatmap”
4 View emergency lighting devices with e-Sense Organic sensor

20 Subject to change without notice. Version3_20191003
1 2 3 4 5
1 Icon to lock the following in display mode
2 Display mode of installed nodes 3 Cumulative display mode (select a specific area on the floor) 4 Mark all nodes
5 Clear function for selected nodes (display mode only)
The scale setting for displaying the “heatmap” allows the colour of the heatmap func-tion to be adjusted
Real-time mode. Shows “heatmap” in real time
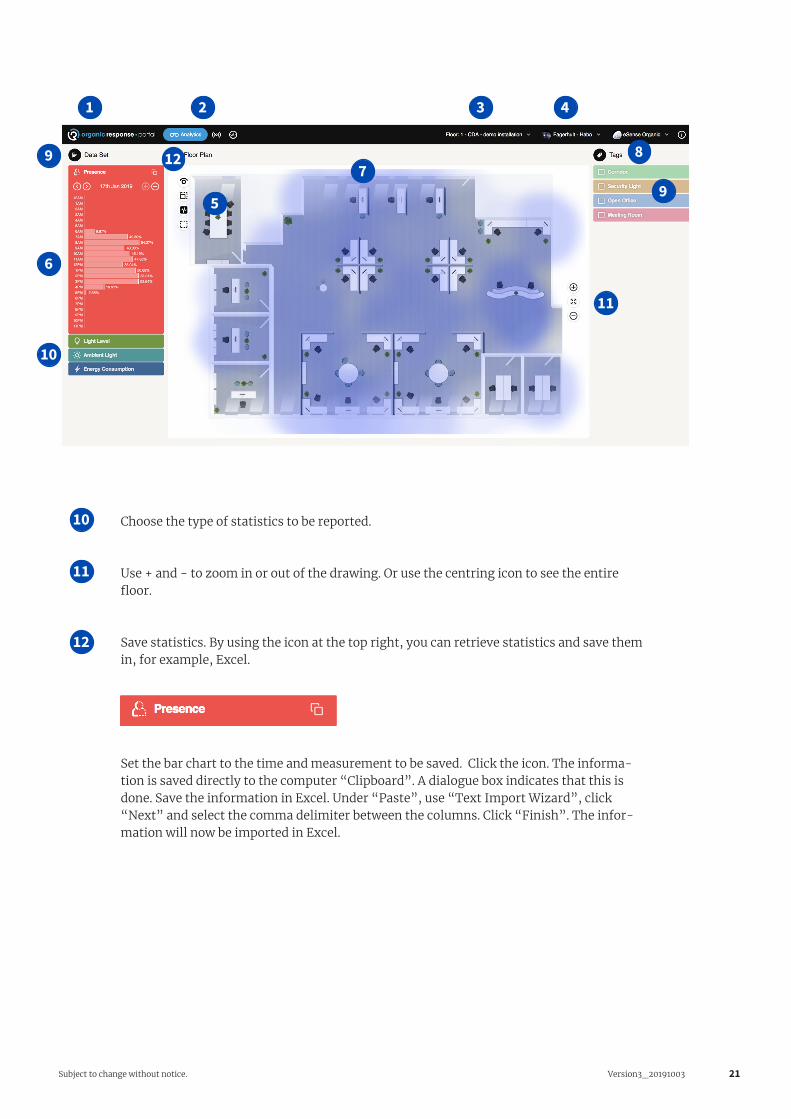
Statistics for the floor can be read from the bar chart to the left. There are four different functions; Presence, Dimming, Ambient Light, and Energy Consumption.
These functions allow you to select statistics with greater or less detail. Choose from day, month or year. Press and hold Shift to highlight multiple bars.
The floor is used to display the “heatmap*” function, or presence representation for the area. Red indicates a high presence level, colder colours indicate less activity.
Tags. This function expands or collapses the display of tags.
You can select to group nodes for the same statistics, e.g. corridor, meeting room, etc. Each node displays the same colour as selected for the zone.
6
7
8
9
21Subject to change without notice. Version3_20191003
Choose the type of statistics to be reported.
Use + and - to zoom in or out of the drawing. Or use the centring icon to see the entire floor.
Save statistics. By using the icon at the top right, you can retrieve statistics and save them in, for example, Excel.
Set the bar chart to the time and measurement to be saved. Click the icon. The informa-tion is saved directly to the computer “Clipboard”. A dialogue box indicates that this is done. Save the information in Excel. Under “Paste”, use “Text Import Wizard”, click “Next” and select the comma delimiter between the columns. Click “Finish”. The infor-mation will now be imported in Excel.
10
11
12
1 2 3 4
5
6
789
9
10
11
12

22 Subject to change without notice. Version3_20191003
There are several different types of statistics and analyses to evaluate for each node. The most important functions are described below. Select “Sensor Node menu” at the very top of the portal. In this environment you can create and change multiple functions for each node. Statistics and information about each node’s setting can be read here. You can use the ID search function for each node, or use the device’s address.
Search by ID or address.
Information about:• ID• Address• See the location of the node on the drawing• Usage time in hours• Number of hours in operation• Energy consumption• The node’s colour according to zone affiliation.
Show nodes (Faulty/Installed/Not InstalledProgram nodesSelect Node/Delete/Revert to Not InstalledSearch node
Sensor nodes
Programming functions:Add nodeSave nodeUndoSelect Node/Delete/Reset Node

23Subject to change without notice. Version3_20191003
Programming functions:Add nodeSave nodeUndoSelect Node/Delete/Reset Node
Managing sensor nodes and information in detail
In this environment you can manage the data that will apply to each individual node. Zone name, load effect for luminaire, search for a node’s location on the drawing.
Here you will find detailed information for each node. The information can be used during maintenance of the lighting installation. Click a row for one sensor, and the drawing will move to the location of the node.
Zone Name “Tag”
Create a new Zone Name “Tag”• Type in a name for the zone• Click a node to be associated to the zone• Click “Add Tag” to confirm and create a new zone name
Node status indication. In addition to a node being assigned the same colour as the zone it belongs to, the node also displays its operating status. • A white node indicates that it is connected and operating normally.• A red node indicates that it is connected but something is wrong.• A green node indicates that the node is not connected to the gateway• A black node indicates that it is not pre-programmed and not “mapped”
1
2
3
4
1
2
3
4

e-Sense Organic G3
Fagerhult develops, manufactures and markets professional lighting systems for public environments. Our business is run with a constant focus on design, function, flexibility and energy-saving solutions. Fagerhult is part of the Fagerhult Group, one of Europe’s lead-ing lighting groups with operations in more than 25 different countries. AB Fagerhult is listed on the NASDAQ OMX Nordic Exchange in Stockholm.
HEAD OFFICE SWEDENFagerhults Belysning ABSE-566 80 Habo, SwedenTel +46 36 10 85 00Fax +46 36 10 86 99www.fagerhult.se