Embed Size (px)
Citation preview

© 2012 Columbia University
E6885 Network Science Lecture 10: Analysis of Network Flow
E 6885 Topics in Signal Processing -- Network Science
Ching-Yung Lin, Dept. of Electrical Engineering, Columbia University
November 19th, 2012

© 2012 Columbia University2 E6885 Network Science – Lecture 10: Analysis of Network Flow
Course StructureClass Date
Class Number Topics Covered
09/10/12 1 Overview – Social, Information, and Cognitive Network Analysis
09/17/12 2 Network Representations and Characteristics
09/24/12 3 Network Partitioning, Clustering, and Visualization
10/01/12 4 Network Estimation and Modeling
10/09/12 5 Network Analysis Use Case
10/15/12 6 Network Topology Inference
10/22/12 7 Dynamic Networks
10/29/12 8 Info Diffusion in Networks
11/12/12 9 Final Project Proposal Presentation
11/19/12 10 Information Flow
11/26/12 11 Privacy, Security, and Economy Issues in Networks
12/03/12 12 Behavior Understanding and Cognitive Networks
12/10/12 13 Large-Scale Network Processing System
12/17/12 14 Final Project Presentation
© 2012 Columbia University3 E6885 Network Science – Lecture 10: Analysis of Network Flow
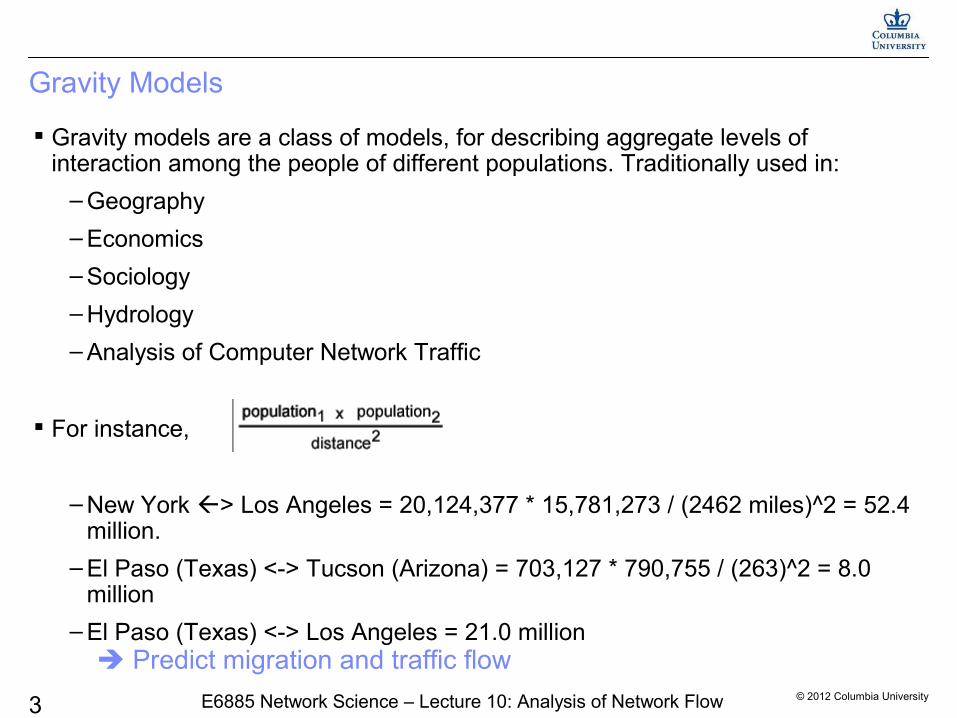
Gravity Models
Gravity models are a class of models, for describing aggregate levels of interaction among the people of different populations. Traditionally used in:
– Geography
– Economics
– Sociology
– Hydrology
– Analysis of Computer Network Traffic
For instance,
– New York > Los Angeles = 20,124,377 * 15,781,273 / (2462 miles)^2 = 52.4 million.
– El Paso (Texas) <-> Tucson (Arizona) = 703,127 * 790,755 / (263)^2 = 8.0 million
– El Paso (Texas) <-> Los Angeles = 21.0 million Predict migration and traffic flow
© 2012 Columbia University4 E6885 Network Science – Lecture 10: Analysis of Network Flow
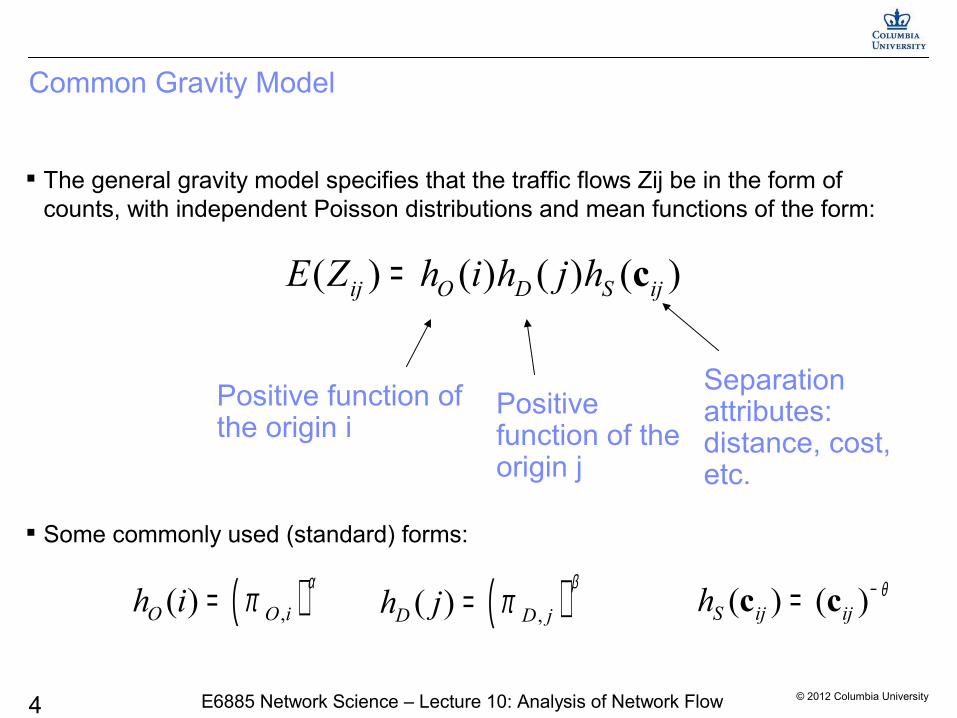
Common Gravity Model
The general gravity model specifies that the traffic flows Zij be in the form of counts, with independent Poisson distributions and mean functions of the form:
Some commonly used (standard) forms:
( ) ( ) ( ) ( )ij O D S ijE Z h i h j h= c
Positive function of the origin i
Positive function of the origin j
Separation attributes: distance, cost, etc.
( ),( )O O ih iα
π= ( ),( )D D jh jβ
π= ( ) ( )S ij ijh θ−=c c

© 2012 Columbia University5 E6885 Network Science – Lecture 10: Analysis of Network Flow
Example: Austrian call data
Phone traffic between 32 telecommunication districts in Austria in 1991.
Call flow volume versus each of origin Gross Regional Product (GRP), destination GRP, and distance.
Linear regression (dotted), and a nonparametric smoother (solid)
© 2012 Columbia University6 E6885 Network Science – Lecture 10: Analysis of Network Flow
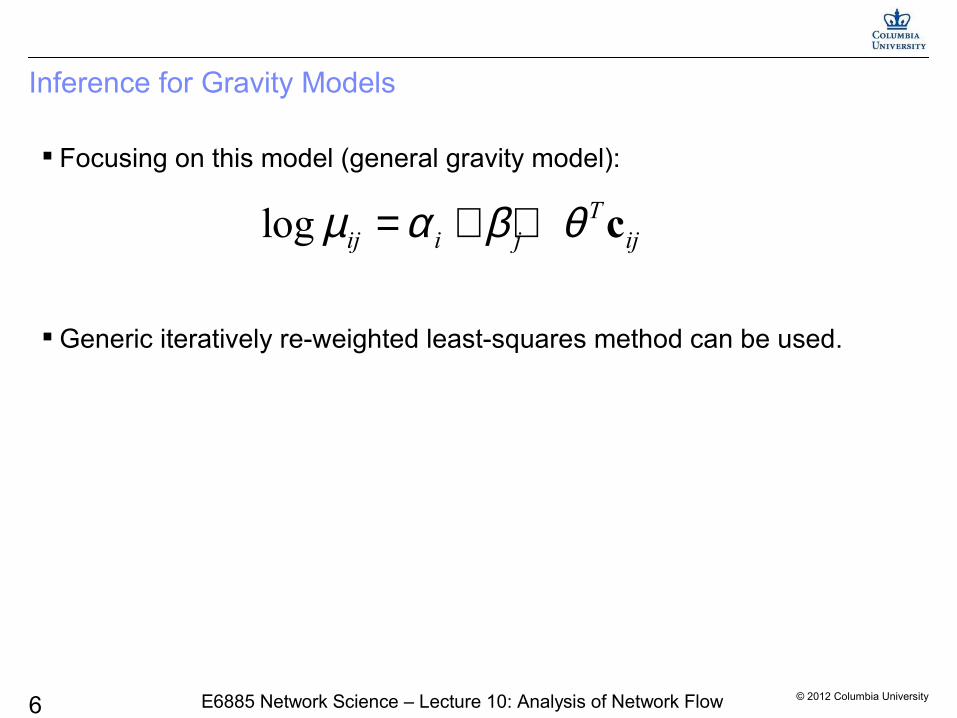
Inference for Gravity Models
Focusing on this model (general gravity model):
Generic iteratively re-weighted least-squares method can be used.
log Tij i j ijµ α β θ= + + c

© 2012 Columbia University7 E6885 Network Science – Lecture 10: Analysis of Network Flow
Example: Gravity Model Accuracy of
estimates of traffic volume made by the standard (left, in blue) and general (right, in green) gravity models for the Austrian call data.
The standard model tends to over-estimate in somewhat greater frequency than the general model, particularly for medium- and low-volume flows.
The relative error decreases with volume.
© 2012 Columbia University8 E6885 Network Science – Lecture 10: Analysis of Network Flow
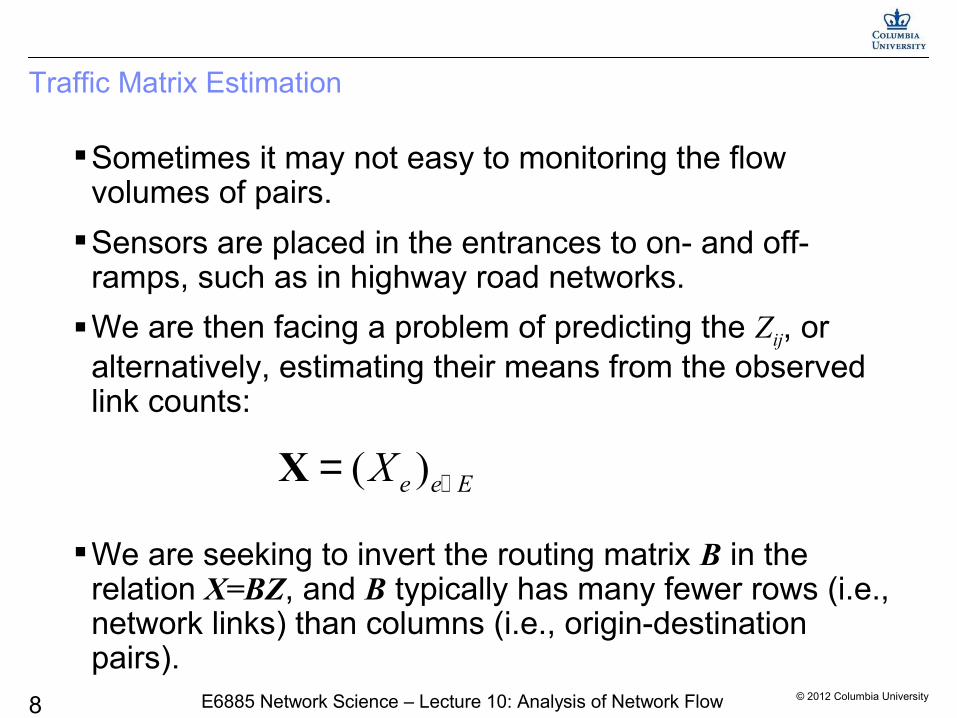
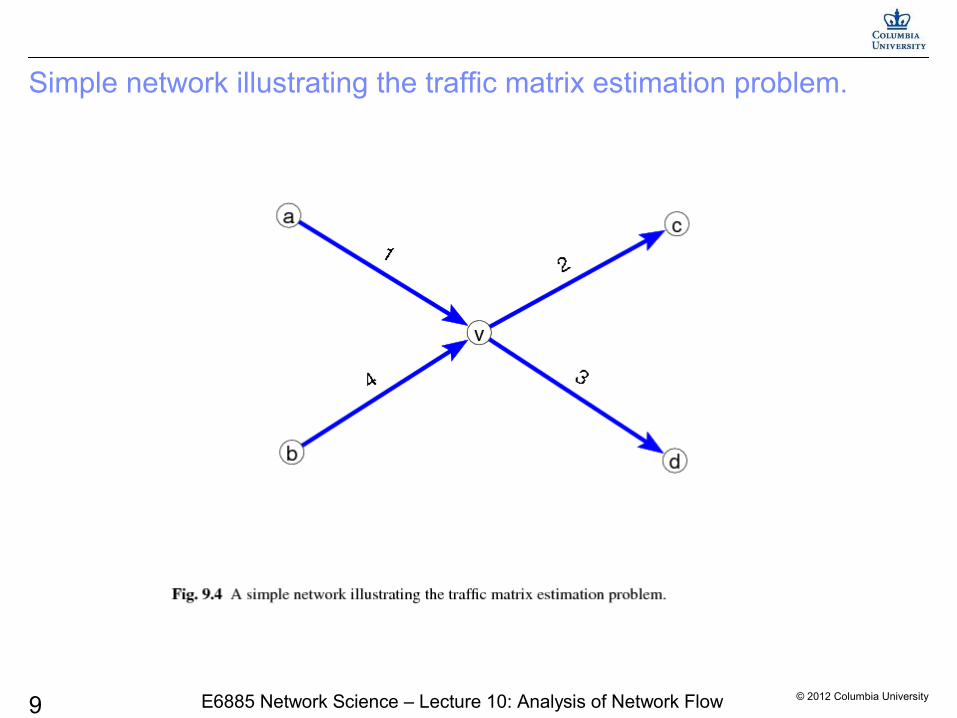
Traffic Matrix Estimation
Sometimes it may not easy to monitoring the flow volumes of pairs.
Sensors are placed in the entrances to on- and off-ramps, such as in highway road networks.
We are then facing a problem of predicting the Zij, or alternatively, estimating their means from the observed link counts:
We are seeking to invert the routing matrix B in the relation X=BZ, and B typically has many fewer rows (i.e., network links) than columns (i.e., origin-destination pairs).
( )e e EX ∈=X
© 2012 Columbia University9 E6885 Network Science – Lecture 10: Analysis of Network Flow
Simple network illustrating the traffic matrix estimation problem.
© 2012 Columbia University10 E6885 Network Science – Lecture 10: Analysis of Network Flow
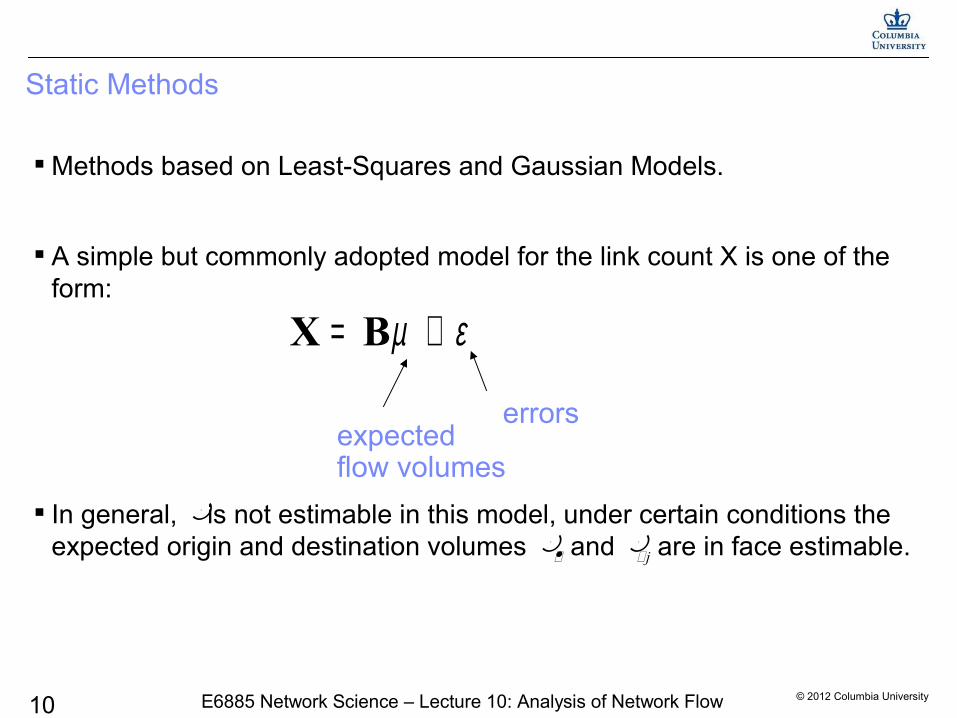
Static Methods
Methods based on Least-Squares and Gaussian Models.
A simple but commonly adopted model for the link count X is one of the form:
In general, is not estimable in this model, under certain conditions the expected origin and destination volumes and j are in face estimable.
µ ε= +X B
errorsexpectedflow volumes

© 2012 Columbia University11 E6885 Network Science – Lecture 10: Analysis of Network Flow
Reduced Dimensionality
Eigenvalues for the routing matrix corresponding to the Abilene network
There are 110 paths traversing just 30 directed links.
The large gap between the second and third eigenvalues, and the resulting knee in the spectrum are indicatinve of there being substantially more linear dependence among the columns of B than suggested by its nominal rank of 30.
The overall decay in the spectrum of eigenvalues suggests that measurements on roughly five to ten paths, and perhaps as few as two paths, may be sufficient to recover useful information about path costs in this network

© 2012 Columbia University12 E6885 Network Science – Lecture 10: Analysis of Network Flow
Visual representation of the first four eigenvectors
© 2012 Columbia University13 E6885 Network Science – Lecture 10: Analysis of Network Flow
Modeling and Predicting Personal Information Dissemination Behavior
Xiaodan Song, Ching-Yung Lin, Belle Tseng, and Ming-Ting Sun -- KDD 2005

© 2012 Columbia University14 E6885 Network Science – Lecture 10: Analysis of Network Flow
Utilizing relational and temporal info provides more insight than pure content analysis
What are a person’s
– role in events?
– with whom do you discuss what is going on in the company?
– behavior evolution?
– interests, tastes?
In a certain event,
– who played the most influential roles?
– who knew the information?
– how will a person or group of person response for future event?
Email,Publications
Time

© 2012 Columbia University15 E6885 Network Science – Lecture 10: Analysis of Network Flow
Outline
Motivation
The Content-Time-Relation (CTR) model
Experimental results
Conclusions and ongoing work

© 2012 Columbia University16 E6885 Network Science – Lecture 10: Analysis of Network Flow
Motivation Goal
– Personal information management
– Modeling and Predicting Personal Behaviors
Prior-Art Systems -- Linkedin, Orkut, Friendster, Yahoo! 360o
– Share what matters to you
•Create your own place online
•Share photos
•Create a blog
•List your favorites
•Send a blast, and more
– Keep your friends and family close
– Control who sees what
•Share as much as you want, with whomever you want
Tools for visually managing personal social networks
However in current solutions– Users need to manually input, update, and manage these networks
– Do not model or predict personal behaviors
© 2012 Columbia University17 E6885 Network Science – Lecture 10: Analysis of Network Flow
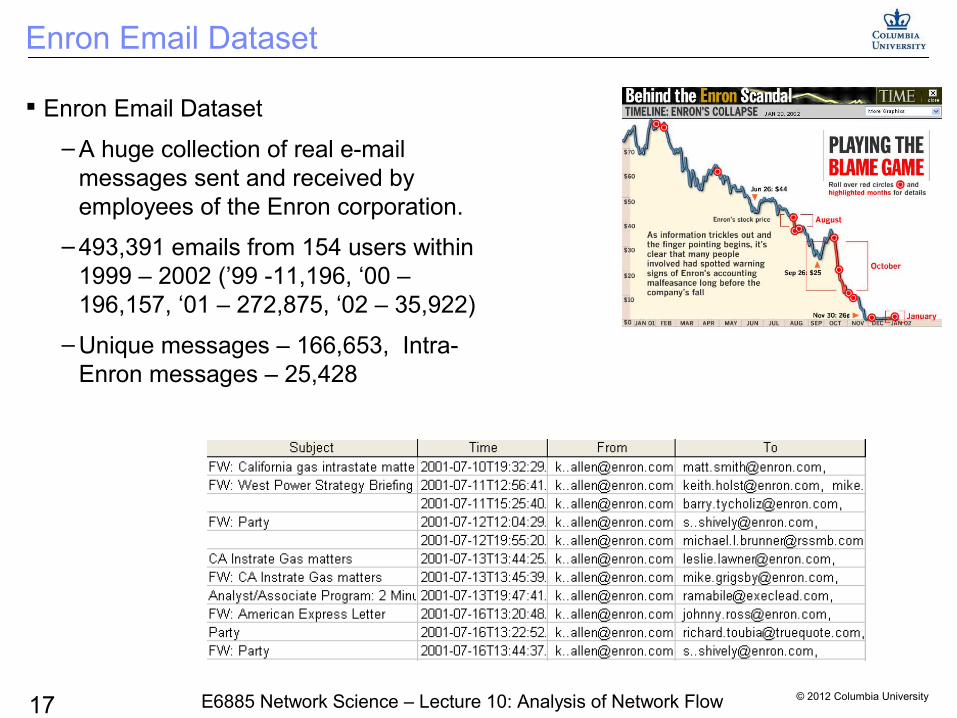
Enron Email Dataset
Enron Email Dataset
– A huge collection of real e-mail messages sent and received by employees of the Enron corporation.
– 493,391 emails from 154 users within 1999 – 2002 (’99 -11,196, ‘00 – 196,157, ‘01 – 272,875, ‘02 – 35,922)
– Unique messages – 166,653, Intra-Enron messages – 25,428
© 2012 Columbia University18 E6885 Network Science – Lecture 10: Analysis of Network Flow
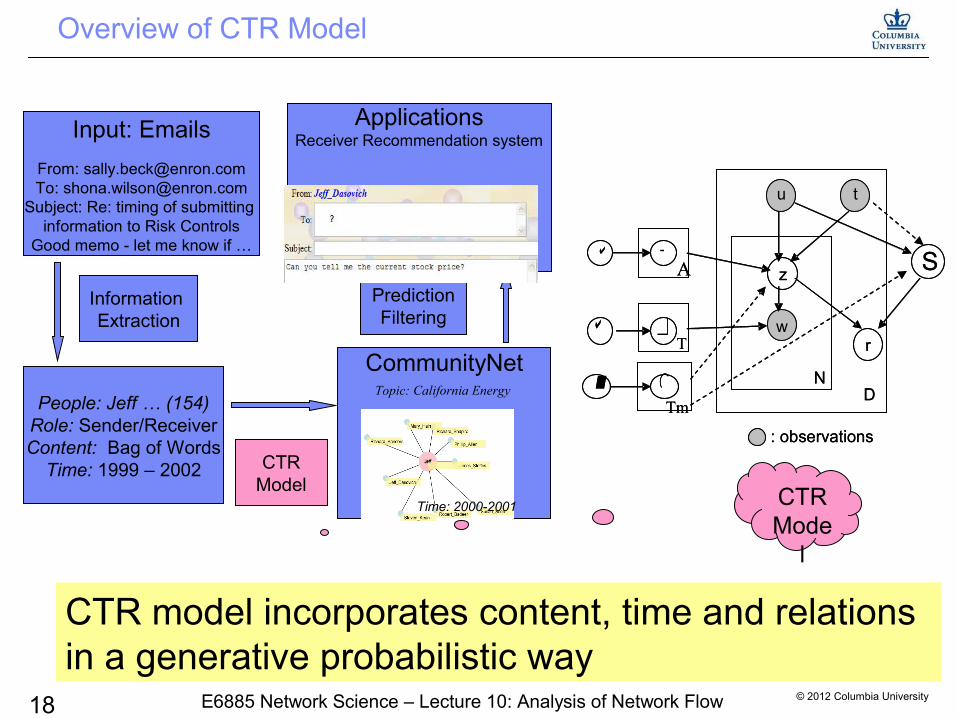
Overview of CTR Model
CTR model incorporates content, time and relations in a generative probabilistic way
: observations
A
ND
T
u
z
wr
CTR
S
Tm
t
: observations
A
ND
T
u
z
wr
CTR
S
Tm
t
Input: Emails
From: [email protected]: [email protected]
Subject: Re: timing of submitting information to Risk Controls
Good memo - let me know if …
Information Extraction
People: Jeff … (154)Role: Sender/ReceiverContent: Bag of Words
Time: 1999 – 2002
CommunityNet
CTRModel
ApplicationsReceiver Recommendation system
PredictionFiltering
Topic: California Energy
Time: 2000-2001 CTR Mode
l
© 2012 Columbia University19 E6885 Network Science – Lecture 10: Analysis of Network Flow
Related Work (I) – Social Network Analysis
Static Social Network Analysis– Small world: six degrees of separation [Milgram 1967]
– Introduce “link analysis” into information retrieval (Page rank [BP ‘98] , Hits [K’98])
– Mine communities from the web [Flake 2002]
– Mining the network value of customers (Domingos et al. 2001, Kempe et al. 2003)
– Exponential Random Graph Model (ERGM [Wasserman et al.1996])
Dynamic Social Network Analysis– Link prediction [Nowell and Kleinberg 2003]
– Tracking network changes [Kubica et al. 2002]
– Dynamic actor-oriented social network [Snijders 2003]
© 2012 Columbia University20 E6885 Network Science – Lecture 10: Analysis of Network Flow
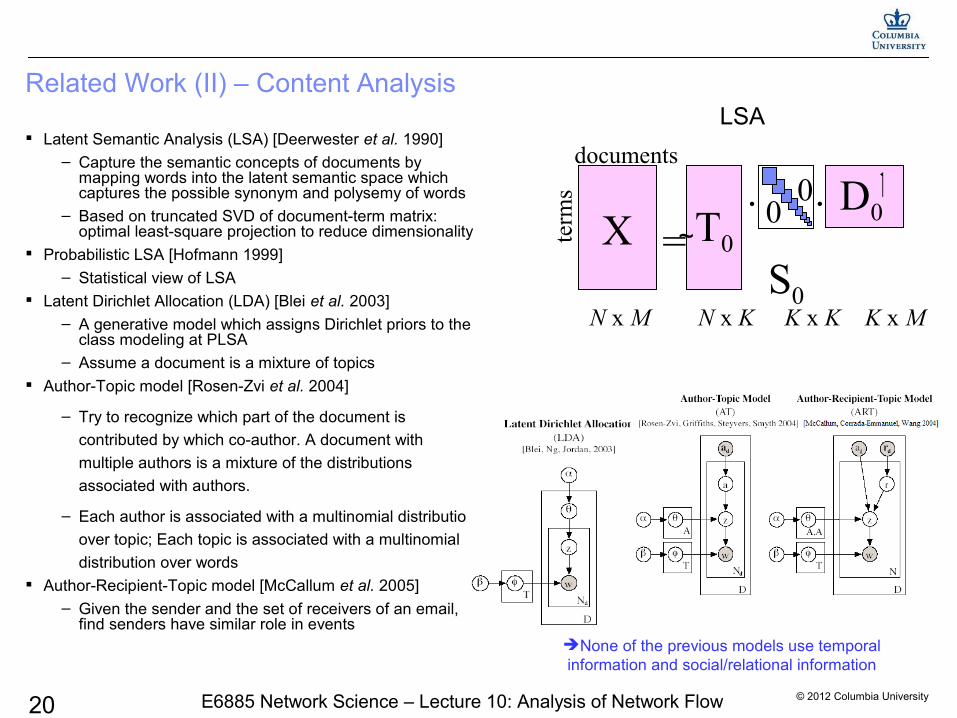
Related Work (II) – Content Analysis
Latent Semantic Analysis (LSA) [Deerwester et al. 1990]– Capture the semantic concepts of documents by
mapping words into the latent semantic space which captures the possible synonym and polysemy of words
– Based on truncated SVD of document-term matrix: optimal least-square projection to reduce dimensionality
Probabilistic LSA [Hofmann 1999]
– Statistical view of LSA Latent Dirichlet Allocation (LDA) [Blei et al. 2003]
– A generative model which assigns Dirichlet priors to the class modeling at PLSA
– Assume a document is a mixture of topics Author-Topic model [Rosen-Zvi et al. 2004]
– Try to recognize which part of the document is
contributed by which co-author. A document with
multiple authors is a mixture of the distributions
associated with authors.
– Each author is associated with a multinomial distribution
over topic; Each topic is associated with a multinomial
distribution over words Author-Recipient-Topic model [McCallum et al. 2005]
– Given the sender and the set of receivers of an email, find senders have similar role in events
X T0
S0
D0
N x M N x K K x K K x M
· ·=te
rms
documents
00
~
LSA
None of the previous models use temporal information and social/relational information
© 2012 Columbia University21 E6885 Network Science – Lecture 10: Analysis of Network Flow
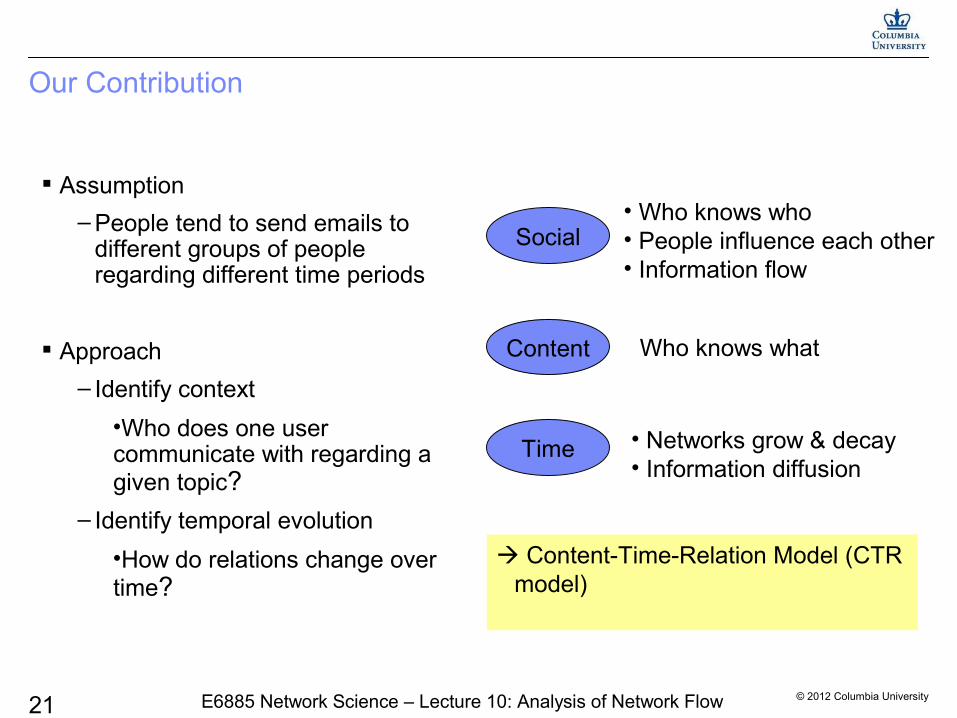
Our Contribution
Assumption
– People tend to send emails to different groups of people regarding different time periods
Approach
– Identify context
•Who does one user communicate with regarding a given topic?
– Identify temporal evolution
•How do relations change over time?
Content-Time-Relation Model (CTR model)
Content
Time
Social• Who knows who• People influence each other• Information flow
• Networks grow & decay• Information diffusion
Who knows what
© 2012 Columbia University22 E6885 Network Science – Lecture 10: Analysis of Network Flow
w
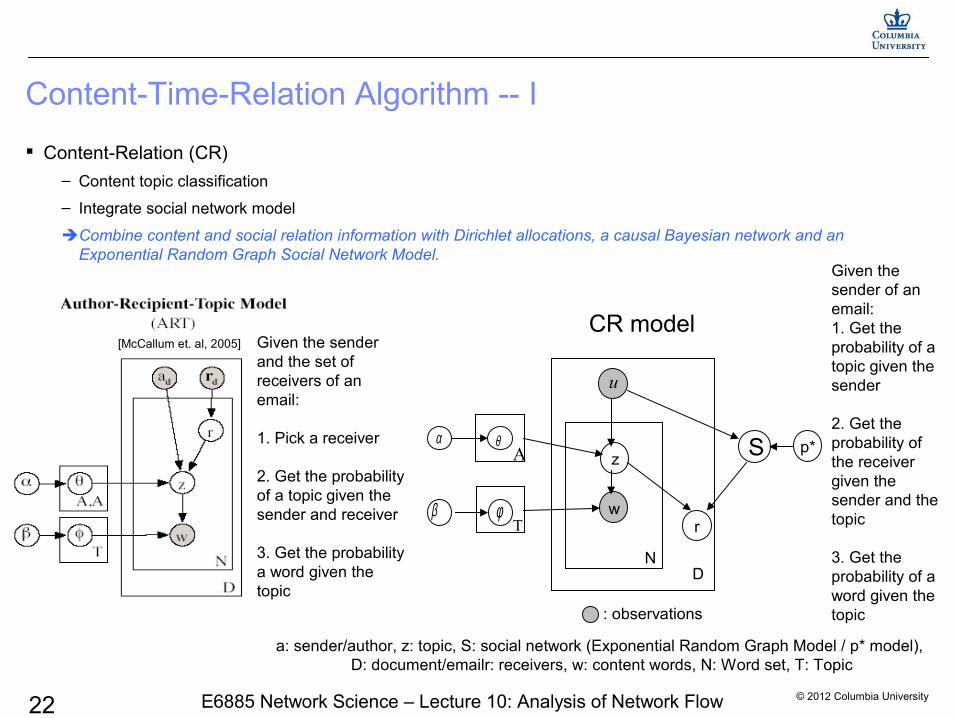
Content-Relation (CR)
– Content topic classification
– Integrate social network model
Combine content and social relation information with Dirichlet allocations, a causal Bayesian network and an Exponential Random Graph Social Network Model.
Content-Time-Relation Algorithm -- I
: observations
a: sender/author, z: topic, S: social network (Exponential Random Graph Model / p* model), D: document/emailr: receivers, w: content words, N: Word set, T: Topic
α θA
ND
βT
φ
u
z
Given the sender of an email:1. Get the probability of a topic given the sender
2. Get the probability of the receiver given the sender and the topic
3. Get the probability of a word given the topic
r
CR model
S
Given the sender and the set of receivers of an email:
1. Pick a receiver
2. Get the probability of a topic given the sender and receiver
3. Get the probability a word given the topic
[McCallum et. al, 2005]
p*
© 2012 Columbia University23 E6885 Network Science – Lecture 10: Analysis of Network Flow
u
w
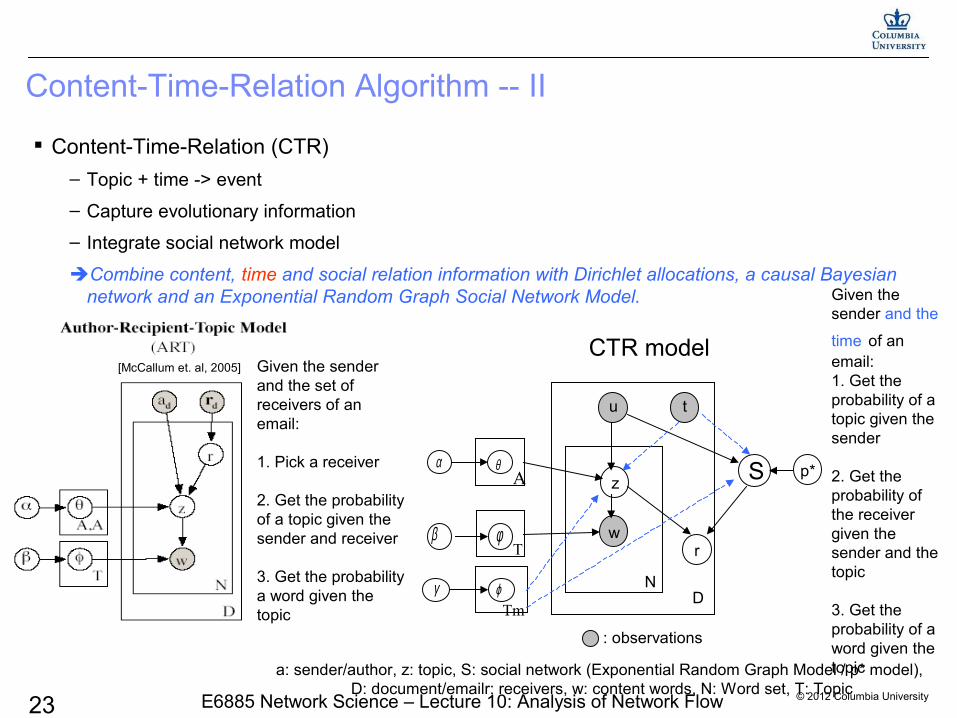
Content-Time-Relation Algorithm -- II
: observations
a: sender/author, z: topic, S: social network (Exponential Random Graph Model / p* model), D: document/emailr: receivers, w: content words, N: Word set, T: Topic
α θA
ND
βT
φ
z
Given the sender and the
time of an email:1. Get the probability of a topic given the sender
2. Get the probability of the receiver given the sender and the topic
3. Get the probability of a word given the topic
r
CTR model
S
Given the sender and the set of receivers of an email:
1. Pick a receiver
2. Get the probability of a topic given the sender and receiver
3. Get the probability a word given the topic
[McCallum et. al, 2005]
p*
Content-Time-Relation (CTR)
– Topic + time -> event
– Capture evolutionary information
– Integrate social network model
Combine content, time and social relation information with Dirichlet allocations, a causal Bayesian network and an Exponential Random Graph Social Network Model.
γ ϕTm
t
© 2012 Columbia University24 E6885 Network Science – Lecture 10: Analysis of Network Flow
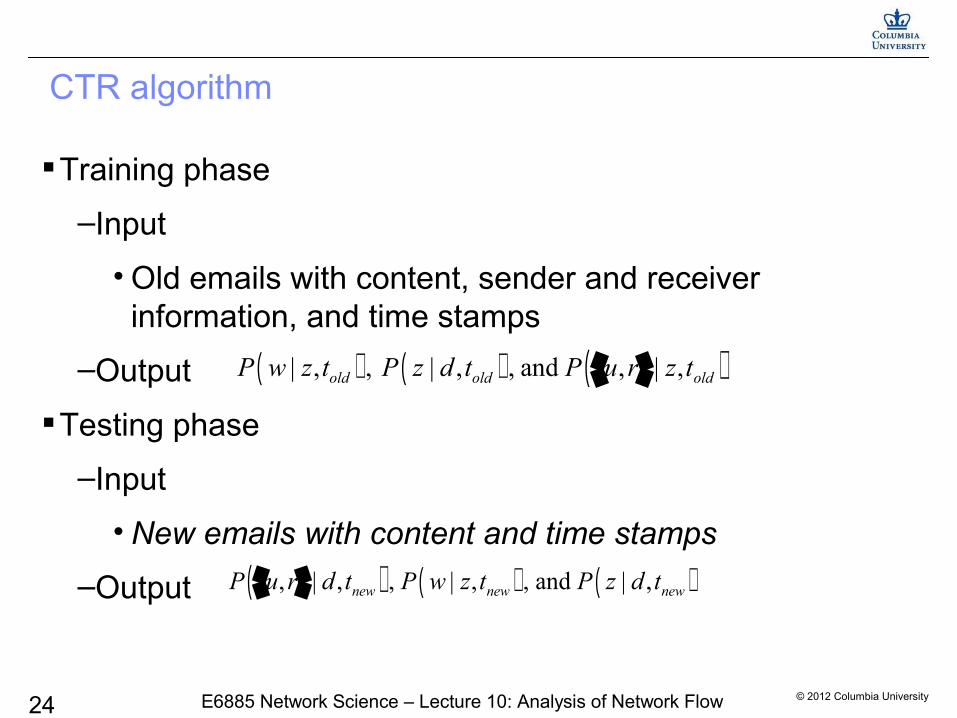
CTR algorithm
Training phase
–Input
• Old emails with content, sender and receiver information, and time stamps
–Output
Testing phase
–Input
• New emails with content and time stamps
–Output
( ) ( ) ( )| , , | , , and , | ,old old oldP w z t P z d t P u r z t
( ) ( ) ( ), | , , | , , and | ,new new newP u r d t P w z t P z d t

© 2012 Columbia University25 E6885 Network Science – Lecture 10: Analysis of Network Flow
Adaptive CTR
Social networks dynamically change and evolve over time
update the model with newest user behavior information is necessary
–Aggregative updating the model by adding new user behavior information including the senders and receivers into the model
–Assume the correlation between current data and the previous data decays over time. The more recent data are more important.
• A sliding window of size n is used to choose the data for building the prediction model
• The prediction is only dependent on the recent data, with the influence of old data ignored
( ) ( ) ( ) ( ) ( )1 /
ˆ , | , , | , | , , | | ,i
t ti old
K
i k old k i old t ik z z
P u r d t P u r z t P z d t P u r t P z d t=
= +∑ ∑
© 2012 Columbia University26 E6885 Network Science – Lecture 10: Analysis of Network Flow
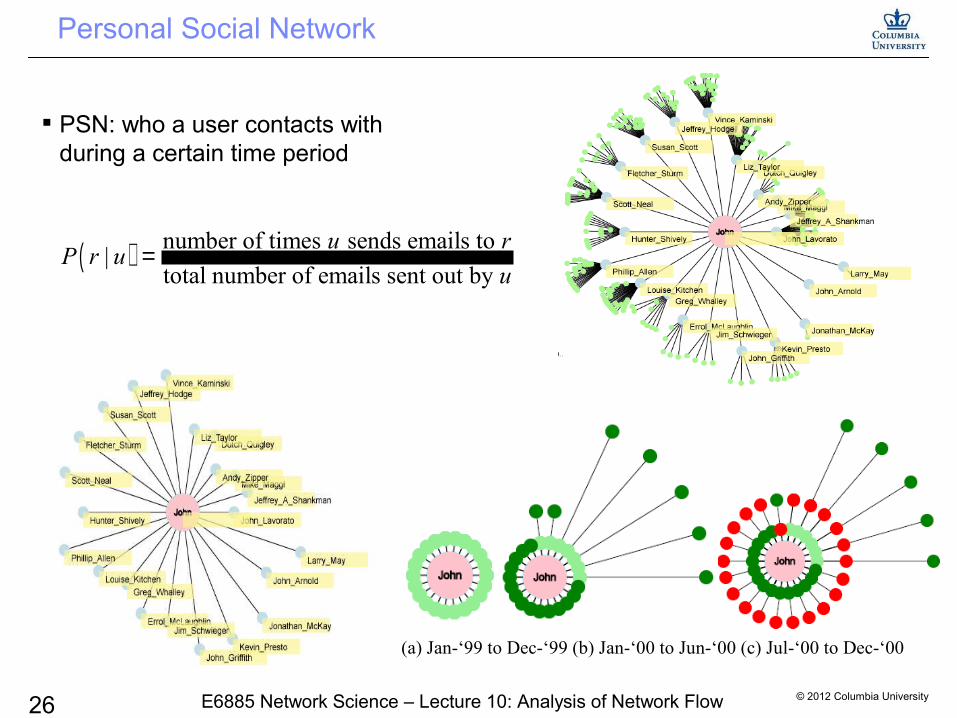
Personal Social Network
PSN: who a user contacts with during a certain time period
(a) Jan-‘99 to Dec-‘99 (b) Jan-‘00 to Jun-‘00 (c) Jul-‘00 to Dec-‘00
( ) number of times sends emails to |
total number of emails sent out by
u rP r u
u=

© 2012 Columbia University27 E6885 Network Science – Lecture 10: Analysis of Network Flow
CommunityNet
“Christmas” “Energy”
Provide a query apply CTR model visualize the personal topic community by CommunityNet

© 2012 Columbia University28 E6885 Network Science – Lecture 10: Analysis of Network Flow
Topic Analysis - Hot and cold topics
Hot Topics Regular Issues
Meeting Deal Petroleum Texas Document
meetingplan conference
balance presentation discussion
dealdeskbookbill
group explore
petroleum researchdear
photoEnronstation
HoustonTexasEnron
north America street
letterdraft
attach comment reviewmark
Cold Topics Specific or Sensitive Issues
Trade Stock Network Project Market
trade London
bankname
Mexico conserve
stockearn
company sharepricenew
network worldusersave
secure system
courtstateIndia
server project govern
callmarket week
trade description respond

© 2012 Columbia University29 E6885 Network Science – Lecture 10: Analysis of Network Flow
Topic Trends - yearly repeating events
Topic Trends
0
0.005
0.01
0.015
0.02
0.025
0.03
Jan Mar May Jul Sep Nov
Pop
ular
ity
Topic45(y2000)
Topic45(y2001)Topic19(y2000)
Topic19(y2001)
Topic 45, which is talking about a schedule issue, reaches a peak during June to September. For topic 19, it is talking about a meeting issue. The trend repeats year to year.

© 2012 Columbia University30 E6885 Network Science – Lecture 10: Analysis of Network Flow
CTR Model Finds Topic Categories, Key People and Communities Simultaneously
Topic Analysis for Topic 61
00.002
0.0040.0060.008
0.010.0120.014
0.0160.018
Jan-00 Apr-00 Jul-00 Oct-00 Jan-01 Apr-01 Jul-01 Oct-01
Pop
ular
ity
Key Words power 0.089361 California 0.088160 electrical 0.087345 price 0.055940 energy 0.048817 generator 0.035345 market 0.033314 until 0.030681
Key People
Jeff_Dasovich 0.249863 James_Steffes 0.139212Richard_Shapiro 0.096179 Mary_Hain 0.078131Richard_Sanders 0.052866 Steven_Kean 0.044745
Event “California Energy Crisis” occurred at exactly this time periodKey people can be identified to be active in this event
Topic Trend of “California Power”

© 2012 Columbia University31 E6885 Network Science – Lecture 10: Analysis of Network Flow
Personal Topic Trends of “California Power”
0
0.1
0.2
0.3
0.4
0.5
Jan-00 May-00 Sep-00 Jan-01 May-01 Sep-01
Pop
ular
ityOverall trend
Jeff_Dasovich
Vince_Kaminski

© 2012 Columbia University32 E6885 Network Science – Lecture 10: Analysis of Network Flow
Predicting Email Receivers
Personal social network
– People tend to send emails to the same group of people
Latent Dirichlet Allocation - Personal social network
– Topic clusters do not change over time
Content-Time-Relation model
Adaptive CTR model
05
1015202530354045
Jan-01 Mar-01 May-01 Jul-01 Sep-01 Nov-01
Adaptive CTR(aggregative)
Adaptive CTR(6 months)
CTR
LDA-PSN
PSN
Comparison using Breese evaluation metrics
© 2012 Columbia University33 E6885 Network Science – Lecture 10: Analysis of Network Flow
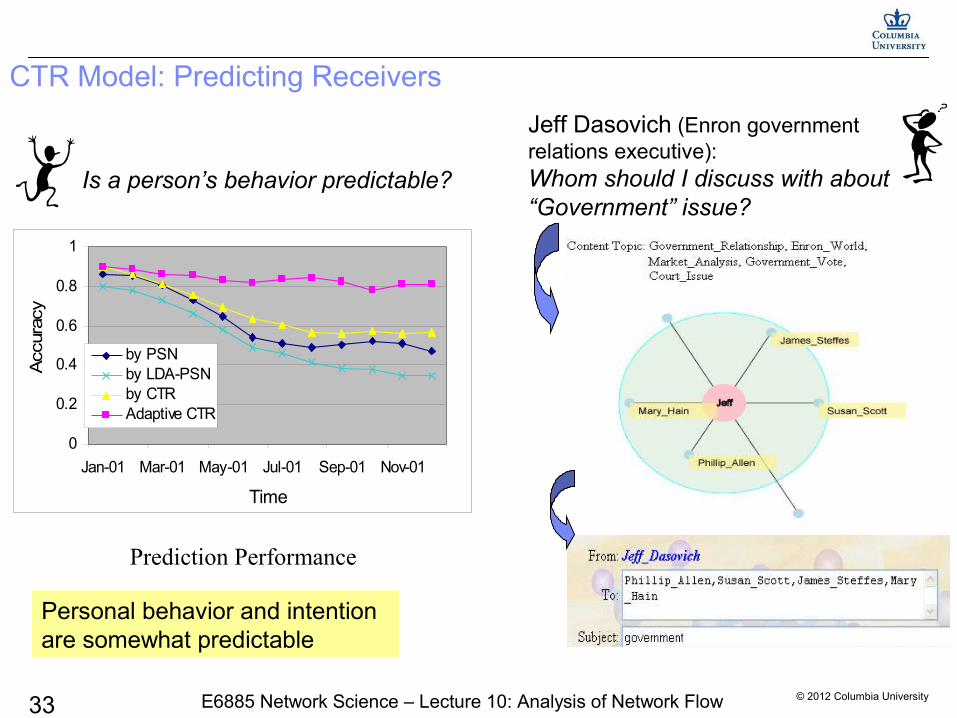
CTR Model: Predicting Receivers
Prediction Performance
Is a person’s behavior predictable?
Jeff Dasovich (Enron government relations executive):Whom should I discuss with about “Government” issue?
Personal behavior and intention are somewhat predictable
0
0.2
0.4
0.6
0.8
1
Jan-01 Mar-01 May-01 Jul-01 Sep-01 Nov-01
Time
Acc
urac
y
by PSNby LDA-PSNby CTRAdaptive CTR

© 2012 Columbia University34 E6885 Network Science – Lecture 10: Analysis of Network Flow
Conclusions and ongoing work
Conclusion
– Automatically model and predict human behavior of receiving and disseminating information
– Establish personal CommunityNet profiles based on the Content-Time-Relation algorithm, which incorporates contact, content, and time information simultaneously from personal communication
– Explore many interesting results,
• Finding the most important employees in events
• Predicting senders or receivers of emails
– Perform better than both the social network-based and the content-based predictions
Personal behavior and intention are somewhat predictable
Ongoing work
– incorporate nonparametric Bayesian methods such as hierarchical LDA with contact and time information
– Extend the CTR model to Content-Time-Context model for personalized Retrieval and Recommendation

© 2012 Columbia University35 E6885 Network Science – Lecture 10: Analysis of Network Flow
Personalized Recommendation Driven by Information Flow
Xiaodan Song, Belle Tseng, Ching-Yung Lin and Ming-Ting Sun -- SIG 2006

© 2012 Columbia University36 E6885 Network Science – Lecture 10: Analysis of Network Flow
A
B
People with similar tastes
adopt?Infer
adoptGiven
Recommendation by Collaborative Filtering (CF)
Similarity is symmetric!
A
B
People with similar tastes
adopt?Infer
adoptGiven
© 2012 Columbia University37 E6885 Network Science – Lecture 10: Analysis of Network Flow
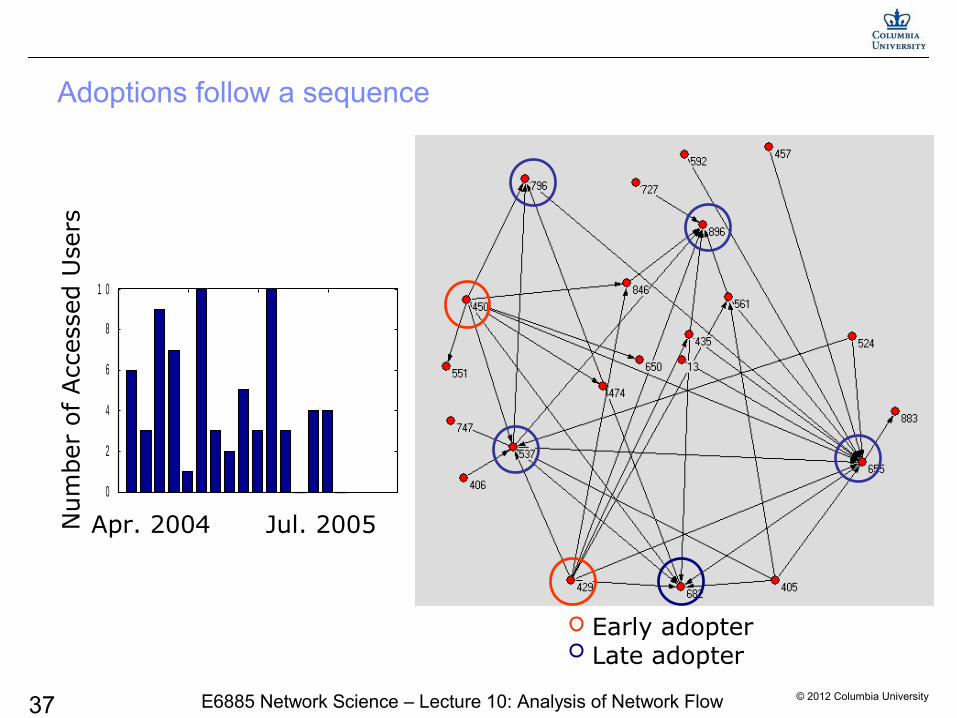
Adoptions follow a sequenceN
um
ber
of
Acc
esse
d U
sers
0 5 1 0 1 5 2 00
2
4
6
8
1 0
Early adopterLate adopter
Apr. 2004 Jul. 2005
© 2012 Columbia University38 E6885 Network Science – Lecture 10: Analysis of Network Flow
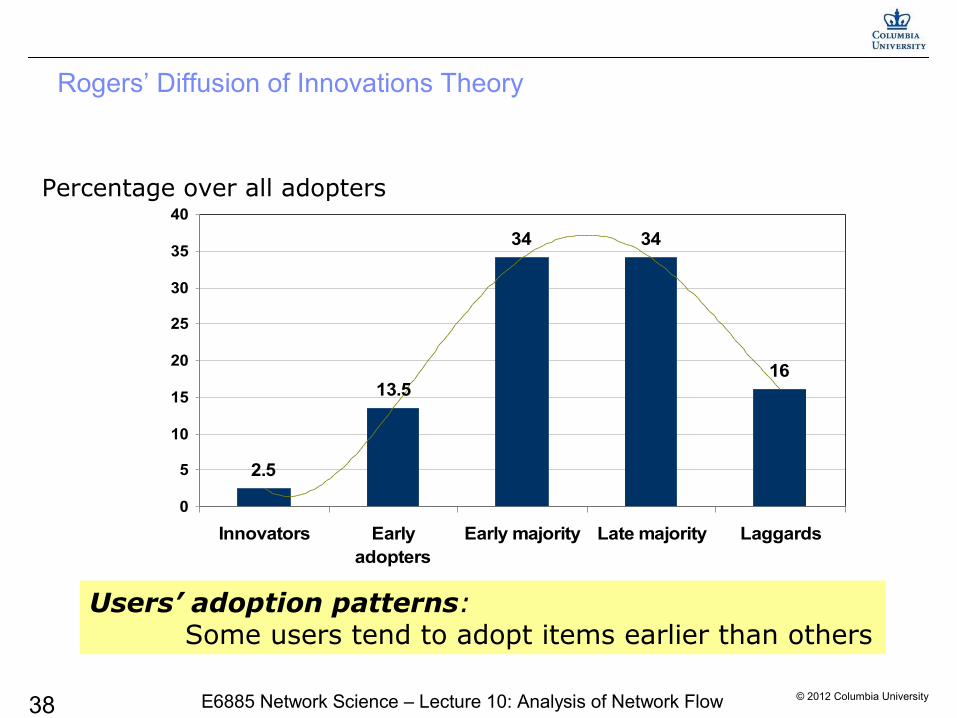
Rogers’ Diffusion of Innovations Theory
2.5
13.5
34 34
16
0
5
10
15
20
25
30
35
40
Innovators Earlyadopters
Early majority Late majority Laggards
Users’ adoption patterns: Some users tend to adopt items earlier than others
Percentage over all adopters
© 2012 Columbia University39 E6885 Network Science – Lecture 10: Analysis of Network Flow
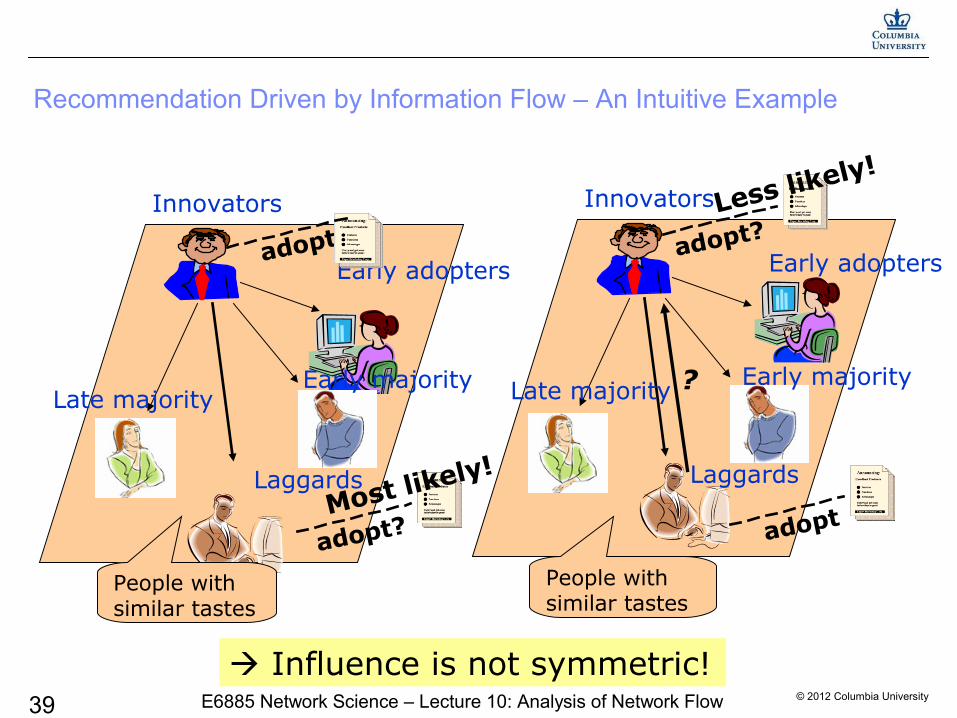
Innovators
People with similar tastes
Early adopters
Early majorityLate majority
Laggards
Innovators
People with similar tastes
Early adopters
Early majorityLate majority
Laggards
Recommendation Driven by Information Flow – An Intuitive Example
Influence is not symmetric!
adopt
adopt
?
adopt?
adopt?Most likely!
Less likely!

© 2012 Columbia University40 E6885 Network Science – Lecture 10: Analysis of Network Flow
Utilize Information Flow for Personalized Recommendation -- Problem Formulation
The typical CF question: What items will user U like?
Our Formulation
Given user U adopts item Y, who would be likely to adopt item Y next?
Information “flows” from earlier adopters to later adopters
Innovators
Laggards

© 2012 Columbia University41 E6885 Network Science – Lecture 10: Analysis of Network Flow
Analogy: Information Adoption As A Diffusion Process
Given user U adopts item Y, who would be likely to adopt item Y next?
Information Adoption Information Flow (Diffusion)
In physics, diffusion process is usually related to a random walk [R. Kondor and J.-P. Vert, Diffusion Kernels, 2004]
Information Adoption is modeled as a random walk
Users are ranked by the state probabilities
© 2012 Columbia University42 E6885 Network Science – Lecture 10: Analysis of Network Flow
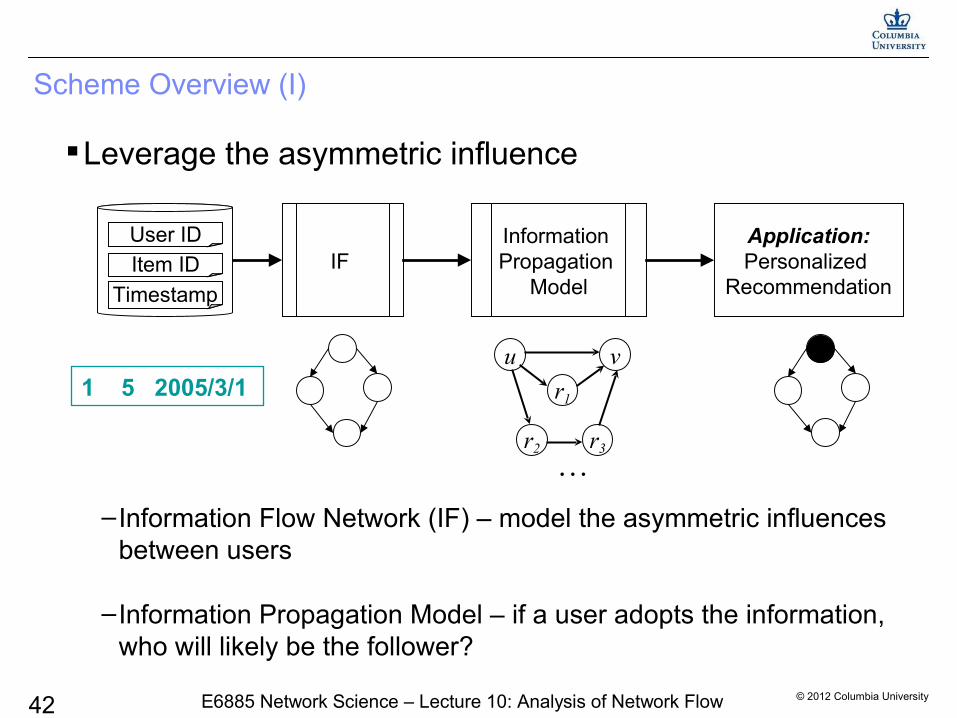
Scheme Overview (I)
Leverage the asymmetric influence
–Information Flow Network (IF) – model the asymmetric influences between users
–Information Propagation Model – if a user adopts the information, who will likely be the follower?
1 5 2005/3/1u v
r1
r2 r3
…
IF Information Propagation
Model
Application:Personalized
RecommendationTimestamp
Item ID
User ID
© 2012 Columbia University43 E6885 Network Science – Lecture 10: Analysis of Network Flow
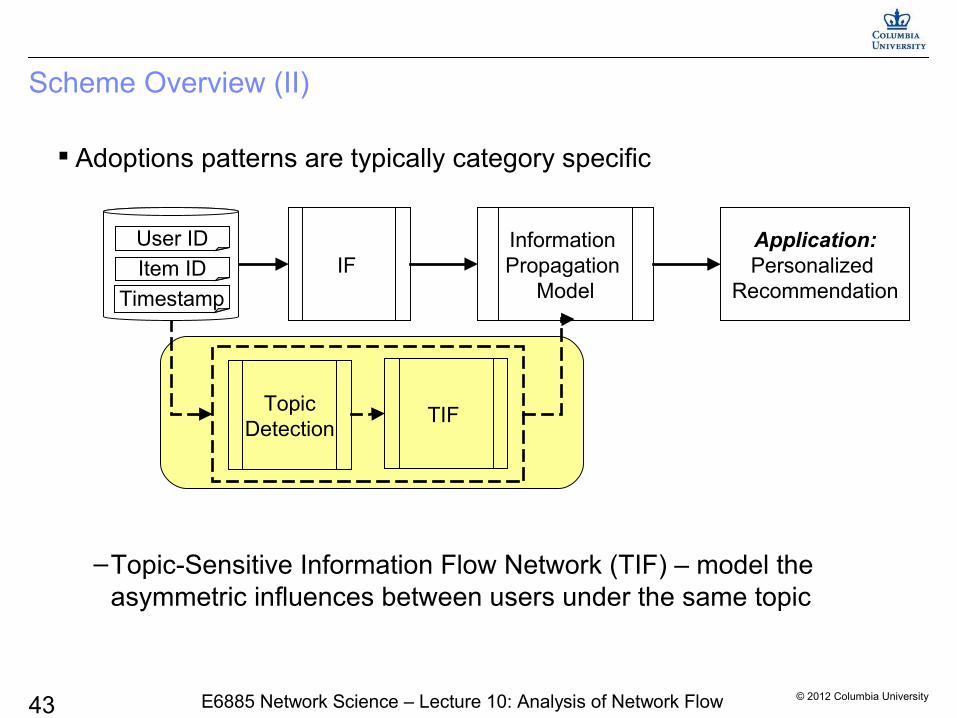
Adoptions patterns are typically category specific
–Topic-Sensitive Information Flow Network (TIF) – model the asymmetric influences between users under the same topic
Scheme Overview (II)
TIF TopicDetection
IF Information Propagation
Model
Application:Personalized
RecommendationTimestamp
Item ID
User ID
© 2012 Columbia University44 E6885 Network Science – Lecture 10: Analysis of Network Flow
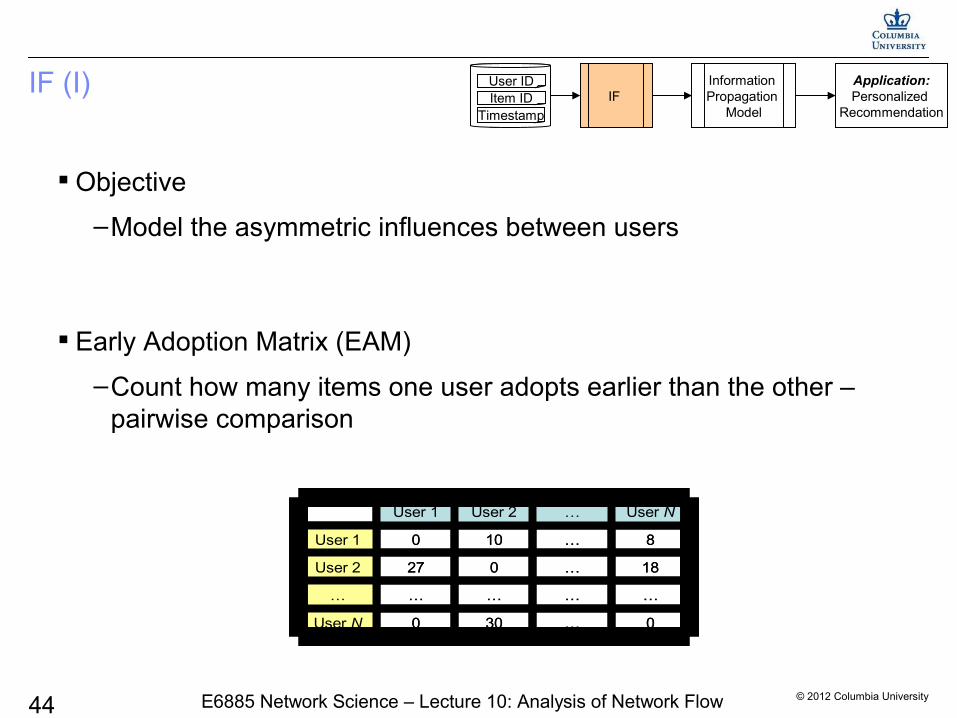
Objective
–Model the asymmetric influences between users
IF (I)
Early Adoption Matrix (EAM)
–Count how many items one user adopts earlier than the other – pairwise comparison
Dataset IF Information Propagation
Model
Application:Personalized
RecommendationTimestampItem IDUser ID
0…300User N
……………
18…027User 2
8…100User 1
User N…User 2User 1
0…300User N
……………
18…027User 2
8…100User 1
User N…User 2User 1

© 2012 Columbia University45 E6885 Network Science – Lecture 10: Analysis of Network Flow
IF (II)
IF – A Random Walk Model
–Network structure
• Each user as a node (state)
• The value on edge (i j) represents how likely user j will follow user i to adopt the information
–Normalize EAM to a Transition probability Matrix – F
i jFij

© 2012 Columbia University46 E6885 Network Science – Lecture 10: Analysis of Network Flow
The random walk over the following graphs does not converge
Make the random walk have a unique stationary distribution (= F + random jump)
1) Make the matrix stochastic 2) Make the matrix irreducible
IF (III) Dataset IF Information Propagation
Model
Application:Personalized
RecommendationTimestampItem IDUser ID
Sink Cycle
F
, ,
,
0
1
u v u vv
u v
if
elseN
≠=
∑F FF
( )1 Nα α= + − TF F ee
N: number of the nodes
© 2012 Columbia University47 E6885 Network Science – Lecture 10: Analysis of Network Flow
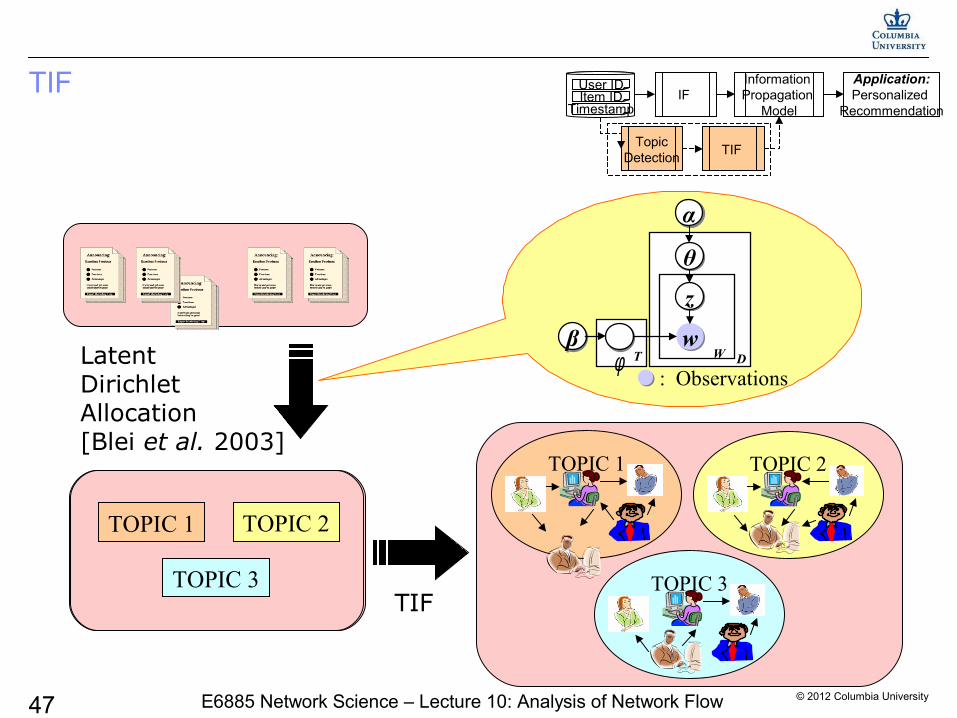
LatentDirichletAllocation[Blei et al. 2003]
TIF IF Information Propagation
Model
Application:Personalized
Recommendation
TIF Topic
Detection
TimestampItem IDUser ID
TOPIC 1
TOPIC 3
TOPIC 2TOPIC 1
TOPIC 3
TOPIC 2
TOPIC 2TOPIC 1
TOPIC 3TIF
θθ
wwW D
ββ
αα
zz
Tφ: Observations
© 2012 Columbia University48 E6885 Network Science – Lecture 10: Analysis of Network Flow
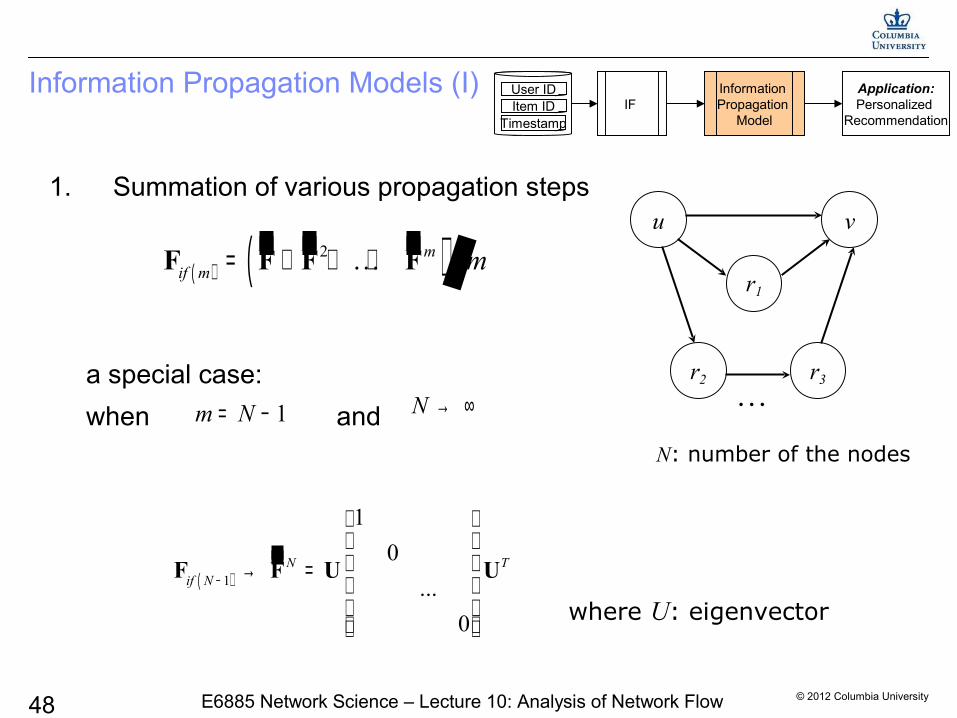
Information Propagation Models (I)
1. Summation of various propagation steps
a special case:
when and N: number of the nodes
( )1
1
0
...
0
N Tif N −
→ =
F F U U
( ) ( )2 mif m m= + + +F F F F
Dataset IF Information Propagation
Model
Application:Personalized
RecommendationTimestampItem IDUser ID
1m N= − N → ∞
u v
r1
r2 r3
…
where U: eigenvector

© 2012 Columbia University49 E6885 Network Science – Lecture 10: Analysis of Network Flow
Information Propagation Models (II)
2. Exponential weighted summation
The longer the path, the less reliable it is
( )( )
( )
( )
2(exp)
exp 1
expexp
exp
Tif
N
ββ λ
β
β λ
⋅ ⋅ ∝ =
⋅
F F U U⋯
N: number of the nodes
Dataset IF Information Propagation
Model
Application:Personalized
RecommendationTimestamp
Item ID
User ID
u v
r1
r2 r3
…
1 21 Nλ λ λ= > > >⋯where eigenvalues
© 2012 Columbia University50 E6885 Network Science – Lecture 10: Analysis of Network Flow
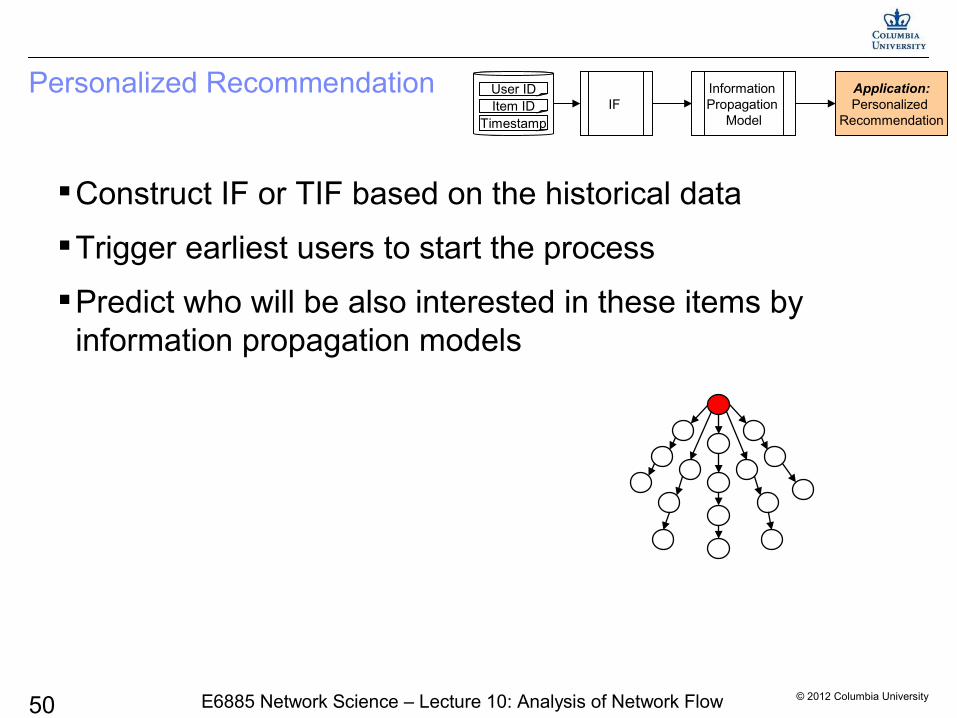
Personalized Recommendation
Construct IF or TIF based on the historical data
Trigger earliest users to start the process
Predict who will be also interested in these items by information propagation models
Dataset IF Information Propagation
Model
Application:Personalized
RecommendationTimestampItem IDUser ID
© 2012 Columbia University51 E6885 Network Science – Lecture 10: Analysis of Network Flow
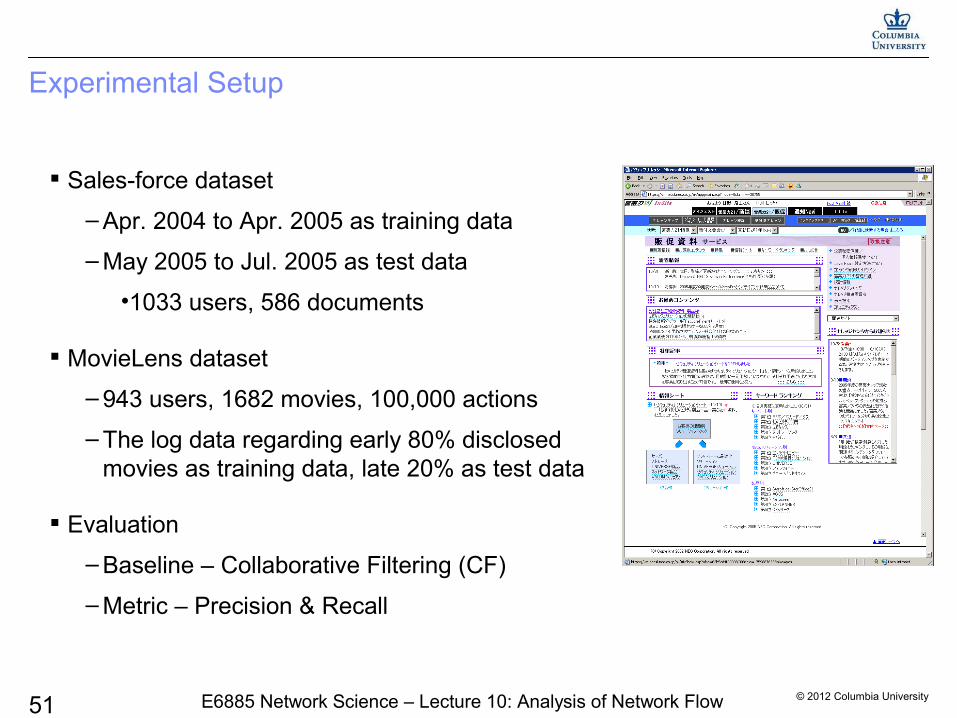
Experimental Setup
Sales-force dataset
– Apr. 2004 to Apr. 2005 as training data
– May 2005 to Jul. 2005 as test data
•1033 users, 586 documents
MovieLens dataset
– 943 users, 1682 movies, 100,000 actions
– The log data regarding early 80% disclosed movies as training data, late 20% as test data
Evaluation
– Baseline – Collaborative Filtering (CF)
– Metric – Precision & Recall
© 2012 Columbia University52 E6885 Network Science – Lecture 10: Analysis of Network Flow
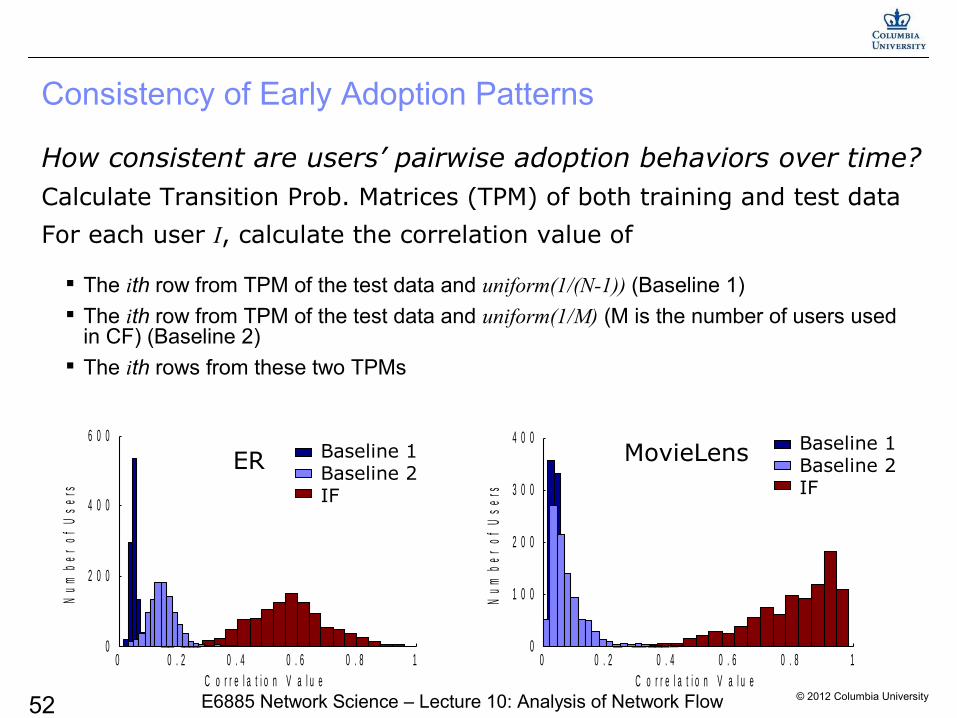
How consistent are users’ pairwise adoption behaviors over time?Calculate Transition Prob. Matrices (TPM) of both training and test data
For each user I, calculate the correlation value of
Consistency of Early Adoption Patterns
0 0 . 2 0 . 4 0 . 6 0 . 8 10
1 0 0
2 0 0
3 0 0
4 0 0
C o r r e l a t i o n V a l u e
Num
ber
of U
sers
0 0 . 2 0 . 4 0 . 6 0 . 8 10
2 0 0
4 0 0
6 0 0
C o r r e l a t i o n V a l u e
Num
ber
of U
sers
ER MovieLensBaseline 1Baseline 2IF
Baseline 1Baseline 2IF
The ith row from TPM of the test data and uniform(1/(N-1)) (Baseline 1) The ith row from TPM of the test data and uniform(1/M) (M is the number of users used
in CF) (Baseline 2) The ith rows from these two TPMs
© 2012 Columbia University53 E6885 Network Science – Lecture 10: Analysis of Network Flow
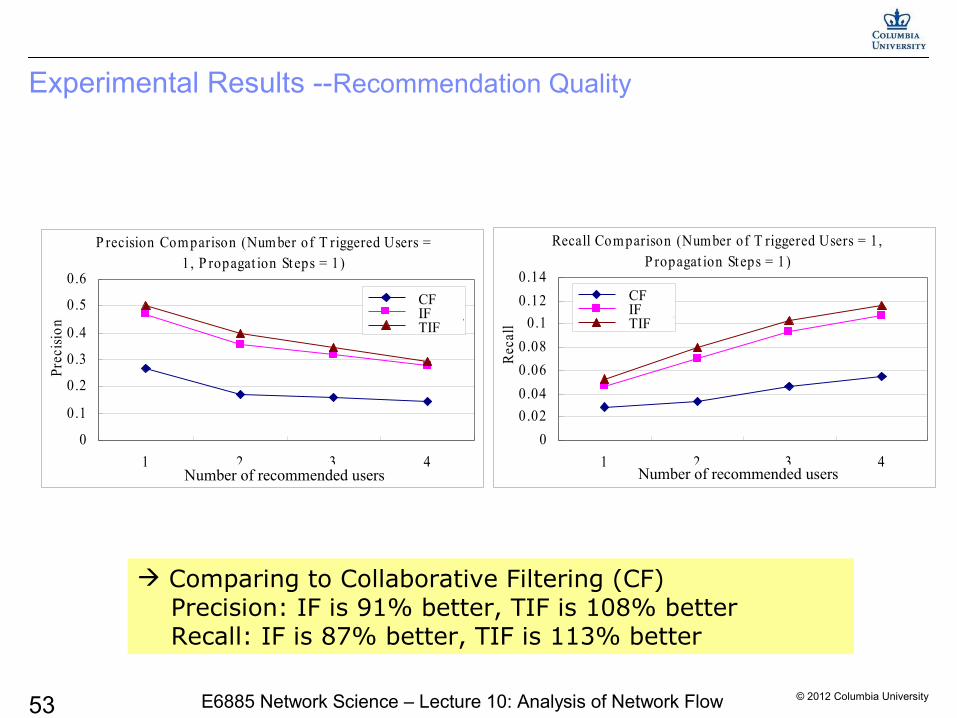
Experimental Results --Recommendation Quality
Comparing to Collaborative Filtering (CF) Precision: IF is 91% better, TIF is 108% better Recall: IF is 87% better, TIF is 113% better
P recision Com parison (Num ber of T riggered Users =1, P ropagat ion St eps = 1)
0
0.1
0.2
0.3
0.4
0.5
0.6
1 2 3 4No. of ret rieved users
Prec
isio
n
CFEABIFT EABIF
Recall Com parison (Number of T riggered Users = 1,P ropagat ion St eps = 1)
0
0.02
0.04
0.06
0.08
0.1
0.12
0.14
1 2 3 4No. of ret rieved users
Rec
all
CFEABIFT EABIF
Number of recommended users Number of recommended users
CFIFTIF
CFIFTIF
© 2012 Columbia University54 E6885 Network Science – Lecture 10: Analysis of Network Flow
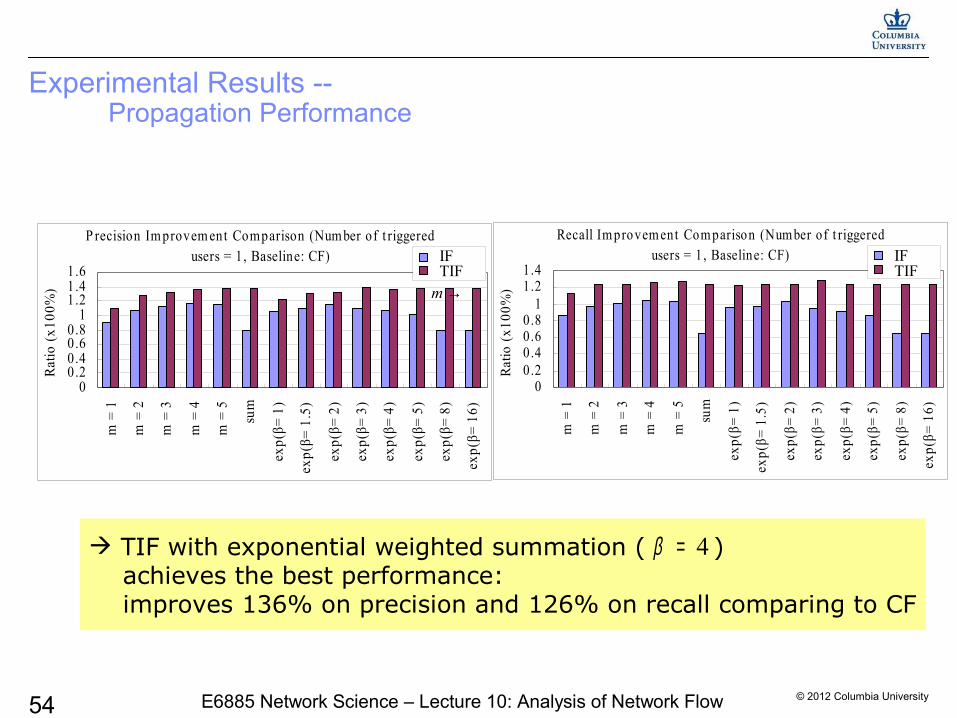
Experimental Results -- Propagation Performance
P recision Im provem ent Comparison (Number of t riggeredusers = 1, Baseline: CF)
00.20.40.60.8
11.21.41.6
m =
1
m =
2
m =
3
m =
4
m =
5
sum
exp(
β= 1
)
exp(
β= 1
.5)
exp(
β= 2
)
exp(
β= 3
)
exp(
β= 4
)
exp(
β= 5
)
exp(
β= 8
)
exp(
β= 1
6)
Rat
io (
x100
%)
EABIFT EABIF
Recall Im provem ent Com parison (Number of t riggeredusers = 1 , Baseline: CF)
00.20.40.60.8
11.21.4
m =
1
m =
2
m =
3
m =
4
m =
5
sum
exp(
β= 1
)
exp(
β= 1
.5)
exp(
β= 2
)
exp(
β= 3
)
exp(
β= 4
)
exp(
β= 5
)
exp(
β= 8
)
exp(
β= 1
6)
Rat
io (
x100
%)
EABIFT EABIF
TIF with exponential weighted summation ( ) achieves the best performance: improves 136% on precision and 126% on recall comparing to CF
4β =
IFTIF
IFTIF
m →
© 2012 Columbia University55 E6885 Network Science – Lecture 10: Analysis of Network Flow
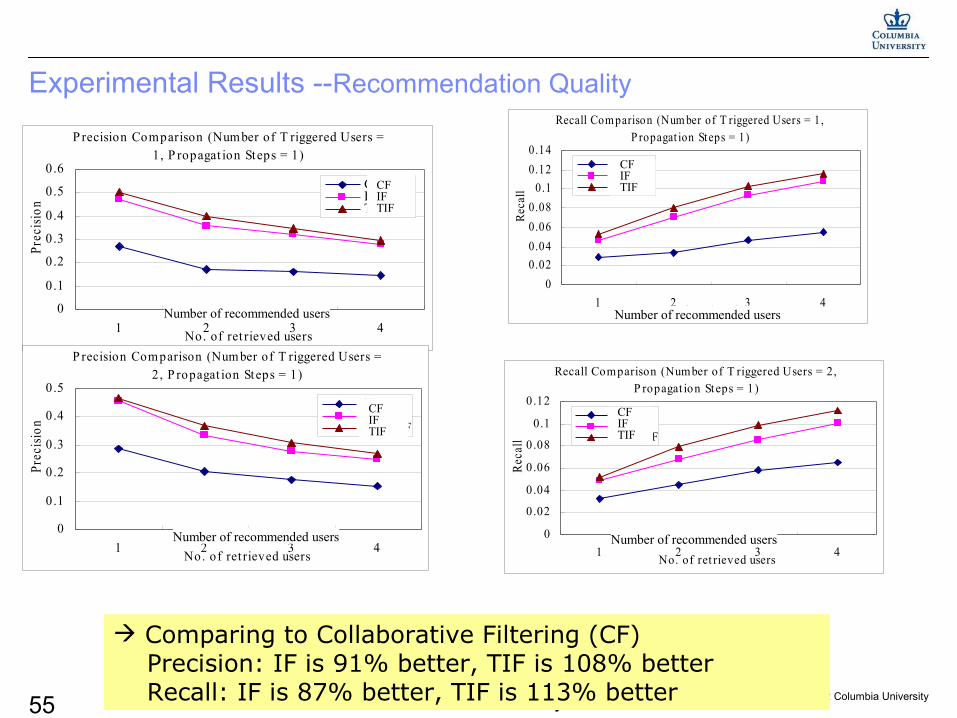
Experimental Results --Recommendation Quality
P recision Comparison (Number of T riggered Users =1, P ropagat ion Steps = 1)
0
0.1
0.2
0.3
0.4
0.5
0.6
1 2 3 4No. of ret rieved users
Prec
isio
n
CFEABIFT EABIF
Recall Com parison (Num ber of T riggered Users = 1,P ropagat ion St eps = 1)
0
0.02
0.04
0.06
0.08
0.1
0.12
0.14
1 2 3 4No. of ret rieved users
Rec
all
CFEABIFT EABIF
P recision Com parison (Num ber of T riggered Users =2, P ropagat ion St eps = 1)
0
0.1
0.2
0.3
0.4
0.5
1 2 3 4No. of ret rieved users
Prec
isio
n
CFEABIFT EABIF
Recall Comparison (Number of T riggered Users = 2,P ropagat ion Steps = 1)
0
0.02
0.04
0.06
0.08
0.1
0.12
1 2 3 4No. of ret rieved users
Rec
all
CFEABIFT EABIF
Comparing to Collaborative Filtering (CF) Precision: IF is 91% better, TIF is 108% better Recall: IF is 87% better, TIF is 113% better
Number of recommended users Number of recommended users
Number of recommended users Number of recommended users
CFIFTIF
CFIFTIF
CFIFTIF
CFIFTIF
© 2012 Columbia University56 E6885 Network Science – Lecture 10: Analysis of Network Flow
Conclusions and Next Steps
Conclusions
–Utilize sequential adoption patterns
–Leverage asymmetric influences between users– IF
–Leverage category-specific patterns – TIF
–Identify how information flows through the network – information propagation models
Next Steps
–Leverage the diffusion rate
–Improve the information propagation models
–Evaluate by online user study