Embed Size (px)
Citation preview
DOCUMENT RESUME
ED 404 746 EA 028 247
AUTHOR Nelson, F. Howard; Rosen, MichaelTITLE Are Teachers' Unions Hurting American Education? A
State-by-State Analysis of the Impact of CollectiveBargaining among Teachers on Student Performance.
INSTITUTION Institute for Wisconsin's Future, Milwaukee.PUB DATE Oct 96NOTE 25p.
PUB TYPE Reports Research/Technical (143)
EDRS PRICE MF01/PC01 Plus Postage.DESCRIPTORS *Academic Achievement; Class Size; *Collective
Bargaining; Elementary Secondary Education; *PublicSchools; Regression (Statistics); Standardized Tests;*State Norms; *Teacher Associations; *Unions
ABSTRACTDuring the 1996 electoral season, public schools and
teachers' unions have been repeatedly attacked by Republicancandidates as the cause of intellectual and moral decline amongAmerican youth. The Institute for Wisconsin's Future initiated anupdated review of the impact of collective bargaining among teacherson the performance levels of school children. This document presentsfindings of their study, which examines the impact of collectivebargaining along with that of region, family income, race, schoolspending, and levels of private school attendance. The study focusedon the relationship between high, medium, and low levels ofunionization among teachers and the test scores of public schoolstudents on the 1995 Scholastic Aptitude (SAT) College Entrance examsand the 1994 National Assessment of Educational Progress (NAEP)fourth-grade reading tests in a state-by-state comparison. Findingsindicate that student performance on the tests was significantlybetter in states with high levels of unionization with all othervariables held constant. Average student scores on the SAT exams were43 points higher in states where over 90 percent of teachers wereunionized than in states where less than 50 percent of the teacherswere covered by collective bargaining or meet-and-confer agreements.Furthermore, when collective bargaining was removed from theanalysis, scores dropped in all states. Those factors found to besignificantly related to poor performance included low householdincome, race (which was correlated with other measures ofsocioeconomic deprivation), large class size, high absenteeism, andhigher rates of private school attendance. The underlying causes ofpoor performance among children were primarily socioeconomic factorsin children's lives and the lack of adequate educational resources.Seven tables are included. (Contains 12 references.) (LMI)
************************************************************************ Reproductions supplied by EDRS are the best that can be made *
* from the original document. *
***********************************************************************
A
A
On DEJEDDTHE INSTITUTE FORWISCONSIN'S FUTURE
ARE TEACHERS' UNIONS HURTING AMERICAN EDUCATION?
A State-by-State Analysis of the Impact ofCollective Bargaining Among Teachers on Student Performance
'ay 1111
October, 1996
Prepared for the Institute for Wisconsin's Future by:
F. Howard NelsonEducational Research Consultant
Michael RosenChairman, Economics DepartmentMilwaukee Area Technical College
Consulting Assistance:Brian Powell
Associate Professor, Sociology DepartmentIndiana University
BEST COPYCOPY AVAILABLE
U.S. DEPARTMENT OF EDUCATIONOffice of Educational Research and Improvement
EDUC TIONAL RESOURCES INFORMATIONCENTER (ERIC)
This document has been reproduced asreceived from the person or organizationoriginating it.
Minor changes have been made toimprove reproduction quality.
Points of view or opinions stated in thisdocument do not necessarily representofficial OERI position or policy.
"PERMISSION TO REPRODUCE THISMAT IAL HAS BEEN GRANTED BY
A1/0. /_!
TO THE EDUCATIONAL RESOURCESINFORMATION CENTER (ERIC)."
ARE TEACHERS' UNIONS HURTING AMERICAN EDUCATION?
A State-by-State Analysis of the Impact ofCollective Bargaining Among Teachers on Student Performance
Prepared for the Institute for Wisconsin's Future by:
F. Howard NelsonEducational Research Consultant
Michael RosenChairman, Economics DepartmentMilwaukee Area Technical College
Consulting Assistance:Brian Powell
Associate Professor, Sociology DepartmentIndiana University
El
Cover Photo by:Mary Ann Onorato
El II BTHE INSTITUTE FORWISCONSIN'S FUTURE759 North Milwaukee Street
Milwaukee, WI 53202
414/963-9882
Executive Director: Karen Royster
3
The Impact of Teachers' Unions on Student Performance
TABLE OF CONTENTS
I. EXECUTIVE SUMMARY Page 1
II. INTRODUCTION Page 3
III. PRIOR RESEARCH Page 4
IV. METHODOLOGY Page 7
V. ANALYSIS Page 9
VI. CONCLUSION Page 18
VII. APPENDIX Page 20
VIII. REFERENCES Page 21
THE INSTITUTE FOR WISCONSIN'S FUTURE
4
The Impact of Teachers' Unions on Student Performance
I. EXECUTIVE SUMMARY
During this 1996 electoral season, public schools and teachers' unions have been repeatedly
attacked by Republican candidates as the cause of intellectual and moral decline among American
youth. These largely undocumented assertions are situated in the context of a campaign to provide
vouchers for privatized education and create a dual educational system in which more children are
in private schools.
To evaluate these claims, the Institute for Wisconsin's Future initiated an updated review of the
impact of collective bargaining among teachers on the performance levels of school children. This
study examines the impact of collective bargaining along with that of region, family income, race,
school spending and levels of private school attendance. The focus of the study is the relationship
between high, medium and low levels of unionization among teachers and student test scores on the
SAT College Entrance exams and the NAEP fourth grade reading tests in a state-by-state comparison.
The results of this study demonstrate clearly that student performance on the tests is significantly
better in states with high levels of unionization with all other variables held constant. Average student
scores on the SAT exams are 43 points higher in states where over 90% of teachers are unionized
than in states where less than 50% of the teachers are covered by collectivebargaining or meet-
and-confer agreements. Furthermore, when collective bargaining is removed from the analysis,
scores drop in all states. Those factors found to be significantly related to poor performance are:
low household income, race (which is correlated with other measures of socio-economic deprivation),
large class size, high absenteeism, and higher rates of private school attendance.
Our findings accord with numerous earlier research studies which show that collective bargaining
among teachers does not harm student school performance. In the last ten years, school performance
among all children has been improving. Differences in performance occur more between states
than over time periods. In fact, report after report demonstrates that unionization is associated
with more stable, productive school environments with higher test scores. The underlying causes
of poor performance among children are primarily socio-economic factors in children's lives and
the lack of adequate educational resources.
THE INSTITUTE FOR WISCONSIN'S FUTURE PAGE 1
5
The Impact of Teachers' Unions on Student Performance
Public education faces serious problems but teachers organizing to secure decent wages and
working conditions is not one of them. Growing poverty, social instability, high rates of mobility
and household disorganization devastate children's lives. Governmental cuts in resources for
school hiring, teacher training and educational resources have led to larger class size, inadequate
educational materials and reduced programming in many schools. Increased learning disabilities
and behavior problems compound the problems in more crowded classrooms. Advocates of
privatized education claim they will improve student performance by "breaking the educational
monopoly of public schools and teachers' unions." Data from this study demonstrates that "breaking
the unions" will hurt, not help students' performance.
THE INSTITUTE FOR WISCONSIN'S FUTURE PAGE 2
6
The Impact of Teachers' Unions on Student Performance
II. INTRODUCTION
The conservative attack on public education in general and teachers' unions in particular has
grown more heated. Public schools and teachers' unions are held culpable for declining test
scores, failing to prepare students for the workforce, reduced intellectual capacity among
American young people and a deteriorating work ethic. Robert Dole has focused on this issue
in presidential campaign speeches attacking teachers' unions as the principal cause of academic
decline. In a national column, pundit Cal Thomas stated that, "the National Education Association
promotes its own narrow agenda while working against the interest of most children and their
parents." This war on public education and unionized teachers waged through conservative
think tanks and their media spokespersons is based on a viewpoint that public education is a
non-competitive monopoly. According to this analysis, educational improvements can only be
achieved by breaking up the public school monopoly and the monopoly of the teachers' union,
privatizing education and creating a deregulated educational marketplace.
These negative views of public education and the impact of teachers' unions are at variance
with a number of reputable studies that have researched the impact of teacher unionization on
student performance. These studies demonstrate that:
a) scores in many national performance tests are improving, particularly in some regions of
the country;
b) the primary variations in test scores occur between states, not over time;
c) teachers' unions have increased productivity and quality in schools by helping to regulate
working conditions;
d) the real determinants of lower student performance are primarily socio-economic factors
in children's lives and educational resources.
Following a review of this body of research, IWF provides an updated examination of whether
collective bargaining has a negative impact on student performance in a state-by-state analysis
of the relationship between levels of teacher unionization and student scores on two national
tests of student knowledge.
THE INSTITUTE FOR WISCONSIN'S FUTURE PAGE 3
7
The Impact of Teachers' Unions on Student Performance
III. PRIOR RESEARCH
In February, 1990, at the request of the Bush Administration, the Strategic Studies Center at the
Sandia National Laboratory in New Mexico began a comprehensive review of the effectiveness
of K-12 education in the United States. The request was apparently made in the belief that the
Laboratory would find a system of failing K-12 schools, thus providing a rationale for a national
school voucher system.
To the surprise of many K-12 critics, the researchers at Sandia reported the following conclusion in
April, 1992: "Our most detailed analyses to date have focused on popular measures used to
discuss the status of education in America. We looked at data over time to put performance of
the current system in proper perspective. To our surprise, on nearly every measure we found
steady or slightly improving trends". (Carson, Huelskamp, and Woodall, p.259).
A 1996 report by the National Science Foundation found that student achievement in Math and
Science as measured by the National Assessment of Educational Progress exams has improved
for all ethnic groups over the last 15 years. These achievements vary widely from state to state
with some states performing at a level equal to the best performing nations in the world and
some states at a level equal to the worst performing nations. In addition, the racial gap in
performance levels, while still evident, was narrowing.
A 1996 report by the college board indicates that American students continue to improve their
SAT scores. Math scores were the best in more than two decades. The scores on ACT college
entrance tests have also risen. (Tabor; 2/27/96).
In The Manufactured Crisis (1995), authors Berliner and Biddle challenge those who argue that
today's students are not as intelligent or able as students of the past. They offer the following
points: "... since 1932 the mean IQ for white Americans age two to 75 has risen about .3 points
each year (p. 43). Scores for other groups are not available. In the United States, today's youth
probably average about 15 (C) points higher than did their grandparents and 7.5 points higher
than their parents on the Stanford-Binet and Wechsler tests". (p. 43).
THE INSTITUTE FOR WISCONSIN'S FUTURE PAGE 4
8
The Impact of Teachers' Unions on Student Performance
Berliner and Biddle note that "... evidence from the NAEP also does not confirm the myth of a
recent decline in American student achievement. Instead, it indicates a general pattern of stable
achievement combined with modest growth in achievement among students from minority
groups and from 'less advantaged' backgrounds". (pp. 25-26).
In addition to schooling, other factors that determine student performance are social factors
such as family size, household income, race, gender, region and discrimination. In a critical
examination of state and regional variations in SAT performance, Powell and Steelman found
that the decline in national test scores cited by critics of public education did not reflect the
major test score differences between states which are much larger than the decline in test scores
over time. Studies asserting a pattern of lowered College entrance test scores over time have failed
to adjust for the increased number of students taking the tests ascollege education becomes an
option for more than an elite minority. These variations in test score results on a state-by-state basis
were due to factors such as family income, percentage of students taking the test, race, gender,
class size, urbanization, etc. (Powell and Steelman; 1984). In their 1996 study, Powell and Steelman
found that higher per pupil expenditures and lower teacher/student ratios are significantly correlated
with higher test scores on the SAT and ACT exams. Graham and Husted replicated the 1984 Powell
findings in a 1992 comprehensive analysis of test scores and the socio-demographic characteristics
of the test takers and their families. The findings showed that race, sex, income and parents' educational
level are significant determinants of student performance in addition to state participation rates.
Denigration of public schools and their teachers based on studies that do not include these key
variables have no basis in fact. (Graham and Husted; 1993).
Studies on the impact of teacher unionization show that, overall, students benefit. An analysis of
teacher unions and productivity found that union school districts are seven percent more productive
for average students and three percent more effective overall (Ebert and Stone, 1987). Freeman
and Medoff (1979) and other research indicates that unions may increase productivity by reducing
worker turnover in the schools, expanding teacher training opportunities and improving communication
between workers and management. Richard Murnane found that seniority rules for teaching
contracts that base wage levels and job security on seniority promoted the educational goals of
public education more effectively than performance-based contracts. (Murnane; 1987).
A 1991 report by Paul Grimes and Charles Register examines the impact of teachers' unions on
the test performance of African American students on the SAT exam. The article teachers' unions
THE INSTITUTE FOR WISCONSIN'S FUTURE PAGE 5
9
The Impact of Teachers' Unions on Student Performance
and Black Students' Scores on College Entrance Exams demonstrates that external factors
such as class size, size and location of school, race and socio-economic status are significant
factors in determining student test performance and that all students in unionized schools scored
3 percent higher on SAT exams. Holding other factors constant, African-American students in unionized
schools score almost 104 points above the black students in non-union schools. (Grimes and
Register; 1991).
One study by Michael Kurth in 1987 often cited by conservatives contradicts these findings. In a
published comment on the Kurth article, Nelson and Gould (1988) demonstrate that the Kurth
study has serious deficiencies in its methodology. These include a failure to establish a base
relationship between test performance and the level of collective bargaining before Kurth
postulated the increase in collective bargaining as a cause for the fall in test scores. There were
numerous other problems in the methodology:
Kurth misrepresented variations in SAT scores and failed to take into account the percentage
of high school graduates taking the test in each state.
His study used inconsistent and inappropriate timing factors (i.e. the lag time between initial
unionization and that period of impact on student performance).
The research included states with collective bargaining agreements in the block of
non-union states.
The research failed to include variables such as race and gender (factors that Powell and
Steelman had found to be significant indicators of state performance levels in 1984).
The research mistimed the lag effects of social changes such as family size, stability and
levels of parent education. (Nelson and Gould, 1988).
Nelson and Gould corrected many of the problems in the Kurth analysis and found that "the
results clearly indicate that collective bargaining is associated with higher SAT scores no matter
what equation is used ..." (Nelson and Gould, 1988).
Despite the research showing that unions are not responsible for poor test scores, school
violence and all other forms of educational pathology, advocates of privatization continue to
assail public education and teachers. The Institute for Wisconsin's Future initiated this study
to update and re-analyze data on standardized testing by both high school students and grade
school students to assess if collective bargaining among teachers in Wisconsin and other states
negatively impacts the performance of students.
THE INSTITUTE FOR WISCONSIN'S FUTURE PAGE 6
1 0
The Impact of Teachers' Unions on Student Performance
IV. METHODOLOGY
A. Measures of Performance.
This study utilizes the 1995 SAT scores for public and private high school seniors from the
Educational Testing Services as well as scores from the 1994 NAEP grade four reading exams
for public school systems as the indicators for students' performance.
The Scholastic Aptitude Test (now called the Scholastic Assessment Test) was originally normed
in 1941 on a population of 10,654 white males who primarily attended private universities in the
East. The test measures student knowledge in two areas, verbal and mathematical, and is designed to
predict academic success in college. Scores on the SAT are not reported as the number or percent
of correct answers (there are 138 questions), but as a scale score, ranging from 400 to 1,600.
In this study, the SAT scores are adjusted based on the percentage of high school seniors taking
the exams in each state, because in some states a low percentage of test takers (the very best
students who intend to go to out-of-state schools) naturally raises the average score. In some
parts of the country, the ACT is more commonly used than the SAT. Measurement experts who
have investigated the drop in SAT scores have concluded that the most important reason for the
decline was due to the fact that a greater number of students, especially those with weaker high
school records, began to take the SAT. In short, beginning in the mid-1960's, takers of the SAT
became a less elite population of high school students. Thus, in recent years, more than one
million students take the SAT annually. Compare this figure with the 10,654 who originally took
the SAT in 1941.
The National Assessment of Educational Progress (NAEP) reading tests are representative of all
fourth graders in public schools. Since 1969, the NAEP has tested national samples of students
ages nine, thirteen, and seventeen. Only fourth grade reading scores have been released on a
state-by-state basis.
THE INSTITUTE FOR WISCONSIN'S FUTURE PAGE 7
.11
The Impact of Teachers' Unions on Student Performance
B. Dependent Variables.
Union impact is measured by the percentage of teachers in each state covered by either collective
bargaining or meet-and-confer agreements. States are considered highly unionized if over 90%
of teachers are covered by collective bargaining agreements. The state is designated as moderately
unionized state if 50-90% of the teachers are covered by collective bargaining or meet-and-confer
agreements. The state is designated a non-union state if less than 50% of state teachers are
covered by collective bargaining or meet-and-confer agreements. The three-way classification was
created for presentation purposes. The statistical model is based on the percent of teachers in
districts with collective bargaining contracts.
C. Independent Variables
Regression analysis is used to weight the impact of race, income, school expenditures and
urbanization on school performance levels. The percent of high school seniors taking the SAT
test in each state is factored into the analysis and shown as a separate outcome for the SAT
impact analysis.
D. Sources of Data
Test Takers is the percentage of high school graduates taking the SAT, and Test Takers Squared
is the quadratic term necessary to describe the non-linear relationship between Test Takers and
Sat Score identified by Powell and Steelman (1984).
The union variables are based on new data (U.S. Department of Education). Collective Bargaining
and Meet-and-Confer Only are based on 1994 Schools and Staffing Survey from the National
Center for Education Statistics in 1994. The Spending Per Pupil (current expenditures only) is
from the National Center for Education Statistics, 1995. Percent Minority (percentage of test
takers) is data from the Educational Testing Service, 1995.
THE INSTITUTE FOR WISCONSIN'S FUTURE PAGE 8
12
The Impact of Teachers' Unions on Student Performance
V. ANALYSIS
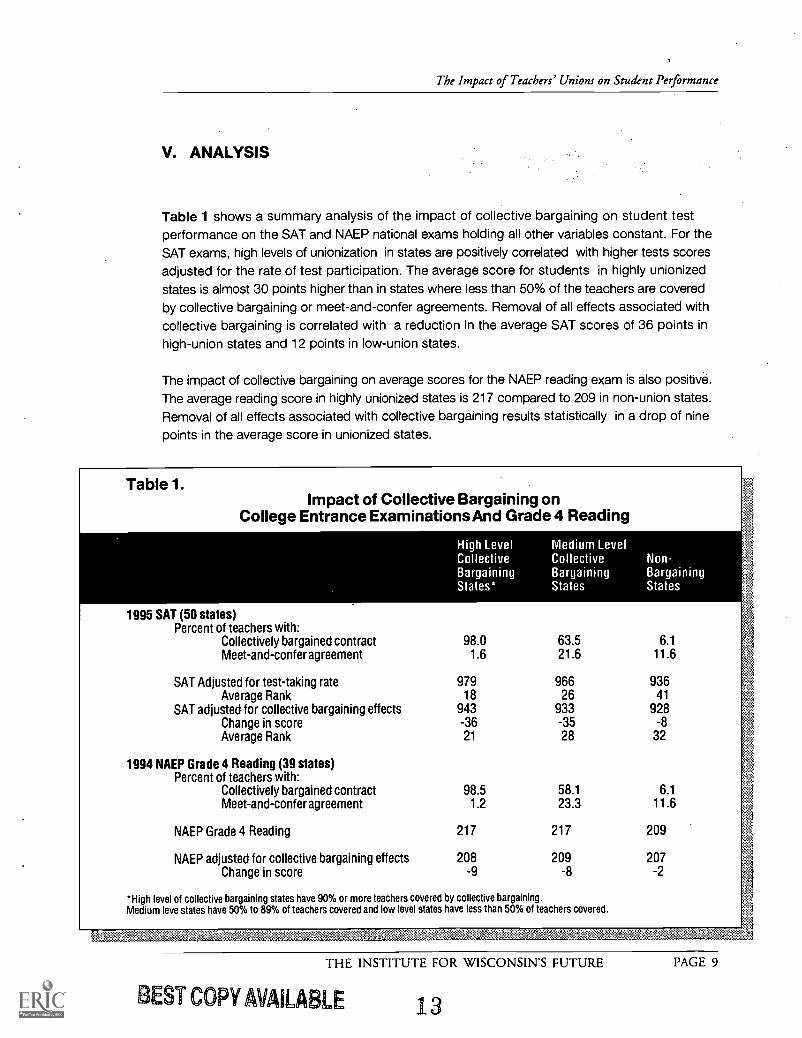
Table 1 shows a summary analysis of the impact of collective bargaining on student testperformance on the SAT and NAEP national exams holding all other variables constant. For theSAT exams, high levels of unionization in states are positively correlated with higher tests scoresadjusted for the rate of test participation. The average score for students in highly unionizedstates is almost 30 points higher than in states where less than 50% of the teachers are coveredby collective bargaining or meet-and-confer agreements. Removal of all effects associated withcollective bargaining is correlated with a reduction in the average SAT scores of 36 points inhigh-union states and 12 points in low-union states.
The impact of collective bargaining on average scores for the NAEP reading exam is also positive.
The average reading score in highly unionized states is 217 compared to 209 in non-union states.Removal of all effects associated with collective bargaining results statistically in a drop of ninepoints in the average score in unionized states.
Table 1.Impact of Collective Bargaining on
College Entrance Examinations And Grade 4 Reading
High LevelCollectiveBargainingStates*
Medium LevelCollective Non-Bargaining BargainingStates States
1995 SAT (50 states)Percent of teachers with:
Collectively bargained contract 98.0 63.5 6.1
Meet-and-confer agreement 1.6 21.6 11.6
SAT Adjusted for test-taking rate 979 966 936Average Rank 18 26 41
SAT adjusted for collective bargaining effects 943 933 928Change in score -36 -35 -8Average Rank 21 28 32
1994 NAEP Grade 4 Reading (39 states)Percent of teachers with:
Collectively bargained contract 98.5 58.1 6.1Meet-and-confer agreement 1.2 23.3 11.6
NAEP Grade 4 Reading 217 217 209
NAEP adjusted for collective bargaining effects 208 209 207Change in score -9 -8 -2
*High level of collective bargaining states have 90% or more teachers covered by collective bargaining.Medium lave states have 50% to 89% of teachers covered and low level states have less than 50% of teachers covered.
BEST COPY AMA re
THE INSTITUTE FOR WISCONSIN'S FUTURE
LE 13
PAGE 9
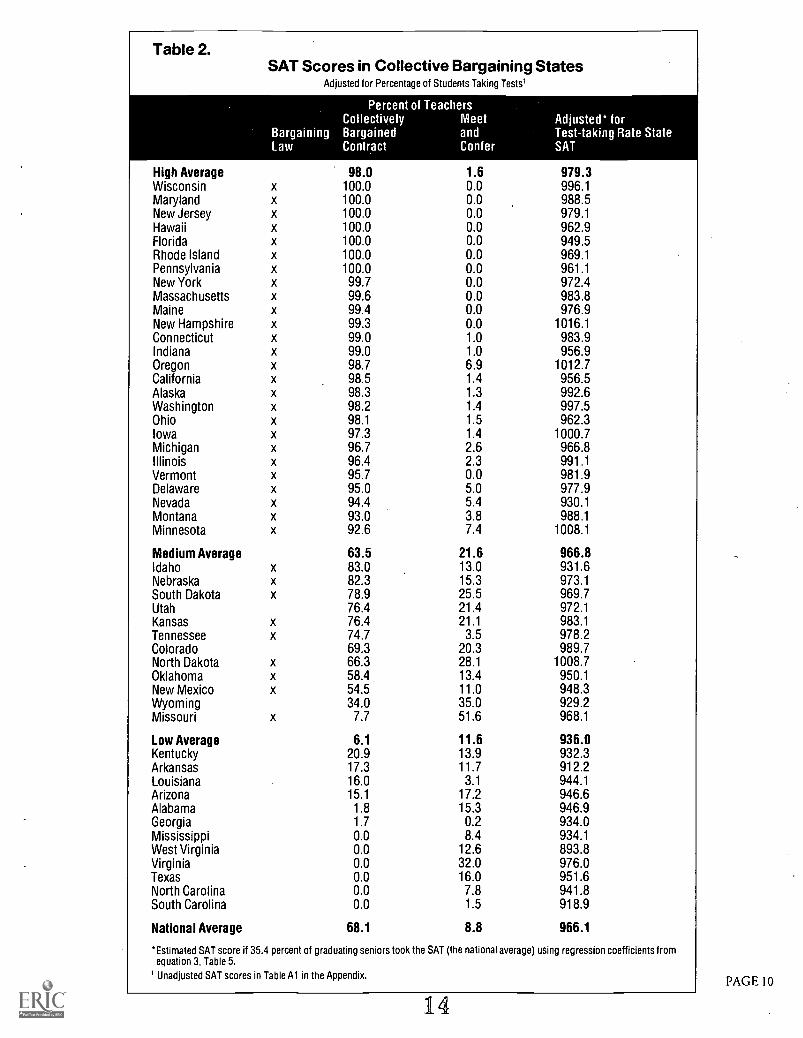
Table 2.SAT Scores in Collective Bargaining States
Adjusted for Percentage of Students Taking Tests'
Percent of Teachers
BargainingLaw
CollectivelyBargainedContract
MeetandConfer
Adjusted* forTest-taking Rate StateSAT
High Average 98.0 1.6 979.3Wisconsin x 100.0 0.0 996.1Maryland x 100.0 0.0 988.5New Jersey x 100.0 0.0 979.1Hawaii x 100.0 0.0 962.9Florida x 100.0 0.0 949.5Rhode Island x 100.0 0.0 969.1Pennsylvania x 100.0 0.0 961.1New York x 99.7 0.0 972.4Massachusetts x 99.6 0.0 983.8Maine x 99.4 0.0 976.9New Hampshire x 99.3 0.0 1016.1Connecticut x 99.0 1.0 983.9Indiana x 99.0 1.0 956.9Oregon x 98.7 6.9 1012.7California x 98.5 1.4 956.5Alaska x 98.3 1.3 992.6Washington x 98.2 1.4 997.5Ohio x 98.1 1.5 962.3Iowa x 97.3 1.4 1000.7Michigan x 96.7 2.6 966.8Illinois x 96.4 2.3 991.1Vermont x 95.7 0.0 981.9Delaware x 95.0 5.0 977.9Nevada x 94.4 5.4 930.1Montana x 93.0 3.8 988.1Minnesota x 92.6 7.4 1008.1
Medium Average 63.5 21.6 966.8Idaho x 83.0 13.0 931.6Nebraska x 82.3 15.3 973.1South Dakota x 78.9 25.5 969.7Utah 76.4 21.4 972.1Kansas x 76.4 21.1 983.1Tennessee x 74.7 3.5 978.2Colorado 69.3 20.3 989.7North Dakota x 66.3 28.1 1008.7Oklahoma x 58.4. 13.4 950.1New Mexico x 54.5 11.0 948.3Wyoming 34.0 35.0 929.2Missouri x 7.7 51.6 968.1
Low Average 6.1 11.6 936.0Kentucky 20.9 13.9 932.3Arkansas 17.3 11.7 912.2Louisiana 16.0 3.1 944.1Arizona 15.1 17.2 946.6Alabama 1.8 15.3 946.9Georgia 1.7 0.2 934.0Mississippi 0.0 8.4 934.1West Virginia 0.0 12.6 893.8Virginia 0.0 32.0 976.0Texas 0.0 16.0 951.6North Carolina 0.0 7.8 941.8South Carolina 0.0 1.5 918.9
National Average 68.1 8.8 966.1
*Estimated SAT score if 35.4 percent of graduating seniors took the SAT (the national average) using regression coefficients fromequation 3, Table 5.
Unadjusted SAT scores in Table Al in the Appendix.
14PAGE 10
The Impact of Teachers' Unions on Student Performance
Table 2 shows the 50 states categorized by the level of teacher unionization correlated with the
SAT scores adjusted for Test Takers and Test Takers Squared. National rankings are shown for
each category. The national average for all states is an adjusted SAT score of 966 and a ranking
of 25th. This table demonstrates that the states with the highest level of teacher unionization
(90% or more of teachers covered by contracts) have an average adjusted SAT score of 979.
States with moderate levels of collective bargaining (50%- 83%) have an average SAT score of
967. Those states with the lowest levels of teacher organization (0 21%) have an averagescore of 936.
On the following page, Table 3 shows the statistical impact of removing effects associated with
collective bargaining from the 50 states on SAT scores. States are divided into the three levels
of union participation for presentation purposes. This table shows that the removal of effects
associated with collective bargaining is correlated with lower scores in all states, even those
with low unionization levels. In states with high levels of collective bargaining (90% +), subtracting
the effects associated with collective bargaining results in a drop in the average SAT score
from 979 to 943. In states with moderate levels of collective bargaining (50% 83%), removal
of collective bargaining effects is tied to a drop in the average score from 967 to 933. In states
with low levels of collective bargaining or meet-and-confer participation ( 0 20%), removal of
all collective bargaining is correlated with a drop in the average SAT score from 936 to 928.
THE INSTITUTE FOR WISCONSIN'S FUTURE PAGE 11
15
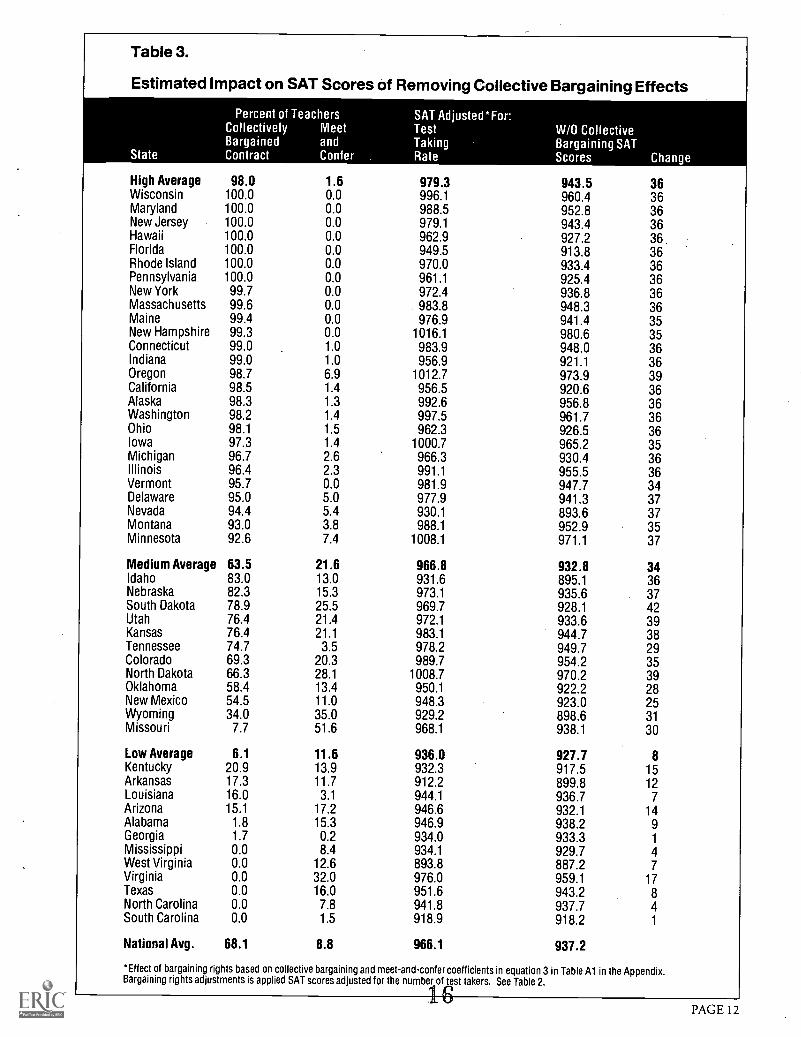
Table 3.
Estimated Impact on SAT Scores of Removing Collective Bargaining Effects
State
Percent of TeachersCollectively MeetBargained andContract Confer
SAT Adjusted*For:TestTakingRate
W/0 CollectiveBargaining SATScores Change
High Average 98.0 1.6 979.3 943.5 36Wisconsin 100.0 0.0 996.1 960.4 36Maryland 100.0 0.0 988.5 952.8 36New Jersey 100.0 0.0 979.1 943.4 36Hawaii 100.0 0.0 962.9 927.2 36Florida 100.0 0.0 949.5 913.8 36Rhode Island 100.0 0.0 970.0 933.4 36Pennsylvania 100.0 0.0 961.1 925.4 36New York 99.7 0.0 972.4 936.8 36Massachusetts 99.6 0.0 983.8 948.3 36Maine 99.4 0.0 976.9 941.4 35New Hampshire 99.3 0.0 1016.1 980.6 35Connecticut 99.0 1.0 983.9 948.0 36Indiana 99.0 1.0 956.9 921.1 36Oregon 98.7 6.9 1012.7 973.9 39California 98.5 1.4 956.5 920.6 36Alaska 98.3 1.3 992.6 956.8 36Washington 98.2 1.4 997.5 961.7 36Ohio 98.1 1.5 962.3 926.5 36Iowa 97.3 1.4 1000.7 965.2 35Michigan 96.7 2.6 966.3 930.4 36Illinois 96.4 2.3 991.1 955.5 36Vermont 95.7 0.0 981.9 947.7 34Delaware 95.0 5.0 977.9 941.3 37Nevada 94.4 5.4 930.1 893.6 37Montana 93.0 3.8 988.1 952.9 35Minnesota 92.6 7.4 1008.1 971.1 37
Medium Average 63.5 21.6 966.8 932.8 34Idaho 83.0 13.0 931.6 895.1 36Nebraska 82.3 15.3 973.1 935.6 37South Dakota 78.9 25.5 969.7 928.1 42Utah 76.4 21.4 972.1 933.6 39Kansas 76.4 21.1 983.1 944.7 38Tennessee 74.7 3.5 978.2 949.7 29Colorado 69.3 20.3 989.7 954.2 35North Dakota 66.3 28.1 1008.7 970.2 39Oklahoma 58.4 13.4 950.1 922.2 28New Mexico 54.5 11.0 948.3 923.0 25Wyoming 34.0 35.0 929.2 898.6 31Missouri 7.7 51.6 968.1 938.1 30
Low Average 6.1 11.6 936.0 927.7 8Kentucky 20.9 13.9 932.3 917.5 15Arkansas 17.3 11.7 912.2 899.8 12Louisiana 16.0 3.1 944.1 936.7 7Arizona 15.1 17.2 946.6 932.1 14Alabama 1.8 15.3 946.9 938.2 9Georgia 1.7 0.2 934.0 933.3 1
Mississippi 0.0 8.4 934.1 929.7West Virginia 0.0 12.6 893.8 887.2 7Virginia 0.0 32.0 976.0 959.1 17Texas 0.0 16.0 951.6 943.2 8North Carolina 0.0 7.8 941.8 937.7 4South Carolina 0.0 1.5 918.9 918.2 1
National Avg. 68.1 8.8 966.1 937.2
Effect of bargaining rights based on collective bargaining and meet-and-confer coefficients in equation 3 in Table Al in the Appendix.Bargaining rights adjustments is applied SAT scores adjusted for the number of
6test takers. See Table 2.
PAGE 12
The Impact of Teachers' Unions on .Student Performance
On the next page, Table 4 shows the NAEP test results for 39 states grouped in levels of teacher
participation in collective bargaining and the statistical impact of removing collective bargaining
on NAEP scores in those states. Thirteen states did not participate in the grade four reading
tests. This table demonstrates that the states with the highest level of teacher unionization
(90% +) have an average adjusted NAEP score of 217. States with moderate levels of collective
bargaining (50%- 83%) have an average NAEP score of 217 and those states with the lowest
levels of teacher organization (0 21%) have an average score of 209. The national average for
all states is a NAEP score of 214.
This table also indicates that the removal of effects associated with bargaining is correlated with
lower scores in all states, even those with low unionization levels. In states with high levels of
collective bargaining (90%+), the elimination of collective bargaining is correlated with a drop in
the average SAT score from 217 to 208. In states with moderate levels of collective bargaining
(50% 83%), removal of unionization is correlated with a drop in the average score from 217
to 209. In states with low levels of collective bargaining or meet-and-confer participation (0 20%),
removal of all collective bargaining effects results in a statistical drop in the average NAEP score
from 209 to 207. The national average for all students without collective bargaining drops statistically
from 214 to 208.
Regression Analysis
Thus far, we have adjusted average test scores for the effect of collective bargaining on school
performance. The impact of collective bargaining indicated in the preceding tables takes into
account other factors impacting school performance such as household income, class size,
urbanization and region by using regression analysis. The regression analysis tables below
describe the additional impact of these variables.
There are two models in this regression analysis: the first is one without collective bargaining,
which looks solely at background factors; the second model includes collective bargaining and
the set of factors. To understand how variables interact, no one factor can be analyzed alone.
It is necessary to control for other variables through a numerical weighting process.
THE INSTITUTE FOR WISCONSIN'S FUTURE PAGE 13
17
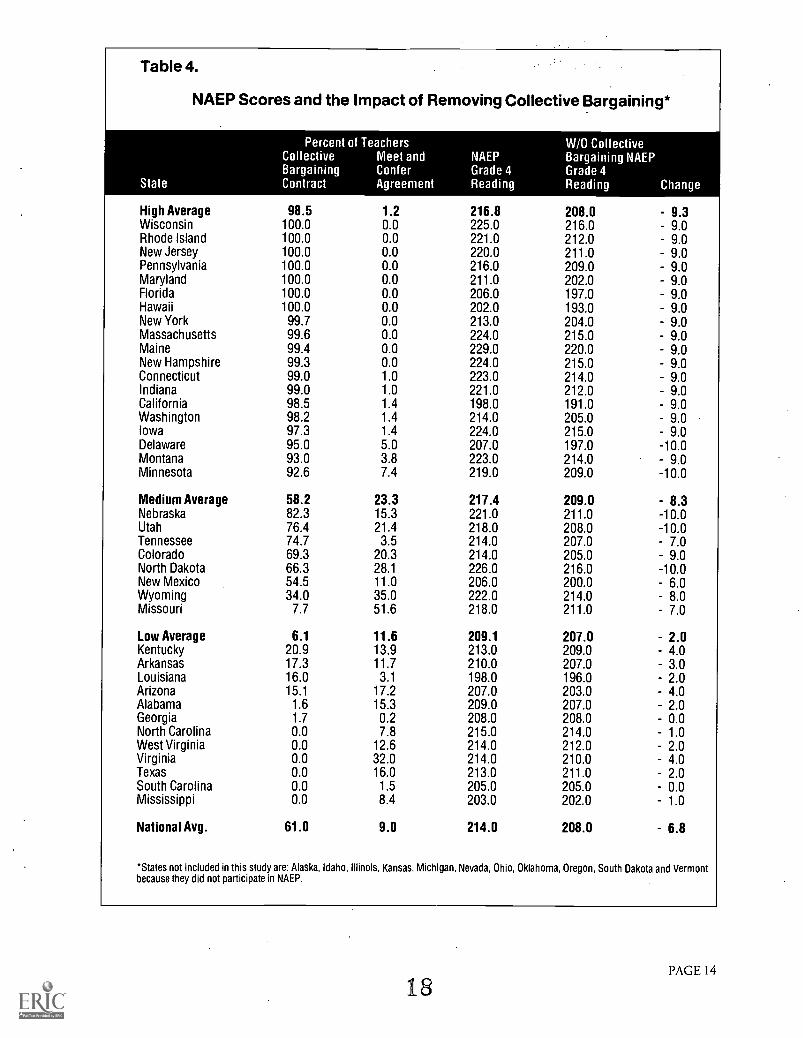
Table 4.
NAEP Scores and the Impact of Removing Collective Bargaining*
State
Percent of TeachersCollective Meet andBargaining ConferContract Agreement
NAEPGrade 4Reading
W/O CollectiveBargaining NAEPGrade 4Reading Change
High Average 98.5 1.2 216.8 208.0 - 9.3Wisconsin 100.0 0.0 225.0 216.0 9.0Rhode Island 100.0 0.0 221.0 212.0 9.0New Jersey 100.0 0.0 220.0 211.0 9.0Pennsylvania 100.0 0.0 216.0 209.0 9.0Maryland 100.0 0.0 211.0 202.0 9.0Florida 100.0 0.0 206.0 197.0 9.0Hawaii 100.0 0.0 202.0 193.0 9.0New York 99.7 0.0 213.0 204.0 9.0Massachusetts 99.6 0.0 224.0 215.0 9.0Maine 99.4 0.0 229.0 220.0 9.0New Hampshire 99.3 0.0 224.0 215.0 9.0Connecticut 99.0 1.0 223.0 214.0 9.0Indiana 99.0 1.0 221.0 212.0 9.0California 98.5 1.4 198.0 191.0 9.0Washington 98.2 1.4 214.0 205.0 9.0Iowa 97.3 1.4 224.0 215.0 9.0Delaware 95.0 5.0 207.0 197.0 -10.0Montana 93.0 3.8 223.0 214.0 9.0Minnesota 92.6 7.4 219.0 209.0 -10.0
Medium Average 58.2 23.3 217.4 209.0 - 8.3Nebraska 82.3 15.3 221.0 211.0 -10.0Utah 76.4 21.4 218.0 208.0 -10.0Tennessee 74.7 3.5 214.0 207.0 7.0Colorado 69.3 20.3 214.0 205.0 9.0North Dakota 66.3 28.1 226.0 216.0 -10.0New Mexico 54.5 11.0 206.0 200.0 6.0Wyoming 34.0 35.0 222.0 214.0 8.0Missouri 7.7 51.6 218.0 211.0 7.0
Low Average 6.1 11.6 209.1 207.0 - 2.0Kentucky 20.9 13.9 213.0 209.0 4.0Arkansas 17.3 11.7 210.0 207.0 3.0Louisiana 16.0 3.1 198.0 196.0 2.0Arizona 15.1 17.2 207.0 203.0 4.0Alabama 1.6 15.3 209.0 207.0 2.0Georgia 1.7 0.2 208.0 208.0 0.0North Carolina 0.0 7.8 215.0 214.0 1.0West Virginia 0.0 12.6 214.0 212.0 2.0Virginia 0.0 32.0 214.0 210.0 4.0Texas 0.0 16.0 213.0 211.0 2.0South Carolina 0.0 1.5 205.0 205.0 0.0Mississippi 0.0 8.4 203.0 202.0 1.0
National Avg. 61.0 9.0 214.0 208.0 - 6.8
*States not included in this study are: Alaska, Idaho, Illinois, Kansas, Michigan, Nevada, Ohio, Oklahoma, Oregon, South Dakota and Vermontbecause they did not participate in NAEP.
PAGE 14
18
The Impact of Teachers' Unions on Student Performance
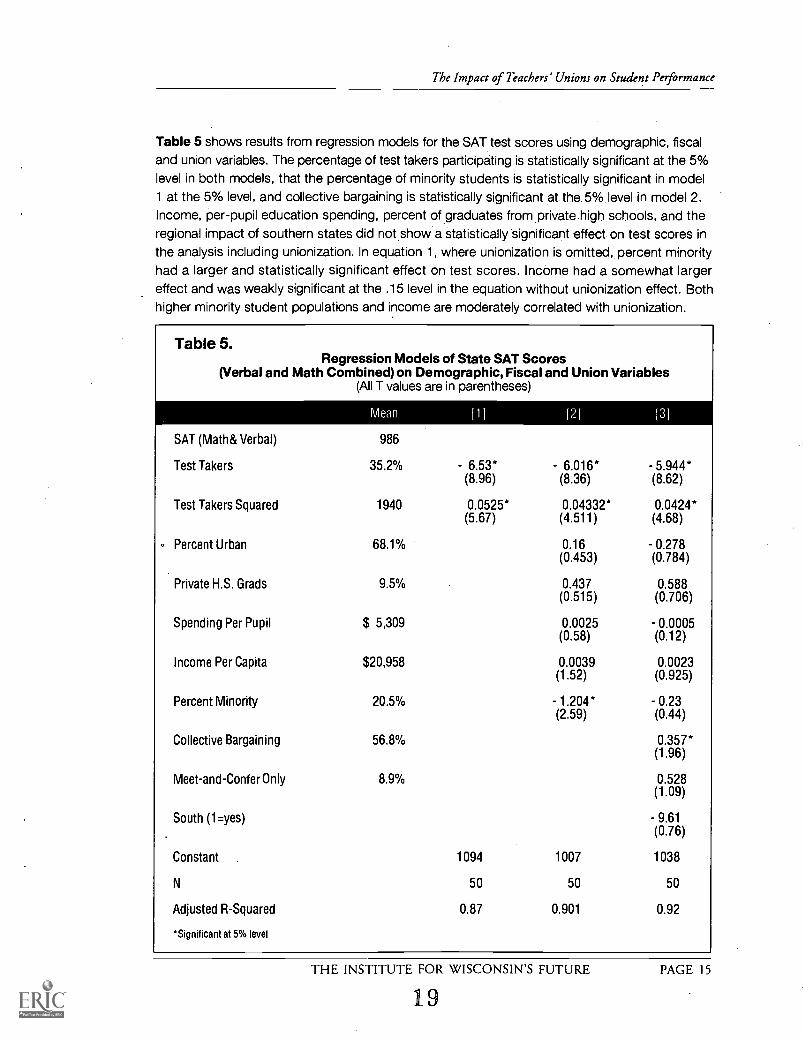
Table 5 shows results from regression models for the SAT test scores using demographic, fiscaland union variables. The percentage of test takers participating is statistically significant at the 5%
level in both models, that the percentage of minority students is statistically significant in model1 at the 5% level, and collective bargaining is statistically significant at the 5% level in model 2.Income, per-pupil education spending, percent of graduates from private high schools, and theregional impact of southern states did not show a statistically significant effect on test scores inthe analysis including unionization. In equation 1, where unionization is omitted, percent minorityhad a larger and statistically significant effect on test scores. Income had a somewhat largereffect and was weakly significant at the .15 level in the equation without unionization effect. Bothhigher minority student populations and income are moderately correlated with unionization.
Table 5.Regression Models of State SAT Scores
(Verbal and Math Combined) on Demographic, Fiscal and Union Variables(All T values are in parentheses)
Mean [1] 12] 131
SAT (Math& Verbal)
Test Takers
Test Takers Squared
986
35.2%
1940
6.53*(8.96)
0.0525*(5.67)
6.016*(8.36)
0.04332*(4.511)
5.944*(8.62)
0.0424*(4.68)
Percent Urban 68.1% 0.16 0.278(0.453) (0.784)
Private H.S. Grads 9.5% 0.437 0.588(0.515) (0.706)
Spending Per Pupil $ 5,309 0.0025 0.0005(0.58) (0.12)
Income Per Capita $20,958 0.0039 0.0023(1.52) (0.925)
Percent Minority 20.5% 1.204* 0.23(2.59) (0.44)
Collective Bargaining 56.8% 0.357*(1.96)
Meet-and-Confer Only 8.9% 0.528(1.09)
South (1=yes) 9.61(0.76)
Constant 1094 1007 1038
N 50 50 50
Adjusted R-Squared 0.87 0.901 0.92
*Significant at 5% level
THE INSTITUTE FOR WISCONSIN'S FUTURE
19PAGE 15
The Impact of Teachers' Unions on Student Performance
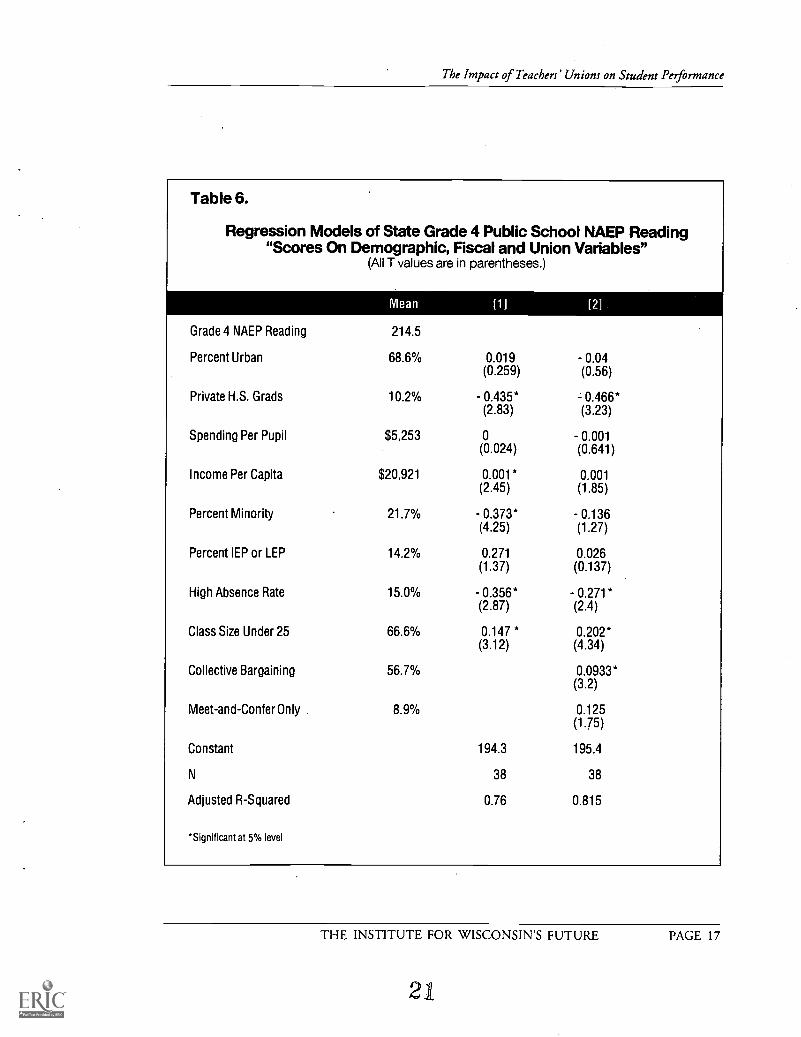
On the following page, the regression models for the NAEP test scores using demographic, fiscal and
union variables show somewhat different results in Table 6 but the correlation between unionization
and higher test results is clear. The differences in results are not surprising since the NAEP test
measures the achievement of all 4th grade students, not just the college bound. In this analysis,
the percent of students in the states graduating from private schools is negatively correlated
with high test scores. The larger the number of students in private schools, the poorer the test
scores. This result is statistically significant at the 5% level. In bivariate analysis, income per
capita in the state is positively related to higher test scores via other variables in the regression
model. Percent of minority students is also negatively correlated with higher test scores at a
significant level without collective bargaining. When collective bargaining is factored in, minority
fades to insignificance. High absence rates in a state is correlated with lower test scores at a
significant level. The percentage of children in classes of less than 25 is correlated with higher
test scores at a statistically significant level. Collective bargaining is also significant with higher
levels of collective bargaining associated with higher test scores. (See Table A2 in the Appendix.)
Results Considering All Evidence, SAT and NAEP
Taking into account evidence from the NAEP 4th Grade reading test and the more limited SAT
college boards, there is strong evidence that there is a positive relationship between collective
bargaining and higher scores in both the SAT and NAEP tests. Income is a significant factor for
the SAT scores. For the NAEP reading scores, low income, large class size, high absence rates,
minority enrollment, and the level of private school attendance are correlated with low performance
levels at the state level.
Data indicates that states with collective bargaining have SAT scores, adjusted for the percentage of
high school test takers, almost 40 points higher than the states with minimal collective bargaining
or meet-and-confer rights and the statistical impact of removing collective bargaining is a drop
in state performance levels of 35 points in the average state score. The same results are
demonstrated for the NAEP test where states with high levels of collective bargaining show
test results nine points higher than states with low levels of collective bargaining. The removal of
all collective bargaining from all states is associated with a seven point drop in scores for all
fourth grade students.
THE INSTITUTE FOR WISCONSIN'S FUTURE PAGE 16
20
The Impact of Teachers' Unions on Student Performance
Table 6.
Regression Models of State Grade 4 Public School NAEP Reading"Scores On Demographic, Fiscal and Union Variables"
(All T values are in parentheses.)
Mean [1] [2]
Grade 4 NAEP Reading 214.5
Percent Urban 68.6% 0.019 0.04(0.259) (0.56)
Private H.S. Grads 10.2% 0.435* - 0.466*(2.83) (3.23)
Spending Per Pupil $5,253 0 0.001(0.024) (0.641)
Income Per Capita $20,921 0.001* 0.001(2.45) (1.85)
Percent Minority 21.7% 0.373* 0.136(4.25) (1.27)
Percent IEP or LEP 14.2% 0.271 0.026(1.37) (0.137)
High Absence Rate 15.0% 0.356* 0.271*(2.87) (2.4)
Class Size Under 25 66.6% 0.147 * 0.202*(3.12) (4.34)
Collective Bargaining 56.7% 0.0933*(3.2)
Meet-and-Confer Only 8.9% 0.125(1.75)
Constant 194.3 195.4
N 38 38
Adjusted R-Squared 0.76 0.815
*Significant at 5% level
THE INSTITUTE FOR WISCONSIN'S FUTURE PAGE 17
21
The Impact of Teachers' Unions on Student Performance
VI. CONCLUSION
The data generated in this study demonstrate that collective bargaining is not responsible for poor
student performance. In fact, in states with high levels of teacher unionization, student scores on
standardized tests are higher than in states with low levels of teacher participation in collective
bargaining or meet-and-confer activities. There are many possible explanations for the higher
scores obtained in states with unionized schools. Through negotiations, unionized teachers have
more leverage over conditions that impact school performance such as class size, academic
resources, teacher training, academic and social support services than non-union educators. In
addition, higher wages and benefits, as well as negotiated grievance procedures obtained through
unionization, create a work environment that encourages teacher stability and commitment, essential
characteristics of an effective school.
Socio-economic factors such as low household income, large class size, high rates of absenteeism,
higher percentages of minority students and larger numbers of persons graduating from private
schools are significantly correlated with lower test scores. After controlling for these variables, the
impact of unionization changes little.
In short:
Collective bargaining is not a destructive force in public education. Students have higher
test scores in unionized states.
Contrary to the claim of privatization advocates, there is no evidence that increased
competition from private schools improves public school performance.
Socio-economic factors are the crucial factors in determining student performance.
Class size matters. Smaller classes are correlated with improved test performance.
Public education faces a number of serious problems that do impact children's education and
performance. Efforts by teachers to organize for decent wages and working condition standards
is not one of them. Poverty rates among children continue to rise across the country. Social and
financial instability contributes to high rates of mobility and disorganization, particularly among
low-income households. Federal and state budget cuts have led to a reduction in resources for
school hiring, teacher training, and educational resources resulting in larger class size with inadequate
THE INSTITUTE FOR WISCONSIN'S FUTURE PAGE 18
22
The Impact of Teachers' Unions on Student Performance
programming in many schools. Often, social and economic deprivation lead to increased learning
disabilities and behavior problems which compound the difficulties encountered in more crowded
classrooms and schools.
The criticisms leveled at teachers' unions are generally tied to an overall negative assessment of
public education and proposals to privatize education. These advocates claim that privatized
education will improve student performance by "breaking the educational monopoly of public
schools and teachers' unions." Data from this study demonstrates that "breaking the unions" will
hurt, not help, student performance. The issues that must be faced and dealt with are more
fundamental. The public school system is a crucial institution established to educate children
from numerous and diverse communities. To provide a quality education for these children
requires the school system to adapt and respond effectively to pervasive and difficult social conditions.
Fragmenting the system, reducing resources and jeopardizing the stability of the teaching staff
will not further this goal.
THE INSTITUTE FOR WISCONSIN'S FUTURE PAGE 19
23
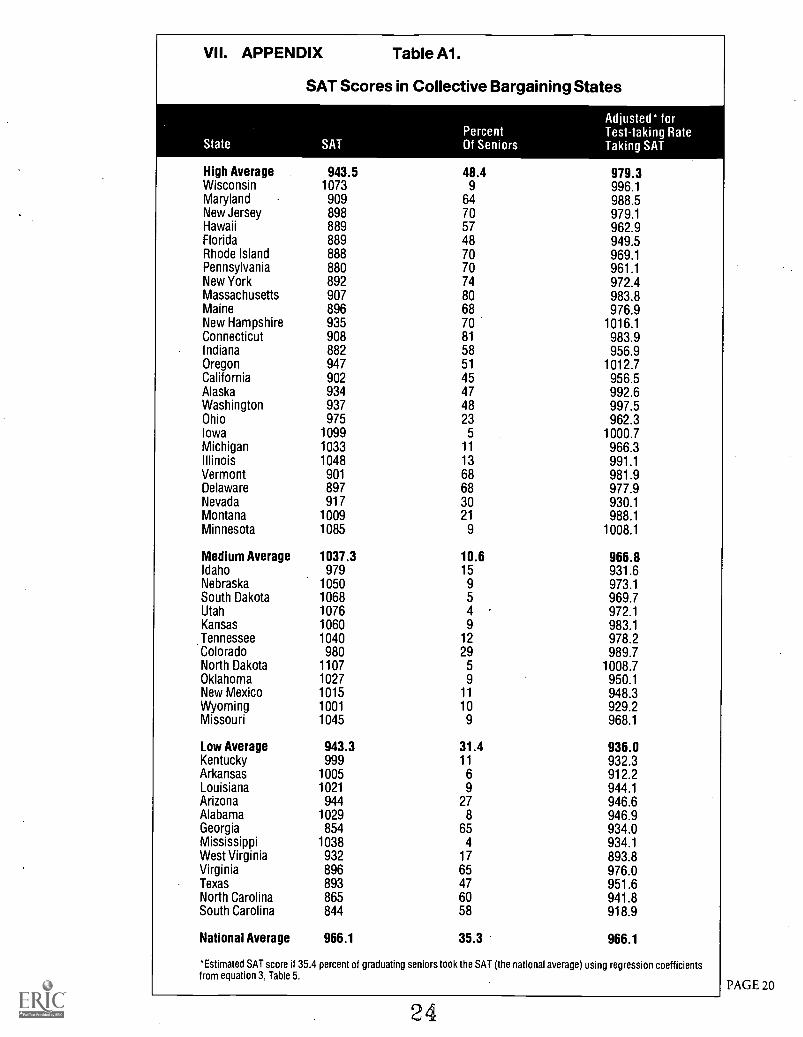
VII. APPENDIX Table A1.
SAT Scores in Collective Bargaining States
State SATPercentOf Seniors
Adjusted* forTest-taking RateTaking SAT
High Average 943.5 48.4 979.3Wisconsin 1073 9 996.1Maryland 909 64 988.5New Jersey 898 70 979.1Hawaii 889 57 962.9Florida 889 48 949.5Rhode Island 888 70 969.1Pennsylvania 880 70 961.1New York 892 74 972.4Massachusetts 907 80 983.8Maine 896 68 976.9New Hampshire 935 70 1016.1Connecticut 908 81 983.9Indiana 882 58 956.9Oregon 947 51 1012.7California 902 45 956.5Alaska 934 47 992.6Washington 937 48 997.5Ohio 975 23 962.3Iowa 1099 5 1000.7Michigan 1033 11 966.3Illinois 1048 13 991.1Vermont 901 68 981.9Delaware 897 68 977.9Nevada 917 30 930.1Montana 1009 21 988.1Minnesota 1085 9 1008.1
Medium Average 1037.3 10.6 966.8Idaho 979 15 931.6Nebraska 1050 9 973.1South Dakota 1068 5 969.7Utah 1076 4 972.1Kansas 1060 9 983.1Tennessee 1040 12 978.2Colorado 980 29 989.7North Dakota 1107 5 1008.7Oklahoma 1027 9 950.1New Mexico 1015 11 948.3Wyoming 1001 10 929.2Missouri 1045 9 968.1
Low Average 943.3 31.4 936.0Kentucky 999 11 932.3Arkansas 1005 6 912.2Louisiana 1021 9 944.1Arizona 944 27 946.6Alabama 1029 8 946.9Georgia 854 65 934.0Mississippi 1038 4 934.1West Virginia 932 17 893.8Virginia 896 65 976.0Texas 893 47 951.6North Carolina 865 60 941.8South Carolina 844 58 918.9
National Average 966.1 35.3 966.1
*Estimated SAT score if 35.4 percent of graduating seniors took the SAT (the national average) using regression coefficientsfrom equation 3, Table 5.
24PAGE 20
The Impact of Teachers' Unions on Student Performance
VIII. REFERENCES
Berliner, David C. and Bruce J. Biddle. The Manufactured Crisis. New York, NY: Addison-Wesley,1995.
Carson, CC., R.M. Huelskamp, and T.D. Woodall. "Perspectives on Education in America: AnAnnotated Briefing." The Journal of Educational Research 86 (May/June 1993).
Eberts, Randall W. and Joe A. Stone. "Teacher Unions and the Productivity of Public Schools."Industrial and Labor Relations Review 40 (April 1987): 354-363.
Freeman, Richard and James Medoff. "Two Faces of Unionism." The Public Interest 57 (1979): 69-93.
Graham, Amy E. and Thomas A. Husted. "Understanding State Variations in SAT Scores."Economics of Education Review 12 (1993): 197-202.
Grimes, Paul and Charles Register. "Teachers' Unions and Black Students' Scores on CollegeEntrance Exams." Industrial Relations (Fall 1991): 492-499.
Kurth, Michael. "Teachers' Unions and Excellence in Education: An Analysis of the Decline inSAT Scores." Journal of Labor Research 8 (Fall 1987): 351-367.
Murnane, Richard. "Seniority Rules and Educational Productivity: Understanding the Consequenceof a Mandate for Equality." American Journal of Education (November 1981): 14-38.
Nelson, F. Howard and Jewell C. Gould. "Teachers' Unions and Excellence in Education: Comment."Journal of Labor Research 9 (Fall 1988): 379-387.
Powell, Brian and Lala Carr Steelman. "Bewitched, Bothered and Bewildering: The Use and Misuseof State SAT and ACT Scores." Harvard Educational Review (Spring 1996): 27-59.
Powell, Brian and Lala Carr Steelman. "Variations in State SAT Performance: Meaningful orMisleading?" Harvard Educational Review 54 (November 1984): 389-410.
Tabor, Mary B. W. "S.A.T. Ranks for the States are Disputed." New York Times (27 March 1996): 8.
THE INSTITUTE FOR WISCONSIN'S FUTURE PAGE 21
25
U.S. Department of EducationOffice of Educational Research and Improvement (OERI)
Educational Resources Information Center (ERIC)
REPRODUCTION RELEASE(Specific Document)
I. DOCUMENT IDENTIFICATION:
7
Title:
fig -t rct-aiL 41 t OA). -% 0-4-1 ,01Author(s):
Corporate Source: Publication Date:
II. REPRODUCTION RELEASE:In order to disseminate as widely as possible timely and significant materials of interest to the educational community, documents announced
in the monthly abstract journal of the ERIC system, Resources in Education (RIE), are usually made available to users in microfiche, reproducedpaper copy, and electronic/optical media, and sold through the ERIC Document Reproduction Service (EDRS) or other ERIC vendors. Credit isgiven to the source of each document, and, if reproduction release is granted, one of the following notices is affixed to the document.
If permission is granted to reproduce and disseminate the identified document, please CHECK ONE of the following two options and sign atthe bottom of the page.
Check hereFor Level 1 Release:Permitting reproduction inmicrofiche (4" x 6' film) orother ERIC archival media(e.g., electronic or optical)and paper copy.
The sample sticker shown below will beaffixed to all Level 1 documents
PERMISSION TO REPRODUCE ANDDISSEMINATE THIS MATERIAL
HAS BEEN GRANTED BY
\e
TO THE EDUCATIONAL RESOURCESINFORMATION CENTER (ERIC)
Level 11
The sample sticker shown below will beaffixed to all Level 2 documents
PERMISSION TO REPRODUCE ANDDISSEMINATE THIS
MATERIAL IN OTHER THAN PAPERCOPY HAS BEEN GRANTED BY
TO THE EDUCATIONAL RESOURCESINFORMATION CENTER (ERIC)
Level 2
Documents will be processed as indicated provided reproduction quality permits. If permissionto reproduce is granted, but neither box is checked, documents will be processed at Level 1.
Check hereFor Level 2 Release:Permitting reproduction inmicrofiche (4" x 6" film) orother ERIC archival media(e.g., electronic or optical),but not in paper copy.
"I hereby grant to the Educational Resources Information Center (ERIC) nonexclusive permission to reproduce and disseminatethis document as indicated above. Reproduction from the ERIC microfiche or electronic/optical media by persons other thanERIC employees and its system contractors requires permission from the copyright holder. Exception is made for non-profitreproduction by libraries and other service agencies to satisfy information needs of educators in response to discrete inquiries.'
Sign Signature:
here)please _1212.iaaN.,.
MTHE INSTITUTE FORWISCONSIN'S FUTURE
531 EAST BURLEIGH ST.MILWAUKEE, WI 53212
Printed Name/Pos
S4 .0Telephone:
E-Mail Address:
ition/Title: Cu ifyl t .1(
Ccorci,AJ9. -tor'ca:ggsa 9ol-6177- p9
Date:
/////96,(over)
III. DOCUMENT AVAILABILITY INFORMATION (FROM NON-ERIC SOURCE):
If permission to reproduce is not granted to ERIC, or, if you wish ERIC to cite the availability of the document from another source,please provide the following information regarding the availability of the document. (ERIC will not announce a document unless it ispublicly available, and a dependable source can be specified. Contributors should also, be aware that ERIC selection criteria aresignificantly more stringent for documents that cannot be made available through EDRS.)
Publisher/Distributor:
Address:
Price:
IV. REFERRAL OF ERIC TO COPYRIGHT/REPRODUCTION RIGHTS HOLDER:
If the right to grant reproduction release is held by someone other than the addressee, please provide the appropriate name and address:
Name:
Address:
V. WHERE TO SEND THIS FORM:
Send this form to the following ERIC Clearinghouse:
However, if solicited by the ERIC Facility, or if making an unsolicited contribution to ERIC, return this form (and the document beingcontributed) to:
ERIC Processing and Reference Facility1100 West Street, 2d Floor
Laurel, Maryland 20707-3598
Telephone: 301-497-4080Toll Free: 800-799-3742
FAX: 301-953-0263e-mail: [email protected]
WWW: http://ericfac.piccard.csc.com(Rev. 6/96)