Embed Size (px)
Citation preview
Eagle Mine Site VisitNovember 3-4, 2014
Cautionary Statements
Caution Regarding Forward Looking Statements
This presentation contains forward-looking statements. These forward-looking statements arenot based on historical facts, but rather on current expectations and projections about futureevents. These forward-looking statements are subject to risks and uncertainties. These risksand uncertainties could cause actual results to differ materially from the future resultsexpressed or implied by the forward-looking statements.
Such risks may include, without limitation: risks and uncertainties relating to foreign currencyfluctuations; risks inherent in mining including environmental hazards, unusual or unexpectedgeological formations, ground control problems and flooding; risks associated with theestimation of mineral resources and reserves and the geology, grade and continuity of mineraldeposits; the possibility that future exploration, development or mining results will not beconsistent with the Company’s expectations; the potential for and effects of labor disputes orother unanticipated difficulties with or shortages of labor or interruptions in production; actualore mined varying from estimates of grade, tonnage, dilution and metallurgical and othercharacteristics; the inherent uncertainty of production and cost estimates and the potential forunexpected costs and expenses; and commodity price fluctuations.
For further details of other risks and uncertainties see Risk Factors Relating to the Company’sBusiness in the Company’s Annual Information Form and in each management discussion andanalysis.
Note: All dollar amounts are in US dollars unless otherwise denoted.
2
Table of Contents
• Introduction
•Safety, Environment & Social Responsibility
•Project Overview
•Exploration
•Corporate Update
3
INTRODUCTION(Mike Welch)
4
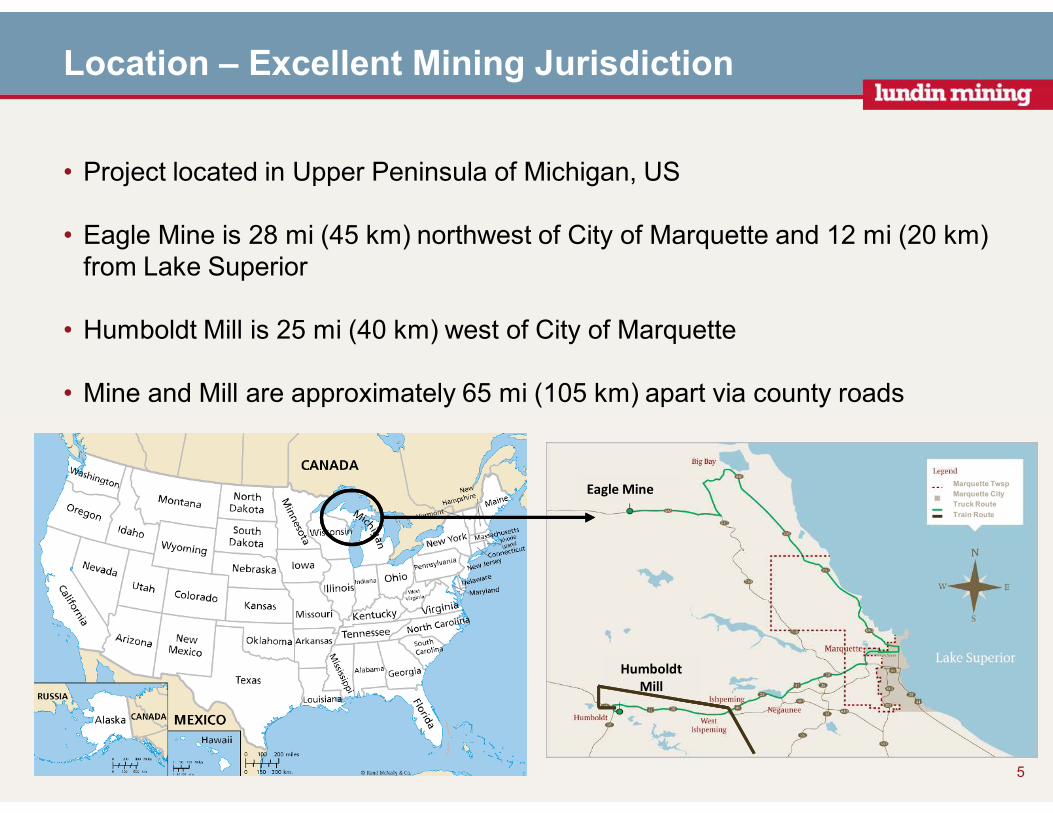
• Project located in Upper Peninsula of Michigan, US
• Eagle Mine is 28 mi (45 km) northwest of City of Marquette and 12 mi (20 km) from Lake Superior
• Humboldt Mill is 25 mi (40 km) west of City of Marquette
• Mine and Mill are approximately 65 mi (105 km) apart via county roads
Marquette Twsp
Marquette City
Truck Route
Train Route
Location – Excellent Mining Jurisdiction
5
Eagle Mine
Humboldt
Mill
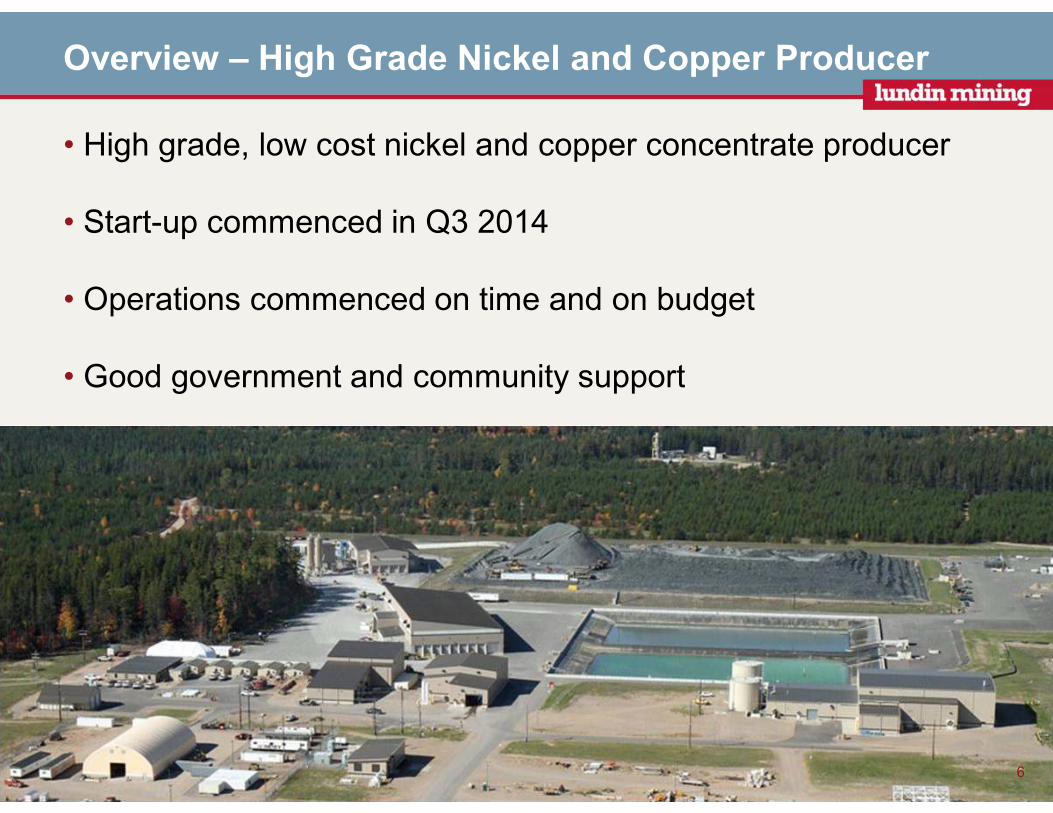
Overview – High Grade Nickel and Copper Producer
• High grade, low cost nickel and copper concentrate producer
• Start-up commenced in Q3 2014
• Operations commenced on time and on budget
• Good government and community support
6
Health & Safety
7
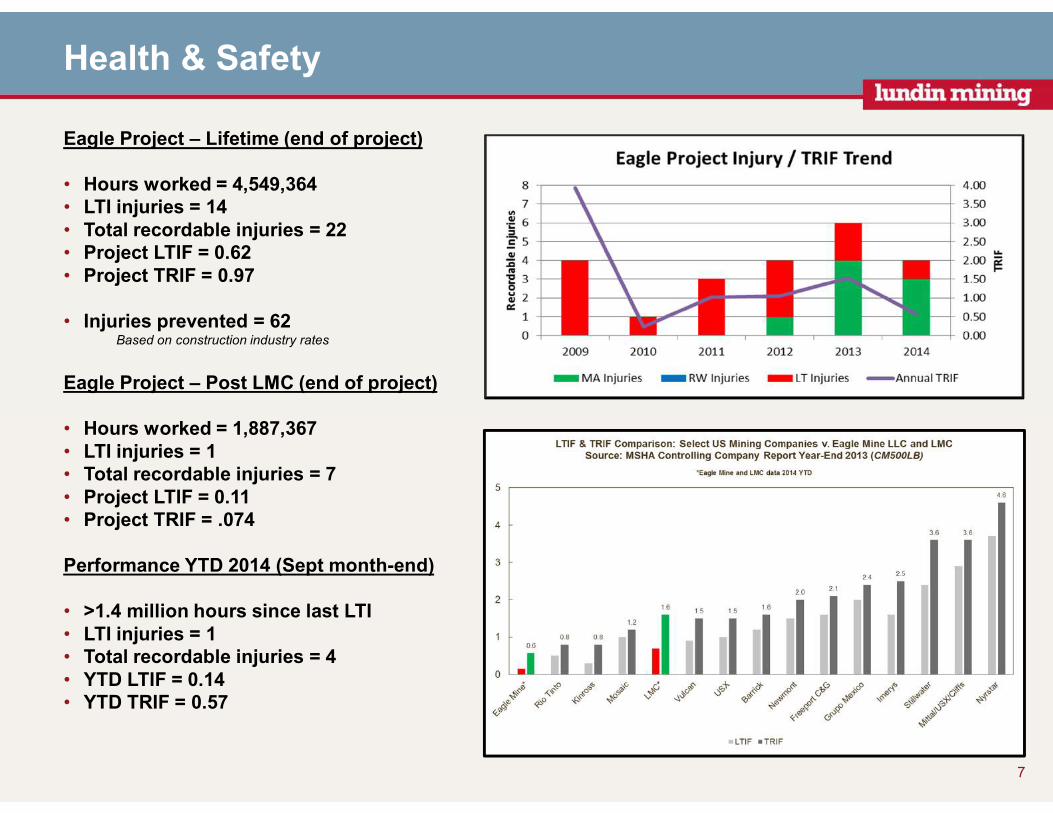
Eagle Project – Lifetime (end of project)
• Hours worked = 4,549,364• LTI injuries = 14• Total recordable injuries = 22• Project LTIF = 0.62• Project TRIF = 0.97
• Injuries prevented = 62Based on construction industry rates
Eagle Project – Post LMC (end of project)
• Hours worked = 1,887,367• LTI injuries = 1• Total recordable injuries = 7• Project LTIF = 0.11• Project TRIF = .074
Performance YTD 2014 (Sept month-end)
• >1.4 million hours since last LTI• LTI injuries = 1 • Total recordable injuries = 4• YTD LTIF = 0.14• YTD TRIF = 0.57
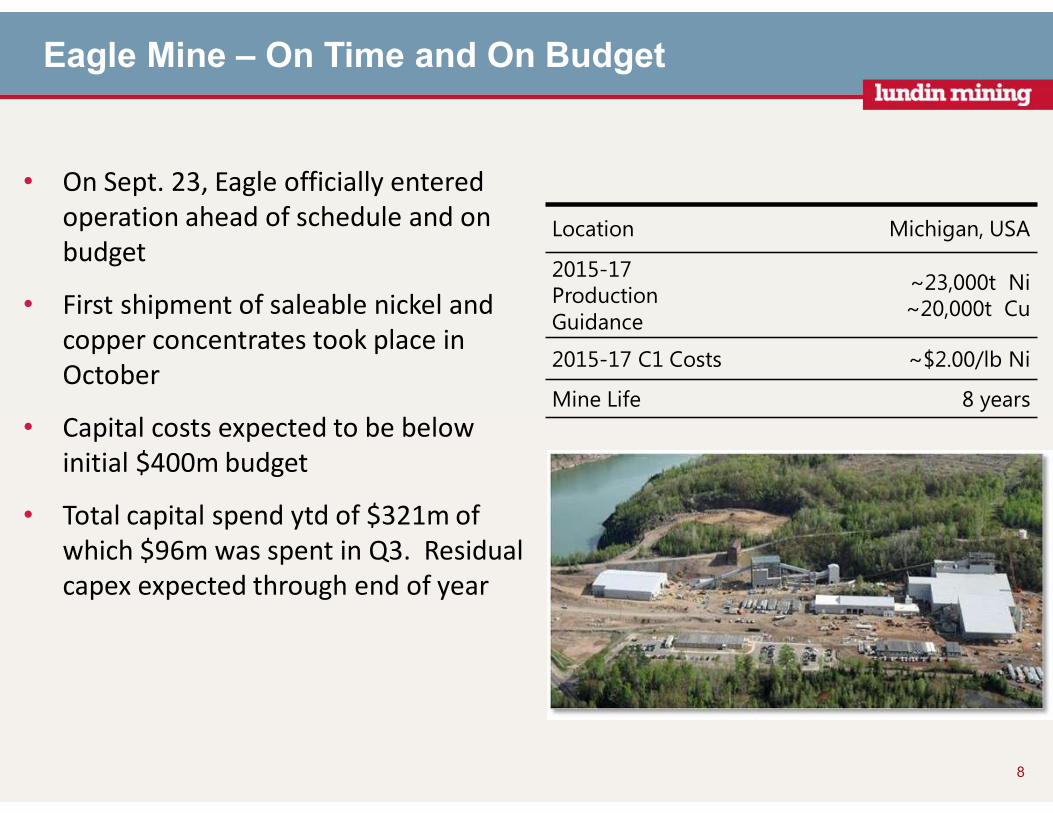
Location Michigan, USA
2015-17 Production Guidance
~23,000t Ni~20,000t Cu
2015-17 C1 Costs ~$2.00/lb Ni
Mine Life 8 years
8
Eagle Mine – On Time and On Budget
• On Sept. 23, Eagle officially entered
operation ahead of schedule and on
budget
• First shipment of saleable nickel and
copper concentrates took place in
October
• Capital costs expected to be below
initial $400m budget
• Total capital spend ytd of $321m of
which $96m was spent in Q3. Residual
capex expected through end of year
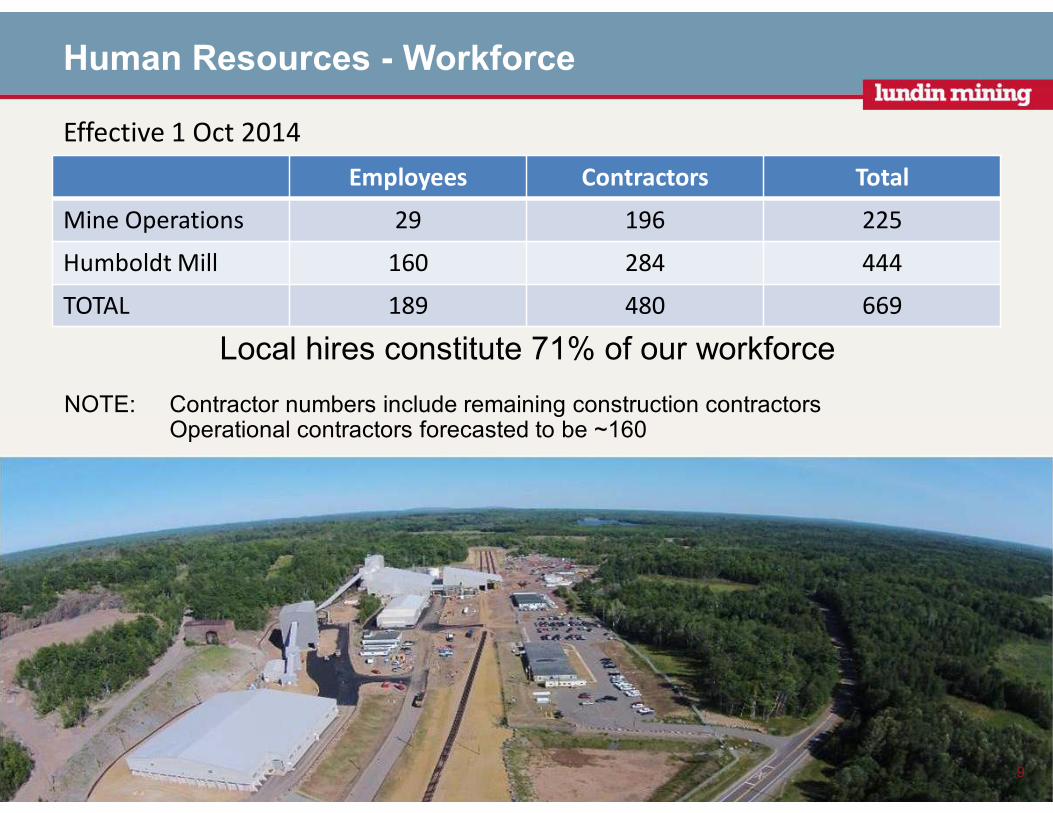
Human Resources - Workforce
Employees Contractors Total
Mine Operations 29 196 225
Humboldt Mill 160 284 444
TOTAL 189 480 669
9
Local hires constitute 71% of our workforce
NOTE: Contractor numbers include remaining construction contractorsOperational contractors forecasted to be ~160
Effective 1 Oct 2014
Environment and Social Responsibility(Kristen Mariuzza & Matt Johnson)
10
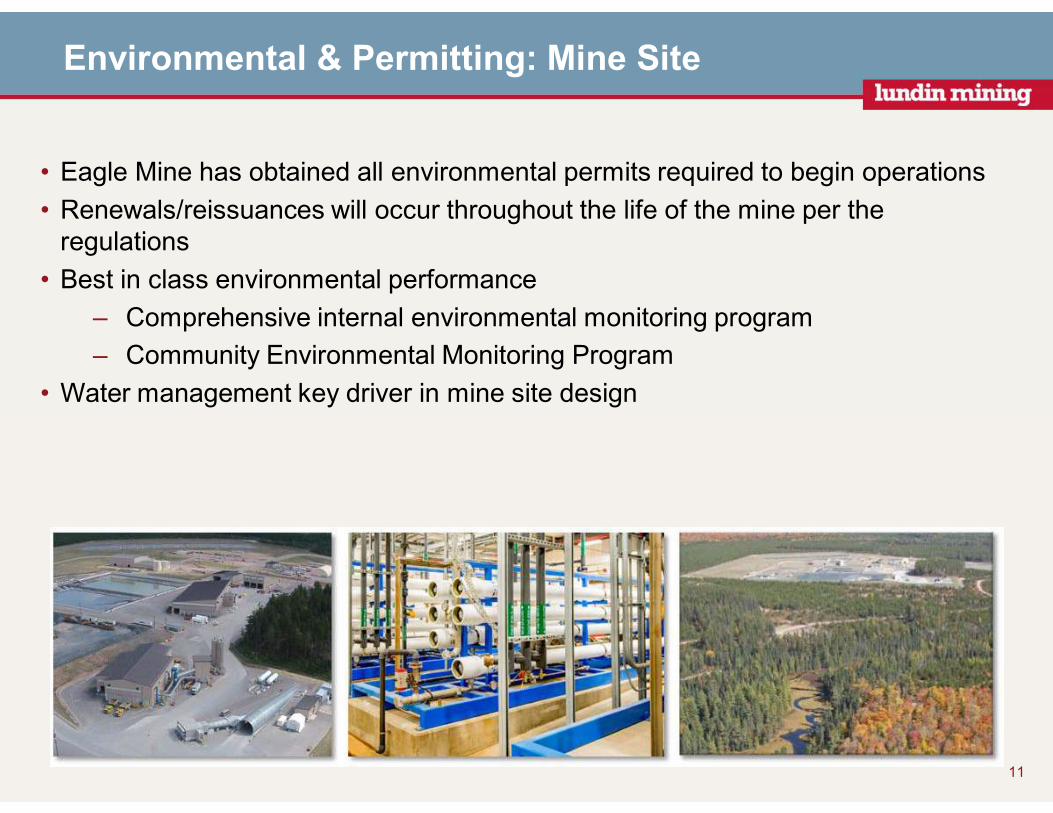
Environmental & Permitting: Mine Site
• Eagle Mine has obtained all environmental permits required to begin operations
• Renewals/reissuances will occur throughout the life of the mine per the regulations
• Best in class environmental performance
– Comprehensive internal environmental monitoring program
– Community Environmental Monitoring Program
• Water management key driver in mine site design
11
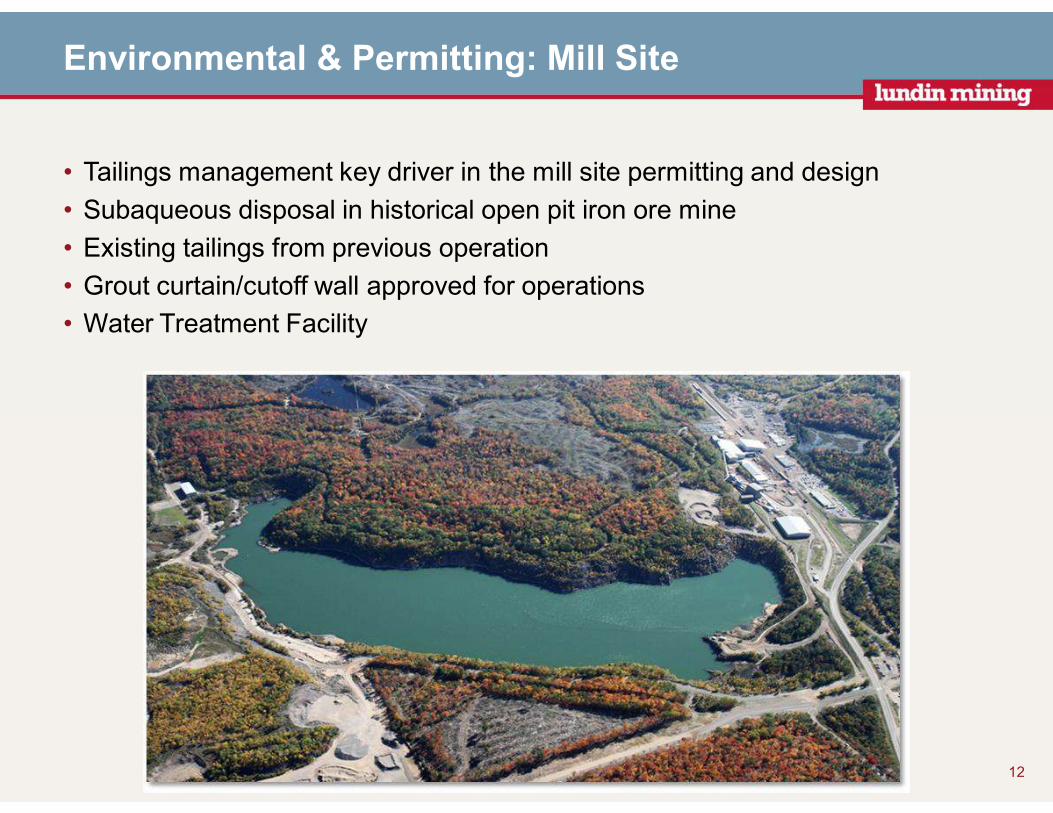
Environmental & Permitting: Mill Site
• Tailings management key driver in the mill site permitting and design
• Subaqueous disposal in historical open pit iron ore mine
• Existing tailings from previous operation
• Grout curtain/cutoff wall approved for operations
• Water Treatment Facility
12
Community Approval Rating (Scorecard)
13
0%
10%
20%
30%
40%
50%
60%
70%
80%
90%
100%
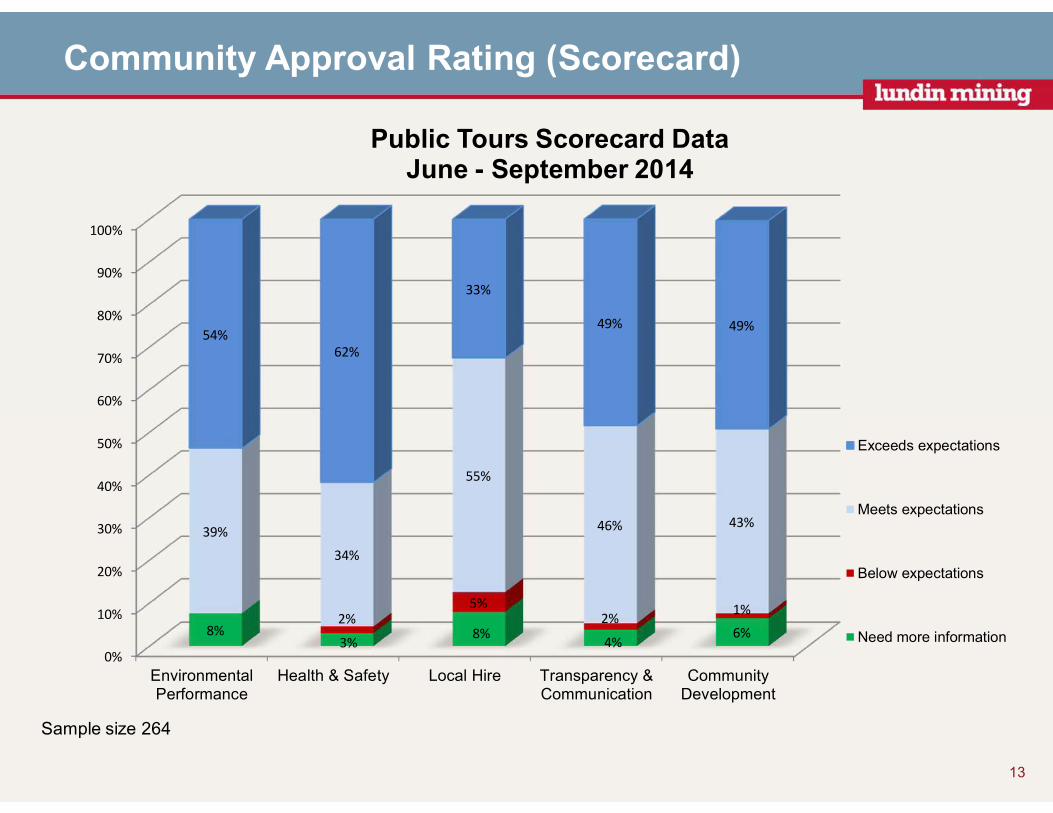
EnvironmentalPerformance
Health & Safety Local Hire Transparency &Communication
CommunityDevelopment
8%3%
8%4%
6%2%
5%2%
1%
39%
34%
55%
46% 43%
54%
62%
33%
49% 49%
Public Tours Scorecard Data June - September 2014
Exceeds expectations
Meets expectations
Below expectations
Need more information
Sample size 264
Community Approval Rating (Scorecard)
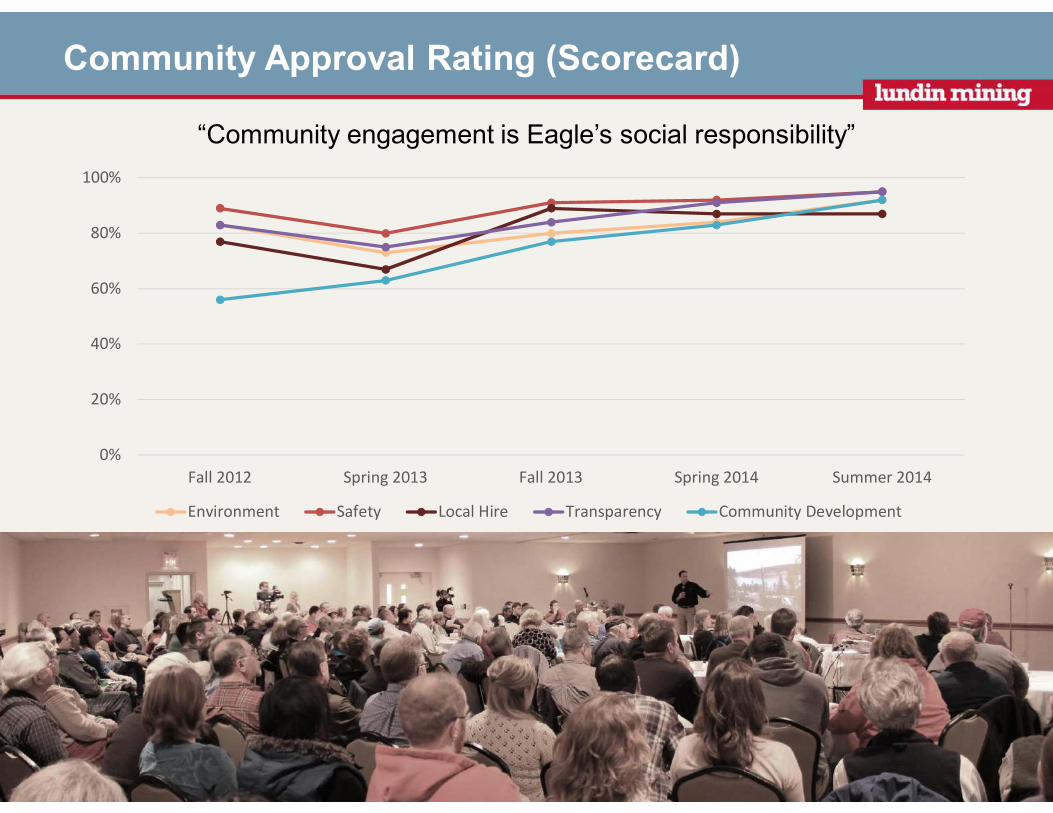
“Community engagement is Eagle’s social responsibility”
14
0%
20%
40%
60%
80%
100%
Fall 2012 Spring 2013 Fall 2013 Spring 2014 Summer 2014
Environment Safety Local Hire Transparency Community Development
Project Overview(Mike Welch)
15
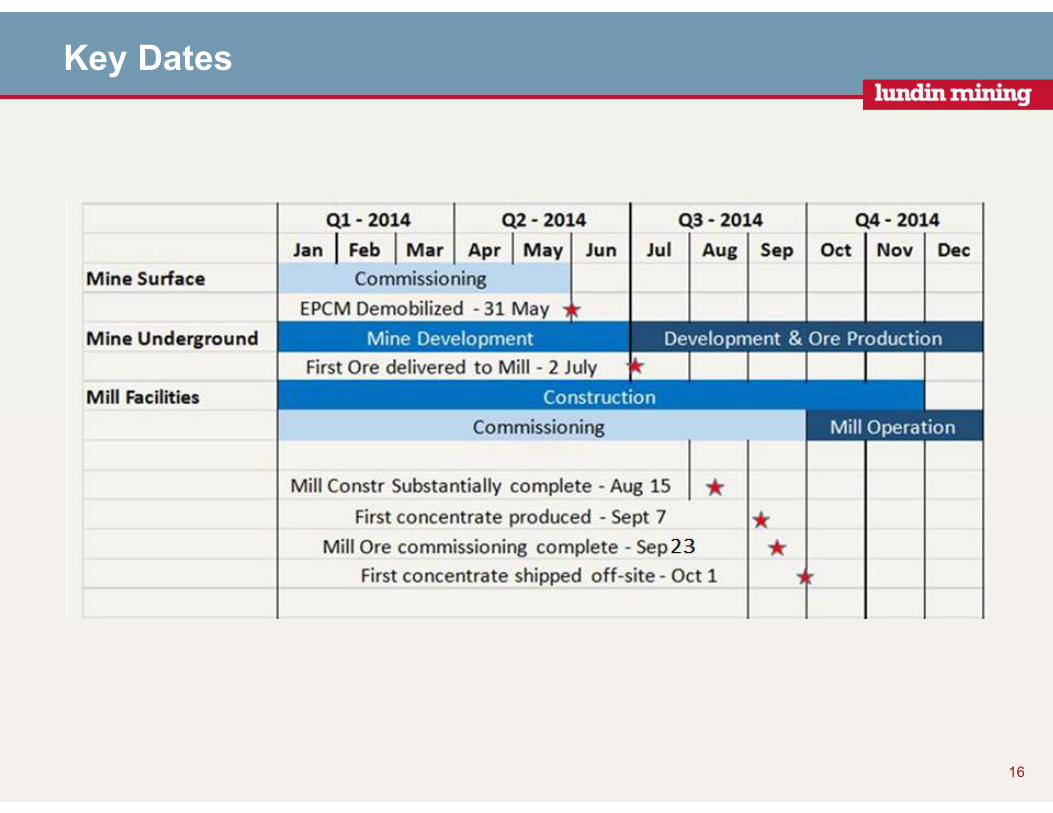
Key Dates
16
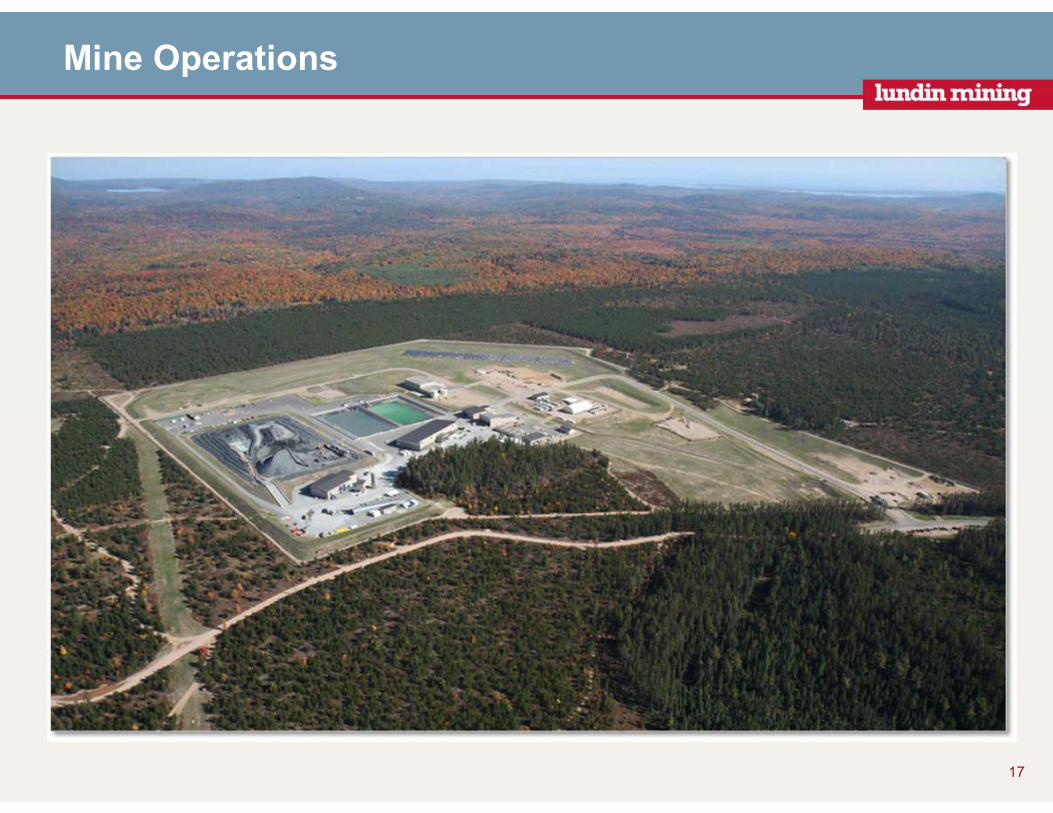
Mine Operations
Mine Operations
17
Metallurgy
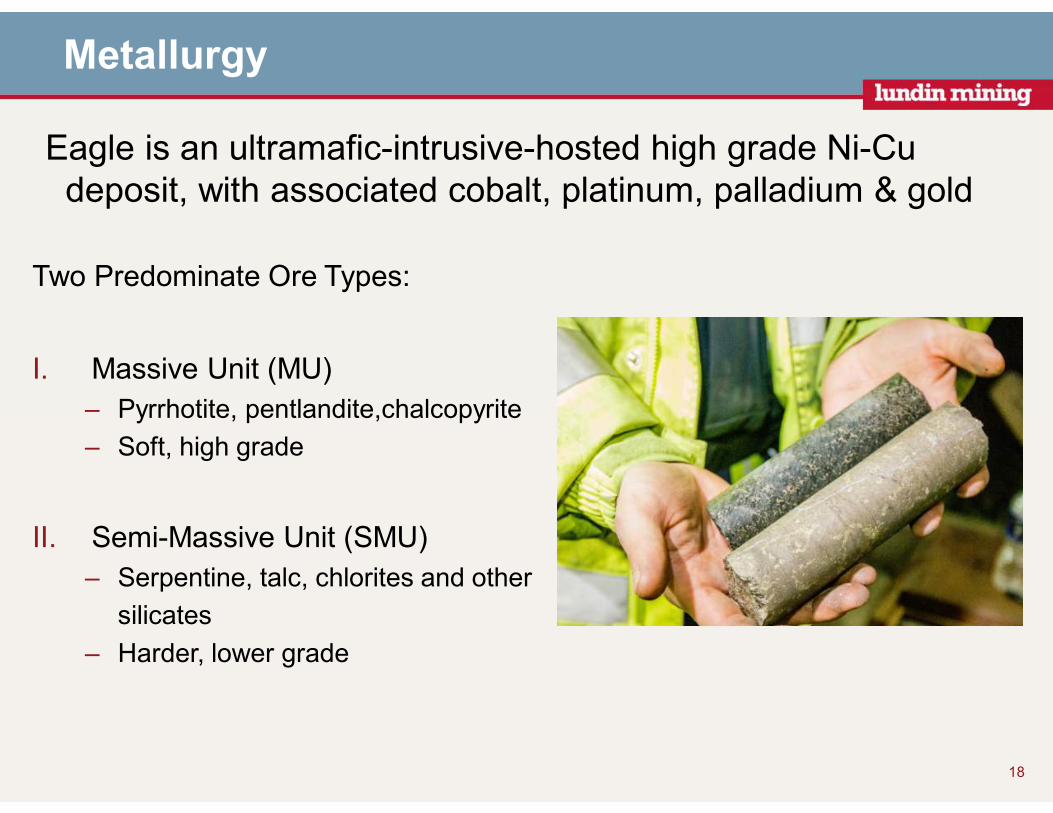
Two Predominate Ore Types:
I. Massive Unit (MU)
– Pyrrhotite, pentlandite,chalcopyrite
– Soft, high grade
II. Semi-Massive Unit (SMU)
– Serpentine, talc, chlorites and other
silicates
– Harder, lower grade
18
Eagle is an ultramafic-intrusive-hosted high grade Ni-Cu deposit, with associated cobalt, platinum, palladium & gold
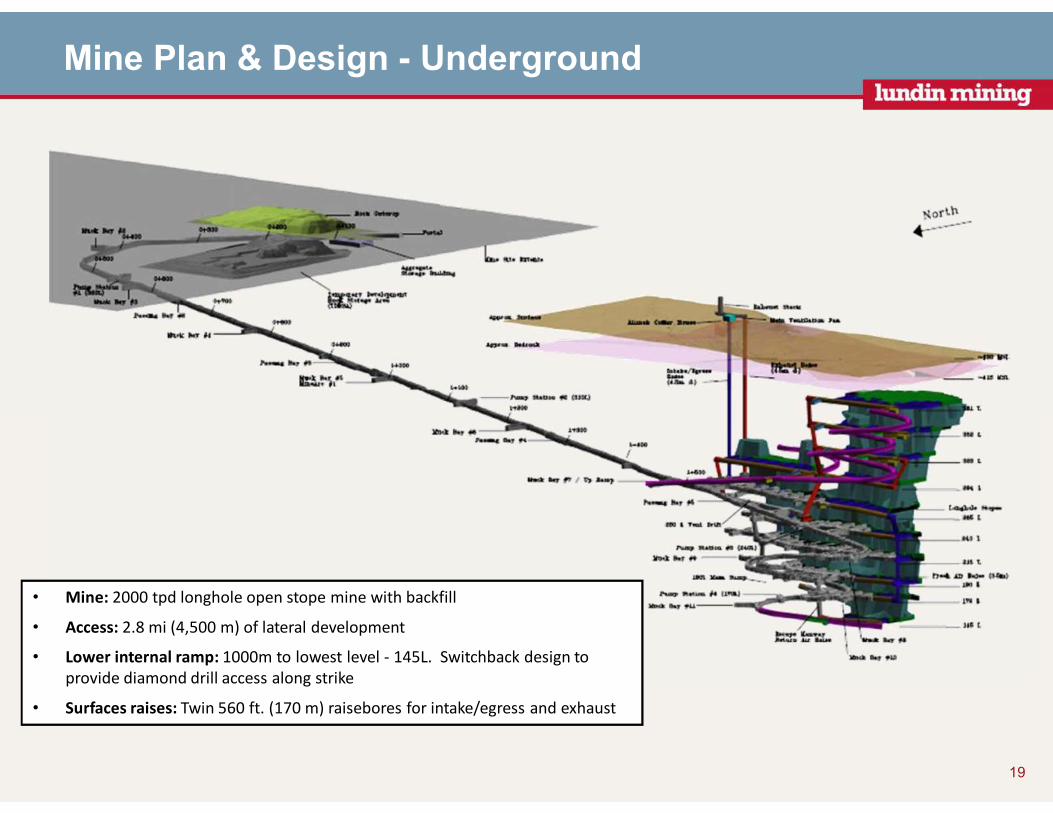
Mine Plan & Design - Underground
19
• Mine: 2000 tpd longhole open stope mine with backfill
• Access: 2.8 mi (4,500 m) of lateral development
• Lower internal ramp: 1000m to lowest level - 145L. Switchback design to
provide diamond drill access along strike
• Surfaces raises: Twin 560 ft. (170 m) raisebores for intake/egress and exhaust
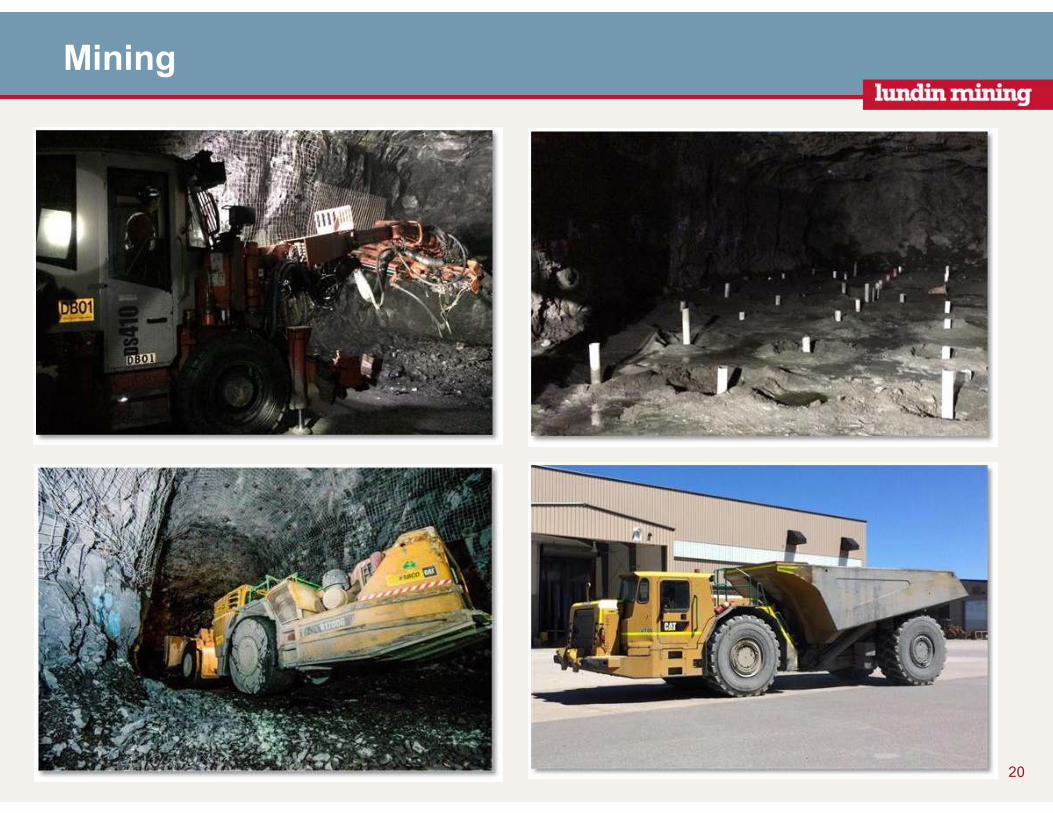
Mining
20
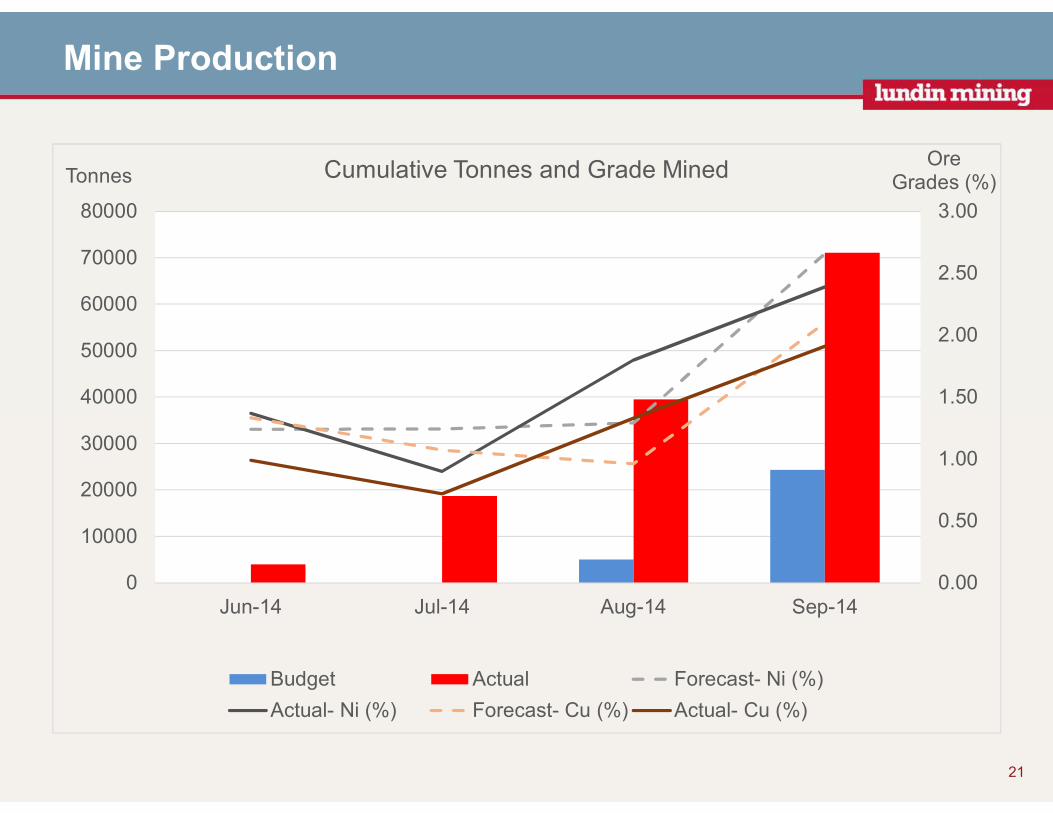
Mine Production
21
0.00
0.50
1.00
1.50
2.00
2.50
3.00
Jun-14 Jul-14 Aug-14 Sep-140
10000
20000
30000
40000
50000
60000
70000
80000
OreGrades (%)Tonnes Cumulative Tonnes and Grade Mined
Budget Actual Forecast- Ni (%)
Actual- Ni (%) Forecast- Cu (%) Actual- Cu (%)
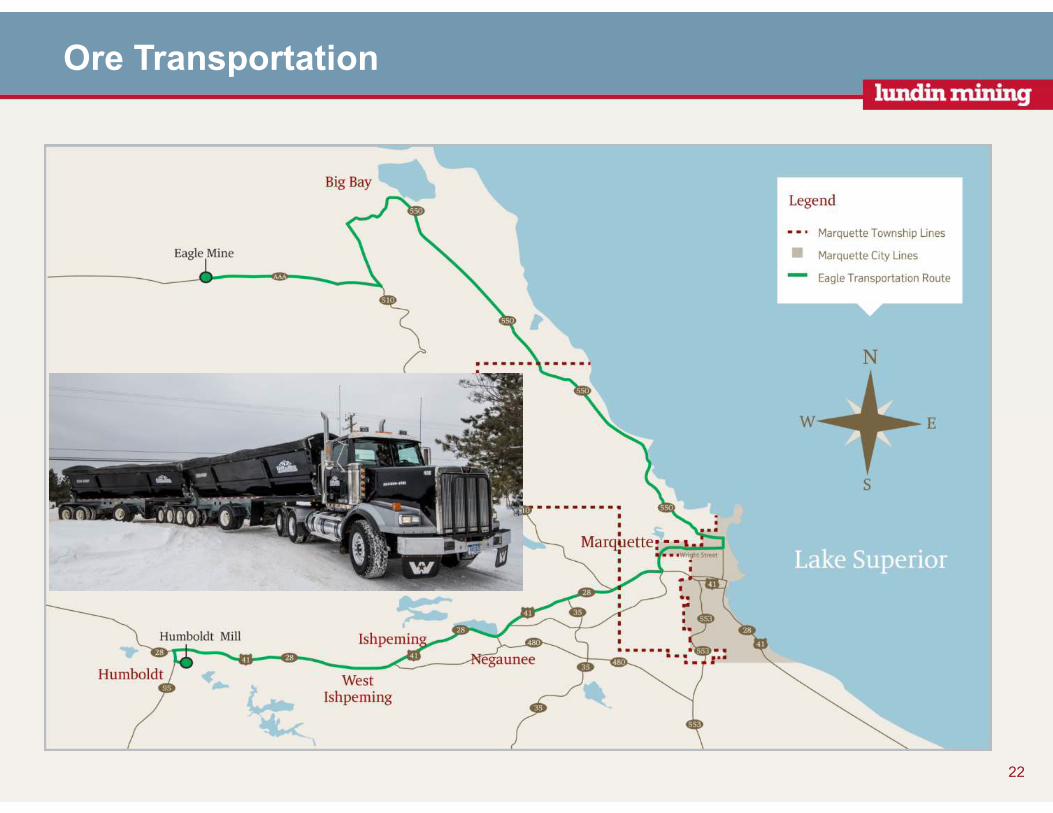
Ore Transportation
22
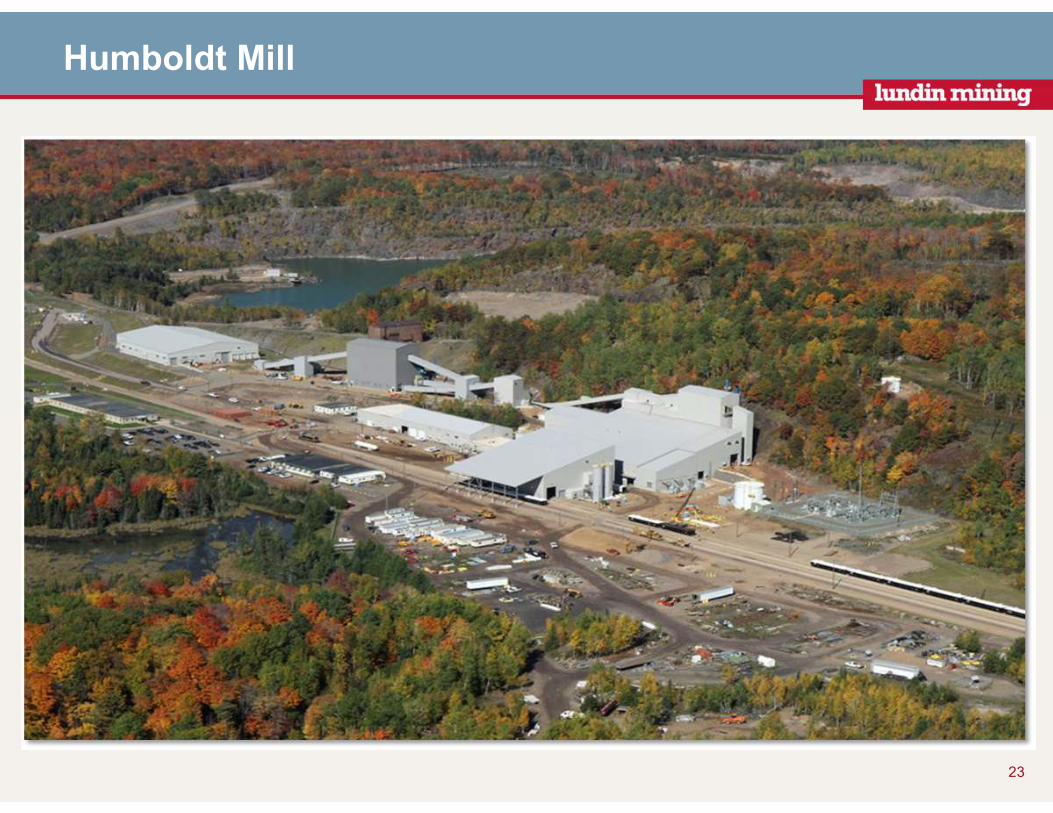
Humboldt Mill
23
Mill Operations
Metallurgy
High Level Design Criteria
• 2,000 tpd operation at 95% availability
• 3-stage crushing plant (8 hr/day, 7-day/week operation)
• Concentrator (24 hr/day, 7-day/week operation)
• Concentrate Load-out (8 hr/day, 7 days/week depending on production)
Straight Forward Processing Circuit
• Conventional flotation to produce separate Ni and Cu concentrates
• Expected life of mine recovery is 82% nickel and 93% copper
• Flotation tailings thickened and deposited subaqueously in the existing Humboldt tailings disposal facility
24
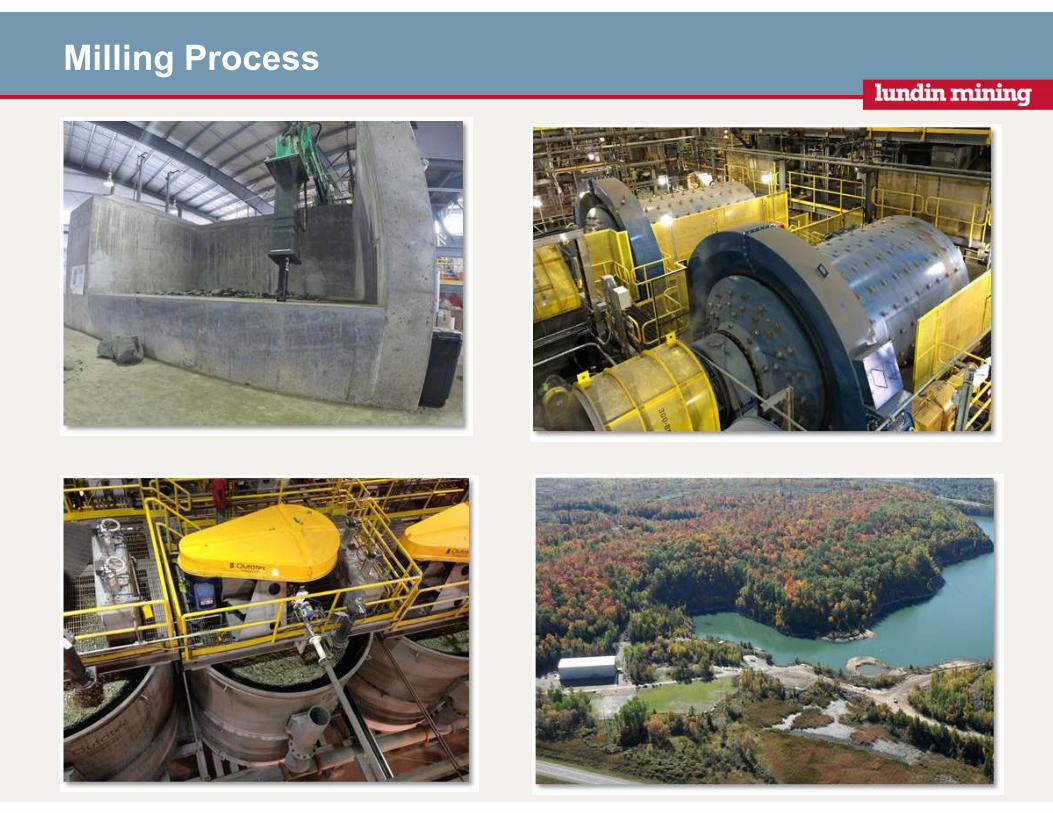
Milling Process
Metal Concentrates
• Nickel concentrate grade is estimated at 11% - 14% and copper concentrate at 31%
• By-product credits include: Copper, cobalt, platinum, palladium, gold and silver
• Storage capacity at site approximately 3,000 wmt for nickel concentrates and 1,000 wmt for copper
• Concentrates will be railed directly to either Canadian smelters or to the ports on the St. Lawrence, east or west coasts for overseas shipping
26
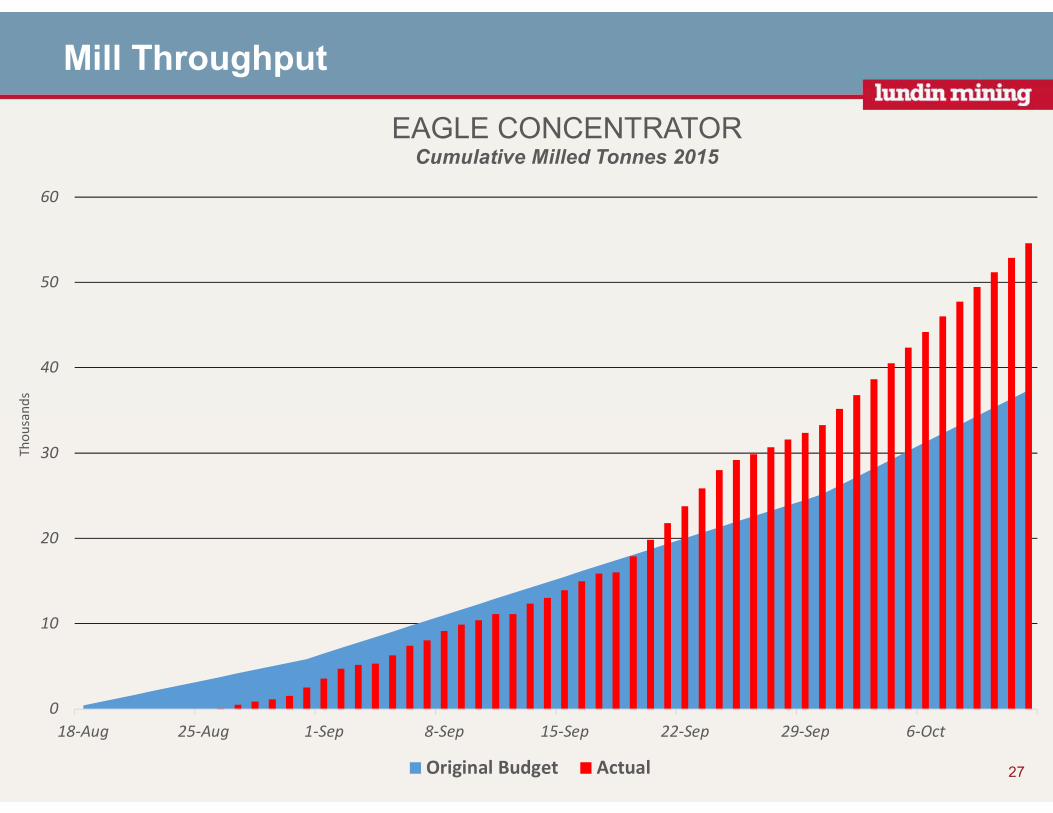
Mill Throughput
27
0
10
20
30
40
50
60
18-Aug 25-Aug 1-Sep 8-Sep 15-Sep 22-Sep 29-Sep 6-Oct
Th
ou
san
ds
EAGLE CONCENTRATORCumulative Milled Tonnes 2015
Original Budget Actual
28
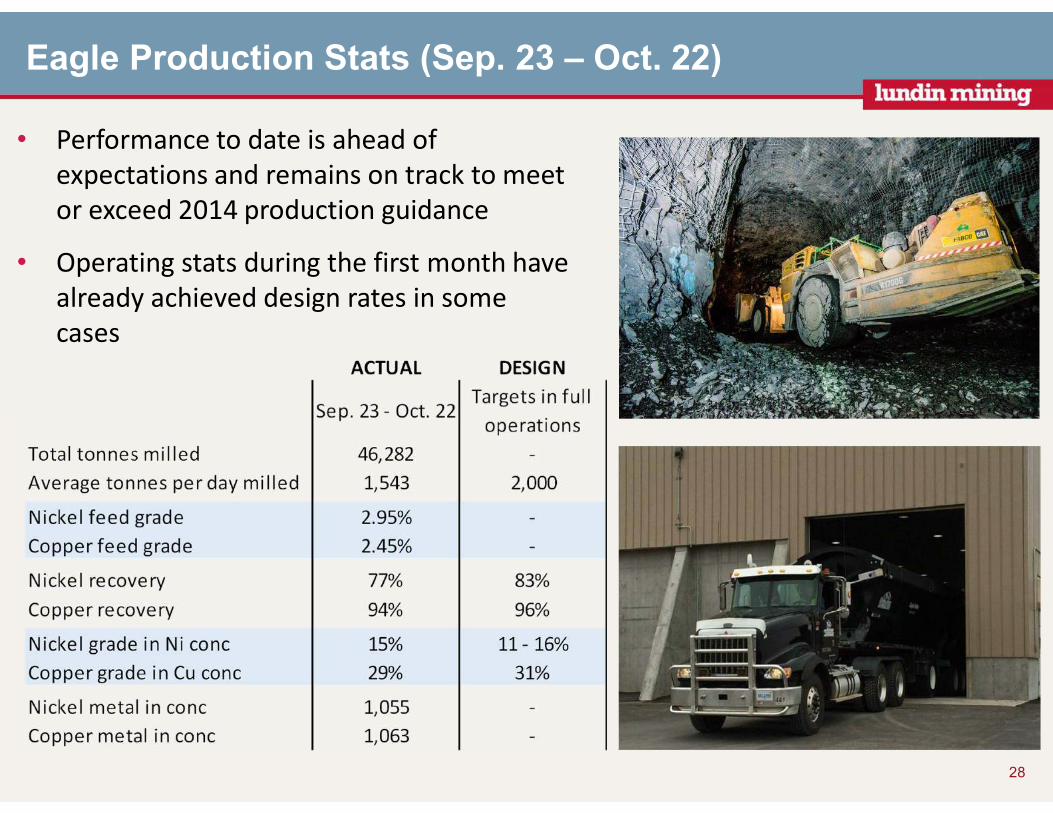
Eagle Production Stats (Sep. 23 – Oct. 22)
• Performance to date is ahead of
expectations and remains on track to meet
or exceed 2014 production guidance
• Operating stats during the first month have
already achieved design rates in some
cases
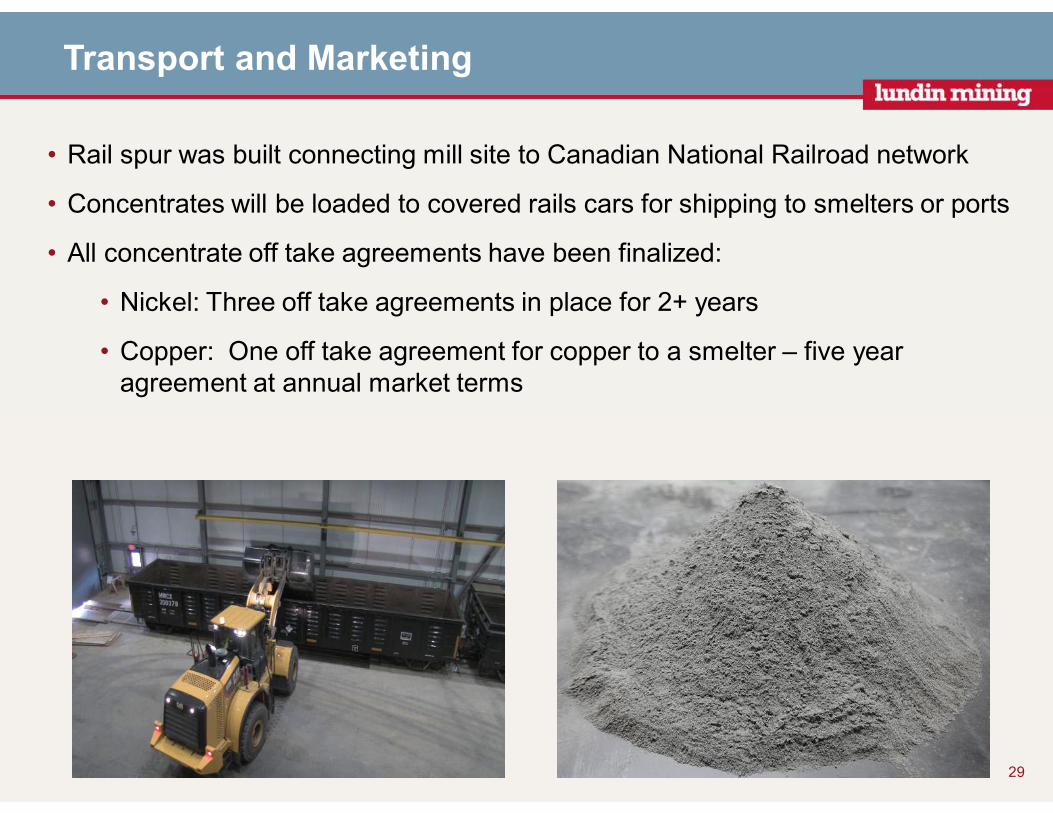
Transport and Marketing
29
• Rail spur was built connecting mill site to Canadian National Railroad network
• Concentrates will be loaded to covered rails cars for shipping to smelters or ports
• All concentrate off take agreements have been finalized:
• Nickel: Three off take agreements in place for 2+ years
• Copper: One off take agreement for copper to a smelter – five year agreement at annual market terms
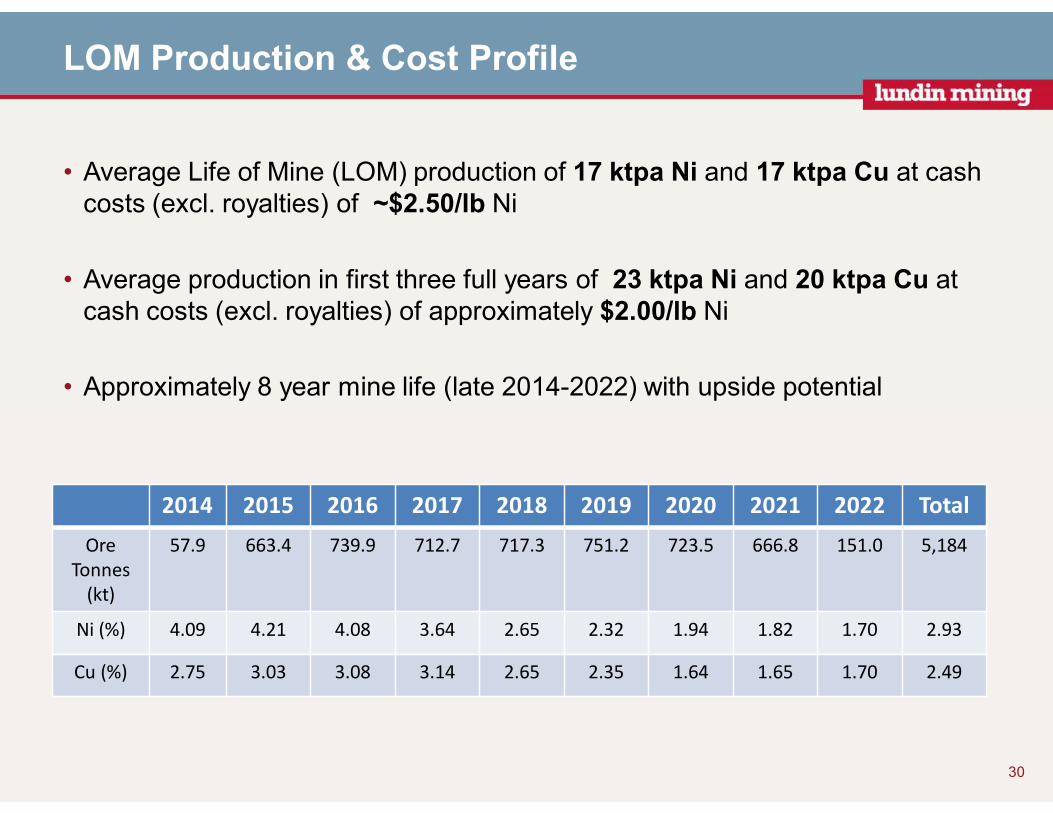
LOM Production & Cost Profile
• Average Life of Mine (LOM) production of 17 ktpa Ni and 17 ktpa Cu at cash costs (excl. royalties) of ~$2.50/lb Ni
• Average production in first three full years of 23 ktpa Ni and 20 ktpa Cu at cash costs (excl. royalties) of approximately $2.00/lb Ni
• Approximately 8 year mine life (late 2014-2022) with upside potential
30
2014 2015 2016 2017 2018 2019 2020 2021 2022 Total
Ore
Tonnes
(kt)
57.9 663.4 739.9 712.7 717.3 751.2 723.5 666.8 151.0 5,184
Ni (%) 4.09 4.21 4.08 3.64 2.65 2.32 1.94 1.82 1.70 2.93
Cu (%) 2.75 3.03 3.08 3.14 2.65 2.35 1.64 1.65 1.70 2.49
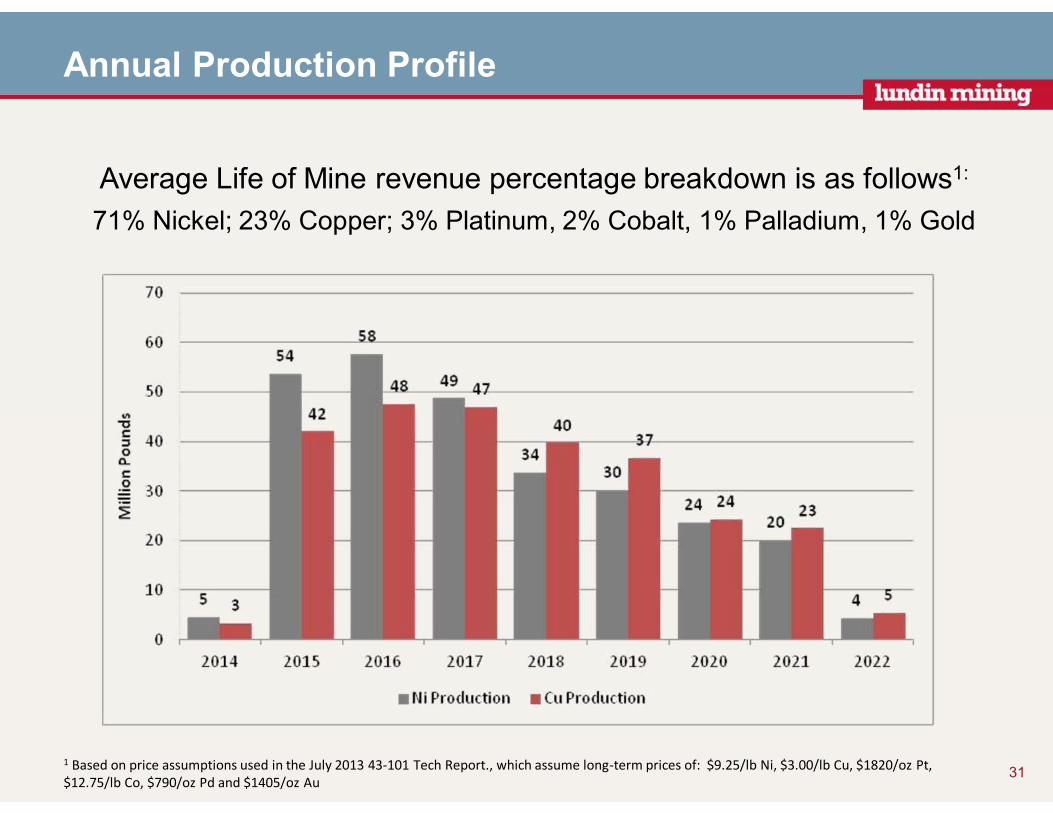
Annual Production Profile
Average Life of Mine revenue percentage breakdown is as follows1:
71% Nickel; 23% Copper; 3% Platinum, 2% Cobalt, 1% Palladium, 1% Gold
1 Based on price assumptions used in the July 2013 43-101 Tech Report., which assume long-term prices of: $9.25/lb Ni, $3.00/lb Cu, $1820/oz Pt,
$12.75/lb Co, $790/oz Pd and $1405/oz Au 31
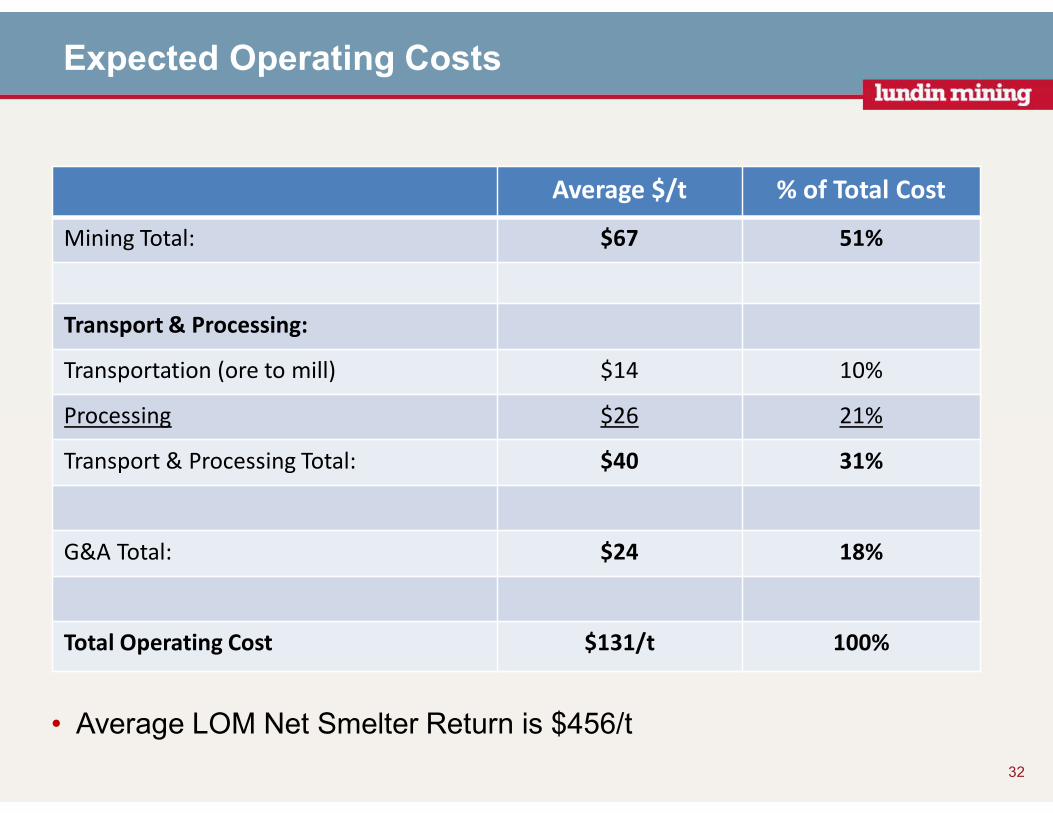
Expected Operating Costs
32
Average $/t % of Total Cost
Mining Total: $67 51%
Transport & Processing:
Transportation (ore to mill) $14 10%
Processing $26 21%
Transport & Processing Total: $40 31%
G&A Total: $24 18%
Total Operating Cost $131/t 100%
• Average LOM Net Smelter Return is $456/t
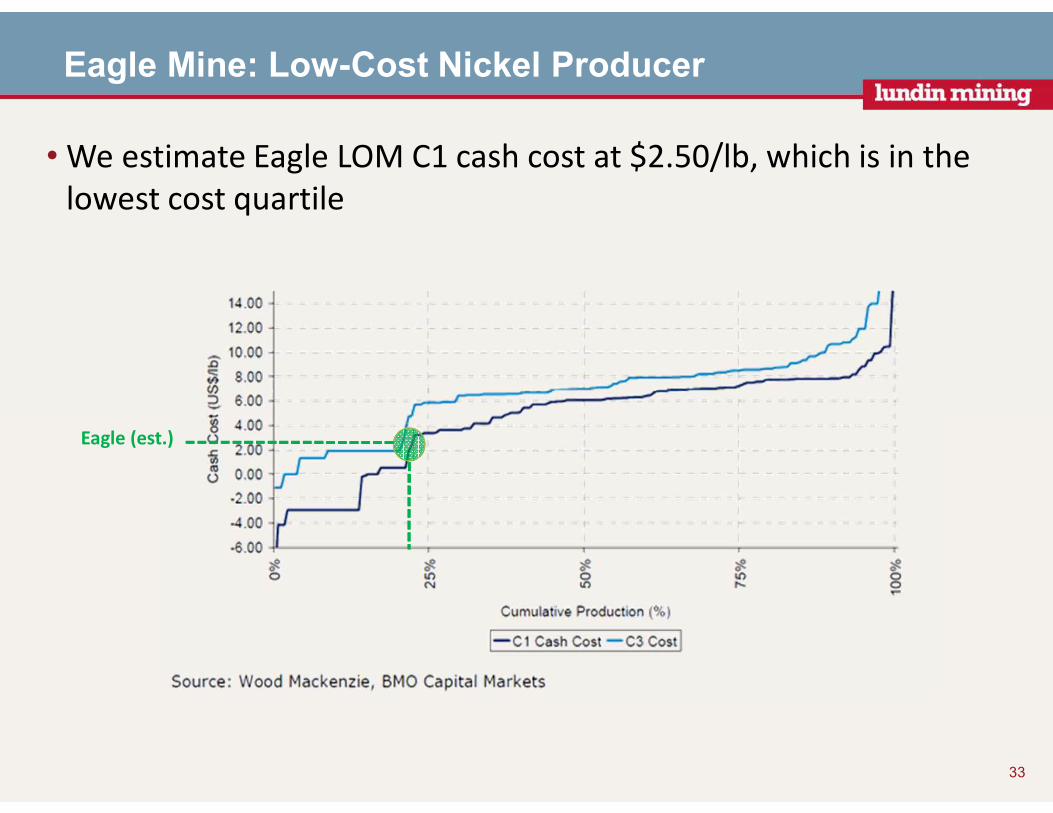
Eagle Mine: Low-Cost Nickel Producer
•We estimate Eagle LOM C1 cash cost at $2.50/lb, which is in the
lowest cost quartile
Eagle (est.)
33
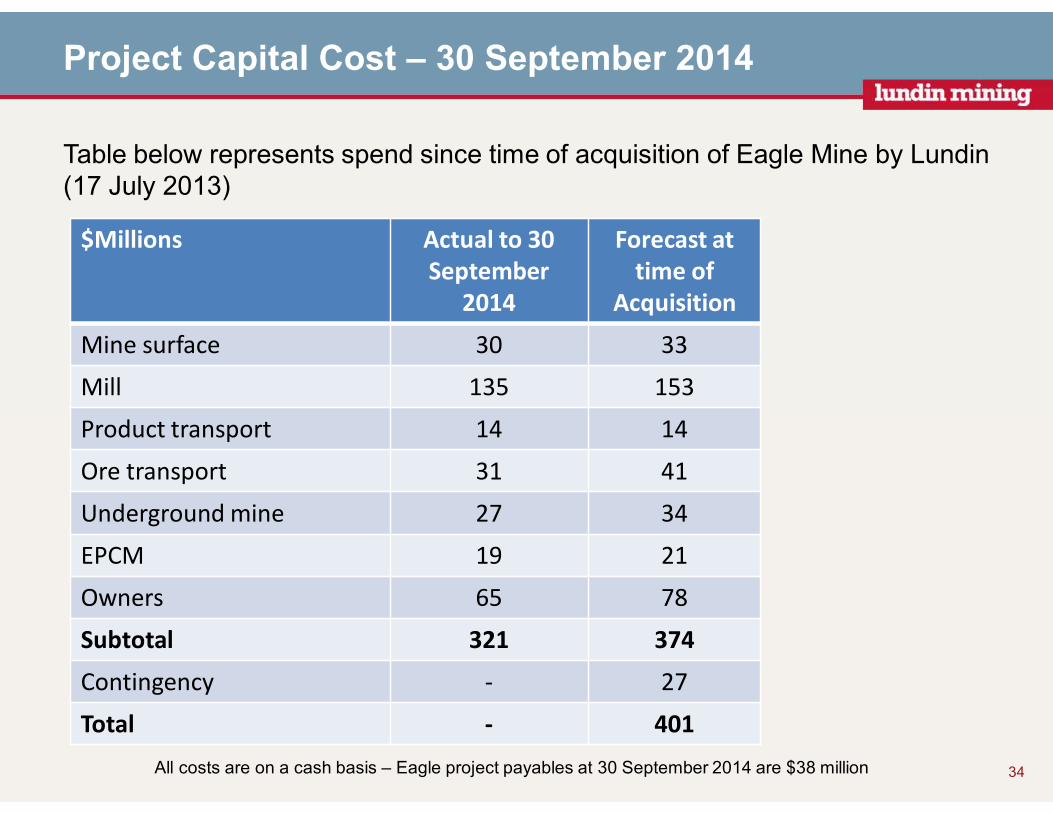
Project Capital Cost – 30 September 2014
Table below represents spend since time of acquisition of Eagle Mine by Lundin (17 July 2013)
34
$Millions Actual to 30
September
2014
Forecast at
time of
Acquisition
Mine surface 30 33
Mill 135 153
Product transport 14 14
Ore transport 31 41
Underground mine 27 34
EPCM 19 21
Owners 65 78
Subtotal 321 374
Contingency - 27
Total - 401
All costs are on a cash basis – Eagle project payables at 30 September 2014 are $38 million
Exploration(Mike Welch)
35
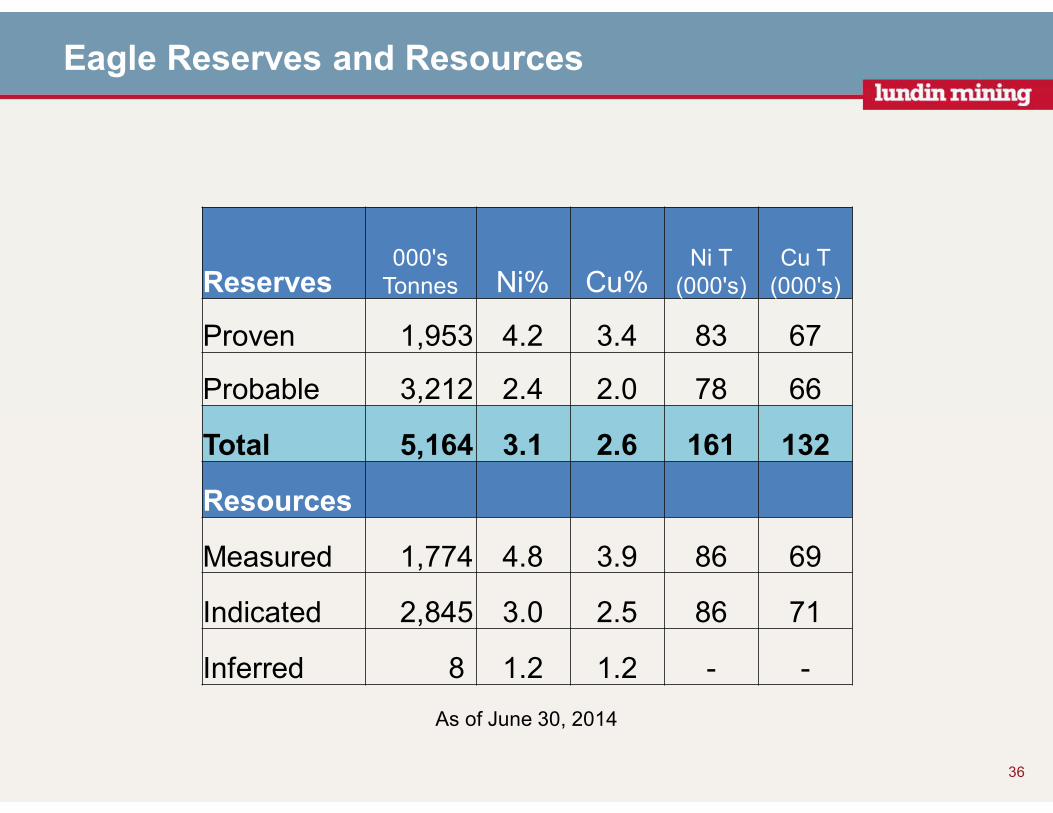
Eagle Reserves and Resources
36
Reserves000's Tonnes Ni% Cu%
Ni T (000's)
Cu T (000's)
Proven 1,953 4.2 3.4 83 67
Probable 3,212 2.4 2.0 78 66
Total 5,164 3.1 2.6 161 132
Resources
Measured 1,774 4.8 3.9 86 69
Indicated 2,845 3.0 2.5 86 71
Inferred 8 1.2 1.2 - -
As of June 30, 2014
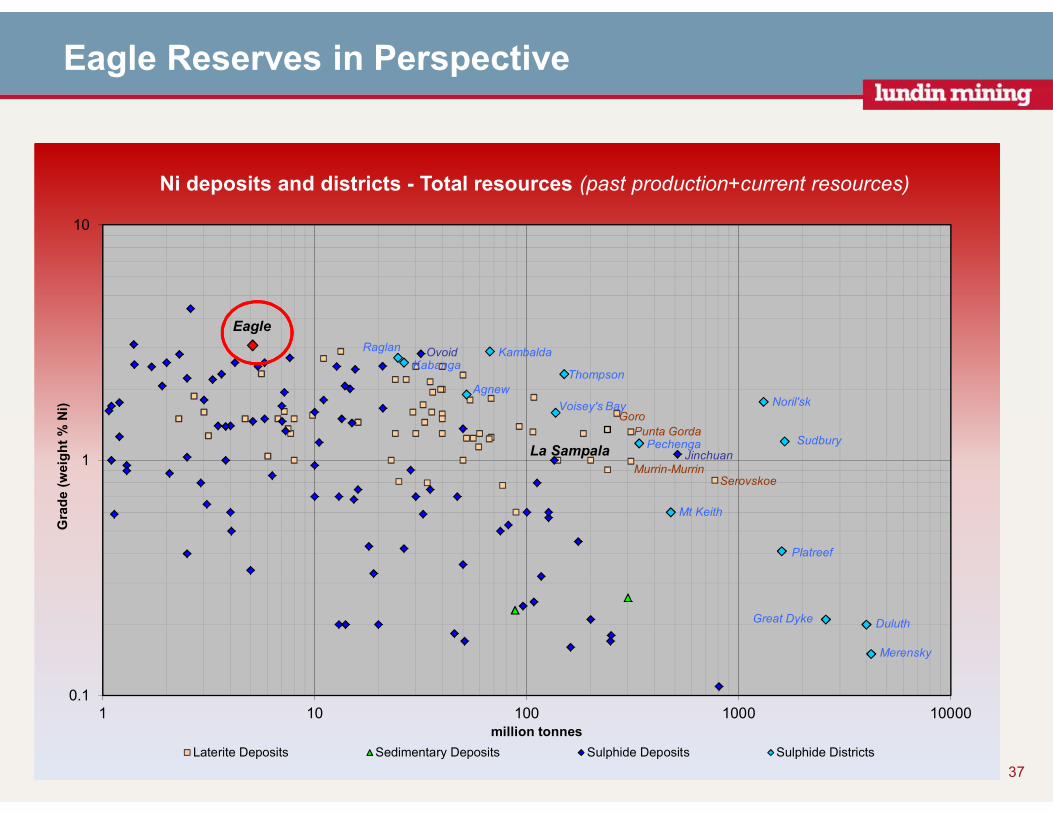
Eagle Reserves in Perspective
37
0.1
1
10
1 10 100 1000 10000
Gra
de (
weig
ht
% N
i)
million tonnes
Ni deposits and districts - Total resources (past production+current resources)
Laterite Deposits Sedimentary Deposits Sulphide Deposits Sulphide Districts
Sudbury
Noril'sk
Duluth
Platreef
Merensky
Great Dyke
Mt Keith
Pechenga
Thompson
Voisey's Bay
Kambalda
Agnew
Raglan
Kabanga
Jinchuan
Ovoid
Eagle
Serovskoe
Punta Gorda
Murrin-Murrin
Goro
La Sampala
`
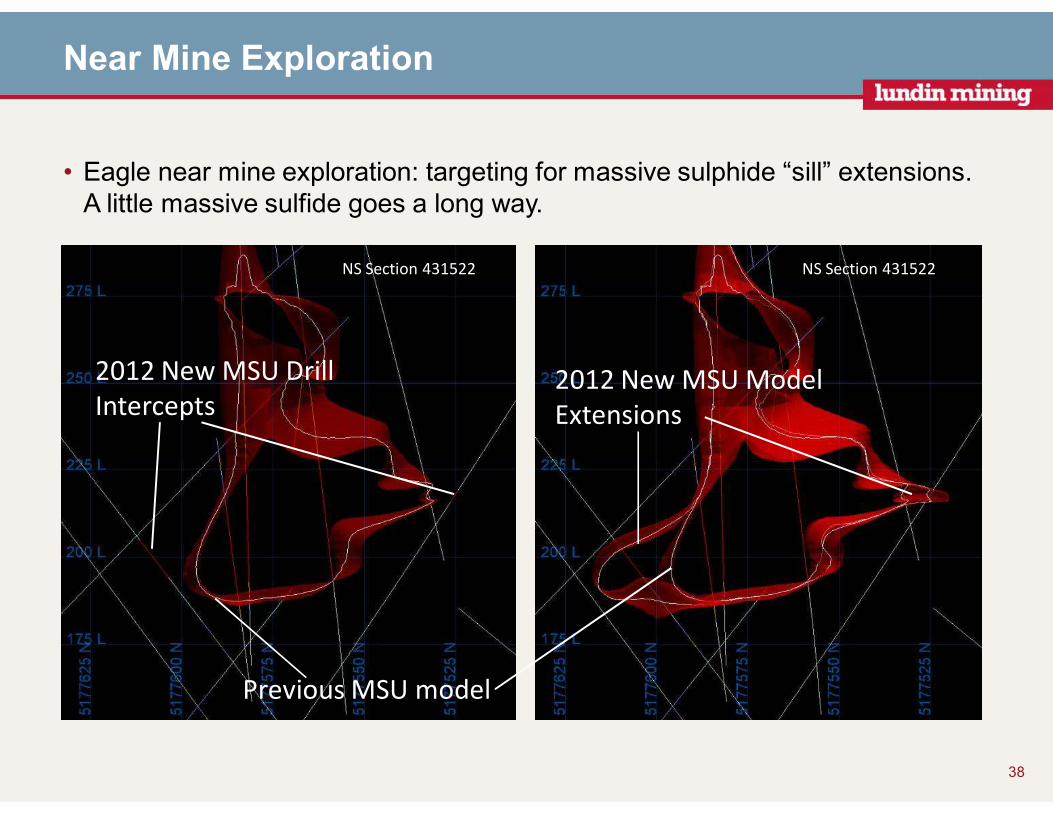
Near Mine Exploration
• Eagle near mine exploration: targeting for massive sulphide “sill” extensions. A little massive sulfide goes a long way.
38
NS Section 431522 NS Section 431522
2012 New MSU Drill
Intercepts2012 New MSU Model
Extensions
Previous MSU model
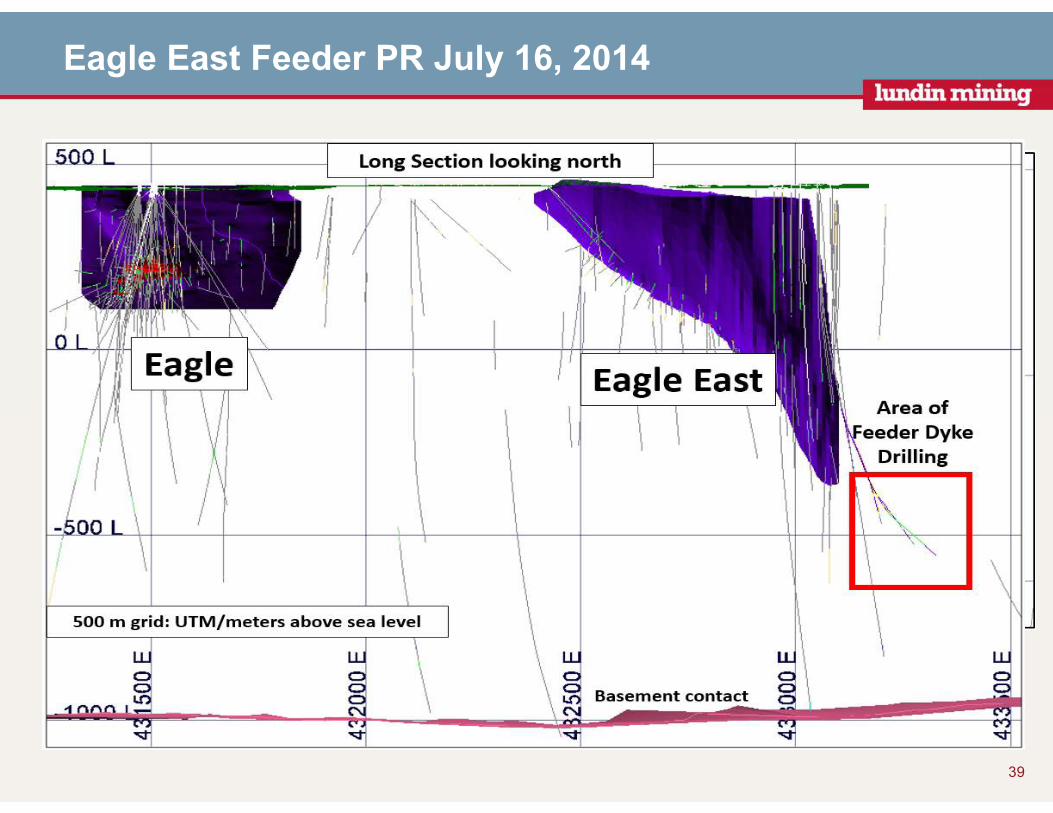
Eagle East Feeder PR July 16, 2014
39
40
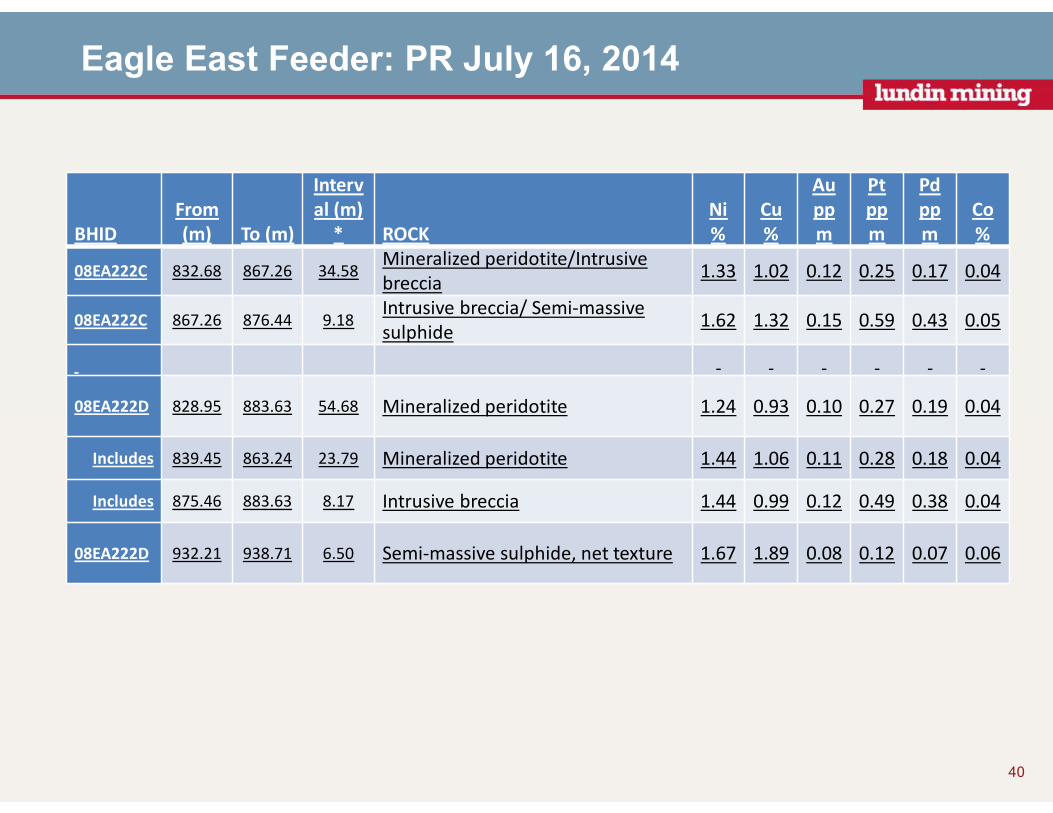
BHID
From
(m) To (m)
Interv
al (m)
* ROCK
Ni
%
Cu
%
Au
pp
m
Pt
pp
m
Pd
pp
m
Co
%
08EA222C 832.68 867.26 34.58Mineralized peridotite/Intrusive
breccia1.33 1.02 0.12 0.25 0.17 0.04
08EA222C 867.26 876.44 9.18Intrusive breccia/ Semi-massive
sulphide1.62 1.32 0.15 0.59 0.43 0.05
08EA222D 828.95 883.63 54.68 Mineralized peridotite 1.24 0.93 0.10 0.27 0.19 0.04
Includes 839.45 863.24 23.79 Mineralized peridotite 1.44 1.06 0.11 0.28 0.18 0.04
Includes 875.46 883.63 8.17 Intrusive breccia 1.44 0.99 0.12 0.49 0.38 0.04
08EA222D 932.21 938.71 6.50 Semi-massive sulphide, net texture 1.67 1.89 0.08 0.12 0.07 0.06
Eagle East Feeder: PR July 16, 2014
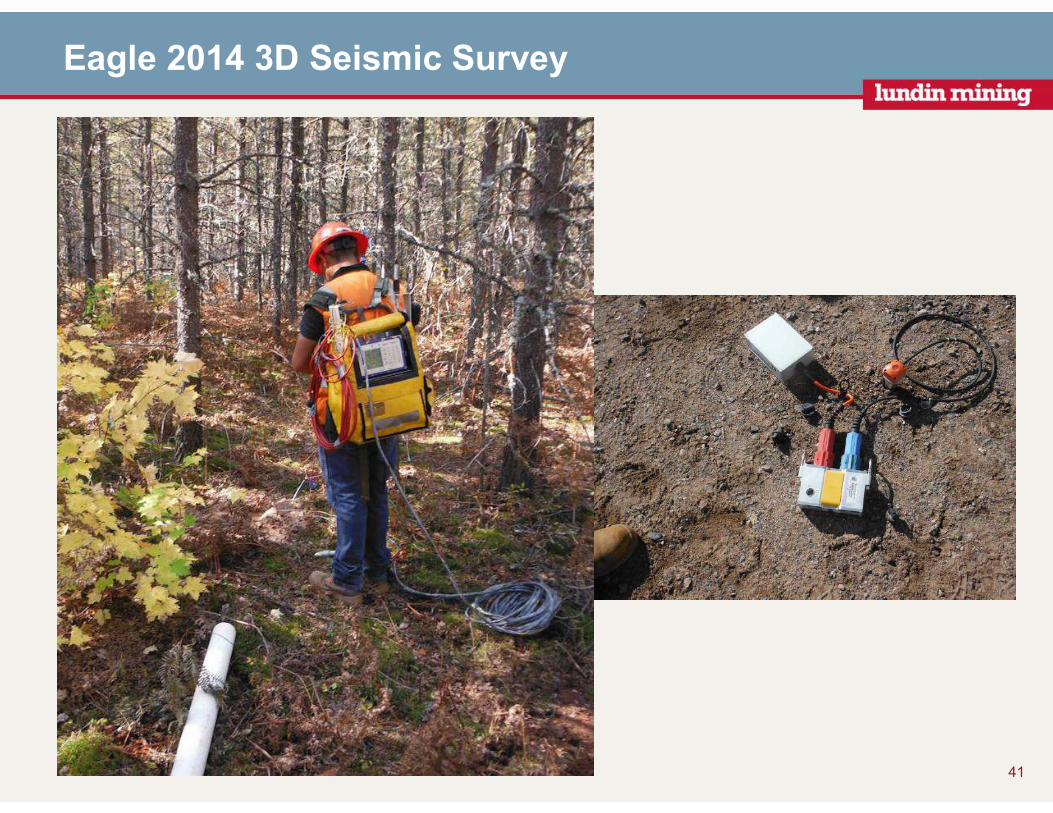
Eagle 2014 3D Seismic Survey
41
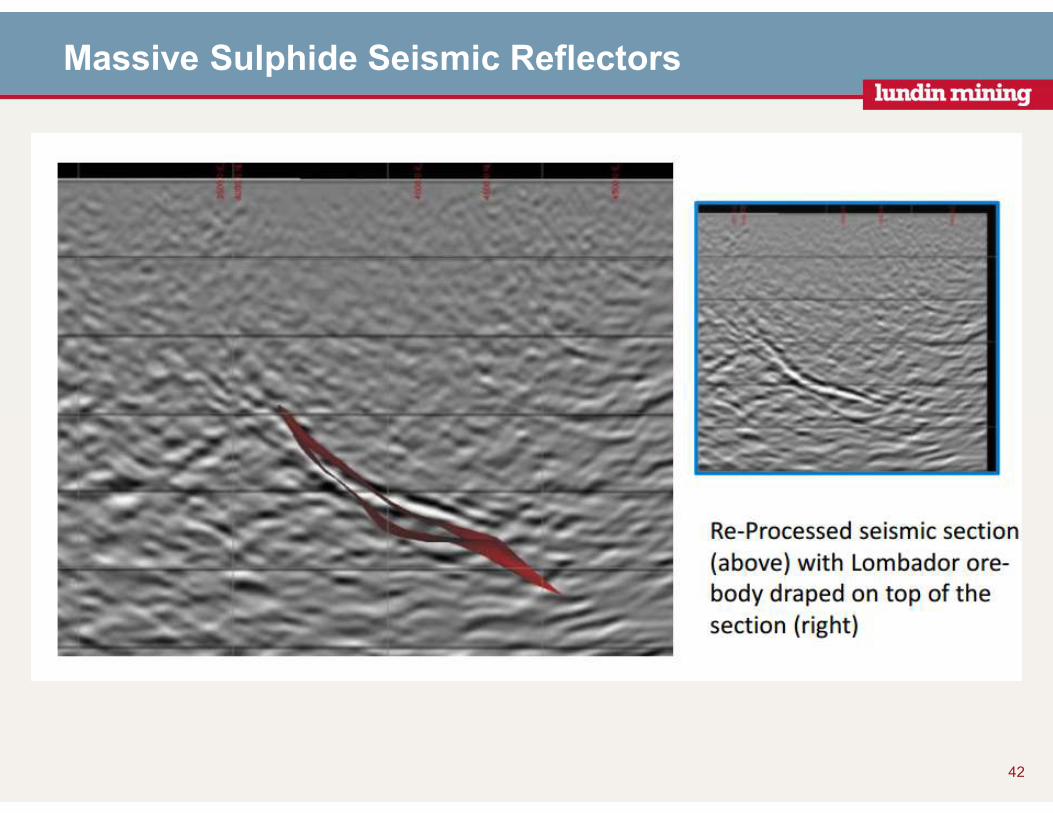
Massive Sulphide Seismic Reflectors
42
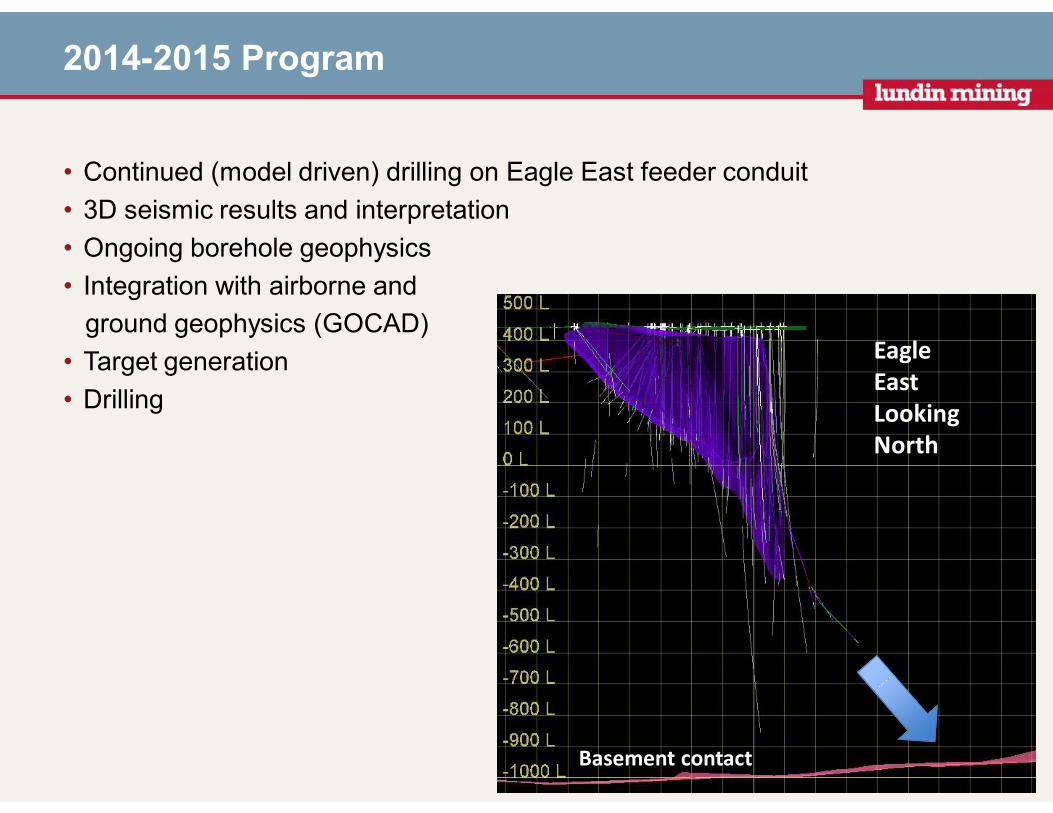
2014-2015 Program
• Continued (model driven) drilling on Eagle East feeder conduit
• 3D seismic results and interpretation
• Ongoing borehole geophysics
• Integration with airborne and
ground geophysics (GOCAD)
• Target generation
• Drilling
43
Eagle
East
Looking
North
Basement contact
Corporate Update(Paul Conibear)
44
45
Tenke Fungurume (24%)(DRC)
Tenke Fungurume (24%)(DRC)
Eagle (100%) (USA)
Eagle (100%) (USA)
Zinkgruvan (100%)(Sweden)
Zinkgruvan (100%)(Sweden)
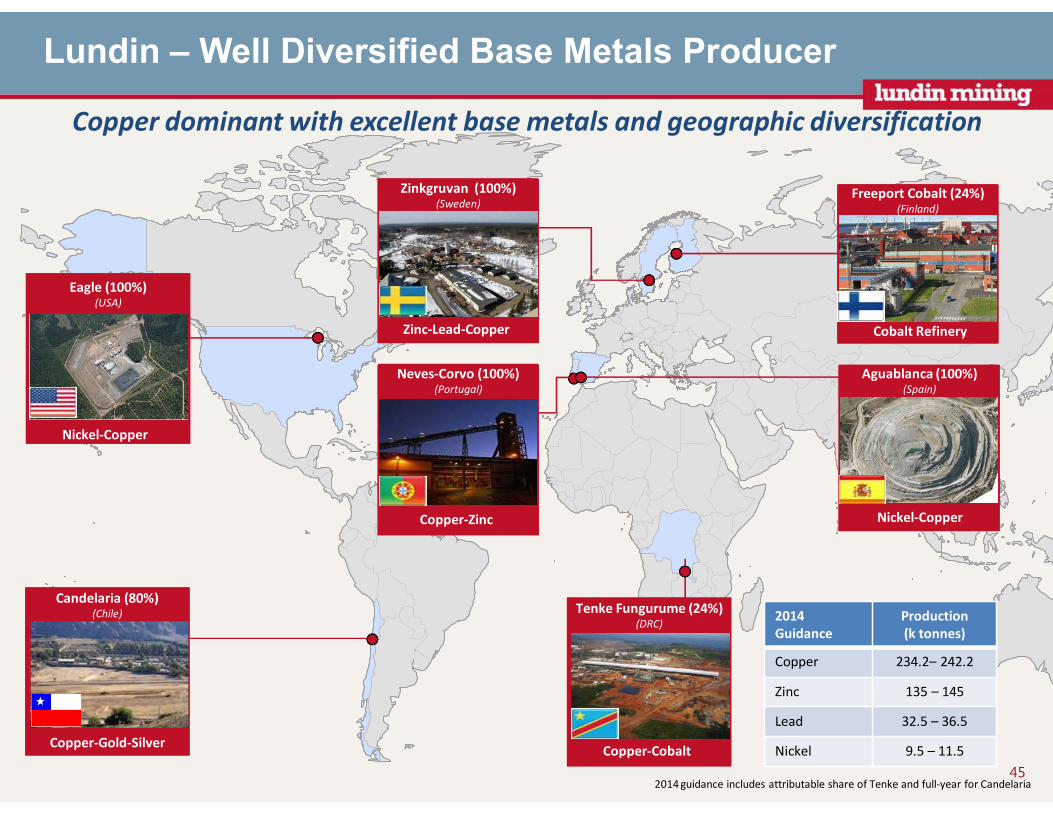
Lundin – Well Diversified Base Metals Producer
Aguablanca (100%) (Spain)
Aguablanca (100%) (Spain)
Copper dominant with excellent base metals and geographic diversification
Candelaria (80%) (Chile)
Candelaria (80%) (Chile)
Neves-Corvo (100%)(Portugal)
Neves-Corvo (100%)(Portugal)
Freeport Cobalt (24%)(Finland)
Freeport Cobalt (24%)(Finland)
Nickel-Copper
Zinc-Lead-Copper
Copper-Zinc
Copper-Gold-SilverCopper-Cobalt
Nickel-Copper
Cobalt Refinery
2014
Guidance
Production
(k tonnes)
Copper 234.2– 242.2
Zinc 135 – 145
Lead 32.5 – 36.5
Nickel 9.5 – 11.5
2014 guidance includes attributable share of Tenke and full-year for Candelaria
46
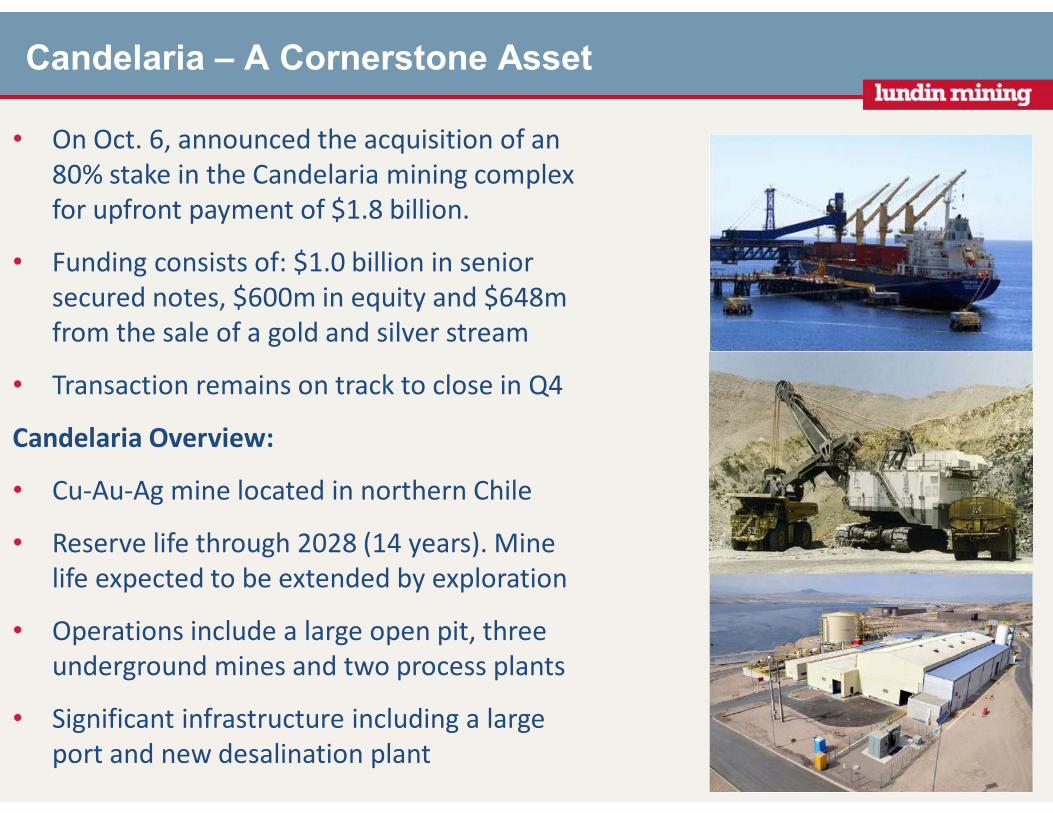
Candelaria – A Cornerstone Asset
• On Oct. 6, announced the acquisition of an
80% stake in the Candelaria mining complex
for upfront payment of $1.8 billion.
• Funding consists of: $1.0 billion in senior
secured notes, $600m in equity and $648m
from the sale of a gold and silver stream
• Transaction remains on track to close in Q4
Candelaria Overview:
• Cu-Au-Ag mine located in northern Chile
• Reserve life through 2028 (14 years). Mine
life expected to be extended by exploration
• Operations include a large open pit, three
underground mines and two process plants
• Significant infrastructure including a large
port and new desalination plant
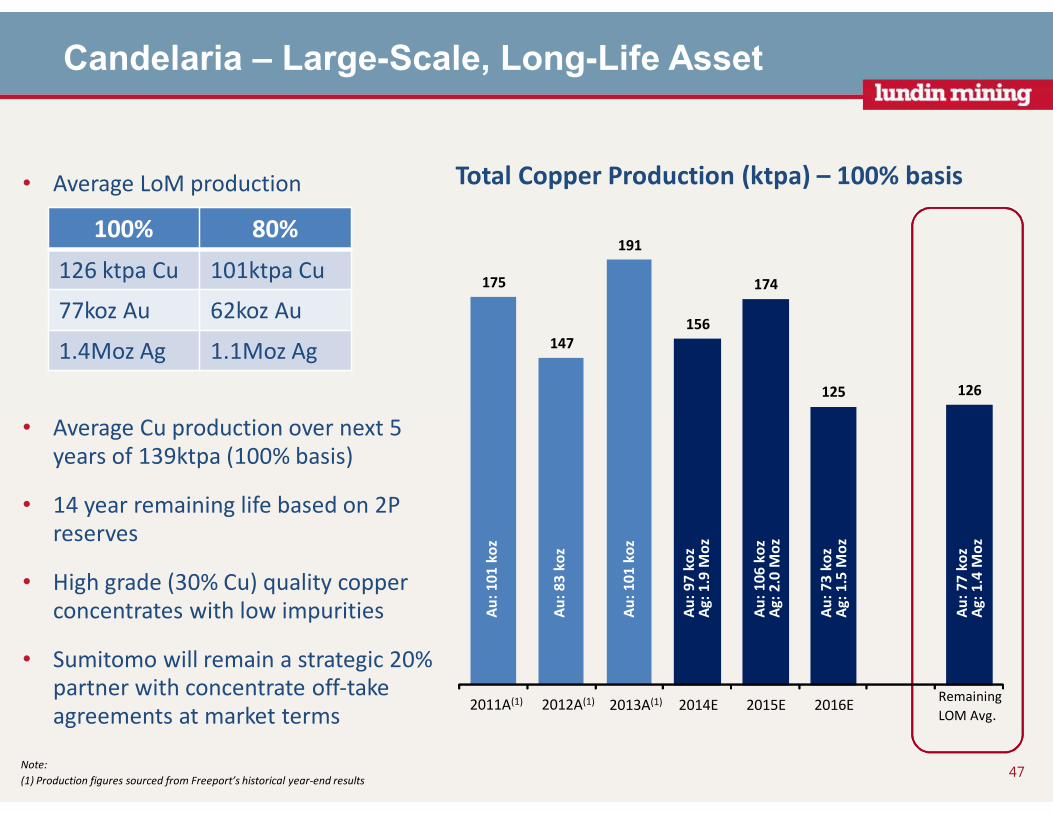
Candelaria – Large-Scale, Long-Life Asset
47
• Average LoM production
• Average Cu production over next 5 years of 139ktpa (100% basis)
• 14 year remaining life based on 2P reserves
• High grade (30% Cu) quality copper concentrates with low impurities
• Sumitomo will remain a strategic 20% partner with concentrate off-take agreements at market terms
Total Copper Production (ktpa) – 100% basis
175
147
191
156
174
125 126
2011A(1) 2012A(1) 2013A(1) 2014E 2015E 2016ERemaining
LOM Avg.
Au
: 77
ko
zA
g: 1
.4 M
oz
Au
: 73
ko
zA
g: 1
.5 M
oz
Au
: 101
ko
z
Au
: 83
ko
z
Au
: 101
ko
z
Au
: 97
ko
zA
g: 1
.9 M
oz
Au
: 106
ko
zA
g: 2
.0 M
oz
Note:
(1) Production figures sourced from Freeport’s historical year-end results
100% 80%
126 ktpa Cu 101ktpa Cu
77koz Au 62koz Au
1.4Moz Ag 1.1Moz Ag
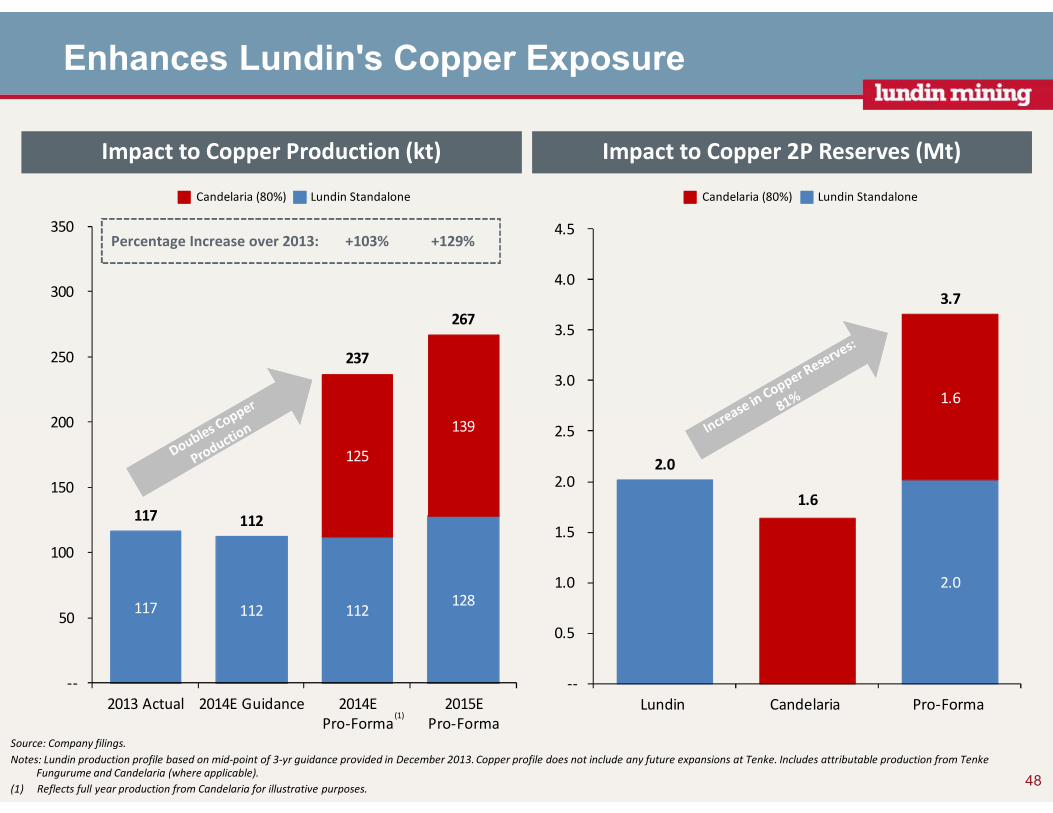
117 112 112 128
125
139
117 112
237
267
--
50
100
150
200
250
300
350
2013 Actual 2014E Guidance 2014E
Pro-Forma
2015E
Pro-Forma
1.6
2.0
1.6
2.0
3.7
--
0.5
1.0
1.5
2.0
2.5
3.0
3.5
4.0
4.5
Lundin Candelaria Pro-Forma
Source: Company filings.
Notes: Lundin production profile based on mid-point of 3-yr guidance provided in December 2013. Copper profile does not include any future expansions at Tenke. Includes attributable production from TenkeFungurume and Candelaria (where applicable).
(1) Reflects full year production from Candelaria for illustrative purposes.
Impact to Copper Production (kt) Impact to Copper 2P Reserves (Mt)
48
Enhances Lundin's Copper Exposure
(1)
Percentage Increase over 2013: +103% +129%
Candelaria (80%) Lundin StandaloneCandelaria (80%) Lundin Standalone
49
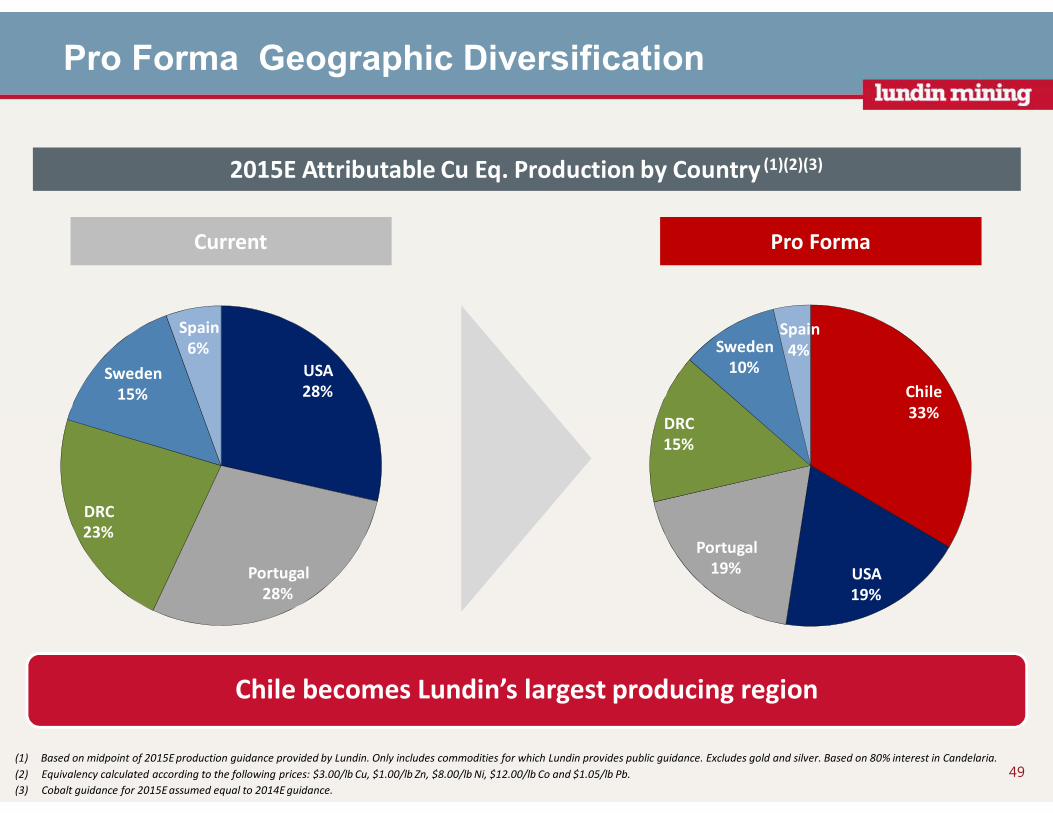
(1) Based on midpoint of 2015E production guidance provided by Lundin. Only includes commodities for which Lundin provides public guidance. Excludes gold and silver. Based on 80% interest in Candelaria.
(2) Equivalency calculated according to the following prices: $3.00/lb Cu, $1.00/lb Zn, $8.00/lb Ni, $12.00/lb Co and $1.05/lb Pb.
(3) Cobalt guidance for 2015E assumed equal to 2014E guidance.
Pro Forma Geographic Diversification
2015E Attributable Cu Eq. Production by Country (1)(2)(3)
Current Pro Forma
USA
28%
Portugal
28%
DRC
23%
Sweden
15%
Spain
6%
Chile
33%
USA
19%
Portugal
19%
DRC
15%
Sweden
10%
Spain
4%
Chile becomes Lundin’s largest producing region
50
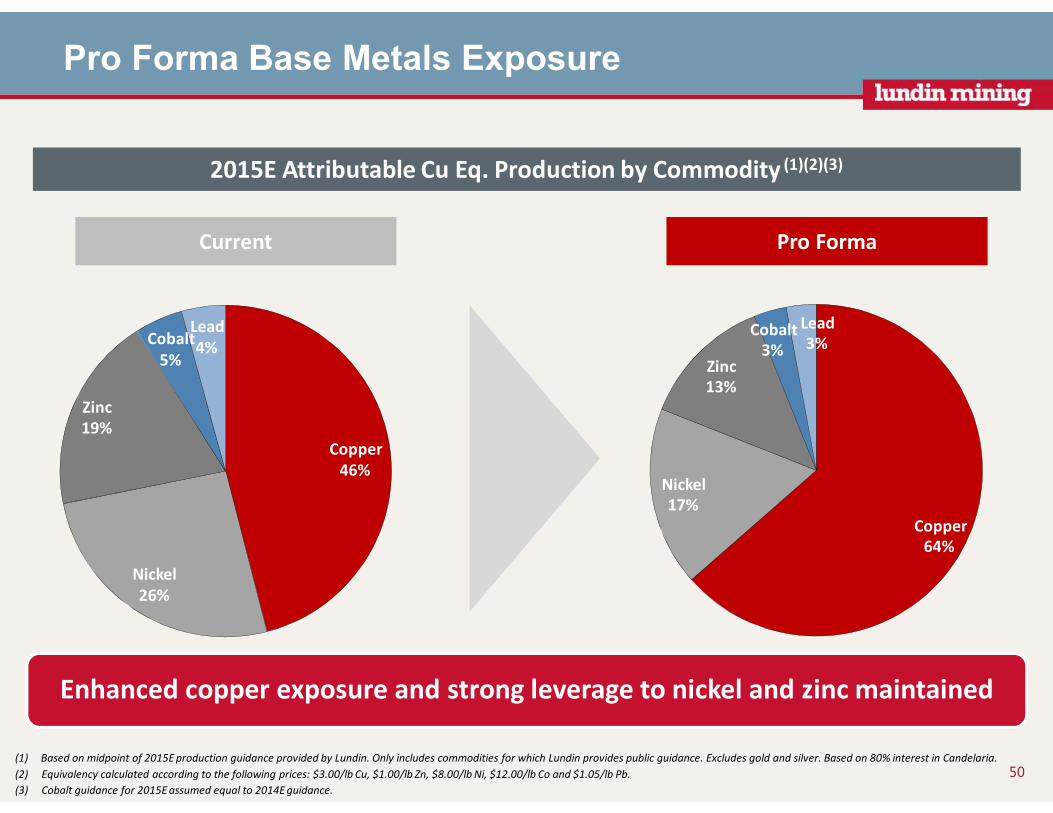
2015E Attributable Cu Eq. Production by Commodity (1)(2)(3)
Pro Forma Base Metals Exposure
Pro FormaCurrent
(1) Based on midpoint of 2015E production guidance provided by Lundin. Only includes commodities for which Lundin provides public guidance. Excludes gold and silver. Based on 80% interest in Candelaria.
(2) Equivalency calculated according to the following prices: $3.00/lb Cu, $1.00/lb Zn, $8.00/lb Ni, $12.00/lb Co and $1.05/lb Pb.
(3) Cobalt guidance for 2015E assumed equal to 2014E guidance.
Copper
46%
Nickel
26%
Zinc
19%
Cobalt
5%
Lead
4%
Copper
64%
Nickel
17%
Zinc
13%
Cobalt
3%
Lead
3%
Enhanced copper exposure and strong leverage to nickel and zinc maintained
Enhanced earnings and cash flow per share with the addition of an
established, large scale, high quality operation
Diverse geographic and base metals portfolio - copper, zinc and nickelDiverse geographic and base metals portfolio - copper, zinc and nickel
Maintains a conservative balance sheet going forwardMaintains a conservative balance sheet going forward
Further strengthens asset base of long-life mines with strong growth potentialFurther strengthens asset base of long-life mines with strong growth potential
Lundin Mining – with Candelaria
Secures Lundin’s position as a leading intermediate base metals
producer with competitive costs
Secures Lundin’s position as a leading intermediate base metals
producer with competitive costs
51
Questions and Answers