Embed Size (px)
Citation preview
RE S E A R C H AR T I C L E
Early Adolescents Perceptions of Healthand Health Literacy*
STEPHEN L. BROWN, PhDa
JAMES A. TEUFEL, MPHb
DAVID A. BIRCH, PhD, CHESc
ABSTRACT
BACKGROUND: Health illiteracy is a societal issue that, if addressed successfully,
may help to reduce health disparities. It has been associated with increased rates of
hospital admission, health care expenditures, and poor health outcomes. Because of
this, much of the research in the United States has focused on adults in the health
care system. This study investigated the effect of aspects of health literacy on the
motivation to practice health-enhancing behaviors among early adolescents.
METHODS: Measures were generally based on 3 National Health Education Stand-
ards for grades 5-8. Data were obtained from 1178 9- to 13-year-old students visiting
11 health education centers in 7 states. Students responded via individual electronic
keypads.
RESULTS: Multivariate logistic regression revealed that, in addition to age, difficulty
understanding health information and belief that kids can do little to affect their
future health, decreased the likelihood for interest in and desire to follow what they
were taught about health. Further, low interest independently decreased motivation to
follow what was taught. Girls were more likely to turn to school, parents, and medical
personnel for health information. Older students were more likely to turn to school
and to the Internet.
CONCLUSIONS: Programs and curricula should be designed to increase student
interest in health issues and their self-efficacy in controlling their own health destinies.
Educators should also teach students to more effectively use nonconventional health
information sources such as the Internet, parents, and medical professionals.
Keywords: health literacy; early adolescents.
Citation: Brown SL, Teufel JA, Birch DA. Early adolescents perceptions of health and
health literacy. J Sch Health. 2007; 77: 7-15.
aAssistant Professor, ([email protected]), Department of Health Education, Southern Illinois University Carbondale, Carbondale, IL 62901-4632.bDoctoral Student, ([email protected]), Department of Health Education, Southern Illinois University Carbondale, Carbondale, IL 62901-4632.cProfessor and Chair ([email protected]), Department of Health Education, Southern Illinois University, Carbondale, Carbondale, IL 62901-4632.
Address correspondence to: Stephen L. Brown, ([email protected]), Professor, Department of Health Education, Southern Illinois University Carbondale,Carbondale, IL 62901-4632.
This study was completed with funding help from the National Association of Health Education Centers and KidsHealth (the Nemours Foundation’s Center forChildren’s Health Media).
Timeframe: Data collection took place in a 3-week period in November 2004.
*Article is available for CHES CECH. Complete the exam at the back of this issue or go to: www.ashaweb.org/continuing_education.html
Journal of School Health d January 2007, Vol. 77, No. 1 d ª 2007, American School Health Association d 7
Health literacy is defined in Healthy People 2010
as ‘‘The degree to which individuals have the
capacity to obtain, process, and understand basic
health information and services needed to make
appropriate health decisions.’’1 Much of the health
literacy research in the United States has focused on
adults in the health care system. Lower levels of
health literacy have been associated with increased
rates of hospital admission, increased health care ex-
penditures, and worse health outcomes.2-4 The issue
of health illiteracy also presents ethical and societal
concerns because it may be linked to health dispar-
ities in the United States.1,5
However, the conventional research perspective is
functionally too narrow because health literacy in-
volves more than the ability to navigate the health
care system or follow doctors’ directions.6 As sug-
gested by the Institute of Medicine, health literacy
should be seen in an ecological framework that in-
cludes 3 systemic influences: (1) the health care sys-
tem, (2) culture or society, and (3) the educational
system.3 Adult medical health literacy research pri-
marily focuses on only 1 of these categories of influ-
ence and needs to be supplemented with other types
of research, especially research on younger samples.
Adult Health LiteracyBecause literacy skills are a key component in the
development of health literacy,3,7 adult health liter-
acy in the United States has been primarily assessed
with the Health Activities Literacy Scale (HALS). The
HALS includes literacy assessments across 5 domains—
health promotion, health protection, disease preven-
tion, health care and maintenance, and systems navi-
gation.7 However, the Joint Committee on National
Health Education Standards and others have reasoned
that health literate individuals need to do more than
comprehend written language as assessed by the
HALS. They should also be able to verbally communi-
cate (speaking, as well as listening) and to analyze
and evaluate health information, skills, and sources.3,8
If these additional requirements (ie, verbal communi-
cation, analysis, and evaluation) are added as requi-
sites for an individual to be categorized as health
literate, then the HALS assessment is likely an under-
estimate of real health illiteracy in the United States.
Early Adolescent Health LiteracyEducation is recognized as an important influence
on both general literacy and health literacy skills.3,7
Although there is a breadth of research regarding
early adolescent literacy skills (reading, writing, and
quantifying), relatively few large studies have
focused on early adolescent health literacy. Most of
the work related to health literacy in K-12 educa-
tional setting use the National Health Education
Standards (NHES) as a framework for research and
discussion.8 The NHES highlights specific proficien-
cies for school-age children and early adolescents
that are assumed to be essential in the development
and maintenance of a functionally health literate
individual. According to the NHES, these proficien-
cies are (1) critical thinking and problem solving, (2)
responsibility and productivity, (3) self-directedness,
and (4) effective communication.8
The School Health Policies and Programs Study of
2000 found that the majority of states use the NHES
as a guide for their health education curricula and
that most elementary and middle schools offer some
type of health education. However, there were dis-
crepancies among schools regarding the content,
consistency, and durations of health education.9
KidsHealth KidsPoll of Health LiteracySurveying early adolescents using questions based
on the NHES could provide data that could be used
to improve the delivery of health education designed
to increase health literacy. For the KidsHealth Kids-
Poll, questions were developed to measure the
degree to which students understand, are interested
in, and apply health information. Students were also
asked their opinions of various sources of health
information. Although not specifically written to
measure the performance indicators, the questions
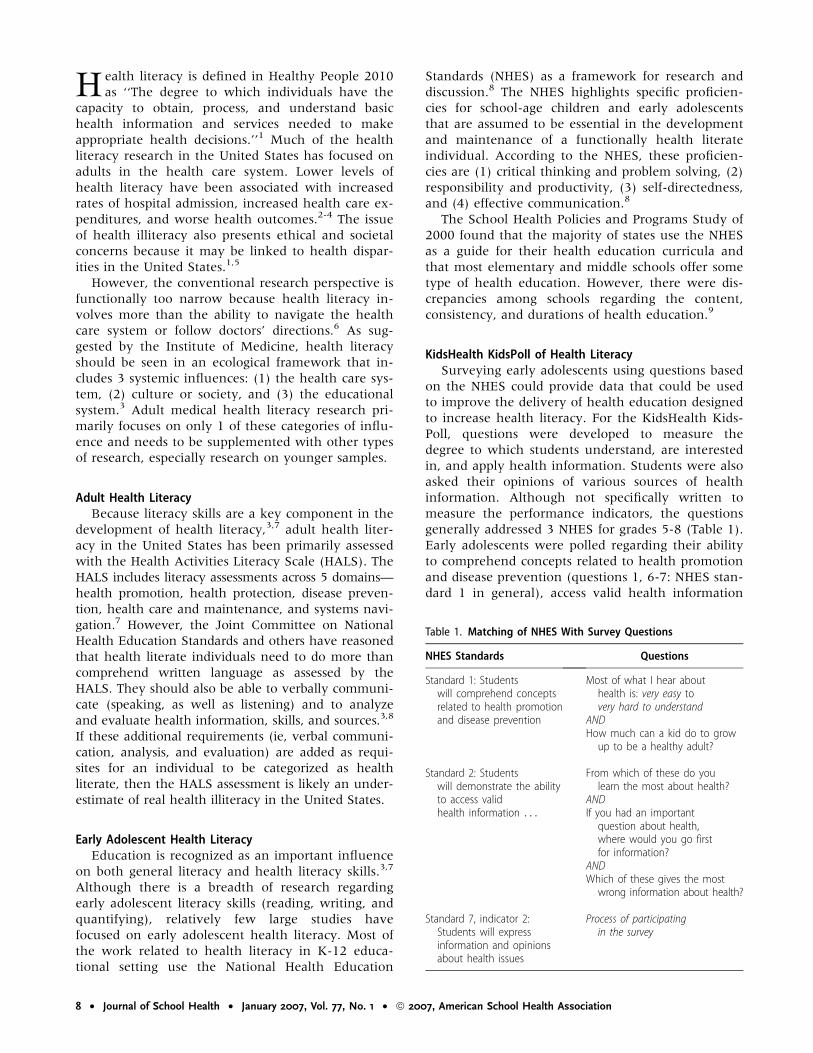
generally addressed 3 NHES for grades 5-8 (Table 1).
Early adolescents were polled regarding their ability
to comprehend concepts related to health promotion
and disease prevention (questions 1, 6-7: NHES stan-
dard 1 in general), access valid health information
Table 1. Matching of NHES With Survey Questions
NHES Standards Questions
Standard 1: Studentswill comprehend conceptsrelated to health promotionand disease prevention
Most of what I hear abouthealth is: very easy tovery hard to understand
ANDHow much can a kid do to growup to be a healthy adult?
Standard 2: Studentswill demonstrate the abilityto access validhealth information . . .
From which of these do youlearn the most about health?
ANDIf you had an importantquestion about health,where would you go firstfor information?
ANDWhich of these gives the mostwrong information about health?
Standard 7, indicator 2:Students will expressinformation and opinionsabout health issues
Process of participatingin the survey
8 d Journal of School Health d January 2007, Vol. 77, No. 1 d ª 2007, American School Health Association
(questions 2-4: NHES standard 2, indicators 1-3),
and, as a process of participating in this poll, demon-
strate the ability to advocate for health by sharing
information (NHES standard 7, indicator 2).
Questions were also similar to other polls of adults
and early adolescents using self-report of or opinions
of health.10-12 For this study, early adolescents re-
ported the source from which they learn most about
health, as well as the source they would go to first if
they had an important question about health. Further,
their interests in learning about health and their per-
ceptions of their own health status were also assessed.
Studies have consistently demonstrated that early
adolescents in the Untied States and elsewhere can
validly and reliably self-report their own emotional,
behavioral, psychological, and somatic health.13-15
METHODS
SampleWe obtained data from 1178 adolescents, aged
9-13 years, who attended programs at 11 health edu-
cation centers in the United States. These centers, all
members of the National Association of Health Educa-
tion Centers, are located in 7 states: Illinois, Indiana,
Michigan, North Carolina, Ohio, Pennsylvania, and
Wisconsin. The centers, which are not affiliated with
schools, are similar to youth science centers, except
that they have the primary goal of teaching about
health and the human body.
Following university institutional review board
approval, center staff contacted officials at each
school, prior to the school’s scheduled trip to the
center, to arrange permission to give the survey dur-
ing the visit. Parental permission for the survey was
passive and was given with the permission to attend
the field trip. Class selection was convenient to the
classes scheduled for visits during the study period
in November 2004 and to the schools extending per-
mission. Staffs at each center were instructed to solicit
enough 4th- through 8th- grade classes to include
100-200 respondents per center. To further facilitate
intracenter variability, centers recruited no more than
2 classes from the same grade and no more than 2
classes from the same school. Center staff invited, but
did not require, all students in a selected class to par-
ticipate. Classes from 35 schools participated.
ProceduresData were collected using computer systems
(Classroom Response System or Audience Response System)
that combine data from multiple students responding
via individual electronic keypads. Preceding or fol-
lowing a health education program on an unrelated
topic, center staff explained the purpose of the study
and taught the selected classes to use the handheld
keypads. Trained staff read to the students the in-
structions for the survey and then read each ques-
tion and answer choice as they simultaneously
appeared on a large screen in the front of the room.
Participating students indicated their choices by
pressing corresponding letters on their keypads.
Participation was voluntary, and all respondents re-
mained anonymous.
MeasuresWe collected data at 2 levels: student and school.
We obtained student-level data from individual stu-
dents via handheld keypads. The students were
given 2 demographic questions (age and gender) and
8 questions dealing with aspects of health literacy.
Based on literature review and previous surveys at
these centers, a research advisory team and the au-
thors developed a large pool of original questions and
a survey script related to 3 of the NHES for grades 5-8.
Content and face validity were established by the
advisory team, which included researchers with ex-
pertise in health literacy. The advisory team consisted
of a child psychologist, parents, 2 center directors, a
pediatrician, 2 researchers with topic expertise, and
the authors.
We piloted the survey with 2 classes at 1 health
education center. Following each pilot, center staff
asked a sample of the adolescents who took the survey
and the teachers and other adults present for qualita-
tive responses regarding the appropriateness, wording,
and answer choices of the survey. We shortened and
revised the survey and script based on the pilots and
qualitative feedback. Due to the method of data collec-
tion, remote keypads, all of the questions were closed-
end with a maximum of 5 answer choices. Therefore,
the answer choices for the questions addressing infor-
mation sources were each limited to the 5 answers
given most often during pilot testing. Answer choices
for questions referring to information sources were
presented in the same order for every question.
Center staff also recorded the size of each class
and the school and school district to which the class
belonged. From this information, we were able to
obtain, from the National Center for Education Sta-
tistics (NCES),16 school-level data for all the schools.
Among other statistics, the NCES reports school size,
urban-to-rural locale code, ethnic/racial proportions,
and proportions participating in free or reduced-
lunch programs.
AnalysisWe calculated proportions for each demographic,
personal belief, and personal behavior variable. We
also evaluated differences in these variables by re-
spondent characteristics (gender and age) by chi-square
tests. Through multiple logistic regression analyses,
we examined associations between predictor variables
Journal of School Health d January 2007, Vol. 77, No. 1 d ª 2007, American School Health Association d 9
(gender, age, beliefs, and behaviors) and outcome
variables (interest in learning about health and desire
to follow what is taught). For these analyses, we re-
coded responses to each outcome into dichotomous
categories: interested versus uninterested and try to
follow most or all the time versus sometimes or less.
As a measure of effect, we present crude odds ratios
and 95% confidence intervals (CIs). Next, we used
multivariate logistic regression to examine the associ-
ation between each dichotomous outcome and the 6
predictor variables simultaneously. We report these
effects as adjusted odds ratios with associated 95%
CIs. A CI that includes the value ‘‘1’’ indicates a non-
significant association (p . .05). Finally, we ran
a nominal logistic regression of gender and age on 3
categorical responses (source learned the most from,
first source sought with a question, and source with
most wrong information). For the nominal logistic
regression, we recoded age into bivariate categories: 9-
11 and 12-13. From the nominal logistic regression
analysis, we report the results of the likelihood ratio
tests and the parameter estimates to show whether
gender and age, in a simultaneous model, affect the
likelihood of giving various responses to these poly-
chotomous categorical items.
In addition, we calculated average proportions
across schools for school-level variables (ethnicity,
reduced-lunch participation, and locale code). We
must note that these variables do not represent the
individual student but the school that the student at-
tends. For example, a high score for reduced-lunch
participation means that the student attended a
school where a large percentage of the students
received reduced lunch, not necessarily that that
student received reduced lunch.
RESULTS
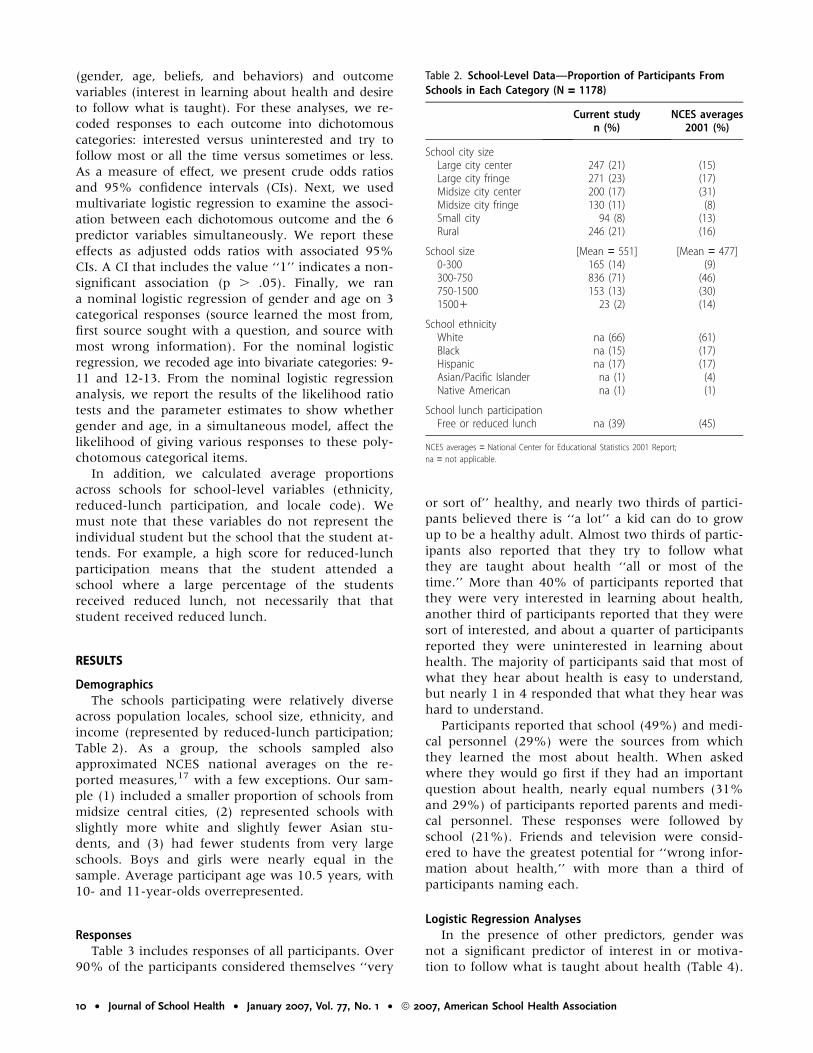
DemographicsThe schools participating were relatively diverse
across population locales, school size, ethnicity, and
income (represented by reduced-lunch participation;
Table 2). As a group, the schools sampled also
approximated NCES national averages on the re-
ported measures,17 with a few exceptions. Our sam-
ple (1) included a smaller proportion of schools from
midsize central cities, (2) represented schools with
slightly more white and slightly fewer Asian stu-
dents, and (3) had fewer students from very large
schools. Boys and girls were nearly equal in the
sample. Average participant age was 10.5 years, with
10- and 11-year-olds overrepresented.
ResponsesTable 3 includes responses of all participants. Over
90% of the participants considered themselves ‘‘very
or sort of’’ healthy, and nearly two thirds of partici-
pants believed there is ‘‘a lot’’ a kid can do to grow
up to be a healthy adult. Almost two thirds of partic-
ipants also reported that they try to follow what
they are taught about health ‘‘all or most of the
time.’’ More than 40% of participants reported that
they were very interested in learning about health,
another third of participants reported that they were
sort of interested, and about a quarter of participants
reported they were uninterested in learning about
health. The majority of participants said that most of
what they hear about health is easy to understand,
but nearly 1 in 4 responded that what they hear was
hard to understand.
Participants reported that school (49%) and medi-
cal personnel (29%) were the sources from which
they learned the most about health. When asked
where they would go first if they had an important
question about health, nearly equal numbers (31%
and 29%) of participants reported parents and medi-
cal personnel. These responses were followed by
school (21%). Friends and television were consid-
ered to have the greatest potential for ‘‘wrong infor-
mation about health,’’ with more than a third of
participants naming each.
Logistic Regression AnalysesIn the presence of other predictors, gender was
not a significant predictor of interest in or motiva-
tion to follow what is taught about health (Table 4).
Table 2. School-Level Data—Proportion of Participants FromSchools in Each Category (N = 1178)
Current study NCES averages2001 (%)n (%)
School city sizeLarge city center 247 (21) (15)Large city fringe 271 (23) (17)Midsize city center 200 (17) (31)Midsize city fringe 130 (11) (8)Small city 94 (8) (13)Rural 246 (21) (16)
School size [Mean = 551] [Mean = 477]0-300 165 (14) (9)300-750 836 (71) (46)750-1500 153 (13) (30)15001 23 (2) (14)
School ethnicityWhite na (66) (61)Black na (15) (17)Hispanic na (17) (17)Asian/Pacific Islander na (1) (4)Native American na (1) (1)
School lunch participationFree or reduced lunch na (39) (45)
NCES averages = National Center for Educational Statistics 2001 Report;
na = not applicable.
10 d Journal of School Health d January 2007, Vol. 77, No. 1 d ª 2007, American School Health Association
Table 3. Frequencies of Responses by Gender and Age
TotalBoys (%) Girls (%) 9 (%) 10 (%) 11 (%) 12 (%) 13 (%)n (%)
Total 48.3 51.7 27.9 28.8 15.4 13.1 14.81. Most of what I hear abouthealth is:*,†
Very easy to understand 397 (37.1) 42.0 32.4 38.3 41.8 35.4 29.9 30.8Sort of easy to understand 438 (41.0) 35.5 46.1 36.0 43.8 44.9 43.8 38.5Sort of hard to understand 164 (15.3) 14.0 16.5 17.4 11.4 13.9 19.7 19.9Very hard to understand 70 (6.5) 8.6 5.0 8.3 3.0 5.7 6.6 10.9
2. From which of these do youlearn the most about health?*,†
The Internet 85 (8.5) 9.9 6.9 8.4 5.9 10.2 10.0 8.6School 403 (40.2) 35.3 42.9 26.6 40.3 43.3 52.3 55.7Parents 124 (12.4) 11.3 14.0 10.3 14.3 14.2 9.2 10.0A doctor or nurse 295 (29.4) 31.3 28.8 41.1 32.6 22.0 21.5 15.0Some other way 96 (9.6) 12.1 7.5 13.7 7.0 10.2 6.9 10.7
3. If you had an important questionabout health, where would you gofirst for information?†
The Internet 129 (12.0) 14.0 10.1 7.7 8.4 14.5 20.6 19.4School 225 (21.0) 19.1 21.2 20.4 21.2 16.7 19.8 20.0Parents 327 (30.5) 28.4 33.7 29.9 32.3 37.7 31.3 31.0A doctor or nurse 313 (29.2) 30.7 27.9 32.7 32.3 26.8 22.1 23.9Some other way 77 (7.2) 7.8 7.0 9.2 5.7 4.3 6.1 5.8
4. Which of these gives the mostwrong information about health?†
The Internet 65 (6.2) 6.3 6.3 7.5 6.6 7.3 3.9 3.9TV 373 (35.5) 37.2 33.5 42.3 38.9 37.2 21.1 21.3School 53 (5.0) 6.3 3.9 3.6 3.5 7.3 3.1 10.3Friends 383 (36.4) 34.3 38.6 26.3 34.4 37.2 56.3 47.7I‘m not sure 178 (16.9) 15.9 17.7 20.3 16.7 10.9 15.6 16.8
5. I try to follow what I’m taughtabout health:†
All the time 368 (33.4) 35.2 31.6 45.6 41.3 28.0 21.6 13.5Most of the time 361 (32.8) 30.4 35.7 31.4 35.9 34.4 37.4 29.0Sometimes 209 (19.0) 17.6 20.7 13.1 14.4 22.3 28.1 31.0Hardly ever 57 (5.2) 5.5 3.6 2.8 3.0 5.7 4.3 7.1Never 107 (9.7) 11.3 8.4 7.1 5.4 9.6 8.6 19.4
6. How much can a kid do to growup to be a healthy adult?*,†
A lot 709 (63.5) 61.8 65.0 69.0 67.1 63.4 58.4 57.6Some 187 (16.7) 15.1 18.8 8.7 17.4 17.4 29.9 17.1A little 42 (3.8) 4.8 2.2 4.9 2.3 2.5 2.9 1.3Almost nothing 23 (2.1) 3.8 0.6 1.0 1.3 3.7 0.0 3.8I don‘t know 156 (14.0) 14.5 13.4 16.4 11.8 13.0 8.8 20.3
7. How interested are you inlearning about health?*,†
Very interested 471 (41.9) 40.7 43.5 63.6 41.5 32.5 25.4 18.8Sort of interested 422 (37.5) 37.5 39.1 25.4 44.1 45.0 47.9 39.0Sort of uninterested 90 (8.0) 6.2 9.0 3.8 6.9 9.4 12.7 14.3Very uninterested 142 (12.6) 15.7 8.3 7.2 7.5 13.1 14.1 27.9
8. I consider myself to be:†
Very healthy 656 (58.8) 58.5 58.5 73.4 63.2 45.6 50.0 42.4Sort of healthy 381 (34.1) 33.1 35.7 22.5 30.3 43.1 43.6 49.6Sort of unhealthy 34 (3.0) 3.8 2.4 2.0 2.9 3.1 2.9 4.3Very unhealthy 45 (4.0) 4.6 3.4 2.0 3.6 8.1 3.6 3.6
*v2 tests statistically significant for gender (p , .05), †v2 tests statistically significant for age (p , .05); N = 1125.
Journal of School Health d January 2007, Vol. 77, No. 1 d ª 2007, American School Health Association d 11
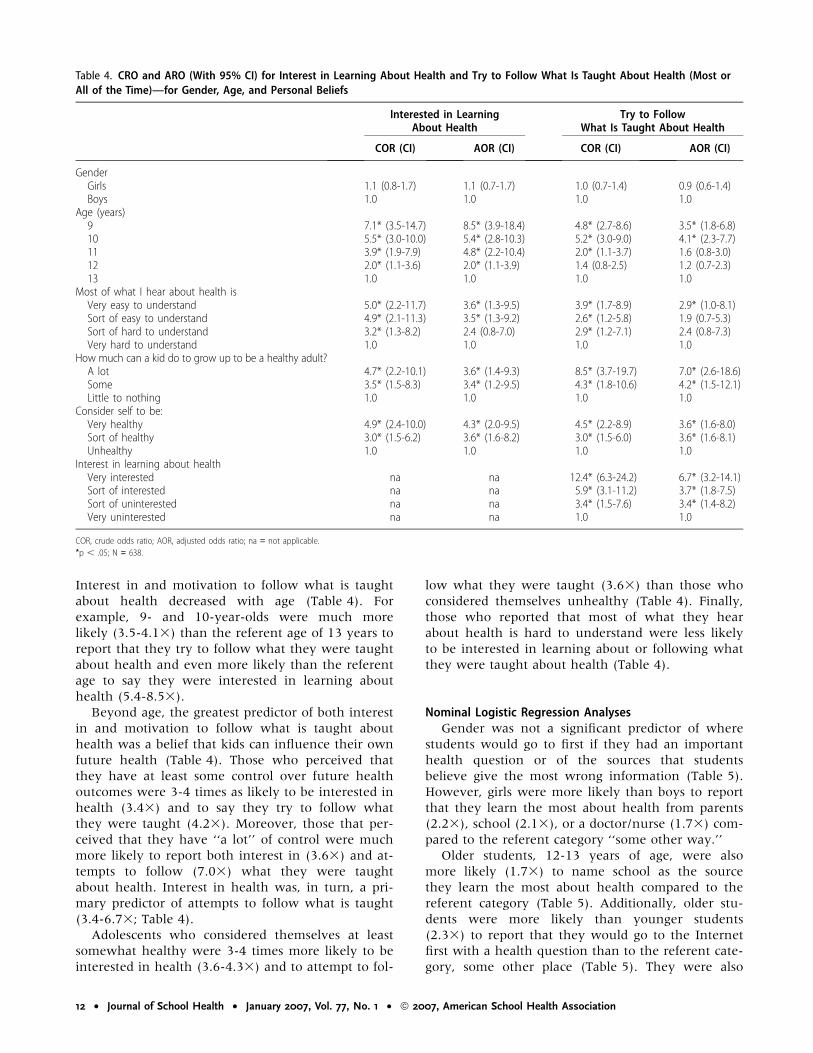
Interest in and motivation to follow what is taught
about health decreased with age (Table 4). For
example, 9- and 10-year-olds were much more
likely (3.5-4.13) than the referent age of 13 years to
report that they try to follow what they were taught
about health and even more likely than the referent
age to say they were interested in learning about
health (5.4-8.53).
Beyond age, the greatest predictor of both interest
in and motivation to follow what is taught about
health was a belief that kids can influence their own
future health (Table 4). Those who perceived that
they have at least some control over future health
outcomes were 3-4 times as likely to be interested in
health (3.43) and to say they try to follow what
they were taught (4.23). Moreover, those that per-
ceived that they have ‘‘a lot’’ of control were much
more likely to report both interest in (3.63) and at-
tempts to follow (7.03) what they were taught
about health. Interest in health was, in turn, a pri-
mary predictor of attempts to follow what is taught
(3.4-6.73; Table 4).
Adolescents who considered themselves at least
somewhat healthy were 3-4 times more likely to be
interested in health (3.6-4.33) and to attempt to fol-
low what they were taught (3.63) than those who
considered themselves unhealthy (Table 4). Finally,
those who reported that most of what they hear
about health is hard to understand were less likely
to be interested in learning about or following what
they were taught about health (Table 4).
Nominal Logistic Regression AnalysesGender was not a significant predictor of where
students would go to first if they had an important
health question or of the sources that students
believe give the most wrong information (Table 5).
However, girls were more likely than boys to report
that they learn the most about health from parents
(2.23), school (2.13), or a doctor/nurse (1.73) com-
pared to the referent category ‘‘some other way.’’
Older students, 12-13 years of age, were also
more likely (1.73) to name school as the source
they learn the most about health compared to the
referent category (Table 5). Additionally, older stu-
dents were more likely than younger students
(2.33) to report that they would go to the Internet
first with a health question than to the referent cate-
gory, some other place (Table 5). They were also
Table 4. CRO and ARO (With 95% CI) for Interest in Learning About Health and Try to Follow What Is Taught About Health (Most orAll of the Time)—for Gender, Age, and Personal Beliefs
Interested in LearningAbout Health
Try to FollowWhat Is Taught About Health
COR (CI) AOR (CI) COR (CI) AOR (CI)
GenderGirls 1.1 (0.8-1.7) 1.1 (0.7-1.7) 1.0 (0.7-1.4) 0.9 (0.6-1.4)Boys 1.0 1.0 1.0 1.0
Age (years)9 7.1* (3.5-14.7) 8.5* (3.9-18.4) 4.8* (2.7-8.6) 3.5* (1.8-6.8)10 5.5* (3.0-10.0) 5.4* (2.8-10.3) 5.2* (3.0-9.0) 4.1* (2.3-7.7)11 3.9* (1.9-7.9) 4.8* (2.2-10.4) 2.0* (1.1-3.7) 1.6 (0.8-3.0)12 2.0* (1.1-3.6) 2.0* (1.1-3.9) 1.4 (0.8-2.5) 1.2 (0.7-2.3)13 1.0 1.0 1.0 1.0
Most of what I hear about health isVery easy to understand 5.0* (2.2-11.7) 3.6* (1.3-9.5) 3.9* (1.7-8.9) 2.9* (1.0-8.1)Sort of easy to understand 4.9* (2.1-11.3) 3.5* (1.3-9.2) 2.6* (1.2-5.8) 1.9 (0.7-5.3)Sort of hard to understand 3.2* (1.3-8.2) 2.4 (0.8-7.0) 2.9* (1.2-7.1) 2.4 (0.8-7.3)Very hard to understand 1.0 1.0 1.0 1.0
How much can a kid do to grow up to be a healthy adult?A lot 4.7* (2.2-10.1) 3.6* (1.4-9.3) 8.5* (3.7-19.7) 7.0* (2.6-18.6)Some 3.5* (1.5-8.3) 3.4* (1.2-9.5) 4.3* (1.8-10.6) 4.2* (1.5-12.1)Little to nothing 1.0 1.0 1.0 1.0
Consider self to be:Very healthy 4.9* (2.4-10.0) 4.3* (2.0-9.5) 4.5* (2.2-8.9) 3.6* (1.6-8.0)Sort of healthy 3.0* (1.5-6.2) 3.6* (1.6-8.2) 3.0* (1.5-6.0) 3.6* (1.6-8.1)Unhealthy 1.0 1.0 1.0 1.0
Interest in learning about healthVery interested na na 12.4* (6.3-24.2) 6.7* (3.2-14.1)Sort of interested na na 5.9* (3.1-11.2) 3.7* (1.8-7.5)Sort of uninterested na na 3.4* (1.5-7.6) 3.4* (1.4-8.2)Very uninterested na na 1.0 1.0
COR, crude odds ratio; AOR, adjusted odds ratio; na = not applicable.
*p , .05; N = 638.
12 d Journal of School Health d January 2007, Vol. 77, No. 1 d ª 2007, American School Health Association
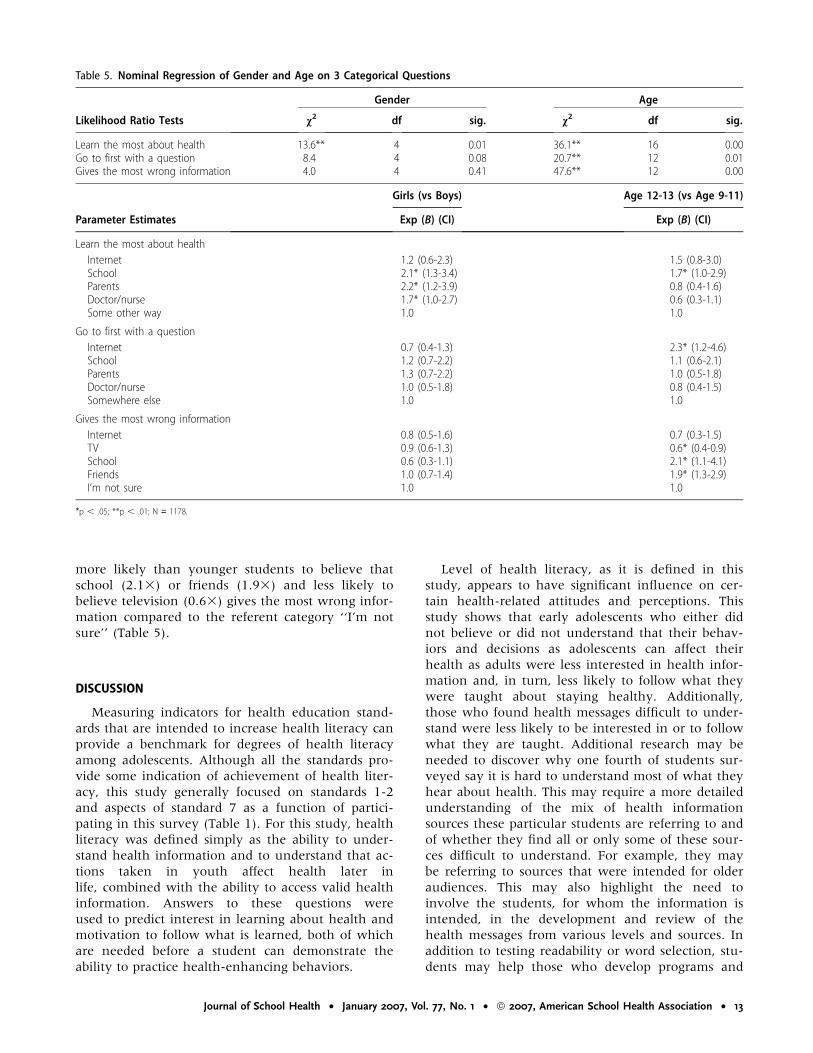
more likely than younger students to believe that
school (2.13) or friends (1.93) and less likely to
believe television (0.63) gives the most wrong infor-
mation compared to the referent category ‘‘I’m not
sure’’ (Table 5).
DISCUSSION
Measuring indicators for health education stand-
ards that are intended to increase health literacy can
provide a benchmark for degrees of health literacy
among adolescents. Although all the standards pro-
vide some indication of achievement of health liter-
acy, this study generally focused on standards 1-2
and aspects of standard 7 as a function of partici-
pating in this survey (Table 1). For this study, health
literacy was defined simply as the ability to under-
stand health information and to understand that ac-
tions taken in youth affect health later in
life, combined with the ability to access valid health
information. Answers to these questions were
used to predict interest in learning about health and
motivation to follow what is learned, both of which
are needed before a student can demonstrate the
ability to practice health-enhancing behaviors.
Level of health literacy, as it is defined in this
study, appears to have significant influence on cer-
tain health-related attitudes and perceptions. This
study shows that early adolescents who either did
not believe or did not understand that their behav-
iors and decisions as adolescents can affect their
health as adults were less interested in health infor-
mation and, in turn, less likely to follow what they
were taught about staying healthy. Additionally,
those who found health messages difficult to under-
stand were less likely to be interested in or to follow
what they are taught. Additional research may be
needed to discover why one fourth of students sur-
veyed say it is hard to understand most of what they
hear about health. This may require a more detailed
understanding of the mix of health information
sources these particular students are referring to and
of whether they find all or only some of these sour-
ces difficult to understand. For example, they may
be referring to sources that were intended for older
audiences. This may also highlight the need to
involve the students, for whom the information is
intended, in the development and review of the
health messages from various levels and sources. In
addition to testing readability or word selection, stu-
dents may help those who develop programs and
Table 5. Nominal Regression of Gender and Age on 3 Categorical Questions
Gender Age
Likelihood Ratio Tests v2 df sig. v2 df sig.
Learn the most about health 13.6** 4 0.01 36.1** 16 0.00Go to first with a question 8.4 4 0.08 20.7** 12 0.01Gives the most wrong information 4.0 4 0.41 47.6** 12 0.00
Girls (vs Boys) Age 12-13 (vs Age 9-11)
Parameter Estimates Exp (B) (CI) Exp (B) (CI)
Learn the most about health
Internet 1.2 (0.6-2.3) 1.5 (0.8-3.0)School 2.1* (1.3-3.4) 1.7* (1.0-2.9)Parents 2.2* (1.2-3.9) 0.8 (0.4-1.6)Doctor/nurse 1.7* (1.0-2.7) 0.6 (0.3-1.1)Some other way 1.0 1.0
Go to first with a question
Internet 0.7 (0.4-1.3) 2.3* (1.2-4.6)School 1.2 (0.7-2.2) 1.1 (0.6-2.1)Parents 1.3 (0.7-2.2) 1.0 (0.5-1.8)Doctor/nurse 1.0 (0.5-1.8) 0.8 (0.4-1.5)Somewhere else 1.0 1.0
Gives the most wrong information
Internet 0.8 (0.5-1.6) 0.7 (0.3-1.5)TV 0.9 (0.6-1.3) 0.6* (0.4-0.9)School 0.6 (0.3-1.1) 2.1* (1.1-4.1)Friends 1.0 (0.7-1.4) 1.9* (1.3-2.9)I’m not sure 1.0 1.0
*p , .05; **p , .01; N = 1178.
Journal of School Health d January 2007, Vol. 77, No. 1 d ª 2007, American School Health Association d 13

curricula identify the types of topics most students at
given ages find interesting or potentially confusing.
This research may also point to personal or social
factors that make these particular students unique.
In this study, students were more likely to report
difficulty understanding health information if
they came from schools with more ethnic minorities
(v2(1) = 5.7, p , .019), or more lower-income fami-
lies, as represented by free-lunch participation
(v2(1) = 34.1, p , .001). Further research is needed
to determine whether this is due to personal, famil-
ial, community, or school variables. For instance,
there may be differences in the resources available,
the cultural appropriateness of the information
delivered at school, or the absence of supporting
messages in the community. This type of research
may help to redesign programs to meet the needs of
these particular students. This type of focus should
also help to increase students’ interest in health edu-
cation, but other efforts may also be necessary, such
as tailoring messages to different learning styles.
Additionally, this research could focus on the best
instrumental approaches to affect behavior early. It
may also be useful to simply investigate the topics
students find most interesting and why.
This study also highlighted issues associated with
ability to access health information (standard 2). For
example, is the finding that school was listed so often
as an information source among older students due
to the fact that students are exposed to more health
education in higher grades or to developmental
maturity? Additionally, parents as a primary source
of health information was surprisingly low even
among younger children. Parents may be missing an
opportunity to reinforce topics about which they are
particularly concerned. If schools are devoting mini-
mal time to health issues and kids do not see parents
as a principal source for health information, they
may be turning to other sources, such as friends or
the Internet, that were not intended to supply them
this information. This low mention of parents may
also be associated with the fact that some schools
may not be using a formal method to reach out to
parents to get them more involved in their child’s
health education. If not currently in place, schools
should consider programs that train parents to
deliver health education and then cast parents in the
roles of important health educators to their children.
There was a surprisingly high mention of medical
personnel as sources of health information. We have
also seen this halo effect with other health topics at
these centers. Schools could take advantage of this
effect by preparing such professionals to be involved
in or to reinforce school programs and curricula.
Additionally, parents could partner with doctors and
nurses by asking them to reinforce, during clinical
visits, messages they are trying to teach their chil-
dren. These practitioners may need additional train-
ing on how to be proactive health educators within
the constraints of a clinical setting and minimal time
per patient.
The Internet also seems to be an important
source, especially for older children; yet few said
that the Internet is a primary source of wrong infor-
mation. As children increasingly use the Internet at
younger ages for all types of information, training
on how to use the Internet to obtain health informa-
tion is becoming more crucial. Curricula at lower
levels should be designed to teach children to distin-
guish valid and poor online information that deals
with health issues.
The limitations of this study warrant consider-
ation. Cross-sectional design prevents causal inferen-
ces due to potential threats to internal validity, and
nonrandom sampling also limits the generalizability
of results. However, the sample did approximate
national demographic characteristics of students in
the United States and was spread across multiple
states. Additionally, limiting answers to 1 of 5 closed-
end options (the 5 most cited during pilot tests) and
the order the answer options were presented also
may have influenced student responses and possibly
attenuated some associations.
Prevention efforts need to start earlier and may be
strengthened by addressing subjective beliefs and by
including an understanding of the perspectives and
preferences of those for whom the programs are
developed. Efforts should extend beyond conven-
tional methods by soliciting and coordinating help
from other potential information sources such as pa-
rents, medical professionals, and health education
centers. Utilizing adolescents as active participants in
health literacy research not only provides important
information to program planners but also may
potentially help to empower or increase the ‘‘buy-
in’’ of some adolescents, thereby increasing their
interest in health information.
REFERENCES
1. US Department of Health and Human Services. Healthy People
2010: understanding and improving health; 2000. Available at:
http://www.healthypeople.gov. Accessed January 10, 2005.
2. Institute of Medicine of the National Academies. Health Literacy:
A Prescription to End Confusion. Washington, DC: The National
Academies Press; 2004.
3. Baker DW, Gazmararian JA, Williams MV, et al. Functional
health literacy and the risk of hospital admission among
Medicare managed care enrollees. Am J Public Health. 2002;
92:1278-1283.
4. Baker DW, Parker R, Williams MV, Clark S. Health literacy and
the risk of hospital admission. J Gen Intern Med. 1998;13:791-798.
5. Erlen J. Functional health literacy: ethical concerns. Orthop
Nurs. 2004;23:150-153.
6. Nutbeam D. Health literacy as a public health goal: a goal for
health education and communication strategies into the 21st
century. Health Promot Int. 2000;15:259-267.
14 d Journal of School Health d January 2007, Vol. 77, No. 1 d ª 2007, American School Health Association
7. Rudd R, Kirsch I, Yamamoto K. Literacy and Health in America: Policy
Information Report. Princeton, NJ: Educational Testing Services; 2004.
8. Joint Committee on National Health Education Standards
(1995). National Health Education Standards: Achieving Health
Literacy. Atlanta, Ga: American Cancer Society.
9. Kann L, Brener N, Allensworth D. Health education: results
from the School Health Policies and Programs Study 2000.
J Sch Health. 2001;71:266-278.
10. Benenson Strategy Group. Survey of the Society for Women’s
Health Research, Berlex Laboratories, from September 4-12,
2001. Data provided by the Roper Center for Public Opinion
Research at the University of Connecticut; 2001. Available at:
http://www.kaisernetwork.org/health_poll/hpoll_index.cfm.
Accessed January 11, 2005.
11. Gallup Organization. Gallup poll conducted from September
5-8, 2002. Data provided by the Roper Center for Public Opin-
ion Research at the University of Connecticut; 2002. Available
at: http://www.kaisernetwork.org/health_poll/hpoll_index.cfm.
Accessed January 11, 2005.
12. International Communications Research. Survey of the Harvard
School of Public Health, Robert Wood Johnson Foundation,
from October 24-28, 2001. Data provided by the Roper Center
for Public Opinion Research at the University of Connecticut;
2001. Available at: http://www.kaisernetwork.org/health_poll/
hpoll_index.cfm. Accessed January 11, 2005.
13. Achenbach T, Dumenci L, Rescorla L. Ten-year comparisons
of problems and competencies for national samples of youth:
self, parent, and teacher reports. J Emotional Behav Disord.
2002;10:194-203.
14. Epstein M, Mooney P, Ryser G, Pierce C. Validity and reli-
ability of the Behavioral and Emotional Rating Scale (2nd Edi-
tion): Youth Rating Scale. Res Soc Work Pract. 2004;14:
358-367.
15. Theunissen N, Vogels T, Koopman H, et al. The proxy prob-
lem: child report versus parent report in health-related quality
of life research. Quality Life Res. 1998;7:387-397.
16. Common Core of Data. National Center for Educational Statis-
tics; 2002-2003. Available at: http://nces.ed.gov/globallocator.
Accessed November 2, 2004.
17. Digest of Educational Statistics. National Center for Educational
Statistics; 2001. Available at: http://nces.ed.gov/programs/digest/
d01. Accessed November 2, 2004.
Journal of School Health d January 2007, Vol. 77, No. 1 d ª 2007, American School Health Association d 15