Embed Size (px)
Citation preview
!!
Early childhood head circumference:
Reference ranges for Ethiopian population
!
!
!
Ephrem'Bililigne'Amare'
!
Centre'for'International'Health'and'department of Pediatrics and Child Health, Addis Ababa
University
Faculty'of'Medicine'and'Dentistry'
University'of'Bergen,'Norway'
2014'
I!!
'
Early childhood head circumference:
Reference ranges for Ethiopian population
'
Ephrem'Bililigne'Amare'
'
'
This'thesis'is'submitted'in'partial'fulfilment'of'the'requirements'for'the'degree'of''
Master'of'Philosophy'in'International'Health'at'the'University'of'Bergen.''
!
!
Centre'for'International'Health'department of Pediatrics and Child Health, Addis Ababa
University'
Faculty'of'Medicine'and'Dentistry'
University'of'Bergen,'Norway'
2014'
II!!
Summary
Background: Hydrocephalus is a condition of increased volume of cerebrospinal fluid
commonly associated with impaired brain function. It is more common in developing countries
and mostly frequently in children. One can expect 3000-6000 new cases of hydrocephalus
annually in Ethiopia. Head circumference (HC) is commonly increased in these children and its
measurement is a simple, quick and inexpensive method of screening for hydrocephalus. Early
treatment, which is now available in Ethiopia, prevents or reduces the development of
malfunction. Since early treatment now has become available in Ethiopia, we were motivated to
establish such a method in the country.
Aims of the study: The aim of this study is to develop reference ranges for HC in Ethiopian
infants and compare this reference with the existing WHO standard.
Materials and methods: This was a prospective cross-sectional study approved by the
ethics review board. Children age 0-24 months attending the mother-and-child clinic primarily
for vaccination program in Addis Ababa and four other main cities of Ethiopia, were recruited to
the study after informed consent. Hydrocephalus or having been treated for hydrocephalus and
other obvious diseases including malnutrition were not included, nor were infants without
documented date of birth. A soft measurement tape was used to measure the circumference in cm
in a standardized way. In addition to measuring HC age, date of birth, ethnicity, medical history
were recorded for all participants. The LMS method was used to establish the reference graphs
for boys and girls. These graphs were compared with WHO and Norwegian charts both by
calculating absolute differences and comparing percentile lines using 95%CI.
Results: 4025 children (2046 boys and 1979 girls) under 24 months were included in the study.
The established reference ranges for boys and girls had a similar pattern to those found in the
WHO and Norwegian studies. The 50th and 97th percentiles of the WHO charts were found to be
significantly below the corresponding Ethiopian lines. The 3rd and 50th Norwegian percentiles
were significantly above the corresponding Ethiopian lines.

III!!
Conclusion: Ethiopian reference ranges for children 0-24 months of age were found to be
significantly different from those established by WHO, suggesting the use of local reference for
the screening for hydrocephalus. We speculate that a trend towards lower 3-percentile values
with advancing age in the Ethiopian children may be due to nutritional or environmental reasons. !
!
IV!!
!
Table!of!contents!
Summary ......................................................................................................................................................II!
Table!of!contents........................................................................................................................................ IV!
Acknowledgement ..................................................................................................................................... VII!
Dedication ................................................................................................................................................ VIII!
1. Introduction ............................................................................................................................................1!
Definition .................................................................................................................................................1!
Signs and symptoms of hydrocephalus .................................................................................................1!
Incidence and prevalence of hydrocephalus.........................................................................................1!
Neurosurgery and hydrocephalus in Africa .........................................................................................3!
Neurosurgeons in Ethiopia ....................................................................................................................4!
Head circumference measurement as a screening tool for hydrocephalus ........................................5!
Significance of the present study ...........................................................................................................7!
2. Objectives of the study ...........................................................................................................................8!
Main objective.........................................................................................................................................8!
Secondary objectives ..............................................................................................................................8!
3. Research design and method ....................................................................................................................9!
General design type ................................................................................................................................9!
Study area and target population..........................................................................................................9!
Data Collection procedures..................................................................................................................11!
Recording the results............................................................................................................................12!
Data management and analysis ...........................................................................................................13!
Statistics and calculations: ...................................................................................................................13!
Quality control ......................................................................................................................................14!
Sample size determination ......................................................................................................................14!
Ethical considerations.............................................................................................................................15!
4. Result......................................................................................................................................................16!
Comparison of HC in between Ethiopian boys and girls aged 0-2 yrs ..................................................21!
Comparison of Ethiopian curves with the WHO curves. ........................................................................23!

V!!
Comparison of the Ethiopian curves with the Norwegian curves. ..........................................................28!
The influence of ethnicity on differences in head circumference of Ethiopian infants. ...........Error!'Bookmark'not'defined.!
5. Discussion and recommendation ...........................................................................................................32!
!
!
!
!
!

VI!!
List of abbreviations
AAU Addis Ababa University
BMI Body Mass Index
CNS Central Nervous System
CI Confidence Interval
CSF Cerebro Spinal Fluid
EDF Equivalent Degrees of Freedom
HC Head Circumference
HIV Human Immunodeficiency Virus
ICP Intra Cranial Pressure
LMS box-cox power Median Coefficient of variation
MGRS Multi- center Growth Reference Study
NPH Normal Pressure Hydrocephalus
RTEM Relative Technical Error of Measurement
SD Standard Deviation
TEM Technical Error of Measurement
UIB Univercity of Bergen
WHO World Health Organization

VII!!
Acknowledgement
I am deeply indebted to my supervisors, Professor Torvid Kiserud and Postdoc. Petur Benedikt Juliusson,
for their unfailing support, wisdom, constructive comments and suggestion in all phases of the
research. Thank you in particular for always making time for me. I am very grateful to have found
you. I look forward to learning from you in the future. I am also grateful for professor Jan Van Den
Broeck, Dr. Andres, Dr. Arvid and Dr. Joakim for helping me a lot at the beginning of this study. I
especially thank the participants of this study, and the staff of the health centers.

VIII!!
Dedication
This dissertation is dedicated to Professor of Emeritus Knut Wester. My academic journey would
have remained a dream had it not been supported by him. I cannot find words to express my
heartfelt gratitude to Professor Knut who inspired me in all my academic and personal growth.
!
!
!
!
!
!
!
!
!
!
1!!
1. Introduction
Definition
Hydrocephalus is a congenital or acquired condition, in which there is a mismatch between
production and elimination of cerebrospinal fluid (CSF), resulting in an accumulation of CSF
and an increased intracranial pressure (ICP), which inevitably will cause permanent brain
damage in the affected children (1-5). The human skull is filled with three compartments; brain,
CSF and blood. An expansion of one compartment is at the expense of another and may result in
severe and irreversible damage (6). If not treated early, it may cause brain damage with
developmental delay, blindness, other neurological problems and in some cases, finally death (7).
Signs and symptoms of hydrocephalus
The signs and symptoms of hydrocephalus are mostly as a result of the increase in intracranial
pressure (ICP), but infants and older children/adults with the disease may have different
manifestations. As the cranial suture is not yet closed in infants, syndrome such as increased
head circumference, tense fontanels, separation of the cranial suture, episodic apnea,
bradycardia, and irritability may occur (8). Older children and adults’ symptoms are usually non
specific and reflect raised intracranial pressure, they include: headache, vomiting, altered level of
consciousness, visual obscuration, papilloedema, cognitive impairment, poor concentration, and
gait disturbance. The rate of onset of the symptoms varies according to the cause of the
hydrocephalus (8).
Incidence and prevalence of hydrocephalus
There have been different studies done on the incidence and prevalence of hydrocephalus, but
almost all are in developed countries. In these countries, pediatric hydrocephalus is mostly a
congenital/developmental disorder with a rather low prevalence and incidence. The incidence of
congenital hydrocephalus has been estimated to be about 0.5 cases per 1000 live births with
overall incidence, including congenital and acquired forms, 3-5 cases per 1000 live births (9, 10).
A study in Norway by Zahl and Wester showed an overall prevalence of hydrocephalus to be
2!!
0.75 cases per 1000 live births (1), and another recent Norwegian study found the prevalence of
idiopathic normal pressure hydrocephalus (NPH) to be 21.9 per 100 000 and the incidence to be
5.5 per 100 000 (11). In Sweden, an overall prevalence of 0.82 per 1000 live births was found,
and the prevalence of infantile hydrocephalus to be 0.49 and 0.33 for children with
myelomeningocoele per 1000 live births (12). Another Swedish study found the prevalence of
infantile hydrocephalus was 6.99 per 1000 in the 1970s (13). Analyzed data from the Czech
National registry from 1961 to 2000 retrospectively found the mean incidence of congenital
hydrocephalus diagnosed both pre and postnatal to be 6.35 per 10 000 live born infants (14).
Similar figures can be found in other western countries. Others show that hydrocephalus is one
of the most commonly encountered conditions in neurosurgery, with estimated prevalence of 1.5-
5 per 10 000 live births (15).
If these prevalences and incidences of hydrocephalus from the countries mentioned above,
should be applied in the developing world, these estimates are likely too low. Moreover, children
born with hydrocephalus in Europe, United States, Japan, and other western societies are likely
to receive surgical attention in the immediate perinatal period or as soon as possible in order to
prevent cerebral damage from increased intracranial pressure.
Hydrocephalus is also a disease of poverty causing a considerable burden in developing societies
such as in Sub-Saharan Africa. The incidence in this region is not yet known, but believed to be
higher than in developed countries. According to a conservative estimate by Mubashir
Mahmood et al., only in East, Central, and Southern Africa region – an area with a combined
population of more than quarter billion (250 million) – the annual incidence of hydrocephalus in
infants is suggested to exceed 14 000 new cases (16). Ben Warf has studied hydrocephalus in
Uganda, and he estimates that the incidence is much higher than in high-income countries. Based
on his estimates, 1000-2000 children with hydrocephalus are born each year in Uganda, a
country with a population of 28 million. Warf points out that this high incidence most likely is
caused by infections, probably 60% of the cases. Central nervous system (CNS) infection such as
meningitis and ventriculitis during the first months of life, are the most common causes. In this
study, 265 (57%) out of 468 hydrocephalus patients were post infectious, 136 cases (29%) were
non-post infectious. Hydrocephalus associated with myelomeningocele was seen in 61 cases
(13%) and associated with encephalocele in five cases (1%). In one patient, the hydrocephalus
3!!
was the probable result of a neonatal intraventricular hemorrhage. The study also tries to
investigate whether there is a correlation between hydrocephalus and HIV, but failed to find an
association. However, the open neural tube defect may in some hydrocephalus patients increase
the likelihood of mother to child transmission of HIV (17). Placing cow dung on the umbilical
stump, which is a harmful traditional practice common in Ethiopian rural areas, may also
contribute to infection (18). HIV and malnutrition, which are quite common in sub-Saharan East
African countries, are known to predispose people to infection. There is therefore reason to
believe that malnutrition and consequent infections also play an important role in the etiology of
hydrocephalus. The Ethiopian incidence is more likely to be closer to that of Uganda than in
European or North American countries. Based on the above estimate of Warf for Uganda, we can
also anticipate the Ethiopian incidence. The population of Ethiopia is approximately three times
that of Uganda. Provided that the Ethiopian incidence of hydrocephalus is equal to that of
Uganda, one can expect 3000-6000 new cases of hydrocephalus annually in Ethiopia. Only a
small fraction of these children will be detected early enough to prevent brain damage, and most
will probably survive with severe neurological and mental deficits, thus, creating a burden to
society and their families. We have made preliminary observations in Addis Ababa indicating
that the prevalence there is 6 - 8 times higher than in the western world.
On top of the high incidence and prevalence in Africa, hydrocephalus comes the challenge of
lacking trained neurosurgical personnel, inadequately equipped public health care facilities, scant
resource allocation, high rates of neonatal infections, poor infrastructure, difficulty in reaching
specialized hospitals that are able to treat hydrocephalus, and high complication rates in patients
who are able to access and receive shunting procedures (16). To conclude, it is a reason to
believe that the prevalence of hydrocephalus in Africa is many times higher than that of
developed nations, and that most cases have an infectious etiology.
Neurosurgery and hydrocephalus in Africa
According to Kalangu’s study on pediatric neurosurgery in Africa in 2000, the problem of
hydrocephalus is complex because most people, including hydrocephalus patients, live in rural
areas far from medical expertise (7). Therefore, most relatives of hydrocephalic children will not
be aware of the possibility of effective treatment, and if they were, they would likely not be able
4!!
to afford to travel to medical centres where such treatment is available. In Ethiopia, this sort of
treatment is currently available only in Addis Ababa. Even those who get diagnosed will be
delayed during their referral process by lack of awareness of treatment options or by seeking
help from traditional healers. On top of this, there is a scarcity of neurosurgeons. There are 565
neurosurgeons on the African continent, making a ratio of 1 neurosurgeon per 1 352 000 people,
whereas the ratio was 1 per 230 000 people in the whole world. In developed countries that ratio
can be even 1 per 81 000 people. The difference in ratio of neurosurgeons per population is
substantial even within Africa. Countries such as Egypt (with 165 neurosurgeons), Algeria (130)
and other North African countries are on one extreme side with a ratio of 1 per 400 000; whereas
sub-Saharan countries such as Ethiopia have only a fraction of that (7).
A study in Kenya showed that among 2000 children with hydrocephalus who were born over the
course of a year, only a lucky 1/4th (500-600 children) will undergo the surgical shunting
procedure. The rest, 3/4th of the cases, remain unfortunate, and do not get a chance of receiving
treatment at all (19).
In Africa where health-seeking behaviour is low, the birth of a child with hydrocephalus can be
taken as a personal failure because certain traditions and cultures think it represents annoyance
from gods or ancestors. Studies from Nigeria in 1985 and in Cameroon in 2011 mention that
“many parents have tried to hide their children’s condition from friends, neighbours, and
extended family, so pressure was exerted on mothers by their families to get rid of the
hydrocephalus child by abandonment in the bush” (20, 21). Thirty-two years later, in 2014,
African children and their desperately helpless parents, still face immense difficulties.
Neurosurgeons in Ethiopia
Hydrocephalus remains a neglected and undertreated pediatric neurosurgical problem in
Ethiopia. Only four neurosurgeons were practicing in Ethiopia in 2006, caring for more than 70
million residents, giving a ratio of 1 neurosurgeon per 17.5 million inhabitants. In the future, this
situation will change, as a training program in neurosurgery has been running since 2006, with 6
more neurosurgeons already graduating, and 20 more residents currently being trained. Thus,
5!!
along with the building-up of the neurosurgical expertise, it is important to improve the
diagnostic tools for detecting hydrocephalus at an early stage.
Head circumference measurement as a screening tool for hydrocephalus
The most commonly used anthropometric measurements for the assessment of growth in child
clinics are length/height, weight and head circumference (HC) or occipito-frontal circumference
(8) reflecting general health and nutritional status of infants. HC can help us monitor the growth
of the brain, because cognitive function, intracranial volume, and brain volume are closely
related to the magnitude of HC (22, 23). Measuring HC is essential when doing physical
examinations, particularly when screening for disorders associated with macrocephaly or
microcephaly. The measurement of HC is an easy, non-invasive, and inexpensive method
routinely included in the physical examination of infants and children. In infants, rapid increase
in head size suggests the presence of hydrocephalus, while microcephalus can be associated with
structural brain abnormalities or genetic syndromes (24). In adults, the diagnosis of
hydrocephalus associated with macrocephaly suggests that the cause of this process occurred
before the complete closure of sutures and fontanels (25), while microcephalus may reflect a
pathogenic mechanism such as idiopathic intracranial hypertension (26).
Therefore, routine measurement of HC in children is a diagnostic tool of utmost importance to
achieve early detection and treatment, hopefully before permanent brain damage has occurred. In
infants and small children, the CSF accumulation and enhanced intracranial pressure causes the
skull to expand, and the condition can therefore be detected by a HC that grows too rapidly. In
western countries, pediatric hydrocephalus is most commonly discovered at an early stage by
such routine HC measurements as Zahl and Wester showed in their nation-wide study from
Norway; 173 (58%) out of 298 neurosurgical pediatric patients were diagnosed with
hydrocephalus, 57 patients (19%) had an intracranial tumor and the rest 68 (23%) had several
other intracranial conditions. Out of all cases, 138 (46%) were diagnosed because of an increased
HC, which was the only symptom in 109 (79%) patients. Seventy-six percent of the
hydrocephalic children were diagnosed before 12 months of age (1). Early and routinely
measuring of HC is also important in diagnosis of brain cancer (17).
6!!
Because of the rapid growth of the brain compared with the rest of the body, the head
circumference increases correspondingly faster than height and weight in the early years. Thus,
at any given age, the brain is closer to its adult size than are height and weight. By the age of
nine months, the brain has reached half of its adult size, and at the age of two years, the brain and
therefore the HC, has reached nearly 80% of the adult size, whereas height and weight have
reached only 50%. Due to this rapid early growth of the brain, the head circumference is more
liable to be affected by malnutrition or diseases in the early years (10).
In early infancy the skull bones are not fused, which allows for brain growth. The rate of
increase in HC differs for different ages. During the first three months it is 3 cm per month, and
then the anterior fontanel closes between 9-18 months. For children between 4 and 6 years of
age, HC growth is only one cm per year (6).
The cut-off for defining small or large heads varies in the litterature. Macrocephaly (an
abnormally large head) in the United States is defined as a head circumference above the 95th
percentile (for normally distributed HC values corresponding to 1.64 standard deviations from
the mean of gender and age specific controls) (27). WHO recommends using the more extreme
97th percentile (28), and the 98th or 99.6th percentiles are proposed in the United Kingdom (29). A
national guideline of Norway used the 3rd and the 97th percentiles specifying that a child whose
HC has crossed two major percentile lines should be referred for further evaluation (1).
Various studies show that serial measurements of the head circumference are more important
than a single measurement. It is known from other studies that the timing for completion of
suture closure depends on the site of the suture, sex of the child and ethnic background (6). In
2006 WHO prepared a multi-centre growth reference study (MGRS), based on data from six
countries (Brazil, Ghana, India, Norway, Oman, USA). All sites included children who were
from affluent societies and who were well-nourished based on the recommendation of WHO
MGRS. The ambition was to create a «standard», showing how children in any part of the world
«should grow» (28). Because of variation in growth between different populations, many
countries have prepared their own growth standards.
7!!
Juliusson et al. found fewer children below -2SD and more children above +2SD when
comparing Norwegian and Belgian data with the WHO standard. This was true for length/height,
weight, BMI and HC. The largest discrepancy was found for HC with the overall percentage
below -2SD being 0.97% (0.70-1.33) for Belgian and only 0.18% (0.05-0.53) for Norwegian
children. The prevalence of children above +2SD was relatively high in both countries; in
Belgium it was 6.55% (5.76-7.42) and in Norway 6.40% (5.19-7.83). In addition, they found the
largest discrepancy in the age group from 1 to 3 years. They also observed that the growth of
children in both Belgium and Norway was generally closer to that of the local reference
population than to that of the WHO standard. Based on this, they recommended use of their local
growth references for monitoring growth of children rather than using the WHO growth
standards (30).
Significance of the present study
Ethiopia is among the African countries that are highly affected by malnutrition causing stunting,
i.e. restricted height (50.7%) and underweight (34.6%) of children less than five years of
age(31). On top of this, pediatric hydrocephalus is among the neglected diseases that have severe
health, social and economic impact on the affected families and communities. As mentioned, it
can be detected by the simple routine of HC measurement(1).
Taking into account facts such as expected high prevalence and incidence of hydrocephalus,
extreme shortage of expertise in neurosurgery and to the lack of a national screening reference, a
first step to improve the care for hydrocephalus in Ethiopia would be to establish reference
ranges and screening routines. Six years ago, the universities of Addis Ababa and Bergen began
a collaborative training of neurosurgeons. As a consequence of this, the accessibility for
hydrocephalus treatment has improved. Therefore, the present study aims at establishing
reference ranges for HC in Ethiopia.
!
!
!

8!!
!
2. Objectives of the study
Main objective
To develop reference ranges for head circumference (HC) for Ethiopian infants
Secondary objectives
1. To compare these new reference ranges for head circumference with the existing WHO
standard.
2. To compare the new reference ranges for head circumference with a Norwegian standard
!
!
!
!
!
!
!
!
!
!
!
9!!
3. Research design and method
General design type
The study design was a prospective, observational cross-sectional study. HC was collected in
healthy children who full fill the inclusion criteria and visited the mother and child clinics at
three health centers in Addis Ababa and four health centers in the cities Mekele, Dessie, Dire
Dawa and Nazeret.
Study area and target population
According to a WHO report for world health statistics in 2012, the total population of Ethiopia
was estimated to be 82 950 000 and those younger than 15 years to constitute 41% of the
population. The annual population growth rate of Ethiopia is 2.3%, which is close to the African
regional growth rate (2.4%). The total fertility rate (4.2%) is less than for the African average
(4.8%). Neonatal, infant and under five year mortality per 1000 live births in Ethiopia is 35, 68
and 106, respectively, while the African average is 34, 75 and, 119 in the same order (32).
Administratively, Ethiopia is structured into nine regional states: Tigray, Affar, Amhara,
Oromiya, Somali, Benishangul-Gumuz, Southern Nations Nationalities and Peoples (SNNP),
Gambela, and Harari in addition to two city administrations, that is, Addis Ababa and Dire Dawa
Administration Councils. The country is home to more than 80 ethnic groups, which vary in
population size from more than 26 million to fewer than 100. The ethnic composition of the
country is shown in the Annex 1. The largest ethnic groups are Oromo (34.5%), Amhara
(26.9%), Somali (6.2%), Tigray (6.1%) and Gurage (2.5%)(32).
Addis Ababa, located about 2,400m above sea level at 9.02° N 38.44° E, is the capital city of
Ethiopia. According to the census conducted in 2007, the population of Addis Ababa is 2 739
551, of whom 1 305 387 are men and 1 434 164 women. It is estimated that presently there are
no rural parts of the city. As it is a capital city, all Ethiopian ethnic groups are represented in the
following pattern: Amhara (47.04%), Oromo (19.51%), Gurage (16.34%), Tigray (6.18%), Silt’e
(2.94%), and Gamo (1.68%) and others (6.31%)(33). The city is administratively divided into 10
parts. There were 26 health centers at the beginning of the data collection, these have now
10!!
increased to about 56; all health centers provide maternal and child health services. These health
clinics are non-profit units rendering services to the public.
Source Population: all children aged ≤24 months who visit the maternal and child health
clinic for any reason.
Study Subjects/Child population: a total of 4025 children who fulfil the inclusion criteria
were measured and included in the study. The data were collected over approximately four years;
from October 2009 to July 2013. This cross sectional study includes measurements from 2046
boys and 1979 girls. All the children had both a father and a mother who are Ethiopians. Only
two children originated from foreign countries (Eritrea and Yemen) that are also excluded from
analysis.
We had formal approval collect data from all the 24 health clinics in Addis Ababa and any health
center in the country. However, the project had limited manpower. After having visited most of
the city’s clinics, the project focused on three large health centers in Addis Ababa and four other
health centers outside the city to maximize data collection within the allotted research period.
The clinics were arbitrarily selected, but priority was given to those with high numbers of
children and within reasonable distance to make the daily work efficient. The health centers
cared for both adults and children. They had department including family planning, a small
maternity ward, a vaccination office, and an out-patient treatment centre for both children and
adults. We measured all children who came for their vaccinations. The immunization department
had high turnover rates on Monday, Thursday and Friday because vaccination campaigns were
offered on those days. Children between 0 - 24 months of age were not a part of a national
follow-up program for children, and therefore not routinely asked to come to the health clinics
for anthropometric. They visited the health clinics for one of the three following purposes: 1) to
participate in the vaccination programme, 2) to participate in a follow-up programme concerning
nutrition and HIV-prophylaxis, or 3) because they had various medical problems.
11!!
Inclusion Criteria: all children who came to the health center, maternal and child clinic for
routine immunization service, and who were ≤24 months of age.
Exclusion Criteria: any child with a suspected or diagnosed intracranial expansive condition,
having been born with congenital problems of the head, a history of chronic illness, visible
malnutrition problems, and/or a child with either of the parents who did not belong to any ethnic
group in Ethiopia were excluded from the study. Signs and symptoms of hydrocephalus were
obvious expansion of head, neurological signs and deficits and distended veins of the scalp.
Previous treatment of intracranial lesions
Data Collection procedures
Measurement technique. After getting the permission of the medical director and the head of
maternal and child care at the health center, we explained the overall aim, procedure and the
importance of measuring the HC of the baby. Soon we got the consent of the parents or
caregivers, we measure HC of the baby three times and taking the average record.
A total of three study workers, the principal investigator and two co-investigators, measured all
children in the study. Three Norwegian medical students (Mari Idsøe, Miriam Wiksnes, Thomas
Moss) measured approximately 1000 children, and the principal investigator (EB), measured
3025 children. A standardized technique was used measuring the maximal occiputo frontal
circumference (HC). After parents or caregivers agreed to participate in the study, they were
asked to remove any of the child’s hair ornaments or braids. Children were placed on
parents/caregivers lap to feel safe and comfortable, and a head circumference tape was placed
around the child’s head so that the tape was situated across the frontal bones of the skull;
immediately above the eyebrows; perpendicular to the long axis of the face; above the ears and
over the occipital prominence on the back of the head. The tape moved up and down over the
back of the head in order to always locate the maximal circumference. The tape measure was
made to be neither too loose nor too tight, so that it fit comfortably around the head, but also
compressed the hair and underlying soft tissues. The measurement was read from lateral side.
The HC was measured to the nearest 0.1 cm. Since the HC tape shows both centimetres and
inches, checking that the metric scale is used was very important. Finally, the HC tape was
12!!
removed and the enumerator proceeded to the next measure(34). In addition to HC measuring, it
was necessary to have a small interview with parent or caregiver who accompanied the child to
the clinic
Ethiopia uses a different calendar than western countries, which is based on the old Coptic
calendar (35). The calendar year has 13 months, and is between seven and eight years behind the
Gregorian calendar, also known as the Western calendar. Children’s date of birth was given to us
on the Ethiopian calendar.
Pilot study: a small pilot study was first performed, showing that the collection of data,
including HC measurements, should be done by well-trained personnel. And this is shown by
when the measuring was conducted by untrained personnel without supervision they always
tended to round off the HC measurements to the closest whole cm, without any decimals. The
pilot study also revealed that a lot of information around the children's health was not recorded
when these personnel measures HC. So we have found that was important to collect the data by a
trained person whose precision is to the standard.
Recording the results
The following information was collected: sex, age, date of birth, date of measurement, ethnicity
of the father, ethnicity of the mother, ethnicity of the child (if mixed; taking paternal ethnicity
which is customary in Ethiopia) and HC in cm and mm. More than three-quarters of the data
were directly entered into the data base using Ipad, and the rest 1/4th on a prepared worksheet.
The child age, calculated by subtracting the date of birth from date of measurement, was cross-
checked with age given by the parents/care providers. For consistency, we asked date of birth
from the parents/caregivers and cross-checked with what was registered on the immunization
card.
13!!
Data management and analysis
The collected data were organized in Excel. Measurements below – 4 SD or about + 4 SD were
defined as outliers, and removed. Thirteen measurements for boys and nine for girls were
removed leaving us with 4019 data for the final analysis.
Statistics and calculations:
Reference curves for head circumference were estimated with the LMS method by Cole and
Green(36). The LMS method is a semi-parametric method that uses the box-cox power
transformation to normalize the distribution of the parameter of interest (i.e. head circumference)
conditional on age. Smooth curves for the box-cox power (L), median (M), and coefficient of
variation (S) are estimated over the whole age-range with cubic splines by maximizing the
penalized likelihood. The degree of smoothing is controlled by assigning a number of equivalent
degrees of freedom (edf) for each curve. Two edf will result in a straight line, and three or more
edf allow for more variation by age. With one edf the corresponding parameter (L, M or S) is
constant (the same at all ages), and the edf are zero when a fixed value is used.
Models are initially selected by a deviance criterion, and goodness of fit is assessed using several
tests for normality of the model residuals. With the LMS coefficients, smooth percentile curves
can be calculated from C = M*(1 + S*zα)(1/L) when L ≠ 0, and C = M*exp(S*zα) when L = 0;
where zα is the quantile of the standard normal distribution that corresponds to the percentile
100*α. Measurements are converted to standard deviation scores (SDS) or z-scores from z =
[(y/M)L – 1]/[L*S] when L ≠ 0, and z = log(y/M)/S when L = 0; where y is a measurement at age
t, and L, M, and S are the corresponding parameters at that age. Standard errors and confidence
intervals for percentiles were estimated from 500 bootstrap samples. The charts were drawn with
the help of Microsoft Excel 2007 (37).
14!!
Quality control
Equipment: A non-stretchable measurement tape was used and checked for variation when used
repeatedly, getting wet or getting warm. To check for these we tested our measurement tape
against a fixed standard (metal) when we started to use it, and again after using it for a period of
time.
Observer reliability assessment: before initiation of the data collection, the principal
investigator trained anthropometric measurement techniches for five days at Haukeland
University Hospital, Bergen. Then he participated in a test and re-test exercise for head
circumference at CIH. These were anthropometric measurements of 10 Norwegian children.
Measurements were performed twice, with an interval of at least 15 minutes. He compared his
measurement technique with that of the supervisor (Petur Juliusson), acting as the reference
standard.
Selection bias study: to avoid the likelihood of selection bias, data collectors stayed in the
health centers and measured all children who came in during the working hours and fulfilled the
inclusion criteria, from 8:30AM to 12:00AM.
Sampling procedures: health centers were selected arbitrary according to the criterion of having
high under two patient clients. Then, any children coming to these health facilities for normal
routine service, and that fulfilled the inclusion criteria were measured.
Sample size determination
Because of rapid growth during the first two years of life, more measurements are needed than
later in childhood. Generally, 200 girls and 200 boys are thought of as sufficient for each age
group above two years of age. This number has been suggested to be doubled between 1-2 years
of age, and increased by factor 4 in the first year of life. Therefore, based on the experience from
a previously published study, we aimed at including 1600 children ≤1 year of age and 800
children 1-2 years of age (38).
15!!
Ethical considerations
The study is an extension of a project approved by the Regional Committee for Medical and
Health Research Ethics, Norway (REK in 2006) aiming at training Ethiopian neurosurgeons in a
collaboration between Addis Ababa University and University of Bergen. The study is also
approved by the Addis Ababa University institutional review board (MFGC/058/07) (Annex1).
The participants’ parent/caregiver gave oral consent. The consent form explained the purpose of
the study (Annex 2). The recorded data were stored on a laptop secured with a password and kept
locked up when not in use. Data analysis and reporting were carried out with de-identified
datasets.
!
!
!
!
!
!
!
!
!
!
!
!
16!!
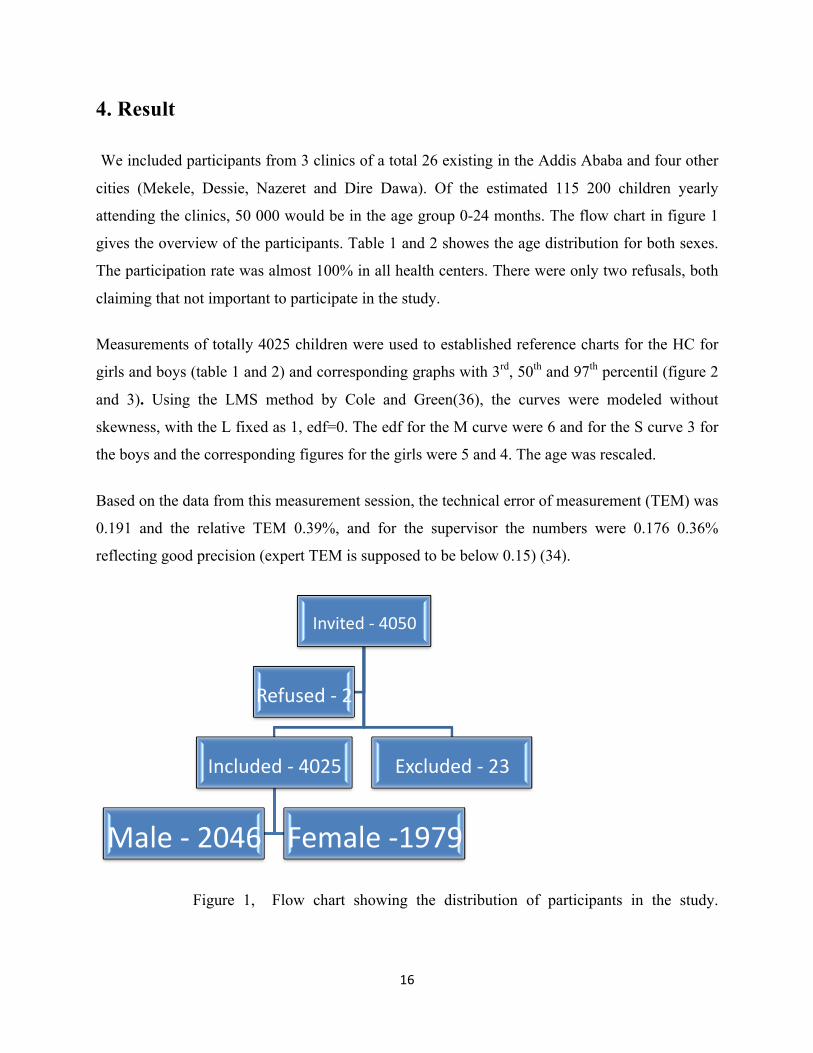
4. Result
We included participants from 3 clinics of a total 26 existing in the Addis Ababa and four other
cities (Mekele, Dessie, Nazeret and Dire Dawa). Of the estimated 115 200 children yearly
attending the clinics, 50 000 would be in the age group 0-24 months. The flow chart in figure 1
gives the overview of the participants. Table 1 and 2 showes the age distribution for both sexes.
The participation rate was almost 100% in all health centers. There were only two refusals, both
claiming that not important to participate in the study.
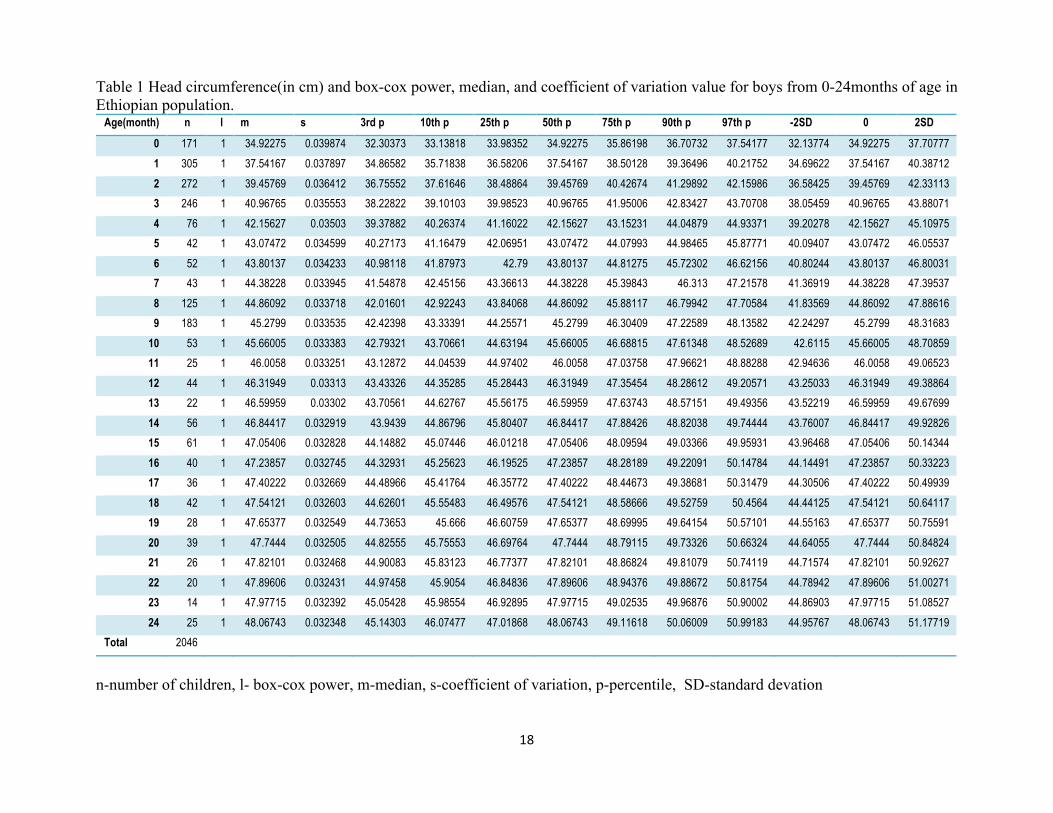
Measurements of totally 4025 children were used to established reference charts for the HC for
girls and boys (table 1 and 2) and corresponding graphs with 3rd, 50th and 97th percentil (figure 2
and 3). Using the LMS method by Cole and Green(36), the curves were modeled without
skewness, with the L fixed as 1, edf=0. The edf for the M curve were 6 and for the S curve 3 for
the boys and the corresponding figures for the girls were 5 and 4. The age was rescaled.
Based on the data from this measurement session, the technical error of measurement (TEM) was
0.191 and the relative TEM 0.39%, and for the supervisor the numbers were 0.176 0.36%
reflecting good precision (expert TEM is supposed to be below 0.15) (34).
Figure 1, Flow chart showing the distribution of participants in the study.
Invited!=!4050!
Included!=!4025!
Male!=!2046!! Female!=1979!
Excluded!=!23!
Refused!=!2!
17##
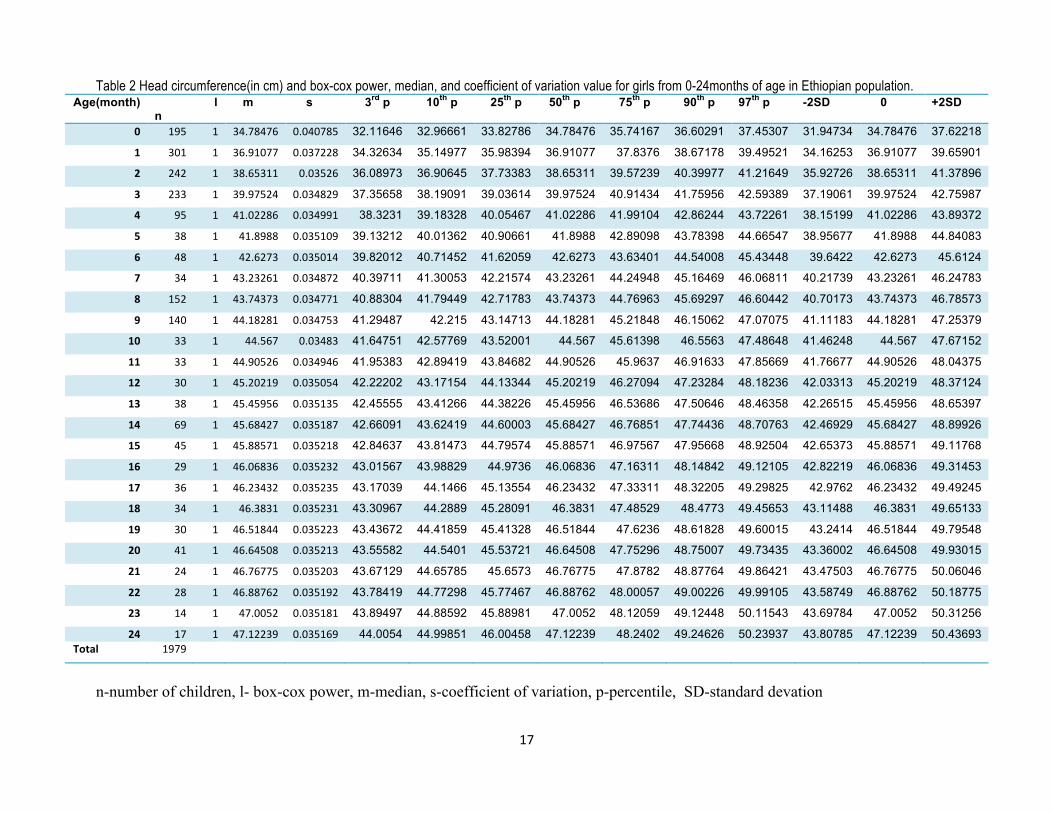
Table 2 Head circumference(in cm) and box-cox power, median, and coefficient of variation value for girls from 0-24months of age in Ethiopian population. Age(month)
n l m s 3rd p 10th p 25th p 50th p 75th p 90th p 97th p -2SD 0 +2SD
0" 195# 1# 34.78476# 0.040785# 32.11646 32.96661 33.82786 34.78476 35.74167 36.60291 37.45307 31.94734 34.78476 37.62218
1" 301# 1# 36.91077# 0.037228# 34.32634 35.14977 35.98394 36.91077 37.8376 38.67178 39.49521 34.16253 36.91077 39.65901
2" 242# 1# 38.65311# 0.03526# 36.08973 36.90645 37.73383 38.65311 39.57239 40.39977 41.21649 35.92726 38.65311 41.37896
3" 233# 1# 39.97524# 0.034829# 37.35658 38.19091 39.03614 39.97524 40.91434 41.75956 42.59389 37.19061 39.97524 42.75987
4" 95# 1# 41.02286# 0.034991# 38.3231 39.18328 40.05467 41.02286 41.99104 42.86244 43.72261 38.15199 41.02286 43.89372
5" 38# 1# 41.8988# 0.035109# 39.13212 40.01362 40.90661 41.8988 42.89098 43.78398 44.66547 38.95677 41.8988 44.84083
6" 48# 1# 42.6273# 0.035014# 39.82012 40.71452 41.62059 42.6273 43.63401 44.54008 45.43448 39.6422 42.6273 45.6124
7" 34# 1# 43.23261# 0.034872# 40.39711 41.30053 42.21574 43.23261 44.24948 45.16469 46.06811 40.21739 43.23261 46.24783
8" 152# 1# 43.74373# 0.034771# 40.88304 41.79449 42.71783 43.74373 44.76963 45.69297 46.60442 40.70173 43.74373 46.78573
9" 140# 1# 44.18281# 0.034753# 41.29487 42.215 43.14713 44.18281 45.21848 46.15062 47.07075 41.11183 44.18281 47.25379
10" 33# 1# 44.567# 0.03483# 41.64751 42.57769 43.52001 44.567 45.61398 46.5563 47.48648 41.46248 44.567 47.67152
11" 33# 1# 44.90526# 0.034946# 41.95383 42.89419 43.84682 44.90526 45.9637 46.91633 47.85669 41.76677 44.90526 48.04375
12" 30# 1# 45.20219# 0.035054# 42.22202 43.17154 44.13344 45.20219 46.27094 47.23284 48.18236 42.03313 45.20219 48.37124
13" 38# 1# 45.45956# 0.035135# 42.45555 43.41266 44.38226 45.45956 46.53686 47.50646 48.46358 42.26515 45.45956 48.65397
14" 69# 1# 45.68427# 0.035187# 42.66091 43.62419 44.60003 45.68427 46.76851 47.74436 48.70763 42.46929 45.68427 48.89926
15" 45# 1# 45.88571# 0.035218# 42.84637 43.81473 44.79574 45.88571 46.97567 47.95668 48.92504 42.65373 45.88571 49.11768
16" 29# 1# 46.06836# 0.035232# 43.01567 43.98829 44.9736 46.06836 47.16311 48.14842 49.12105 42.82219 46.06836 49.31453
17" 36# 1# 46.23432# 0.035235# 43.17039 44.1466 45.13554 46.23432 47.33311 48.32205 49.29825 42.9762 46.23432 49.49245
18" 34# 1# 46.3831# 0.035231# 43.30967 44.2889 45.28091 46.3831 47.48529 48.4773 49.45653 43.11488 46.3831 49.65133
19" 30# 1# 46.51844# 0.035223# 43.43672 44.41859 45.41328 46.51844 47.6236 48.61828 49.60015 43.2414 46.51844 49.79548
20" 41# 1# 46.64508# 0.035213# 43.55582 44.5401 45.53721 46.64508 47.75296 48.75007 49.73435 43.36002 46.64508 49.93015
21" 24# 1# 46.76775# 0.035203# 43.67129 44.65785 45.6573 46.76775 47.8782 48.87764 49.86421 43.47503 46.76775 50.06046
22" 28# 1# 46.88762# 0.035192# 43.78419 44.77298 45.77467 46.88762 48.00057 49.00226 49.99105 43.58749 46.88762 50.18775
23" 14# 1# 47.0052# 0.035181# 43.89497 44.88592 45.88981 47.0052 48.12059 49.12448 50.11543 43.69784 47.0052 50.31256
24" 17# 1# 47.12239# 0.035169# 44.0054 44.99851 46.00458 47.12239 48.2402 49.24626 50.23937 43.80785 47.12239 50.43693 Total" 1979# # # # # # # # # # # # # #
n-number of children, l- box-cox power, m-median, s-coefficient of variation, p-percentile, SD-standard devation
18##
Table 1 Head circumference(in cm) and box-cox power, median, and coefficient of variation value for boys from 0-24months of age in Ethiopian population.
Age(month) n l m s 3rd p 10th p 25th p 50th p 75th p 90th p 97th p -2SD 0 2SD
0 171 1 34.92275 0.039874 32.30373 33.13818 33.98352 34.92275 35.86198 36.70732 37.54177 32.13774 34.92275 37.70777
1 305 1 37.54167 0.037897 34.86582 35.71838 36.58206 37.54167 38.50128 39.36496 40.21752 34.69622 37.54167 40.38712
2 272 1 39.45769 0.036412 36.75552 37.61646 38.48864 39.45769 40.42674 41.29892 42.15986 36.58425 39.45769 42.33113
3 246 1 40.96765 0.035553 38.22822 39.10103 39.98523 40.96765 41.95006 42.83427 43.70708 38.05459 40.96765 43.88071
4 76 1 42.15627 0.03503 39.37882 40.26374 41.16022 42.15627 43.15231 44.04879 44.93371 39.20278 42.15627 45.10975
5 42 1 43.07472 0.034599 40.27173 41.16479 42.06951 43.07472 44.07993 44.98465 45.87771 40.09407 43.07472 46.05537
6 52 1 43.80137 0.034233 40.98118 41.87973 42.79 43.80137 44.81275 45.72302 46.62156 40.80244 43.80137 46.80031
7 43 1 44.38228 0.033945 41.54878 42.45156 43.36613 44.38228 45.39843 46.313 47.21578 41.36919 44.38228 47.39537
8 125 1 44.86092 0.033718 42.01601 42.92243 43.84068 44.86092 45.88117 46.79942 47.70584 41.83569 44.86092 47.88616
9 183 1 45.2799 0.033535 42.42398 43.33391 44.25571 45.2799 46.30409 47.22589 48.13582 42.24297 45.2799 48.31683
10 53 1 45.66005 0.033383 42.79321 43.70661 44.63194 45.66005 46.68815 47.61348 48.52689 42.6115 45.66005 48.70859
11 25 1 46.0058 0.033251 43.12872 44.04539 44.97402 46.0058 47.03758 47.96621 48.88288 42.94636 46.0058 49.06523
12 44 1 46.31949 0.03313 43.43326 44.35285 45.28443 46.31949 47.35454 48.28612 49.20571 43.25033 46.31949 49.38864
13 22 1 46.59959 0.03302 43.70561 44.62767 45.56175 46.59959 47.63743 48.57151 49.49356 43.52219 46.59959 49.67699
14 56 1 46.84417 0.032919 43.9439 44.86796 45.80407 46.84417 47.88426 48.82038 49.74444 43.76007 46.84417 49.92826
15 61 1 47.05406 0.032828 44.14882 45.07446 46.01218 47.05406 48.09594 49.03366 49.95931 43.96468 47.05406 50.14344
16 40 1 47.23857 0.032745 44.32931 45.25623 46.19525 47.23857 48.28189 49.22091 50.14784 44.14491 47.23857 50.33223
17 36 1 47.40222 0.032669 44.48966 45.41764 46.35772 47.40222 48.44673 49.38681 50.31479 44.30506 47.40222 50.49939
18 42 1 47.54121 0.032603 44.62601 45.55483 46.49576 47.54121 48.58666 49.52759 50.4564 44.44125 47.54121 50.64117
19 28 1 47.65377 0.032549 44.73653 45.666 46.60759 47.65377 48.69995 49.64154 50.57101 44.55163 47.65377 50.75591
20 39 1 47.7444 0.032505 44.82555 45.75553 46.69764 47.7444 48.79115 49.73326 50.66324 44.64055 47.7444 50.84824
21 26 1 47.82101 0.032468 44.90083 45.83123 46.77377 47.82101 48.86824 49.81079 50.74119 44.71574 47.82101 50.92627
22 20 1 47.89606 0.032431 44.97458 45.9054 46.84836 47.89606 48.94376 49.88672 50.81754 44.78942 47.89606 51.00271
23 14 1 47.97715 0.032392 45.05428 45.98554 46.92895 47.97715 49.02535 49.96876 50.90002 44.86903 47.97715 51.08527
24 25 1 48.06743 0.032348 45.14303 46.07477 47.01868 48.06743 49.11618 50.06009 50.99183 44.95767 48.06743 51.17719
Total 2046
n-number of children, l- box-cox power, m-median, s-coefficient of variation, p-percentile, SD-standard devation
19##
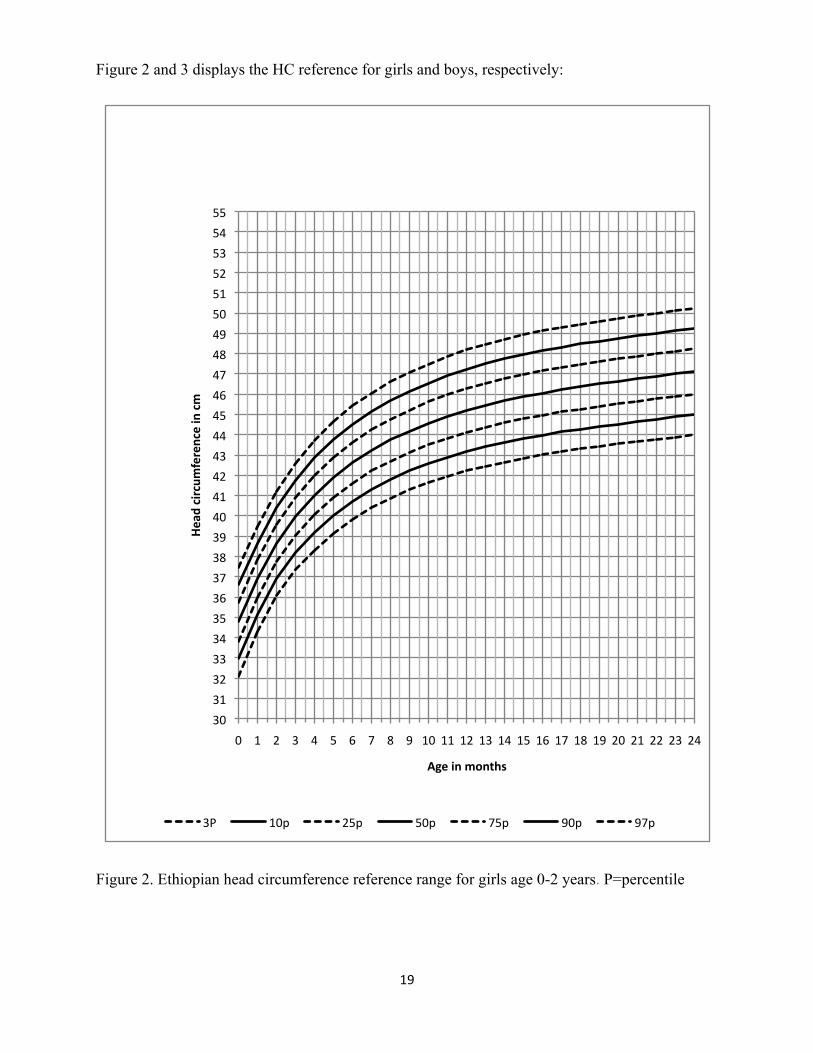
Figure 2 and 3 displays the HC reference for girls and boys, respectively:
Figure 2. Ethiopian head circumference reference range for girls age 0-2 years. P=percentile
#
30#
31#
32#
33#
34#
35#
36#
37#
38#
39#
40#
41#
42#
43#
44#
45#
46#
47#
48#
49#
50#
51#
52#
53#
54#
55#
0# 1# 2# 3# 4# 5# 6# 7# 8# 9# 10# 11# 12# 13# 14# 15# 16# 17# 18# 19# 20# 21# 22# 23# 24#
Head%circum
ference%in%cm%
Age%in%months%
3P# 10p# 25p# 50p# 75p# 90p# 97p#
20##
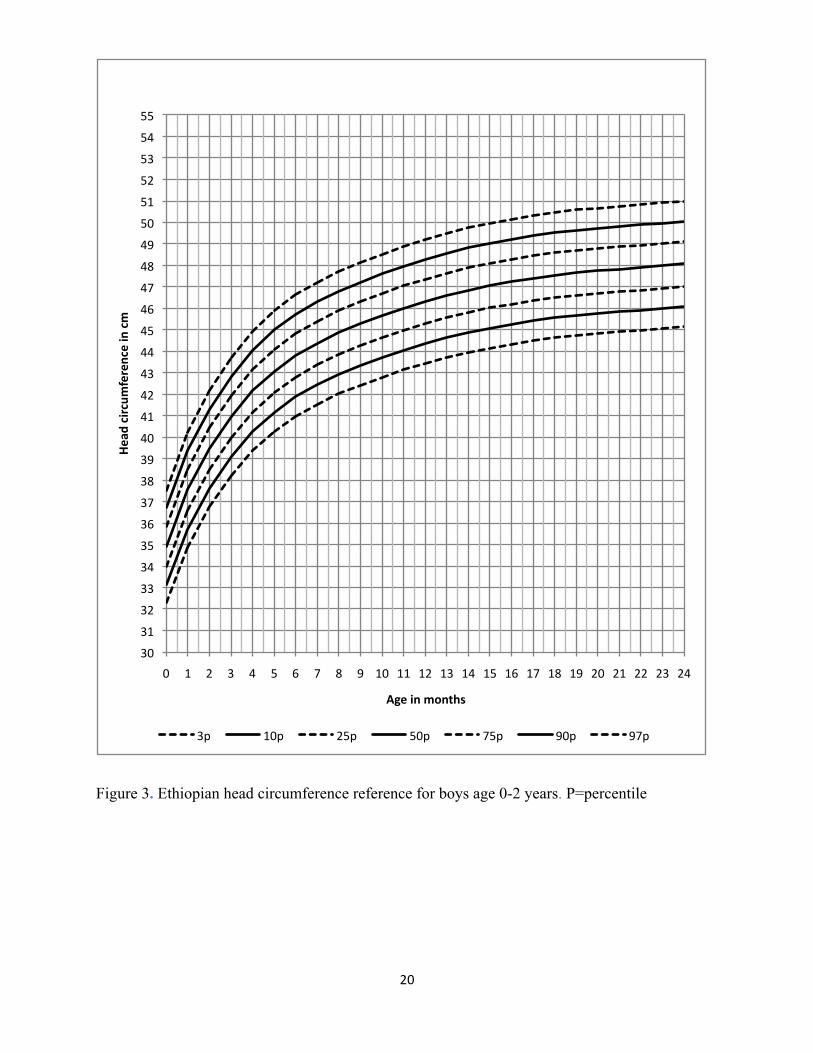
Figure 3. Ethiopian head circumference reference for boys age 0-2 years. P=percentile
30#
31#
32#
33#
34#
35#
36#
37#
38#
39#
40#
41#
42#
43#
44#
45#
46#
47#
48#
49#
50#
51#
52#
53#
54#
55#
0# 1# 2# 3# 4# 5# 6# 7# 8# 9# 10# 11# 12# 13# 14# 15# 16# 17# 18# 19# 20# 21# 22# 23# 24#
Head%circum
ference%in%cm%
Age%in%months%
3p# 10p# 25p# 50p# 75p# 90p# 97p#
21##
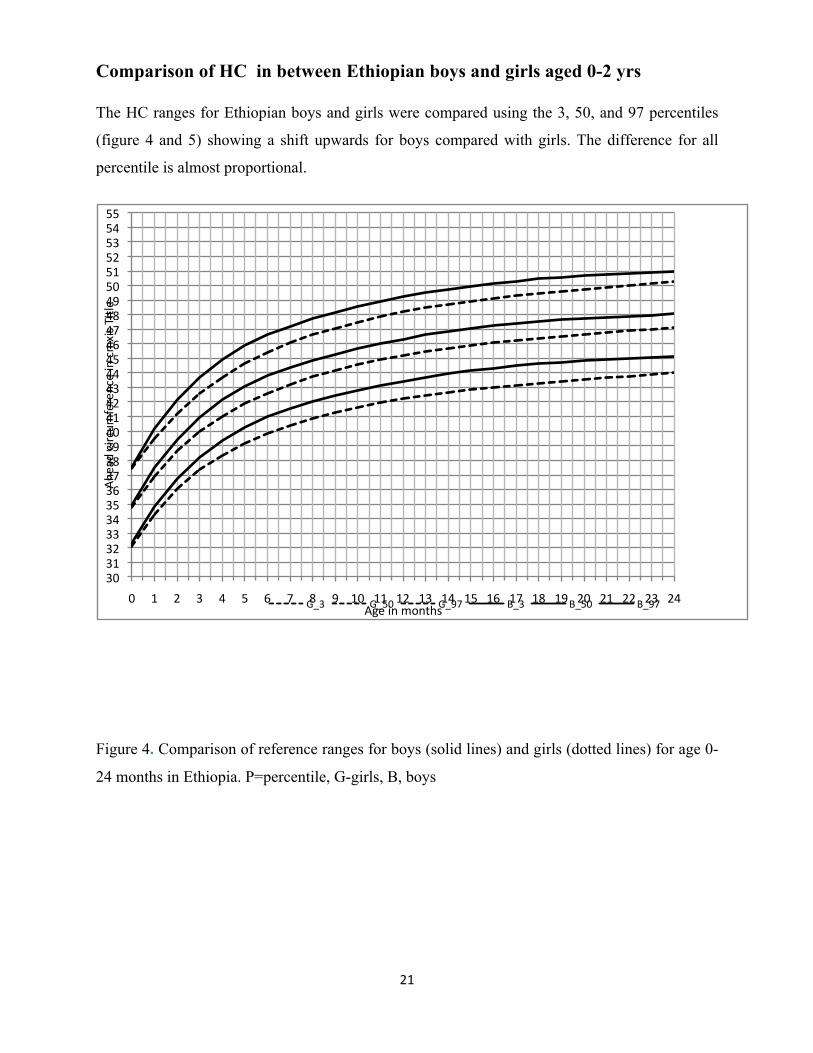
Comparison of HC in between Ethiopian boys and girls aged 0-2 yrs
The HC ranges for Ethiopian boys and girls were compared using the 3, 50, and 97 percentiles
(figure 4 and 5) showing a shift upwards for boys compared with girls. The difference for all
percentile is almost proportional.
Figure 4. Comparison of reference ranges for boys (solid lines) and girls (dotted lines) for age 0-
24 months in Ethiopia. P=percentile, G-girls, B, boys
30#31#32#33#34#35#36#37#38#39#40#41#42#43#44#45#46#47#48#49#50#51#52#53#54#55#
0# 1# 2# 3# 4# 5# 6# 7# 8# 9# 10# 11# 12# 13# 14# 15# 16# 17# 18# 19# 20# 21# 22# 23# 24#
Ahe
ad#circum
ference#in#cmxis#Title
#
Age#in#months#G_3# G_50# G_97# B_3# B_50# B_97#
22##
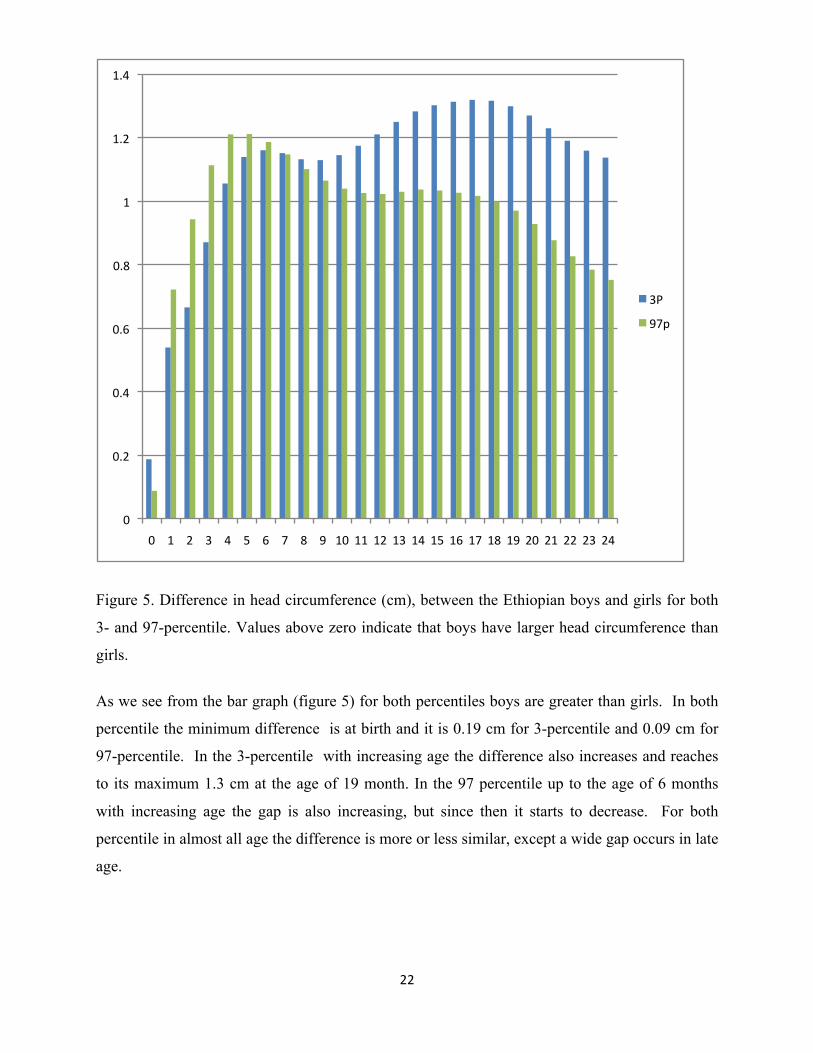
Figure 5. Difference in head circumference (cm), between the Ethiopian boys and girls for both
3- and 97-percentile. Values above zero indicate that boys have larger head circumference than
girls.
As we see from the bar graph (figure 5) for both percentiles boys are greater than girls. In both
percentile the minimum difference is at birth and it is 0.19 cm for 3-percentile and 0.09 cm for
97-percentile. In the 3-percentile with increasing age the difference also increases and reaches
to its maximum 1.3 cm at the age of 19 month. In the 97 percentile up to the age of 6 months
with increasing age the gap is also increasing, but since then it starts to decrease. For both
percentile in almost all age the difference is more or less similar, except a wide gap occurs in late
age.
0#
0.2#
0.4#
0.6#
0.8#
1#
1.2#
1.4#
0# 1# 2# 3# 4# 5# 6# 7# 8# 9# 10# 11# 12# 13# 14# 15# 16# 17# 18# 19# 20# 21# 22# 23# 24#
3P#
97p#
23##
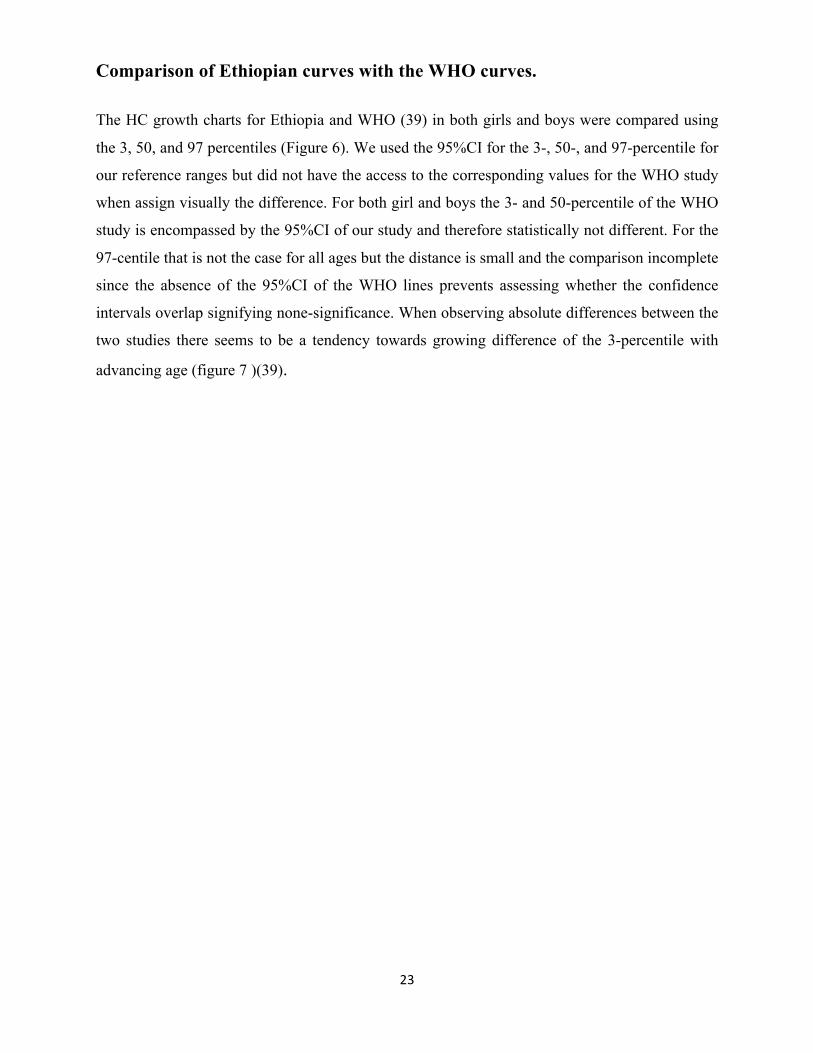
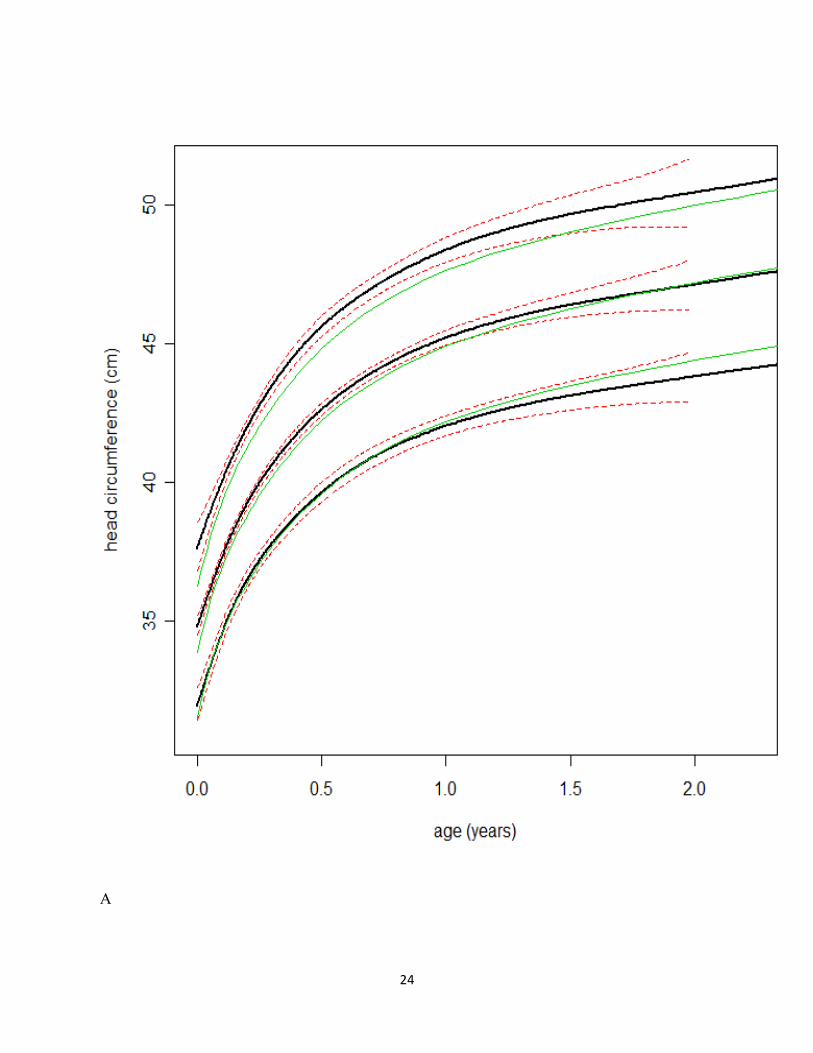
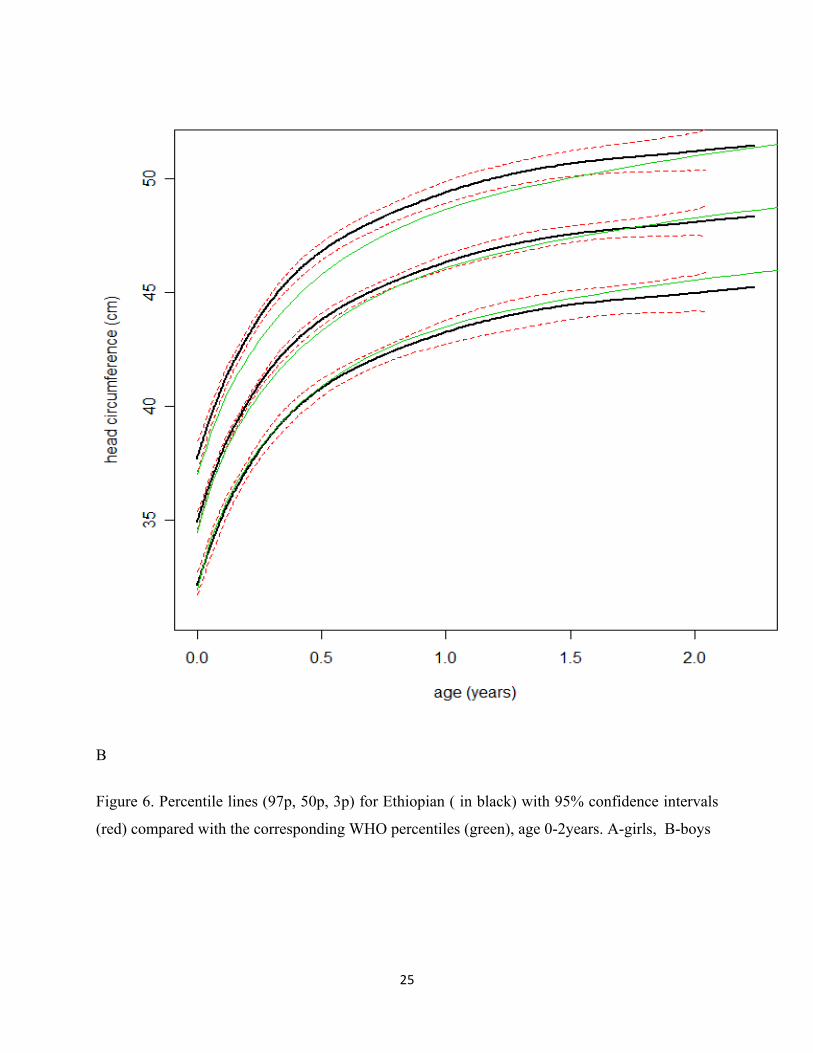
Comparison of Ethiopian curves with the WHO curves.
The HC growth charts for Ethiopia and WHO (39) in both girls and boys were compared using
the 3, 50, and 97 percentiles (Figure 6). We used the 95%CI for the 3-, 50-, and 97-percentile for
our reference ranges but did not have the access to the corresponding values for the WHO study
when assign visually the difference. For both girl and boys the 3- and 50-percentile of the WHO
study is encompassed by the 95%CI of our study and therefore statistically not different. For the
97-centile that is not the case for all ages but the distance is small and the comparison incomplete
since the absence of the 95%CI of the WHO lines prevents assessing whether the confidence
intervals overlap signifying none-significance. When observing absolute differences between the
two studies there seems to be a tendency towards growing difference of the 3-percentile with
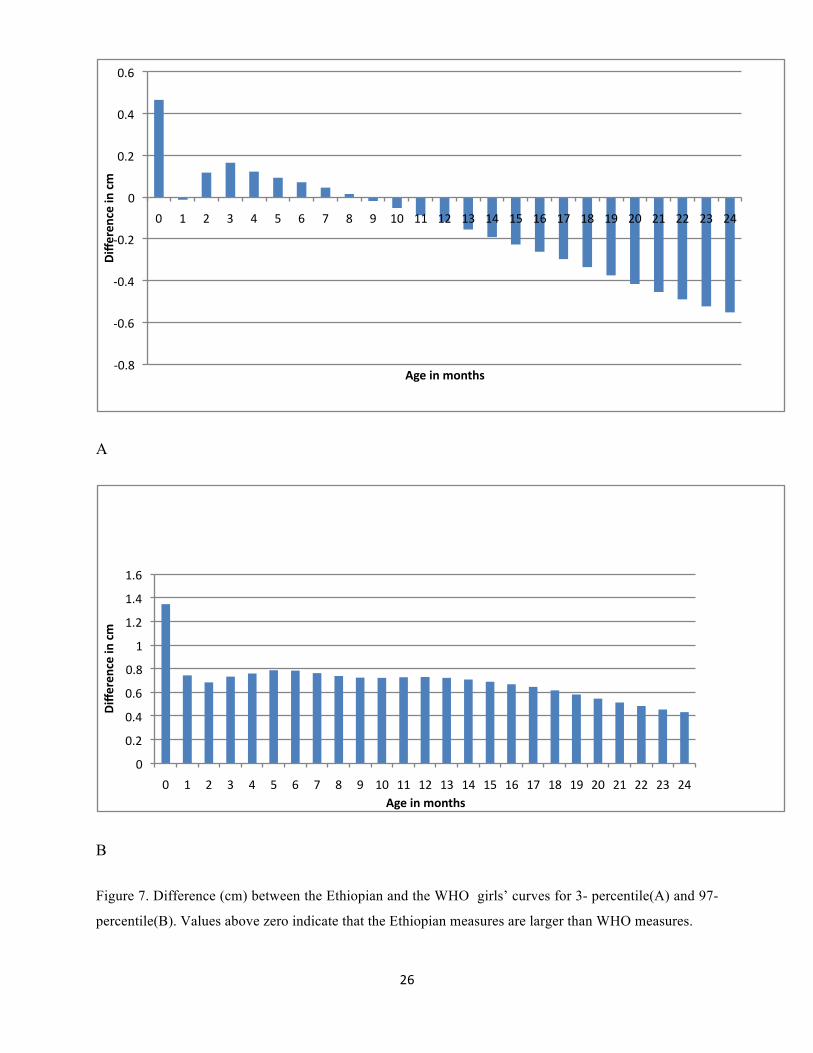
advancing age (figure 7 )(39).
24##
A
25##
B
Figure 6. Percentile lines (97p, 50p, 3p) for Ethiopian ( in black) with 95% confidence intervals
(red) compared with the corresponding WHO percentiles (green), age 0-2years. A-girls, B-boys
26##
A
B
Figure 7. Difference (cm) between the Ethiopian and the WHO girls’ curves for 3- percentile(A) and 97-
percentile(B). Values above zero indicate that the Ethiopian measures are larger than WHO measures.
E0.8#
E0.6#
E0.4#
E0.2#
0#
0.2#
0.4#
0.6#
0# 1# 2# 3# 4# 5# 6# 7# 8# 9# 10# 11# 12# 13# 14# 15# 16# 17# 18# 19# 20# 21# 22# 23# 24#
Differen
ce%in%cm%
Age%in%months%
0#
0.2#
0.4#
0.6#
0.8#
1#
1.2#
1.4#
1.6#
0# 1# 2# 3# 4# 5# 6# 7# 8# 9# 10# 11# 12# 13# 14# 15# 16# 17# 18# 19# 20# 21# 22# 23# 24#
Differen
ce%in%cm%
Age%in%months%
27##
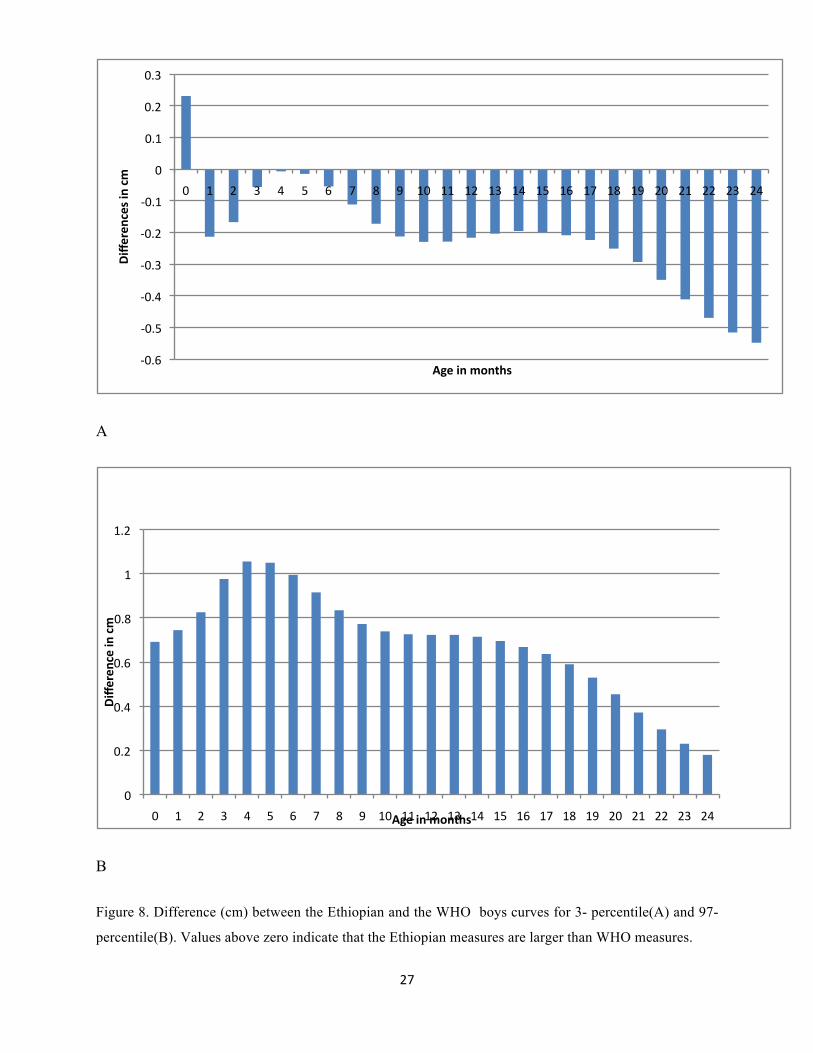
A
B
Figure 8. Difference (cm) between the Ethiopian and the WHO boys curves for 3- percentile(A) and 97-
percentile(B). Values above zero indicate that the Ethiopian measures are larger than WHO measures.
E0.6#
E0.5#
E0.4#
E0.3#
E0.2#
E0.1#
0#
0.1#
0.2#
0.3#
0# 1# 2# 3# 4# 5# 6# 7# 8# 9# 10# 11# 12# 13# 14# 15# 16# 17# 18# 19# 20# 21# 22# 23# 24#
Differen
ces%in%cm%
Age%in%months%
0#
0.2#
0.4#
0.6#
0.8#
1#
1.2#
0# 1# 2# 3# 4# 5# 6# 7# 8# 9# 10# 11# 12# 13# 14# 15# 16# 17# 18# 19# 20# 21# 22# 23# 24#
Differen
ce%in%cm%
Age%in%months%
28##
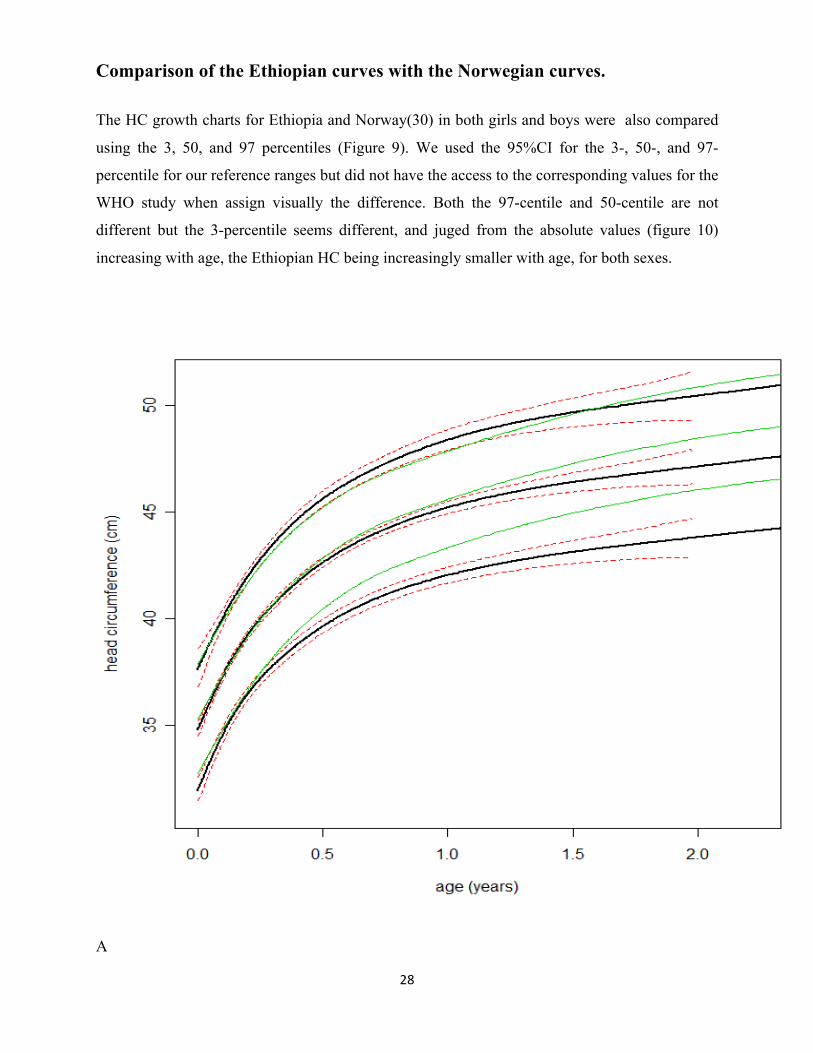
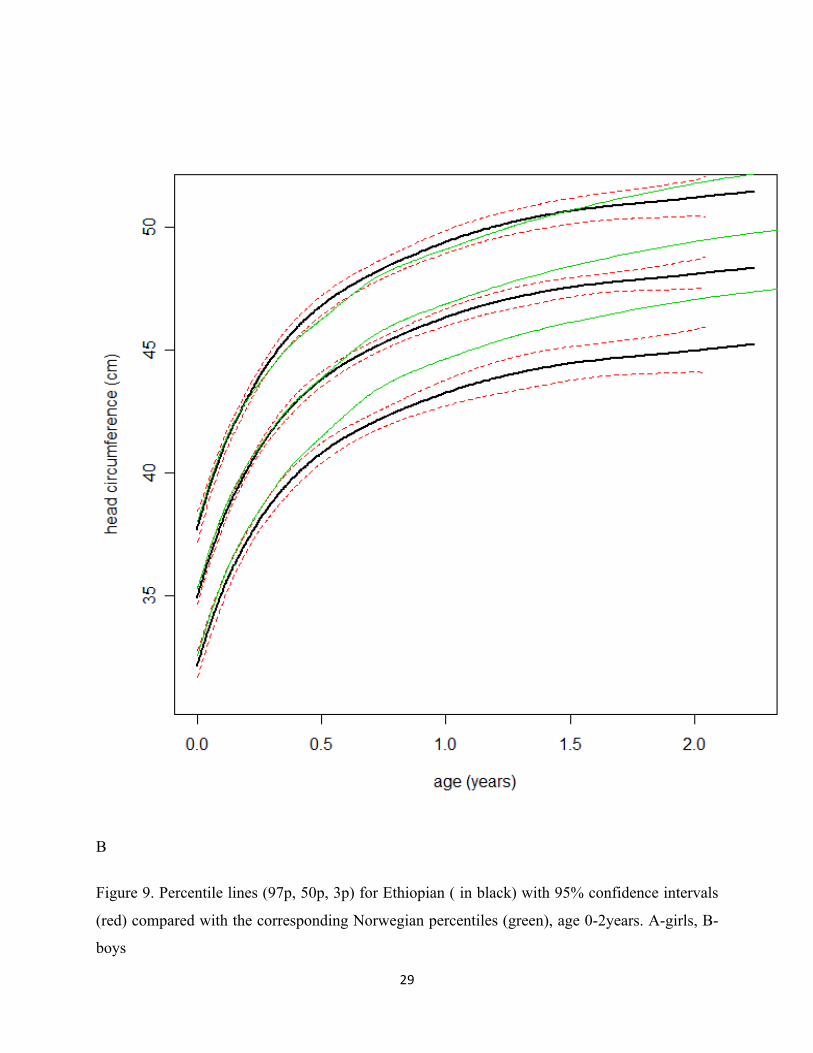
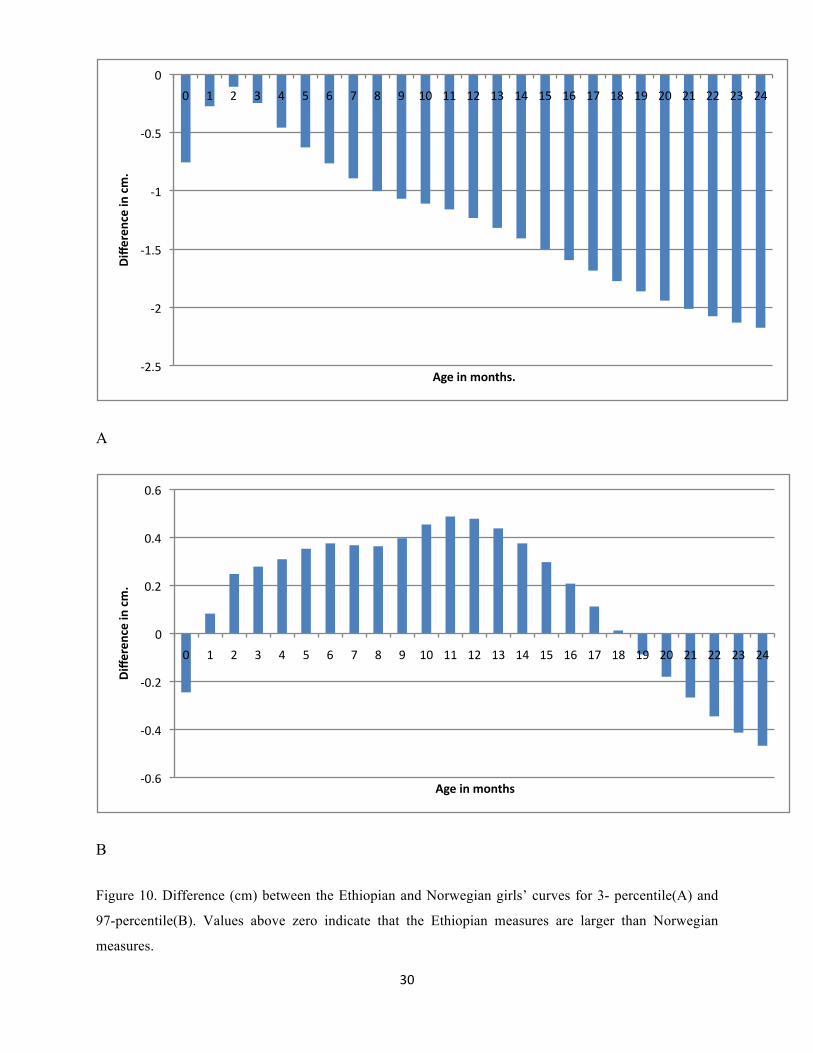
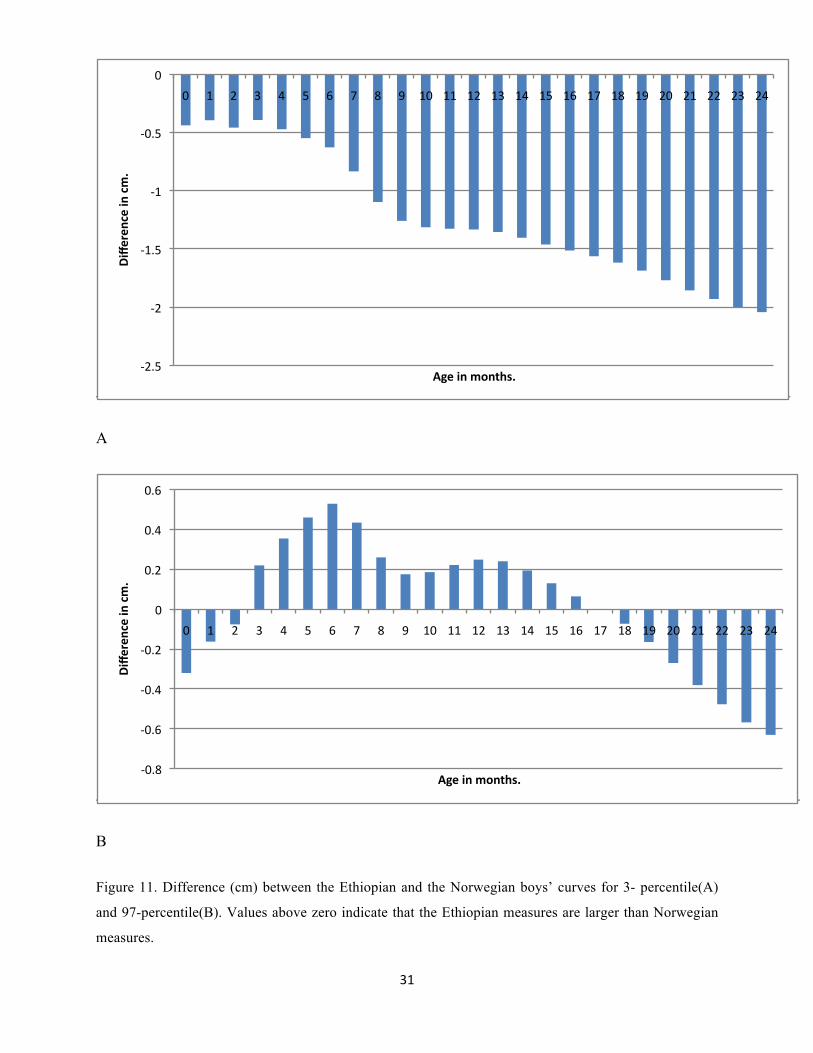
Comparison of the Ethiopian curves with the Norwegian curves.
The HC growth charts for Ethiopia and Norway(30) in both girls and boys were also compared
using the 3, 50, and 97 percentiles (Figure 9). We used the 95%CI for the 3-, 50-, and 97-
percentile for our reference ranges but did not have the access to the corresponding values for the
WHO study when assign visually the difference. Both the 97-centile and 50-centile are not
different but the 3-percentile seems different, and juged from the absolute values (figure 10)
increasing with age, the Ethiopian HC being increasingly smaller with age, for both sexes.
A
29##
#
B
Figure 9. Percentile lines (97p, 50p, 3p) for Ethiopian ( in black) with 95% confidence intervals
(red) compared with the corresponding Norwegian percentiles (green), age 0-2years. A-girls, B-
boys
30##
A
B
Figure 10. Difference (cm) between the Ethiopian and Norwegian girls’ curves for 3- percentile(A) and
97-percentile(B). Values above zero indicate that the Ethiopian measures are larger than Norwegian
measures.
E2.5#
E2#
E1.5#
E1#
E0.5#
0#
0# 1# 2# 3# 4# 5# 6# 7# 8# 9# 10# 11# 12# 13# 14# 15# 16# 17# 18# 19# 20# 21# 22# 23# 24#
Differen
ce%in%cm.%
Age%in%months.%
E0.6#
E0.4#
E0.2#
0#
0.2#
0.4#
0.6#
0# 1# 2# 3# 4# 5# 6# 7# 8# 9# 10# 11# 12# 13# 14# 15# 16# 17# 18# 19# 20# 21# 22# 23# 24#
Differen
ce%in%cm.%
Age%in%months%
31##
A
B
Figure 11. Difference (cm) between the Ethiopian and the Norwegian boys’ curves for 3- percentile(A)
and 97-percentile(B). Values above zero indicate that the Ethiopian measures are larger than Norwegian
measures.
E2.5#
E2#
E1.5#
E1#
E0.5#
0#
0# 1# 2# 3# 4# 5# 6# 7# 8# 9# 10# 11# 12# 13# 14# 15# 16# 17# 18# 19# 20# 21# 22# 23# 24#
Differen
ce%in%cm.%
Age%in%months.%
E0.8#
E0.6#
E0.4#
E0.2#
0#
0.2#
0.4#
0.6#
0# 1# 2# 3# 4# 5# 6# 7# 8# 9# 10# 11# 12# 13# 14# 15# 16# 17# 18# 19# 20# 21# 22# 23# 24#
Differen
ce%in%cm.%
Age%in%months.%
32##
5. Discussion and recommendation
In this chapter the researcher is going to discuss all the findings of the research that mentioned
before. As the main objective of the study the HC standard for Ethiopian boys and girls based on
the national data has been prepared. Comparison of this national standard was only for 3rd ,50th
and 97th percentile. The first comparison is in between Ethiopian boys and girls HC. Based on
the objective another important point of discussion is a comparison in between the existing
standard (WHO) and this finding. Then we will come to the main point which is; weather is it
needed to replace the WHO standard with the new national standard or not. As we are aiming the
standard to be in use for early detection of hydrocephalus (big head) we also compare with
nations such as Norway child population, which are on one extreme side of having large HC
(40). Finally, we are going to discuss whether ethnicity has a factor for HC change or not.
The sex specific HC-for-age percentiles presented here are the first reference values from a
nationally representative sample of Ethiopian children for the age range of 0-24month. As
expected for both sex, in the first year of life head growth is more rapid than in the second year
of life (41). The maximum range of HC in Ethiopian boys for the age group 0-1year is 11.40cm
and in girls 10.42cm; whereas it is 1.75cm and 1.92cm respectively for boys and girls in the age
group from 1-2yr. The same findings are seen in different studies. For the age group 0-1 year and
1-2 year, respectively, and in the order of first for boys then for girls: (9.5cm, 9.1cm) and (2.3cm,
2.4cm) (41); (11.6cm, 11.01cm) and (2.19cm, 2.29cm) (39); (11.72cm, 10.86cm) and (2.8cm,
3.06cm) (42); (12.32cm, 11.49cm) and (2.57cm, 2.54cm) (43); (11.56cm, 10.29cm) and
(2.54cm, 2.86cm) (30). So as we see from all the above in early age (0-1yr) regardless of sex
there is a high increment in HC. This is because a very fast histological change in this age (42).
All this tells us measuring HC is extremely important and any deviation has to be watched
more carefully in this age group than any age in the life time. And from all the above studies, we
can see that the Ethiopian HC growth is almost the same to others in the first year of life for
both sexes. But it is the slowest one of all in the second year of life.
33##
Ethiopian boys HC in comparison with Ethiopian girls HC
The mean of HC for each age group and sex is indicated in table 1 and 2. For each percentiles
(3rd, 50th , 97th) the HC of boys is above girls. The minimal differences (0.19cm, 0.14cm and
0.09cm) for 3rd,50th and 97th percentile respectively and which are all at birth. The maximum
difference for the same percentiles is 1.14cm (at 17month), 1.18cm (at 5month) and 1.21cm (at
5month) in the same order. So the mean difference ranges from 0.14cm to 1.18cm. This finding
is in line with a published study by Barber(41) who gate the mean difference before the age of
three years in the range from 0.79 to 1.17cm then the ranges decreases to be 0.45cm to 0.85cm.
So we can say that at the beginning boys HC increases faster than girls then come to be slow but
no where girls are above boys in HC (42). For all percentile with increasing age the gap in HC
between boys and girls also increases. There is also a research which tells us that as there is a
faster increase in HC of girls than boys in later age and this is more pronounced for HC than
stature and weight (44).
Ethiopian HC in comparison with WHO HC
These have been presented with seven percentiles: 3rd , 10th , 25th, 50th, 75th, 90th and 97th. But for
simplicity as already mentioned the comparison is only for the 3rd , 50th, and 97th percentile. For
both boys and girls HC growth charts showed that the Ethiopian HC entirely lies above the WHO
curve in the upper percentile. In this percentile for boys the difference ranges from 0.18cm to
1.06cm at the age of 24month and 4month respectively. In girls it is from 0.43cm at 24month to
1.35cm for neonates. So for the upper percentile in both sexes the maximum difference is more
than 1percentile which is at an early age and the minimum in late age (24month). This tells us
that irrespective of gender for the upper percentile with increasing age the WHO and Ethiopian
curve close each other. For both sexes, we can also see from the 97 percentile graph the WHO
curve is out of the 95%CI of Ethiopian curve and this difference might be statistically significant.
In both sexes, we have found that more Ethiopian children above +2SD and few below -2SD
when using the WHO standard as a reference. The overall percentage above +2SD is 0.69% of
each sex. While the percentage below -2SD is 0.21% for boys and 0.14%for girls. This result is
consistent with a finding by Juliusson et al. (30) But more difference with WHO in Norwegian
34##
and Belgium standard than Ethiopian. So If one uses the WHO growth chart when measuring
Ethiopian children, more children will be registered as having a HC above the 97th percentile,
although they are under the 97th percentile of the Ethiopian population.
Regarding the 3rd percentiles the difference is very minimal compared to the 97th percentile
difference. Boys with a difference of 0.23cm in neonates to 0.55cm at 24month and for girls the
difference ranges from 0.47cm to 0.55cm as the same age in boys respectively. So even if the
Ethiopian is entirely below the WHO for the whole age span; they are almost on the same line up
to the age of about 6-7mo. Since then the gap continuously increases and that could be explained
by nutritional differences in between the two samples. But the WHO curves have never been out
of the 95%CI of Ethiopian curve.
The period from birth to age two is especially important for optimal growth, health, and
development. A WHO growth standard was prepared to show how all the world children should
grow provided that they are exclusively breast feed (28). As described earlier in this paper
Ethiopia is the most affected country by malnutrition in the world and when we see the overall
trend of malnutrition in Ethiopian children it increases with increasing age, particularly in height
for age (stunting/restricted height) and weight for age (underweight) (33). It is exactly at the
same age of 6-8 month where the stunting, wasting and underweight level increases very fast
and the Ethiopian HC starts go down from its comparisons WHO and Norwegians. Stunting and
underweight keep going up where as wasting will go slightly down after having a maximum
recording at the age of 9-11month(24). This could be by the difference in breast feeding practice
in between these three samples especially in late age. In Ethiopia complementary feeding is not
common, not introduced on time for all. Children aged 6-23months who are appropriately feed
based on the recommendation is only 4 % in the country (33).
This is supported by a study which show that the rate of increase in HC is reduced for children
who are severely deprived from malnutrition(45). A published study also supports this idea and
show that protein energy malnutrition (PEM) in the early age group is a main reason for some
damage to the brain and this may end up with a decrease in HC (46). A case control study of
children under two years in Addis Ababa show that ” 35 of the 38 controls had a HC within the
normal range, but 11of the 18 patients with marasmus had a HC below the normal range. The
35##
rest 7 of the patients with marasmus and all 10 of those with Kwashiorkor had a HC within the
lower part of the normal range” (45).
Ethiopian HC in comparison with Norwegian HC
In the 97th percentile the difference is almost negligible (maximum of 0.63cm and 0.48cm for
boys and girls, respectively) in which the Ethiopian is above the Norwegian. For both sex the
two curves cross each other at the age of 17months where the Ethiopian standard starts to go
down and then the gap continually increases. For both genders the Ethiopian 3rd percentile is
entirely below the Norwegian standard with maximum difference recorded at 24mo age (2.04cm
for boys and 2.17cm for girls) and minimum difference recorded at early age (0.39cm for boys
and 0.12cm for girls). Here the maximum difference is not like in the 97th percentile, which was
in between Ethiopian and WHO rather here it is in between the Norwegian standard and
Ethiopian curve. The difference which is recorded in late age (24mo) reaches up to 2 percentile.
This tells as irrespective of gender for the lower percentile with increasing age the Ethiopian
curve going down while the other two curves (WHO and Norwegians) going up with the
Norwegian the fastest. This could be explained by ethnic differences in addition to wide
nutritional difference between Ethiopia and Norway.
When there is a large increase in HC particularly increases in each percentile level the first and
the most important one which has to be considered especially in the first few years is
hydrocephalus (47). At the lower percentile Ethiopian is the lowest of all. Later in 50th
percentile Ethiopian curve become in between the WHO and Norwegian. But in the upper most
percentile it is the Ethiopians which is the top one.
To sum up, Ethiopian reference ranges for children 0-24 months of age were found to be
significantly different from those established by WHO, suggesting the use of local reference for
the screening for hydrocephalus. We speculate that a trend towards lower 3-percentile values
with advancing age in the Ethiopian children may be due to nutritional or environmental reasons. #
36##
Limitation and strength of the study
The study tries to collect data more from Addis Ababa and other big cities of the country.The
ethnic distribution of the data is more or less as ethnic distribution in Addis in the sequence of
Amhara, Oromo, Tigray, Somali and Gurage (table 3). In the 2011 census, more than 80 ethnic
groups are listed, 10 of them with a population of more than 1 million It is therefore possible that
the HC measurements should have been collected in several parts of the country in order to
produce a HC curve that is representative for the whole population. However, Addis Ababa is
only a little more than one century old and thus most of the inhabitants, relatively recently
moved in from different parts of the country. The city is probably the area in Ethiopia with the
highest ethnical diversity; thus, our HC charts are most likely created on the basis of data from
an ethnically diverse population that do not deviate too much from the national average (table
4).the city seems to represent the different ethnicities nicely. Nevertheless, we believe that the
strength of the chart would have been considerately improved if it were based also on
measurements collected from all ethnic groups of the country. The children were screened only
for nationality, ensuring that only children of Ethiopian origin were included in the HC-curves.
The population of Addis Ababa has a total of less than 1 % of people from foreign nationalities,
and none of the children in the study were among these.
As we see above PEM has an effect on the growth of HC, especially stunting (chronic
malnutrition) and underweight. The prevalence of malnutrition in Ethiopian different in rural and
urban areas. But as the HC data is collected from health centers and hospitals in the city this
could be one potential limitation of the study. Another limitation of the study is not taking into
account the gestational age of the mother, weight of the child, familial HC in which all the
factors could have an effect on the HC of the baby. But different studies show that it is sex and
age of the baby are the most determinant of HC growth.
#
37##
References%
1.# Zahl#SM,#Wester#K.#Routine#measurement#of#head#circumference#as#a#tool#for#detecting#intracranial#expansion#in#infants:#what#is#the#gain?#A#nationwide#survey.#Pediatrics.#2008;121(3):e416E20.#2.# Alia#Hdeib#ARC.#Hydrocephalus#in#Children#and#Adults.#Richard#G.#Ellenbogen#SIA,#editor.#Philadelphia:#Saunders,#an#imprint#of#Elsevier#Inc;#2012.#3.# Raimondi#AJ.#A#unifying#theory#for#the#definition#and#classification#of#hydrocephalus.#Childs#Nerv#Syst.#1994;10(1):2E12.#4.# Rekate#HL.#The#definition#and#classification#of#hydrocephalus:#a#personal#recommendation#to#stimulate#debate.#Cerebrospinal#Fluid#Res.#2008;5:2.#5.# Dandy#WE.#Experimental#hydrocephalus.#Ann#Surg.#1919;70:129E42.#6.# Menounou#A.#Head#Size:#is#it#important?#PAEDIATRIC#NEUROLOGY.#2011;11(2):16E20.#7.# Kalangu#KK.#Pediatric#neurosurgery#in#AfricaEEpresent#and#future.#Childs#Nerv#Syst.#2000;16(10E11):770E5.#8.# Gale#CR,#O'Callaghan#FJ,#Bredow#M,#Martyn#CN.#The#influence#of#head#growth#in#fetal#life,#infancy,#and#childhood#on#intelligence#at#the#ages#of#4#and#8#years.#Pediatrics.#2006;118(4):1486E92.#9.# Chi#JH,#Fullerton#HJ,#Gupta#N.#Time#trends#and#demographics#of#deaths#from#congenital#hydrocephalus#in#children#in#the#United#States:#National#Center#for#Health#Statistics#data,#1979#to#1998.#J#Neurosurg.#2005;103(2#Suppl):113E8.#10.# Wiswell#TE,#Tuttle#DJ,#Northam#RS,#Simonds#GR.#Major#congenital#neurologic#malformations.#A#17Eyear#survey.#Am#J#Dis#Child.#1990;144(1):61E7.#11.# Persson#EK,#Hagberg#G,#Uvebrant#P.#Hydrocephalus#prevalence#and#outcome#in#a#populationEbased#cohort#of#children#born#in#1989E1998.#Acta#Paediatr.#2005;94(6):726E32.#12.# Fernell#E,#Hagberg#G.#Infantile#hydrocephalus:#declining#prevalence#in#preterm#infants.#Acta#Paediatr.#1998;87(4):392E6.#13.# Sipek#A,#Gregor#V,#Horacek#J,#Masatova#D.#[Congenital#hydrocephalus#1961E2000EEincidence,#prenatal#diagnosis#and#prevalence#based#on#maternal#age].#Ceska#Gynekol.#2002;67(6):360E4.#14.# Garne#E,#Loane#M,#Addor#MC,#Boyd#PA,#Barisic#I,#Dolk#H.#Congenital#hydrocephalusEEprevalence,#prenatal#diagnosis#and#outcome#of#pregnancy#in#four#European#regions.#Eur#J#Paediatr#Neurol.#2010;14(2):150E5.#15.# Qureshi#MM,#Piquer#J,#Young#PH.#Mobile#endoscopy:#a#treatment#and#training#model#for#childhood#hydrocephalus.#World#Neurosurg.#2013;79(2#Suppl):S24.e1E4.#16.# Warf#BC.#Hydrocephalus#in#Uganda:#the#predominance#of#infectious#origin#and#primary#management#with#endoscopic#third#ventriculostomy.#J#Neurosurg.#2005;102(1#Suppl):1E15.#17.# Illingworth#RS,#Lutz#W.#Head#circumference#of#infants#related#to#body#weight.#Archives#of#disease#in#childhood.#1965;40(214):672E6.#18.# Oyewole#A,#Adeloye#A,#Adeyokunnu#AA.#Psychosocial#and#cultural#factors#associated#with#the#management#of#spina#bifida#cystica#in#Nigeria.#Dev#Med#Child#Neurol.#1985;27(4):498E503.#19.# Tambo#FF,#Djientcheu#V,#Chiabi#A,#Mbarnjuk#SA,#Walburga#YJ,#Mbonda#E,#et#al.#Our#experience#in#the#management#of#infantile#hydrocephalus:#a#study#on#thirtyEfive#regrouped#cases#in#Yaounde,#Cameroon.#Afr#J#Paediatr#Surg.#2011;8(2):199E202.#20.# Gokcay#G,#Furman#A,#Neyzi#O.#Updated#growth#curves#for#Turkish#children#aged#15#days#to#60#months.#Child#Care#Health#Dev.#2008;34(4):454E63.#21.# Bartholomeusz#HH,#Courchesne#E,#Karns#CM.#Relationship#between#head#circumference#and#brain#volume#in#healthy#normal#toddlers,#children,#and#adults.#Neuropediatrics.#2002;33(5):239E41.#22.# Coronado#R,#Giraldo#J,#Macaya#A,#Roig#M.#Head#circumference#growth#function#as#a#marker#of#neurological#impairment#in#a#cohort#of#microcephalic#infants#and#children.#Neuropediatrics.#2012;43(5):271E4.#
38##
23.# Wilson#RK,#Williams#MA.#Evidence#that#congenital#hydrocephalus#is#a#precursor#to#idiopathic#normal#pressure#hydrocephalus#in#only#a#subset#of#patients.#Journal#of#neurology,#neurosurgery,#and#psychiatry.#2007;78(5):508E11.#24.# Ellis#JA,#Anderson#RC,#O'Hanlon#J,#Goodman#RR,#Feldstein#NA,#Ghatan#S.#Internal#cranial#expansion#surgery#for#the#treatment#of#refractory#idiopathic#intracranial#hypertension.#J#Neurosurg#Pediatr.#2012;10(1):14E20.#25.# Samuelsen#SO,#Bakketeig#LS,#Tretli#S,#Johannesen#TB,#Magnus#P.#Head#circumference#at#birth#and#risk#of#brain#cancer#in#childhood:#a#populationEbased#study.#Lancet#Oncol.#2006;7(1):39E42.#26.# BreuningEBroers#JM,#Deurloo#JA,#Gooskens#RH,#Verkerk#PH.#At#what#age#is#hydrocephalus#detected,#and#what#is#the#role#of#head#circumference#measurements?#Eur#J#Public#Health.#2014;24(1):32E4.#27.# Cole#TJ.#Do#growth#chart#centiles#need#a#face#lift?#Bmj.#1994;308(6929):641E2.#28.# Borghi#E,#de#Onis#M,#Garza#C,#Van#den#Broeck#J,#Frongillo#EA,#GrummerEStrawn#L,#et#al.#Construction#of#the#World#Health#Organization#child#growth#standards:#selection#of#methods#for#attained#growth#curves.#Statistics#in#medicine.#2006;25(2):247E65.#29.# Wright#CM,#Inskip#HM,#Godfrey#K,#Williams#AF,#Ong#KK.#Monitoring#head#size#and#growth#using#the#new#UKEWHO#growth#standard.#Archives#of#disease#in#childhood.#2011;96(4):386E8.#30.# Juliusson#PB,#Roelants#M,#Nordal#E,#Furevik#L,#Eide#GE,#Moster#D,#et#al.#Growth#references#for#0E19#yearEold#Norwegian#children#for#length/height,#weight,#body#mass#index#and#head#circumference.#Ann#Hum#Biol.#2013;40(3):220E7.#31.# International.#CSAEaI.#Ethiopia#Demographic#and#Health#Survey#2011.#.#Addis#Ababa,#Ethiopia#and#Calverton,#Maryland,#USA:#Central#Statistical#Agency#and#ICF#International.#;#2012.#32.# Authority#CS.#Report#of#the#1994#census#of#Addis#Ababa.#Addis#Ababa:#1997.#33.# International.#CSAEaI.#Ethiopia#Demographic#and#Health#Survey#2011.#Addis#Ababa,#Ethiopia#and#Calverton,#Maryland,#USA:#Central#Statistical#Agency#and#ICF#International.#,#2012.#34.# Norton#TOK.#Anthropometrica:#A#Textbook#of#Body#Measurement#for#Sports#and#Health#Courses.#Australia:#University#of#New#South#Wales;#1996.#35.# Huntingford#CFBaGWB.#The#Ethiopian#Calendar.#36.# Cole#TJ,#Green#PJ.#Smoothing#reference#centile#curves:#the#LMS#method#and#penalized#likelihood.#Statistics#in#medicine.#1992;11(10):1305E19.#37.# Microsoft#Office#Excel,#2003.#38.# M#H.#Requirements#for#anthropometric#references##In:#Hermanussen#M,#editor.#Auxology,#studying#human#growth#and#development.#Schweizerbart,#Stuttgart,#Germany,2013.#p.#159.#39.# WHO.#Head#Circumference#of#age#growth#charts.#2006###
#2006#[cited#2013#May].#Available#from:#http://www.who.int/childgrowth/standards/hc_for_age/en/index.html.#40.# P#B#Júlíusson#MR,#K#Hoppenbrouwers,#R#Hauspie,#R#Bjerknes.#Growth#of#Belgian#and#Norwegian#children#compared#to#the#WHO#growth#standards:#prevalence#below#−2#and#above#+2#SD#and#the#effect#of#breastfeeding.#Archives#of#disease#in#childhood.#2011;96:916E21.#41.# Westropp#CK,#Barber#CR.#Growth#of#the#skull#in#young#children.#I.#Standards#of#head#circumference.#Journal#of#neurology,#neurosurgery,#and#psychiatry.#1956;19(1):52E4.#42.# Roche#AF,#Mukherjee#D,#Guo#SM,#Moore#WM.#Head#circumference#reference#data:#birth#to#18#years.#Pediatrics.#1987;79(5):706E12.#43.# Ounsted#M,#Moar#VA,#Scott#A.#Head#circumference#charts#updated.#Archives#of#disease#in#childhood.#1985;60(10):936E9.#44.# Eichorn#DH,#Bayley#N.#Growth#in#head#circumference#from#birth#through#young#adulthood.#Child#development.#1962;33:257E71.#

39##
45.# Vahlquist#B,#Engsner#G,#Sjogren#I.#Malnutrition#and#size#of#the#cerebral#ventricles.#Echoencephalographic#studies#in#infants#and#young#children.#Preliminary#communication.#Acta#paediatrica#Scandinavica.#1971;60(5):533E9.#46.# Udani#PM.#Protein#energy#malnutrition#(PEM),#brain#and#various#facets#of#child#development.#Indian#journal#of#pediatrics.#1992;59(2):165E86.#47.# Korobkin#R.#The#relationship#between#head#circumference#and#the#development#of#communicating#hydrocephalus#in#infants#following#intraventricular#hemmorrhage.#Pediatrics.#1975;56(1):74E7.#
#

40##
#
Annex
Annex 1 – Consent form
University of Bergen,
Center for International Health, 5021 Bergen, NORWAY. Date of measuring: ----------------- Informed consent Part 1: information sheet Dear parents, My name is Ephrem Bililigne Amare, and I am a Master student at the Centre of International Health at the University of Bergen, Norway. In collaboration with Addis Ababa University and by approval of the Ministry of health, this thesis aims to make a growth chart by collecting data from healthy children and that enables health professionals in the early diagnosis of hydrocephalus. Hydrocephalus means increased amount of fluid and increased pressure in the brain. If untreated, this can – sometimes – lead to health problems of the child. Through simple routine measuring of the head circumference this can often be detected. This procedure is common in many countries in the world. The data collection will be from April 2013 until November 2013 and around 3000 Ethiopian children under 24 months will be asked to participate in the study. If you agree to participate, I will measure the head circumference. The measuring is without harm or discomfort for the child, and takes about half a minute, while the child is on your lap. It is as simple as measuring weight and height. It is no problem for me if the child is sleeping or in breastfeeding. If your child does not participate, you will still have the same service from the health center as before.
The information or measurement values of your child will be kept anonymous. If you have any questions, do not hesitate to ask the responsible nurse at your local MCH-clinic. They will eventually contact me and also you can call to me +251911945330 Part 2: Participants statement Will you participate in the study: Yes….. No…. Signature of parent/caregiver of the child: Thank you for taking your time. Kind regards,

41##
Ephrem Bililigne Amare (sign.) #
Annex 2

42##
Annex 3
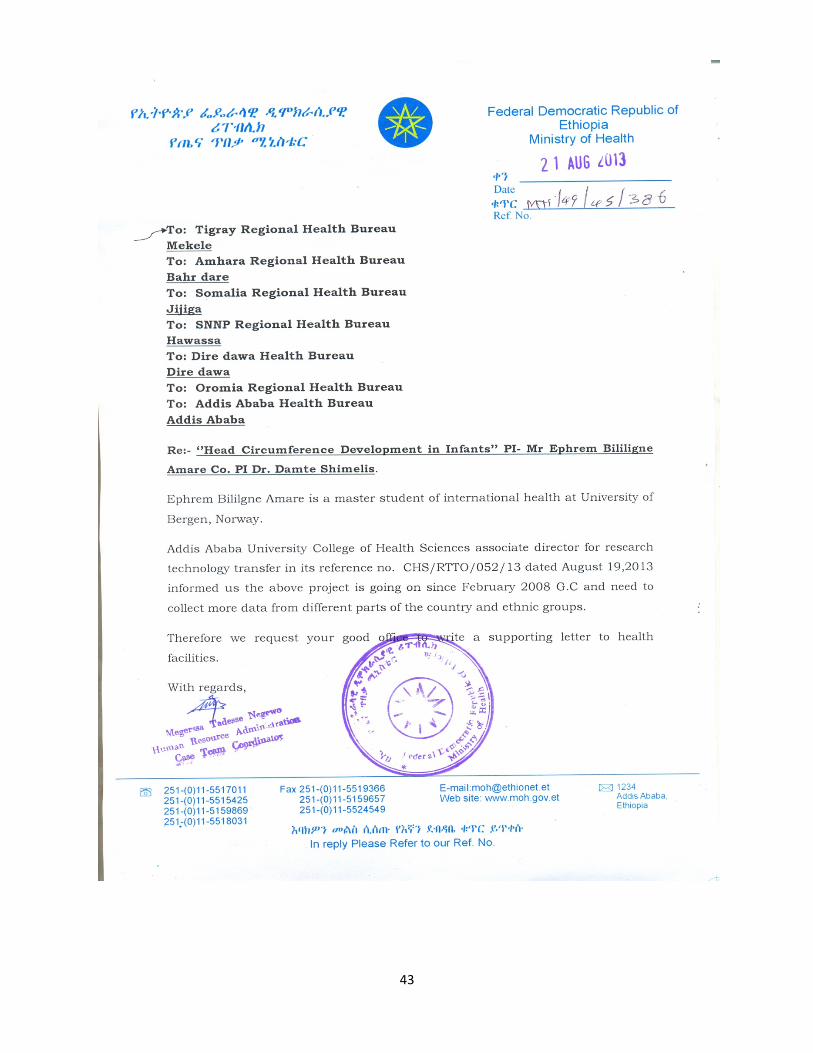
43##


![EON 13W16C F v2 [轉換] - manualszoom.com Size Circumference Nunber ... CIRCUMFERENCE REFERENCE TABLE ... Enter this value to set the wheel circumference. Quick Table](https://img.pdfslide.net/doc/110x75/5af038c77f8b9abc788ce64f/eon-13w16c-f-v2-size-circumference-nunber-circumference-reference.jpg)