Embed Size (px)
Citation preview

1
EARLY DETECTION OF POTENTIAL BANK BANKRUPTCY
THROUGH FINANCIAL RATIO ANALYSIS:
MULTINOMIAL LOGISTIC REGRESSION MODEL
Tengku Nuzulul Qurriyani
Hilda Rossieta
(Department of Accounting, Faculty of Economics, Universitas Indonesia, Depok, Indonesia)
ABSTRACT
Prediction of potential bank bankruptcy based on financial ratios is a continuing
research. This study is aimed to provide prediction model capable of explaining bank’s health,
predicting or detecting early potential bankruptcy of bank, finding formula that can be applied
to all banks, promoting sound banking and simultaneously creating economic prosperity of
the country considering that bank is the country’s economic infrastructure. Statistical
technique based on multinomial logistic regression model is used as method to test the model
with categorical dependent variables given a set of independent variables. It is found that
financial ratio related to bank’s capital adequacy is statistically significant (in two logit
functions) in providing early detection of potential bank insolvency. The accuracy of
predictions by the model is 75% for failed banks (BL), 62.50% for banks classified under
special surveillance or banks in resolution (BDP), and 97.14% for healthy banks (BS).
Financial ratios are believed to have contributed to the bankruptcy prediction model by
89.36%.
Keywords: Financial ratios; Go-public bank; Multinomial logistic regression model;
Prediction accuracy; Prediction model of potential bank bankruptcy
INTRODUCTION
A nation is inevitably prone to monetary crisis. The most significant aspect of the
monetary crisis which affects a nation is banking. This is signified by a number of banks
which in turn belong to categories of BBO (suspended banks) and BTO (take-over banks).
This condition occurred in 1998 in Indonesia when monetary crisis turned into banking crisis.
Fraser and Fraser (1990) assumed that a failure in a bank might lead to a failure in whole
banking system, meaning that a failure in a bank causes other banks to be unhealthy and thus
puts them in danger. In the end, this bad circumstance would reduce a degree of people’s trust
toward banks. To sum up, it is the banking system which maintains the economic stability of a
nation. Bank plays a very important role as the country’s economic infrastructure; therefore, it
is very essential that the government continuously be doing monitoring and controlling of the
stability of all banks. Ghosh (2012) stated that “Banks are the key players in the financial
system, and the bank management is expected to take all prudent actions to ensure the
solvency of the institution and promote the soundness of the financial system” (491).
2
A very crucial indicator which might be representing bank surviving capability is
financial reports that are translated into financial ratios. As Choudhry (2007) mentioned, these
financial reports are primary resources of bank analysis. This research tried to re-evaluate
bank survival through financial ratios analysis and statistical methods. Statistical methods and
a bankruptcy prediction model are two united entities which cannot be separated. A designed
and modified prediction model results in the probability of a bank to be potentially bankrupt
or not (logit and probit methods) so that it is easier for regulators to take an immediate action
to anticipate banking failure (Cheng, Chen, and Fu, 2006; Martin, 1977). When dependent
variables are under more than two categories, a prediction model may be collaborated with
statistical method of multinomial logistic regression (Hosmer and Lemeshow, 2000). This
research uses three different categories of bank surviving capability: BS (surviving bank),
BDP (bank under special surveillance), and BL (failed bank). It is expected that through this
classification model, regulators are capable of taking a prompt action to anticipate the failure
of banking system which might affect the stability of the national economy.
Two models of ratios portraying bank financial condition—CAMEL, cash flow from
operations or operating cash flow (OCF), and market measurement—will also be variables of
this research. It is estimated that financial ratios of CAMEL, OCF, and market measurement
(market’s response to stock exchange) are closely connected to identifying bank performance;
therefore, it can be a prediction and early detection instrument of potential bank bankruptcy.
The effectiveness of the financial ratios above in the prediction and identification of
bank surviving capability requires empirical testing. This is necessary in an attempt to build a
prediction model which might be responding to whether or not accounting numbers are
actually capable of predicting and identifying bank’s health, not to mention detecting potential
bank bankruptcy early. This prediction model would be a supplementary asset for regulators
with their intervention authority to avoid failed operation of a bank as early as possible and
automatically reduce costs of failure.
2.
THEORETICAL REVIEW
Dynamic State of Banking in Indonesia
Indonesia had entered into a phase of the most rapid banking growth when Paket
Deregulasi Keuangan Moneter dan Perbankan [Deregulation Package of Monetary Finance
and Banking] (Pakto: the Package of 27 October 1988 regulation). Indonesian banking history
had shifted into a stage at which banks grew very fast. This was caused by a release of a
regulation which provided an easier access to do the followings: the opening of a new bank

3
office, the establishment and operation of a rural crediting bank, the establishment of a mixed
bank, the operation of a foreign bank, and the opening of a foreign bank branch office
(Mintorahardjo, 2001).
The above change brought a number of risks. Some of the negative consequences of the
Pakto 88 (Mintorahardjo, 2001) were as follow: (i) Principles of carefulness and
professionalism in controlling banking business operation has faded away. Enormous
violations occur and they were highly unlikely to prevent and monitor; (ii) Bank interest value
increased dramatically. Intensity of competition among banks in having as many clients as
possible was getting more obvious.
The Pakto 88 ended up with bank liquidation—banks were difficult in liquidity and
credits were not running smoothly. Monetary crisis in 1998 had ruined Indonesian banking
system, and thus a preventive action to save banking sector and economic stability was in
urgent need. Restructuring strategy had to involve three groups of bank, which were banks on
the brink of failure which needed to liquidate immediately, healthy banks, and banks likely to
perform better if provided support (Stiglitz, 2012).
Development of a Prediction Model of Potential Bank Bankruptcy
An interesting fact that accounting practice in a real world may be utilized to predict
and identify a phenomenon of bank bankruptcy has come into discussion. Accounting
numbers within one particular organization (company or bank) is believed to be reflecting an
actual financial condition of the organization. It is estimated that the numbers are useful to
detect potential bank bankruptcy earlier. This type of prediction model is usually using
accounting data in the form of financial ratios analysis (Watts and Zimmerman, 1986). This
implies that accounting numbers, reflected in financial reports, contain predicting information.
Bernstein (1989) stated that assessment of a company’s past and present financial condition
originated from its financial reports, and the reports might be used to predict its future
operational performance.
This study is narrowed down to banking system due to the fact that it is a pillar of a
nation’s economy. Bank plays a very significant role in maintaining people’s trust toward a
monetary system. Therefore, it is imperative to pay serious attention to bank’s health,
especially bank’s liquidation and solvability. Bank, moreover, functions as a regulator of
money flow and as financial intermediaries, meaning that it provides access for people and
business sectors to obtain financial resources (Ritter, Silber, dan Udell, 2009).
Qurriyani (2000) examined go-public banks’ health in 1997, one year before the
government released categories of BBO (suspended banks) and BTO (take-over banks). A
4
prediction model of potential bank bankruptcy was designed through financial ratios.
Trichotomous logistic regression model was a statistical method used to identify potential
bank bankruptcy. This method applies when trichotomous outcome variable—identification
of bank survival (BBO, BTO, and healthy banks)—becomes a dependent variable and
eventually a function for a number of independent variables (financial ratios of CAMEL).
Factor analysis was conducted with 9 financial ratios, and this led to 2 final factors: F1
(profitability ratio) and F2 (liquidity ratio). F1 showed bank’s capability of generating profit
through its resources utilization, while F2 was related to bank’s ability to fulfill its billed
obligations. From 22 go-public banks examined, Qurriyani (2000) found that they were highly
likely to be classified into BBO, BTO and surviving banks. Qurriyani’s research (2000)
resulted in a model with the prediction accuracy value of 63.6%, with details of BBO=75%,
BTO=50%, and surviving banks=66.7%.
This current research is a continuation of the above research. It is aimed to raise
predicting capability from financial ratios without using factor analysis. There are currently
17 financial ratios to predict and identify the potential of bank bankruptcy. It attempts to find
the most effective predicting ratio of all in order that the prediction model used provides
better classification accuracy. Logit model is still used within this research for banking system
refers to three different categories of bank: failed bank (liquidated bank), bank under special
surveillance, and healthy bank (surviving bank). The primary prerequisite of a logit is that a
dependent variable’s value or conditional mean must be bigger than or equal to 0, and lower
than or equal to 1 1|0 xYE (Hosmer and Lemeshow, 2000).
Statistical method utilized to predict the potential of bank bankruptcy—later forming an
early warning system model—frequently ends up with two different analyses: discriminant
analysis and logistic regression analysis or probit. However, the former type of analysis is not
appropriate to identify the potential of bank bankruptcy when its statistical approach is not
matched pair sampling but random sample from companies to be examined—the number of
bankrupt company samples is lower (Eisenbeis, 1977). Grice and Ingram (2001) proved that
discriminant analysis used by Altman (1986), re-used for present samples, had a lower
predicting accuracy value of 57.8%.
It is evident that logistic regression analysis enables readers to measure the bankruptcy
value of each bank or company more easily through looking at the bankruptcy percentage of
an examined bank or company. Logit model is more recommended than MDA due to the fact
that it is easier to do, and it doesn’t require independent variable data which have to be
normally distributed (Espahbodi, 1991). This condition also applies to multinomial logistic

5
regression model which is the extension of binary logistic regression (dichotomy). The only
feature differentiating logistic regression and multinomial logistic regression lies on the
number of dependent variables, meaning that the dependent variables within the latter analysis
are classified into more than two categories.
The computerized era has brought a variety of statistical methods in connection with the
prediction model of potential bank bankruptcy, and these methods are designed to end up with
prediction accuracy values closer to real prediction accuracy values. The methods include
artificial neural network (ANN) (Kumar and Ravi, 2007), data envelopment analysis (DEA)
(Premachandra, Chen, and Watson, 2011; Premachandra, Bhabra, and Sueyoshi. 2009), and
trait recognition analysis (TRA) (Kolari et al., 2002). The use of these current methods is
closely relevant to two popular multivariate statistical methods—multiple discriminant
analysis and logistic regression.
Kolari (2002) analyzed large bank failure in America with an attempt to build early
warning systems (EWSs) mainly based on accounting and published financial data. He used
two following methods to do so: logit and trait recognition models. Two failed bank samples
were divided into two groups: original sample (data was taken in 1989) to form classification
model, and holdout sample (data was taken in 1990, 1991, 1992) to determine the
effectiveness of an EWS prediction model. Accounting data was taken one until two years
before the banks came into failure. He found out that logit and trait recognition models had
capability of identifying risks of bank bankruptcy, especially on original sample classification
result, which resulted in the predicting accuracy percentage of 95%-100%.
Premachandra, Bhabra, and Sueyoshi (2009) were trying to compare logit and DEA
models in order to create a prediction model of corporate bankruptcy. DEA model was
naturally non-parametric and distribution-free-based. On the other hand, Premachandra, Chen,
and Watson (2011) revised the model which Premachandra, Bhabra, and Sueyoshi (2009)
used. They found that the effectiveness of super-efficiency DEA model in predicting failed
corporate was relatively lower than that in predicting surviving corporate. DEA model tended
to end up with efficiency scores. It was proved that DEA superior model successfully
identified corporate success.
In addition, Öğüt et al. (2012) took samples of banks in Turkey in order to measure
financial strength ratings of the bank samples through a series of financial ratios, and to do
statistical comparison between logistic regression and multiple discriminant analysis models
using data mining methodology (support vector machine and artificial neural network). It was
found that logit regression was still dominating over discriminant analysis in terms of

6
predicting banks’ financial strength ratings providing that independent variables were factor
scores, and that the most essential factors which contributed to the prediction effectiveness
included efficiency, profitability, and proportion of loans in the assets.
Multiple discriminant analysis tends to end up with a predictor capable of
discriminating failed corporate and successful (surviving) corporate. Nevertheless, a basic
fallacy of the utilization of multiple discriminant analysis is the subjective cutoff score which
is the most effective element in differentiating failed corporate and non-failed corporate
(Stickney and Brown, 1999). This circumstance encourages numerous researchers to design a
prediction model of bankruptcy through logistic regression analysis—which is relatively
easier to interpret because it results in percentage of bankruptcy. When dependent variables
belong to two categories, multinomial logistic regression model is regarded to be capable of
creating a prediction model of bankruptcy which is signified by the fact that each examined
organization or bank has its own bankruptcy percentage or value. This condition indicates the
predicting accuracy percentage of the model.
Financial Ratio as a Determining Factor of Bank Bankruptcy
CAMEL
Andersen (2008) claimed that the assumption on which CAMEL concept is associated
with conditions that cause banks prone to experiencing the following possible set of failures:
low capital adequacy, low assets quality and management, and decreased earnings and
liquidity. “As a bank or firm becomes more and more insolvent, it gradually enters a danger
zone. Then, changes to its operations and capital structure must be made in order to keep it
solvent” (Kumar and Ravi, 2007, 1).
Financial ratio of CAMEL, ratio of cash flow, and market assessment ratio are usually
used to analyze bank profitability, bank solvability, and bank risks. To what extent might
banks be able to tolerate risks to gain profits? Another thing which banks want to achieve is
sustainability of their business operations within banking market, meaning that they are
capable of remaining financially strong and healthy and backing a nation’s economic growth
simultaneously. In relation to operation sustainability, it is imperative that there be a primary
predictor which can define bank’s capability of putting operation risks and profit into balance
in order to find an early detection method of bank bankruptcy or bank failure. Many studies
have attempted to explore the potential of early warning systems for banking cases or bank
rating. Financial ratios utilized originate from fundamental analysis of corporate or banks
including profitability, liquidity, solvability, and efficiency. Fraser and Fraser (1990) claimed

7
that there were four determining factors of banking financial soundness, and these four factors
included (i) earnings; (ii) liquidity; (iii) asset quality; and (iv) capital adequacy.
CAMEL concept is actually an independent variable in research, originating from a
series of financial ratios used by previous researchers and having relevance to the
identification of bank bankruptcy or bank soundness. The CAMEL concept proxy used in this
study refers to Kasmir (2000), and it was proven significant based on previous research in
defining bank performance in Indonesia. For example, the significant ratios used in Surifah’s
research (2002) were risk assets ratio, RORA, assets utilization, ROA, leverage management,
ROE, quick ratio, and LDR; in Aryati’s and Manao’s research (2000), the ratios were RORA,
ROA, BOPO, net call money, and LDR; while in Payamta’s research (2008), the ratios were
CAR, ROA, ROE, LDR.
Cash Flow
In addition to CAMEL concept, cash flow (OCF) concept might be used to measure
bank performance, primarily bank bankruptcy. The information about corporate liquidity
condition and corporate capability of getting funding from corporate core business activities
might be obtained from cash flow report (White, Sondhi, and Fried, 2003). Providing that
OCF value was positive, then corporate was likely to be sustainable for long (FASB, 1978).
Beaver (1966) also stated that the higher the OCF value was the lower the probability of
failure was. Based on Beaver’s research (1966), it was found that cash flow/total liability
variable was a significant variable in predicting bank bankruptcy. The same outcome was also
shared by Rujoub, Cook, and Hay (1995) through their study that OCF was relatively
significant in predicting bank bankruptcy. It was tested through discriminant analysis.
A huge number of investors have used OCF as the most effective determinant factor in
identifying potential corporate bankruptcy since cash flow concept cannot be manipulated.
They all are merely interested in cash flow from operations, ignoring cash flow from investing
as well as cash flow from financing. Schilit and Perler (2010) assumed that OCF was ‘a
golden child’ for it contains inside corporate capability of generating revenues from their core
business operations.
Share Price as Market Response to Bank Performance
It is convinced that stock market is closely related to financial report analysis. The more
active the market is, the more critical the investors are to decide if or not they want to invest.
Accounting numbers are detrimental factors for investors to make a decision of whether or not
they want to invest in the market. It is believed that through investment they will be able to
improve their wealth. Bauman (2003) found out that earnings were correlated with and had a
8
significantly positive impact on market value of equity. When earnings fell, indicating that
earnings prospect was poor, market value of equity (ME) decreased, too.
White, Sondhi, and Fried (2003) took Fama’s and French’s statement (1992) that PBV
ratio was an important predictor of future stock returns. A company with a low PBV value
would have a higher return than that with a high PBV value. A low PBV value might be also
indicating a high BE/ME ratio which automatically referred to poor earnings prospects. This
fact signifies that PBV ratio is applicable for identification of potential bank bankruptcy.
According to Bodie, Kane, and Marcus (2011), PBV or market-price-to-book ratio indicated
firm value in terms of growth opportunities. It is believed that corporate having significant
growth are more able to identify their upcoming cash flow (Smith and Watts, 1992).
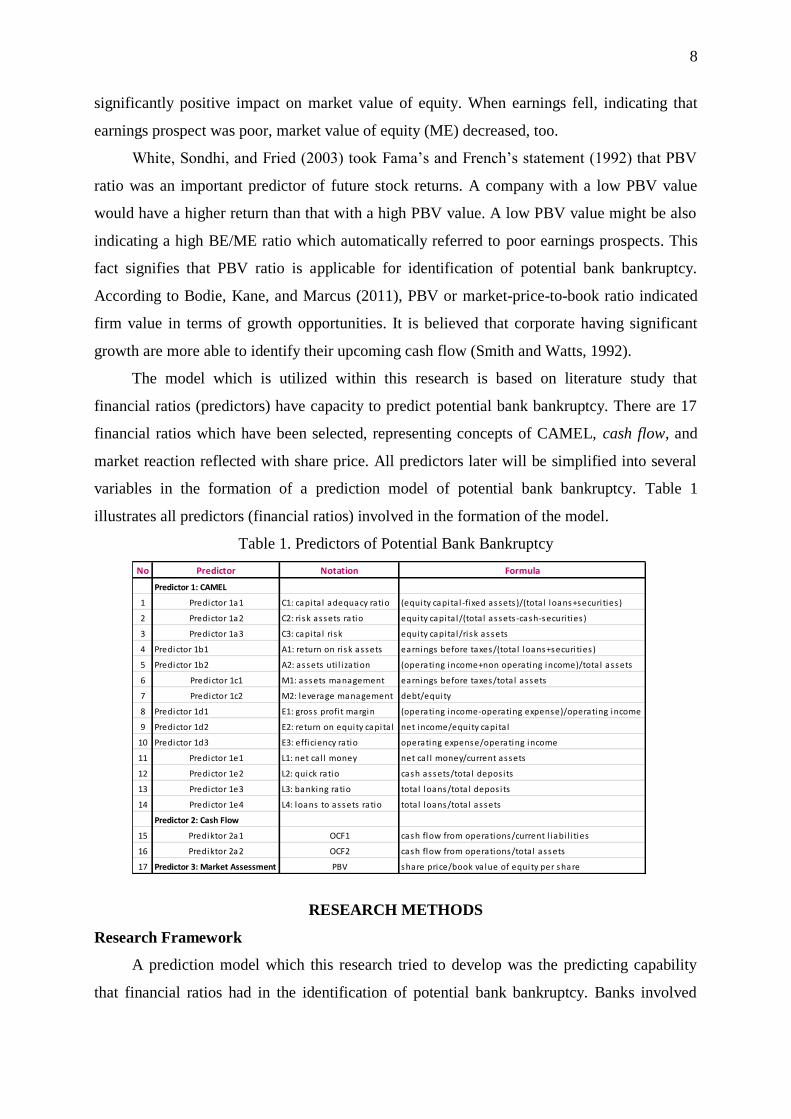
The model which is utilized within this research is based on literature study that
financial ratios (predictors) have capacity to predict potential bank bankruptcy. There are 17
financial ratios which have been selected, representing concepts of CAMEL, cash flow, and
market reaction reflected with share price. All predictors later will be simplified into several
variables in the formation of a prediction model of potential bank bankruptcy. Table 1
illustrates all predictors (financial ratios) involved in the formation of the model.
Table 1. Predictors of Potential Bank Bankruptcy
RESEARCH METHODS
Research Framework
A prediction model which this research tried to develop was the predicting capability
that financial ratios had in the identification of potential bank bankruptcy. Banks involved
No Predictor Notation Formula
Predictor 1: CAMEL
1 Predictor 1a1 C1: capita l adequacy ratio (equity capita l -fixed assets)/(total loans+securi ties )
2 Predictor 1a2 C2: ri sk assets ratio equity capita l/(total assets-cash-securi ties )
3 Predictor 1a3 C3: capita l ri sk equity capita l/risk assets
4 Predictor 1b1 A1: return on risk assets earnings before taxes/(total loans+securi ties )
5 Predictor 1b2 A2: assets uti l i zation (operating income+non operating income)/total assets
6 Predictor 1c1 M1: assets management earnings before taxes/total assets
7 Predictor 1c2 M2: leverage management debt/equity
8 Predictor 1d1 E1: gross profi t margin (operating income-operating expense)/operating income
9 Predictor 1d2 E2: return on equity capita l net income/equity capita l
10 Predictor 1d3 E3: efficiency ratio operating expense/operating income
11 Predictor 1e1 L1: net ca l l money net ca l l money/current assets
12 Predictor 1e2 L2: quick ratio cash assets/total depos its
13 Predictor 1e3 L3: banking ratio total loans/total depos its
14 Predictor 1e4 L4: loans to assets ratio total loans/total assets
Predictor 2: Cash Flow
15 Prediktor 2a1 OCF1 cash flow from operations/current l iabi l i ties
16 Prediktor 2a2 OCF2 cash flow from operations/total assets
17 Predictor 3: Market Assessment PBV share price/book va lue of equity per share

9
within this research were classified into three following categories: surviving banks (BS),
banks under special surveillance (BDP), and failed banks (liquidated banks) (BL). This
research was aimed to examine whether or not the following financial ratios: CAMEL, cash
flow, and share price were able to detect potential bank bankruptcy so that it can be a very
effective method of early detection which later would contribute to decision making in
whether or not to save or liquidate banks (Figure 1). An econometric model that this research
had selected for the formulation of early detection system of potential bank bankruptcy was
multinomial logistic regression.
Figure 1. Research Framework
Sample Selection
Secondary data was the main source of research data—banks as analysis unit. Financial
statements as of 31 December 2006 to 31 December 2007 (income statement, balance sheet,
cash flow statement) and stock market data (2006 and 2007) were taken from go-public banks
(registered at BEI (Indonesia Stock Exchange)). The data was available on BEI website, bank
websites, Indonesian Capital Market Directory (ICMD), Indonesia Stock Exchange (IDX),
and Yahoo Finance. Research population was go-public banks with consideration that it was
relatively easy to get financial statements of these banks which had been audited. Another
consideration was indeed transparency. Research samples were narrowed to go-public banks
operating in years 2006 and 2007, with a minimum listing period of one year to avoid
Prediction Model of Potential Bank Bankruptcy
Probability of Bankruptcy
Early Detection of Potential Bank Bankruptcy
Financial RatiosBank Survival Categories
Surviving Bank (BS)
Bank under Special
Surveillance (BDP)
Failed Bank (BL)
CAMEL
Cash Flow
Share Price
Capital Adequacy
Assets Quality
Management
Earnings
Liquidity
Capital Adequacy Ratio, C1
Risk Assets Ratio, C2
Capital Risk, C3
Return on Risk Assets, A1
Assets Utilization, A2
Assets Management, M1
Leverage Management, M2
Gross Profit Margin, E1
Return on Equity Capital, E2
Efficiency Ratio (BOPO), E3
Net Call Money, L1
Quick Ratio, L2
Banking Ratio (LDR), L3
Loans to Assets Ratio, L4
OCF/Current Liabilities, OCF1
OCF/Total Assets, OCF2
Price to Book Value Ratio PBV

10
distorted financial statements. This period of two years was expected to predict potential bank
bankruptcy which would occur one or two years ahead. In total, final samples were 47 (Table
2).
Table 2. Research Samples—Original Sample
In order to validate the model developed from original samples, Table 3 presents second
samples—holdout sample.
Table 3. Research Samples—Holdout Sample
Variable Definition and Operationalization
Dependent Variables
There are three categories of bank involved within this research: surviving banks (BS)
→ Y=0; banks under special surveillance (BDP) → Y=1; and failed banks (liquidated banks)
(BL) → Y=2. Banks which are taken over by LPS (Indonesia Deposit Insurance Corporation)
and under supervision of Bank Indonesia belong to category of BL; banks merged into and
acquired by other banks to achieve a healthy banking system are classified into category of
BDP; and BS is a category for the banks that are still operating well up to now, 2012. Data
resources of dependent variables were taken from bank’s annual report and LPS’ annual
report.
Research carried out by Koetter et al. (2007) presented that distressed and non-
distressed mergers tended to have a worsened CAMEL condition compared with non-merging
banks. This worsened condition was signified by low capital ratios, high credit risk, and
terrible efficiency factor. The research (Koetter et al., 2007) showed that bank merger tended
to happen to banks with bad financial profiles. However, it is not clear whether or not one
particular bank is merged or acquired, and this is caused by no access to the real data of it.
Year Data Number of Bank Selection Sample Bank
2006 Banks regis tered in BEI 26
Banks l i s ting in 2006: BBKP, BNBA, SDRA 3 23
2007 Banks regis tered in BEI 29
Banks l i s ting in 2007: AGRO, BACA, MCOR 3
Bank del is ting in 2007 (merged with Commonwealth): ANKB 1
Bank acquis i tion in 2007: BSWD 1 24
Research samples 55 8 47
Tahun Data Number of Bank Selection Sample Bank
2008 Banks registered in BEI 28
Banks l i s ting in 2008: BAEK, BTPN 2
Legal merger in 2008: MCOR 1
Bank acquis i tion in 2007: BSWD 1 24
Research samples 28 4 24

11
Merger or acquisition issues are raised with the main objective to strengthen banking capital
for business expansion and competitive survival, not to mention a demand from API
(Indonesia Banking Architecture) for the fulfillment of minimum banking capital.
Independent Variables as Predictors of Potential Bank Bankruptcy
CAMEL-oriented predictors which were popular in previous research include capital
adequacy, assets quality, management, earnings, and liquidity. Besides, cash flow from
operations and market assessment (shares price assessment) are detrimental predictors of
potential bank bankruptcy. It is expected that all ratios utilized within this research, using
statistical approach, are able to create a prediction model of bankruptcy with dominant
predictors capable of early detecting of potential bank bankruptcy.
Stepwise Procedure
Researchers prefer to use this stepwise estimation because it is capable of improving the
accuracy of a prediction model with the involvement of variables significantly contributing to
the identification of potential bank bankruptcy. Hair et al. (2010) claimed that the objective
method in selecting variables to maximize prediction accuracy is stepwise method. Stepwise
regression is very popular in the establishment of a prediction model. Researchers tend to use
many independent variables and later select them to be the variables only having significant
correlation (Hosmer and Lemeshow, 2000). In stepwise procedure, several variables are
united to be a group which has a high significance value, while the others are no longer
existent from statistical model. A variable is deemed important providing that its coefficient
value is statistically significant, signified by the lowest p-value (Hosmer and Lemeshow,
2000). The aid instrument is SPSS 19.
Multinomial Logistic Regression Model
When dependent variables belong to more than two categories (no longer binary nor
dichotomy), the most likely statistical model which accommodates this is multinomial logistic
regression model. Model with three categories results in two logit functions (BS → reference
outcome value (comparing category)). This model is expected to answer a research question.
STATA 11 would be used to run this multinomial logistic regression model. Hosmer and
Lemeshow (2000) said that logistic regression model with dependent variables in the form of
dichotomy data only had one logit function, which was the logit of Y=1 versus Y=0. On the
contrary, when the variables belong to three categories, there would be two logit functions:
the logit of Y=1 versus Y=0, and the logit of Y=2 versus Y=0 (Y=0 functions as a comparing
category). Codes 0, 1, 2 were chosen as dependent variables: BS → Y=0; BDP → Y=1; and
BL → Y=2.

12
The formation of the prediction model with the availability of p covariates and x
constant as a vector of p+1 with a value of =1 resulted in denotation of 2 logit functions
(Hosmer and Lemeshow, 2000):
11212111101 '...)|0(
)|1(ln)( xxxx
xYP
xYPxg pp
22222121202 '...)|0(
)|2(ln)( xxxx
xYP
xYPxg pp
Conditional probability was later formed from each dependent variable:
0)()(2
1
)(211
1
1
1)|0(
xgxg
j
xg eee
xYPj
1)()(
)(
2
1
)(
)(
21
11
11
)|1(
xgxg
xg
j
xg
xg
ee
e
e
exYP
j
2)()(
)(
2
1
)(
)(
21
22
11
)|2(
xgxg
xg
j
xg
xg
ee
e
e
exYP
j
RESEARCH FINDINGS
Description of Dependent and Independent Variables
Numerous data were collected to answer whether or not financial ratios were capable of
detecting potential bank bankruptcy early. Table 4 illustrates description of dependent
variables after they were identified based on their definition. Description of independent
variables, on the other hand, is presented in Appendix 1, including 6 financial ratios after they
were analyzed using stepwise procedure.
0x

13
Table 4. Description of Dependent Variable Data as an Identification Results
according to Definition
Stepwise Procedure
Stepwise estimating procedure was aimed to formulate a regression model with its
independent variables which were statistically significant to maximize predicting accuracy
(Hair et al., 2010). Out of 17 financial ratios, only 6 ratios originating from step 6 of forward
stepwise procedure—SPSS 19 were used. Step 6 was utilized first with conditions of formula
=0.15 and =0.20, as Lee and Koval (1997) suggested. In order to find important
variables to establish a model, it was essential to determine a higher value of α (alpha) to
ensure that each variable was equally selected, especially on cases in which predictors were
enormous (Lee and Koval, 1997).
Multinomial Logistic Regression Model
Testing of a prediction model of potential bank bankruptcy was done in this section.
After 6 important variables obtained from stepwise procedure were included into multinomial
2006
No BL (Y=2) No BDP (Y=1) No BS (Y=0) Total
2008: 2007: 1 Bank Artha Graha Internas ional Tbk
1 Bank Century Tbk → taken over by LPS 1 Bank Arta Niaga Kencana Tbk → del is ting from BEI 2 Bank Centra l As ia Tbk
(in 2009, becoming Bank Mutiara) (merged with Bank Commonwealth) 3 Bank Danamon Indones ia Tbk
2 Bank Swades i Tbk → acquired by Bank of India Indones ia 4 Bank International Indones ia Tbk
2009: 5 Bank Kesawan Tbk
2 Bank Eksekuti f Internas ional Tbk → 2008: 6 Bank Mandiri (Persero) Tbk
under survei l lance of Bank Indones ia 3 Bank Buana Indones ia Tbk → del is ting from BEI 7 Bank Mayapada Tbk
due to bad loan 4 Bank Lippo Tbk → merged becoming CIMB Niaga, and 8 Bank Mega Tbk
(in 2010, becoming Bank Pundi ) del i s ting from BEI 9 Bank Negara Indones ia Tbk
10 Bank Niaga Tbk
tahun 2009: 11 Bank NISP Tbk
5 Bank Bumiputera Indones ia Tbk → ICB Bumiputera 12 Bank Nusantara Parahyangan Tbk
13 Bank Pan Indones ia Tbk
14 Bank Permata Tbk
15 Bank Rakyat Indones ia (Persero) Tbk
16 Bank Victoria International Tbk
2 5 16 23
2007
No BL (Y=2) No BDP (Y=1) No BS (Y=0) Total
2008: 2008: 17 Bank Artha Graha Internas ional Tbk
3 Bank Century Tbk → taken over by LPS 6 Bank Buana Indones ia Tbk → Bank UOB Buana Tbk 18 Bank Bukopin Tbk
(in 2009, becoming Bank Mutiara) 7 Bank Lippo Tbk → merged becoming CIMB Niaga, and 19 Bank Bumi Arta Tbk
del i s ting from BEI 20 Bank Centra l As ia Tbk
2009: 21 Bank Danamon Indones ia Tbk
4 Bank Eksekuti f Internas ional Tbk → 2009: 22 Bank Saudara Tbk
under survei l lance of Bank Indones ia 8 Bank Bumiputera Indones ia Tbk → ICB Bumiputera 23 Bank International Indones ia Tbk
due to bad loan 24 Bank Kesawan Tbk
(in 2010, becoming Bank Pundi ) 25 Bank Mandiri (Persero) Tbk
26 Bank Mayapada Tbk
27 Bank Mega Tbk
28 Bank Negara Indones ia Tbk
29 Bank Niaga Tbk
30 Bank NISP Tbk
31 Bank Nusantara Parahyangan Tbk
32 Bank Pan Indones ia Tbk
33 Bank Permata Tbk
34 Bank Rakyat Indones ia (Persero) Tbk
35 Bank Victoria International Tbk
2 3 19 24

14
logistic regression model, multinomial logistic regression equation from STATA 11 data
analysis was obtained.
Tabel 5. Multinomial Logit Model
Multinomial logistic regression model resulted in 2 logit functions, with condition that
surviving banks (BS) became a comparing category. These two functions later were becoming
2 formulas leading to three probabilities of BS, BDP, and BL. These five formulas would
eventually become prediction models of potential bank bankruptcy, and tested through
holdout sample data (go-public banks registered in BEI in 2008). These holdout sample data
would be used to validate prediction models of potential bank bankruptcy which were
formulated from original sample. Here is presented 5 aforementioned formulas:
1200.392609.242710.1191845.4132088.621159.67182.5)|(
)|(ln)( OCFLEACC
xBSP
xBDPPxg BDP
1100.152653.352179.1401609.3782508.751550.50730.10)|(
)|(ln)( OCFLEACC
xBSP
xBLPxgBL
variable coefficient std error z p-value
Logit Model
bdp
c1 67.159 34.037 1.97 0.048**
c2 -62.088 28.580 -2.17 0.03**
a1 413.845 217.937 1.90 0.058*
e2 -119.710 57.099 -2.10 0.036**
l2 -24.609 11.366 -2.17 0.030**
ocf1 39.200 18.164 2.16 0.031**
intercept 5.182 3.870 1.34 0.181
bl
c1 50.550 30.270 1.67 0.095*
c2 -75.508 65.685 -1.15 0.250
a1 378.609 503.527 0.75 0.452
e2 -140.179 96.664 -1.45 0.147
l2 -35.653 29.036 -1.23 0.219
ocf1 15.100 16.123 0.94 0.349
intercept 10.730 8.161 1.31 0.189
Number of obs = 47
LR chi2(12) = 39.43
Prob > chi2 = 0.0001
Pseudo R2 = 0.5742
(**s igni fikan=5%; *s igni fikan=10%)
Prediction Correct predicted
survival 0 1 2 tota l
bs 34 1 0 35
97.14 2.86 0.00 100.00
bdp 2 5 1 8
25.00 62.50 12.50 100.00
bl 0 1 3 5
0.00 25.00 75.00 100.00
tota l 36 7 4 47
76.60 14.89 8.51 100.00
overa l l percentage 89.36
source: data processed_stata11

15
BSOCFLEACCOCFLEACC eexBSP
11.152653.352179.1401609.3782508.75155.5073.1012.392609.24271.1191845.4132088.621159.67182.51
1)|(
BDPOCFLEACCOCFLEACC
OCFLEACC
ee
exBDPP
11.152653.352179.1401609.3782508.75155.5073.1012.392609.24271.1191845.4132088.621159.67182.5
12.392609.24271.1191845.4132088.621159.67182.5
1)|(
BLOCFlEACCOCFLEACC
OCFLEACC
ee
exBLP
11.152653.352179.1401609.3782508.75155.5073.1012.392609.24271.1191845.4132088.621159.67182.5
11.152653.352179.1401609.3782508.75155.5073.10
1)|(
Validation Testing of Prediction model of Potential Bank Bankruptcy
The five above formulas were tested using holdout sample data. Table 6 shows a
summary of validation of a prediction model of potential bank bankruptcy and predicting
accuracy of the model.
Table 6. Predicting Accuracy of Potential Bank Bankruptcy
The formation of holdout sample data for model validation had predicting accuracy of
70.83% (70% for BS category, 50% for BDP category, and 100% for BL category).
Meanwhile, prediction model with original sample had predicting accuracy of 89.36%
(97.14% for BS category, 62.50% for BDP category, and 75% for BL category). The fact that
predicting accuracy with holdout sample was lower than that with original sample was
probably due to contribution of economic-macro condition which was relatively not stable in
the year of 2008. Many banks under category of BS actually belonged to category of either
BDP or BL, and those classified into category of BL actually performed even worse based on
financial ratios analysis.
Prediction Correct
survival 0 (BS) 1 (BDP) 2 (BL) tota l
BS (=0) 34 1 0 35
97.14 2.86 0.00 100.00
BDP (=1) 2 5 1 8
25.00 62.50 12.50 100.00
BL (=2) 0 1 3 4
0.00 25.00 75.00 100.00
tota l 36 7 4 47
76.60 14.89 8.51 100.00
overa l l percentage 89.36
Prediction Correct
survival 0 (BS) 1 (BDP) 2 (BL) tota l
BS (=0) 14 3 3 20
70.00 15.00 15.00 100.00
BDP (=1) 0 1 1 2
25.00 50.00 50.00 100.00
BL (=2) 0 0 2 2
0.00 0.00 100.00 100.00
tota l 14 4 6 24
58.33 16.67 25.00 100.00
overa l l percentage 70.83
source: data processed
Original Sampel
Holdout Sample
predicted
predicted

16
Analysis of Prediction model of Potential Bank Bankruptcy
In order to create a firm pillar for Indonesia banking system, Indonesia government
established API in January 2004. It has done numerous preventive actions to save Indonesian
banking business. One of these actions was merger and acquisition of banks. It was found that
there were go-public banks under Bank Indonesia’s (BI) special surveillance because of
credits which did not run smoothly; liquidated (acquired) banks; and merged banks to save
them from bankruptcy and enable them to perform better. This research attempted to analyze
whether or not financial ratios were capable of predicting bank survival and classifying banks
in Indonesia into three categories: BS, BDP and BL.
It was found that according to data analysis using STATA 11, financial ratios which had
capability of predicting bank survival were capital adequacy ratio (C1, C2), assets quality
ratio (A1), earnings (E2), liquidity (L2), and cash flow from operations (OCF1). Significant
value was obtained for functions of logit 1 (BDP) and logit 2 (BL) toward variable C1 (capital
adequacy ratio). On the other hand, toward variables C2, E2, L2, and OCF1, the value was
obtained for function of logit 1 (BDP), meaning that p-value was lower than alpha 0.05, while
the value of variable A1 was statistically significant for function of logit 1, with alpha 0.10.
Capital is an important factor for the establishment of sustainability of banking
business. Once one particular bank has settled its capital, it would try to expand its business
operations, anticipate coming risks, develop its technological system, and improve its capacity
of distributing loan (credit). These all actions are initiated to strengthen its capacity of
generating profits. At the end, it would achieve its ultimate sustainability. Ratios of assets
quality, earnings, liquidity, and cash flow from operations have significantly contributed to
the establishment of prediction model of potential bank bankruptcy. Strong capital, increased
profits, high liquidity, and cash flow from operations are capable of maintaining sustainability
of bank business operations, as well as there is no poor corporate governance prone to moral
hazard. As a consequence, this condition leads to sustainability of banking business
operations.
CONCLUSION AND SUGGESTIONS
Conclusion
It was evident that financial ratios on the basis of multinomial logistic regression model
might significantly be a detecting device of early potential bank bankruptcy. These ratios
included C1: capital adequacy ratio, C2: risk assets ratio, A1: return on risk assets, E2:
return on equity capital, L2: quick ratio, and OCF1: cash flow from operations/current

17
liabilities. These six ratios eventually formulated five statistical formulas, expected to
contribute to the early anticipation and prevention of bank failure. Predicting accuracy of this
model was 89.36% for original sample, and 70.83% for holdout sample used for model
validation.
C1 ratio was proved effectively contributing to the classification of banks into BDP
category and BL category, shown by a significant value of 2 logit functions. High capital
could improve bank business operations, with condition that there should be well-maintained
risk management system to avoid credits which didn’t run well. Meanwhile, earnings and
liquidity ratios had negative influence on function of logit 1, and were not significantly
correlated with function of logit 2. This means that the higher the earnings (E2) and liquidity
(L2) ratios were, the lower risk it was that the bank belonged to BDP category.
Suggestions
This prediction model had Pseudo R2 57.42%, indicating that there was other
information which probably influences the prediction of potential bank bankruptcy. Banking
system might also be influenced by political situation of a country (Indonesia), economic
macro condition, BI (Bank Indonesia) policies, and corporate governance of a particular bank
itself. These elements must be the main focus in next studies in an attempt to obtain a more
comprehensive prediction model of bank bankruptcy for the sake of the achievement of good
economic welfare of a nation through strong banking system. It is evident that poor
management causes moral hazard which may ruin a bank.
Computerized world which develops very rapidly bears a variety of statistical methods
allowing researchers to establish prediction models of potential bank bankruptcy. Next studies
need to compare statistical methods in order to obtain prediction model which is close to the
real condition. These statistical methods include neural network, trait recognition, data
envelopment analysis (DEA) though they are hardly easy to interpret and their mathematical
language seems hard.
REFERENCES
Andersen, Henrik. (2008). Failure prediction of Norwegian banks: A logit approach.
Working Paper. Financial Markets Department, Norges Bank.
Aryati, Titik, & Hekinus Manao. (2000). Rasio Keuangan sebagai Prediktor Bank
Bermasalah di Indonesia. Simposium Nasional Akuntansi III, Depok.
Bauman, Mark P. (2003). The Impact and Valuation of Off-Balance-Sheet Activities
Concealed by Equity Method Accounting. Accounting Horizons, Vol. 17(4): 303-314.
Beaver, William H. (1966). Financial Ratios As Predictors of Failure. Journal of Accounting
Research, Vol. 4: 71-111.

18
Bernstein, Leopold A. (1989). Financial Statement Analysis: Theory, Application, and
Interpretation. Richard D. Irwin, Inc., Illinois.
Bodie, Kane, & Marcus. (2011). Investments and Portfolio Management, 9th
Edition, Irwin
McGraw Hill, Singapore.
Cheng, Chi-Bin, Ching-Lung Chen, & Chung-Jen Fu. (2006). Financial Distress Prediction
by a Radial Basis Function Network with Logit Analysis Learning. Computers and
Mathematics with Applications, 51: 579-588.
Choudhry, Moorad. (2007). Bank Asset and Liability Management: Strategy, Trading,
Analysis. John Wiley & Sons (Asia) Pte. Ltd., Singapore.
Eisenbeis, Robert A. (1977). Pitfalls in the Application of Discriminant Analysis in Business,
Finance, and Economics. The Journal of Finance, Vol. 32(3): 875-900.
Espahbodi, Pouran. (1991). Identification of problem binary choice models. Journal of
Banking and Finance, Vol. 15: 53-71.
FASB. (1978). Statement of Financial Accounting Concept No. 1: Objectives of Financial
Reporting by Business Enterprises.
Fraser, Donald R., & Lyn M. Fraser. (1990). Evaluating Commercial Bank Performance: A
Guide to Financial Analysis. Bankers Publishing Company, Illinois.
Ghosh, Amalendu. (2012). Managing Risks in Commercial and Retail Banking. John Wiley
& Sons (Asia) Pte. Ltd., Singapore.
Grice, John Stephen, & Robert W. Ingram. (2001). Tests of the generalizability of Altman’s
bankruptcy prediction model. Journal of Business Research, 54: 53-61.
Hair, Joseph F., William C. Black, Barry J. Babin, & Rolph E. Anderson. (2010).
Multivariate Data Analysis: A Global Perspective. Pearson Prentice Hall, New Jersey.
Hosmer, David W., & Stanley Lemeshow. (2000). Applied Logistic Regression, 2nd
Edition.
John Wiley & Sons, Inc.
Kasmir. (2000). Manajemen Perbankan. PT RajaGrafindo Persada, Jakarta.
Koetter, M., J.W.B. Bos, F. Heid, J.W. Kolari, C.J.M. Kool, D. Porath. (2007). Accounting
for distress in bank mergers. Journal of Banking & Finance, 31: 3200-3217.
Kolari, James, Dennis Glennon, Hwan Shin, & Michele Caputo. (2002). Predicting large US
commercial bank failures. Journal of Economics and Business, 54: 361-387.
Kumar, P. Ravi, & V. Ravi. (2007). Bankruptcy prediction in banks and firms via statistical
and intelligent techniques – A review. European Journal of Operational Research, 180:
1-28.
Lee, Kang-In, & John J. Koval. (1997). Determination of the Best Significance Level in
Forward Stepwise Logistic Regression. Communication in Statistics–Simulation and
Computation, 26(2): 559-575.
Lembaga Penjamin Simpanan (LPS). (2010 & 2011). Laporan Tahunan.
Martin, Daniel. (1977). Early Warning of Bank Failure: A logit regression approach. Journal
of Banking and Finance, 1: 249-276.
Mintorahardjo, Sukowaluyo. (2001). BLBI Simalakama. Riset Ekonomi Sosial Indonesia,
Jakarta.

19
Öğüt, Hulisi, M. Mete Doğanay, Nildağ Başak Ceylan, & Ramazan Aktaş. (2012). Prediction
of bank financial strength ratings: The case of Turkey. Economic Modelling, 29: 632-
640.
Payamta. (2008). Model Deteksi Dini Kesehatan Bank Umum di Indonesia. Jurnal Bisnis &
Manajemen, Vol. 8(2): 163-178.
Premachandra, I.M., Gurmeet Singh Bhabra, Toshiyuki Sueyoshi. (2009). DEA as a tool for
predicting corporate failure and success: A case of bankruptcy assessment. European
Journal of Operational Research, 193: 412-424.
Premachandra, I.M., Yao Chen, & John Watson. (2011). DEA as a tool for predicting
corporate failure and success: A case of bankruptcy assessment. Omega, 39: 620-626.
Qurriyani, Tengku Nuzulul. (2000). Indikasi Potensial menuju Bank Survival melalui Analisis
Rasio Keuangan: Model Regresi Logistik Trikotomi. Karya Akhir. Program Magister
Akuntansi, Fakultas Ekonomi Universitas Indonesia, Jakarta.
Ritter, Lawrence S., William L. Silber, & Gregory F. Udell. (2009). Principles of Money,
Banking & Financial Markets.Pearson Education, Inc., Boston.
Rujoub, Mohamed A., Doris M. Cook, & Leon E. Hay. (1995). Using Cash Flow Ratios To
Predict Business Failures. Journal of Managerial Issues, Vol. 7(1): 75-90.
Schilit, Howard M., & Jeremy Perler. (2010). Financial Shenanigans. McGraw-Hill.
Smith, C. W. Jr., & Ross L. Watts. (1992). The investment opportunity set and corporate
financing, dividend and compensation policies. Journal of Financial Economics, 32:
263-292.
Stickney, Clyde P., & Paul R. Brown. (1999). Financial Reporting and Statement Analysis: A
Strategic Perspective, 4th
Edition. Harcourt Brace & Company, Orlando.
Stiglitz, Joseph E. (2012). Kegagalan Globalisasi dan Lembaga-Lembaga Keuangan
Internasional. PT Ina Publikatama, Jakarta.
Surifah. (2002). Kinerja Keuangan Perbankan Swasta Nasional Indonesia sebelum dan
setelah Krisis Ekonomi. Jurnal Auditing dan Akuntansi Indonesia, Vol. 6(2): 23-50.
Watts, Ross L., & Jerold L. Zimmerman. (1986). Positive Accounting Theory. Prentice-Hall
Inc.
White, Gerald I., Ashwinpaul C. Sondhi, & Dov Fried. (2003). The Analysis and Use of
Financial Statements, 3rd
Edition. John Wiley & Sons, Inc., USA.

20
Appendix 1. Description of Independent Variable Data
2006
no bank go public C1 C2 A1 E2 L2 OCF1
bank likuidasi (bl) (Y=2)
1 Bank Century Tbk. 0.103 0.087 0.008 0.046 0.149 -0.014
2 Bank Eksekutif International Tbk. 0.014 0.097 -0.022 -0.118 0.105 0.016
bank dalam penyelamatan (bdp) (Y=1)
3 Bank Arta Niaga Kencana Tbk. 0.090 0.153 0.016 0.088 0.090 0.036
4 Bank Swadesi Tbk. 0.220 0.208 0.026 0.071 0.486 0.071
5 Bank UOB Buana Tbk. 0.213 0.268 0.043 0.125 0.091 0.058
6 Bank Lippo Tbk. 0.202 0.148 0.045 0.151 0.350 0.146
7 Bank Bumiputera Indonesia Tbk. 0.111 0.115 0.003 0.015 0.109 0.036
bank sehat (bs) (Y=0)
8 Bank Artha Graha International Tbk. 0.050 0.065 0.005 0.056 0.122 0.012
9 Bank Central Asia Tbk. 0.139 0.242 0.053 0.235 0.310 0.046
10 Bank Danamon Indonesia Tbk. 0.122 0.191 0.032 0.140 0.126 0.027
11 Bank International Indonesia Tbk. 0.119 0.160 0.020 0.121 0.102 -0.001
12 Bank Kesawan Tbk. 0.055 0.080 0.004 0.032 0.097 -0.143
13 Bank Mandiri (Persero) Tbk. 0.109 0.199 0.014 0.092 0.185 0.056
14 Bank Mayapada Tbk. 0.055 0.105 0.021 0.107 0.077 0.018
15 Bank Mega Tbk. 0.049 0.145 0.009 0.078 0.111 0.216
16 Bank Negara Indonesia (Persero) Tbk. 0.098 0.140 0.026 0.130 0.129 0.062
17 Bank Niaga Tbk. 0.112 0.130 0.024 0.135 0.091 0.037
18 Bank NISP Tbk. 0.092 0.139 0.017 0.097 0.089 0.008
19 Bank Nusantara Parahyangan Tbk. 0.098 0.137 0.017 0.109 0.105 0.100
20 Bank Pan Indonesia Tbk. 0.249 0.235 0.049 0.110 0.365 -0.093
21 Bank Permata 0.082 0.137 0.016 0.085 0.143 0.048
22 Bank Rakyat Indonesia (Persero) Tbk. 0.143 0.181 0.056 0.252 0.314 0.109
23 Bank Victoria International Tbk. 0.109 0.224 0.016 0.095 0.072 -0.027
2007
no bank go public C1 C2 A1 E2 L2 OCF1
bank likuidasi (bl) (Y=2)
24 Bank Century Tbk. 0.144 0.114 0.007 0.049 0.108 -0.030
25 Bank Eksekutif International Tbk. 0.006 0.097 0.002 0.006 0.090 -0.014
bank dalam penyelamatan (bdp) (Y=1)
26 Bank UOB Buana Tbk. 0.207 0.253 0.039 0.118 0.084 -0.084
27 Bank Lippo Tbk. 0.154 0.142 0.053 0.190 0.308 0.027
28 Bank Bumiputera Indonesia Tbk. 0.107 0.099 0.007 0.038 0.114 -0.016
bank sehat (bs) (Y=0)
29 Bank Artha Graha International Tbk. 0.064 0.072 0.004 0.024 0.239 -0.010
30 Bank Bukopin Tbk. 0.064 0.083 0.021 0.191 0.140 -0.074
31 Bank Bumi Arta Tbk. 0.332 0.391 0.038 0.056 0.653 0.022
32 Bank Central Asia Tbk. 0.132 0.214 0.046 0.220 0.342 0.046
33 Bank Danamon Indonesia Tbk. 0.137 0.171 0.048 0.195 0.126 -0.081
34 Bank Saudara Tbk 0.135 0.133 0.040 0.176 0.082 -0.003
35 Bank International Indonesia Tbk. 0.110 0.144 0.009 0.076 0.110 -0.107
36 Bank Kesawan Tbk. 0.051 0.090 0.004 0.047 0.100 -0.023
37 Bank Mandiri (Persero) Tbk. 0.113 0.174 0.029 0.149 0.225 0.022
38 Bank Mayapada Tbk. 0.206 0.250 0.017 0.043 0.082 -0.282
39 Bank Mega Tbk. 0.077 0.174 0.026 0.177 0.116 -0.009
40 Bank Negara Indonesia (Persero) Tbk. 0.099 0.158 0.011 0.052 0.139 0.067
41 Bank Niaga Tbk. 0.105 0.112 0.023 0.148 0.082 -0.024
42 Bank NISP Tbk. 0.116 0.147 0.015 0.074 0.101 -0.046
43 Bank Nusantara Parahyangan Tbk. 0.093 0.162 0.015 0.102 0.120 0.125
44 Bank Pan Indonesia Tbk. 0.153 0.196 0.038 0.127 0.168 -0.055
45 Bank Permata 0.093 0.133 0.026 0.130 0.234 -0.001
46 Bank Rakyat Indonesia (Persero) Tbk. 0.132 0.159 0.058 0.249 0.323 0.140
47 Bank Victoria International Tbk. 0.063 0.166 0.013 0.123 0.078 -0.024