Embed Size (px)
Citation preview

Early detection of the advanced persistent threat
attack using performance analysis of deep learning
Javad Hassannataj Joloudari1,2, Mojtaba Haderbadi1, Amir Mashmool1,
Mohammad GhasemiGol1, Shahab S.3,4, Amir Mosavi5,6,7,8
1 Computer Engineering Department, Faculty of Engineering, University of Birjand, Birjand, Iran 2 Department of Information Technology, Mazandaran University of Science and Technology, Babol, Iran
3 Institute of Research and Development, Duy Tan University, Da Nang 550000, Vietnam 4 Future Technology Research Center, College of Future, National Yunlin University of Science
and Technology 123, University Ro ad, Section 3, Douliou, Yunlin 64002, Taiwan 5 Institute of Automation, Obuda University, 1034 Budapest, Hungary
6 School of Economics and Business, Norwegian University of Life Sciences, 1430 Ås, Norway 7 Faculty of Civil Engineering, Technische Universität Dresden, 01069 Dresden, Germany
8 Department of Informatics, J. Selye University, 94501 Komarno, Slovakia
Abstract
One of the most common and important destructive attacks on the victim system is
Advanced Persistent Threat (APT)-attack. The APT attacker can achieve his hostile
goals by obtaining information and gaining financial benefits regarding the
infrastructure of a network. One of the solutions to detect a secret APT attack is using
network traffic. Due to the nature of the APT attack in terms of being on the network
for a long time and the fact that the network may crash because of high traffic, it is
difficult to detect this type of attack. Hence, in this study, machine learning methods
such as C5.0 decision tree, Bayesian network and deep neural network are used for
timely detection and classification of APT-attacks on the NSL-KDD dataset. Moreover,
10-fold cross validation method is used to experiment these models. As a result, the
accuracy (ACC) of the C5.0 decision tree, Bayesian network and 6-layer deep learning
models is obtained as 95.64%, 88.37% and 98.85%, respectively, and also, in terms of
the important criterion of the false positive rate (FPR), the FPR value for the C5.0
decision tree, Bayesian network and 6-layer deep learning models is obtained as 2.56,
10.47 and 1.13, respectively. Other criterions such as sensitivity, specificity, accuracy,
false negative rate and F-measure are also investigated for the models, and the
experimental results show that the deep learning model with automatic multi-layered
extraction of features has the best performance for timely detection of an APT-attack
comparing to other classification models.
Keywords: APT-attack, detection and classification, feature extraction,
machine learning, C5.0 decision tree, Bayesian network, deep learning
1. Introduction
Providing information security is one of the main problems of the companies and
organizations, and they constantly try to ensure that their data and information are not
compromised due to the accidents and attacks [1]. The attacks and activities of the
attackers have become more complicated and targeted owing to the progress and
growth of the cyberspace.
The Authors' Email: [email protected] (Javad Hassannataj Joloudari), [email protected] (Mojtaba Haderbadi), [email protected] (Amir Mashmool), [email protected] (Shahab S.), [email protected] (Amir Mosavi)

2
According to Gartner, budgets have risen from $114 billion in 2018 to more than $124
billion in 2019. Information technology security leaders in companies agree to a 72%
budget increase in 2020 to take steps such as continuous staff training, awareness and
skill enhancement and reduce the damage caused by intrusion into their systems. Today,
most of the attacks that threaten companies are targeted and long time, some of which are
known as Advanced Persistent Threats (APT) [2]. The term APT was first introduced in
2006 by US Army Air Force specialists regarding unknown intrusion activities [3]. APT
attacks are carried out by a group of well-funded attackers with a pre-determined plan to
gain access to the confidential information or data of the companies. This attack is a multi-
step and persistent attack through which the attacker can remain in the victim system for
several months with full awareness [4]-[7].
An APT attack has three characteristics [3], [4], which include 1) threats; the ability of
the attacker to access confidential information, 2) advanced; using advanced techniques
to complete the attack cycle by the attacker, and 3) persistent; the slow process of the
attacker to reach the defined goal. Consequently, an APT attack can be favorable for the
attacker from three points of view. The first is that the attacker has unlimited time to
attack. Second, the attacker can seize unlimited resources, and third, the organizations
need to focus on their business strategies rather than spending all of their resources on
defensive strategies [5].
Examples of APT attacks that have occurred in recent years are listed below.
EPIC TURLA, which was identified by Kaspersky, aimed to infect the systems of
government agencies, state departments, military agencies and embassies in more than 40
countries worldwide [6].
Deep panda was an attack carried out to obtain the information of the staff of the US
Intelligence Service, and was probably of Chinese origin. The attackers used the Deep
panda code to endanger the information of more than 4 million employees [7].
In addition, a group from Russia known as Fancy Bear, Pawn Storm and Sednit was
identified by Trend Micro in 2014 that launched attacks on military and government
targets in Ukraine, Georgia, NATO and US defense allies [5].
In an APT attack, attackers use various methods to intrude, two of which are mentioned
as follows: I) Zero Day; Attackers identify the weaknesses of a company or an
organization and use them to damage the systems [4], II) Targeted phishing; In this
method, attackers use infected emails that contain malware to intrude) the systems [4]. In
APT attack, attackers try to find the codes of the target systems and programs at the
beginning of the task to intrude the systems. As attacks become more complicated,
traditional security systems such as firewalls, web and email protectors and scanners are
no longer suitable for defending and preventing damages. One of the serious issues and
challenges associated with APT attack is lack of a high-precision and real-time detection
system. The other challenges are that the attacker is able to invisibly analyze the victim
system using structured models and can be placed in the target system for a long time [2],
[8].
Therefore, the methods used by researchers to detect APT attacks are as follows.
Detection models based on machine learning algorithms, including linear support
vector machine, Quadratic SVM, Cubic SVM, Fine Gaussian SVM, Medium Gaussian
SVM, Coarse Gaussian SVM [8] as a subset of SVM methods as well as Complex tree,
Medium tree and Simple tree for decision tree [9].
Detection models based on mathematical models, such as hidden Markov model [10].
Methods and approaches for automatic extraction of features using attack graph [11].
Techniques to reduce false detection, such as Duqu tool [12].
Detection of all attack steps using tools, such as SpuNge [13].

3
Although aforementioned schemes can be relatively appropriate detection methods for
dealing with APT attacks, they cannot perform timely detection when attacks occur in
real-time. In addition, these methods have high false negative and positive rates, which
are important criteria that can indicate the effectiveness of a method in correct detection
of the attack. None of these methods provide a system model capable of detecting a new
attack pattern, high generalizability and high flexibility. Finally, lack of proper process
on the dataset of the attacks in these methods is quite obvious. Consequently, we decided
to examine and investigate machine learning methods such as C5.0 decision tree,
Bayesian network and deep neural network on the NSL-KDD dataset. As a result, it can
be stated that deep neural network method greatly reduces the weaknesses of the
mentioned methods and can be a powerful approach to detect an APT attack on the
considered dataset, since deep learning model provides high detection accuracy (ACC)
as well as automatic extraction of the main features of the attack. In other words,
according to our latest and greatest knowledge about APT attack detection, we can
reasonably argue that among the available methods, deep learning method [14] as an
intelligent method that is used today for large data sets in different organizations, provides
the best performance.
It is noteworthy that it is the first time that C5.0 decision tree, Bayesian Network and
deep learning models are utilized to detect APT attack on the NSL-KDD dataset. In this
paper, deep learning model as a proposed model along with Bayesian Network and C5.0
decision tree models is implemented on the relatively large NSL-KDD dataset. In brief,
the contributes of the article are as follows:
Improving the detection accuracy by analyzing the data through deep learning model
in comparison with C5.0 decision tree and Bayesian classification models.
Improving deep neural network training by testing the existing data through Maxout
method and cross-validation in order to avoid over-fitting and increase generalizability.
Proposing a 6-layer deep learning model by automatic extracting and selecting the
features in the hidden layers of the neural network.
The remaining sections of this paper are organized as follows. We explain related work
in Section 2. Section 3 describes our proposed methodology regarding APT attack
detection using classification models. The evaluation of the models' performance is
accomplished and analyzed in section 4. Section 5 presents the experimental results.
Section 6 represents “Results and Discussions”. Finally, we conclude our paper with
some suggestion for future research works in Section 7.
2. Literature Review
The detection methods of APT attacks that have been introduced up to now, have
disadvantages, such as high rate of false detection of the attacks and lack of real-time
detection. Due to the fact that APT attack uses secret and intelligent techniques, and
can stay in the system for months, therefore, traditional intrusion detection systems
cannot detect these attacks, because they are usually based on pattern or signature and
use applications to detect APT [15]-[17].
The APT attack detection methods with different criteria that have been studied by
researchers so far have been investigated in the following. Among these methods that
have led to better detection of the attacks are machine learning-based methods.
Salama et al. have used Deep Belief Network (DBN) method combined with Support
Vector Machine (SVM) to detect intrusion into the NSL-KDD dataset [18]. The
combined DBN-SVM method through 40% of the training dataset with 92.84%
detection accuracy provides better performance in comparison to the SVM and DBN
methods.

4
Despite the growth and spread of APT attacks, no specific research and study has
been conducted about this attack, and most of the investigations about APT consist the
attack patterns and its general information, and automatic detection methods have not
been taken into consideration [19]-[22]. One of the most vulnerable platforms is mobile
phones, which are very popular for attackers [23].
Aziz et al. have used classification algorithms including Naive Bayes (NB),
Multilayer Perceptron Neural Network and Decision trees in order to detect Denial-of-
Service (DoS), User to Root (U2R), Remote to local (R2L) and Probe attacks on the
NSL-KDD dataset [24]. Their results show that the Naive Bayes classification method
has better detection accuracy for R2Land U2R attacks, so that for R2L attack, 32.90%
and 21.07% accuracies were obtained using all the training data and 20% of the training
data, respectively, and also, for U2R attack, 20.35% and 16.28% accuracies were
obtained using all the training data and 20% of the training data, respectively. Then,
they achieved high accuracy of up to 82% for DoS attack and 65.4% accuracy for Probe
attack using J48 decision tree.
In some cases, the introduced methods and tools are not complete, meaning that they
may only be able to detect the vulnerability of the environment or network and not be
able to detect the attack in the environment, as in [25] that Johnson and Hogan have
proposed a method to investigate whether the network environment is vulnerable to an
APT attack or not. This tool allows the network security administrators to check the
vulnerability of the network environment after initial configuration and then make
changes if necessary.
Ingre and Yadav have utilized Artificial Neural Network (ANN) method to detect
intrusion into the NSL-KDD dataset [26]. Their results indicate that the ANN method
reaching 81.2% and 79.9% detection accuracies for binary class (i.e. normal and attack
statuses) and 5 classes (i.e. DoS, Probe, R2L, U2R attacks and normal status),
respectively, provides better performance comparing to Self-Organization Map (SOM)
method with a detection accuracy of 75.49%.
Friedberg et al. state that in order to detect an APT attack, the attack detection system
requires a large amount of information and input data [27]. In addition, at the end of
the detection process, what the detection system presents as a result is highly complex,
and it is very difficult for security analysts to understand it.
Guo et al. have proposed a two-layer combined approach to detect intrusion into the
KDD-99 dataset and the Kyoto University Benchmark Dataset (KUBD) [28], which
consists of two anomaly detection components and one misuse detection component.
In the first step, an Anomaly Detection method Based on the change of the Cluster
Centres (ADBCC) has been used to construct the first component of the anomaly
detection, where the cluster centres are obtained using the K-means algorithm. In the
second step, by applying the K-nearest neighbor (k-NN) algorithm, two different
detection components, including anomaly detection and misuse detection have been
constructed. In fact, the anomaly detection component created in the first step
participates in the construction of the two detection components in the second step.
Their results in terms of the detection accuracy indicate that the proposed combined
approach with 93.29% accuracy has better performance comparing to ADBCC method
with 92.71% accuracy for both normal and attack classes on the KDD-99 dataset.
Furthermore, the proposed combined approach with 95.76% accuracy performed better
than the ADBCC method with 92.85% accuracy on the KUBD dataset.
Mazraeh et al. have used machine learning algorithms such as SVM, Naive Bayes
and J48 decision tree as well as classification to detect intrusion into the KDD-99
dataset [29]. The feature selection method they employed was Information Gain. Their
5
experiments show that the J48 decision tree method in combination with the AdaBoost
method has the highest accuracy of 97% compared to other methods.
Bhatt et al. have proposed a method to predict and detect APT attacks [30]. Due to
the fact that this attack is dynamic and can be developed in several directions in parallel,
a combination of attack and defense patterns have been used in this model. To
implement the procedure, Apache Hadoop has been performed with a logical layer that
includes Information Gathering, Weaponization, Delivery, Exploitation, Installation,
Command and Control (C2) and Actions steps, and is capable of predicting and
detecting APT attacks. Each of these steps is necessary to pursue the goals.
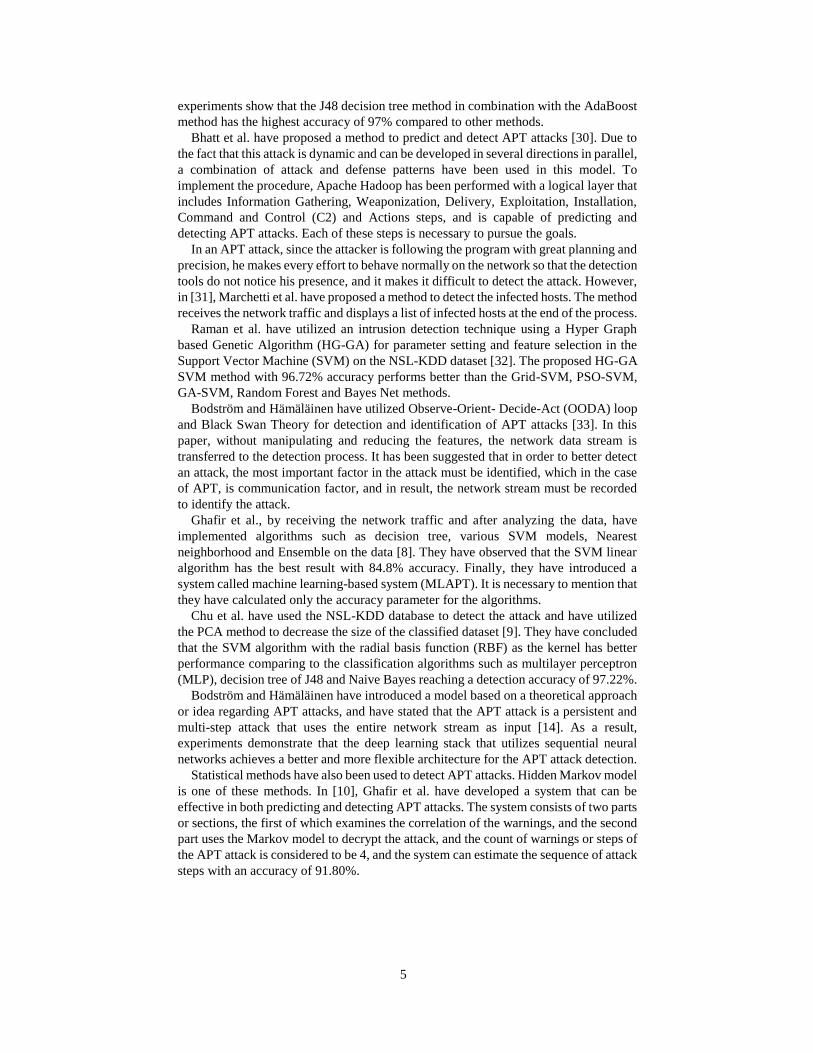
In an APT attack, since the attacker is following the program with great planning and
precision, he makes every effort to behave normally on the network so that the detection
tools do not notice his presence, and it makes it difficult to detect the attack. However,
in [31], Marchetti et al. have proposed a method to detect the infected hosts. The method
receives the network traffic and displays a list of infected hosts at the end of the process. Raman et al. have utilized an intrusion detection technique using a Hyper Graph
based Genetic Algorithm (HG-GA) for parameter setting and feature selection in the
Support Vector Machine (SVM) on the NSL-KDD dataset [32]. The proposed HG-GA
SVM method with 96.72% accuracy performs better than the Grid-SVM, PSO-SVM,
GA-SVM, Random Forest and Bayes Net methods.
Bodström and Hämäläinen have utilized Observe-Orient- Decide-Act (OODA) loop
and Black Swan Theory for detection and identification of APT attacks [33]. In this
paper, without manipulating and reducing the features, the network data stream is
transferred to the detection process. It has been suggested that in order to better detect
an attack, the most important factor in the attack must be identified, which in the case
of APT, is communication factor, and in result, the network stream must be recorded
to identify the attack.
Ghafir et al., by receiving the network traffic and after analyzing the data, have
implemented algorithms such as decision tree, various SVM models, Nearest
neighborhood and Ensemble on the data [8]. They have observed that the SVM linear
algorithm has the best result with 84.8% accuracy. Finally, they have introduced a
system called machine learning-based system (MLAPT). It is necessary to mention that
they have calculated only the accuracy parameter for the algorithms.
Chu et al. have used the NSL-KDD database to detect the attack and have utilized
the PCA method to decrease the size of the classified dataset [9]. They have concluded
that the SVM algorithm with the radial basis function (RBF) as the kernel has better
performance comparing to the classification algorithms such as multilayer perceptron
(MLP), decision tree of J48 and Naive Bayes reaching a detection accuracy of 97.22%.
Bodström and Hämäläinen have introduced a model based on a theoretical approach
or idea regarding APT attacks, and have stated that the APT attack is a persistent and
multi-step attack that uses the entire network stream as input [14]. As a result,
experiments demonstrate that the deep learning stack that utilizes sequential neural
networks achieves a better and more flexible architecture for the APT attack detection.
Statistical methods have also been used to detect APT attacks. Hidden Markov model
is one of these methods. In [10], Ghafir et al. have developed a system that can be
effective in both predicting and detecting APT attacks. The system consists of two parts
or sections, the first of which examines the correlation of the warnings, and the second
part uses the Markov model to decrypt the attack, and the count of warnings or steps of
the APT attack is considered to be 4, and the system can estimate the sequence of attack
steps with an accuracy of 91.80%.

6
3. Methodology
In this study, we have used RapidMiner1 simulator for the APT attack detection and
classification process. The methodological process is illustrated in Figure 1.
According to Figure 1, the proposed methodology includes 7 modules, each of which
will be described in detail in the following. In this study, the modules include data
collection from an external source, pre-processing, segmentation, classifiers, model
evaluation criteria, selection of the best model and extraction of the features.
3.1. Used Dataset
We used the NSL-KDD dataset [9], [34], to detect APT attacks. This dataset includes
148517 data samples and includes 125973 training dataset and 22544 test dataset.
The values distribution of the NSL-KDD dataset for all the attack classes is presented
in Table 1.
Table 1. Values Distribution of the NSL-KDD dataset for all the
attack classes.
According to Table 1, the NSL-KDD dataset includes 41 features. In addition, a
description of the NSL-KDD dataset with corresponding features is given in Table 2.
1https://docs.rapidminer.com/latest/studio/operators/modeling/predictive/neural_nets/deep_learning.html
Training dataset Testing dataset
Class values Class Values
Normal 67343 Normal 9711
DoS 45927 DoS 7458
R2L 995 R2L 2754
U2R 52 U2R 200
Probe 11656 Probe 2421
Sum 125973 Sum 22544

7
Dataset Contents: 148517 numbers
Two Classes: Normal and Anomaly
Type of dataset: Categorical, Numerical and Nominal
Module 1: Collection
Log File
APT NSL-KDD
Dataset
Dataset Cleaning
Feature engineering
Module 2: Preprocessing
Training
Testing
k-fold cross validation
Module 3: Partitioning
Module 6: Experimental Results
Normal
Anomaly
Module 7: Feature Extraction by Deep learning
Selecting significant features
Module 4: Classifiers Module 5: Evaluation method
Decision Tree of C5.0
Bayesian Network
Deep Learning
Accuracy, F1-score,
Precision, Sensitivity, FPR,
TPR, ROC-AUC score
Classification
using Bayesian Network Deep Learning Decision Tree
Figure 1. Proposed model.

8
Table 2. Features of the NSL-KDD dataset [34], [35].
3.2. Pre-processing
In this paper, machine learning and deep learning approaches are used. One of the
steps in these approaches is pre-processing of the data, which necessitates analyzing
the data. In the pre-processing module on the NSL-KDD dataset, the data needs to be
usable and performable for the classifiers in the next modules. Therefore, for this
module, we have investigated the missing data after extracting the samples using
RapidMiner software and we have found out that there is no missed and unvalued data.
Additionally, we have not used feature selection in this module, since feature
selection methods cannot have great effects on analyzing the NSL-KDD dataset here.
It should be noted that we will investigate and execute feature extraction as an important
module in the seventh module. However, feature engineering [36] is utilized in this
subsection, i.e. we first need to specify the features of the APT attack in the relevant
dataset in terms of their type. According to the features of the NSL-KDD dataset [35],
the data types are as categorical, numerical and nominal data.
In this study, 4 attack classes including DoS, R2L, U2R and Probe are grouped under
one class called anomaly as well as normal status as normal class. Finally, the dataset
used in this paper is changed into two classes of anomaly and normal.
No. Feature
Name
Data
Type
No. Feature Name
Data
Type
1
1
Duration Numerical 22 Is_guest_login Categorical
2 Protocol_type Nominal 23 Count Numerical
3 Service Nominal 24 Srv_count Numerical
4 Flag Nominal 25 Serror_rate Numerical
5 Src_bytes Numerical 26 Srv_serror_rate Numerical
6 Dst_bytes Numerical 27 Rerror_rate Numerical
7 Land Categorical 28 Srv_rerror_rate Numerical
8 Wrong_ fragment Numerical 29 Same_srv_rate Numerical
9 Urgent Numerical 30 Diff_srv_rate Numerical
10 Hot Numerical 31 Srv_diff_host_rate Numerical
11 Num_failed logins Numerical 32 Dst_host_count Numerical
12 Logged_in Categorical 33 Dst_host_srv_count Numerical
13 Num_compromised Numerical 34 Dst_host_same
_srv_rate
Numerical
14 Root_shell Categorical 35 Dst_host_diff_srv_rate Numerical
15 Su_attempt ed
Categorical 36 Dst_host_same_src_port_rate Numerical
16 Num_root Numerical 37 Dst_host_srv_
diff_host_rate
Numerical
17 Num_file_creations Numerical 38 Dst_host_serror_rate Numerical
18 Num_shells Numerical 39 Dst_host_srv_serror_rate Numerical
19 Num_access_files Numerical 40 Dst_host_rerror_rate Numerical
20 Num_outbo und_cmds Numerical 41 Dst_host_srv_rerror_rate Numerical
21 Is_hot_login Categorical

9
Furthermore, in order to complete the pre-processing of the data, we have aggregated
and integrated the training and testing data sets so that the count of normal and anomaly
samples is 77054 and 71463, respectively.
3.3. Partition of the NSL-KDD dataset
As mentioned in subsection 3.1., the NSL-KDD dataset used in this research includes
148517 samples, and as data segmentation, we consider 90% of them for training and
10% for testing. In addition, we have used 10-fold cross validation method, and for
examining the proposed models, 0.9 of the data is used for training and the remaining
0.1 of the data is used for testing for each fold. In section 5, giving the experiment
results, the data classification will be explained in more detail.
Note that in this study for the NSL-KDD dataset, the attack classes including DoS,
R2L, U2R and Probe are grouped under a class called anomaly and also normal status
as normal class.
3.4. Classification models
3.4.1. C5.0 Decision tree
In the process of improving decision tree models, C5.0 decision tree is the latest
generation of the decision tree models, including CHAID, ID3 and C4.5 [37], [38]. The
main task of the decision tree is to create rules that can help the security experts to
detect the type of the input data based on the constructed model. A decision tree model
consists of a number of nodes and branches so that the leaves (external nodes) represent
normal and anomalous classes or a set of answers, and in other nodes (internal nodes),
the decisions are made based on one or more features. A decision tree diagram with a
depth of 5 is shown in Figure 3.
Figure 3. C5.0 decision tree diagram on the NSL-KDD dataset.

10
An important preference of the C5.0 decision tree model for testing features is the
gain ratio. A higher gain ratio indicates a better model [37], [39]. The gain ratio is
calculated as below:
CKSplitInfoCKGainCKGainRatio ,,, (1)
According to Equation 1, CKSplitInfo , and CKGain , are calculated as follows:
CCCCInfoCKSplitInfo iEntropy ,...,, 1 (2)
),()(, CKInfoKInfoCKGain GainEntropy (3)
where K is the count of the features and Ci is the partition of the C derived by the
value of K.
Thus,are formulated as follows: ),( CKInfoGain and )(KInfoEntropy
i
CN
i
iEntropy PPKInfoi
2
1
log)(
(4)
)(),(1
iEntropy
CN
i
iGain KInfoPCKInfoi
(5)
According to Equations 4 and 5, P is calculated as follows:
SCSCSCP i,...,, 21 (6)
where S is the count of examples in set of S and P is the probability distribution of
partition (C1, C2, …, Ci).
3.4.2. Bayesian network model
Another classification model in data mining is Bayesian network classification
model. The philosophy of this model is based on a possible framework for solving
classification problems. According to Bayes' theorem, the classification of events is
formed based on the probability of occurring or not occurring an event so that the
probability of an event is calculated and classified [39]. In the Bayes' theorem, we have
the following probabilities:
BPDBPBDP , (7)
BPDPDBPBDP , (8)
In fact, the Bayesian Network model has a graphical scheme that represents
prediction variables and their eventual connections using a directed or non-circular
signal graph. The nodes are also a prediction variable in the graph [39], [40].

11
3.4.3. Deep learning model
The philosophy of deep learning is derived from the architecture of biological neural
networks in human brain under artificial neural networks, which is a branch of machine
learning and artificial intelligence. In nerve cells and neurons, information and data are
in the form of pulses or electrical signals that enter and leave the cell. In other words,
nerve cells decode through tagging and assigning features and items to different
categories and classes so that a series of changes and processing are performed on the
cell nucleus. These changes and processes are learned during human life, and the so-
called neural network structure is trained during human life. A similar process is seen
in deep learning [41]-[48]. In deep learning, we deal with multi-layered deep neural
networks, which introduce multi-layered learning of the features as the main
characteristic. These layers are called hidden layers in the neural network, and a
network is considered as a deep learning network, when it includes more than two
hidden layers. In general, this model has 3 types of layers:
Input layer: Receives input data related to features.
Hidden layer: Data patterns are extracted in this layer.
Output layer: Data processing results are related to this layer.
It is necessary to mention that the advantage of a deep neural network is having lots
of hidden layers, which makes it different from superficial artificial neural network that
has a single hidden layer. This means that deep neural network is able to do more
complex tasks. The structure of a deep network is such that the data is transferred from
one hidden layer to another so that simpler features are recombined and recomposed as
complex features.
For example, consider a two-layered neural network in which a three-dimensional
input can be connected to four other neurons of different weights in one layer. This
process is similar to feature extraction process, i.e. an input from a 3-dimensional space
is mapped to a new 4-dimensional space, which can be known as the feature space. In
other words, the inputs are transformed to a series of features that are good and useful
features. In machine learning, after the feature extraction process, we have algorithm
learning process, i.e. the features are used as inputs to a classification algorithm, which
learns to detect the class of the inputs. We had the same rules and principles for these
methods in Subsections 3.4.1 and 3.4.2.
In this two-layer neural network, there is a layer called the feature layer or hidden
layer, the outputs of which are the feature space and also the inputs to the last layer.
The last layer is called the classification layer, which specifies the class of the input
data related to the features. The two-layer neural network is shown in Figure 4 adopted
from [39], [42].
According to Figure 4, the output generation process is such that if we multiply each
of the input dimensions by a coefficient or so-called weight, and then pass sum of them
through a nonlinear function, a new output is generated.
This is similar to the process that we have in a nerve cell, meaning that the input
changes during the passage through the cell. These changes are weights, and the
nonlinear function results in new outputs. The set of inputs, weights and nonlinear
function are called a layer in artificial neural networks, and this layer must be well
trained. Neural network training means finding weights to transform inputs into
expected outputs. Therefore, it's the weights that are trained, and the nonlinear function
is usually added to increase the network capability.
As mentioned before, the deep learning model of a neural network includes more
than two middle or hidden layers.
For example, in Figure 5, a deep network with 3 hidden layers [49] using RapidMiner
tool is illustrated.

12
In a 3-layer network, low-level, middle-level and high-level or much more complex
features are extracted in the first, second and third layers, respectively. At the output of
this network, we have the classification of the input data that specifies the class type of
the data.
Figure 4. Multi-layered neural network.
Figure 5. Neural network with 3 hidden layers.
Hence, the goal of deep learning is to discover several levels of distributed
representations of the input data so that by creating features in the lower layers, it can
differentiate the factors of changes in the input data and then combine these
representations in the higher layers [50].

13
In addition, one of the noticeable advantages of a deep network is that deep learning
model performs very well on unstructured data and has a higher accuracy comparing to
machine learning models such as decision tree, Bayesian network, support vector
machine, etc., but in practice, requires a large amount of training data along with
appropriate hardware and software. Furthermore, one of the most important capabilities
of a deep learning network is the ability to extract features automatically. Deep neural
network also has a high generalizability, meaning that in addition to the data being
trained, if the network receives new data that is similar to the training data, it can detect
the data with high accuracy, which is called high generalization ability. In this paper, a
6-layer deep learning model with 4 hidden layers sized 50x50 in the 10 epoch range by
10-fold cross validation method is used.
Additionally, the nonlinear activation function used, which determines the activity
of neurons in the hidden layers of the network, is determined by Maxout [51]. The
Maxout function selects the maximum coordinates for the network input vector, and is
utilized in this research to avoid data over-fitting and improve network training. The
Sofmax function is also used to classify the
output layer. The deep learning model used in this paper is performed in RapidMiner
software. The proposed deep learning model is shown in Figure. 6.
Figure 6. Proposed deep learning model.
According to Figure 6, after entering the data into the deep network, the extraction
of features and classification of attacks is performed in combination and
simultaneously, and no other method is required to extract the features, because feature
extraction is performed automatically in deep network. Finally, the attack classification
is accomplished after applying the nonlinear function.
4. Method Evaluation
In this paper, the confusion matrix is used to evaluate the proposed models [37]-[39],
[52]. This matrix includes 4 elements, including True Positive (TP), False Positive (FP),
True Negative (TN) and False Negative (FN). The basic definitions of these 4 elements
are as follows.
TP: Represents that when an alert is generated, then an APT attack occurs.
FP: Represents that when an alert is generated, but an APT attack does not occur.
TN: Represents that when an alarm is not generated, then an APT attack does not
occur.
FN: Represents that when an alert is not generated, but an APT attack occurs.
The confusion matrix is shown in Table 3.

14
Table 3. Confusion matrix for detection of APT attack.
The predicted class The Actual class
Normal Anomaly
False Positive True Positive Positive
True Negative False Negative Negative
Consequently, according to the confusion matrix, we have used 7 criteria to evaluate
three models including Bayesian, C5.0 decision tree and deep learning. The criteria are
accuracy, F-measure or F1-score, precision or positive predictive value (PPV),
specificity (TNR), sensitivity or true positive rate (TPR), FPR and ROC-AUC score
[39].
These criteria are formulated based on the following equations:
FPTNTNTNR (9)
FNTPTPTPR
(10)
FNFPTNTPTNTPAccuracy (11)
FPTPTPprecision
(12)
FNTPTPrecall (13)
recallprecision
recallprecisionmeasureF
**2
(14)
Furthermore, FPR and FNR criteria show the type of false, and FPR is a more
important criterion than FNR in terms of false determination and effectiveness. These
criteria are formulated as follows:
TNRFPR 1 (15)
TPRFNR 1 (16)
These criteria are calculated through 10-fold cross validation method. The results of
the classification models will be analyzed in the next Section.
5. Experimental Results
The results of the Bayesian, C5.0 decision tree and deep learning classification
models are investigated and analyzed in this Section. Since the purpose of this article
is detection and classification of APT attacks on network, we have used the NSL-KDD
dataset to detect the APT attacks. In the detection process, after receiving the data and
pre-processing, we have used classification models such as Bayesian, C5.0 decision
tree and 6-layer deep learning. In addition, to evaluate the models in the output, criteria
such as accuracy, precision, false positive rate (FPR), false negative rate (FNR),
sensitivity, specificity and F-measure have been extracted as experiment results.
In this experiment, 10-fold cross validation method has been utilized to classify the
dataset so that in each fold, 0.9 of the data has been used for training and the remaining
0.1 of the data has been used to test the performance of the proposed models, and this
process has been repeated 10 times.

15
Moreover, in order to evaluate the generated models, control the training process,
prevent over-fit of the data and improve the generalization, we have considered 90% of
the training data, 80% of which is for training and 20% is for validation of the models
in 10 epochs. Figure 7 illustrates the training, testing and validation process of the
proposed models.
Figure 7. Training, testing and validation process of the proposed models.
The results based on the evaluation criteria are given in Table 4 for the Bayesian,
C5.0 decision tree and deep learning classification models.
According to Table 4, the accuracy of the Bayesian network, C5.0 decision tree and
deep neural network classification models is 88.37%, 95.64% and 98.85%,
respectively. Besides, for the important FPR criteria, the values 1.13, 2.56 and 10.47
are obtained for the deep neural network, C5.0 decision tree and Bayesian network,
respectively. Furthermore, for the rest of the evaluation criteria, the proposed deep
learning model has achieved the best results.
In addition to the above criteria, in terms of TPR, TNR, F-measure and FNR criteria,
the 6-layer deep learning model performs better than the C5.0 decision tree and
Bayesian network models.
Another important criterion used in this experiment is the AUC criterion, the
accuracy of the surface below the ROC diagram. The better AUC value indicates the
more accuracy of the model. The diagram of this criterion for the Bayesian network,
C5.0 decision tree and deep learning classification models are shown in Figures 8-10,
respectively.

16
Table 4. Results of the classification models (%).
Classification
models ACC TPR TNR PPV F-measure FPR FNR
Naïve Bayes 88.37 87.12 89.53 88.54 87.82 10.47 12.88
Decision Tree of C5.0
95.64 97.3 97.44 97.15 95.39 2.56 2.7
6-layer Deep
learning 98.85 98.89 98.87 98.72 95.84
1.13
1.11
Figure 8. ROC curve for the Bayesian model.
Figure 9. ROC curve for the C5.0 decision tree model.

30
Figure 10. ROC curve for the 6-layer deep learning model.
According to Figures 8-10, the AUC value for the Bayesian, C5.0 decision tree and
deep learning classification models are obtained as 96.1%, 99.60% and 99.90%,
respectively. Consequently, the proposed deep learning model is the best model in
terms of the AUC. As a result, by analyzing the classification models, it can be
concluded that the 6-layer deep learning model has the best performance regarding all
the criteria examined in the
output to detect APT attacks on the NSL-KDD dataset. Since the purpose of this
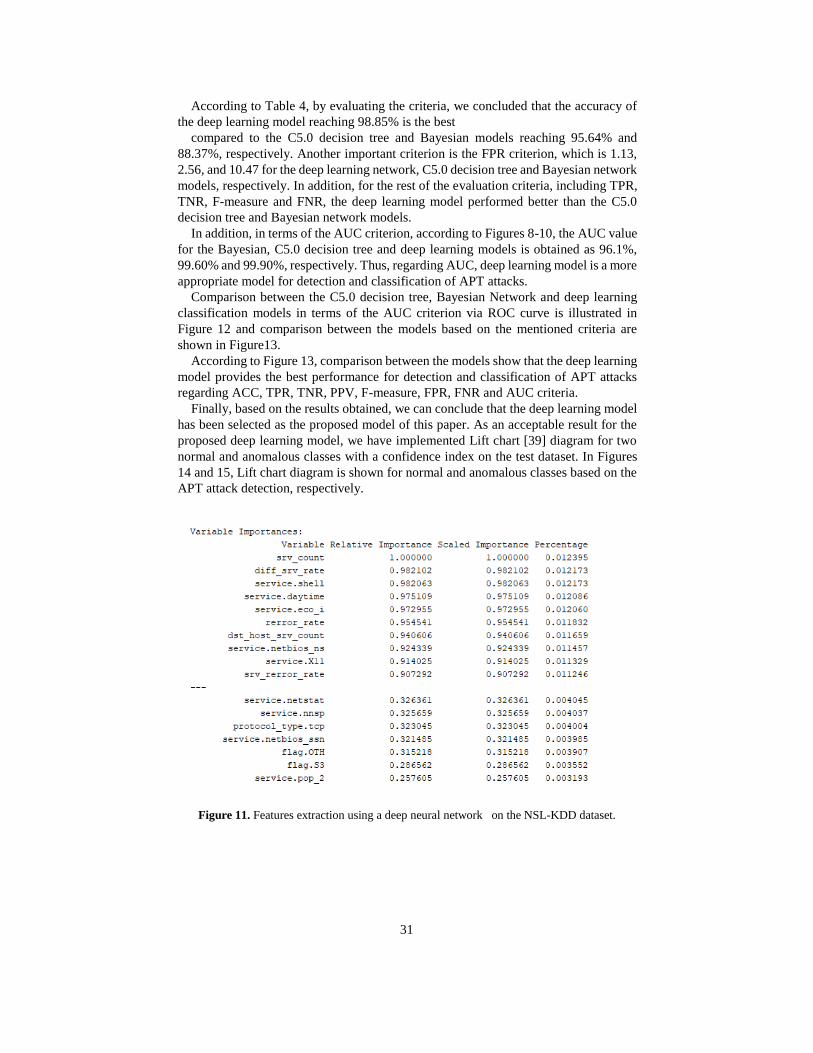
paper is to extract features automatically in the layers related to the features using a
deep neural network, the important features that are extracted using this method are
explained in Figure 11.
According to Figure 11, the most important features/variables of the APT attack
detection are arranged from the highest probability of occurrence to the lowest
probability so that the highest probability of attack for srv_count variable, which
indicates the count of connections to the identical services with the current connection
during the last two seconds [35], is 1.0000.
6. Results and Discussions
In general, researches indicate that among the approaches developed for APT attacks
detection, artificial intelligence methods are the best methods. Moreover, according to
the latest scientific achievements in the field of network security, deep learning method
has had the best performance comparing to other methods. Consequently, in this paper,
artificial intelligence methods such as C5.0 decision tree, Bayesian network and deep
neural network classification models were used to detect two normal and anomaly
classes of APT attacks on the NSL-KDD dataset. The models were implemented via
RapidMiner software.
As APT attack is one of the most stable and persistent attacks on the system and
involves the system for a long time, it is very important to detect it early. Therefore, we
needed artificial intelligence methods for timely detection of APT attacks, and we
implemented three methods of C5.0 decision tree, Bayesian model and deep learning
using 10-fold cross validation method.
31
According to Table 4, by evaluating the criteria, we concluded that the accuracy of
the deep learning model reaching 98.85% is the best
compared to the C5.0 decision tree and Bayesian models reaching 95.64% and
88.37%, respectively. Another important criterion is the FPR criterion, which is 1.13,
2.56, and 10.47 for the deep learning network, C5.0 decision tree and Bayesian network
models, respectively. In addition, for the rest of the evaluation criteria, including TPR,
TNR, F-measure and FNR, the deep learning model performed better than the C5.0
decision tree and Bayesian network models.
In addition, in terms of the AUC criterion, according to Figures 8-10, the AUC value
for the Bayesian, C5.0 decision tree and deep learning models is obtained as 96.1%,
99.60% and 99.90%, respectively. Thus, regarding AUC, deep learning model is a more
appropriate model for detection and classification of APT attacks.
Comparison between the C5.0 decision tree, Bayesian Network and deep learning
classification models in terms of the AUC criterion via ROC curve is illustrated in
Figure 12 and comparison between the models based on the mentioned criteria are
shown in Figure13.
According to Figure 13, comparison between the models show that the deep learning
model provides the best performance for detection and classification of APT attacks
regarding ACC, TPR, TNR, PPV, F-measure, FPR, FNR and AUC criteria.
Finally, based on the results obtained, we can conclude that the deep learning model
has been selected as the proposed model of this paper. As an acceptable result for the
proposed deep learning model, we have implemented Lift chart [39] diagram for two
normal and anomalous classes with a confidence index on the test dataset. In Figures
14 and 15, Lift chart diagram is shown for normal and anomalous classes based on the
APT attack detection, respectively.
Figure 11. Features extraction using a deep neural network on the NSL-KDD dataset.

32
Figure 13. Comparison between the classification models based on the evaluation criteria.
Figure 12. Comparison between the C5.0 decision tree, Bayesian Network and deep
learning classification models in terms of the AUC criterion via ROC curve.

33
Figure 14. Lift Chart diagram for modeling of Deep Neural Network for normal class.
Figure 15. Lift Chart diagram for modeling of Deep Neural Network for anomaly class.
The diagram of Lift Chart for normal class is illustrated in Figure 14. Based on Figure
14, confidence for normal class, for example in scope 0.94 related to the fifth record
include 14851 samples, illustrating that 14625 samples are as normal. Therefore,
confidence for normal class at the scope 0.94 is very important for 14851 records,
illustrating that over 98% of samples are as normal. Furthermore, the diagram of Lift
Chart for anomaly class is shown in Figure 15. Hence, confidence for anomaly class,
for example in scope 0.99 related to the fourth record contains 14851 samples
illustrating that 14832 samples are as anomaly.
34
Therefore, confidence for anomaly class on data sets at the scope 0.99 is very
important for 14851 records, illustrating that more than 98% of samples are as anomaly.
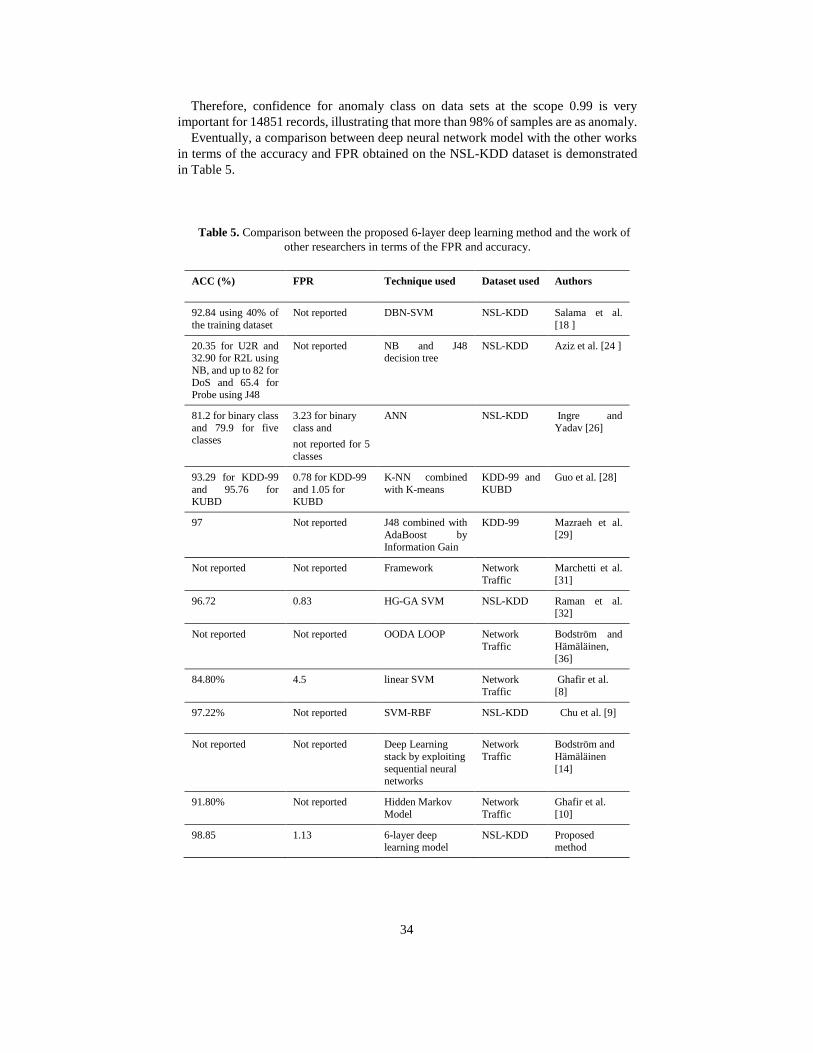
Eventually, a comparison between deep neural network model with the other works
in terms of the accuracy and FPR obtained on the NSL-KDD dataset is demonstrated
in Table 5.
Table 5. Comparison between the proposed 6-layer deep learning method and the work of
other researchers in terms of the FPR and accuracy.
ACC (%) FPR Technique used Dataset used Authors
92.84 using 40% of
the training dataset
Not reported DBN-SVM NSL-KDD Salama et al.
[18 ]
20.35 for U2R and 32.90 for R2L using
NB, and up to 82 for
DoS and 65.4 for Probe using J48
Not reported NB and J48 decision tree
NSL-KDD Aziz et al. [24 ]
81.2 for binary class
and 79.9 for five classes
3.23 for binary
class and
not reported for 5
classes
ANN NSL-KDD Ingre and
Yadav [26]
93.29 for KDD-99
and 95.76 for KUBD
0.78 for KDD-99
and 1.05 for KUBD
K-NN combined
with K-means
KDD-99 and
KUBD
Guo et al. [28]
97 Not reported J48 combined with
AdaBoost by
Information Gain
KDD-99 Mazraeh et al.
[29]
Not reported Not reported Framework Network
Traffic
Marchetti et al.
[31]
96.72 0.83 HG-GA SVM NSL-KDD Raman et al. [32]
Not reported Not reported OODA LOOP Network
Traffic
Bodström and
Hämäläinen,
[36]
84.80% 4.5 linear SVM Network
Traffic
Ghafir et al.
[8]
97.22% Not reported SVM-RBF NSL-KDD Chu et al. [9]
Not reported Not reported Deep Learning
stack by exploiting
sequential neural networks
Network
Traffic
Bodström and
Hämäläinen
[14]
91.80% Not reported Hidden Markov
Model
Network
Traffic
Ghafir et al.
[10]
98.85 1.13 6-layer deep learning model
NSL-KDD Proposed method

35
According to Table 5, we have accomplished the APT attack detection and
classification process on the NSL-KDD dataset and have compared our proposed
method with other researches that have used machine learning methods to detect
intrusion into the NSL-KDD dataset. A comparison of the proposed 6-layer deep
learning method with the work of other researchers on the NSL-KDD dataset is as
follows.
Salama et al. have proposed the combined DBN-SVM method for intrusion
detection, which achieved 92.84% detection accuracy and have not reported any value
for the FPR [18]. In our study, the detection accuracy for APT attack is 98.85% using
a 6-layer deep learning model, and the FPR value obtained via our proposed model is
1.13.
Aziz et al. have achieved 21.07% detection accuracy for R2L attack on all the
training data and 32.90% accuracy on 20% of the training data using the Naive Bayes
classification method [24]. Also, regarding U2R attack, 20.35% accuracy was achieved
on all the training data and 16.28% accuracy was achieved on 20% of the training data.
Then, they have used the J48 decision tree to achieve a high accuracy of up to 82% for
DoS attack and 65.4% accuracy for Probe attack, and no FPR values were reported.
Whereas, in our study, we grouped all the attack classes into a class under the anomaly
attack class in the data preprocessing step. Finally, the accuracy of 98.85% is obtained
for APT attack detection using a 6-layer deep learning model, and the FPR value in our
proposed model is 1.13.
In a study by Ingre and Yadav, Artificial Neural Network (ANN) method has been
utilized to detect intrusion [26]. Their results show that the ANN method with detection
accuracies of 81.2% and 79.9% for 2 classes and 5 classes, respectively, has better
performance comparing to the SOM method with 75.49% detection accuracy, and also,
the FPR obtained via their method is 3.23 for the binary class. While, in our study, the
accuracy of 98.85% is achieved using a 6-layer deep learning model, and the FPR value
is obtained as 1.13.
In the next study, Raman et al. have proposed an intrusion detection technique using
a Hyper Graph-Based Genetic Algorithm (HG-GA) for parameterization and feature
selection in the Support Vector Machine (SVM) [32]. They achieved 96.72% accuracy
using the proposed HG-GA SVM method, and also the FPR value obtained applying
their method is 0.83. But in our study, the accuracy of APT attack detection using a 6-
layer deep learning model is 98.85%, and the FPR value is 1.13.
Chu et al. have used the combined SVM-RBF method to detect APT attacks with
97.22% accuracy and the FPR value has not been reported in their work [9]. However,
we achieved the accuracy of 98.85% using a 6-layer deep learning model, and the FPR
value through our proposed model is 1.13.
As a general result, the proposed deep learning model with the extracted features
according to Figure 11 has the best performance in comparison with the work of others
in terms of the above evaluation criteria for APT attack detection. To the best of our
knowledge, it is the first time that the attack classes are grouped into an anomaly class
to detect an APT anomaly attack on the NSL-KDD dataset in the data preprocessing
step. Moreover, for the first time, the 10-fold cross validation method is utilized for
APT attack detection, so that all the training and testing data are aggregated and
integrated, and then, the 10-fold cross validation method is applied.

36
7. Conclusion and Future Works
In this study, three artificial intelligence-based classification models including
Bayesian Network, C5.0 decision tree and deep learning were used to detect and
classify APT attacks on the NSL-KDD dataset. Since the nature of the APT attack is
permanent and persistent presence in the victim system, early detection of this attack
requires high accuracy and minimal FPR in the early steps. For this purpose, through
the mentioned classification models, based on the obtained results, a 6-layer deep
learning model with the highest accuracy and the lowest FPR, which are equal to 98.85
and 1.13, respectively, was selected as the final model. In addition, other evaluation
criteria, such as TPR, TNR, PPV, F-measure, FPR, FNR and AUC were investigated.
The 6-layer deep learning model had also the best performance in terms of these
criteria. One of the important criteria for comparing models is the AUC criterion.
Figures 8-10 as well as Figure 12, comparing the three classification models, show that
the deep learning model with the AUC value 99.9% is better than the Bayesian Network
and C5.0 decision tree models with the AUC values 99.6% and 99.60%, respectively.
Finally, Table 5 summarizes the comparison of the proposed deep learning model
with other related works on the NSL-KDD dataset. The 6-layer deep learning model
had the best execution and performance in terms of the accuracy compared to previous
work [9] regarding APT attack detection on the NSL-KDD dataset. Furthermore, so far
in no study the important features of the dataset have been extracted. Figure 11 shows
the importance of the features. As an important result, deep learning has been ranked
the highest and best in most areas of network security detection, and in this article, we
also have obtained the best results for the deep learning model. For future work, we
suggest that a combination of machine learning and deep learning methods can be
implemented on the NSL-KDD dataset used and network traffic flow. Moreover,
supervised and unsupervised deep learning methods, such as Recurrent Neural
Networks and Auto-Encoder Neural Networks, respectively, can be utilized.

37
References
[1]. Y. Wang, Q. Li, Z. Chen, P. Zhang, and G. Zhang, “A Survey of Exploitation Techniques and Defenses for Program
Data Attacks,” J. Netw. Comput. Appl., vol. 154, p. 102534, 2020.
[2]. J. Chen, C. Su, K.-H. Yeh, and M. Yung, “Special issue on advanced persistent threat.” Elsevier, 2018.
[3]. S. Singh, P. K. Sharma, S. Y. Moon, D. Moon, and J. H. Park, “A comprehensive study on APT attacks and
countermeasures for future networks and communications: challenges and solutions,” J. Supercomput., vol. 75, no. 8,
pp. 4543–4574, 2019.
[4]. A. Alshamrani, S. Myneni, A. Chowdhary, and D. Huang, “A survey on advanced persistent threats: Techniques,
solutions, challenges, and research opportunities,” IEEE Commun. Surv. Tutorials, vol. 21, no. 2, pp. 1851–1877,
2019.
[5]. M. Auty, “Anatomy of an advanced persistent threat,” Netw. Secur., vol. 2015, no. 4, pp. 13–16, 2015.
[6]. https://malpedia.caad.fkie.fraunhofer.de/actor/turla_group
[7]. https://www.cynet.com/cyber-attacks/advanced-persistent-threat-apt-attacks/
[8]. I. Ghafir et al., “Detection of advanced persistent threat using machine-learning correlation analysis,” Futur. Gener.
Comput. Syst., vol. 89, pp. 349–359, 2018.
[9]. W.-L. Chu, C.-J. Lin, and K.-N. Chang, “Detection and Classification of Advanced Persistent Threats and Attacks
Using the Support Vector Machine,” Appl. Sci., vol. 9, no. 21, p. 4579, 2019.
[10]. I. Ghafir et al., “Hidden Markov models and alert correlations for the prediction of advanced persistent threats,” IEEE
Access, vol. 7, pp. 99508–99520, 2019.
[11]. M. Lee and D. Lewis, “Clustering disparate attacks: Mapping the activities of the advanced persistent threat,” Last
accessed June, vol. 26, 2013.
[12]. B. Bencsáth, G. Pék, L. Buttyán, and M. Félegyházi, “Duqu: Analysis, detection, and lessons learned,” in ACM
European Workshop on System Security (EuroSec), 2012, vol. 2012.advanced persistent threat,” Last accessed June,
vol. 26, 2013.
[13]. M. Balduzzi, V. Ciangaglini, and R. McArdle, “Targeted attacks detection with spunge,” in 2013 Eleventh Annual
Conference on Privacy, Security and Trust, 2013, pp. 185–194.
[14]. T. Bodström and T. Hämäläinen, “A novel deep learning stack for APT detection,” Appl. Sci., vol. 9, no. 6, p. 1055,
2019.
[15]. B. Mukherjee, L. T. Heberlein, and K. N. Levitt, “Network intrusion detection,” IEEE Netw., vol. 8, no. 3, pp. 26–41,
1994.
[16]. M. Roesch, “Snort: Lightweight intrusion detection for networks.,” in Lisa, 1999, vol. 99, no. 1, pp. 229–238.
[17]. D. E. Denning, “An intrusion-detection model,” IEEE Trans. Softw. Eng., no. 2, pp. 222–232, 1987.
[18]. M. A. Salama, H. F. Eid, R. A. Ramadan, A. Darwish, and A. E. Hassanien, “Hybrid intelligent intrusion detection
scheme,” in Soft computing in industrial applications, Springer, 2011, pp. 293–303.
[19]. R. Brewer, “Advanced persistent threats: minimising the damage,” Netw. Secur., vol. 2014, no. 4, pp. 5–9, 2014.
[20]. N. Virvilis and D. Gritzalis, “The big four-what we did wrong in advanced persistent threat detection?,” in 2013
international conference on availability, reliability and security, 2013, pp. 248–254.
[21]. B. Bencsáth, G. Pék, L. Buttyán, and M. Felegyhazi, “The cousins of stuxnet: Duqu, flame, and gauss,” Futur. Internet,
vol. 4, no. 4, pp. 971–1003, 2012.
[22]. T. M. Chen and S. Abu-Nimeh, “Lessons from stuxnet,” Computer (Long. Beach. Calif)., vol. 44, no. 4, pp. 91–93,
2011.
[23]. M. H. Au, K. Liang, J. K. Liu, R. Lu, and J. Ning, “Privacy-preserving personal data operation on mobile cloud—
Chances and challenges over advanced persistent threat,” Futur. Gener. Comput. Syst., vol. 79, pp. 337–349, 2018.
[24]. A. S. A. Aziz, A. E. Hassanien, S. E.-O. Hanaf, and M. F. Tolba, “Multi-layer hybrid machine learning techniques for
anomalies detection and classification approach,” in 13th International Conference on Hybrid Intelligent Systems (HIS
2013), 2013, pp. 215–220.
[25]. J. R. Johnson and E. A. Hogan, “A graph analytic metric for mitigating advanced persistent threat,” in 2013 IEEE
International Conference on Intelligence and Security Informatics, 2013, pp. 129–133.
[26]. B. Ingre and A. Yadav, “Performance analysis of NSL-KDD dataset using ANN,” in 2015 international conference
on signal processing and communication engineering systems, 2015, pp. 92–96.
[27]. I. Friedberg, F. Skopik, G. Settanni, and R. Fiedler, “Combating advanced persistent threats: From network event
correlation to incident detection,” Comput. Secur., vol. 48, pp. 35–57, 2015.
[28]. C. Guo, Y. Ping, N. Liu, and S.-S. Luo, “A two-level hybrid approach for intrusion detection,” Neurocomputing, vol.
214, pp. 391–400, 2016.
[29]. S. Mazraeh, M. Ghanavati, and S. H. N. Neysi, “Intrusion detection system with decision tree and combine method
algorithm,” Int. Acad. J. Sci. Eng., vol. 3, no. 8, pp. 21–31, 2016.

38
[30]. P. Bhatt, E. T. Yano, and P. Gustavsson, “Towards a framework to detect multi-stage advanced persistent threats
attacks,” in 2014 IEEE 8th international symposium on service oriented system engineering, 2014, pp. 390–395.
[31]. M. Marchetti, F. Pierazzi, M. Colajanni, and A. Guido, “Analysis of high volumes of network traffic for advanced
persistent threat detection,” Comput. Networks, vol. 109, pp. 127–141, 2016.
[32]. M. R. G. Raman, N. Somu, K. Kirthivasan, R. Liscano, and V. S. S. Sriram, “An efficient intrusion detection system
based on hypergraph-Genetic algorithm for parameter optimization and feature selection in support vector machine,”
Knowledge-Based Syst., vol. 134, pp. 1–12, 2017.
[33]. T. Bodström and T. Hämäläinen, “A Novel Method for Detecting APT Attacks by Using OODA Loop and Black
Swan Theory,” in International Conference on Computational Social Networks, 2018, pp. 498–509.
[34]. https://github.com/jmnwong/NSL-KDD-Dataset
[35]. L. Dhanabal and S. P. Shantharajah, “A study on NSL-KDD dataset for intrusion detection system based on
classification algorithms,” Int. J. Adv. Res. Comput. Commun. Eng., vol. 4, no. 6, pp. 446–452, 2015.
[36]. M. Hasan, M. M. Islam, M. I. I. Zarif, and M. M. A. Hashem, “Attack and anomaly detection in IoT sensors in IoT
sites using machine learning approaches,” Internet of Things, vol. 7, p. 100059, 2019.
[37]. J. H. Joloudari et al., “Coronary Artery Disease Diagnosis; Ranking the Significant Features Using Random Trees
Model,” Int. J. Environ. Res. Public Health, vol. 17, no. 3, p. 731, 2020.
[38]. J. H. Joloudari et al. (2020). “Coronary artery disease diagnosis; ranking the significant features using a random trees
model,” [Online]. Available: https://arxiv.org/abs/2001.09841
[39]. J. H. Joloudari, H. Saadatfar, A. Dehzangi, and S. Shamshirband, “Computer-aided decision-making for predicting
liver disease using PSO-based optimized SVM with feature selection,” Informatics Med. Unlocked, vol. 17, p. 100255,
2019.
[40]. J. Cheng and R. Greiner, “Learning bayesian belief network classifiers: Algorithms and system,” in Conference of the
Canadian Society for Computational Studies of Intelligence, 2001, pp. 141–151.
[41]. I. Goodfellow, Y. Bengio, and A. Courville, Deep learning. MIT press, 2016.
[42]. Y. LeCun, Y. Bengio, and G. Hinton, “Deep learning,” Nature, vol. 521, no. 7553, pp. 436–444, 2015.
[43]. J. Ngiam, A. Khosla, M. Kim, J. Nam, H. Lee, and A. Y. Ng, “Multimodal deep learning,” 2011.
[44]. J. Schmidhuber, “Deep learning in neural networks: An overview,” Neural networks, vol. 61, pp. 85–117, 2015.
[45]. L. Deng and D. Yu, “Deep learning: methods and applications,” Found. trends signal Process., vol. 7, no. 3–4, pp.
197–387, 2014.
[46]. Y. Bengio, I. Goodfellow, and A. Courville, Deep learning, vol. 1. MIT press Massachusetts, USA:, 2017.
[47]. M. A. Nielsen, Neural networks and deep learning, vol. 2018. Determination press San Francisco, CA, 2015.
[48]. Y. Bengio, Learning deep architectures for AI. Now Publishers Inc, 2009.
[49]. Q. Zhu, X. Jiang, Q. Zhu, M. Pan, and T. He, “Graph embedding deep learning guide microbial biomarkers’
identification,” Front. Genet., vol. 10, p. 1182, 2019.
[50]. M. Längkvist, L. Karlsson, and A. Loutfi, “A review of unsupervised feature learning and deep learning for time-
series modeling,” Pattern Recognit. Lett., vol. 42, pp. 11–24, 2014.
[51]. I. Goodfellow, D. Warde-Farley, M. Mirza, A. Courville, and Y. Bengio, “Maxout networks,” in International
conference on machine learning, 2013, pp. 1319–1327.
[52]. S. Mojrian et al., “Hybrid Machine Learning Model of Extreme Learning Machine Radial basis function for Breast
Cancer Detection and Diagnosis; a Multilayer Fuzzy Expert System,” in 2020 RIVF International Conference on
Computing and Communication Technologies (RIVF), 2020, pp. 1–7.