Embed Size (px)
Citation preview

A
Early PerspectivesThe situation at the start of Grade 1
The Second Early Grade Reading Study

Contents
Acronyms ............................................................................................................................................................................................... 04
Executive Summary ............................................................................................................................................................................ 05
1 Introduction ��������������������������������������������������������������������������������������������������������������������������������������������������������������� 07
2 Background ����������������������������������������������������������������������������������������������������������������������������������������������������������������08
3 Study Design ������������������������������������������������������������������������������������������������������������������������������������������������������������� 103.1 Research Site ........................................................................................................................................................................ 103.2 Interventions .......................................................................................................................................................................... 113.3 Theory of Change ................................................................................................................................................................ 133.4 Evaluation ............................................................................................................................................................................... 143.5 Ethical Clearance ................................................................................................................................................................. 16
4 Baseline Results �������������������������������������������������������������������������������������������������������������������������������������������������������� 184.1 Sample Characteristics ...................................................................................................................................................... 184.2 Learner Assessment ...........................................................................................................................................................234.3 Balance Test ......................................................................................................................................................................... 304.4 Characteristics Correlated with Learner Test Scores ...............................................................................................32
5 Sensitivity Checks ���������������������������������������������������������������������������������������������������������������������������������������������������� 37
6 USAID Indicators �������������������������������������������������������������������������������������������������������������������������������������������������������38
7 Next Steps in the Project ����������������������������������������������������������������������������������������������������������������������������������������40
References .............................................................................................................................................................................................. 41

List of TablesTable 1: Comparison of interventions ................................................................................................................................................... 12Table 2: Percentage of learners tested during baseline data collection .................................................................................... 17Table 3: Percentage of teacher interviews conducted during baseline data collection 17Table 4: Number of principals interviewed during baseline data collection ............................................................................. 17Table 5: Percentage of home background questionnaires returned........................................................................................... 17Table 6: School characteristics...............................................................................................................................................................18Table 7: Learner characteristics ............................................................................................................................................................ 20Table 8: Average performance per subtask ....................................................................................................................................... 24Table 9: Summary statistics per subtask ............................................................................................................................................. 24Table 10: Subtest correlation matrix ...................................................................................................................................................... 25Table 11: Subtask 1 – Naming Animals .................................................................................................................................................. 26Table 12: Subtask 2.1: Word Recall ............................................................................................................................................................27Table 13: Subtask 2.2: Non-word Recall .................................................................................................................................................27Table 14: Subtask 3: Phoneme Isolation ................................................................................................................................................27Table 15: English receptive and expressive vocabulary ................................................................................................................... 30Table 16: Balance tests per subtask ........................................................................................................................................................ 31Table 17: Balance test on teacher English proficiency ...................................................................................................................... 31Table 18: Learner characteristics correlated with baseline performance .................................................................................. 33Table 19: Learner characteristics correlated with learner performance per subtask ............................................................. 34Table 20: Learner background factors correlated with baseline performance ......................................................................... 35Table 21: Community level factors ......................................................................................................................................................... 36Table 22: Robustness check – reallocating intervention status .....................................................................................................37Table 23: Specific USAID indicators ........................................................................................................................................................38Table 24: Custom USAID indicators ........................................................................................................................................................ 39
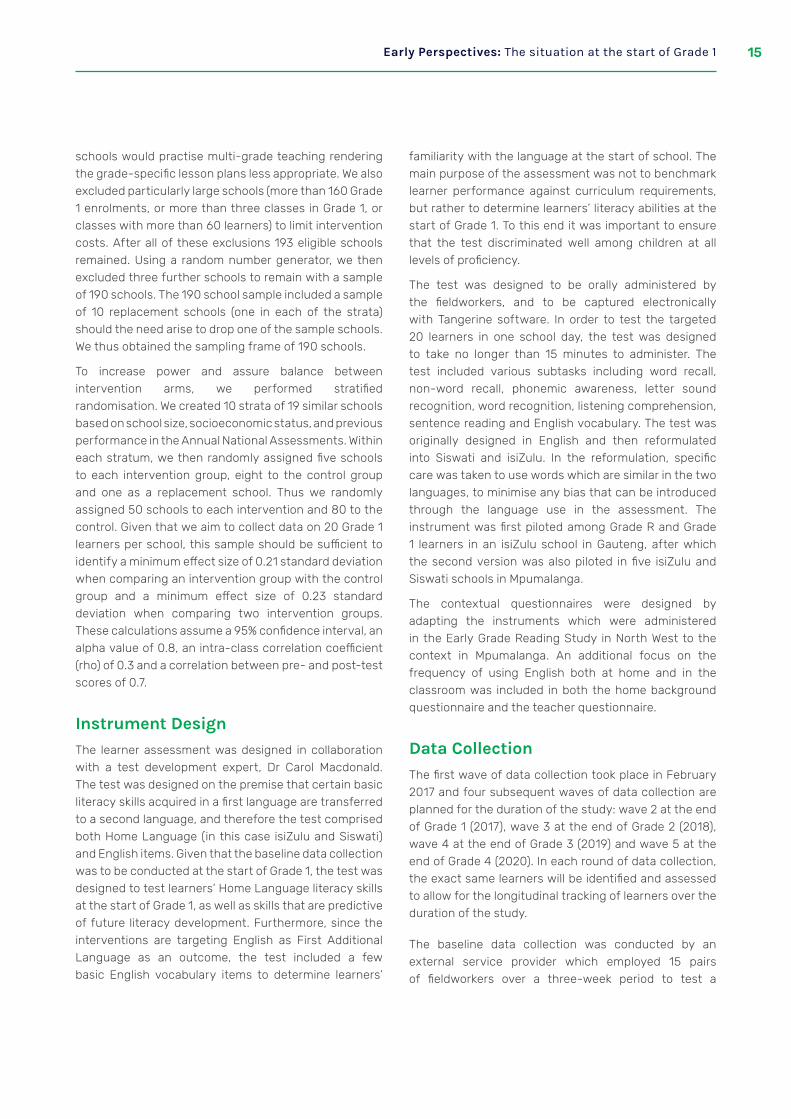
List of FiguresFigure 1: Map of the research site ............................................................................................................................................................11Figure 2: Who is responsible for your child’s reading? .......................................................................................................................21Figure 3: How often do you speak English to your child? .................................................................................................................21Figure 4: Teacher age profile .................................................................................................................................................................... 22Figure 5: Resources used for EFAL lesson planning ......................................................................................................................... 22Figure 6: Two most important lesson types ........................................................................................................................................ 22Figure 7: Subject teachers enjoy teaching most ............................................................................................................................... 22Figure 8: Teacher’s use of technology .................................................................................................................................................. 22Figure 9: Principal age profile ................................................................................................................................................................... 23Figure 10: Instructional leadership – time dedicated to EFAL ......................................................................................................... 23Figure 11: Instructional leadership – when to start with EFAL ........................................................................................................ 23Figure 12: Overall learner performance distribution .......................................................................................................................... 26Figure 13: Histogram – Naming Animals ................................................................................................................................................. 26Figure 14: Histogram – Word Recall .......................................................................................................................................................... 26Figure 15: Histogram – Phoneme Isolation ............................................................................................................................................ 28Figure 16: Histogram – Story Comprehension ...................................................................................................................................... 28Figure 17: Distribution of learner performance on Letter Sound Recognition ............................................................................ 28Figure 18: Subtask 8 – Visual perception .............................................................................................................................................. 29Figure 19: Composite learner score by intervention group ................................................................................................................ 31Figure 20: Subtask performance by intervention group ..................................................................................................................... 31Figure 21: Language difference in phoneme isolation ....................................................................................................................... 34Figure 22: Reading at home and learner performance ....................................................................................................................... 35Figure 23: Speaking English at home and learner performance ...................................................................................................... 35

Acronyms
CAPS Curriculum and Assessment Policy Statement
DBE Department of Basic Education
EFAL English as First Additional Language
EGRA Early Grade Reading Assessment
EGRS Early Grade Reading Study
EGRS II Second Early Grade Reading Study
HOD Head of Department
ICT Information and Communications Technology
LoLT Language of Learning and Teaching
LTSM Learning and Teaching Support Materials
NECT National Education Collaboration Trust
OLS Ordinary Least Squares
PIRLS Progress in International Reading and Literacy Study
PMT Project Management Team
RCT Randomised Control Trial
SADTU South African Democratic Teacher Union
SMT School Management Team
USAID United States Agency for International Development
The Second Early Grade Reading Study04

Executive Summary
Early literacy has been taking centre stage as one of the most important aspects in ensuring sustained learning throughout an individual’s schooling career. Literacy allows individuals to access information, improve their knowledge, increase their productivity and contribute to society using their full potential. Literacy therefore not only holds major benefits for the individual, but has spill-over effects to the broader society, and at a national level leads to economic growth. Ensuring that all individuals are literate by the end of Grade 12 is therefore of critical importance to the South African Department of Basic Education (DBE).
In pursuing this objective, the DBE in collaboration with the University of Witwatersrand embarked on the Early Grade Reading Study (EGRS) series in 2015. Both the first and second EGRS aim to evaluate and trial more effective ways of supporting and training teachers in order to influence both the quality of instructional practice and the pace of teaching. The theory of change is therefore that improvement in these two aspects of instructional practice will lead to more effective teaching, and will subsequently lead to improved learner performance. EGRS I supported teachers in the teaching of Setswana as Home Language in the Foundation Phase, whereas EGRS II will be supporting teachers in the teaching of English as First Additional Language in the Foundation Phase.
Building on the experience of EGRS I, EGRS II evaluates two different interventions which support teachers to teach more effectively. In both interventions teachers are provided with lesson plans and additional reading resources, as well as instructional coaching and training. Two different strategies to training and coaching are used in EGRS II:
1. Traditional face-to-face block training, complemented with regular on-site coaching
2. Traditional face-to-face block training, combined with an Information and Communications Technology (ICT) component that includes tablets provided to teachers and a virtual coach, which provides continuing support through cell phone messaging and phone calls to the teacher.
EGRS II is designed as a Randomised Control Trial (RCT), and schools are therefore randomly assigned to each of the intervention groups (50 schools each), as well as the control group (80 schools). This ensures comparability between the groups, with the only difference between them being the treatment allocation. The random assignment is fundamental in the design of the study and serves as the basis of making claims about the causal impact of each of the intervention groups on the English literacy outcomes of learners.
The interventions of the study were implemented in Mpumalanga in Grade 1 in 2017 and would be implemented in Grade 2 in 2018. To evaluate the impact of the interventions, Grade 1 learners were tested at the start of Grade 1 in 2017 and were tracked throughout the course of the study, participating in assessments at the end of Grade 1 (2017) and at the end of Grade 2 (2018).
The baseline data collection was administered at the end of January and start of February 2017 in all 180 schools. A random sample of 20 Grade 1 learners per school was selected to participate in the oral assessment of reading and pre-reading skills. The learner assessment was administered in the Language of Learning and Teaching (LoLT) of the school, which was either isiZulu or Siswati. Questionnaires were also administered to the school principal, to all Grade 1 teachers and to the caregivers of the 20 tested learners. The learner tests were reformulated into isiZulu and Siswati and adapted from the Early Grade Reading Assessment (EGRA). The assessment covered the following skills: expressive vocabulary, word recall and non-word recall, phoneme isolation, listening comprehension and visual perception. A task assessing learners’ English vocabulary was also included.
The baseline testing confirms the success of randomisation, with no significant difference in the performance of the learners in the different treatment groups on the various subtasks of the test. Some of the subtasks did show some ceiling effects, whereas others showed some floor effects, but overall the test seems to provide good discrimination between learners of varying ability levels. The correlation between the subtasks is relatively low, which does seem to suggest that there is some noise in the information generated from the
Early Perspectives: The situation at the start of Grade 1 05

assessment. This is largely driven by the floor effects in some of the reading tasks (too little information generated in these questions). The correlation between phoneme isolation and letter recognition is moderate, as well as the correlation between word and non-word recall.
The Grade 1 teachers in the sample are all female. Just over a quarter of the teachers are older than 55 years old, whereas just over half of teachers are between the ages of 45 and 54 years. This could potentially have implications for the implementation of the interventions, specifically since one of the interventions involves the use of technology. Given the South African context, however, this situation was expected and the interventions were designed with this in mind.
Interventions continued throughout 2017, with the initial training having been conducted just after the conclusion of the baseline data collection. Teachers further attended clustered workshop training for one day at the start of each term, and the reading coaches provided continuing support throughout the year. The midline data collection took place from 23 October to 10 November 2017, and provided the data necessary to determine the impact of the interventions after one year of implementation. The interventions were set to continue to Grade 2 teachers in 2018, and the same learners would be tested at the end of Grade 2 in 2018.
The Second Early Grade Reading Study06

/Reading is arguably the most important skill which a child needs to acquire during the Foundation Phase. If a child has not yet acquired the skill to read for meaning by the end of Grade 3, all further learning will be constrained. This has implications on an individual level, as the skill of reading is a necessary requirement for the acquisition of all further learning, and subsequently leads to higher wages and a higher likelihood of employment. Moreover, higher literacy rates have societal benefits and are associated with higher economic growth, healthier societies and less crime.
In South Africa literacy rates are very low in all languages. Large-scale tests of reading proficiency show that the majority of learners in South Africa cannot read for meaning by the end of Grade 4. This trend is worse when looking at only African language readers. Although the South African language policy promotes the teaching of reading in learners’ Home Language during the first three years of schooling, all further learning from Grade 4 will most likely be taking place in English for the majority of learners. This means that learners do not only need to be able to read for meaning in their Home Language, but also in English. English, however, is not only an additional language for the learners, but is also the additional language for the majority of teachers in South Africa. Teaching English as First Additional Language (EFAL) is therefore often done very scantily, with teachers lacking confidence in speaking English themselves. To address these systemic challenges, the Early Grade Reading Study II (EGRS II) aims to support and strengthen the teaching of early grade reading in English by providing teachers with structured lesson plans, additional learning and teaching support material, training sessions and reading coaches.
The Early Grade Reading Study II builds on the experience of the Early Grade Reading Study I that was conducted in North West province. Both interventions aim to
contribute to knowledge about how to support and train teachers to influence both the quality of instructional practice and the pace of their teaching. Improved instructional practices will enable learners to better understand and internalise the content of the lesson, whereas an increased pace will ensure that teachers cover the entire curriculum in the year. The theory of change is therefore that change in these two aspects of instructional practice will lead to more effective teaching, and will subsequently lead to improved learner performance.
For this reason the EGRS II interventions target both of these elements. To evaluate new ways in which to assist and support teachers to teach more effectively, teachers are provided with lesson plans and additional reading resources, as well as instructional coaching and training. Two different strategies to training and coaching are used:
1. Traditional face-to-face block training, complemented with regular on-site coaching
2. Traditional face-to-face block training, combined with an ICT component that includes tablets provided to teachers and a virtual coach, which provides continuing support through cell phone messaging and phone calls to the teacher.
The lesson plans are fully aligned with the Curriculum and Assessment Policy Statement (CAPS) and give the teacher a sense of the breakdown of the CAPS curriculum in daily lessons that will allow the coverage of the entire curriculum within the academic year. In addition, the reading coaches encourage teachers to stay on track and teach each lesson, as well as support the teacher in teaching the sections that are found to be more challenging.
1 Introduction
Early Perspectives: The situation at the start of Grade 1 07

Reading is often used as an indicator of how well an education system is delivering on its mandate. International assessments such as the Progress in International Reading Literacy Study (PIRLS) have shown that at Grade 4 and Grade 5 level, South African learners have not yet learned to read with meaning. In the 2011 pre-PIRLS assessment, 29% of learners did not even reach the low international benchmark and, therefore, when reading information texts, these learners could not make any inferences about logical connections to provide reasons, or interpret obvious reasons and causes when reading literary texts (Howie, et al., 2012). By these grade levels learners are required to use these specific skills to accumulate all further knowledge, signifying that for the largest majority of South African learners, further learning will always be constrained.
South Africa, like many other countries on the African continent, has a rich language heritage with 11 official languages. The language policy in South Africa explicitly promotes primary Home Language instruction in the Foundation Phase and the choice of the specific Language of Learning and Teaching (LoLT) in the Foundation Phase is left to the governing bodies of schools. From Grade 4 onwards, learners are taught most subjects in either English or Afrikaans, but English is the language chosen by the majority of schools. Although African languages are not used as the LoLT from Grade 4 onwards, African language speakers are
expected to continue studying their Home Language as a school subject until Grade 12. To ameliorate the language transition that learners face in Grade 4, English is introduced as an additional language from Grade 1. The language policy therefore promotes an additive approach to bilingualism where the Home Language is developed together with the additional language (Matjila & Pretorius, 2004).
Strengthening the teaching of English in the Foundation Phase is therefore critical to effect improved learning performance in the later grades. In understanding the main constraints to more effective teaching, school effectiveness studies in South Africa have found that primary school classrooms are mainly characterised by a lack of print material, a lack of opportunities for reading and writing, chorusing practices, low levels of cognitive demand and slow pacing (Taylor, 2007). However, while a range of factors influence learning outcomes, it is widely recognised that instruction or instructional practice is critical to improving learning outcomes (Coe, 2014). One of the key characteristics of South African education is that the dualistic nature of learning outcomes between the wealthy and the poor is mirrored by dual types of instructional practice happening in the schools serving these communities (Hoadley, 2012). It is likely that weak instructional practices have a causal impact on learning outcomes in the poorly performing part of the school system. To substantially shift achievement in the
2 Background
Strengthening the teaching of English in the Foundation Phase is therefore critical to effect improved learning performance in the later grades.
/
The Second Early Grade Reading Study08

weak part of the schooling system it may be necessary to apply a comprehensive instructional change intervention, involving a set of coherent and aligned instructional inputs. For this study, the instructional inputs include lesson plans, aligned learning materials and in-classroom support to teachers.
The study is designed as a Randomised Control Trial (RCT) to allow the robust evaluation of the causal impact of the two interventions trialled. This impact evaluation will thus inform credible policy decisions around interventions that have been implemented on a relatively large scale. The main benefit of the RCT design is the inclusion of a randomly selected control group in the evaluation, which allows the measurement of the amount of learning that would have taken place in schools, should the interventions not have been implemented. This in turn provides a benchmark to which the learning gains in the intervention groups can be compared in order to establish the additional learning
gained by implementing the interventions. Furthermore, the comparison of the two interventions with the control group also allows a direct comparison of the costs involved to effect the learning gains, and therefore allows the determination of the cost-effectiveness of each of the interventions.
The primary implementing partner is the South African government, in particular the Department of Basic Education (DBE). The national department partnered with the provincial Education Department in Mpumalanga and the University of the Witwatersrand to implement and evaluate the interventions in the province. Service providers were appointed to assist with the implementation of the interventions, as well as the data collection for the evaluation of the programme. The evaluation side of the project is being supervised by the research team. The study is completely funded by USAID, with the funding housed and administered by the University of Witwatersrand.
Early Perspectives: The situation at the start of Grade 1 09

The EGRS II is designed as an RCT that aims to measure the effects of each of the interventions and compare it to the situation among a comparison group of learners where typical teaching is taking place. The study entails the implementation of two early grade reading interventions in South Africa in 180 primary schools in Mpumalanga province during 2017 and 2018. The EGRS II focuses on the early learning of English as the First Additional Language and the interventions consist of lesson plans, additional reading resources and instructional coaching and training. Two alternative strategies to training and coaching are used:
1. Traditional face-to-face format
2. A combination of face-to-face training and an ICT component that includes tablets and cell phone messaging to the teacher.
The sections to follow will elaborate on the research site, the specific interventions, the theory of change, the sample selection, the instrument design and the baseline data collection.
3�1 Research Site
In selecting Mpumalanga as the province in which to implement and evaluate the second Early Grade Reading Study, the following requirements were considered:
1. Close proximity to the DBE in Pretoria to enable officials to monitor the implementation and evaluation at relatively low cost
2. A politically stable environment with minimal interruptions to the school year due to service delivery or other protests
3. A relatively well-functioning provincial office capable of providing the necessary support to the implementation of the intervention
1 The final school-leaving examination in South Africa. This examination is standardised across all schools in South Africa, and is the only credible standardised assessment which can be used to make cross-province comparisons.
4. A relatively well-functioning school environment with limited teacher absenteeism
5. Enough schools for an adequate sample, given the restrictions imposed.
A further consideration in selecting the districts in which to implement the study was the Home Languages spoken in each district. The interventions target English as First Additional Language, but the learner assessments contain sections assessing the learners’ proficiency in their Home Language. These sections are particularly prominent in Grade 1 and Grade 2, and require fieldworkers to administer the assessments in the learners’ Home Language. For this reason it is necessary to determine the extent of multilingualism in the schools of the respective districts. In the districts in Mpumalanga there is a large variety of Home Languages, but in the district of Ehlanzeni and Gert Sibande the majority of schools either have isiZulu or Siswati as the LoLT. The district of Bohlabela was excluded because the National Education Collaboration Trust (NECT) had already implemented lesson plans in the district.
Relative to the other provinces in South Africa, Mpumalanga is a mid- to low-performing province. In the 2016 matric examination1, Mpumalanga ranked fifth out of the nine provinces. Unfortunately, South Africa does not currently have a standardised assessment with which to compare schools, districts and provinces in the Primary Phase, but various other indicators can provide an indication of the current schooling conditions. The 2016 General Household Survey reports that 94.3% of five- to six-year-olds in Mpumalanga are currently attending an educational institution and 91.4% of Grade 1 learners reported having attended Grade R prior to Grade 1. Poverty analysis shows that 28.4% of learners attending schools in Mpumalanga fall below the food poverty line (monthly per capita income is below R442.00) and 47% below the lower bound poverty line (monthly per capita income is below R660.00).
3 Study Design/
The Second Early Grade Reading Study10
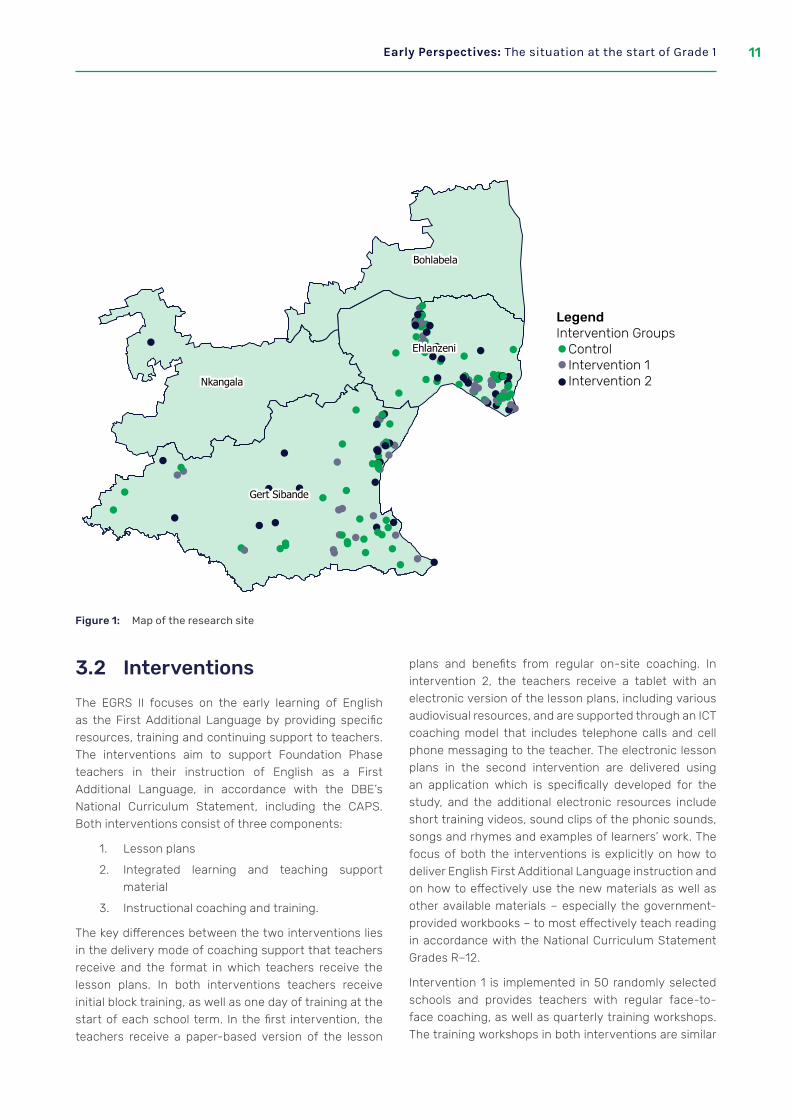
LegendIntervention Groups
ControlIntervention 1Intervention 2
Figure 1: Map of the research site
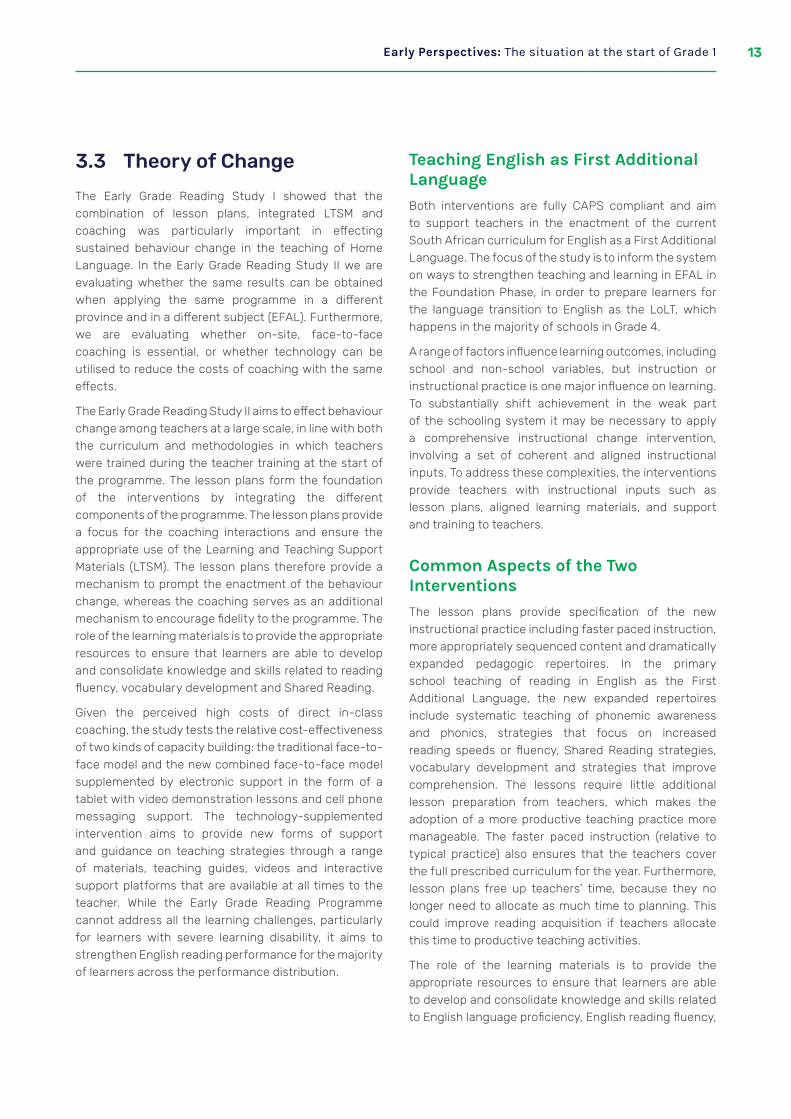
3�2 Interventions
The EGRS II focuses on the early learning of English as the First Additional Language by providing specific resources, training and continuing support to teachers. The interventions aim to support Foundation Phase teachers in their instruction of English as a First Additional Language, in accordance with the DBE’s National Curriculum Statement, including the CAPS. Both interventions consist of three components:
1. Lesson plans
2. Integrated learning and teaching support material
3. Instructional coaching and training.
The key differences between the two interventions lies in the delivery mode of coaching support that teachers receive and the format in which teachers receive the lesson plans. In both interventions teachers receive initial block training, as well as one day of training at the start of each school term. In the first intervention, the teachers receive a paper-based version of the lesson
plans and benefits from regular on-site coaching. In intervention 2, the teachers receive a tablet with an electronic version of the lesson plans, including various audiovisual resources, and are supported through an ICT coaching model that includes telephone calls and cell phone messaging to the teacher. The electronic lesson plans in the second intervention are delivered using an application which is specifically developed for the study, and the additional electronic resources include short training videos, sound clips of the phonic sounds, songs and rhymes and examples of learners’ work. The focus of both the interventions is explicitly on how to deliver English First Additional Language instruction and on how to effectively use the new materials as well as other available materials – especially the government-provided workbooks – to most effectively teach reading in accordance with the National Curriculum Statement Grades R–12.
Intervention 1 is implemented in 50 randomly selected schools and provides teachers with regular face-to-face coaching, as well as quarterly training workshops. The training workshops in both interventions are similar
Early Perspectives: The situation at the start of Grade 1 11

and focus specifically on supporting teachers with the integration of the lesson plans and LTSM into the teaching of EFAL, as well as on various methodologies for the teaching of reading and literacy in English. Unlike typical training workshops, this is best understood as ‘just-in-time’ training: not on general principles, but specifically on how to implement the EFAL literacy programme in the upcoming weeks. The provision of specialist reading coaches is an alternative model of support, involving regular (once a month) in-school coaching. The reading coaches play a number of distinct and overlapping roles, firstly in modelling new practices and secondly in monitoring implementation fidelity. As the teachers become more familiar with the new practices, the coach’s role shifts from introducing new practices towards that of ‘critical friend’, observing and providing real-time input to teachers as they begin to master the new practice. The coaches also play an important monitoring role, providing regular feedback to the Project Management Team (PMT) on the level and quality of programme implementation. The monitoring is always done in an encouraging manner, which therefore contributes to teachers’ being more motivated and encouraged to implement the programme throughout the year. The reading coaches also initiate needs-driven clustered workshops throughout the school term with identified teachers invited to attend. Finally, teachers in both interventions are supplied with sets of LTSM
including graded reading booklets, posters, big books, sentence strips and vocabulary words.
Intervention 2 is implemented in a different group of 50 randomly selected schools and uses a different model of teacher support and mode of delivering the lesson plan. The technology-supplemented intervention aims to provide new forms of support and guidance on teaching strategies through a range of resources, electronically available lesson plans and interactive support platforms that are available at all times to the teacher. The application further includes various resources such as video clips on best practice, and audio clips of the phonic sounds, the songs and the rhymes in the lesson plans. The intervention makes use of WhatsApp or SMS to create virtual reading coaching practices and virtual communities of practice. The virtual reading coach uses text messaging to communicate with teachers regularly, providing them with teaching tips on a weekly basis, and answering any questions they may have on the lessons that they have taught, or are preparing to teach the following day. The regular communication is important in building trust in the virtual reading coach as well as in the overall intervention. Secondly, the virtual reading coach also helps facilitate virtual teacher groups using an appropriate platform such as WhatsApp. This platform assists in building teacher networks where they can share their experiences and assist each other with useful tips and techniques.
Table 1: Comparison of interventions
Intervention 1 Intervention 2
Provision of lesson plans Paper-based Electronic, on an application on a tablet
Provision of LTSM
Paper-based:• Big books• Posters• Flash cards• Writing frames
Paper-based:• Big books• Posters• Flash cards• Writing frames
CoachingCoach visits teacher in her classroomOnce every three weeks
Coach contacts teacher via telephone calls and instant messaging (WhatsApp)Once every two weeks
Training
Initial training: Two-day block trainingQuarterly training: One day at the start of each termNeeds-based training: As required
Initial training: Three-day block trainingQuarterly training: One day at the start of each termNeeds-based training: None
Core methodologiesPaper-based instructional manual with accompanying CD with phonic sounds
Application-based instructions, including videos, sound clips and photos of example writing
The Second Early Grade Reading Study12
3�3 Theory of Change
The Early Grade Reading Study I showed that the combination of lesson plans, integrated LTSM and coaching was particularly important in effecting sustained behaviour change in the teaching of Home Language. In the Early Grade Reading Study II we are evaluating whether the same results can be obtained when applying the same programme in a different province and in a different subject (EFAL). Furthermore, we are evaluating whether on-site, face-to-face coaching is essential, or whether technology can be utilised to reduce the costs of coaching with the same effects.
The Early Grade Reading Study II aims to effect behaviour change among teachers at a large scale, in line with both the curriculum and methodologies in which teachers were trained during the teacher training at the start of the programme. The lesson plans form the foundation of the interventions by integrating the different components of the programme. The lesson plans provide a focus for the coaching interactions and ensure the appropriate use of the Learning and Teaching Support Materials (LTSM). The lesson plans therefore provide a mechanism to prompt the enactment of the behaviour change, whereas the coaching serves as an additional mechanism to encourage fidelity to the programme. The role of the learning materials is to provide the appropriate resources to ensure that learners are able to develop and consolidate knowledge and skills related to reading fluency, vocabulary development and Shared Reading.
Given the perceived high costs of direct in-class coaching, the study tests the relative cost-effectiveness of two kinds of capacity building: the traditional face-to-face model and the new combined face-to-face model supplemented by electronic support in the form of a tablet with video demonstration lessons and cell phone messaging support. The technology-supplemented intervention aims to provide new forms of support and guidance on teaching strategies through a range of materials, teaching guides, videos and interactive support platforms that are available at all times to the teacher. While the Early Grade Reading Programme cannot address all the learning challenges, particularly for learners with severe learning disability, it aims to strengthen English reading performance for the majority of learners across the performance distribution.
Teaching English as First Additional LanguageBoth interventions are fully CAPS compliant and aim to support teachers in the enactment of the current South African curriculum for English as a First Additional Language. The focus of the study is to inform the system on ways to strengthen teaching and learning in EFAL in the Foundation Phase, in order to prepare learners for the language transition to English as the LoLT, which happens in the majority of schools in Grade 4.
A range of factors influence learning outcomes, including school and non-school variables, but instruction or instructional practice is one major influence on learning. To substantially shift achievement in the weak part of the schooling system it may be necessary to apply a comprehensive instructional change intervention, involving a set of coherent and aligned instructional inputs. To address these complexities, the interventions provide teachers with instructional inputs such as lesson plans, aligned learning materials, and support and training to teachers.
Common Aspects of the Two InterventionsThe lesson plans provide specification of the new instructional practice including faster paced instruction, more appropriately sequenced content and dramatically expanded pedagogic repertoires. In the primary school teaching of reading in English as the First Additional Language, the new expanded repertoires include systematic teaching of phonemic awareness and phonics, strategies that focus on increased reading speeds or fluency, Shared Reading strategies, vocabulary development and strategies that improve comprehension. The lessons require little additional lesson preparation from teachers, which makes the adoption of a more productive teaching practice more manageable. The faster paced instruction (relative to typical practice) also ensures that the teachers cover the full prescribed curriculum for the year. Furthermore, lesson plans free up teachers’ time, because they no longer need to allocate as much time to planning. This could improve reading acquisition if teachers allocate this time to productive teaching activities.
The role of the learning materials is to provide the appropriate resources to ensure that learners are able to develop and consolidate knowledge and skills related to English language proficiency, English reading fluency,
Early Perspectives: The situation at the start of Grade 1 13

English vocabulary development and Guided Reading. Flash cards, big books and posters are provided to teachers to use in an integrated manner when teaching vocabulary, phonics and reading. From Grade 2 onwards, 10 titles of graded reading books are provided for each classroom. The accompanying graded reading materials provide ample material for learners to practise decoding and reading at their level of development. It is recognised in South Africa that the opportunity to learn EFAL may be hindered by a lack of suitable materials to assist in the progression from one phase of reading acquisition to the next, and this is likely to be particularly true in African language schools, the focus of our intervention. Furthermore, teachers are required to provide regular assessment of learners’ reading proficiency in order to assign learners to the appropriate graded readers and small reading groups, based on ability.
In addition to the above, coaching is provided as more intensive training to improve teacher capacity. In essence, the role of coaching support is to fuse capacity building and accountability. The assumption is that, just like learning to read, the ability to teach is a skill that needs to be developed over time and might not be accomplished in one day of training. Furthermore, the coach also plays the role of a ‘champion’ who keeps the teacher accountable for implementing the programme through encouragement and motivation.
Intervention 1 Specifically In intervention 1, specialist reading coaches visit each intervention school about once a month. The in-class support allows for modelling of the new practice on site and the gradual development of teachers in the new practice from novice to expert. The in-class support also allows teachers to manage the emotional labour, i.e. stress, insecurity and anxiety associated with developing a new professional practice mid-career. The presence of the in-class support allows for the development of professional accountability in an environment of trust, where the coach monitors and evaluates the teachers’ teaching practices in order to encourage more productive teaching practices. The continuing support from the coach also encourages the teacher to keep up with the increased pace of the lesson plans throughout the course of the year.
2 The Annual National Assessments have not been administered since 2014. This is therefore the most recent standardised measure of school performance we have for the full population of schools.
Intervention 2 SpecificallyThe technology-supplemented intervention aims to provide new forms of support and guidance on teaching strategies through a range of materials, teaching guides, videos and interactive support platforms that are available at all times to the teacher. These resources are intended to encourage more productive teaching practices among the teachers. Lesson plans are provided in an electronic format on a tablet and are integrated with various audio and visual resources to support teachers in the teaching of EFAL. The resources are supplemented with virtual coaching through phone calls and cell phone messaging. Similar to intervention 1, the continuing support from the virtual coach intends to encourage the teacher to keep up with the increased pace of the lesson plans throughout the course of the year. However, given that the virtual coach will not be in the classrooms, the role of the coach will focus more on encouragement and less on monitoring.
3�4 Evaluation
The study is designed as an RCT and consists of an implementation and evaluation side. Implementation service providers are appointed to ensure the effective implementation of the interventions. The evaluation component of the study is conducted independently of the implementation service providers to ensure that the impact of the interventions minimises service provider bias. Data collection service providers are recruited for each round of data collection and the PMT is ultimately responsible for the instrument design and data analysis.
Sample Selection and Intervention AssignmentThrough a process of elimination we developed a sampling frame of 180 eligible schools. Beginning with 731 primary schools registered in the 2016 administrative data in the districts of Ehlanzeni and Gert Sibande, we firstly excluded relatively affluent schools (those in quintiles 4 and 5). Next, we excluded schools in which the language of instruction in the Foundation Phase was neither Siswati, nor isiZulu. We also excluded schools which were missing in the 2014 Annual National Assessment (ANA) dataset.2 We further excluded particularly small schools (fewer than 30 Grade 1 enrolments) since many of these
The Second Early Grade Reading Study14
schools would practise multi-grade teaching rendering the grade-specific lesson plans less appropriate. We also excluded particularly large schools (more than 160 Grade 1 enrolments, or more than three classes in Grade 1, or classes with more than 60 learners) to limit intervention costs. After all of these exclusions 193 eligible schools remained. Using a random number generator, we then excluded three further schools to remain with a sample of 190 schools. The 190 school sample included a sample of 10 replacement schools (one in each of the strata) should the need arise to drop one of the sample schools. We thus obtained the sampling frame of 190 schools.
To increase power and assure balance between intervention arms, we performed stratified randomisation. We created 10 strata of 19 similar schools based on school size, socioeconomic status, and previous performance in the Annual National Assessments. Within each stratum, we then randomly assigned five schools to each intervention group, eight to the control group and one as a replacement school. Thus we randomly assigned 50 schools to each intervention and 80 to the control. Given that we aim to collect data on 20 Grade 1 learners per school, this sample should be sufficient to identify a minimum effect size of 0.21 standard deviation when comparing an intervention group with the control group and a minimum effect size of 0.23 standard deviation when comparing two intervention groups. These calculations assume a 95% confidence interval, an alpha value of 0.8, an intra-class correlation coefficient (rho) of 0.3 and a correlation between pre- and post-test scores of 0.7.
Instrument DesignThe learner assessment was designed in collaboration with a test development expert, Dr Carol Macdonald. The test was designed on the premise that certain basic literacy skills acquired in a first language are transferred to a second language, and therefore the test comprised both Home Language (in this case isiZulu and Siswati) and English items. Given that the baseline data collection was to be conducted at the start of Grade 1, the test was designed to test learners’ Home Language literacy skills at the start of Grade 1, as well as skills that are predictive of future literacy development. Furthermore, since the interventions are targeting English as First Additional Language as an outcome, the test included a few basic English vocabulary items to determine learners’
familiarity with the language at the start of school. The main purpose of the assessment was not to benchmark learner performance against curriculum requirements, but rather to determine learners’ literacy abilities at the start of Grade 1. To this end it was important to ensure that the test discriminated well among children at all levels of proficiency.
The test was designed to be orally administered by the fieldworkers, and to be captured electronically with Tangerine software. In order to test the targeted 20 learners in one school day, the test was designed to take no longer than 15 minutes to administer. The test included various subtasks including word recall, non-word recall, phonemic awareness, letter sound recognition, word recognition, listening comprehension, sentence reading and English vocabulary. The test was originally designed in English and then reformulated into Siswati and isiZulu. In the reformulation, specific care was taken to use words which are similar in the two languages, to minimise any bias that can be introduced through the language use in the assessment. The instrument was first piloted among Grade R and Grade 1 learners in an isiZulu school in Gauteng, after which the second version was also piloted in five isiZulu and Siswati schools in Mpumalanga.
The contextual questionnaires were designed by adapting the instruments which were administered in the Early Grade Reading Study in North West to the context in Mpumalanga. An additional focus on the frequency of using English both at home and in the classroom was included in both the home background questionnaire and the teacher questionnaire.
Data CollectionThe first wave of data collection took place in February 2017 and four subsequent waves of data collection are planned for the duration of the study: wave 2 at the end of Grade 1 (2017), wave 3 at the end of Grade 2 (2018), wave 4 at the end of Grade 3 (2019) and wave 5 at the end of Grade 4 (2020). In each round of data collection, the exact same learners will be identified and assessed to allow for the longitudinal tracking of learners over the duration of the study.
The baseline data collection was conducted by an external service provider which employed 15 pairs of fieldworkers over a three-week period to test a
Early Perspectives: The situation at the start of Grade 1 15

random sample of 20 learners in each school. The data collection at each school was conducted by a pair of two fieldworkers with one fieldworker being responsible for the individual administration of the learner assessment, and the second fieldworker being responsible for the structured questionnaires. The fieldworker responsible for the learner assessment was also responsible for arranging the completion of a structured contextual questionnaire (home background questionnaire) by the parents or caregivers of all the sampled learners. The contextual questionnaires were taken home by the learners and fieldworkers arranged to retrieve them from the schools again via the learners’ teachers within the three-week fieldwork period. The second fieldworker was responsible for administering a structured questionnaire to all the Grade 1 teachers, as well as the school principal. Both these instruments also involved completing some school and classroom facility observations.
The learner assessment, teacher and principal questionnaire were administered using Tangerine software. The home background questionnaire was sent home with the learners for a parent or guardian to fill out. These questionnaires were subsequently collected by the data collection company and captured and cleaned. The final data set, as well as .do files used to clean the data in the statistical software, Stata, was provided to the PMT at the conclusion of the data collection contract.
During the first week of the baseline data collection the South African Democratic Teacher Union (SADTU) held a protest which disrupted schooling in the Ehlanzeni district. To mitigate the effects of the protest action, the fieldwork schedule was rearranged to visit affected schools later in the data collection periods. In some schools the protest action took the format of go-slows, where the schools only operated until 10:00 in the morning. In these schools arrangements were made with the principal and teachers to interview them after 10:00 and to test as many learners as possible before the school closed at 10:00. The protest action has resulted in a slightly smaller sample of learners than expected. Table 2 shows that the protest action did not affect any of the groups of schools more severely than the rest.
The teacher questionnaires were linked to the learner assessments and the principal questionnaires by means of a linking form that was filled out by the fieldworkers. Unfortunately, the linking forms were filled out very poorly, specifically with regard to the teacher names and
surnames. This has meant that the linking of the teacher questionnaire to the learner questionnaires has been challenging, and only 89% of the teacher interviews could be linked to the learner assessments. The linking of the teacher questionnaires to the learner assessments was also more effective among the intervention 1 schools, and therefore introduces a potential bias in the analysis of the results when including the teacher interview data. Robustness checks will be conducted to evaluate the impact of the bias.
The principal interview asks general questions about the school to gain a better understanding of the context in which the Grade 1 teachers and learners function. Fieldworkers were briefed that the deputy principal or a Head of Department (HOD) in the school can also respond to the questionnaire, should the principal not be available on the day of the visit. Table 4 shows that 78% of the interviews were conducted with the principals themselves, but that 40 of the interviews were conducted with a School Management Team (SMT)
member other than the principal.
The final instrument administered was the home background questionnaire which learners took home. The purpose of the questionnaire was to collect information about the learners’ home circumstances. Since the baseline data collection was administered at the start of Grade 1, it is expected that home background factors will play a large role in determining learner performance. The data collection company collected 3 482 returned questionnaires, of which 3 327 (96%) were successfully matched.
3�5 Ethical Clearance
The research methodology, with the intended instruments and research consent forms related to the baseline data collection, was formally submitted to the University of Witwatersrand Human Research Ethics Committee (Non-medical) in May 2016. The project was approved on 3 November 2016 and was granted ethical clearance for the duration of the study, up to 2 November 2019. During the baseline data collection, consent forms were provided to all principals and teachers interviewed. Consent forms were also sent with the home background questionnaire to parents.
The Second Early Grade Reading Study16

Table 2: Percentage of learners tested during baseline data collection
Original number Tested number Percentage tested
Control 1 500 1 555 94%
Intervention 1 1 000 952 95%
Intervention 2 1 000 975 98%
Total 3 500 3 482 97%
Table 3: Percentage of teacher interviews conducted during baseline data collection
Number of teacher
interviews
Number of teacher
exercises
Number of learners matched
to teachers
Percentage questionnaires
merged
Control 143 141 1 225 84%
Intervention 1 89 86 895 97%
Intervention 2 88 88 843 89%
Total 320 315 285 89%
Table 4: Number of principals interviewed during baseline data collection
Number
Principal 140
Person standing in for the principal
40
Table 5: Percentage of home background questionnaires returned
Number returned Number matched Percentage learners
matched to PBQ
Control 1 555 1 459 94%
Intervention 1 952 924 97%
Intervention 2 975 944 97%
Total 3 482 3 327 96%
Early Perspectives: The situation at the start of Grade 1 17

The sections to follow report on the data collected through the baseline data collection. The first section describes the learner characteristics of the learners in the sample, as well as the teacher and school characteristics linked to the learners. The second section reports on the baseline learner assessment and the learner performance on the various tasks at the start of Grade 1. Subsequent to the learner assessment analysis, balance tests are reported to ensure that the sample selected and the intervention allocation support the assumption that the random allocation of the schools to the intervention groups has ensured that there are no observable differences to the groups of schools at the
3 The Quintile system in South Africa determines the funding that schools are eligible for. Quintile 1 schools are situated in the poorest areas, whereas Quintile 5 schools are situated in the wealthiest neighbourhoods. Quintile 1–3 schools are classified as no-fee schools, and are therefore not allowed to charge learners any school fees.
baseline. Finally some sensitivity checks are conducted to evaluate the effect of various data collection and intervention implementation issues so that they do not cause any reason for biased results.
4�1 Sample Characteristics
As mentioned above, the sample was specifically selected to target the lowest performing portion of the population. From Table 6 it is evident that over half of the schools in the sample are Quintile 13 schools, whereas almost a third of the schools are Quintile 2 schools.
Table 6: School characteristics
Number of schools Percentage of schools Percentage of learners
Quintile 1 97 53.9% 54.2%
Quintile 2 59 32.8% 32.6%
Quintile 3 24 13.3% 13.2%
Ehlanzeni 98 54.4% 52.9%
Gert Sibande 82 45.6% 47.1%
isiZulu 49 27.2% 28.6%
Siswati 131 72.8% 71.4%
Remote rural 134 74% 73.7%
Small village 32 18% 18.2%
Informal settlement 3 2% 1.7%
Formal township 9 5% 5.3%
Suburban 2 1% 1.1%
4 Baseline Results/
The Second Early Grade Reading Study18

Only 13% of the schools in the sample are Quintile 3 schools. There are slightly more schools in the Ehlanzeni district relative to the Gert Sibande district, and there are remarkably more schools with Siswati as LoLT than isiZulu schools. The administrative data which classifies school as either being located in urban or rural areas are of a poor quality for Mpumalanga province, and therefore school principals were asked to select the area in which their schools are located. 74% of school principals reported that their schools were situated in a remote rural area, a further 18% stated that their schools are in a small village and the final 8% of principals reported that their schools were either in an informal settlement, a formal township or a suburban area.
Learner CharacteristicsThe largest majority of learners in the selected sample are six years of age, which is the expected age at the start of the Grade 1 school year. The South African Schools Act specifies that a learner can be enrolled in Grade 1 if the learner is five years and turning six years or older by 30 June of the Grade 1 year. At the start of the Grade 1 year it is evident that only 17% of the learners are actually five years or younger, whereas a quarter of the learners are already seven years or older. The learners who are seven years or older may have been enrolled a year later, but it is likely that they are learners who are repeating Grade 1. The sample includes slightly more boys than girls, but the difference is not relevant. Two-thirds of the learners’ mothers filled out the home background questionnaire as their main caregiver and 18% of the learners’ grandmothers filled out the questionnaire as a caregiver. Smaller proportions were filled out by fathers, siblings or other household members. The questionnaire specifically asked the age of the learner’s mother, but it is likely that this question might have been misinterpreted by the person filling out the questionnaire in that they filled out their own age. To mitigate some of this misinterpretation, mother age
was calculated only for those individuals who reported that they are the learner’s mother, as well as all other individuals reporting an age which is above 15 and below 45. Using this variable, it is evident that 12% of learners are from households where the mother is younger than 25 (which would mean that the learner’s mother would have been younger than 20 when they were pregnant with the learner). With regard to parent or guardian education, 56% of parents or guardians did not complete matric, whereas a further 23% only completed matric. This means that 79% of the learners have a parent or guardian who does not have any post-school education. A further 7% of learners are from households where the parent is studying towards or has completed a certificate or diploma, and only 6% are from households where the parent is studying towards or has completed a degree.
Parents or guardians of the learners were also asked some questions on how regularly they read to their child, or spoke English to their child. They were also asked some questions on household assets so that a wealth index could be derived for each learner. Self-reported answers on language practices in the home should be interpreted with some caution, as these types of questions are susceptible to respondents providing socially desirable responses. In this sample, 60% of the parents or guardians reported that they sometimes spoke English to their children, but 27.5% reported that they never spoke English to their child. With regard to reading to their children, 35.9% of parents responded that they read to their child every day, whereas 27.9% responded that they read most days and 22.9% that they read once a week. Parents were also asked who they thought was most responsible for their child’s reading progress. Almost two-thirds of the parents said that they regarded themselves as most responsible for their children’s reading progress; 27% responded that teachers were most responsible and a small percentage said that it was the government’s responsibility.
Almost two-thirds of the parents said that they regarded themselves as most responsible for their children’s reading progress
Early Perspectives: The situation at the start of Grade 1 19

Table 7: Learner characteristics
Number of
learnersPercentage of
learnersControl Intervention 1 Intervention 2
Learner age
Younger than 5 46 1% 1% 1% 1%
5 years old 546 16% 17% 14% 17%
6 years old 1 912 57% 58% 61% 53%
7 years old 697 21% 20% 19% 23%
Older than 7 126 4% 3% 4% 4%
Learner gender
Boys 1 801 54% 53% 54% 55%
Girls 1 526 46% 47% 46% 45%
Main caregiver
Mother 2 190 66% 64% 66% 68%
Father 203 6% 6% 6% 6%
Grandmother 583 18% 18% 19% 16%
Sibling 120 4% 4% 3% 3%
Other 231 7% 7% 7% 6%
Mother age
Younger than 25 402 12% 12% 13% 12%
25–34 years old 1 538 49% 49% 50% 48%
35–44 years old 722 22% 21% 22% 22%
Older than 45 134 4% 4% 3% 5%
Missing 431 13% 13% 12% 13%
Mother education
Did not complete matric
1 875 56% 55% 58% 56%
Finished Grade 12 768 23% 22% 24% 24%
Studying towards TVET or FET certificate
102 3% 4% 2% 3%
Finished a certificate or diploma
118 4% 4% 3% 3%
Studying or completed a degree
184 6% 5% 6% 5%
The Second Early Grade Reading Study20

Teacher I as a parent Government
29%2%
68%
Figure 2: Who is responsible for your child’s reading?
Never Sometimes Most of the time All of the time
28%2%
62%
Figure 3: How often do you speak English to your child?
Teacher CharacteristicsGiven the poor linking between the learners and the teachers in the sample, the teacher characteristics were calculated on the teacher dataset separately. For this reason the statistics reported on in this section should be interpreted as a proportion to the teachers interviewed, and not to the proportion of learners in the sample. In total, data was collected through interviews with 320 teachers.
The teacher age profile reveals that more than a quarter of the Grade 1 teachers are older than 55 years, which means that one in every four Grade 1 teachers will be retiring in the next 10 years. Teacher education levels indicate that the majority of the teachers have a three or four year diploma and that only 18% of the teachers have only a three-year diploma.4
Some questions were also asked regarding the teachers’ current planning and teaching practices with regard to the teaching of English as First Additional Language.
The overwhelming majority of teachers reported that they use the EFAL CAPS document and the DBE workbooks to plan their EFAL teaching. Very few teachers reported using plans they developed themselves, or even plans developed by another teacher. Teachers were further asked which lesson
4 Teacher education levels are not shown in a table or graph as the categories were not asked as being mutually exclusive. Regardless, it is possible to deduct that the majority of teachers have obtained at least a three- or four-year diploma.
types they consider most important in the teaching of EFAL in Grade 1 (the CAPS curriculum specifically states that listening and speaking, and Shared Reading are the most important); 77% of teachers correctly identified listening and speaking as one of the most important lesson types, but only 48% managed to correctly identify Shared Reading.
Teachers were also asked which of the following three subjects they enjoyed teaching most in Grade 1: Mathematics, EFAL or Home Language. Interestingly, the majority of teachers said that they enjoyed teaching Mathematics most, followed by Home Language. EFAL was the subject that teachers were least likely to state as the subject they enjoyed teaching most.
Given the ICT focus of intervention 2, all teachers were asked about the technology devices they have in their household, as well as how regularly they use certain technology features. It was interesting to note that 72% of teachers owned a smartphone and 54% owned a computer. However, only 44% of teachers made use of email, only 28% accessed educational resources on the internet and only 25% made use of Microsoft Word. However, 64% of teachers use WhatsApp, which is encouraging for intervention 2, as this will be one of the methods of communicating with the virtual coach.
Early Perspectives: The situation at the start of Grade 1 21

Younger than 45 45–54 years old Older than 55
18%27%
57%
Figure 4: Teacher age profile
0% 50% 100%
Use a plan from anotherteacher
Use own plan
Use a Teacher's Guide
Use Departmental Plans
Use DBE Workbooks
Use CAPS
Figure 5: Resources used for EFAL lesson planning
Maths HL EFL
49%15%
42%
Figure 7: Subject teachers enjoy teaching most
0% 20% 40% 60% 80% 100%
Language development
Writing
Group guided reading
Shared reading
Listening and speaking
Figure 6: Two most important lesson types
0% 10% 20% 30% 40% 50% 60% 70% 80%
Tablet
Cellphone
Computer
Smartphone
Microsoft Word
GPS
Education websites
Internet banking
Hou
seho
ld o
wns
the
follo
win
gTe
ache
r re
gula
rly u
ses
the
follo
win
g
Figure 8: Teacher’s use of technology
The Second Early Grade Reading Study22

School and Principal CharacteristicsSimilar to the teacher age profile, it is evident that a large percentage of principals will be retiring in the near future: 31% of principals are older than 55 years, which means that almost one in every three principals will be retiring in the next 10 years. There is also not a strong gender bias with regard to the principals in the sampled schools, with 46% of the principals being female.
Two curriculum-related questions were asked of the principals in order to gain a sense of the instructional leadership present at the school. The first question asked the principal how many hours a week are dedicated to teacher EFAL in the Foundation Phase. The CAPS curriculum provides two options, either the minimum amount of two hours, or the maximum amount of three hours. Four options were presented to principals (one to four hours) and interestingly 37% of the principals went for the seemingly most socially desirable option, four hours. The second question asked principals when learners should be starting with EFAL in the Foundation Phase. This question was answered more accurately, with 71% of the principals providing the correct answer of ‘at the start of Grade 1’.
4�2 Learner Assessment
The baseline learner assessment was adapted from the isiZulu and Siswati Early Grade Reading Assessment and included measures of pre-literacy skills. The test was therefore administered orally to learners, one learner at a time. The test took on average 15 minutes to administer and included nine different subtasks. The standard EGRA items which remained in the test included letter sound recognition, familiar word reading and sentence reading. Given that the assessment was conducted at the start of Grade 1, before learners begin formal literacy instruction, various subtasks were included to assess pre-literacy abilities. These include receptive and expressive vocabulary, non-word recall, phoneme isolation, listening comprehension and visual perception. Finally, a task was included to assess the learners’ English vocabulary.
The average performance and summary statistics for each subtask are presented in Tables 8 and 9. Learners scored relatively high in the pre-literacy tasks, but predictably struggled with the Grade 1 EGRA tasks since the majority of learners would have only been exposed to formal literacy instruction for about two weeks.
Younger than 45 45–54 years old Older than 55
13%31%
56%
Figure 9: Principal age profile
0
5
10
15
20
25
30
35
40
45
50
1 Hour 2 Hours 3 Hours 4 Hours
Figure 10: Instructional leadership – time dedicated to EFAL
0
10
20
30
40
50
60
70
80
Start ofGrade 1
Half waythroughGrade 1
Grade 2 Grade 3 Grade 4
Figure 11: Instructional leadership – when to start with
EFAL
Early Perspectives: The situation at the start of Grade 1 23

Table 8: Average performance per subtask
Observations Mean S.D. s.e.
Naming the Animals (/12) 3 327 7.30 2.37 0.04
Word Recall (/14) 3 327 10.00 2.33 0.04
Non-word Recall (/5) 3 327 4.21 1.13 0.02
Phoneme Isolation (/6) 3 327 1.11 1.79 0.03
Story Comprehension (/4) 3 327 2.20 1.16 0.02
Letter Sound Recognition 3 327 4.62 5.01 0.09
Word Recognition 3 327 0.41 1.37 0.02
Sentence Reading 3 327 0.04 0.38 0.01
Visual Perception (/10) 3 327 1.55 1.64 0.03
English Vocabulary (/6) 3 327 0.82 1.03 0.02
Index Score 3 327 0.00 1.00 0.02
Table 9: Summary statistics per subtask
Observations p10 p25 p50 p75 p90 Min. Max.
Naming the Animals 3 327 4 6 7 9 10 0 12
Word Recall 3 327 7 9 10 12 13 0 14
Non-word Recall 3 327 3 4 5 5 5 0 5
Phoneme Isolation 3 327 0 0 0 2 4 0 6
Story Comprehension 3 327 1 1 2 3 4 0 4
Letter Sound Recognition 3 327 0 1 3 6 12 0 20
Word Recognition 3 327 0 0 0 0 1 0 6
Sentence Reading 3 327 0 0 0 0 0 0 6
Visual Perception 3 327 0 0 1 3 4 0 10
English Vocabulary 3 327 0 0 0 1 2 0 6
The Second Early Grade Reading Study24

Overall, the test did not seem to have any floor or ceiling effects, but in some of the subtasks these effects were seen. Learners scored particularly high on the pre-literacy tasks assessing expressive vocabulary and word and non-word recall, with learners at the 10th percentile managing to answer a few items correctly. These items were included specifically to allow for discrimination in learner performance among the weaker part of the learner performance distribution. The EGRA task assessing word recognition and sentence reading was clearly too difficult for the learners, with quite severe floor effects visible in the performance results on these tasks. This result is expected since learners are at the start of formal literacy instruction. Nonetheless, these items will assist in discriminating among the strongest learners. The letter sound recognition and story comprehension items both have a more normal distribution. While learners are not able to read words, they may have been exposed to letters in Grade R or at home. Overall the test seems to provide enough information to discriminate among learners at various parts of the performance distribution. Using Principal Component Analysis, the performance results on all the different subtasks are combined to give a single composite score.
Figure 12 shows the learner performance distribution for all learners, and it is encouraging to notice that this distribution has a good normal-curve shape which will allow the detection of a change in learning outcomes for all learners across the distribution. The sections to follow will describe the results of each subtask in more detail. Table 10 presents the correlation matrix for the subtasks in the baseline learner assessment. The floor effects in the word recognition and sentence reading assessment means that not enough information on learner performance has been captured in these tasks to calculate credible correlations. As expected, however, correlations were higher between word recall and non-word recall, and letter sound recognition and story comprehension. English vocabulary was more correlated with the first subtask (naming animals in the Home Language) and story comprehension, but there was very little correlation between English vocabulary and the word recall and non-word recall tasks. However, overall the correlations between the subtasks are not specifically high is indicating that there is quite a bit of noise in the baseline data.
Table 10: Subtest correlation matrix
1 2 3 4 5 6 7 8 9 10
Naming Animals 1.00
Word Recall 0.20 1.00
Non-word Recall 0.13 0.33 1.00
Phoneme Isolation 0.13 0.17 0.15 1.00
Story Comprehension 0.23 0.21 0.16 0.22 1.00
Letter Sound Recognition 0.10 0.10 0.08 0.37 0.13 1.00
Word Recognition 0.01 0.06 0.01 0.08 -0.02 0.36 1.00
Sentence Reading 0.05 0.02 0.01 0.11 0.06 0.17 0.17 1.00
Visual Perception 0.14 0.12 0.12 0.16 0.19 0.09 -0.08 0.03 1.00
English Vocabulary 0.20 0.09 0.08 0.19 0.21 0.18 0.01 0.08 0.13 1.00
Early Perspectives: The situation at the start of Grade 1 25

-5 0 5 10Composite Score
kernel = epanechnikov, bandwidth = 0.2450
Figure 12: Overall learner performance distribution
'
Den
sity
00
2
4
5
3
1
5 10 15Subscore 1: Naming Animals in HL
Figure 13: Histogram – Naming Animals
.0
1
2
3
4
0 5 10 15Subscore 2.1: Word Recall
Figure 14: Histogram – Word Recall
Table 11: Subtask 1 – Naming Animals
% Correct s.e.
Cow 93% 0.004
Chicken 93% 0.005
Dog 88% 0.006
Horse 74% 0.008
Duck or Bird 70% 0.008
Pig 63% 0.008
Goat 60% 0.008
Rabbit 55% 0.009
Donkey 39% 0.008
Sheep 38% 0.008
Lamb 6% 0.004
Cronbach: 0.6758
Subtask 1: Naming AnimalsThe first subtask of the learner assessment was an easy task that entailed learners looking at a picture of farm animals and naming each of the animals that they recognised in their Home Language. Overall, learners did quite well in this exercise, with learners in the 10th percentile at least managing to recognise four of the animals. On average, learners managed to name at least seven animals. Learners did, however, struggle to identify the lamb, which might be due to the colouring of the lamb in the picture resulting in the lamb being unclear.
Subtask 2: Word and Non-word RecallTwo subtasks, word recall and non-word recall were included to assess the learners’ phonological working memory in their Home Language. The ability to repeat real and non-words has been closely linked to vocabulary acquisition and growth (Gathercole, 2006). The first task required learners to repeat a sequence of Home Language words after the fieldworker, with the length of the sequence increasing with each item. The second task required learners to repeat non-words which follow the same language structure as the Home Language, with the words increasing in complexity in each item. Learners did quite well in this exercise, with the majority of learners managing to repeat on average 10 of the 14 words, and four of the five non-words. Learners at the 10th percentile managed to recall at least seven of the 14 words, and three of the five non-words.
The Second Early Grade Reading Study26

Subtask 3: Phoneme IsolationPhonological awareness is widely accepted as one of the most important cognitive skills for the acquisition of literacy. Phonological awareness is the ability to identify and manipulate the phonological structures (sounds) in words independent of their meaning. This skill is a prerequisite for reading as it enables learners to match letters to the sounds they represent. Learners who are slower at matching sounds to letters will understandably take longer to learn to read fluently. Although a large body of research exists for assessing the phonological awareness of learners in English, very little research exists on the assessment of this skill in African languages in general, but specifically the Nguni language group to which both isiZulu and Siswati belong. Diemer, et al. (2015) recently conducted research on the development of phonological awareness measures for isiXhosa and advocate the need for further research into phonological awareness measures in African languages. In the baseline learner assessment, phoneme isolation was used to evaluate the learners’ phonological awareness. This subtask required learners to provide the first sound of a word which was read out to the learner by the fieldworker. The ability to identify phonemes may emerge before the start of formal reading instruction, but generally it is accepted that this skill only develops further after learners are exposed to reading instruction (Adams, 1990). The latter may be the case in South Africa where there is not much research on this skill, and therefore less information for parents on how they can develop their child’s (pre) literacy skills in the Home Language. The words used in this task were words which are similar in Siswati and isiZulu, and therefore it is not expected that there will be any differences in learner achievement between the two languages.
When the fieldworkers administered this task, learners often only repeated the whole word after the fieldworker. It is, unfortunately, not clear whether this repetition was because the learners did not understand the task correctly and were therefore still using the same ‘rules of the game’ from the previous exercise (word recall or non-word recall), or whether it was that the learners just could not identify the initial sounds in the words.
Regardless of potential errors from the administration of the task, learners performed as would be expected for first graders: 63% of the learners could not identify a single sound, but some learners (about 13%) could identify three or more sounds. The average score out of six was 1.11. From Table 9 in section 4.2 it is evident that it is only at the 75th percentile that learners
Table 12: Subtask 2.1: Word Recall
isiZulu or Siswati % Correct
Cula/Cula 95%
Jika/Jika 97%
Vela/Vela 95%
Xoxa/Coca 88%
Qala/Cala 88%
Sika/Sala 91%
Itiye/Umlimi 79%
Indlebe/Indlebe 79%
Baleka/Baleka 85%
Indoda/Indvodza 58%
Izitsha/Inkhomo 46%
Umhlobo/Umhlobo 22%
Incwadi/Incwadzi 35%
Umntwana/Umntfwana 45%
Cronbach: 0.7496
Table 13: Subtask 2.2: Non-word Recall
isiZulu or Siswati Obser- vations
% Correct
s.e.
Mani/Mani 3 327 96% 0.004
Inxhovi/Inchoti 3 327 89% 0.005
Zonhlamvu/Temdzalu 3 327 85% 0.006
Noyiqoqo/Ofudlanga 3 327 77% 0.007
Qinisokisa/Ngiyagudziye 3 327 74% 0.008
Cronbach: 0.626
Table 14: Subtask 3: Phoneme Isolation
% Correct s.e.
/b/uka 20% 0.007
/g/ogo 22% 0.007
/w/ena 13% 0.006
/c/eba 22% 0.007
/dl/ala 17% 0.007
/ch/aza 16% 0.006
Cronbach: 0.864
Early Perspectives: The situation at the start of Grade 1 27

managed to successfully identify a phoneme. The manner of articulation of the sounds to be identified did not affect the learners’ ability to identify them.5
Subtask 4: Story ComprehensionSubtask 4 was a story comprehension that entailed the fieldworkers reading a short (five sentence) story to the learners in their Home Language, and asking four factual questions on what happened in the story. Fieldworkers were trained to only read the story to the learners once, and to read the story with expression. In general the learners did relatively well in this subtask with 81% of the learners successfully answering the first question of the task correctly. On average learners managed to answer two of the four questions correctly, and 14% of learners managed to answer all of the questions correctly.
Subtask 5: Letter Sound RecognitionLetter sound recognition is a key predictor of later reading success especially for Grade 1 English learners. This task can also be used to quantify learners’ previous print and reading instruction exposure: higher print and reading instruction exposure would result in more letters recognised.
The letter sound recognition assessment is based on the letter sound recognition assessment in the Early Grade Reading Assessment (EGRA). Given that the assessment was conducted at the start of Grade 1, it was adapted to include fewer letters, the letters which learners are most likely to be familiar with at the start of Grade 1, and to only be administered for 40 seconds (instead of 60 seconds). On average learners identified four to five letters in the 40 seconds, which translates to about six to seven letters per minute. Learners at the 10th percentile did not manage to identify a single letter, whereas learners at the 25th percentile managed to identify one letter and learners at the 90th percentile, 12 letters.
Subtasks 6 and 7: Word Recognition and Sentence ReadingSubtasks 6 and 7 assess learners’ ability to read words, in isolation and in sentences. Although it is not expected that learners will be able to decode or recognise words at this stage of their formal education, the task was included to identify learners at the upper distribution of performance, especially since previous reading skill accounts for unique variance in later reading skill.
5 Typically for English, the easiest sounds to identify would be fricatives (‘dl’), sonorants (‘w’), followed by plosives (‘b’). The jury is still out as to how this will apply to African languages.
0
1
2
3
4
Den
sity
0 2 4 6Subscore 3: Phoneme Isolationa
Figure 15: Histogram – Phoneme Isolation
00
2
4
6
8
1 2 3 4
Subscore 4: Story Comprehension
Den
sity
Figure 16: Histogram – Story Comprehension
Number of Letter Sounds Correct
Kernel density estimate
kernel = epanechnikov, bandwidth = 0.2450
0
0
1
0.5
1.5
5 10 15 20
Den
sity
Figure 17: Distribution of learner performance on Letter
Sound Recognition
The Second Early Grade Reading Study28

The learner assessment included six words which learners were asked to read. The words were no longer than four phonemes, and all followed the cvcv6 sound pattern which is characteristic of the Nguni language group. Once again, the words in the different language versions of the task were carefully chosen to be words which are very similar across the languages. Overall, the learners did very poorly in this task, with only learners in the 90th percentile managing to successfully read one word.
The sentence reading task required learners to read two short sentences which were assumed to be very familiar to learners at the start of Grade 1. Similar to the word recognition, learners scored very poorly in this subtask, with even learners in the 90th percentile not managing to read a single word in these sentences.
Subtask 8: Visual PerceptionThe penultimate task of the learner assessment comprised a ‘spot-the-difference’ task where learners were requested to identify the differences between two seemingly similar pictures. The task was included as an easier, fun, exercise, with the intention to boost the learners’ confidence a bit before the final English task. However, the learners struggled a lot more with
6 Consonant – vowel – consonant – vowel, for instance yena or bona.
this exercise than expected. Over a third of the learners did not manage to identify a single difference. Learners at the median managed to identify one difference, and learners at the 90th percentile managed to identify four differences.
Subtask 9: English Receptive and Expressive VocabularyThe purpose of the final task was to assess learners’ familiarity with English at the start of Grade 1. The learners were given the same picture of farm animals as the picture used in the first task of the learner assessment. To assess the learners’ receptive vocabulary, the first three questions required the fieldworkers to ask learners to point to specific animals in the picture. The instructions for the task were provided in the learners’ Home Language, but the animal name was read in English. For example: ‘Ngikhombe dog’.
The data shows that learners are not yet familiar with English animal names, and it can be assumed, English in general. Just less than a third of learners managed to correctly point to the first two animals (dog and chicken), but only 10% could point to the goat. The task assessing expressive vocabulary entailed the fieldworkers pointing
0%
10%
20%
30%
40%
0 1 2 3 4 5 6 7 8 9 10
Figure 18: Subtask 8 – Visual perception
Early Perspectives: The situation at the start of Grade 1 29

Table 15: English receptive and expressive vocabulary
Observations % Correct s.e.
Receptive vocabulary
Dog 3 324 32% 0.008
Chicken 3 324 30% 0.008
Goat 3 324 11% 0.005
Expressive vocabulary
Cow 3 324 5% 0.004
Pig 3 324 3% 0.003
Sheep 3 324 1% 0.002
7 Farm animals are introduced in the second term of Grade 1 in the DBE workbook.
to specific animals and asking the learners to name the animal in English. Very few learners could correctly name the animals in English, with only 5% of learners managing to name the cow, 3% the pig and 1% the sheep. These results suggest that at the start of Grade 1, learners are not yet familiar with basic farm animals in English.7 This in turn gives an indication of learners’ general familiarity of English at the start of school.
4�3 Balance Test
The main purpose of randomisation is to ensure that neither the intervention groups nor the control groups are inherently more prone to showing learning gains over the period of the study. Since this is the fundamental assumption upon which the RCT is based, it is necessary to check that the different groups of schools are balanced. As a first check, Figure 19 shows the learner performance distributions of the different intervention groups. From this figure it is evident that there are no distinguishable differences between the distributions. As a second check, Figure 20 shows the average learner performance in the different subtasks for each intervention group, also with no significant differences.
Furthermore, balance tests were conducted on each subtask to ensure that the sample is balanced. Table 16 shows the results based on regression analysis to test for balance. These tests evaluate whether the differences in learning outcomes among the different intervention groups are statistically significantly different from zero.
Each column in Table 16 is a separate regression run for each subtask on intervention indicators, controlling for strata and district fixed effects. The significant differences in the table will be represented by stars. For instance, the one statistically significant result in Table 16 is the performance on the ‘Naming the Animals’ subtask of the learners in the intervention 2 group, relative to the control group. The three stars indicate that this difference is significant at a 5% level. The final row in the table shows the p-value for the pair-wise test comparing the means between the two intervention groups (i.e. not the means of the intervention groups with the control group). A p-value of less than 0.05 would indicate that there is an imbalance between the two groups for the specific learning outcome. There are only two slight imbalances visible, but overall the samples are clearly balanced.
A short English proficiency task was administered to teachers. The main purpose of the task is to serve as a control in the learner regressions, but it also allows an additional balance check. Table 17 shows that the teachers in the various intervention groups are similar in their English proficiency. Although teacher English proficiency is not the focus of the interventions, it is likely that improved English proficiency might be the result of increased use of English during the lessons. The balance between the groups at the baseline means that any differences in teacher English proficiency in the wave 2 data collection could be ascribed as a secondary outcome of the interventions.
The Second Early Grade Reading Study30
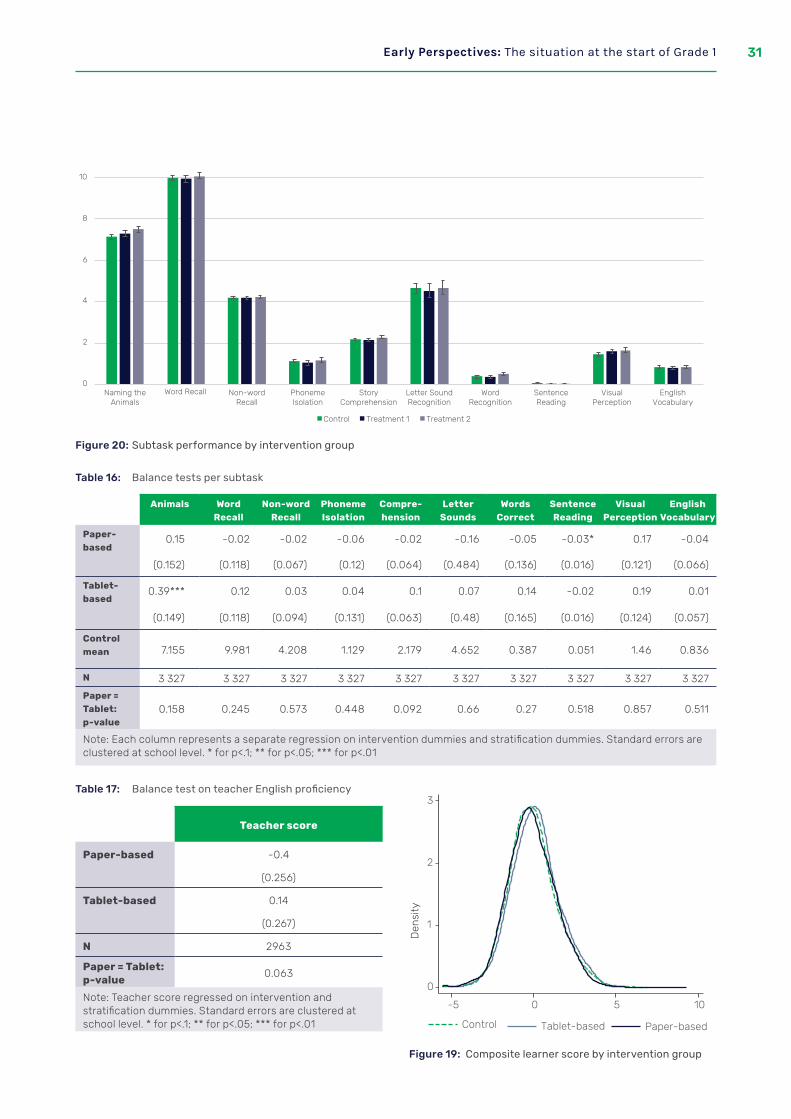
0
2
4
6
8
10
Naming theAnimals
Word Recall Non-wordRecall
PhonemeIsolation
StoryComprehension
Letter SoundRecognition
WordRecognition
SentenceReading
VisualPerception
EnglishVocabulary
Control Treatment 1 Treatment 2
Figure 20: Subtask performance by intervention group
Table 16: Balance tests per subtask
Animals Word Recall
Non-word Recall
Phoneme Isolation
Compre-hension
Letter Sounds
Words Correct
Sentence Reading
Visual Perception
English Vocabulary
Paper-based
0.15 -0.02 -0.02 -0.06 -0.02 -0.16 -0.05 -0.03* 0.17 -0.04
(0.152) (0.118) (0.067) (0.12) (0.064) (0.484) (0.136) (0.016) (0.121) (0.066)
Tablet-based
0.39*** 0.12 0.03 0.04 0.1 0.07 0.14 -0.02 0.19 0.01
(0.149) (0.118) (0.094) (0.131) (0.063) (0.48) (0.165) (0.016) (0.124) (0.057)
Control mean 7.155 9.981 4.208 1.129 2.179 4.652 0.387 0.051 1.46 0.836
N 3 327 3 327 3 327 3 327 3 327 3 327 3 327 3 327 3 327 3 327
Paper = Tablet: p-value
0.158 0.245 0.573 0.448 0.092 0.66 0.27 0.518 0.857 0.511
Note: Each column represents a separate regression on intervention dummies and stratification dummies. Standard errors are clustered at school level. * for p<.1; ** for p<.05; *** for p<.01
Table 17: Balance test on teacher English proficiency
Teacher score
Paper-based -0.4
(0.256)
Tablet-based 0.14
(0.267)
N 2963
Paper = Tablet: p-value
0.063
Note: Teacher score regressed on intervention and stratification dummies. Standard errors are clustered at school level. * for p<.1; ** for p<.05; *** for p<.01
0
1
2
3
Den
sity
-5 0 5 10
Control Paper-basedTablet-based
Figure 19: Composite learner score by intervention group
Early Perspectives: The situation at the start of Grade 1 31

4�4 Characteristics Correlated with Learner Test Scores
Table 18 shows the results of simple Ordinary Least Squares (OLS) regressions predicting the overall composite test score, as well as the number of letters read correctly.
The overall composite score is reported in terms of standard deviation, whereas the letter sounds are reported in letters read correctly within the 40 seconds time span. The regressions indicate that age is a significant predictor of learner performance: learners who were five years old or younger at the start of Grade 1 performed significantly poorer than their six-year-old peers. Learners who were seven years old, in turn performed better than their six-year-old peers. The language in which the learner took the test seems to have made a potential difference in the letter sound recognition. This is an interesting finding, given that the letter sound recognition task did not differ between the two languages and can therefore be regarded as a common item between the two instruments. This difference will be explored further in the section below. Learner gender does not seem to be a significant predictor of learner performance in the average score, but boys seem to have performed worse at letter sound recognition. A measure of socioeconomic status was included to control for household wealth. This indicator does not seem to explain as much of the variation in test scores as expected, but still shows that household wealth remains a predictor of learner outcomes even at the start of Grade 1. A district dummy was included which shows a slight difference in the overall score, but no difference in the letter sound recognition. However, overall the R-squared values are very low, which shows that we are not able to explain much of the variation in general. Given the low correlations between the subtasks, it seems that the information gained from the assessments might be quite noisy.
To further explore any potential language effects, the same regressions were run for each of the subtasks. Table 19 reports only the coefficients for the language and gender dummy, although learner age, caregiver age, caregiver education level, literacy practices in the home relating to reading to the child and speaking
English to the child, socioeconomic status and district effects were also included. The results show that, even after controlling for these factors, six of the nine subtasks have significant language differences. These differences, however, are not necessarily favourable to a single language: Siswati learners performed better than the isiZulu learners in phoneme isolation, letter sound recognition and English vocabulary, whereas isiZulu learners performed better in word recall, words read correctly and sentence reading.
As explained previously, the reformulation of the instrument was done in such a way as to ensure that the exact same word or sound was used where possible. This means that the letter sound recognition task is directly comparable between the two instruments. With regard to the phoneme isolation task, there was only one difference with the isiZulu assessment had the word ceba and the Siswati assessment the word liso. The Siswati version therefore had one easier item. Figure 21 indicates the percentage of learners who managed to successfully identify the initial sounds for each of the words. It is clear from this figure that a significantly higher proportion of learners managed to successfully identify the initial sounds of the common items as well, and that the one easier item is not the only item driving the language difference. The significant difference on the English subtask is specifically interesting as well, since this difference is apparent, even after controlling for the frequency of English spoken to the learner by the caregiver.
Although the language difference in the word reading and sentence reading tasks are significant, the performance in these two tasks are too low to make any substantial claims. When considering the word recall tasks, it is evident that the Siswati version is linguistically slightly more difficult, which does not allow a direct comparison of the items.
Gender effects are also visible in four of the subtasks, with boys performing better than girls in the naming of the animals, but girls performing better in non-word recall, phoneme isolation and letter sound recognition. This is concurrent to what has been found in EGRS I for Grade 1 learners in Setswana.
The Second Early Grade Reading Study32

Table 18: Learner characteristics correlated with baseline performance
Average score (SD) Letter sounds (letters correct)
(1) (2) (3) (4) (5) (1) (2) (3) (4) (5)
Learner age: 5 years or younger
-0.35*** -0.36*** -1.58*** -1.77***
(0.048) (0.047) (0.255) (0.249)
Learner age: 7 years
0.25*** 0.26*** 0.41 0.72***
(0.044) (0.046) (0.256) (0.246)
Learner age: older than 7 years
0.06 0.09 -0.55 -0.01
(0.104) (0.109) (0.464) (0.477)
Test language: isiZulu
0.06 -0.14 -1.16** -1.69***
(0.07) (0.091) (0.448) (0.634)
Gender: boy -0.04 -0.04 -0.74*** -0.74***
(0.035) (0.033) (0.171) (0.170)
SES -0.05*** -0.05*** -0.2* -0.18*
(0.018) (0.016) (0.107) (0.100)
SES-squared 0.01 0.01 -0.11 -0.06
(0.013) (0.013) (0.08) (0.074)
District dummy 0.16* 0.33
(0.079) (0.575)
N 3 327 3 327 3 327 3 281 3 281 3 327 3 327 3 327 3 281 3 281
Adjusted R2 0.035 0.001 0.000 0.004 0.044 0.018 0.011 0.005 0.002 0.043
Note: Each column represents a separate regression on learner age, gender, Home Language, socioeconomic background and district dummies. Standard errors are clustered at school level. * for p<.1; ** for p<.05; *** for p<.01
Early Perspectives: The situation at the start of Grade 1 33

Table 19: Learner characteristics correlated with learner performance per subtask
Na
min
g
An
ima
ls
Wo
rd R
ec
all
No
n-w
ord
R
ec
all
Ph
on
em
e Is
ola
tio
n
Co
mp
re-
he
nsi
on
Le
tte
r S
ou
nd
s
Wo
rds
Co
rre
ct
Se
nte
nc
e R
ea
din
g
Vis
ua
l P
erc
ep
tio
n
En
gli
sh
Vo
ca
bu
lary
Test language: isiZulu
-0.2 0.49*** 0.02 -0.44** -0.02 -1.63** 0.72*** -0.05* 0.19 -0.32***
(0.188) (0.184) (0.107) (0.17) (0.077) (0.663) (0.186) (0.028) (0.159) (0.098)
Gender: boy
0.65*** 0.04 -0.08* -0.18*** 0.02 -0.66*** -0.05 0 -0.03 0.01
(0.087) (0.098) (0.045) (0.066) (0.043) (0.186) (0.044) (0.015) (0.062) (0.039)
N3 281 3 281 3 281 3 281 3 281 3 281 3 281 3 281 3 281 3 281
Adjusted R2 0.115 0.01 0.011 0.033 0.013 0.049 0.055 0.005 0.028 0.057
Note: Each column represents a separate regression on learner age, socioeconomic background and district dummies. Standard errors are clustered at school level. * for p<.05; ** for p<.01; *** for p<.001.
0%
10%
20%
30%
b g w c / l dl ch
Siswati isiZulu
Figure 21: Language difference in phoneme isolation
Table 20 reports the regression results of guardian or parent characteristics on learner performance. As before, each column represents a different regression, with the final column including all the variables included. The results show that learner’s home characteristics play a significant role in predicting learner performance. The age of the learner’s mother does not seem to have any predictive value, whereas guardian’s education and reading practices at home are positively correlated to learner performance. Learners from households where the guardian did not complete matric performed poorer
than learners from households where the guardian did complete matric. Similarly, learners from households where they are read to every day performed significantly better than learners where reading happened less regularly (see Figure 22). For the English vocabulary task, the most significant predictor of learner performance was whether the guardian speaks English to the learner on a regular basis (see Figure 23).
The Second Early Grade Reading Study34

Table 20: Learner background factors correlated with baseline performance
Average score (SD) English vocabulary
(1) (2) (3) (4) (5) (1) (2) (3) (4) (5)
Mother or caregiver age0.00 0.00 0.00 0.01
(0.002) (0.002) (0.011) (0.013)
Did not complete matric -0.14*** -0.12** -0.36 -0.25
(0.042) (0.047) (0.224) (0.243)
Enrolled in or completed any further training
-0.05 -0.02 -0.04 0.03
(0.062) (0.065) (0.360) (0.382)
Read to child every day 0.09** 0.07 0.25 0.19
(0.042) (0.046) (0.235) (0.256)
Speaks English to the learner regularly
0.14** 0.12 0.25 -0.09
(0.067) (0.075) (0.317) (0.355)
Belief: responsible for reading
0.10** 0.07 0.40 0.29
(0.044) (0.049) (0.292) (0.319)
Test language: isiZulu -0.02 -1.23*
(0.096) (0.670)
N 3070 3047 3192 3140 2682 3070 3047 3192 3140 2682
R-Squared 0.000 0.004 0.004 0.002 0.014 0.000 0.001 0.001 0.001 0.013
Note: Each column represents a separate regression on intervention dummies and stratification dummies. The final model controls for district effects and learner socioeconomic status. Standard errors are clustered at school level. * for p<.1; ** for p<.05; *** for p<.01
-0.6
-0.4
-0.2
0
0.4
0.2
Never Once a week
Most days Every day
Sta
nda
rd D
evia
tion
s
Figure 22: Reading at home and learner performance
0
0,5
1
1,5
2
Never Sometimes Most of the time
Alll of the time
Sco
re o
ut
of 6
Figure 23: Speaking English at home and learner
performance
Early Perspectives: The situation at the start of Grade 1 35

Since the baseline assessment was conducted at the start of Grade 1, it is not expected that the school and teacher characteristics will have any direct correlation with learner performance, except for the aspects which might be a reflection of the community the learner
is from. Various factors which provide one with an indication of the general wealth and education levels in the community were included in the regressions, but none of these factors predicted any variation in the learner performance.
Table 21: Community level factors
Average score (SD)
Letter sounds (Letters per minute)
(1) (2) (3) (1) (2) (3)
Quintile 2 -0.01 0.15 -0.61 -1.07**
(0.131) (0.143) (0.486)
Quintile 3 -0.03 0.19 -0.29 -1.25**
(0.153) (0.168) (0.619)
Remote rural area 0.05 0.04 -0.18 0.01
(0.124) (0.145) (0.509)
Principal perception: at least 50% of parents have matric
0.05 0.11 0.15 -0.1
(0.116) (0.127) (0.423) (0.426)
Principal perception: 20–40% of parents employed
-0.28* -0.26* 0.88* 0.71
(0.142) (0.158) (0.488) (0.495)
Principal perception: 40–60% of parents employed
-0.27* -0.23 0.83 0.79
(0.163) (0.189) (0.584) (0.607)
Principal perception: > 60% of parents employed
-0.13 -0.05 0.53 0.29
(0.182) (0.182) (1.126) (1.141)
Gr 1 class enrolment 0.01 -0.03
(0.006) (0.017)
Multi-grade school -0.2 -0.6
(0.216) (0.841)
LoLT: isiZulu 0.12 -1.24*
(0.191) (0.634)
District dummy 0.31* -0.54
(0.182) (0.615)
N 3 271 3 271 2 911 3 327 3 327 2 963
R-squared 0.000 0.003 0.013 0.003 0.006 0.033
Note: Each column represents a separate regression on intervention dummies and stratification dummies. Standard errors are clustered at school level.* for p<.1; ** for p<.05; *** for p<.01
The Second Early Grade Reading Study36

During the first term of implementing the interventions, two issues emerged which might affect the sample balance. Firstly, one school was dropped from intervention 2 because it consistently failed to send the Grade 1 teacher to the initial teacher training. Secondly, in inviting the schools to the initial teacher training, confusion arose regarding two schools with the same name. This has meant that the incorrect school attended the teacher training. With regard to the first issue, the PMT decided to still include the school in the data collection for the ensuing waves of data collection, but that the school will be considered as a non-compliant school. With regard to the second issue, the mistake was only recognised later in the study after implementation was well underway, and it was therefore decided to continue with the implementation as has been done for the first part of the year. The PMT determined that the mix-up was merely an administrative mistake and therefore still considers the school allocation to be random. The concern however, lies with the impact that
8 The stratum allocation of the two schools was also swopped around. This decision essentially makes the assumption that the allocation of these schools to their new intervention status was random, and could have been based on the stratum they were allocated to. This ensures that the strata also remain equally sized.
this will have on future analysis. Both schools are in the Gert Sibande District, both schools are Quintile 1 schools and both schools were classified as low performers for the stratification. The original school was in stratum 6 (large Quintile 1 schools who are weaker performers), whereas the new intervention school is in stratum 2 (medium-sized schools from all quintiles who are weaker performers).
Sensitivity analyses will be conducted in all future reports to gauge the effect that this new allocation has on the final results. Table 22 shows the balance test results once the intervention status of the two schools was swopped.8 It is evident that this change does not affect the balance of the sample significantly, with only a minor additional imbalance in the visual perception task. This difference, however, does not influence the overall balance of the sample. A further test was done by dropping both schools from the sample, but this did not have any significant difference on the sample balance.
Table 22: Robustness check – reallocating intervention status
Na
min
g
An
ima
ls
Wo
rd
Re
ca
ll
No
n-w
ord
R
ec
all
Ph
on
em
e Is
ola
tio
n
Co
mp
re-
he
nsi
on
Le
tte
r S
ou
nd
s
Wo
rds
Co
rre
ct
Se
nte
nc
e R
ea
din
g
Vis
ua
l P
erc
ep
tio
n
En
gli
sh
Vo
ca
bu
lary
Paper-based
0.15 -0.01 -0.02 -0.06 -0.01 -0.19 -0.06 -0.03* 0.20* -0.02
(0.154) (0.118) (0.068) (0.12) (0.064) (0.486) (0.137) (0.016) (0.12) (0.067)
Tablet-based
0.39*** 0.12 0.03 0.04 0.1 0.06 0.13 -0.02 0.21 0.01
(0.149) (0.118) (0.095) (0.13) (0.063) (0.477) (0.164) (0.016) (0.125) (0.057)
Control mean 7.155 9.981 4.208 1.129 2.179 4.652 0.387 0.051 1.46 0.836
N 3 327 3 327 3 327 3 327 3 327 3 327 3 327 3 327 3 327 3 327
Paper = Tablet: p-value
0.154 0.259 0.557 0.448 0.101 0.649 0.26 0.507 0.965 0.594
5 Sensitivity Checks/
Early Perspectives: The situation at the start of Grade 1 37

Table 23: Specific USAID indicators
FY October 2015 – September 2016
FY October 2016 – September 2017
Indicator no
Indicators Target Actual Male Female Target Actual Male Female
ES. 1-1 Proportion of learners who, by the end of two grades of primary schooling, demonstrate that they can read and understand the meaning of grade level text
0% 0% 0% 0% 0% 0% 0% 0%
ES. 1-1a;b Percentage of learners
0% 0% 0% 0% 0% 0% 0% 0%
ES. 1-1c;d Numerator 0 0 0 0 0 0 0 0
ES. 1-1e;f Denominator 0 0 0 0 0 0 0 0
ES. 1-5 Number of learners reached in reading programmes at the primary level
0 0 0 0 7 000 7 600 4 114 3 486
ES. 1-7 Number of primary school educators who complete professional development activities on implementing evidence-based reading instruction with USG assistance
0 0 0 0 212 188 0 188
ES. 1-11 Number of primary school classrooms that receive a complete set of essential reading instructional materials with USG assistance
0 0 0 0 212 188 0 188
6 USAID Indicators/
The Second Early Grade Reading Study38

Table 24: Custom USAID indicators
FY October 2015 – September 2016
FY October 2016 – September 2017
Indicator no
Indicators Target Actual Male Female Target Actual Male Female
2.1. Proportion of teachers that attended each compulsory training session
0 0 0 0 95% 94% 0% 100%
2.2. Number of principals or HODs that attended each training session
0 0 0 0 50 27 1 26
2.3. Number teachers who attended needs-driven workshops
0 0 0 0 50 66 0 66
2.4. Average number of interactions between the virtual coach and a teacher
0 0 0 0 1 per week
1 per week
0 93
2.5. Average number of visits a teacher receives from a reading coach
0 0 0 0 1 per month
0.75 per month
0 93
2.6. Comparison of baseline and endline scores
0 0 0 0 0 0 0 0
3.1. Number of learner background questionnaires completed, as well as actual data
0 0 0 0 3 500 3 327 1 801 1 526
3.2. Number of teacher questionnaires completed, as well as actual data
0 0 0 0 360 320 0 320
3.3. Number of principal questionnaires completed, as well as actual data
0 0 0 0 180 180 98 82
4.1. Number and details of key stakeholders involved in planning
10 0 0 0 5 4 2 2
4.2. Number and details of research dissemination sessions with provinces and schools
0 0 0 0 5 4 . .
4.3. Number and details of reports, journal articles and conferences
0 0 0 0 0 0 0 0
Early Perspectives: The situation at the start of Grade 1 39

Interventions continued throughout 2017, with the initial training having been conducted just after the conclusion of the baseline data collection. Teachers further attended clustered workshop training for one day at the start of each term, and the reading coaches provided continuing support throughout the year. The midline data collection
took place from 23 October to 10 November 2017 to provide the data necessary to determine the impact of the interventions after one year of implementation. The interventions were set to continue to Grade 2 teachers in 2018, and the same learners would be tested at the end of Grade 2 in 2018.
7 Next Steps in the Project/
The Second Early Grade Reading Study40

References
Adams, M., 1990. Beginning to Read: Thinking and Learning about Print. Cambridge: MIT Press.
Aploon-Zokufa, K., 2013. Locating the difference: A comparison of pedagogic strategies in high and low performing schools. South African Journal of Childhood Education, 3(2), p. 112–130.
Boakye, N. A. N. Y., 2012. A socio-affective approach to improving students’ reading comprehension abilities, Pretoria: Faculty of Humanities. University of Pretoria.
Coe, R. A. C. H. S. M. L., 2014. What makes great teaching? Review of the underpinning research, London: Sutton Trust.
Diemer, M., Van der Merwe, K. & De Vos, M., 2015. The development of phonological awareness literacy measures for isiXhosa. South African Linguistics and Applied Language Studies, 33(3), p. 325–341.
DPME, 2017. CAPS Implementation Evaluation, Pretoria: Department of Planning, Monitoring and Evaluation.
Duke, N., 2000. For the Rich It’s Richer: Print Experiences and Environments Offered to Children in Very Low- and Very High-Socioeconomic Status First-Grade Classrooms. American Educational Research Journal, 37(2), p. 441–478.
Fleisch, B. & Christie, P., 2004. Structural Change, Leadership and School Effectiveness/Improvement: Perspectives from South Africa. Discourse: Studies in the Cultural Politics of Education, 25(1), pp. 95-112.
Fleisch, B. & Schoër, V., 2014. Large-scale instructional reform in the Global South: Insights from the mid-point evaluation of the Gauteng Primary Language and Mathematics Strategy. South African Journal of Education, 34(3), p. 1–34.
Fleisch, B. T. S., Schoër, V. & Mabogoane, T., 2017. Failing to catch up in reading in the middle years: The findings of the impact evaluation of the Reading Catch-Up Programme in South Africa. International Journal of Educational Development, 53(1), p. 36–47.
Gathercole, S., 2006. Nonword repetition and word learning: The nature of the relationship. Applied Psycholinguistics, Volume 27, p. 513–543.
Hill, H., Charalambos, Y. & Kraft, M., 2012. When Rater Reliability Is Not Enough: Teacher Observation Systems and a Case for the Generalizability Study. Educational Researcher, p. 56–64.
Hoadley, U., 2012. What do we know about teaching and learning in South African primary schools?. Education as Change, 16(2), p. 187–202.
Hoadley, U. & Galant, J., 2016. Specialisation and school organisation: Investigating pedagogic culture. British Journal of Sociology and Education, 37(8), p. 1187–1210.
Howie, S. et al., 2012. PIRLS 2011 South African Children’s reading literacy achievement: Summary Report, Pretoria: Centre for Evaluation and Assessment, University of Pretoria.
Macdonald, C., 2006. The properties of mediated action in three different literacy contexts in South Africa. Theory and Psychology, 16(1), p. 51–80.
Matjila, D. & Pretorius, E., 2004. Bilingual and Biliterate? An exploratory study of Grade 8 reading skills in Setswana and English. Per Linguam, 20(1), p. 1–21.
McDonald Connor, C., 2002. Are children still swimming up the waterfall? A look at literacy development in the new curriculum. Language Matters, 33(1), p. 111–141.
McDonald Connor, C. et al., 2009. The ISI Classroom Observation System: Examining the Literacy Instruction Provided to Individual Students. Educational Researcher, 38(2), p. 85–99.
Early Perspectives: The situation at the start of Grade 1 41

NEEDU, 2013. National Report 12. The state of literacy teaching and learning in the Foundation Phase, Pretoria: Department of Basic Education .
Nonoyama-Tarumi, Y. & Bredenberg, K., 2009. Impact of school readiness program interventions on children’s learning in Cambodia. International Journal of Educational Development, 29(1), p. 39–45.
Piper, B., Zuilkowski, S. & Mugenda, A., 2014. Improving reading outcomes in Kenya: First-year effects of the PRIMR Initiative. International Journal of Education Development, 37(1), p. 11–21.
Pretorius, E. & Currin, S., 2010. Do the rich get richer and the poor poorer? The effects of an intervention programme on reading in the home and schools language in a high poverty multilingual context.. International Journal of Educational Development, 30(1), p. 67–76.
Pretorius, E. & Lephala, M., 2011. Reading Comprehension in High-Poverty Schools: How should it be taught and how well does it work?. Per Linguam, 27(2), p. 1–24.
Pretorius, E. & Mokhwesana, M., 2009. Putting reading in Northern Sotho on track in the early years: Changing resources, expectations, and practices in a high poverty school. South African Journal of African Languages, 1(1), p. 54–73.
Raudenbush, S., 2005. Learning from attempts to improve schooling: The contribution of methodological diversity. Educational Researcher, 34(5), p. 25–31.
Reeves, C. et al., 2008. Evaluation of literacy teaching in primary schools in Limpopo, Polokwane: Limpopo Department of Education.
Snilstveit, B. et al., 2016. The impact of education programmes on learning and school participation in low- and middle-income countries: a systematic review summary report, 3ie Systematic Review Summary 7, London: International Initiative for Impact Evaluation (3ie).
Spaull, N., 2016. Learning to Read and Reading to Learn. Policy Brief. Research on Socioeconomic Policy (RESEP): (Online). Available: www.resep.sun.ac.za.
Taylor, N., 2007. Equity, efficiency and the development of South African schools. In: T. Townsend, ed. International Handbook of School Effectiveness and Improvement. Springer International Handbooks on Education. Dordrecht: Springer.
Taylor, N., Van der Berg, S. & Mabogoane, T., 2013. Creating Effective Schools. Cape Town: Pearson Education South Africa.
Taylor, S., 2011. Uncovering indicators for effective school management in South Africa using the National School Effectiveness Study. Stellenbosch Working Paper Series: 10/11.
Taylor, S., 2013. Modelling educational achievement. In: N. Taylor, S. Van der Berg & T. Mabogoane, eds. Creating effective schools. Cape Town: Pearson Education South Africa, p. 63–101.
Taylor, S. & Watson, P., 2015. The impact of the study guides on “matric” performance: Evidence from a randomised experiment. Stellenbosch Economic Working Papers: 13/15.
Van der Berg, S., 2009. Fiscal incidence of social spending in South Africa. Stellenbosch Working Paper Series: 10/09.
The Second Early Grade Reading Study42

Tel: (021) 486 7000
Fax: (021) 461 8110
Call Centre: 0800 202 933
222 Struben Street, Pretoria, 0001
Private Bag X985, Pretoria, 0001
Private Bag X9035, Cape Town, 8000
www�education�gov�za
www�facebook�com/BasicEd
www�twitter�com/dbe_sa