Embed Size (px)
Citation preview
1
Early prediction of disease progression in small-cell lung cancer: Towards
model-based personalized medicine in oncology
Authors: Núria Buil-Bruna1, Tarjinder Sahota2, José-María López-Picazo3, Marta
Moreno-Jiménez4 , Salvador Martín-Algarra3 , Benjamin Ribba5 and Iñaki F. Trocóniz1
Affiliations:
1, Department of Pharmacy and Pharmaceutical Technology, School of Pharmacy;
University of Navarra, IdiSNA Navarra Institute for Health Research, Pamplona, Spain
2, Clinical Pharmacology Modelling and Simulation, GSK, United Kingdom
3, Department of Medical Oncology, University Clinic of Navarra, University of Navarra,
IdiSNA Navarra Institute for Health Research, Pamplona, Spain
4, Department of Radiation Oncology, University Clinic of Navarra, University of
Navarra, IdiSNA Navarra Institute for Health Research, Pamplona, Spain
5, INRIA, Ecole Normale Supérieure de Lyon, Lyon, France.
Author for correspondence: Iñaki F. Trocóniz. Department of Pharmacy and
Pharmaceutical Technology, School of Pharmacy, University of Navarra, Pamplona
31080, Spain. Telephone: +34 948 42 56 00 ext. 806507; Fax: +34 948 42 57 40; e-mail:
Number of references/figures/tables: 24/6/1
Key words: biomarkers, early prediction of disease progression, personalized medicine,
pharmacometrics, non-linear mixed effects
on May 30, 2020. © 2015 American Association for Cancer Research. cancerres.aacrjournals.org Downloaded from
Author manuscripts have been peer reviewed and accepted for publication but have not yet been edited. Author Manuscript Published OnlineFirst on May 4, 2015; DOI: 10.1158/0008-5472.CAN-14-2584
2
Running title: Model-based personalized disease monitoring
Financial support: NB-B was supported by a pre-doctoral fellowship from Asociación de
Amigos de la Universidad de Navarra. This work was supported by the Innovative Medicines
Inniative Joint Undertaking under grant agreement no. 115156, resources of which are
composed of financial contributions from the European Union’s Seventh Framework
Programma (FP7/2007-2013) and EFPIA companies’ in-kind contribution. The DDMoRe project
is also supported by financial contribution from academic and SME partners. This work does
not necessarily represent the view of all DDMoRe partners.
Disclosure of Potential Con�icts of Interest: No potential con�icts of interest were disclosed
on May 30, 2020. © 2015 American Association for Cancer Research. cancerres.aacrjournals.org Downloaded from
Author manuscripts have been peer reviewed and accepted for publication but have not yet been edited. Author Manuscript Published OnlineFirst on May 4, 2015; DOI: 10.1158/0008-5472.CAN-14-2584
3
ABSTRACT��
Predictive biomarkers can play a key role in individualized disease monitoring. Unfortunately,
the use of biomarkers in clinical settings has thus far been limited. We have previously shown
that mechanism-based pharmacokinetic/pharmacodynamic modeling enables integration of
non-validated biomarker data to provide predictive model-based biomarkers for response
classification. The biomarker model we developed incorporates an underlying latent variable
(disease) representing (unobserved) tumor size dynamics, which is assumed to drive biomarker
production and to be influenced by exposure to treatment. Here we show that by integrating
CT scan data, the population model can be expanded to include patient outcome. Moreover,
we show that in conjunction with routine medical monitoring data, the population model can
support accurate individual predictions of outcome. Our combined model predicts that a
change in disease of 29.2% (RSE 20%) between two consecutives CT scans (i.e. 6-8 weeks)
gives a probability of disease progression of 50%. We apply this framework to an external
dataset containing biomarker data from 22 small cell lung cancer patients (four progressing
during follow up). Using only data up until the end of treatment (a total of 137 LDH and 77 NSE
observations), the statistical framework prospectively identified 75% of the individuals as
having a predictable outcome in follow up visits. This included two of the four patients who
eventually progressed. In all identified individuals, the model predicted outcomes matched the
observed outcomes. This framework allows at risk patients to be identified early and
therapeutic intervention/monitoring to be adjusted individually, which may improve overall
patient survival.
on May 30, 2020. © 2015 American Association for Cancer Research. cancerres.aacrjournals.org Downloaded from
Author manuscripts have been peer reviewed and accepted for publication but have not yet been edited. Author Manuscript Published OnlineFirst on May 4, 2015; DOI: 10.1158/0008-5472.CAN-14-2584

4
MAJOR�FINDINGS��
We propose a framework based on non-linear mixed effects modeling to individualize disease
monitoring in small cell lung cancer patients. We use data routinely collected during first line
treatment (two biomarkers and CT scan outcomes) to obtain probabilities of disease
progression in follow-up visits. We propose a model-based framework that can be used to
identify at risk patients early for individualization of therapeutic intervention and monitoring.
This framework can be applied to other biomarkers and/or type of cancers in order to aid
personalization of disease monitoring in oncology.
on May 30, 2020. © 2015 American Association for Cancer Research. cancerres.aacrjournals.org Downloaded from
Author manuscripts have been peer reviewed and accepted for publication but have not yet been edited. Author Manuscript Published OnlineFirst on May 4, 2015; DOI: 10.1158/0008-5472.CAN-14-2584

5
INTRODUCTION�
Lung cancer (LC) is the leading cause of cancer mortality around the world (1-3). In the United
States and Europe, small cell lung cancer (SCLC) accounts for 13 to 20% of all new cases and
deaths from LC (4, 5). Treatment of SCLC is based on chemotherapy and radiotherapy. In the
last 30 years, few therapeutic strategies have been successful in clinical trials (6) and many
important questions regarding effective treatment strategies remain open (7, 8). These include
the duration of the treatment, the role of maintenance and consolidation therapies, the role of
chemoradiotherapy, alternative combination chemotherapy agents and dose intensification.
While responses rates (RRs) to first-line treatment (generally combinations of platinum
compound and etoposide) are high, RRs to second-line treatment are generally lower due to
rapid onset of resistance (9). Amongst other factors, RRs to second-line depend on the time
elapsed between the end of first-line treatment and the detection of disease recurrence (9).
Therefore, early identification of the individual risk of disease recurrence is a key component
of effective clinical management.
Prognosis of untreated patients with SCLC is poor, with a median survival of 2 to 4 months
after diagnosis. Currently, the main prognostic factor of SCLC is the disease stage at diagnosis
(10). The most widely used staging classification is the dichotomous system developed by the
Veterans Administration Lung Study Group (VALG). This method classifies patients with
limited-stage disease (LD) (those with tumor confined to the hemithorax of origin, the
mediastinum, or the supraclavicular lymph nodes) and extensive-stage disease (ED) (those
whose tumor has spread outside these limits) (11). SCLC is characterized by its fast growth and
rapid onset of widespread metastases where approximately 30% of patients with SCLC are
diagnosed as limited-stage and the remaining 70% as extensive-stage (4). The median survival
for LD SCLC is 14-20 months, and the 2- and 5-year survival rates are 30% and 10%,
respectively. For ED SCLC, median survival is 9-12 months, and survival after two years occurs
on May 30, 2020. © 2015 American Association for Cancer Research. cancerres.aacrjournals.org Downloaded from
Author manuscripts have been peer reviewed and accepted for publication but have not yet been edited. Author Manuscript Published OnlineFirst on May 4, 2015; DOI: 10.1158/0008-5472.CAN-14-2584

6
in less than 5% of patients (4). In addition to stage at diagnosis, performance status and other
clinical parameters such as age, gender and number and location of metastatic tumors, have
been proposed as predictive and prognostic factors (12-15).
Existing methods to detect disease progression in SCLC and most solid tumors generally rely on
CT scans, where the change in the sum of longest diameters (SLD) is assessed. In particular, the
RECIST criteria define disease progression as change of 20% in SLD or appearance of new
metastases (16). Recommendations during follow up of SCLC include a CT scan every two to
three months (9, 17). This follow-up strategy, however, means that significant disease
progression can already occur even before the recurrent disease is detected. In a retrospective
study, Sugiyama et al. showed that a more intensive follow-up strategy in SCLC patients that
had achieved response to first line treatment resulted in significantly higher post relapse
survival and overall median survival compared to non-intensive follow-up patients (18).
However, more intensive follow up programs may not be necessary for all patients since early
identification of high risk patients may enable targeted monitoring programs to ultimately
improve individual patient survival.
The use of circulating biomarkers has been proposed for predicting patient outcome. However,
despite the easy collection of those biomarkers in many tumor types, their use has had limited
uptake due to the lack of validated markers of disease progression (19). One of the reasons is
that establishing the link between biomarkers and tumor progression is not a trivial task. The
prevailing strategy has been to use simple univariate and multivariate analysis to determine
biomarker relevance. With SCLC, elevation of serum lactate dehydrogenase (LDH) is found in
half of patients, and up to 85% of patients with ED (10, 20). Some studies have also proposed
other biomarkers which may have prognostic significance, namely neuron-specific enolase
(NSE), chromogranin, circulating tumor cells and progastrin-releasing peptide (21-23).
However, the prognostic and predictive value of these biomarkers has not been widely
on May 30, 2020. © 2015 American Association for Cancer Research. cancerres.aacrjournals.org Downloaded from
Author manuscripts have been peer reviewed and accepted for publication but have not yet been edited. Author Manuscript Published OnlineFirst on May 4, 2015; DOI: 10.1158/0008-5472.CAN-14-2584

7
accepted in the context of standard clinical practice and therefore their use as predictive
biomarkers has been limited (24). The empirical methods used to assess these biomarkers,
however, may not provide an accurate representation of their utility since appropriate
assessment of the predictive capacity of biomarkers should be in the context of mechanistic
models (25-27). Indeed, we have previously shown that when these biomarkers are integrated
into a mechanistic model of disease time-course, model-based disease predictions showed
high correlation with outcome (28). These models allow for time-dependent and nonlinear
relationships between biomarker and outcome to be accounted, which may not be detected
by a simple assessment of correlation. Mechanistic models also allow data from multiple
biomarkers to be integrated together to obtain improved predictors of response. With SCLC
we found that model-based disease predictions showed higher correlation with outcome than
either biomarker individually.
The traditional approach for using markers for individual prediction generally relies on the
comparison of biomarker levels with an established cut off value (e.g. derived from ROC
analysis). Indeed, our previously developed SCLC biomarker model could have been used in
this manner for individual prediction. However, with cut off approaches, individuals with
similar disease profiles may have very different predictions of outcome if they lie close to the
cut-off value. This unsatisfactory situation arises because a cut-off approach describes risk as a
dichotomous rather than continuous variable. In contrast, a probabilistic model-based
approach allows the continuous disease-risk relationship to be accurately modeled and
provides quantitative predictions of individual risk. Patients predicted to have high
probabilities of disease progression may therefore be provided with alternative therapeutic
strategies whilst patients predicted to have less certain outcomes may be more intensively
monitored.
on May 30, 2020. © 2015 American Association for Cancer Research. cancerres.aacrjournals.org Downloaded from
Author manuscripts have been peer reviewed and accepted for publication but have not yet been edited. Author Manuscript Published OnlineFirst on May 4, 2015; DOI: 10.1158/0008-5472.CAN-14-2584
8
Based on the above considerations, the main objective is to develop a framework which allows
at risk patients to be identified early so that therapeutic intervention and monitoring can be
individualized. We use our previously reported biomarker model (28) to develop and illustrate
this framework in SCLC.
�METHODS
Data
Two datasets were available: a training and an external dataset. The training data was identical
to the data used to develop and assess the previously reported biomarker model (28). The
external dataset was retrospectively collected from the medical records of 22 patients
diagnosed in the University Hospital of Navarra (Pamplona, Spain) between 2012 and 2014.
We included all treatment-naïve SCLC patients (as determined by histological examination)
receiving first line chemotherapy (i.e. etoposide plus either cisplatin or carboplatin). No
patients satisfying these inclusion criteria were excluded from the analysis. Figure 1a depicts
standard treatment and follow-up periods. Treatment typically included six chemotherapy
cycles given every three weeks. Some patients also received concomitant radiotherapy in the
primary tumor (hemithorax). Tumor assessments were performed with computed tomography
(CT) before the commencement of therapy, between the second and third cycles of
chemotherapy, at the end of the entire course of chemotherapy, and every second/third
month thereafter in follow-up exams. Clinical outcome was categorized according to modified
RECIST criteria, where the sum of the longest diameters is compared with the value of the
previous CT scan. Since the medical records did not contain the exact tumor size
measurements, only the derived RECIST categories were used in the data analysis. Biomarker
(LDH and NSE) samples used to externally validate the model were obtained during the
treatment period. The time courses of LDH and NSE are shown in Supplementary Figure S1.
on May 30, 2020. © 2015 American Association for Cancer Research. cancerres.aacrjournals.org Downloaded from
Author manuscripts have been peer reviewed and accepted for publication but have not yet been edited. Author Manuscript Published OnlineFirst on May 4, 2015; DOI: 10.1158/0008-5472.CAN-14-2584

9
The external dataset included a total of 137 LDH and 77 NSE observations during treatment
period and a total of 78 CT scans, obtained during both treatment and follow-up periods. Out
of the 22 patients, 7 patients (31.8%) had CT scans with disease progression (with 3 patients
progressing just after finishing first line treatment). A more detailed description of the data can
be found in Table 1 which lists also the patients and study characteristics of the training
dataset.
Overview
We have previously developed a population model describing the dynamics of LDH and NSE in
SCLC patients (28). A schematic view of the published biomarker model and model equations
can be found in supplementary Figure S2. In the present work, we extend this biomarker
model with a logistic model to link model predictions from the biomarker model with clinical
outcome (observed disease progression). We then perform an external validation of both the
biomarker and the logistic models. We then used the combined biomarker/logistic model to
predict, at the end of first line treatment, individual probabilities of disease progression in
follow-up periods. Figure 1b shows a schematic diagram of the workflow.
Biomarker model and external validation
Our previously published semi-mechanistic model for NSE and LDH dynamics has not yet been
assessed using an external data set (28). We therefore used the newly acquired external
dataset to perform an external validation of biomarker predictions in these new patients.
External validation of the biomarker model at the individual level was based on basic goodness
of fit (GOF) plots. Individual parameters for the new set of patients were obtained in NONMEM
7.2 (29) by evaluating the empirical Bayes estimates (EBEs). EBEs are conditional estimates of
an individual’s model parameters given the parameter estimates from the population model
(28), the individual observations (LDH and NSE concentrations), and covariate information
(radiotherapy and G-CSF therapy) from patients in the external dataset.
on May 30, 2020. © 2015 American Association for Cancer Research. cancerres.aacrjournals.org Downloaded from
Author manuscripts have been peer reviewed and accepted for publication but have not yet been edited. Author Manuscript Published OnlineFirst on May 4, 2015; DOI: 10.1158/0008-5472.CAN-14-2584
10
The external validation at the population level was based on simulation-based diagnostics,
namely prediction- and variability-corrected visual predictive checks (pvc-VPCs) (30) as
implemented in PsN (31). Briefly, VPCs evaluate the model’s ability to describe the central
tendency and variability in the observed data by comparison of the observed quantiles to the
quantiles of the simulated datasets. We produced pvc-VPCs by simulating 1000 replicate
datasets with the same characteristics of the external data set (i.e. patient numbers, sample
times, intervention and covariate information) by sampling new sets of individual parameters
from the estimated population parameter distributions (28).
Model for RECIST outcome
RECIST data were dichotomized into two categories (disease progression and non-disease
progression) and analyzed using by logistic regression. We fit a linear logit model to relate the
probability of having disease progression at the CT scans to the model predicted changes in
disease (equation 1) between each CT scan and its previous CT scan. The logit transformation
(equation 2) assures that the probability of having disease progression as outcome of a CT scan
will fall between 0 and 1.
Di,j is the predicted disease level for patient j at observation point (CT scan) i, and �Di,j is the
predicted change in disease level for patient j between observation point i and i+1 (i.e., the
following CT scan, approximately 8 weeks later). P(DPij|η) represents the probability of disease
progression in the jth individual at the ith measurement (CT scan), � is a subject level random
�ji
jijiji D
DDD
�
���
�
−=Δ +
� ����
��
�����jjiL
L
ji DLeeDPP ηθθη +Δ×+=
+= ���� �
����
on May 30, 2020. © 2015 American Association for Cancer Research. cancerres.aacrjournals.org Downloaded from
Author manuscripts have been peer reviewed and accepted for publication but have not yet been edited. Author Manuscript Published OnlineFirst on May 4, 2015; DOI: 10.1158/0008-5472.CAN-14-2584
11
effect (normally distributed with mean 0 and variance OMEGA) describing inter-patient
variability in the probability of disease progression, θ1 is the intercept parameter and θ2 is the
slope parameter. To obtain meaningful initial parameter estimates, θ1 and θ2, were
parameterized in terms of �D80 and �D50, which describe the �D predicted to cause a 50% and
80% probability of disease progression [P(DP)], respectively. Thus, the intercept and the slope
take the form of θ1=- �D50 x θ2 and θ2= log(4)/(�D80 - �D50).
The logistic model was obtained using the CT scans from treatment and follow-up periods of
patients belonging to the training dataset. Model parameters were estimated in NONMEM 7.2
using the SAEM algorithm (29). Model evaluation was based on the construction of VPCs, in a
similar manner to the biomarker model evaluation. The VPC compared the observed
proportion of patients showing disease progression in each CT scan with the model predicted
distribution of the same proportion attained in 1000 simulated datasets. Since a model may
perform well at the population level (i.e. it may predict well the proportion of patients
progressing at each CT scan) but it may perform poorly with individual patient prediction, we
also evaluated the predictive accuracy of the model at the individual level. This was achieved
by applying the framework detailed in the next section (Individual early prediction of disease
progression) but modified to use all data available (i.e. biomarker and CT scans outcomes). The
final output was a graphical comparison of the predicted individual distribution of P(DP) with
the actual outcome of each CT scan.
Individual early prediction of disease progression
To simulate decision making after completion of first line treatment, we evaluated P(DP)
predictions of the first two follow-up CT scans (i.e. the period 6 months after end of treatment)
using data up to the end of first line treatment, by comparing the predicted P(DP) distributions
at the first and the second follow-up CT scans with the observed CT scan outcomes.
on May 30, 2020. © 2015 American Association for Cancer Research. cancerres.aacrjournals.org Downloaded from
Author manuscripts have been peer reviewed and accepted for publication but have not yet been edited. Author Manuscript Published OnlineFirst on May 4, 2015; DOI: 10.1158/0008-5472.CAN-14-2584
12
Biomarker (LDH and NSE) samples from patients in the external dataset obtained during the
treatment period were used to create patient-specific disease profiles during treatment and
follow-up using the Bayesian algorithm in NONMEM 7.2 (31). Changes in the distribution of
predicted disease levels were computed in accordance with equation 1. The logistic model was
then used to convert predicted changes in disease levels to probabilities of disease progression
at the times where CT scans were collected (equation 2). In order to account for uncertainty in
population and individual model parameters, we obtained the full uncertainty distribution of
P(DP) predictions for each individual using Markov chain Monte Carlo (MCMC) evaluation in
NONMEM 7.2 (29). In total, 1000 MCMC samples were obtained from the stationary
distribution with Gibbs sampling to obtain individual uncertainty distributions.
on May 30, 2020. © 2015 American Association for Cancer Research. cancerres.aacrjournals.org Downloaded from
Author manuscripts have been peer reviewed and accepted for publication but have not yet been edited. Author Manuscript Published OnlineFirst on May 4, 2015; DOI: 10.1158/0008-5472.CAN-14-2584
13
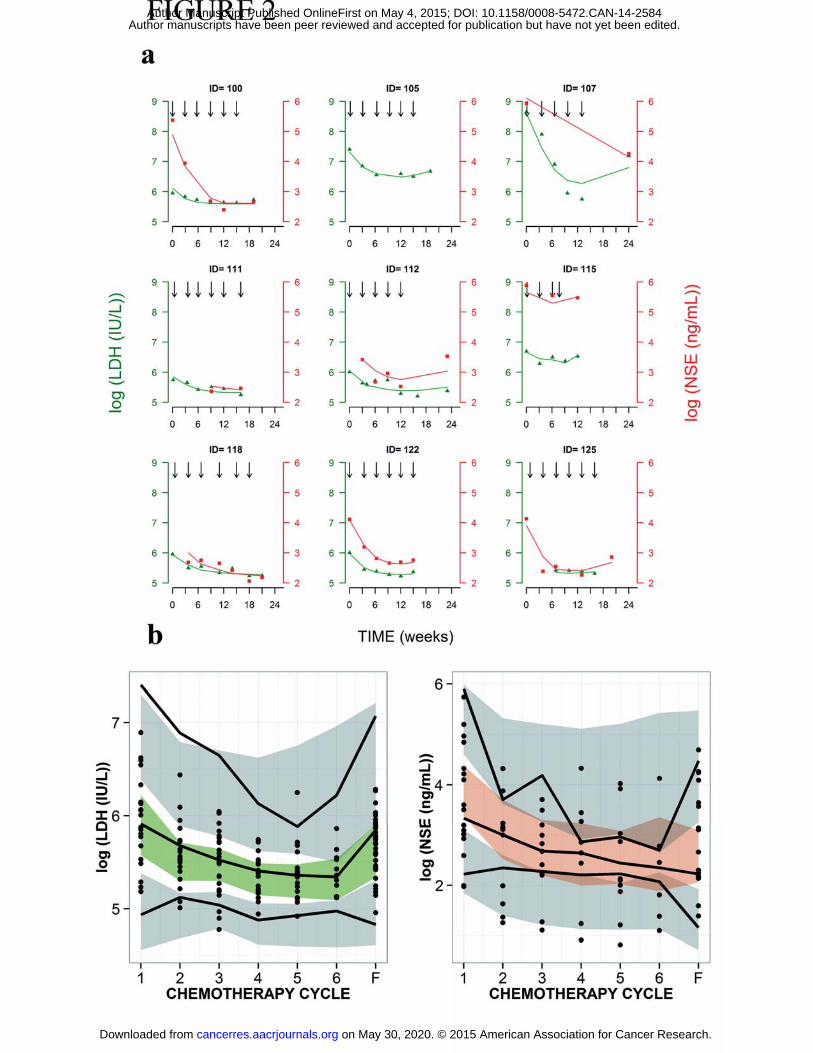
RESULTS�Biomarker model and external validation
Results of the external validation (individual and population level) of the previously developed
biomarker model (28) are shown in Figure 2 and indicate that individual profiles (2a), typical
tendencies and data dispersion (2b) are well captured by the model.
Model for RECIST outcome
Predicted P(DP) was obtained by logistic regression where the expression for the logit included
a linear function of �Di,j and �Di,j is the change in predicted disease between two consecutive
CT scans using the biomarker model (28). Estimation of inter-patient variability in the logistic
model was not supported by the data. The estimates of the transformed parameters (see
Methods) �D50 and �D80 were 0.292 and 0.510 with relative standard errors of 20.2% and
30.2%, respectively.
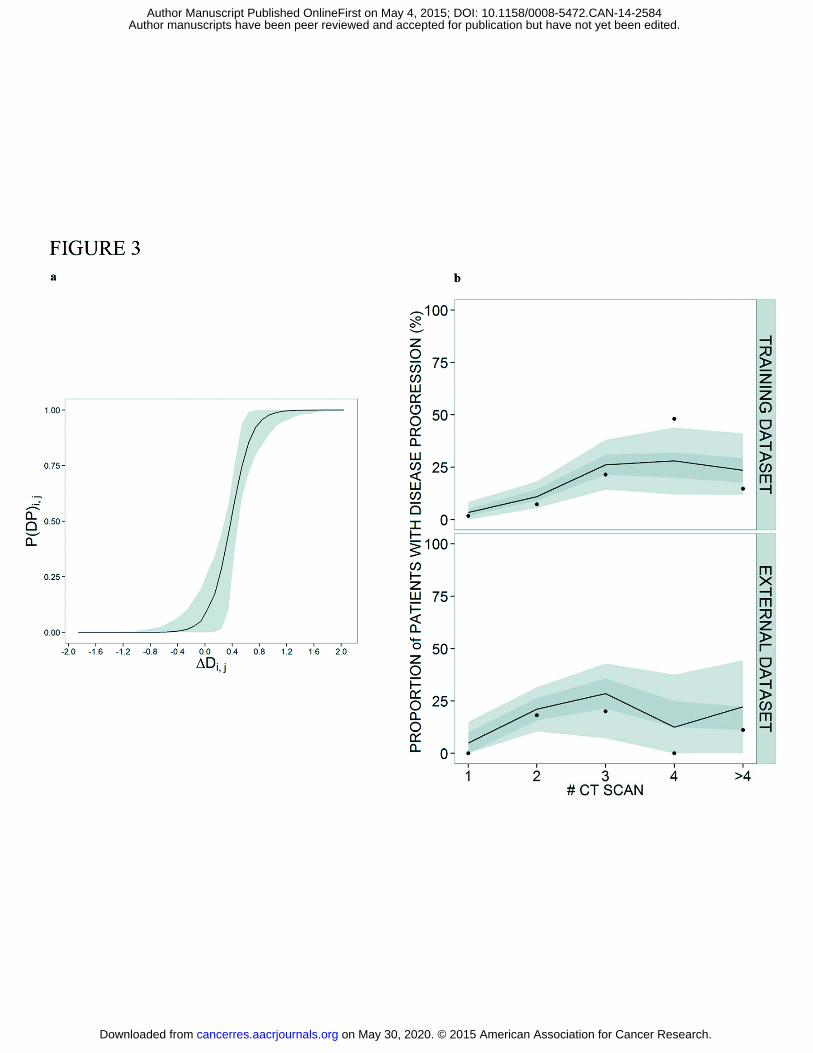
Figure 3a shows the relationship between the typical probability of disease progression and
�Di,j. In Figure 3b the performance of the logistic model at the population level is shown for
the training and external datasets. The predictive accuracy of the model at the individual level
is shown in supplementary Figure S3. Results indicate adequate model performance in both
cases.
Individual early prediction of disease progression
P(DP) predictions for follow up visits were obtained for new SCLC cancer patients (external
dataset) assuming that only treatment period data was available (see Figure 1). Figure 4 shows
the schematic of the Bayesian framework developed for prediction. P(DP) uncertainty
on May 30, 2020. © 2015 American Association for Cancer Research. cancerres.aacrjournals.org Downloaded from
Author manuscripts have been peer reviewed and accepted for publication but have not yet been edited. Author Manuscript Published OnlineFirst on May 4, 2015; DOI: 10.1158/0008-5472.CAN-14-2584
14
distributions were obtained using the full nonparametric distribution of the predicted disease
in accordance with equation 2 (Figure 4b-4d).
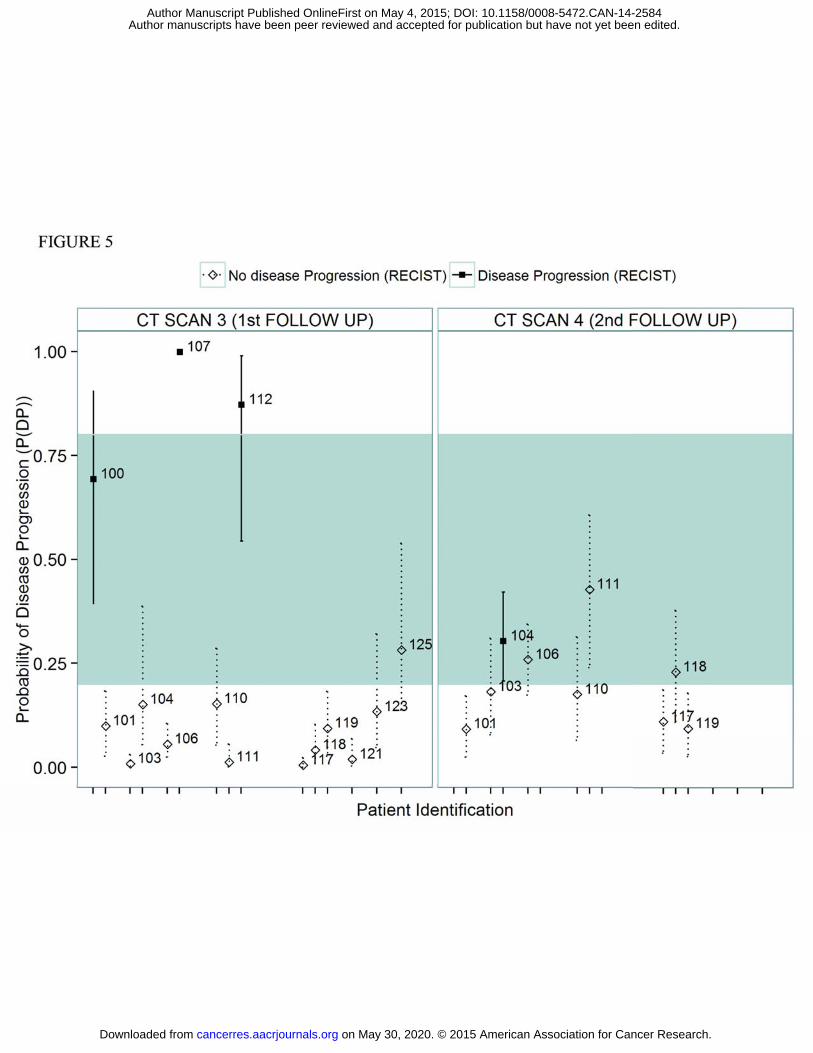
Figure 5 shows the results comparing the predicted P(DP) with the observed patient status (i.e.
disease progression vs non disease progression) at the first and second follow up scans. For
demonstration purposes, P(DP) predictions higher than 80% were deemed “high confidence”
or “reliable” predictions of a disease progression outcome. Similarly, P(DP) predictions lower
than 20% were deemed “high confidence” predictions of a non-disease progression outcome.
Out of 24 CT scan measurements, 75% of the P(DP) predictions were prospectively identified
as “high confidence” predictions. As can be seen in Figure 5, all “high confidence” P(DP)
predictions correctly predicted follow up outcomes with 100% accuracy using treatment only
data. The remaining 25% of the P(DP) predictions were deemed to be of insufficient
confidence to provide a reliable prediction of outcome. A total of four individuals experienced
disease progression in the two follow up scans. Two of these four outcomes were
prospectively identified as having “high confidence” P(DP) predictions.
on May 30, 2020. © 2015 American Association for Cancer Research. cancerres.aacrjournals.org Downloaded from
Author manuscripts have been peer reviewed and accepted for publication but have not yet been edited. Author Manuscript Published OnlineFirst on May 4, 2015; DOI: 10.1158/0008-5472.CAN-14-2584

15
DISCUSSION�In the last decade, great advances have been made in the area of personalized medicine
thanks to pharmacogenomics and targeted therapies (32-34). Likewise, great efforts have been
made to develop new predictive biomarkers to personalize therapy to individuals (35, 36). In
this work, we used known biomarkers together with probabilistic non-linear mixed effects
models (NLME) within a framework to improve personalized disease monitoring.
The disease we have investigated together with the current monitoring strategy would
traditionally be viewed as challenging for prediction due to the heterogeneity in response and
highly dynamic nature of SCLC (37). On a conceptual level, the predictive capability of the
model may be restricted by the ability to infer underlying disease processes from the available
data. However, our success with predicting SCLC outcome suggests that the integrated NLME
approach (combining individual biomarker and scan data) may have wider utility to other
cancers even when available biomarkers have not historically been considered as predictive
markers. In fact, NLME models have been used in the past to describe circulating biomarker
dynamics and clinical outcome in different cancer indications. Some examples include the use
of mathematical models in prostate cancer to personalize vaccination regimens to stabilize
prostate-specific antigen (PSA) levels (38, 39), the use of CA125 as a predictive marker of
ovarian cancer (40), the kinetic modeling of human chorionic gonadotropin as an early
predictor of methotrexate resistance in low-risk gestational trophoblastic neoplasia patients
(41), and the use soluble VEGF receptor 3 to monitor adverse events and clinical response in
patients with imatinib-resistant gastrointestinal stromal tumors (42, 43). A key strength of
NLME models is that they provide a description of individual variability in population level
trends. NLME modeling also provides a rigorous statistical basis to individual prediction using
Bayesian methodology, so that information from available individual level observations is
balanced with knowledge and uncertainty in population level trends (44, 45).
on May 30, 2020. © 2015 American Association for Cancer Research. cancerres.aacrjournals.org Downloaded from
Author manuscripts have been peer reviewed and accepted for publication but have not yet been edited. Author Manuscript Published OnlineFirst on May 4, 2015; DOI: 10.1158/0008-5472.CAN-14-2584
16
The external dataset was used to evaluate the predictive accuracy of the previously reported
biomarker model (28). Interestingly, NSE values in Table 1 are lower in the external dataset
compared to the training dataset. This is likely due to differences in diagnostic techniques used
between the two datasets leading to the Will Rogers phenomenon (46), where stage migration
due to new methods of diagnosis leads to a systemic bias in measures of central tendency.
Patients in the training dataset were staged using imaging techniques while patients included
in the external dataset (more recently diagnosed) were staged according to the PET (Positron
emission tomography) technique. Due to the highly metabolic nature of SCLC, it has been
shown that the use of PET can increase staging accuracy, resulting in a higher percentage of
patients upstaged from limited- to extensive- disease compared to patients downstaged from
extensive- to limited- disease (47). Nevertheless, the biomarker and the RECIST model were
capable to describe observations from the external dataset.
After successful external validation of the combined biomarker/logistic model, we investigated
the feasibility of using data up to end of first line treatment to obtain early prediction of
disease progression in follow up visits. Although we defined thresholds for “high confidence”
P(DP) predictions to assess overall predictive accuracy in our external dataset, we do not
recommend establishing arbitrary thresholds such as P(DP)>80% in clinical practice. This is
because personalized dosing decisions should account for all available individual information
including patient characteristics, available treatments and their expected tolerability and
efficacy. We therefore envisage quantitative prediction of probability of progression as being
one factor for oncologists to consider.
The surprising result of this investigation was that biomarker data gathered only during the
treatment period was sufficient to provide reliable predictions for 75% of follow up tumor
assessment results. Moreover, disease progression was confidently predicted at the end of
treatment for two out of the four cases present in the external dataset. Although the sample
on May 30, 2020. © 2015 American Association for Cancer Research. cancerres.aacrjournals.org Downloaded from
Author manuscripts have been peer reviewed and accepted for publication but have not yet been edited. Author Manuscript Published OnlineFirst on May 4, 2015; DOI: 10.1158/0008-5472.CAN-14-2584
17
size here is limited, this suggests that the approach can be used to optimize the timing of
commencement of second line therapy in a significant proportion of patients. As an example,
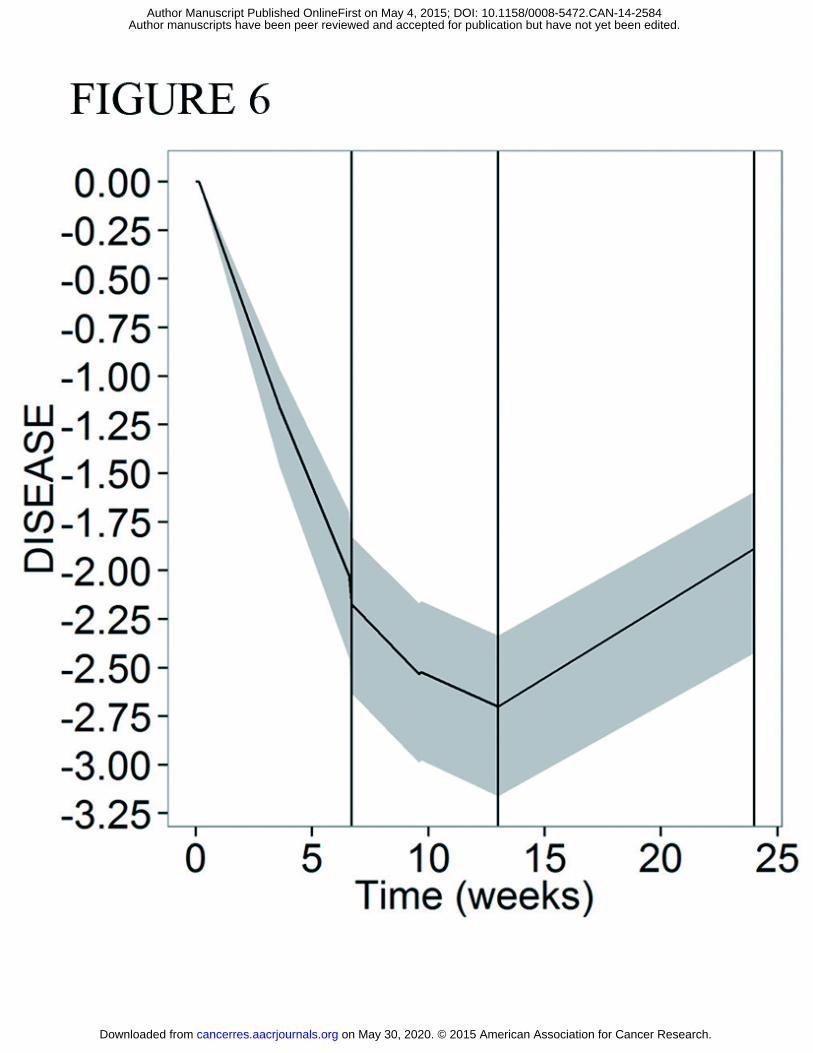
ID patient 107 completed first line treatment on week 13 and was detected to be in disease
progression in week 24. As shown in Figure 5, our framework could have confidently predicted
this outcome from the treatment-only data. Figure 6 corroborates this by showing that the
model-predicted disease profile was increasing up to thirteen weeks prior to the follow up CT
scan, a period where the patient was receiving no treatment. These model predictions could
have been made at the end of first line treatment, providing oncologists with the option to
continue first line therapy or commence second line therapy immediately at the end of first
line treatment for this particular patient.
For the 25% of assessments where P(DP) were not deemed to be of “high confidence” (i.e. 20%
< P(DP) < 80%), the framework fails to provide reliable predictions of outcome. However,
physicians can still derive relevant information from the model: there is insufficient individual
level information for these patients and therefore these patients should be considered “at
risk”. Intensive monitoring plans can then be followed to gather more individual level
information. For example, for ID 100 (Fig 5), who progressed at the first follow up scan, the
uncertainty intervals indicate that the true P(DP) may be above 80%, so the decision could be
taken to continue weekly or biweekly visits for additional biomarker monitoring as a
precautionary measure. Another example of a “non-high confidence” prediction is patient 104,
who had an expected P(DP) at second follow-up scan of 30.3% and progressed at this scan.
Although this P(DP) does not fall into the P(DP)>80% range, 30.3% is not a small probability of
progression and therefore this patient should also be considered at risk and monitored
carefully. It is the opinion of the authors, that although many patients were predicted not to
progress with high confidence, a reduced monitoring schedule relative to existing practices
would not be advisable due to the reliance of the RECIST criteria on an approximately fixed
interval between CT scans.
on May 30, 2020. © 2015 American Association for Cancer Research. cancerres.aacrjournals.org Downloaded from
Author manuscripts have been peer reviewed and accepted for publication but have not yet been edited. Author Manuscript Published OnlineFirst on May 4, 2015; DOI: 10.1158/0008-5472.CAN-14-2584
18
On a statistical level, the main distinction between the proposed framework and traditional
binary classification systems is that the output is a continuous probability measure associated
with a binary state rather than a binary state itself. The consequence of unreliable predictions
in binary classification systems is the potential for inappropriate treatment decisions for
individuals. As discussed though the primary strength of the proposed framework, is the ability
identify a priori individuals with reliable/unreliable predictions and tailor
treatment/monitoring strategies as appropriate, providing value to physicians even when
there is significant individual uncertainty in underlying predictor variables.
Limitations
Several limitations have already been stated in this discussion section and in the discussion
section of Buil Bruna et al (28). All limitations applying to the previously reported biomarker
model also apply here. Briefly, the limited numbers of patients available for the training
dataset means that the ability to accurately quantify inter-patient variability effects is reduced.
Individual prediction in some instances may therefore be limited if the patient is atypical of
individuals in the training dataset. A K-PD model was used to describe the relationship
between treatment and drug effects due to the lack of pharmacokinetic information. The
absence of PK information likely hampers the interpretation of the variability seen in the
response. There was also insufficient information to incorporate differences in radiotherapy
administration into the model.
In this work, the latent disease variable representing tumor size dynamics that was used to
predict disease progression was inferred from two biomarkers. Although our results suggest
that predictive biomarkers allow inference of the latent disease variable, actual tumor size
measurements, when available, should be more informative. In fact, a recent review article
summarizes several population models describing tumor growth dynamics using tumor size
measurement data (48). However, medical records of the SCLC patients did not include exact
on May 30, 2020. © 2015 American Association for Cancer Research. cancerres.aacrjournals.org Downloaded from
Author manuscripts have been peer reviewed and accepted for publication but have not yet been edited. Author Manuscript Published OnlineFirst on May 4, 2015; DOI: 10.1158/0008-5472.CAN-14-2584
19
tumor size measurements, which is a frequent occurrence with routinely collected medical
data. In addition, there is a high degree of heterogeneity in the number, time and frequency of
samples (biomarker and CT scans) between patients, which translates into heterogeneity in
the precision of individual P(DP) predictions. The proposed framework, however, accounts for
these differences by quantifying the uncertainty in P(DP) predictions.
Avenues for further research
Optimal design methodology (49) could be applied to identify the optimum number and time
of measurements to narrow prediction uncertainty.
We modeled the RECIST endpoint as a binary variable for simplicity. However, the additional
step of modeling the four different RECIST categories (i.e. complete response, partial response,
stable disease and disease progression) may further increase the individual predictive
accuracy.
Efficacy and toxicity associated with second line therapies have not been formally considered
in this analysis. Therefore it is currently not possible to quantify what early commencement of
second line therapy would mean in terms of expected patient outcome (e.g. increased survival
times or remission rates). In order to quantify the added value of early treatment in terms of
measureable endpoints, a model based analysis of efficacy and toxicity endpoints from second
line therapy would be required.
Summary and conclusions
We recommend the use of the proposed prediction framework to support proactive
personalized medicine in SCLC patients during and following first line treatment. Development
of the model-based framework required only patient medical record data and did not require
commissioning of a new study. The feasibility of the approach should be investigated with
other cancers.
on May 30, 2020. © 2015 American Association for Cancer Research. cancerres.aacrjournals.org Downloaded from
Author manuscripts have been peer reviewed and accepted for publication but have not yet been edited. Author Manuscript Published OnlineFirst on May 4, 2015; DOI: 10.1158/0008-5472.CAN-14-2584

20
ACKNOWLEDGEMENTS
We thank MC Martínez-Cosgaya, I Echenique-Gubía and MJ Martínez Alvarez-Nava for their
kind help with data collection from University Clinic of Navarra. NB-B was supported by a pre-
doctoral fellowship from Asociación de Amigos de la Universidad de Navarra. This work was
supported by the Innovative Medicines Inniative Joint Undertaking under grant agreement no.
115156, resources of which are composed of financial contributions from the European
Union’s Seventh Framework Programma (FP7/2007-2013) and EFPIA companies’ in-kind
contribution. The DDMoRe project is also supported by financial contribution from academic
and SME partners. This work does not necessarily represent the view of all DDMoRe partners.
�
on May 30, 2020. © 2015 American Association for Cancer Research. cancerres.aacrjournals.org Downloaded from
Author manuscripts have been peer reviewed and accepted for publication but have not yet been edited. Author Manuscript Published OnlineFirst on May 4, 2015; DOI: 10.1158/0008-5472.CAN-14-2584

21
References
1. Ferlay J, Steliarova-Foucher E, Lortet-Tieulent J, Rosso S, Coebergh J, Comber H, et al. Cancer incidence and mortality patterns in europe: Estimates for 40 countries in 2012. Eur J Cancer. 2013;49:1374-403.
2. Ferlay J, Soerjomataram I, Dikshit R, Eser S, Mathers C, Rebelo M, et al. Cancer incidence and mortality worldwide: Sources, methods and major patterns in GLOBOCAN 2012. International Journal of Cancer. 2014.
3. Siegel R, Naishadham D, Jemal A. Cancer statistics, 2013. CA: a cancer journal for clinicians. 2013;63:11-30.
4. Govindan R, Page N, Morgensztern D, Read W, Tierney R, Vlahiotis A, et al. Changing epidemiology of small-cell lung cancer in the united states over the last 30 years: Analysis of the surveillance, epidemiologic, and end results database. J Clin Oncol. 2006 Oct 1;24:4539-44.
5. Janssen-Heijnen ML, Coebergh JW. The changing epidemiology of lung cancer in europe. Lung Cancer. 2003;41:245-58.
6. Lally BE, Urbanic JJ, Blackstock AW, Miller AA, Perry MC. Small cell lung cancer: Have we made any progress over the last 25 years? Oncologist. 2007 Sep;12:1096-104.
7. Small cell lung cancer treatment [Internet]. [updated 2014 august 6 ; cited 2014 december 11] Available from: http://www.cancer.gov/cancertopics/pdq/treatment/small-cell-lung/healthprofessional/page6.
8. Sgambato A, Casaluce F, Maione P, Rossi A, Sacco PC, Panzone F, et al. Medical treatment of small cell lung cancer: State of the art and new development. Expert Opin Pharmacother. 2013;14:2019-31.
9. Fruh M, De Ruysscher D, Popat S, Crino L, Peters S, Felip E, et al. Small-cell lung cancer (SCLC): ESMO clinical practice guidelines for diagnosis, treatment and follow-up. Ann Oncol. 2013 Oct;24 Suppl 6:vi99-105.
10. Paesmans M, Sculier JP, Lecomte J, Thiriaux J, Libert P, Sergysels R, et al. Prognostic factors for patients with small cell lung carcinoma: Analysis of a series of 763 patients included in 4 consecutive prospective trials with a minimum follow-up of 5 years. Cancer. 2000 Aug 1;89:523-33.
11. Zelen M. Keynote address on biostatistics and data retrieval. Cancer Chemother Rep 3. 1973 Mar;4:31-42.
12. Spiegelman D, Maurer LH, Ware JH, Perry MC, Chahinian AP, Comis R, et al. Prognostic factors in small-cell carcinoma of the lung: An analysis of 1,521 patients. J Clin Oncol. 1989 Mar;7:344-54.
13. Gronowitz JS, Bergström R, N�u E, Påhlman S, Brodin O, Nilsson S, et al. Clinical and serologic markers of stage and prognosis in small cell lung cancer. A multivariate analysis. Cancer. 1990;66:722-32.
on May 30, 2020. © 2015 American Association for Cancer Research. cancerres.aacrjournals.org Downloaded from
Author manuscripts have been peer reviewed and accepted for publication but have not yet been edited. Author Manuscript Published OnlineFirst on May 4, 2015; DOI: 10.1158/0008-5472.CAN-14-2584

22
14. Paesmans M, Sculier JP, Lecomte J, Thiriaux J, Libert P, Sergysels R, et al. Prognostic factors for patients with small cell lung carcinoma: Analysis of a series of 763 patients included in 4 consecutive prospective trials with a minimum follow-up of 5 years. Cancer. 2000 Aug 1;89:523-33.
15. Siu LL, Shepherd FA, Murray N, Feld R, Pater J, Zee B. Influence of age on the treatment of limited-stage small-cell lung cancer. J Clin Oncol. 1996 Mar;14:821-8.
16. Eisenhauer E, Therasse P, Bogaerts J, Schwartz L, Sargent D, Ford R, et al. New response evaluation criteria in solid tumours: Revised RECIST guideline (version 1.1). Eur J Cancer. 2009;45:228-47.
17. National comprehensive cancer network. practice guidelines for small-cell lung cancer. rockledge,PA: National comprehensive cancer network. . 2000.
18. Sugiyama T, Hirose T, Hosaka T, Kusumoto S, Nakashima M, Yamaoka T, et al. Effectiveness of intensive follow-up after response in patients with small cell lung cancer. Lung Cancer. 2008;59:255-61.
19. Diamandis EP. Cancer biomarkers: Can we turn recent failures into success? J Natl Cancer Inst. 2010 Oct 6;102:1462-7.
20. Cerny T, Anderson H, Bramwell V, Thatcher N, Blair V. Pretreatment prognostic factors and scoring system in 407 small-cell lung cancer patients. International journal of cancer. 1987;39:146-9.
21. Molina R, Filella X, Auge JM. ProGRP: A new biomarker for small cell lung cancer. Clin Biochem. 2004;37:505-11.
22. Holdenrieder S, von Pawel J, Dankelmann E, Duell T, Faderl B, Markus A, et al. Nucleosomes, ProGRP, NSE, CYFRA 21-1, and CEA in monitoring first-line chemotherapy of small cell lung cancer. Clinical Cancer Research. 2008;14:7813-21.
23. Stovold R, Blackhall F, Meredith S, Hou J, Dive C, White A. Biomarkers for small cell lung cancer: Neuroendocrine, epithelial and circulating tumour cells. Lung Cancer. 2012;76:263-8.
24. Harmsma M, Schutte B, Ramaekers F. Serum markers in small cell lung cancer: Opportunities for improvement. Biochimica et Biophysica Acta (BBA)-Reviews on Cancer. 2013;1836:255-72.
25. Agur Z, Elishmereni M, Kheifetz Y. Personalizing oncology treatments by predicting drug efficacy, side-effects, and improved therapy: Mathematics, statistics, and their integration. Wiley Interdisciplinary Reviews: Systems Biology and Medicine. 2014;6:239-53.
26. Almufti R, Wilbaux M, Oza A, Henin E, Freyer G, Tod M, et al. A critical review of the analytical approaches for circulating tumor biomarker kinetics during treatment. Ann Oncol. 2014 Jan;25:41-56.
27. J Keizer R, HM Schellens J, H Beijnen J, DR Huitema A. Pharmacodynamic biomarkers in model-based drug development in oncology. Current clinical pharmacology. 2011;6:30-40.
on May 30, 2020. © 2015 American Association for Cancer Research. cancerres.aacrjournals.org Downloaded from
Author manuscripts have been peer reviewed and accepted for publication but have not yet been edited. Author Manuscript Published OnlineFirst on May 4, 2015; DOI: 10.1158/0008-5472.CAN-14-2584

23
28. Buil-Bruna N, López-Picazo J, Moreno-Jiménez M, Martín-Algarra S, Ribba B, Trocóniz IF. A population pharmacodynamic model for lactate dehydrogenase and neuron specific enolase to predict tumor progression in small cell lung cancer patients. The AAPS journal. 2014;16:609-19.
29. Bauer R. NONMEM users guide introduction to NONMEM 7.2. 0. ICON Development Solutions Ellicott City, MD. 2011.
30. Bergstrand M, Hooker AC, Wallin JE, Karlsson MO. Prediction-corrected visual predictive checks for diagnosing nonlinear mixed-effects models. The AAPS journal. 2011;13:143-51.
31. Lindbom L, Pihlgren P, Jonsson N. PsN-toolkit—a collection of computer intensive statistical methods for non-linear mixed effect modeling using NONMEM. Comput Methods Programs Biomed. 2005;79:241-57.
32. Chan IS, Ginsburg GS. Personalized medicine: Progress and promise. Annual review of genomics and human genetics. 2011;12:217-44.
33. Crews KR, Hicks JK, Pui C, Relling MV, Evans WE. Pharmacogenomics and individualized medicine: Translating science into practice. Clinical Pharmacology & Therapeutics. 2012;92:467-75.
34. Evans WE, Relling MV. Moving towards individualized medicine with pharmacogenomics. Nature. 2004;429:464-8.
35. Kalia M. Personalized oncology: Recent advances and future challenges. Metab Clin Exp. 2013;62:S11-4.
36. Duffy MJ, O’Donovan N, Crown J. Use of molecular markers for predicting therapy response in cancer patients. Cancer Treat Rev. 2011;37:151-9.
37. van Meerbeeck JP, Fennell DA, De Ruysscher DK. Small-cell lung cancer. The Lancet. 2011;378:1741-55.
38. Kogan Y, Halevi–Tobias K, Elishmereni M, Vuk-Pavlovi� S, Agur Z. Reconsidering the paradigm of cancer immunotherapy by computationally aided real-time personalization. Cancer Res. 2012;72:2218-27.
39. Kronik N, Kogan Y, Elishmereni M, Halevi-Tobias K, Vuk-Pavlovi� S, Agur Z. Predicting outcomes of prostate cancer immunotherapy by personalized mathematical models. PloS one. 2010;5:e15482.
40. Wilbaux M, Hénin E, Oza A, Colomban O, Pujade-Lauraine E, Freyer G, et al. Dynamic modeling in ovarian cancer: An original approach linking early changes in modeled longitudinal CA-125 kinetics and survival to help decisions in early drug development. Gynecol Oncol. 2014.
41. You B, Harvey R, Henin E, Mitchell H, Golfier F, Savage P, et al. Early prediction of treatment resistance in low-risk gestational trophoblastic neoplasia using population kinetic modelling of hCG measurements. Br J Cancer. 2013;108:1810-6.
on May 30, 2020. © 2015 American Association for Cancer Research. cancerres.aacrjournals.org Downloaded from
Author manuscripts have been peer reviewed and accepted for publication but have not yet been edited. Author Manuscript Published OnlineFirst on May 4, 2015; DOI: 10.1158/0008-5472.CAN-14-2584

24
42. Hansson E, Ma G, Amantea M, French J, Milligan P, Friberg L, et al. PKPD modeling of predictors for adverse effects and overall survival in sunitinib-treated patients with GIST. CPT: pharmacometrics & systems pharmacology. 2013;2:e85.
43. Hansson E, Amantea M, Westwood P, Milligan P, Houk B, French J, et al. PKPD modeling of VEGF, sVEGFR-2, sVEGFR-3, and sKIT as predictors of tumor dynamics and overall survival following sunitinib treatment in GIST. CPT: pharmacometrics & systems pharmacology. 2013;2:e84.
44. Davidian M, Giltinan DM. Nonlinear models for repeated measurement data. New York: Chapman & Hall; 1995.
45. Gelman A, Carlin JB, Stern HS, Dunson DB, Vehtari A, Rubin DB. Bayesian data analysis. second edition. New York: Chapman & Hall; 2004.
46. Feinstein AR, Sosin DM, Wells CK. The will rogers phenomenon: Stage migration and new diagnostic techniques as a source of misleading statistics for survival in cancer. N Engl J Med. 1985;312:1604-8.
47. Kalemkerian GP. Staging and imaging of small cell lung cancer. Cancer Imaging. 2012 Jan 12;11:253-8.
48. Ribba B, Holford N, Magni P, Trocóniz I, Gueorguieva I, Girard P, et al. A review of mixed-effects models of tumor growth and effects of anticancer drug treatment used in population analysis. CPT: pharmacometrics & systems pharmacology. 2014;3:e113.
49. Fedorov VV. Theory of optimal experiments. Elsevier; 1972.
on May 30, 2020. © 2015 American Association for Cancer Research. cancerres.aacrjournals.org Downloaded from
Author manuscripts have been peer reviewed and accepted for publication but have not yet been edited. Author Manuscript Published OnlineFirst on May 4, 2015; DOI: 10.1158/0008-5472.CAN-14-2584
25
Table 1: Patient characteristics in the training dataset (data used to develop the model) and the external dataset (data from new patients, used to externally validate the approach).
Figure1: a, Schematic representation of typical pharmacological and disease monitoring protocol in SCLC
patients. Vertical rectangles correspond to CT scans (tumor assessment); gray vertical arrows
correspond to each chemotherapy (CT) cycle (etoposide plus cisplatin or carboplatin) and horizontal
gray arrow depicts concomitant radiotherapy; b, Schematic representation of the developed framework.
Light shaded area corresponds to already published work (28) where darker shaded areas are developed
within this paper.
Figure 2: External model validation at the individual level (a) and at the population level (b) using new
patient data (external dataset). a, LDH observations (green circles) with individual predictions (green
lines) on the left y-axis and NSE observations (orange squares) with the individual predictions (orange
lines) on the right y-axis for nine selected patients. Observations and predictions for both biomarkers
are log-transformed. Vertical black arrows depict chemotherapy administration. b; pcv-VPC of LDH (left)
and NSE (right) for the final model against chemotherapy cycles. Cycle F corresponds to follow-up
measurement. Dots depict individual observations (LDH and NSE concentrations). Solid black lines
represent the 5th, 50th and 95th percentiles of the observed data. Shaded areas are the 95% confidence
intervals based on simulated data (n=1000) for the corresponding percentiles.
Figure 3: a, Logistic regression model linking predicted changes (on the x-axis) in disease with probability
of disease progression at a CT scan (on the y-axis). b; Visual predictive checks for the combined
biomarker/logistic model where the observed proportion of patients with observed disease progression
at each CT scan is compared with proportion obtained with simulated data (n=1000) for the training
dataset (upper panel) and the external dataset (lower panel). CT scan #1 is taken during treatment, CT
scan #2 corresponds to the tumor assessment obtained at the end of first line treatment and CT scans
>#2 are obtained in the follow-up period. Dots represent observed proportion. Dark gray shared areas
are the 90% confidence intervals, light gray shared areas are interquartile ranges based on simulated
data and black line represents the median of the simulated data.
Figure 4: Schematic illustration of algorithm used to obtain predicted probabilities of progression at first
and second follow-up scans based on biomarker samples from treatment period. Briefly, a, LDH and NSE
observations from a new patient are obtained during treatment period. b, The full posterior distribution
of predicted disease level for this patient is generated using a Full Bayesian MCMC analysis using the
population biomarker model as a prior. c, Distribution of changes in predicted disease levels between
two CT scans are computed. d, Distribution of predicted changes in disease are translated to distribution
of P(PD) at each CT scan.
on May 30, 2020. © 2015 American Association for Cancer Research. cancerres.aacrjournals.org Downloaded from
Author manuscripts have been peer reviewed and accepted for publication but have not yet been edited. Author Manuscript Published OnlineFirst on May 4, 2015; DOI: 10.1158/0008-5472.CAN-14-2584

26
Figure 5: Predicted probabilities of progression at the first two follow-up CT scans for patients in
external dataset obtained from their biomarker data collected up to end of first line treatment. Empty
rhombuses represent patients that did not have disease progression in the CT scan and filled squares
depict patients with observed disease progression at each CT scan.Dotted and solid lines depict the 25th
and 75th quantiles corresponding to the individual posterior distribution.
Figure 6: Predicted disease profile for representative patient which had high predicted probability of
progression at the first follow-up CT scan (ID patient 107). Shaded area represents posterior distribution
of disease predictions. Treatment for this patient was given between time 0 and 13 weeks. Vertical lines
represent CT scans (week 7= CT scan during treatment; week 13 = CT scan at the end of first line
treatment; week 24= first follow-up CT scan).
on May 30, 2020. © 2015 American Association for Cancer Research. cancerres.aacrjournals.org Downloaded from
Author manuscripts have been peer reviewed and accepted for publication but have not yet been edited. Author Manuscript Published OnlineFirst on May 4, 2015; DOI: 10.1158/0008-5472.CAN-14-2584

27
Tabl
e 1:
Pat
ient
cha
ract
erist
ics i
n th
e tr
aini
ng d
atas
et (d
ata
used
to d
evel
op th
e m
odel
) and
the
exte
rnal
dat
aset
(dat
a fr
om n
ew p
atie
nts,
use
d to
ext
erna
lly v
alid
ate
the
appr
oach
).
TR
AIN
ING
DAT
ASET
EXTE
RNAL
DAT
ASET
Li
mite
d di
seas
e (n
=18)
Exte
nsiv
e di
seas
e (n
=42)
Lim
ited
dise
ase
(n=6
)Ex
tens
ive
dise
ase
(n=1
6)
#
%#
%#
%#
% A
ge (y
ears
)
M
ean
(ran
ge)
67.8
(48-
78)
-61
.0 (4
0-85
)-
59.8
(53-
81)
-57
.4 (4
4-76
)-
Gen
der
M
ale
13
72.2
3890
.55
83.3
1275
Fem
ale
5 27
.84
9.5
116
.74
25
�2
0
04
9.5
00
318
.8 L
DH (U
I/L)
M
edia
n (r
ange
) 23
7 (1
76 -5
92)
-32
2 (1
63-3
480)
-22
4 (1
27 -
493)
-43
4 (1
30-5
696)
- N
SE (n
g/m
L)
Med
ian
(ran
ge)
30.9
(9.8
5-15
6)-
67.7
(11.
5-25
34)
-11
.2 (5
.09-
30.3
)-
14.3
(7.1
4-37
7)-
Trea
tmen
t str
ateg
y
E
topo
side
+ ci
spla
tin
9 50
3173
.84
66.7
1593
.8
Eto
posid
e +
carb
opla
tin
9 50
1126
.22
33.3
16.
2
Tho
raci
c irr
adia
tion
16
88.9
1330
.95
83.3
743
.7 G
-CSF
co-
adm
inis
trat
ion
9 50
2150
233
.38
50
CT
scan
s M
edia
n (r
ange
) w
eeks
#
DP
Med
ian
(ran
ge)
wee
ks
# DP
M
edia
n (r
ange
) wee
ks
# DP
M
edia
n (r
ange
) w
eeks
#
DP
Du
ring
1st li
ne tr
eatm
ent
8.4
(6 -
22)
08.
5 (2
.6 -
21)
06.
3 (5
.9 -1
1)0
7.0
(6 -
17)
0
End
of 1
st li
ne tr
eatm
ent
22 (1
0 - 2
7)0
20 (6
.0 -
23)
417
(12
-22)
013
(11
-32)
3
1st fo
llow
-up
30 (2
2 - 4
8)3
29 (1
9 -3
7)14
28 (2
2 -6
6)0
28 (1
9 -4
5)3
2nd
follo
w-u
p
42 (3
2 - 5
3)2
43 (3
1 -9
2)6
44 (2
7 -8
0)1
44 (3
6 -5
2)0
ECO
G pe
rfor
man
ce st
atus
bas
ed o
n Ea
ster
n Co
oper
ativ
e O
ncol
ogy
Grou
p LD
H la
ctat
e de
hydr
ogen
ase,
NSE
neu
rona
l spe
cific
eno
lase
, G-C
SF g
ranu
locy
te c
olon
y-st
imul
atin
g fa
ctor
. CT
scan
s rep
ort t
umor
ass
essm
ents
acc
ordi
ng to
REC
IST
v1.1
., de
fined
acc
ordi
ng to
pre
viou
s CT
(com
pute
d to
mog
raph
y) sc
an,
DP=
dise
ase
prog
ress
ion
on May 30, 2020. © 2015 American Association for Cancer Research. cancerres.aacrjournals.org Downloaded from
Author manuscripts have been peer reviewed and accepted for publication but have not yet been edited. Author Manuscript Published OnlineFirst on May 4, 2015; DOI: 10.1158/0008-5472.CAN-14-2584
Published OnlineFirst May 4, 2015.Cancer Res Nuria Buil-Bruna, Tarjinder Sahota, Jose-María Lopez-Picazo, et al. oncologycancer: Towards model-based personalized medicine in Early prediction of disease progression in small-cell lung
Updated version
10.1158/0008-5472.CAN-14-2584doi:
Access the most recent version of this article at:
Material
Supplementary
http://cancerres.aacrjournals.org/content/suppl/2015/05/05/0008-5472.CAN-14-2584.DC1
Access the most recent supplemental material at:
Manuscript
Authoredited. Author manuscripts have been peer reviewed and accepted for publication but have not yet been
E-mail alerts related to this article or journal.Sign up to receive free email-alerts
Subscriptions
Reprints and
To order reprints of this article or to subscribe to the journal, contact the AACR Publications
Permissions
Rightslink site. Click on "Request Permissions" which will take you to the Copyright Clearance Center's (CCC)
.http://cancerres.aacrjournals.org/content/early/2015/05/02/0008-5472.CAN-14-2584To request permission to re-use all or part of this article, use this link
on May 30, 2020. © 2015 American Association for Cancer Research. cancerres.aacrjournals.org Downloaded from
Author manuscripts have been peer reviewed and accepted for publication but have not yet been edited. Author Manuscript Published OnlineFirst on May 4, 2015; DOI: 10.1158/0008-5472.CAN-14-2584