Embed Size (px)
Citation preview

A comparative analysis of NEETs’ profiles and their determinants in Europe in the years of the crisis: a longitudinal perspective
The role of education on women's NEET status
Marianna Filandri Università di TorinoLia Pacelli Università di Torino, Laboratorio RevelliFrancesco Trentini Collegio Carlo Alberto, Università di Torino, Laboratorio Revelli
1
The EEA and Norway Grants for Youth Employment, project Youth Employment PartnerSHIP, evaluation studies in Spain, Hungary, Italy and Poland, are kindly acknowledged for financial support.

NEETs: a heterogeneous group
• Relevance: EU policies, such as Youth Guarantee, target them explicitly.
• Many dimensions of vulnerability• School dropouts, long-term unemployed, discouraged, inactive due to family responsibilities
• Analytical concept based on:• Age• Labour market status• Education or training• Duration
• Eurofound (2012, 2016)
Useful concept as it reduces the complexity of the condition to a simplebut powerful concept, human capital, and its process of depreciation, with large empirical and theoretical base in labour economics literature.
2

Longitudinal data to identify NEETs: EU-SILC
Contini, Filandri, Pacelli (2019): persistence in the NEET state
Each individual in the longitudinal survey of EU-SILC is asked the monthly activity (11 categories) in previous year (PL2011A-L) → 48 observations of self-declared status.
PL2011A-L : From 11 to 2 categories: Student or Employed, NEET.
Ex-ante classification based on the persistence in the condition:• 0-11 months NEET → Never or Episodic NEET • 12-35 months NEET, 1 period → One long NEET• 12-35 months NEET, 2+ periods → Frequent NEET• 36-48 months NEET → Always NEET
3
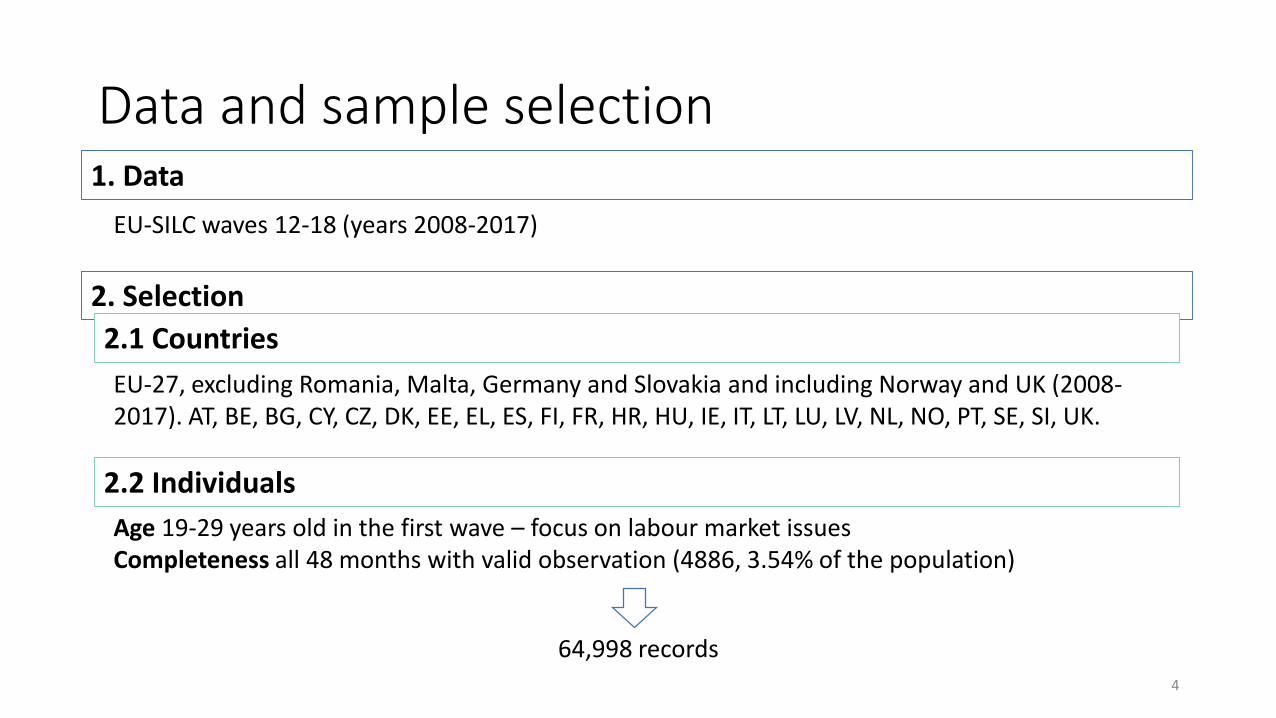
Data and sample selection
4
1. Data
2. Selection
2.1 Countries
2.2 Individuals
EU-27, excluding Romania, Malta, Germany and Slovakia and including Norway and UK (2008-2017). AT, BE, BG, CY, CZ, DK, EE, EL, ES, FI, FR, HR, HU, IE, IT, LT, LU, LV, NL, NO, PT, SE, SI, UK.
Age 19-29 years old in the first wave – focus on labour market issuesCompleteness all 48 months with valid observation (4886, 3.54% of the population)
64,998 records
EU-SILC waves 12-18 (years 2008-2017)

Sample
5
n N
wave years Male Female Total Male Female Total
12 2008-2011 4,924 5,035 9,959 20,236,862 20,637,131 40,873,993
13 2009-2012 4,766 4,535 9,301 20,265,010 20,225,190 40,490,200
14 2010-2013 4,903 4,731 9,634 20,224,795 19,526,909 39,751,704
15 2011-2014 4,475 4,391 8,866 19,822,862 20,283,186 40,106,048
16 2012-2015 4,727 4,375 9,102 20,963,750 20,615,765 41,579,515
17 2013-2016 4,448 4,357 8,805 19,678,908 19,849,593 39,528,501
18 2014-2017 4,752 4,579 9,331 18,943,852 19,321,750 38,265,602
Total 32,995 32,003 64,998 Source: authors’ calculation on EU-SILC data (November 2020 release). For each wave, interviews are made on a yearly basis in March and items are
retrospective on the whole previous year. Therefore, year here refers to the time period the information is referred to, while it is gathered in March year +1.
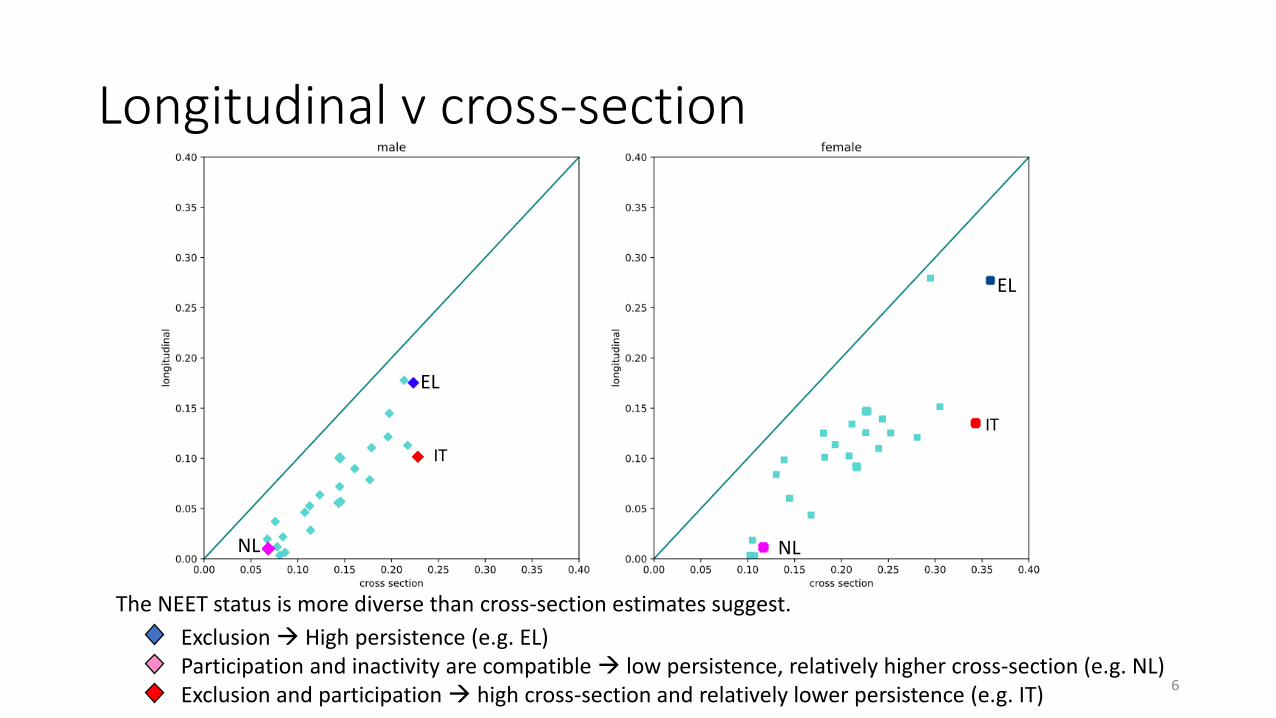
Longitudinal v cross-section
6
EL
IT
EL
IT
NL
The NEET status is more diverse than cross-section estimates suggest.
• Exclusion High persistence (e.g. EL)• Participation and inactivity are compatible low persistence, relatively higher cross-section (e.g. NL)• Exclusion and participation high cross-section and relatively lower persistence (e.g. IT)
NL

Research question
We study the trajectories identified with the above-mentionedclassification for men and women with different levels of education.
How does education relate to participation in employment or education/training activites?
Which level of education is necessary for women to have a relative performance similar to men, given the trajectory of belonging?
7

Sample characteristics: gender and trajectories
8
Male Female Total
Average N % Average N % Average N %
Episodic NEET 15,461,734 77.3% 14,078,727 70.1% 29,542,857 73.7%
One Long NEET 524,579 2.6% 563,440 2.8% 1,088,019 2.7%
Frequent NEET 2,645,784 13.2% 3,125,060 15.6% 5,770,844 14.4%
Always NEET 1,387,173 6.9% 2,298,419 11.5% 3,685,592 9.2%
Total 20,014,286 100.0% 20,071,429 100.0% 40,085,714 100.0%
• Women are over represented in Always and Frequent NEET• One Long NEET is a small group

Male Female Total
Average N % Average N % Average N %Lower secondary or lower 3,886,515 20.1% 2,809,709 14.4% 6,696,224 17.3%
Higher secondary 10,780,048 55.8% 10,165,211 52.3% 20,945,259 54.0%
Tertiary or higher 4,647,712 24.1% 6,470,076 33.3% 11,117,788 28.7%
Total 19,314,276 100.0% 19,444,995 100.0% 38,759,271 100.0%
Sample characteristics: gender and education
9
• Women are more educated than men on average.

1. Multinomial logit regression
Model
10
• Separate models by country
2. Results
Average marginal effects at mean age, by education, gender and country. Odds-ratio with baseline category Episodic NEET.
For each country and trajectory, pairwise significance test of the difference between:women with tertiary education (F: High educ)
𝑍 = 𝛼 +
𝑐∈{1,…,6}
𝛽𝑐𝐴𝑔𝑒𝑐 + 𝛾 𝐹𝑒𝑚𝑎𝑙𝑒 +
𝑒∈{1,2,3}
𝛿𝑒𝐸𝑑𝑢𝑐𝑎𝑡𝑖𝑜𝑛 +
𝑓∈{0,1}
𝑒∈{1,2,3}
𝜂𝑓𝑒𝐹𝑒𝑚𝑎𝑙𝑒𝑓 ∗ 𝐸𝑑𝑢𝑐𝑎𝑡𝑖𝑜𝑛𝑒 + 휀
𝑝𝑡 = exp(𝑍𝑡) (1 + k!=t ,k∈𝑇 exp(𝑍𝑘))
For each individual with outcome trajectory 𝑡 | 𝑡 ∈ 𝑇={ Episodic NEET, One Long NEET, Frequent NEET, Always NEET }
men with lower secondary or lower (M: Low educ)men with higher secondary education (M: Medium educ)men with tertiary education or higher (M: High educ)

Frequent NEET
11
12-35 months NEET, 2 or more episodes
Women with tertiary education have higher probability of being employed or in education than men with lower secondary education but perform similarly to (worse than, in some cases) men with higher secondary.
AME at mean age, by education, gender and country. OR with baseline trajectory “Episodic NEET”.

One long NEET
12
12-35 months NEET, 1 episode
Few estimates are statistically different → small groupLower dispersion
AME at mean age, by education, gender and country. OR with baseline trajectory “Episodic NEET”.

Always NEET
13
36-48 months NEET
Women with tertiary education are more protected then men with secondary education but perform worsethan men with tertiary.
AME at mean age, by education, gender and country. OR with baseline trajectory “Episodic NEET”.

DiscussionThe use of longitudinal data allows to include detailed duration in measures of NEET incidence.
Education increases participation in employment of education/training for bothmen and women but the investment in education fills the gender gap only partially.
Women with tertiary degrees perform similarly to men with higher secondary ones.
14
Limitations:
• Ex-ante categories are rigid.
Future research:
• Are compensatory policies in place? Are they effective?

References
Dalit Contini, Marianna Filandri & Lia Pacelli (2019): Persistency in the NEET state: a longitudinal analysis, Journal of Youth Studies, DOI: 10.1080/13676261.2018.1562161
Eurofound (2012) NEETs – Young people not in employment, education or training: characteristics, costs and policy responses in Europe. Luxembourg: Publication Office of the European Union.
Eurofound (2016) Exploring the diversity of NEETs. Luxembourg: Publication Office of the EuropeanUnion.
15


![[final thesis IX] Conclusions - Comparative Management of Cultural Activities in Europe](https://img.pdfslide.net/doc/110x75/577d369d1a28ab3a6b93869d/final-thesis-ix-conclusions-comparative-management-of-cultural-activities.jpg)