Embed Size (px)
Citation preview

1
SAP Support Mailbox
From: Batch ID for Basis <[email protected]>Sent: Tuesday, April 21, 2015 12:42 AMSubject: PBD - Critical (Yellow) - SAP EarlyWatch Alert
Analysis from 04/13/2015 Until 04/19/2015
Report: PBD, Not ProductiveInstallation: 0020598649
Session: 0010000007390
EarlyWatch Alert-UKY Production
1 Service Summary
This EarlyWatch Alert session detected issues that could potentially affect your system. Take corrective action as soon as possible.
Alert Overview
Standard users have default password.
Secure password policy is not sufficiently enforced.
A high number of users has critical authorizations
Perform the following Guided Self Services.
Guided Self Service FAQ SAP Note
Security Optimization Service 696478
For more information about Guided Self-Services, see SAP Enterprise Support Academy.
Register for an Expert-Guided Implementation Session for the Guided Self-Service at SAP Enterprise Support Academy - Learning Studio - Calendar.
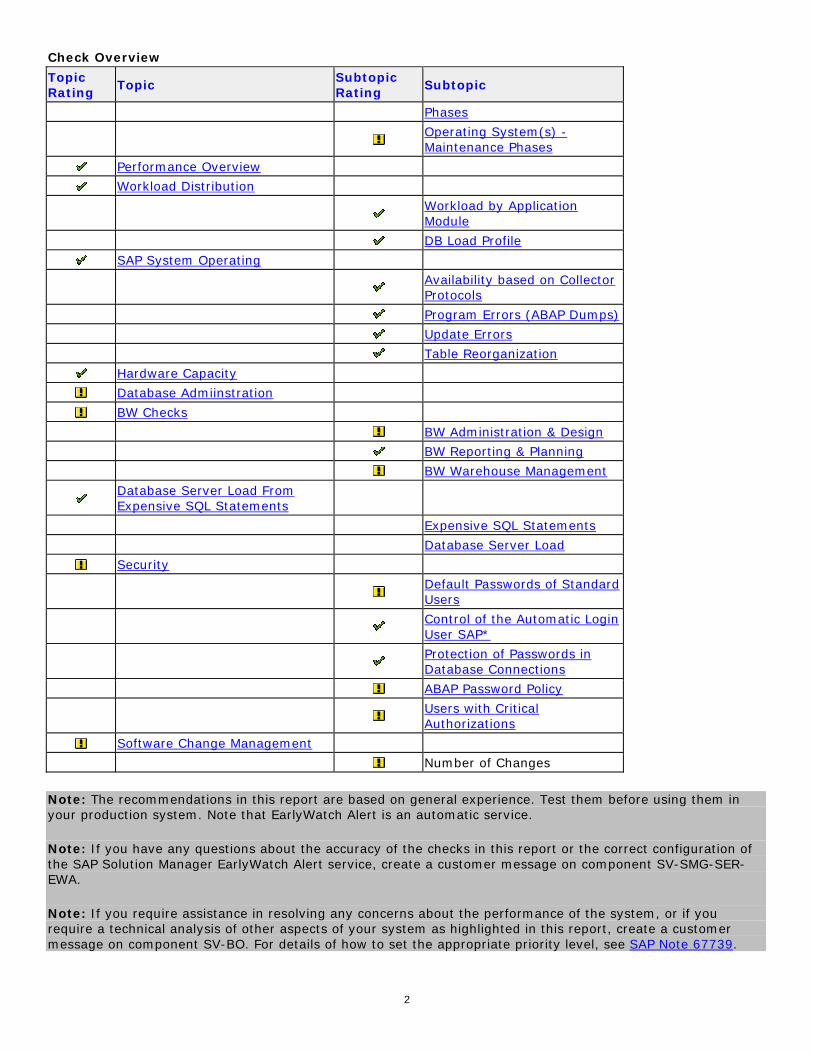
Check Overview Topic Rating Topic Subtopic
Rating Subtopic
SAP System Configuration
Database - Maintenance
2
Check Overview Topic Rating Topic Subtopic
Rating Subtopic
Phases
Operating System(s) - Maintenance Phases
Performance Overview
Workload Distribution
Workload by Application Module
DB Load Profile
SAP System Operating
Availability based on Collector Protocols
Program Errors (ABAP Dumps)
Update Errors
Table Reorganization
Hardware Capacity
Database Admiinstration
BW Checks
BW Administration & Design
BW Reporting & Planning
BW Warehouse Management
Database Server Load From Expensive SQL Statements
Expensive SQL Statements
Database Server Load
Security
Default Passwords of Standard Users
Control of the Automatic Login User SAP*
Protection of Passwords in Database Connections
ABAP Password Policy
Users with Critical Authorizations
Software Change Management
Number of Changes
Note: The recommendations in this report are based on general experience. Test them before using them in your production system. Note that EarlyWatch Alert is an automatic service.
Note: If you have any questions about the accuracy of the checks in this report or the correct configuration of the SAP Solution Manager EarlyWatch Alert service, create a customer message on component SV-SMG-SER-EWA.
Note: If you require assistance in resolving any concerns about the performance of the system, or if you require a technical analysis of other aspects of your system as highlighted in this report, create a customer message on component SV-BO. For details of how to set the appropriate priority level, see SAP Note 67739.

3
Performance Indicators for PBD The following table shows the relevant performance indicators in various system areas.
Area Indicators Value Trend
System Performance Active Users (>400 steps) 11
Avg. Availability per Week 100 %
Avg. Response Time in Dialog Task 1824 ms
Max. Dialog Steps per Hour 73
Avg. Response Time at Peak Dialog Hour 1078 ms
Avg. Response Time in RFC Task 582 ms
Max. Number of RFCs per Hour 1016
Avg. RFC Response Time at Peak Hour 604 ms
Hardware Capacity Max. CPU Utilization on Appl. Server 11 %
Database Performance Avg. DB Request Time in Dialog Task 173 ms
Avg. DB Request Time for RFC 56 ms
Avg. DB Request Time in Update Task 15 ms
Database Space Management DB Size 17.65 GB
DB Growth Last Month 0.39 GB
2 Landscape
2.1 Products and Components in current Landscape Product SID SAP Product Product Version PBD SAP NetWeaver 7.31 Main Instances (ABAP or Java based) SID Main Instance PBD Application Server ABAP PBD Business Intelligence Databases SID Database System Database Version

4
Databases SID Database System Database Version PBD SQL SERVER 2012
2.2 Servers in current Landscape SAP Application Servers SID Host Instance Name Logical Host ABAP JAVA PBD pbd01 pbd01_PBD_01 PBD01
DB Servers SID Host Logical Host (SAPDBHOST) PBD sqlclusb03 PBFPRODSQL Components Related SID Component Host Instance Name Logical Host PBD ABAP SCS pbd01 pbd01_PBD_00 PBD01
2.3 Hardware Configuration Host Overview
Host Hardware Manufacturer Model CPU
Type Virtualization Operating System
No. of CPUs
Memory in MB
pbd01 VMware, Inc. VMware Virtual Platform
Xeon E5520 VMWARE
Windows Server 2008 R2 (x86_64)
2 12287
sqlclusb03
3 Service Preparation and Data Quality of PBD
Configuration hints for optional service data are provided.
SAP NetWeaver system PBD is not fully prepared for delivery of future remote services.
Rating Check Performed
Service Data Quality
ST-PI and ST-A/PI Plug-Ins

5
Rating Check Performed
Service Preparation Check (RTCCTOOL)
Service Data Control Center
Hardware Utilization Data
In preparation for SAP services, ensure that connections, collectors, and service tools are up to date. These functionalities are explained in SAP Notes 91488 and 1172939.
3.1 Service Data Quality The service data is collected by the Service Data Control Center (SDCCN) or read from the Solution Manager's BW or Configuration and Change Database (CCDB).
This section comprehensively shows issues with the data quality and provides hints on how to resolve them.
Legend for 'Priority' in Service Data Quality Prio. Explanation: Impact of Missing or Erroneous Data
Overall important data are missing. Detecting a critical situation may fail. Report cannot be rated green or yellow.
Data for an important chapter are missing. Some issues may not be detected. Report cannot be rated green.
Some important check could not be processed. The report can be rated green nevertheless.
Only checks of minor importance are affected.
An optional check was skipped.
3.1.1 Quality of Service Data in Solution Manager Diagnostics - BW
Prio. Report Area affected Details and Related Infocube SAP
Note
Workload of ABAP System PBD
Reading performance data from BW returned neither data nor an error code. A timeout may have occurred. Infocube: 0CCMSMTPH used in section 'Workload Overview PBD'.
1332428
3.2 ST-PI and ST-A/PI Plug-Ins The table below shows the service plug-ins implemented and their releases and patch levels. These recommendations are derived from report RTCCTOOL. For more information about RTCCTOOL, see SAP Note 309711.
Rating Plug-In Release Patch Level Release Rec. Patch Level Rec.
ST-A/PI 01R_731 1 01R_731 1

6
Rating Plug-In Release Patch Level Release Rec. Patch Level Rec.
ST-PI 2008_1_710 11 2008_1_710 11
3.3 Hardware Utilization Data
Host Operating System Performance Data
pbd01 Windows Server 2008 R2 (x86_64) OK
sqlclusb03 OS not detected OK
Hardware capacity checks could not be run successfully due to missing data. See SAP Note 1309499.
4 Software Configuration For PBD
We have listed recommendations concerning the current software configuration on your system.
Your system's software versions are checked. If known issues with the software versions installed are identified, they are highlighted.
4.1 SAP Application Release - Maintenance Phases
SAP Product Version End of Mainstream Maintenance Status
SAP EHP1 FOR SAP NETWEAVER 7.3 12/31/2020
In October 2014, SAP announced a maintenance extension for SAP Business Suite 7 core application releases to 2025. If you are running a relevant release, see SAP Note 1648480 for more details and applicable restrictions.
4.2 Support Package Maintenance - ABAP The following table shows an overview of currently installed software components.
Support Packages

7
Software Component Version Patch
Level
Latest Avail. Patch Level
Support Package
Component Description
BI_CONT 746 2 5 SAPK-74602INBICONT
SAP Business Intelligence Content
PBFBI 731 1 1 SAPK-73101INPBFBI
Public Budget Formulation BI Content
PI_BASIS 731 8 15 SAPK-73108INPIBASIS
SAP R/3 Basis Plug-In
SAP_ABA 731 8 15 SAPKA73108 SAP Application Basis
SAP_BASIS 731 8 15 SAPKB73108 SAP Basis Component
SAP_BW 731 8 15 SAPKW73108 SAP Business Information Warehouse
ST-A/PI 01R_731 1 2 SAPKITAB9N SAP Service Tools for Applications Plug-In
ST-PI 2008_1_710 11 11 SAPKITLREK SAP Solution Tools Plug-In
4.3 Database - Maintenance Phases
Database Version
End of Standard Vendor Support*
End of Extended Vendor Support* Comment Status SAP
Note
SQL Server 2012 07/11/2017 07/12/2022 Planned
Date
1177356
* Maintenance phases and duration for the DB version are defined by the vendor. Naming of the phases and required additional support contracts differ depending on the vendor. Support can be restricted to specific patch levels by the vendor or by SAP. Check in the referenced SAP Note(s) whether your SAP system requires a specific patch release to guarantee support for your database version.
See the "Service Pack" section in the database section for additional information.
4.4 Operating System(s) - Maintenance Phases
Host Operating System
End of Standard Vendor Support*
End of Extended Vendor Support* Status SAP
Note
sqlclusb03
pbd01 Windows Server 2008 R2 (x86_64) 01/13/2015 01/14/2020
1177282
* Maintenance phases and duration for the OS version are defined by the vendor. Naming of the phases and required additional support contracts differ depending on the vendor. Support can be restricted to specific
8
patch levels by the vendor or by SAP. Check in the referenced SAP Note(s) whether your SAP system requires a specific patch release to guarantee support for your operating system version.
The automatic determination of the used operating system version(s) of system PBD did not work correctly for at least one host. For more information and possible reasons, refer to the section 'Service Preparation and Data Quality of PBD'.
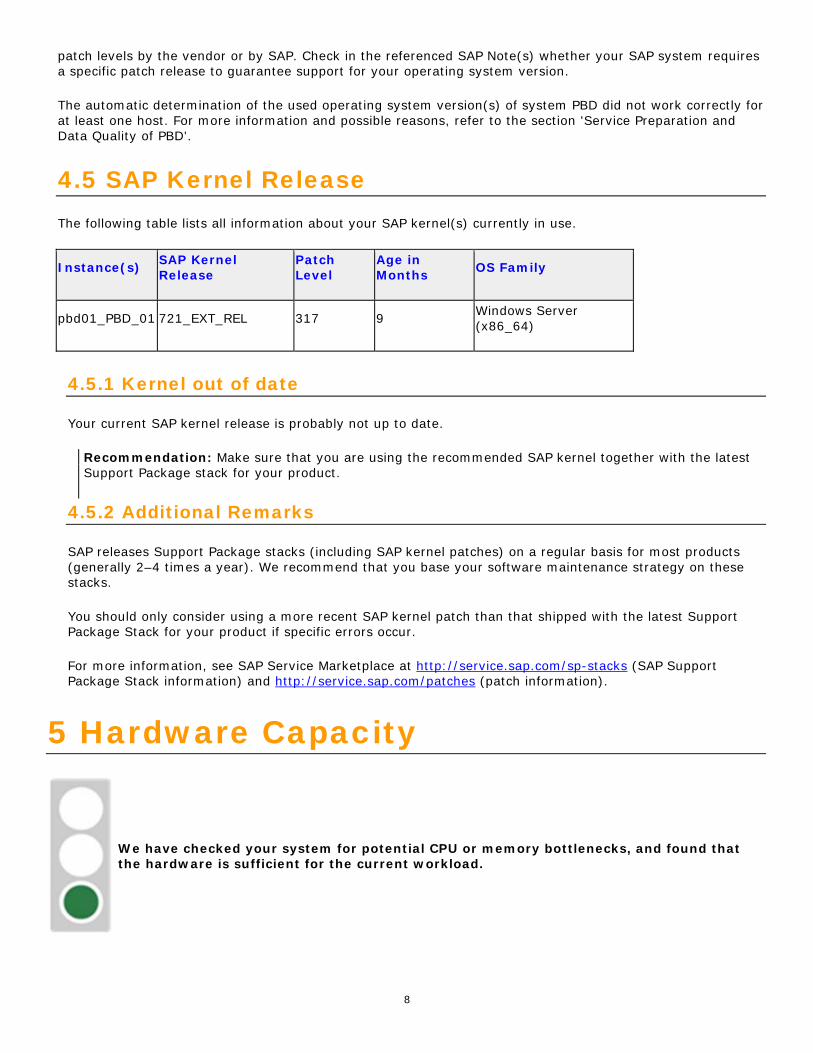
4.5 SAP Kernel Release The following table lists all information about your SAP kernel(s) currently in use.
Instance(s) SAP Kernel Release
Patch Level
Age in Months OS Family
pbd01_PBD_01 721_EXT_REL 317 9 Windows Server (x86_64)
4.5.1 Kernel out of date
Your current SAP kernel release is probably not up to date.
Recommendation: Make sure that you are using the recommended SAP kernel together with the latest Support Package stack for your product.
4.5.2 Additional Remarks
SAP releases Support Package stacks (including SAP kernel patches) on a regular basis for most products (generally 2–4 times a year). We recommend that you base your software maintenance strategy on these stacks.
You should only consider using a more recent SAP kernel patch than that shipped with the latest Support Package Stack for your product if specific errors occur.
For more information, see SAP Service Marketplace at http://service.sap.com/sp-stacks (SAP Support Package Stack information) and http://service.sap.com/patches (patch information).
5 Hardware Capacity
We have checked your system for potential CPU or memory bottlenecks, and found that the hardware is sufficient for the current workload.

9
5.1 Overview System PBD General This analysis focuses on the workload during the peak working hours (9-11, 13) and is based on the hourly averages collected by SAPOSCOL. For information about the definition of peak working hours, see SAP Note 1251291.
CPU If the average CPU load exceeds 75%, temporary CPU bottlenecks are likely to occur. An average CPU load of more than 90% is a strong indicator of a CPU bottleneck.
Memory If your hardware cannot handle the maximum memory consumption, this causes a memory bottleneck in your SAP system that can impair performance. The paging rating depends on the ratio of paging activity to physical memory. A ratio exceeding 25% indicates high memory usage (if Java has been detected 0%) and values above 50% (Java 10%) demonstrate a main memory bottleneck.
Server Max. CPU load [%] Date Rating RAM
[MB] Max. Paging [% of RAM] Date Rating
pbd01 11 04/16/2015
12287 0
6 Business Key Figures System errors or business exceptions can be a reason for open, overdue, or unprocessed business documents or long-lasting processes. SAP Business Process Analysis, Stabilization and Improvement offerings focus on helping you to find these documents (as it may directly or indirectly negatively impact business).
This section provides an example of indicators, and its findings are a basis of further SAP offerings. In the example below, the backlog of business documents is compared to daily or weekly throughput or set in relation to absolute threshold numbers.
It provides business information to discuss possible technical or core business improvement process potential.
SAP tools and methods can help to monitor and analyze business processes in more detail.
NOTE: Overdue or exceptional business documents are often caused by system errors, such as user handling issues, configuration or master data issues, or open documents on inactive organizational units or document types, that can be included in the measurements. These documents are rarely processed further by the business departments and often do not have a direct impact on customer satisfaction, revenue stream, or working capital. Nevertheless, these documents can have negative impacts on other areas such as supply chain planning accuracy, performance (of other transactions, reports, or processes), and reporting quality.
6.1 SAP Business Process Analytics With SAP Business Process Analytics in SAP Solution Manager, you can continuously analyze the above key figures and around 750 additional out-of-the-box key figures for continuous improvement potential in your SAP business processes.
With SAP Business Process Analytics, you can perform the following functions:

10
(1) Internal business process benchmarking (across organizational units, document types, customers, materials, and so on) for a number of exceptional business documents and/or for the cumulated monetary value of these documents.
(2) Age analysis to measure how many open documents you have from the previous years or months.
(3) Trend analysis for these business documents over a certain time period.
(4) Create a detailed list for all of these exceptional business documents in the managed system, enabling a root cause analysis to find reasons why these documents are open, overdue, or erroneous.
SAP Business Process Analytics can help you to achieve the following main goals:
- Gain global transparency of business-relevant exceptions to control template adherence
- Improve process efficiency and reduce process costs by reducing system issues and eliminating waste (for example, user handling, configuration issues, and master data issues)
- Improve working capital (increase revenue, reduce liabilities and inventory levels)
- Ensure process compliance (support internal auditing)
- Improve supply chain planning (better planning results and fewer planning exceptions)
- Improve closing (fewer exceptions and less postprocessing during period-end closing)
SAP also provides business process improvement methodology to help you identify and analyze improvement potential within your business processes using Business Process Analytics in SAP Solution Manager and visualize it for your senior management.
For more information, navigate to the following link: here.
6.2 SAP Active Global Support Follow-Up Opportunities In general, SAP Active Global Support provides several self-assessments or guided services to encourage customers to benefit from an SAP Business Process Stabilization and/or Business Process Improvement project. If you have an SAP Enterprise Support contract, SAP Active Global Support provides you with the following offering for obtaining business process analytics and implementing improvements:
- SAP Expert Guided Implementation Business Process Analytics and Improvement (SAP EGI Portfolio Overview)
- CQC Business Process Analytics and Improvement (fact sheet).
If you have an SAP Max Attention Contract, contact your Technical Quality Manager (TQM) for information about how SAP Active Global Support can help you obtain business process analytics and implement improvements.
7 Workload of System PBD

11
This chart displays the main task types and indicates how their workload is distributed in the system. The table below lists the detailed KPIs.
Response Time Components In Hours Task Type Response Time Wait Time CPU Time DB Time GUI Time RFC 16.8 0.0 1.9 1.6 0.0 BATCH 2.7 0.0 0.5 1.5 0.0 DIALOG 1.7 0.0 0.3 0.2 1.0 Others 0.1 0.0 0.0 0.1 0.0
7.1 Workload By Users User activity is measured in the workload monitor. Only users of at least medium activity are counted as 'active users'.
Users Low Activity Medium Activity High Activity Total Users
dialog steps per week 1 to 399 400 to 4799 4800 or more
measured in system 9 7 4 20
7.2 Workload Distribution PBD The performance of your system was analyzed with respect to the workload distribution. We did not detect any major problems that could affect the performance of your SAP system.
7.2.1 Workload by Application Module
The following diagrams show how each application module contributes to the total system workload. Two workload aspects are shown: - CPU time: total CPU load on all servers in the system landscape - Database time: total database load generated by the application

12
All programs that are not classified in the SAP Application Hierarchy (transaction SE81) are summarized in the "Un-Assigned" category. Customer programs, industry solutions, and third-party add-on developments fall into this category.
7.2.2 DB Load Profile
The number of work processes creating database load in parallel is not significantly high.
The following diagram shows the DB load caused by dialog, RFC, HTTP(S), and background tasks, over different time frames.
The data provided in the diagram represents the average number of database processes occupied by each task type in the database during the specified time frames.
These statistics are calculated as a weekly average, the average values over six working days with a unit of one hour. Periods between 00:00-06:00 and 21:00-24:00 contain an average value per hour, as these are not core business hours.

13
You can enable 24-hour monitoring by implementing SAP Note 910897. With 24-hour monitoring, the time profile returns the workload of the system or application server on an hourly basis rather than returning an average value per hour for the periods 00:00–06:00 and 21:00–24:00.
By comparing the load profiles for dialog and background activity, you can get an overview of the volume of background activity during online working hours.
8 Performance Overview PBD
The performance of your system was analyzed with respect to the average response times and total workload. We did not detect any major problems that could affect the performance of your system.
The following table shows the average response times for various task types:
Averages of Response Time Components in ms Task type
Dialog Steps
Response Time
CPU Time
Wait Time
Load Time
DB Time
GUI Time
DIALOG 3315 1,824.0 321.7 0.5 12.0 172.7 1,064.5 RFC 104134 582.2 65.9 0.5 0.3 55.8 0.0 UPDATE 85 27.0 5.3 1.8 0.8 14.8 0.0 UPDATE2 27 34.3 6.9 0.5 1.1 17.0 0.0 BATCH 37636 257.6 43.8 0.6 2.5 145.1 0.0 SPOOL 10074 33.5 11.0 4.6 0.1 22.3 0.0 HTTP 10073 6.0 4.7 0.3 0.9 0.2 0.0
More than 200 ms of the dialog response time is caused by GUI time. High GUI time can be caused by poor network performance.
14
Perform a LAN Ping check via ST06 with a package size of 4096 bytes. The reference response times are:
- In a local area network (LAN: < 20 milliseconds
- In a Wide Area Network (WAN): < 50 milliseconds
- With a modern connection (for example, 56 KB): < 250 milliseconds
- There should be no loss of data package.
For further analysis, use NIPING as per SAP Note 500235 - Network Diagnosis with NIPING. If necessary, contact your network partner to improve the network throughput.
Other optimization options:
Low-Speed Connection
In WAN (wide area network) environments, switch the network communication between the GUI and the application level to Low Speed Connection.
This will reduce the volume of data transferred per dialog step (see SAP Note 164102). You can activate the low-speed connection in the SAP logon window by selecting the entry for an SAP system and selecting the “Low Speed Connection” option in the Properties Advanced menu option.
SAP Easy Access Menu
1) Restrict the number of transactions in a user role (ideally 1,000 or fewer).
2) Avoid widely used background images in SAP Easy Access menu (which should be no larger than 20 KB).
Refer to SAP Note 203924 for details.
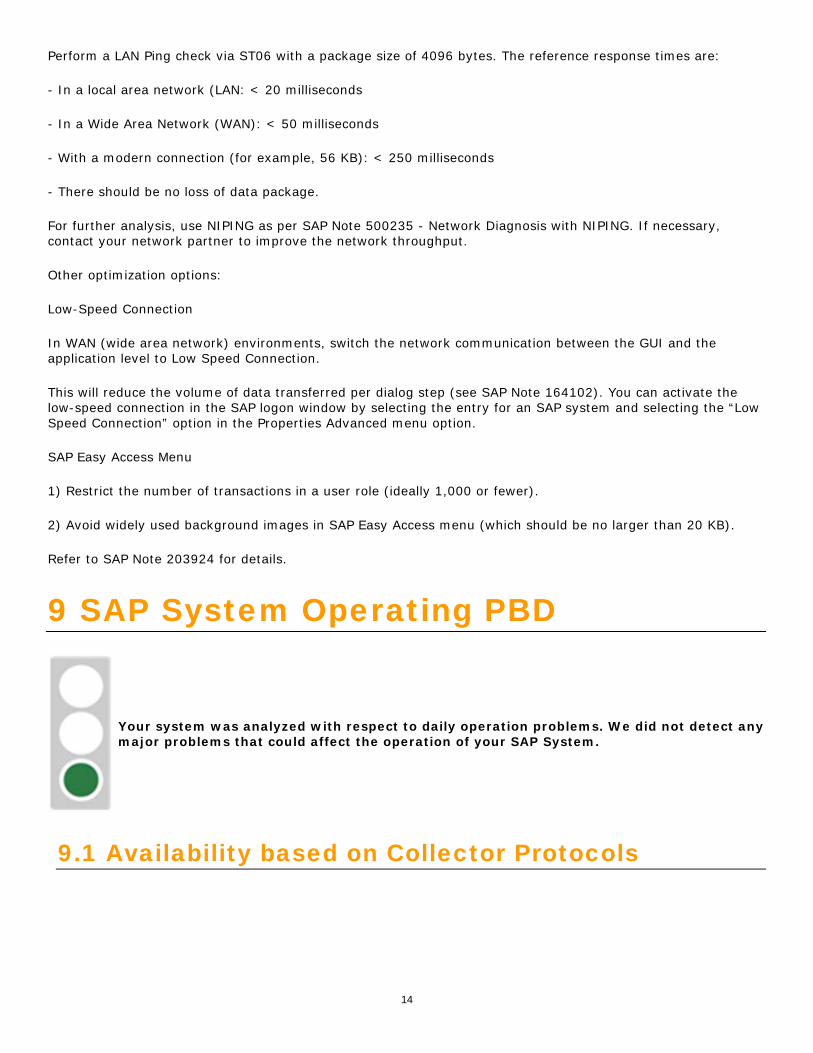
9 SAP System Operating PBD
Your system was analyzed with respect to daily operation problems. We did not detect any major problems that could affect the operation of your SAP System.
9.1 Availability based on Collector Protocols

15
A value of 100% means that the collector was available all day. "Available" in the context of this report means that at least one SAP instance was running. If the SAP collector was not running correctly, the values in the table and graphics may be incorrect.
To check these logs, call transaction ST03N (expert mode) and choose "Collector and Performance DB -> Performance Monitor Collector -> Log".
This check is based on the logs for job COLLECTOR_FOR_PERFORMANCEMONITOR that runs every hour.
The job does NOT check availability; it carries out only general system tasks such as collecting and aggregating SAP performance data for all servers/instances. The log does not contain any direct information about availability; it contains only information about the status of the hourly statistical data collection.
As of SAP Basis 6.40, system availability information is available in the CCMS (Computing Center Management System) of an SAP System, in Service Level Reporting of SAP Solution Manager.
This function is provided by the relevant Solution Manager Support Packages as an advanced development. For more information, refer to SAP Note 944496, which also lists the prerequisites that must be fulfilled before implementation can take place."
9.2 Update Errors In a system running under normal conditions, only a small number of update errors should occur. To set the rating for this check, the number of active users is also taken into consideration.
We did not detect any problems.
9.3 Table Reorganization The largest tables and/or rapidly growing tables of system PBD were checked. No standard SAP recommendations for the applicable data volume management were found.
9.4 Transports Transports were not found in the period analyzed.

16
9.5 Program Errors (ABAP Dumps) 22 ABAP dumps have been recorded in your system in the period 04/13/2015 to 04/19/2015. ABAP dumps are generally deleted after 7 days by default. To view the ABAP dumps in your system, call transaction ST22 and choose Selection. Then select a timeframe.
Date Number of Dumps
04/13/2015 2
04/14/2015 2
04/15/2015 7
04/16/2015 4
04/17/2015 3
04/18/2015 2
04/19/2015 2
Name of Runtime Error Dumps Server (e.g.) User (e.g.) Date (e.g.)
Time (e.g.)
CALL_FUNCTION_PARM_MISSING 4 PBD01_PBD_01 RRLA225 04/15/2015 05:16:18
DBIF_RSQL_SQL_ERROR 1 PBD01_PBD_01 SAPSYS 04/16/2015 18:08:12
DBIF_REPO_SQL_ERROR 1 PBD01_PBD_01 SMDAGENT_SMD 04/16/2015 18:08:16
CALL_FUNCTION_CONFLICT_TAB_TYP 2 PBD01_PBD_01 SKO238 04/17/2015 02:21:39
LOAD_PROGRAM_NOT_FOUND 14 PBD01_PBD_01 BAT-BC 04/19/2015 19:03:32
It is important that you monitor ABAP dumps using transaction ST22 on a regular basis. If ABAP dumps occur, you should determine the cause as soon as possible. Based on our analysis, we expect no serious problems at the moment.
10 Security

17
Critical security issues were found in your system. See the information in the following sections.
Rating Check
Default Passwords of Standard Users
Control of the Automatic Login User SAP*
Protection of Passwords in Database Connections
ABAP Password Policy
Gateway and Message Server Security
Users with Critical Authorizations
10.1 ABAP Stack of PBD
10.1.1 Default Passwords of Standard Users
Standard users have default passwords.
Recommendation: Run report RSUSR003 to check the usage of default passwords by standard users. Ensure that users SAP* (must exist in all clients), SAPCPIC, and EARLYWATCH have non-default passwords in all clients. For more information, see "Protecting Standard Users" either on SAP Help Portal or in the SAP NetWeaver AS ABAP Security Guide. Make sure that the standard password for user TMSADM has been changed in client 000, and delete this user in any other client. SAP Note 1414256 describes a support tool to change the password of user TMSADM in all systems of the transport domain. SAP Note 1552894 shows how to update the report RSUSR003 to show the status of user TMSADM.
10.1.2 ABAP Password Policy
If password login is allowed for specific instances only, the password policy is checked only for these instances.
10.1.2.1 Password Complexity
Parameter: login/min_password_lng
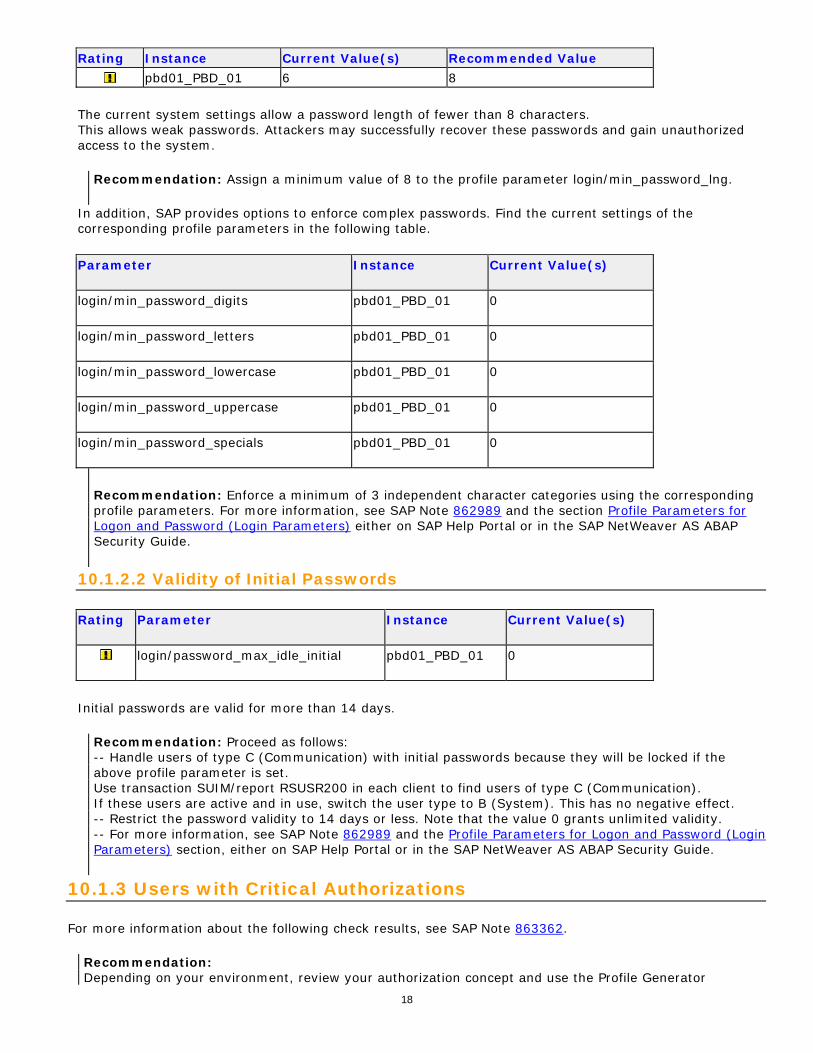
18
Rating Instance Current Value(s) Recommended Value
pbd01_PBD_01 6 8
The current system settings allow a password length of fewer than 8 characters. This allows weak passwords. Attackers may successfully recover these passwords and gain unauthorized access to the system.
Recommendation: Assign a minimum value of 8 to the profile parameter login/min_password_lng.
In addition, SAP provides options to enforce complex passwords. Find the current settings of the corresponding profile parameters in the following table.
Parameter Instance Current Value(s)
login/min_password_digits pbd01_PBD_01 0
login/min_password_letters pbd01_PBD_01 0
login/min_password_lowercase pbd01_PBD_01 0
login/min_password_uppercase pbd01_PBD_01 0
login/min_password_specials pbd01_PBD_01 0
Recommendation: Enforce a minimum of 3 independent character categories using the corresponding profile parameters. For more information, see SAP Note 862989 and the section Profile Parameters for Logon and Password (Login Parameters) either on SAP Help Portal or in the SAP NetWeaver AS ABAP Security Guide.
10.1.2.2 Validity of Initial Passwords
Rating Parameter Instance Current Value(s)
login/password_max_idle_initial pbd01_PBD_01 0
Initial passwords are valid for more than 14 days.
Recommendation: Proceed as follows: -- Handle users of type C (Communication) with initial passwords because they will be locked if the above profile parameter is set. Use transaction SUIM/report RSUSR200 in each client to find users of type C (Communication). If these users are active and in use, switch the user type to B (System). This has no negative effect. -- Restrict the password validity to 14 days or less. Note that the value 0 grants unlimited validity. -- For more information, see SAP Note 862989 and the Profile Parameters for Logon and Password (Login Parameters) section, either on SAP Help Portal or in the SAP NetWeaver AS ABAP Security Guide.
10.1.3 Users with Critical Authorizations
For more information about the following check results, see SAP Note 863362.
Recommendation: Depending on your environment, review your authorization concept and use the Profile Generator

19
(transaction PFCG) to correct roles and authorizations. You can use the User Information System (transaction SUIM) to check the results. For each check, you can review the roles or profiles that include the authorization objects listed in the corresponding section.
10.1.3.1 Super User Accounts
Users with authorization profile SAP_ALL have full access to the system. There should be a minimum of such users. The number of users with this authorization profile is stated for each client.
Client No. of Users Having This Authorization No. of Valid Users Rating
000 6 7
001 13 35
Authorization profile: SAP_ALL
10.1.3.2 Users Authorized to Change or Display all Tables
Unauthorized access to sensitive data is possible if too many users have this authorization. The specified number of users for each client have the checked authorization.
Client No. of Users Having This Authorization No. of Valid Users Rating
001 27 35
Authorization objects:
Object 1: S_TCODE with TCD=SE16, TCD=SE16N, TCD=SE17, TCD=SM30, or TCD=SM31
Object 2: S_TABU_DIS with ACTVT = 03 or 02 and DICBERCLS = *
10.1.3.3 Users Authorized to Start all Reports
This authorization allows critical functions and reports that do not contain their own authorization checks to be executed. The specified number of users for each client have the checked authorization.
Client No. of Users Having This Authorization No. of Valid Users Rating
001 27 35
066 1 1
Authorization objects:
Object 1: S_TCODE with TCD=SE38 or TCD=SA38 or TCD=SC38
Object 2: S_PROGRAM with P_ACTION=SUBMIT P_GROUP=*

20
10.1.3.4 Users Authorized to Debug / Replace
This authorization provides access to data and functions, since any authorization check that is built in ABAP can be bypassed. In addition, you can change data during processing, which may lead to inconsistent results. The specified number of users for each client have the checked authorization.
Client No. of Users Having This Authorization No. of Valid Users Rating
001 27 35
Authorization objects:
Object 1: S_DEVELOP with ACTVT=02 (change) and OBJTYPE=DEBUG
Note: If you do not want to disable development in your system, you have to exclude the OBJTYPE=DEBUG with ACTVT=02 from the profile and allow any other object type for S_DEVELOP. This means that development and debugging with visualization is still possible. You can achieve this by linking two authorizations to the object S_DEVELOP: one with all object types (except for "DEBUG") and all activities, and another for the object type DEBUG only and all activities (except for 02).
10.1.3.5 Users Authorized to Display Other Users Spool Request
This authorization allows unauthorized access to sensitive data contained in spool requests. The specified number of users for each client have the checked authorization.
Client No. of Users Having This Authorization No. of Valid Users Rating
001 27 35
Authorization objects:
Object 1: S_TCODE with TCD = SP01 or SP01O
Object 2: S_ADMI_FCD with S_ADMI_FCD = SP01 or SP0R
Object 3: S_SPO_ACT with SPOACTION = BASE and DISP and SPOAUTH = * or __USER__
10.1.3.6 Users Authorized to Administer RFC Connections
If too many users have this authorization, two problems can occur: - Unauthorized access to other systems - Malfunction of interfaces if invalid connection data is entered
The specified number of users for each client have the checked authorization.
Client No. of Users Having This Authorization No. of Valid Users Rating
001 14 35
Authorization objects:

21
Object 1: S_TCODE with TCD=SM59
Object 2: S_ADMI_FCD with S_ADMI_FCD = NADM
Object 3: S_RFC_ADM with ACTVT NE 03
10.1.3.7 Users Authorized to Reset/Change User Passwords
The following users are allowed to change and reset the passwords of all users. This is very risky because any of these users could change the password and log on themselves with any user. The only consequence is that the "real user" would no longer be able to log on because the password was changed. However, this normally results in the password being reset, because there is a chance that the "real user" might have forgotten the correct password.
Client No. of Users Having This Authorization No. of Valid Users Rating
001 13 35
066 1 1
Authorization objects:
Object 1: S_TCODE with TCD=SU01 or TCD=OIBB or TCD=OOUS or TCD=OPF0 or TCD=OPJ0 or TCD=OVZ5
Object 2: S_USER_GRP with ACTVT=05
11 Software Change and Transport Management of PBD
Software change management issues were found in your system. See the information in the following sections.
11.1 SAP Netweaver Application Server ABAP of PBD
Rating Check Performed
Number of Changes

22
11.1.1 Number of Changes
Performing changes is an important cost driver for the IT department. It is only acceptable to make a large number of software and configuration changes in exceptional situations, such as during go-live for an implementation project.
No data from the managed system could be found in the configuration and change database (CCDB). Check whether the diagnostics setup for the managed system has been performed as described in SAP Note 1472465. Solution Manager Diagnostics provides valuable features for root cause analysis and is an important data source for various support services. The CCDB data is required here to check the configuration of the managed system.
12 Data Volume Management (DVM)
A statement regarding Data Volume Management on your system PBD could not be provided.
This report does not have a Data Volume Management (DVM) section because your SAP Solution Manager system does not fulfill the technical requirements, or the ST-A/PI release on your system PBD is too low (or could not be identified). For more information, see SAP Note 2036442. As a workaround, an attempt was made to check the database size and growth per year for your system PBD. However, the database size or growth per year could not be collected. As a consequence, a statement regarding Data Volume Management in your system PBD could not be provided.
13 Database Performance for PBD
No major performance problems were found in your database system.
13.1 Wait Statistics The wait statistics of the SQL Server show long wait times for the event(s) highlighted below. This can indicate slow performance of the I/O system or other unusual conditions. Note that wait events that are known to have

23
no relevance to user queries ("idle events") are not shown in the table. High wait time for some events may indicate a performance bottleneck. In the "Rating" column, you may find the following symbols: "Red flash" - in a well-tuned database, the event should not appear among the top events. Its appearance indicates a bottleneck and thus potential for improvement. See explanations below. "Yellow exclamation mark" - it is normal that the wait event is among the top events, but its average value exceeds a threshold. An improvement may be possible. "Blue information sign" - this wait event is important for performance but does not have a critical value. No symbol - we do not have experience with a wait event of that type. If the overall database performance is not affected; it can be ignored.
One of the events LCK_M_X, LCK_M_S, or LCK_M_U appears in the "Top Wait Events Statistics" table. This indicates that some processes must wait for exclusive database locks. Exclusive DB locks are caused either by application logic holding exclusive locks for longer than needed, by expensive statements executed within a database transaction, or by too high parallelization grade during background processing.
Analyze the lock history as explained in SAP Note 806342 to find the root cause.
A DB task goes to wait state SOS_SCHEDULER_YIELD if it has been running too long on a CPU. This indicates that there are a lot of expensive, long-running statements.
Analyze the SQL statement cache by looking for statements with high total and average CPU time, and then tune them. If SQL statements have been optimized, but there are still high total figures for this wait event, the database engine is suffering from an overall CPU bottleneck because of too slow CPUs or too few CPUs for the current load. Also check whether the CPU bottleneck itself is caused by excessive paging. If the paging rate is high, make sure you allow the SQL Server to lock pages in the memory, as described in SAP Note 1134345, irrespective of whether you are experiencing the symptoms described in this SAP Note.
Wait type Wait time (ms) Requests Wait time / Requests Rating
Analysis timeframe (ms): 2,224,347,900
LCK_M_S 3,958,524,200 96 41,234,627.08
LCK_M_X 626,935,490 9,740 64,367.09
LCK_M_U 604,622,530 29,118 20,764.56
WRITELOG 43,019,584 14,805,072 2.91
BACKUPBUFFER 34,194,956 5,586,398 6.12
ASYNC_IO_COMPLETION 16,904,110 11,333 1,491.58
ASYNC_NETWORK_IO 15,673,265 19,275,708 0.81
BACKUPIO 13,038,216 3,050,976 4.27
WAITSTAT_MUTEX 4,979,852 3,944,345 1.26
SOS_SCHEDULER_YIELD 2,676,335 32,036,440 0.08
13.2 Missing Indexes

24
This check verifies that the indexes defined by SAP application developers in the SAP data dictionary also exist in the database. Missing primary indexes can lead to inconsistent data in the SAP system. A missing index of any kind can lead to severe performance problems.
No missing indexes were found in system PBD.
14 Database Administration for PBD
Some problems regarding database administration have been found. Check the following sections for possible problems that may be caused by the way you administrate your database. Note: A remote service cannot verify certain important aspects of your administration strategy, such as your offsite storage of database backups and whether the backup tapes can be read correctly.
14.1 Database Files The following checks analyze the settings for database and transaction log files.
14.1.1 Data Separation
To distribute I/O load, place heavily used files such as database files, transaction log files, files of database tempdb, and the Windows paging files on separate disks.
Note: From the SAP side, we are not in a position to check whether your partitions are distributed across multiple physical devices.
Make sure the following brief guidelines for security, maximum performance, and scalability are taken into account.
1. The temporary database for SQL Server (tempdb) is used by queries to execute large join, sort, and group operations when the SQL Server buffer pool cannot provide enough memory.
For SAP BW, SAP SEM, and SAP SCM, tempdb I/O performance can become a major bottleneck when reporting queries are executed that use the fact table or perform aggregation. To prevent bottlenecks, we recommend that you manage tempdb as a normal SAP database. Use a data tempdb file on the same partition with each data SAP database file. Furthermore, do not place tempdb on the partition and disks that contain the transaction log. For Storage Area Network (SAN) storage, tempdb can share space with the tempdb log files.
2. For security and performance reasons, store the SAP data files and the SAP transaction log file(s) on separate disk systems. They should not share disks with other SQL Server programs and database files.
3. Store the Windows paging file(s) on dedicated disks.
14.1.2 Database File Settings
When distributing database files, adhere to the following general rules:

25
1. If you use directly attached disks, distribute the I/O load to multiple physical disks. This can be achieved by assigning each data file to an individual disk spindles.
2. For all data files in the R/3 system, enable "Autogrowth" option using SQL Server tools. Set the file growth to at least 100 MB.
3. Starting from SQL Server 2008 on Windows 2008R2 you can rely on automatic growth feature if a number of prerequisites are met. Please check SAP Note 1238993 for details.
4. Ensure that after a manual or automatic file expansion all data files have approximately equal amount of free space in them.
Note: Your current database file settings are:
Database File Name Growth activated?
Growth not restricted?
Next 2 steps possible?
Next step size
Free Space on File
Data file full?
Rating
P:\DataVol1\SqlData\PBDDATA1.mdf
60.00 MB
676 MB
P:\DataVol2\SqlData\PBDDATA2.ndf
60.00 MB
681 MB
P:\DataVol3\SqlData\PBDDATA3.ndf
60.00 MB
682 MB
P:\DataVol4\SqlData\PBDDATA4.ndf
60.00 MB
680 MB
P:\DataVol1\SqlData\PBDDATA5.ndf
60.00 MB
680 MB
P:\DataVol2\SqlData\PBDDATA6.ndf
60.00 MB
681 MB
P:\DataVol3\SqlData\PBDDATA7.ndf
60.00 MB
674 MB
P:\DataVol4\SqlData\PBDDATA8.ndf
60.00 MB
676 MB
Recommendation:
Use SQL Server tools to change the data file settings and ensure that enough free space is available. The standard settings for database files are: - Autogrowth = Enabled - File growth = at least 100 MB - No growth limit set
We found the following incorrect settings in system PBD:
The step size configured for automatic file growth is smaller than the recommended size of 100 MB.

26
14.1.3 Transaction Log File Settings
When transaction log files of an SQL Server database are full, log files can grow automatically, limited only by the space available on the Windows partition. This is only true if the files are allowed to grow and sufficient space is available.
The current settings of your transaction log files are as follows:
Transaction Log File Name Growth activated?
Growth not restricted?
Next step possible?
Next step size
P:\DataVol5\SqlLog\PBDLOG1.ldf
10.00 %
The log file settings in system PBD are correct.
14.1.4 Tempdb Size and Settings
A NetWeaver installation uses database statements that need a lot of tempdb space. In some cases, the tempdb database may grow beyond 10 GB. Therefore, it is important to provide enough disk space for tempdb.
File Name Growth activated?
Growth not restricted?
Next step possible?
Next step size
File size
Initial file size
Growth restricted to
Free on partition Rating
tempdb.mdf
10.00 %
20000 MB
20000 MB no limit 56343
MB
templog.ldf
10.00 %
142 MB 50 MB no limit 21142
MB
Tempdb Free Space Space Usage Size (MB) Database size 20000 free in partition P 56343 DB size + free in partitions 76343 Transaction log size 142 free in partition P 21142 Log Size + Free in Partitions 21284
Recommendation: Set the size of database tempdb to at least 10 GB. Set the size of the transaction log of database tempdb to at least 200 MB.
Recommendation: Set the properties of the database files of tempdb to grow automatically in increments of at least 250 MB or 20% of the tempdb size. Do not specify a growth limit. For the transaction log files, set the properties to grow automatically in increments of at least 20 MB or 10% of the log size. To ensure that the tempdb can grow automatically, make sure that there is enough free space on the drive on which the database files of tempdb are located.

27
Recommendation: Ensure that the data and log files of database tempdb do not need to grow. If the 'File size' is larger than the 'Initial file size', the database expanded since the last database restart. For performance reasons, you should avoid this by setting the initial data size to a value that is larger than the current value. These settings may be considerably higher than the 2 GB for the data files and the 200 MB for the log files mentioned above.
14.2 Environment and Operating In this section, basic information on the database and its software environment are shown.
14.2.1 Database Growth
The figures show a history of the total size and usage of the database files.
14.2.2 Largest Tables
The following table shows the largest tables currently in the database.
Table Name Data (kB)
Reserved (data + indexes) kB
Used (data + indexes) kB Rows Modified
Rows
REPOLOAD 3099672 3111104 3104912 99994 8065
REPOSRC 2044784 2107200 2097096 1184256 26952
/BIC/FZPBF_C03 138880 885440 842984 5694060 0
/BIC/B0000546000 807288 887680 817496 8872674 0
D010TAB 212920 568768 568464 11745744 16
/BP09/FPROJ_1 99224 433976 394920 3190526 0
/BIC/FZPBF_C01 61960 396768 359576 2344780 0

28
Table Name Data (kB)
Reserved (data + indexes) kB
Used (data + indexes) kB Rows Modified
Rows
/BP09/AHRPAO0700 159128 361216 328648 2582534 0
DOKCLU 290344 311680 293248 439960 0
OCSCMPLOBJ 261496 311104 292600 891320 0
14.2.3 Service Pack
SAP always recommends the latest SQL Server Service Pack. For details on the SAP support strategy for SQL Server, see SAP Note 62988.
The recommendations for this check are as up to date as the SAP Service Tool.
Build In Use Builds Comment Release
Date
3153
11.00.3321 2765331 Cumulative update package 1 (CU1) for SQL Server 2012 Service Pack 1 11/20/2012
11.00.3335 2800050 FIX: Component installation process fails after you install SQL Server 2012 SP1 01/14/2013
11.00.3339 2790947 Cumulative update package 2 (CU2) for SQL Server 2012 Service Pack 1 01/25/2013
11.00.3349 2812412 Cumulative update package 3 (CU3) for SQL Server 2012 Service Pack 1 03/18/2013
11.00.3350 2832017 FIX: You can’t create or open SSIS projects or maintenance plans after you apply Cumulative Update 3 for SQL Ser
04/17/2013
11.00.3368 2833645 Cumulative update package 4 (CU4) for SQL Server 2012 Service Pack 1 05/31/2013
11.00.3373 2861107 Cumulative update package 5 (CU5) for SQL Server 2012 Service Pack 1 07/16/2013
11.00.3381 2874879 Cumulative update package 6 (CU6) for SQL Server 2012 Service Pack 1 09/16/2013
11.00.3393 2894115 Cumulative update package 7 (CU7) for SQL Server 2012 Service Pack 1 11/18/2013
11.00.3401 2917531 Cumulative update package 8 (CU8) for SQL Server 2012 Service Pack 1 01/20/2014

29
Build In Use Builds Comment Release
Date
11.00.3412 2931078 Cumulative update package 9 (CU9) for SQL Server 2012 Service Pack 1 03/18/2014
11.00.3431 2954099 Cumulative update package 10 (CU10) for SQL Server 2012 Service Pack 1 05/19/2014
11.00.3437 2969896 FIX: Data loss in clustered index occurs when you run online build index in SQL Server 2012 (Hotfix for SQL2012
06/10/2014
11.00.3449 2975396 Cumulative update package 11 (CU11) for SQL Server 2012 Service Pack 1 07/21/2014
11.00.3460 2977325 MS14-044: Description of the security update for SQL Server 2012 Service Pack 1 (QFE) 08/12/2014
11.00.3470 2991533 Cumulative update package 12 (CU12) for SQL Server 2012 Service Pack 1 09/15/2014
11.00.5058 SQL Server 2012 Service Pack 2 (SP2) 06/10/2014
11.00.5522 2969896 FIX: Data loss in clustered index occurs when you run online build index in SQL Server 2012 (Hotfix for SQL2012
06/20/2014
11.00.5532 2976982 Cumulative update package 1 (CU1) for SQL Server 2012 Service Pack 2 07/24/2014
11.00.5548 2983175 Cumulative update package 2 (CU2) for SQL Server 2012 Service Pack 2 09/15/2014
11.00.5556 3002049 Cumulative update package 3 (CU3) for SQL Server 2012 Service Pack 2 11/17/2014
Full information about all SQL server builds is linked in Microsoft Knowledge Base Article 321185.
14.2.4 Database Maintenance Jobs
Job SAP Note Rating
Blocking Lockstats Job not Scheduled! (CCMS Blocking Locks statistics) 547911
DBCC Job not Scheduled! (CCMS Check Database) 142731
Update Tabstats Job not Scheduled! (CCMS Update Table Statistics) 1027512
There are a number of database maintenance jobs that should be scheduled in order to alleviate troubleshooting and help with the administration of your system. Some of these jobs are not scheduled.

30
14.2.5 SAP Notes for SQL Server
The following SAP Notes contain useful information to operate the NetWeaver system on SQL Server.
SAP Note Title
151603 Copying an SQL Server database
1660220 Microsoft SQL Server: Common misconceptions
1684545 SAP Installation Media and SQL4SAP for SQL Server 2012
1702408 Configuration Parameters for SQL Server 2012
1712785 Support for Microsoft SQL Server 2012
1725220 New Trace Flags set and recommended with SQL Server 2012
1730470 SQL Agent Job History(Log Size Limits) configuration
1744217 MSSQL: Improving the database performance
15 BW Checks for PBD
Some problems were detected, that may impair your system's performance and stability. You should take corrective action as soon as possible.
Rating Overview Rating Check
BW Administration & Design
BW Reporting & Planning
BW Warehouse Management
The first table above contains the ratings for the three main areas in this service. To identify what check causes one area (such as BW Administration & Design) to receive a RED rating, the individual checks with RED ratings are listed in subsequent tables with information about the check name and the main area to which the check belongs.
In general, the checks are structured in a hierarchy and, in most cases, a check with a RED rating will propagate the rating to its parent check. For this reason, it usually makes sense to follow the recommendations for the check at the lowest level in the hierarchy.
However, not all checks propagate their rating to their main check. In other words, a section can have a GREEN rating even though one of its checks has a RED rating.

31
15.1 BW Administration & Design
15.1.1 BW - KPIs
Some BW KPIs exceed their reference values. This indicates either that there are critical problems or that performance, data volumes, or administration can be optimized.
Follow the recommendations below. Note If a large number of aggregates have 0 calls or are suggested for deletion, please check whether you deactivate (that is, delete the content of) aggregates before your roll-up/change runs. Aggregates recommended for deletion may include those that were recently deactivated and have not been used between deactivation and data collection for this service.
KPI Description Observed Reference Rating
Relevant for Overall Service Rating
Lock Server Implementation Not Properly (1=True)
Lock server implementation not align with SAP standard (1=True, 0=False)
1 1 YELLOW NO
Planning queries without Cache Mode 5 (#)
Number of planning queries without cache mode 5 (#)
1 1 YELLOW NO
Planning queries without using Selection of Structure Elements (#)
Number of planning queries without "use Selection of Structure Elements"(#)
1 1 YELLOW NO
Cache Mode of Plan Queries: Consider switching to cache mode 5 (BLOB/Cluster Enhanced) for your plan buffer queries because this setting provides better support for processing large result sets compared to other cache modes. For more information, see SAP Note 1026944. Cache mode 5 is not active by default. You need to set RSADMIN parameter RSR_CACHE_ACTIVATE_NEW = X using report SAP_RSADMIN_MAINTAIN and select the cache mode for the relevant InfoProviders in transaction RSRT or RSDIPROP.
Structure Elements: In some cases, the "Use Selection of Structure Elements" option (transaction RSRT -> Properties) can improve the performance of query executions. This option is normally used with plan buffer queries. By default, the OLAP cache contains all key figures, which means that all key figures will be read. The setting should be activated for plan buffer queries to avoid this kind of behavior and improve performance. See also SAP Note 1358706 'Incorrect data when KIDSEL and delta cache are used'. Implement the SAP Note before using this option with the delta cache option.
Lock Server Performance: Wait times for retrieving locks in SAP BW planning may be high if several users are working in parallel. Transaction SM12 will temporarily show a large number of lock entries.

32
If you find locks in SAP BW planning, reduce the number of lock-relevant characteristics to improve performance. Maintain the settings in transaction RSPLAN (RSPLSE). This is particularly important if multiple users are working in parallel in your planning application. Ensure that the size of the SAP BW planning lock server is large enough to prevent overflows. We recommend a lock server size of 200 MB. The size of the SAP lock server lock table should be set to 20000 (20MB) at least.
For more information, see SAP Note 928044.
15.1.2 Data Distribution
15.1.2.1 Largest DSO tables
DSOName Active Table name # Records
/PBFBI/HRPA /BP09/AHRPAO0700 2,582,534
/PBFBI/HRPA /BP09/AHRPAO0800 607,992
/PBFBI/HRPA /BP09/AHRPAO0500 211,200
/PBFBI/HRST /BP09/AHRSTO0500 211,200
/PBFBI/HRPA /BP09/AHRPAO0300 73,836
/PBFBI/HRST /BP09/AHRSTO0300 73,836
/PBFBI/HRPA /BP09/AHRPAO0900 70,931
/PBFBI/HRPA /BP09/AHRPAO0100 28,785
/PBFBI/HRST /BP09/AHRSTO0100 28,785
/PBFBI/HRPA /BP09/AHRPAO1000 24,156
Large DataStore objects can have a negative impact on reporting and upload performance. See the detailed recommendations in the subsequent sections of this report.
Note: Keep in mind that the values in the table below are based on database statistics. If you have not updated the database statistics for the DataStore objects recently, the values do not reflect the latest status.
15.1.2.2 Largest InfoCubes
The values in the "Records" column are the sum of the number of rows in the E and F tables. If they exceed specified threshold values, a YELLOW or RED rating will be propagated by this check in the session. The threshold values are 500,000,000 for YELLOW and 1,000,000,000 for RED.
InfoCube Name # Records

33
InfoCube Name # Records
ZPBF_C03 5,694,060
/PBFBI/PROJ_1 3,190,526
ZPBF_C01 2,344,780
Recommendations
The more records that are stored within an InfoCube, the more time is needed for administrative and/or maintenance tasks for the cube. Follow these guidelines to keep the number of records as small as possible and, therefore, manageable.
The more records (requests) that are stored in the F-fact table, the longer queries have to run to collect all relevant entries for their result sets. It also increases the time needed to delete and recreate secondary indexes before and after uploads into the cube, which is mandatory/advisable on some databases. Compress as many requests as possible. Depending on the cube design, this may also reduce the total number of records.
Query runtimes generally deteriorate if there are too many records, simply because the individual database tables get too big. If possible from a business perspective, archive or delete data that is no longer relevant for reporting.
If you cannot remove any records for business reasons, consider splitting one InfoCube into multiple physical objects. Split the InfoCube into multiple cubes using a suitable characteristic (time-based, region-based, and so on) and combine these cubes within a MultiProvider for reporting purposes. This concept is known as logical partitioning. On a BW release >= 7.30, you can use a semantically partitioned object (SPO) to benefit from the advantages of logical partitioning (smaller physical objects) without the maintenance overhead formerly attached to this strategy.
15.1.3 Analysis of InfoProviders
15.1.3.1 InfoProvider Distribution
The following section provides an overview of the distribution of your InfoProviders. Note that the following overview table takes into account only objects that can currently be used for reporting.
Info Providers
Basis Cubes
Multi Providers Aggregates Virtual
Cubes Remote Cubes
Transactional Cubes
DSO Objects
Info Objects
Info Sets
411 15 31 2 0 17 17 28 299 2
Aggregates
The table below displays the top 3 InfoCubes regarding the number of their aggregates.
InfoCube # Aggregates
0TCT_C22 1

34
InfoCube # Aggregates
0TCT_C23 1
DSO Object
The following table provides a summary of the DataStore objects.
Description: SIDs Generation upon Activation You can use this flag to specify whether the DSO should be directly available for BEx queries. In this case, SIDs will be created for all InfoObject fields while the DSO is being activated. Contrary to BW 3.X, you can also execute queries on a DSO without reporting flag. In this case, the query would create necessary SIDs during its runtime, which can lead to a long response time. SIDs created in this way are stored persistently, which is why subsequent query executions do not have to create them again. If the DSO is only used as a data container, that is, not for reporting, you can deselect the flag to improve the performance of the activation. Should you use a DSO without reporting flag as a BW-internal DataSource, SIDs will be generated during the activation of subsequent DSOs (if the reporting flag is set) or, at the latest, during the upload into InfoCubes. The "SIDs Generation upon Activation" can be selected/deselected even if the DSO already contains data.
Note that you must not deselect the flag if you want to use the referential integrity check within 3.x InfoPackages or DTPs loading into the DSO. Unique Data Records If each key field combination is loaded only once, you can select the "Unique Data Records" indicator. In this case, the system does not need to check whether the same key field combination already exists in the active table of the DSO during its activation. Instead, mass inserts into the active table can be executed directly, which improves activation performance.
Important: If the "Unique Data Records" indicator is selected, the BW system does not guarantee unique records by deleting duplicates based on the DSO key fields. For this reason, the DataSource must ensure that only unique records are delivered. If this is not the case, the DSO activation terminates. Please note that this feature only works if the "SIDs Generation upon Activation" flag is set. Simultaneous Activation In SAP NetWeaver BW 7.0, you can activate the DSO data in parallel work processes to optimize the load performance. If you activate the requests of a DSO object in parallel, the data of the activation queue is read and packaged. The data packages are then processed in several concurrent processes (dialog or background). You can set the number of processes used for DSO activation in the maintenance view for DSO Objects (transaction RSODSO_SETTINGS), depending on the availability of your work processes. You can also specify a server group or a server that you want to use to activate the DSO data. Note that SAP recommends using background processes for reasons of stability and administration.
# DSO Objects
# DSO Objects with BEX flag
# DSO Objects with unique flag
# Transactional DSO Objects
103 28 0 67
15.1.3.2 InfoCube Design of Dimensions

35
We checked for InfoCubes with one or more dimensions containing 30% or more entries compared to the number of records in the fact tables and found that the design of your InfoCubes complies with our recommendations.
Explanation: The ratio between the number of entries in the dimension tables and the number of entries in the fact table should be reasonable. If an InfoObject has almost as many distinct values as there are entries in the fact table, the dimension this InfoObject belongs to should be defined as a line item dimension. Instead of creating a dimension table that has almost as many entries as the fact table, the system then writes the data directly to the fact table. On the other hand, if there are several dimension tables with very few entries (for example, less than 10), those small dimensions should be combined in just one dimension. In order to obtain this information for your InfoCubes: - Call transaction RSRV. - Choose "All Elementary Tests" - "Database." - Double-click the line "Database Information about InfoProvider Tables." - In the window on the right, choose "Database Information about InfoProvider Tables." - Enter the InfoCube name and choose "Execute Tests." - After the analysis finishes, choose "Display Messages" and open the analysis tree with the correct time stamp.
15.1.4 Analysis of Aggregates
Aggregates only improve performance when they are used by your queries and when they summarize the data of the structure from which they are built (the InfoCube or another aggregate). Unused or incorrect aggregates consume space in your database and increase the time needed for the rollup and the change run procedure. For this reason, you should create proper aggregates in your system and regularly check that you are using the proper aggregates. We offer the following training courses for performance optimization:
TEWA50 - SAP BW Query Tuning with Aggregates. For more details about training, please refer to http://service.sap.com/empoweringworkshops
Maintenance of Aggregate
Notification:
The data collector that provides the information for this chapter has been rewritten for performance reasons.
To benefit from this change, apply either the latest version of ST-A/PI release 01R or the current version of SAP Note 1808944 in addition to ST-A/PI release 01Q. Note that this has to be done on the BW system and not on the SAP Solution Manager.
Name Rollup (Re)Creation Delta Change Total
/
# Executions 0.0 0.0 0.0 0.0
Total time [s] 0.0 0.0 0.0 0.0
Avg. total time [s] 0.0 0.0 0.0 0.0
Avg. read time [s] 0.0 0.0 0.0 0.0

36
Name Rollup (Re)Creation Delta Change Total
Avg. insert time [s] 0.0 0.0 0.0 0.0
Avg. index time [s] 0.0 0.0 0.0 0.0
Avg. analyze time [s] 0.0 0.0 0.0 0.0
Avg. condense time [s] 0.0 0.0 0.0 0.0
Avg. # records (read) 0.0 0.0 0.0 0.0
Avg. # records (inserted) 0.0 0.0 0.0 0.0
15.1.5 Number Range Buffering for BW Objects
For each characteristic and dimension, BW uses a number range to uniquely identify a value (SIDs and DIM IDs). If the system creates a high amount of new IDs periodically, the performance of a data load may decrease.
To avoid the high number of accesses to the NRIV table, activate number range buffering for these BW objects (Main Memory Number Range Buffering). For more detailed information, see SAP Notes 504875, 141497, and 179224.
To map InfoCube dimensions to their number range objects, use table RSDDIMELOC with INFOCUBE = <Infocube Name> to find the number range object in the NOBJECT field.
To map InfoObjects to their number range objects, use table RSDCHABASLOC with CHABASNM = <InfoObject Name>. The number range object is the value of NUMBRANR with the prefix 'BIM'.
The tables below provide an overview of the number range buffering settings of dimensions and InfoObjects, sorted in descending order by the number range level ("Level"). This information identifies candidates for activating the number range main memory buffer.
Recommendation Activate number range buffering for all dimensions and InfoObjects with a high number of rows, based on the rules in SAP Note 857998. Note that you must NEVER buffer the package dimension of an InfoCube nor the InfoObject 0REQUID (usually number range object BIM9999998).
Note
Neither the number of DIM IDs in a dimension table nor the number of SIDs of an InfoObject may exceed the threshold value of 2,000,000,000 (technical limitation). Coming close to this limit points to a problem with your dimension and/or InfoObject modeling. In this case, the corresponding data model should be refined. For a thorough discussion of this topic, see SAP Note 1331403. If a dimension or InfoObject has more than 1,500,000,000 entries, a RED rating is set for this check, unless you confirm that you have taken precautions to prevent further growth of the object in question.
Top10 Unbuffered dimensions with highest number range level InfoCube Dimension # Rows NR Object NR Level ZPBF_C01 ZPBF_C012 32,465 BID0001232 32,465 ZPBF_C03 ZPBF_C032 31,903 BID0001388 31,903 ZPBF_C01 ZPBF_C011 24,752 BID0001231 24,752

37
Top10 Unbuffered dimensions with highest number range level InfoCube Dimension # Rows NR Object NR Level ZPBF_C01 ZPBF_C015 13,621 BID0001235 13,621 ZPBF_C03 ZPBF_C031 12,824 BID0001387 12,824 ZPBF_C02 ZPBF_C025 1,859 BID0001347 1,864 ZPBF_C01 ZPBF_C013 1,647 BID0001233 1,647 ZPBF_C03 ZPBF_C033 1,496 BID0001389 1,496 ZPBF_C01 ZPBF_C01B 943 BID0001240 943 ZPBF_C02 ZPBF_C022 901 BID0001344 905 Top10 Unbuffered InfoObjects with highest number range level InfoObject SID Table # Rows NR Object NR Level /PBFBI/FUND /BP09/SFUND 17,022 BIM0000280 84,630 /PBFBI/EMPLOYE /BP09/SEMPLOYE 9,806 BIM0000263 79,499 /PBFBI/RPT_JOB /BP09/SRPT_JOB 79,488 BIM0000339 79,488 /PBFBI/FUND_CT /BP09/SFUND_CT 56,566 BIM0000285 56,566 /PBFBI/GRANT /BP09/SGRANT 39,106 BIM0000288 39,106 ZTRN_DEPT /BIC/SZTRN_DEPT 26,812 BIM0001364 26,812 /PBFBI/RPT_EMP /BP09/SRPT_EMP 26,067 BIM0000338 26,067 /PBFBI/LNAME /BP09/SLNAME 7,598 BIM0000302 7,598 /PBFBI/PYSCLVL /BP09/SPYSCLVL 722 BIM0000333 5,600 ZRES_CCTR /BIC/SZRES_CCTR 5,240 BIM0001412 5,240
TOP 10 Buffered InfoObjects with Highest Number Range Level
Since there is no InfoObject for which number range buffering is currently used, we cannot display the TOP 10 list of buffered InfoObjects.
15.1.6 DTP Error Handling
The first table below shows an overview of the error handling usage of the active data transfer processes in the BW system. It indicates the total number of active DTPs and the number of DTPs using the four different error handling options.
The second table shows the number of existing error DTPs as well as the number of missing and unnecessary ones. 'Missing' in this context means that a DTP uses error handling option 3 or 4 but no error DTP exists for it. This may indicate that error handling is being used inadvertently and could be deactivated to improve performance. 'Unnecessary' refers to error DTPs of which the source DTP does not use error handling. These error DTPs, therefore, could probably be deleted. This is a pure maintenance task; there is no effect on performance whatsoever.
DTP Overview - Error Handling
# DTPs
#1 Deactivated
#2 No Update, No Reporting
#3 Update Valid Records, No Reporting
#4 Update Valid Records, Reporting Possible
90 4 47 35 4 DTP Overview - Error DTPs # Error DTPs # Missing Error DTPs # Unnecessary Error DTPs
3 38 2
Recommendation:

38
Deactivate error handling with error stack creation if not required:
Do not use error handling with error stack creation for every upload. Use the 'No Update, No Reporting' option instead. We recommend using error handling with error stack creation only once per data flow, usually for the first DTP in a dataflow, when the potential for incorrect data delivery from the source system is highest. For further data mart uploads, use it only where necessary (for example, with a very complex, error-prone transformation routine in a certain upload).
When using error handling with error stack creation:
Error handling with error stack creation also filters out correct records for data targets that require sorting, when semantic grouping is activated. As semantic grouping causes a sorting and re-packaging of the source packages, which allows loading in parallel packages afterwards to the data targets, it is also resource intensive. For this reason, we advise not using it in every upload where error handling with error stack creation is activated. Instead, it should be used only when it is necessary to support parallel loading. Here is a quick matrix:
Use semantic grouping when loading with error handling (and error stack) to the following targets to support parallel loading:
- InfoObject
- standard DSO or write-optimized DSO with semantic key
Do not use semantic grouping when loading with error handling (and error stack) to the following targets (as they allow parallel loading anyway):
- InfoCube
- write-optimized DSO without semantic key
Differences between option 1 'Error Handling deactivated' and option 2 'No update, no reporting'
If an incorrect record exists while using option 1 'Error Handling deactivated', the error is reported at data package level, that is, it is not possible to identify the incorrect record(s). With option 2 'No update, no reporting', the incorrect record(s) is/are highlighted so that the error can be assigned to specific data records. This makes it easier to correct the request in the source system. As neither scenario writes to the error stack, the whole request is terminated and has to be loaded again in its entirety. The performance difference between option 1 and option 2 is minimal, especially when compared to an error handling option using the error stack (options 3 and 4).
15.1.7 Recommendations for BW System PBD
15.1.7.1 Important SAP Notes for BW
The table below lists important SAP Notes for BW that address performance.
Important notes for BW 7.x SAP Note Number Description
1392715 DSO req. activation:collective perf. problem note 1331403 SIDs, Numberranges and BW Infoobjects 1162665 Changerun with very big MD-tables 1136163 Query settings in RSRT -> Properties 1106067 Low performance when opening Bex Analyzer on Windows Server

39
Important notes for BW 7.x SAP Note Number Description
1101143 Collective note: BEx Analyzer performance
1085218
NetWeaver 7.0NetWeaver 7.x BI Frontend SP\Patch Delivery Schedule
1083175 IP: Guideline to analyze a performance problem 1061240 Slow web browser due to JavaScript virus scan 1056259 Collective Note: BW Planning Performance and Memory 1018798 Reading high data volumes from BIA 968283 Processing HTTP requests in parallel in the browser 914677 Long runtime in cache for EXPORT to XSTRING 899572 Trace tool: Analyzing BEx, OLAP and planning 892513 Consulting: Performance: Loading data, no of pkg, 860215 Performance problems in transfer rules 857998 Number range buffering for DIM-IDs and SIDs 803958 Debuffering BW master data tables 550784 Changing the buffer of InfoObjects tables 192658 Setting parameters for BW systems
15.1.7.2 Nametab inconsistencies
Nametab inconsistencies
Table # Total
# View 01
# View 02
# View 03
# View 04
# View 05
# View 06
DDNTT 87 0 49 0 0 0 38 DBDIFF 41 3 0 0 0 0 38 RSDD_TMPNM_ADM 95 8 49 0 0 0 38
There are several entries in tables DDNTT and DDNTF that cannot be found in tables DBDIFF and RSDD_TMPNM_ADM. This means that these temporary entries are obsolete and no longer used.
Recommendation: Check SAP Note 1139396 and run reports SAP_DROP_TMPTABLES and SAP_UPDATE_DBDIFF to clean obsolete temporary entries.
Caution: The report SAP_DROP_TMPTABLES deletes all objects (except for the temporary hierarchy tables) without checking whether they are still in use. This can result in terminations of queries, InfoCube compression, and data extraction, for example, if these are running simultaneously. If temporary objects prove to be inconsistent under DB02, you must execute report SAP_UPDATE_DBDIFF once. If you use the DB02 again afterwards, you must make sure that the system updates the results. The report copies information about differences between definitions in the ABAP DDIC and in the DB catalog to table DBDIFF. DB02 includes the table when checking for inconsistencies.
15.1.8 BW Statistics
Since new data is continuously loaded into the Business Warehouse(BW), the amount of data is always increasing. The structure of such data may also change. You can obtain information about data growth from the statistical data in the "BW Statistics" menu, at InfoCube, query, InfoSource, and aggregate level. These statistics also provide information about the performance of your queries.

40
An overview of the BW processes is essential, and more useful than a detailed view of database statistics, or even CCMS.
Background: When you maintain the settings for the query statistics, deactivating the statistics is the same as activating the statistics internally with detail level 9. In both cases, no statistical data is written. The settings on the "InfoProvider" tab page affect the collection of statistical data for queries, as well as the settings on the "Query" tab page (transaction RSDDSTAT). The following logic applies: If there are settings for the query (other than "Default"), the maintained statistical settings are chosen to write or not write the statistical data. Otherwise, the setting for the InfoProvider on which the query is defined, is used. If there is neither a setting for the query, nor for the InfoProvider (both are "D"), the general default setting maintained for all queries is used. If you have not changed the default settings, the statistics are activated with detail level 1. For Web templates, workbooks, and InfoProviders, you can decide between activating or deactivating the statistics only. If you did not maintain settings for the individual objects, the default setting for the object is used. If you did not change the default settings, the statistics are activated. The following table contains an overview of the current statistical settings for the different objects.
Object Statistics activated? Detail Level # Objects
Query Element X 1 246
Object Statistics activated? Statistics deactivated? # Objects
Aggregation Level X 32
Web Template X 163
Workbook X 2
InfoProvider X 368
BW Technical Content for Statistical Data
From NetWeaver BW 7.0, activate the technical content for the BW statistical data. You can then use many additional features, such as ST03N. Process chains are also provided to facilitate the administration of the statistical data and provide routines for automatic deletion of the RSDDSTAT* tables. The table below provides an overview of the technical content for statistical data currently available in your system. This table provides the Basis InfoProviders and the corresponding MultiProviders and Virtual Cubes. The current object version and the date when the statistical data was last uploaded to the Basis InfoProvider are also listed. If there is no table, you have not yet imported any technical content. Upload the statistical data at least once a week.
Recommendation: Activate the technical content and upload the data regularly. For further information, see SAP Note 934848, steps 1 to 5.
Basis InfoProvider
Object Version
Last Upload
MultiProvider Object Version
Virtual Cube Object Version
Long Description Basis InfoProvider
0TCT_C01 A 00/00/0000 A A Front-End and OLAP Statistics

41
Basis InfoProvider
Object Version
Last Upload
MultiProvider Object Version
Virtual Cube Object Version
Long Description Basis InfoProvider
(Aggregated)
0TCT_C02 A 00/00/0000 A A Front-End and OLAP Statistics (Details)
0TCT_C03 A 00/00/0000 A A Data Manager Statistics (Details)
0TCT_C05 A 00/00/0000 A A OLAP Statistics: Cache type Memory Consumption
0TCT_C12 D 00/00/0000 A A Process Status
0TCT_C14 D 00/00/0000 D Report Availability Status
0TCT_C15 A 00/00/0000 A BW Data Storages with inconsistent and incomplete data
0TCT_C21 A 00/00/0000 A A Process Statistics
0TCT_C22 A 00/00/0000 A A DTP Statistics
0TCT_C23 A 00/00/0000 A A InfoPackage Statistics
0TCT_C25 A 00/00/0000 A Database Volume Statistics
0TCT_C31 A 00/00/0000 A A BWA Statistics: CPU Consumption
0TCT_C32 A 00/00/0000 A A
BWA Statistics: InfoProvider Memory Consumption
0TCT_CA1 A 00/00/0000 A A Front-End and OLAP Statistics (Highly Aggregated)
15.2 BW Reporting & Planning
15.2.1 BW Runtime Statistics for PBD

42
The performance of your queries and upload was analyzed with respect to average runtime and total workload. The following table provides an overview of your system activity and performance from the BW point of view.
Note: All queries using the 'Read API' of your system (such as from connected SAP-APO or SAP-SEM systems) are named 'RSDRI_QUERY,' so you cannot locate them in your BW system. Please note that the following chapters only contain queries/InfoCubes for which the statistics indicators are set.
Task type
Navigation steps
Runtime > 20 seconds [%]
Avg. runtime [s]
Avg. time OLAPCACHE [s]
Avg. time OLAP [s]
Avg. time DB [s]
Avg. time Frontend [s]
Other time/ RFC [s]
All Queries 333 22 49.0 0.0 3.0 0.9 22.6 22.0
15.2.1.1 Top Infoprovider per Queries
The following table lists the top five InfoProviders based on the number of query hits.
Top InfoProviders per number of queries
InfoProvider Query Steps
Avg. runtime [s]
Runtime [%]
Avg. time OLAP [s]
Avg. time DB [s]
Avg. time Planning [s]
Avg. Frontend time [s]
Avg. Time Others/ RFC [s]
ZPBF_M01 46 155.30 46 0.10 0.00 0.00 153.10 1.40 /PBFBI/FUND_CT 54 91.60 32 8.50 0.10 0.00 0.60 82.10 /PBFBI/POSTN 47 43.30 13 4.00 0.20 0.00 0.70 38.30 /PBFBI/EMPLOYE 21 34.60 5 4.30 0.20 0.00 1.10 29.00 /PBFBI/HR_M04 49 13.90 4 1.00 2.90 0.00 0.60 9.40
15.2.1.2 Frontend Distribution
# Query executions
via BEx Analyzer 7.x
via Business Explorer BW 3.X
via BEx Broadcaster
via RSDRI Interface (API)
via BEx Web 7.x (JAVA)
via MDX Queries (e.g. BPC)
Other
611 1 3 0 8 599 0 0
The table above provides an overview of the front-end distribution. It contains the total number of queries executed over the last complete week (Monday to Sunday) and the number of queries executed from the different front ends.
15.2.1.3 Query Profile Check
Queries
The following table provides a summary of the query runtimes and distinguishes between the different front ends (Queries: BEx Analyzer, BEx Web (ABAP), BEx Web (JAVA), MDX, API, Settings: BEx Broadcaster).
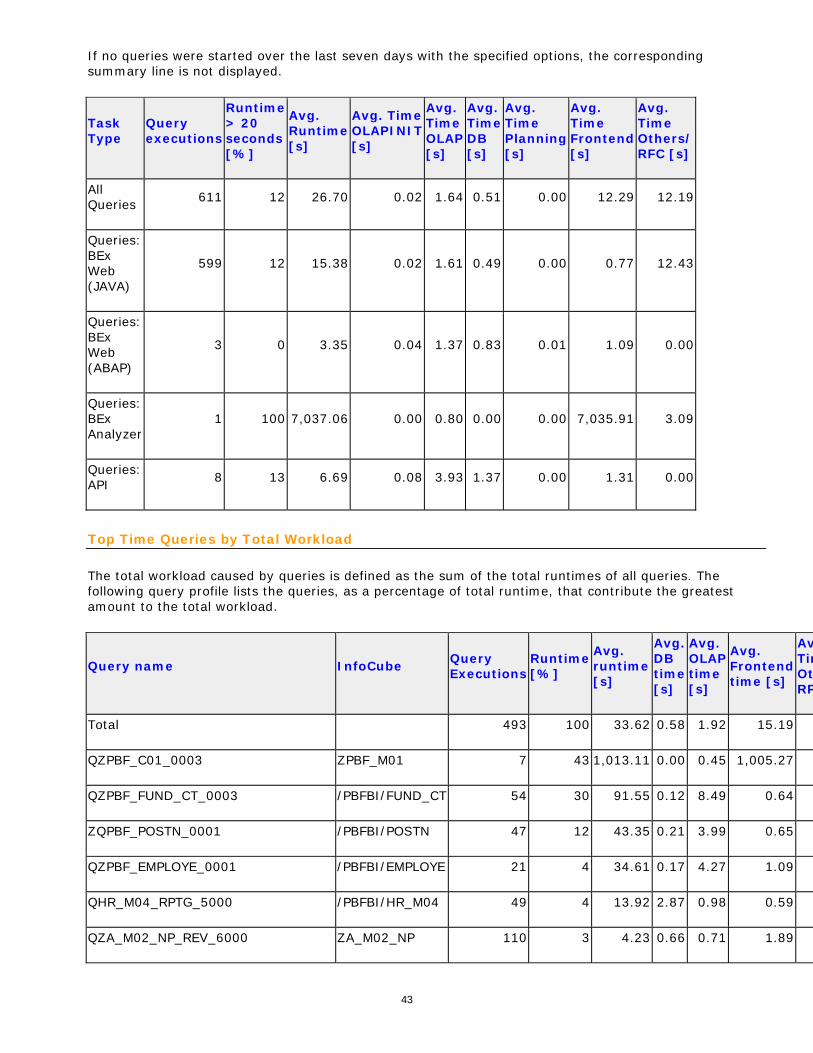
43
If no queries were started over the last seven days with the specified options, the corresponding summary line is not displayed.
Task Type
Query executions
Runtime > 20 seconds [%]
Avg. Runtime [s]
Avg. Time OLAPINIT [s]
Avg. Time OLAP [s]
Avg. Time DB [s]
Avg. Time Planning [s]
Avg. Time Frontend [s]
Avg. Time Others/ RFC [s]
All Queries 611 12 26.70 0.02 1.64 0.51 0.00 12.29 12.19
Queries: BEx Web (JAVA)
599 12 15.38 0.02 1.61 0.49 0.00 0.77 12.43
Queries: BEx Web (ABAP)
3 0 3.35 0.04 1.37 0.83 0.01 1.09 0.00
Queries: BEx Analyzer
1 100 7,037.06 0.00 0.80 0.00 0.00 7,035.91 3.09
Queries: API 8 13 6.69 0.08 3.93 1.37 0.00 1.31 0.00
Top Time Queries by Total Workload
The total workload caused by queries is defined as the sum of the total runtimes of all queries. The following query profile lists the queries, as a percentage of total runtime, that contribute the greatest amount to the total workload.
Query name InfoCube Query Executions
Runtime [%]
Avg. runtime [s]
Avg. DB time [s]
Avg. OLAP time [s]
Avg. Frontend time [s]
AvTimOtRF
Total 493 100 33.62 0.58 1.92 15.19
QZPBF_C01_0003 ZPBF_M01 7 43 1,013.11 0.00 0.45 1,005.27
QZPBF_FUND_CT_0003 /PBFBI/FUND_CT 54 30 91.55 0.12 8.49 0.64
ZQPBF_POSTN_0001 /PBFBI/POSTN 47 12 43.35 0.21 3.99 0.65
QZPBF_EMPLOYE_0001 /PBFBI/EMPLOYE 21 4 34.61 0.17 4.27 1.09
QHR_M04_RPTG_5000 /PBFBI/HR_M04 49 4 13.92 2.87 0.98 0.59
QZA_M02_NP_REV_6000 ZA_M02_NP 110 3 4.23 0.66 0.71 1.89

44
Query name InfoCube Query Executions
Runtime [%]
Avg. runtime [s]
Avg. DB time [s]
Avg. OLAP time [s]
Avg. Frontend time [s]
AvTimOtRF
$!1ZPBF_M02 ZPBF_M02 66 2 3.79 0.00 0.00 0.12
QZA_M02_NP_EXP_6001 ZA_M02_NP 43 1 3.68 0.48 0.37 1.72
QZA_M01_SP_FAC_5000 ZA_M01_SP 77 1 2.05 0.28 0.73 0.33
QZA_M02_NP_TRANSFERS_OUT_6006 ZA_M02_NT 19 0 3.20 0.46 0.33 1.11
Top Time Queries by DB Load
The total database workload generated by the BW system is the sum of the total database access times of all queries. The following query profile lists the queries, as percentages of total database access time, that make up the largest part of the database load.
Query name InfoCube # Executions
DB load [%]
Avg. DB time [s]
Avg. Runtime [s]
Total 432 100 0.68 21.52
QHR_M04_RPTG_5000 /PBFBI/HR_M04 49 48 2.87 13.92
QZA_M02_NP_REV_6000 ZA_M02_NP 110 25 0.66 4.23
QZA_M01_SP_FAC_5000 ZA_M01_SP 77 7 0.28 2.05
QZA_M02_NP_EXP_6001 ZA_M02_NP 43 7 0.48 3.68
ZQPBF_POSTN_0001 /PBFBI/POSTN 47 3 0.21 43.35
QZA_M02_NP_TRANSFERS_OUT_6006 ZA_M02_NT 19 3 0.46 3.20
QZPBF_FUND_CT_0003 /PBFBI/FUND_CT 54 2 0.12 91.55
/PBFBI/HRPAO01_Q0001 /PBFBI/HRPAO01 2 1 2.12 14.25
QZA_M02_NP_TRANSFERS_IN_6005 ZA_M02_NT 10 1 0.36 3.33
QZPBF_EMPLOYE_0001 /PBFBI/EMPLOYE 21 1 0.17 34.61
Top Time Queries by Average Runtime
The ten queries whose average runtimes have the highest optimization potential are listed here.

45
Query name InfoCube Avg. Runtime [s]
Avg. DB time [s]
Avg. OLAP time [s]
Avg. Frontend time [s]
Avg. Time Others/ RFC [s]
Total 40.89 0.65 2.26 18.59 18.55
QZPBF_C01_0003 ZPBF_M01 1,013.11 0.00 0.45 1,005.27 7.69
QZPBF_FUND_CT_0003 /PBFBI/FUND_CT 91.55 0.12 8.49 0.64 82.12
ZQPBF_POSTN_0001 /PBFBI/POSTN 43.35 0.21 3.99 0.65 38.32
QZPBF_EMPLOYE_0001 /PBFBI/EMPLOYE 34.61 0.17 4.27 1.09 29.02
/PBFBI/HRPAO01_Q0001 /PBFBI/HRPAO01 14.25 2.12 8.75 3.25 0.00
QHR_M04_RPTG_5000 /PBFBI/HR_M04 13.92 2.87 0.98 0.59 9.36
/PBFBI/HRPAO02_Q0001 /PBFBI/HRPAO02 6.78 1.61 3.62 1.48 0.00
QZA_M02_NP_REV_6000 ZA_M02_NP 4.23 0.66 0.71 1.89 0.38
$!1ZPBF_M02 ZPBF_M02 3.79 0.00 0.00 0.12 0.36
QZA_M02_NP_EXP_6001 ZA_M02_NP 3.68 0.48 0.37 1.72 0.30
15.2.1.4 Queries by Total Workload per Frontend
The tables below contain data about the 10 queries for each step type that consumed the most time with regard to runtime.
Note that these tables contain data about single query executions. This means that the data is not summarized and that the name of a query may appear several times.
Queries: BEx Analyzer 7.x
Query name InfoCube Query Executions
Runtime [%]
Avg. runtime [s]
Avg. DB time [s]
Avg. OLAP time [s]
Avg. Frontend time [s]
Avg. Time Others/ RFC [s]
QZPBF_C01_0003 ZPBF_M01 1 100 7,037.06 0.00 0.80 7,035.91 3.09 Queries: BEx 3.x (ABAP)
Query name InfoCube Query Executions
Runtime [%]
Avg. runtime [s]
Avg. DB time [s]
Avg. OLAP time [s]
Avg. Frontend time [s]
Avg. Time Others/ RFC [s]
QZA_M02_NP_REV_6000 ZA_M02_NP 3 100 3.35 0.83 1.37 1.09 0.00 Queries: BEx Web 7.x (JAVA)
Query name InfoCube Query Executions
Runtime [%]
Avg. runtime [s]
Avg. DB time [s]
Avg. OLAP time [s]
Avg. Frontend time [s]
AvgTimeOtheRFC

46
Queries: BEx Web 7.x (JAVA)
Query name InfoCube Query Executions
Runtime [%]
Avg. runtime [s]
Avg. DB time [s]
Avg. OLAP time [s]
Avg. Frontend time [s]
AvgTimeOtheRFC
QZPBF_FUND_CT_0003 /PBFBI/FUND_CT 54 52 91.55 0.12 8.49 0.64 8ZQPBF_POSTN_0001 /PBFBI/POSTN 47 21 43.35 0.21 3.99 0.65 3QZPBF_EMPLOYE_0001 /PBFBI/EMPLOYE 21 8 34.61 0.17 4.27 1.09 2QHR_M04_RPTG_5000 /PBFBI/HR_M04 49 7 13.92 2.87 0.98 0.59 QZA_M02_NP_REV_6000 ZA_M02_NP 107 5 4.26 0.66 0.70 1.92 $!1ZPBF_M02 ZPBF_M02 66 3 3.79 0.00 0.00 0.12 QZA_M02_NP_EXP_6001 ZA_M02_NP 43 2 3.68 0.48 0.37 1.72 QZA_M01_SP_FAC_5000 ZA_M01_SP 77 2 2.05 0.28 0.73 0.33 QZA_M02_NP_TRANSFERS_OUT_6006 ZA_M02_NT 19 1 3.20 0.46 0.33 1.11 QZPBF_C01_0003 ZPBF_M01 6 1 9.12 0.00 0.39 0.17 Queries: RSDRI (via API)
Query name InfoCube Query Executions
Runtime [%]
Avg. runtime [s]
Avg. DB time [s]
Avg. OLAP time [s]
Avg. Frontend time [s]
Avg. Time Others/ RFC [s]
/PBFBI/HRPAO01_Q0001 /PBFBI/HRPAO01 2 53 14.25 2.12 8.75 3.25 0.00 /PBFBI/HRPAO02_Q0001 /PBFBI/HRPAO02 2 25 6.78 1.61 3.62 1.48 0.00 /PBFBI/HR_I01_Q0001 /PBFBI/HR_I01 2 13 3.42 1.18 1.88 0.33 0.00 /PBFBI/HR_I02_Q0001 /PBFBI/HR_I02 2 9 2.31 0.57 1.49 0.20 0.00
15.2.1.5 Integrated Planning Performance
BW Planning Activities
The table below provides an overview of the integrated planning activities from the past week. You can use this information to identify peak times within your planning cycle. The "No. Users" column displays the number of different users that used planning functions or input queries on a specific day. The plan buffers are technical queries (!!1-Queries) used from both input queries and planning functions to read transactional data from the InfoProviders.
Date # Users # Planning Sequences # Planning Functions # PlanBuffers
04/13/2015 1 0 0 1
04/14/2015 2 0 0 26
04/15/2015 3 0 0 49
04/16/2015 4 0 0 109
04/17/2015 3 0 0 29
All runtimes in the following tables are measured in seconds.
Overview: PlanBuffers

47
An overview of plan buffer executions from the past week is provided below. Plan buffers are technical queries that are automatically generated for each InfoProvider. For example, the plan buffer for InfoProvider ABC is called ABC/!!1ABC. Every input query and planning function uses the plan buffer to read transaction data from the InfoProviders. The "Avg. # Cells" column indicates the number of cells prepared from the OLAP for this query.
For more information about using the plan buffer in integrated planning, see SAP Note 1136131.
Date # Executions Avg. Runtime [s] Avg. # Cells
04/13/2015 1 0.92 0
04/14/2015 26 0.47 40
04/15/2015 49 0.88 19
04/16/2015 109 0.82 22
04/17/2015 29 0.61 160
The following tables list the most performance-critical plan buffers sorted by performance area. These plan buffers showed a high overall runtime or a high runtime in a particular area. However, plan buffers that contributed significantly to the overall planning workload can also be found in the system.
Top PlanBuffers by Single Execution
A list is shown below of the longest running plan buffer executions. If one planning buffer ran several times last week, only the most expensive sequence execution is displayed.
"DM Time [s]" stands for data manager time, for example, the time required to read transaction data from InfoProviders via the data manager. When data is read, DBSEL is the number of records selected from the database. DBTRANS is the number of values transferred (after aggregation). A high ratio of DBSEL/DBTRANS (>10) indicates that an aggregate would improve performance (when BWA is not in use). "Cache Time [s]" is the time required for OLAP cache processing, that is, reading the relevant OLAP cache entries or creating new entries and reading/writing data to the OLAP cache.
InfoProvider Runtime [s]
Cache Time [s]
OLAP Time [s]
DM Time [s]
Other Time [s]
# Cells DBSEL DBTRANS
ZPBF_M02 3 0.07 1.20 1.52 0.01 55 84 55
ZPBF_M01 2 0.04 1.10 0.48 0.01 0 0 0
Top PlanBuffers by Average Runtime
The table below shows the plan buffers with the highest average runtime per execution. In comparison to the table above, statistical outliers can be eliminated by also taking into account the number of calls. The number of calls indicates how often this plan buffer was executed in the last week.

48
InfoProvider # Executions
Avg. Runtime [s]
Avg. Cache Time [s]
Avg. OLAP Time [s]
Avg. DM Time [s]
Avg. Other Time [s]
Avg. # Cells
ZPBF_M02 133 0.91 0.03 0.08 0.78 0.01 20
ZPBF_M01 81 0.53 0.03 0.12 0.37 0.01 79
Top PlanBuffers by Workload Contribution
The table below shows the plan buffers that contributed significantly to the overall BW planning workload (from last week) on your system. The "Runtime [%]" column indicates what percentage of the total runtime (runtime of all plan buffers) was caused by this particular plan buffer.
InfoProvider Runtime [%]
# Executions
Avg. Runtime [s]
Avg. Cache Time [s]
Avg. OLAP Time [s]
Avg. DM Time [s]
Avg. Other Time [s]
Avg. # Cells
ZPBF_M02 74 133 0.91 0.03 0.08 0.78 0.01 20
ZPBF_M01 26 81 0.53 0.03 0.12 0.37 0.01 79
Top PlanBuffers by DataManager Time
The table below shows plan buffers with the highest average data manager runtime. These are plan buffers that show high database-related times and should be tuned with aggregates, BIA indexes, or by adjusting the OLAP cache settings.
InfoProvider # Executions
Avg. DM Time [s]
Avg. Runtime [s]
Avg. # Cells (selected)
Avg. # Cells (transferred)
ZPBF_M02 133 0.78 0.91 33 10
ZPBF_M01 81 0.37 0.53 83 79
15.2.2 BW Workload
15.2.2.1 Workload per User and Navigation Steps
This overview takes into account the following: - The number of users who execute queries independent of the statistical settings (grand total) - This number is grouped according to InfoConsumer, Executive, and Power User (totals), depending on their number of navigation steps - The InfoConsumer is divided again according to the number of navigation steps (subtotals). - The timeframe is the last full week from Monday to Sunday.
User/Consumer Number
49
User/Consumer Number
Grand total: Users performing queries 7
Total: Info Consumer [1 - 400 Nav Steps/ week] 7
...Sub total: Info Consumer 1-10 Nav Steps/ week 2
...Sub total: Info Consumer 11-50 Nav Steps/ week 3
...Sub total: Info Consumer 51-100 Nav Steps/ week 1
...Sub total: Info Consumer 101-200 Nav Steps/ week 1
...Sub total: Info Consumer 201-300 Nav Steps/ week 0
...Sub total: Info Consumer 301-400 Nav Steps/ week 0
Total: Executive [401 - 1200 Nav Steps/ week] 0
Total: Power User [> 1200 Nav Steps/ week] 0
15.2.2.2 Reporting and Upload Workload last week

50
The diagram above shows an overview of the workload distribution with regard to reporting and upload activities from the last week. Note that the values shown do not reflect the actual values. In each case, we have taken the highest value and considered it to be "100". The other values show the ratio to the maximum values. Maximum values are listed below. Note that the minimum requirement is ST-A/PI 01I*. If this has not been applied, no upload activity will be shown in the diagram. If even ST-A/PI 01G* has not been applied, no reporting activities can be measured.
Max. # Navigation Steps Max. # Uploads
57 0
15.2.3 Analysis of Query Definition
# Queries
# Queries with Read Mode 'A'
# Queries with Read Mode 'X'
# Queries with Read Mode 'H'
338 0 155 183
You use the read mode "Query to read when you navigate or expand hierarchies" for all of your queries.
Recommendation Design suitable aggregates for your queries. Make sure that newly created queries use the correct read mode.
Consequences If you use the read mode "Query to read when you navigate or expand hierarchies" and no suitable aggregates are available, performance may be worse than when using the read mode "Query to read data during navigation". It is therefore very important that you create the appropriate aggregates for the read mode "Query to read when you navigate or expand hierarchies". If a query uses no hierarchies, there is no difference between these two read modes.
Background When a user navigates through a report, data can be read from the database in three different ways (the read modes depend on the Cus
tomizing settings): 1. Query to read all data at once 2. Query to read data during navigation 3. Query to read when you navigate or expand hierarchies The first read mode (Query to read all data at once) may cause unnecessary data to be read from the database, decreasing the performance of your queries, so you should only use this read mode in special situations.
Note In most cases, the most appropriate read mode is "Query to read when you navigate or expand hierarchies". You have to adjust the design of the aggregates for this read mode so that expanding hierarchies does not cause the same data to be read again.
15.2.4 Analysis of OLAP Cache

51
The OLAP Cache is used for duplicated storing of query results that are often used, whereby these query results can be accessed quickly. The tables below contain information about the size and the usage of the OLAP Cache.
15.2.4.1 Cache usage of queries
Defined Queries
The OLAP cache can buffer results from queries and provide them again for different users and similar queries (that is, the same queries or real subsets of them). The OLAP cache therefore reduces the workload of the DB server and decreases the response time.
The OLAP cache can store the query results with their navigation statuses in the memory of the application server; the data can also be stored in database tables and files.
When the main memory buffer (located in the export/import shared memory) overruns, the displaced data is either removed or, depending on the persistence mode, stored on the database server. The following OLAP cache modes exist:
0 Cache Is Inactive 1 Main Memory Cache Without Swapping 2 Main Memory Cache with Swapping 3 Persistent Cache per Application Server 4 Persistent Cache Across Each Application Server
5 Query Aggregate Cache
Default Cache Mode
In most cases, the optimal cache mode will be the system default, which depends on the SAP BW release:
*BW release = 3.x --> Mode 1
*BW release = 7.0x/7.1x --> Mode 5 if available, 1 if not
*BW release = 7.3x --> Mode 5
*BW release >= 7.4x --> Mode D
MODE 0 - Cache is Inactive All data is read from the relevant InfoProvider and only the local cache (for navigation of the executed query, for example) is used.
MODE 1 - Main Memory Cache without Swapping New data is stored in the export/import SHM buffer until this memory area is full. If new data then has to be added to the buffer, an LRU mechanism is applied. Data used least recently is permanently removed from the buffer. If this data is requested again by a query, it must access the relevant InfoProvider on the DB server.
MODE 2 - Main Memory Cache with Swapping This works in a similar way to MODE 1. However, if the memory is full and data is removed from the cache, it is not deleted but written to a cluster table/flat file (depending on your cache persistency settings). If this data is then needed again by a query, it can be read from the cluster table/flat file, which is still quicker than reading it from the relevant InfoProvider on the DB server.

52
NOTE: Note that modes 1 and 2 are instance-dependent.
MODE 3 - Persistent Cache per Application Server The cache data is kept persistently in a cluster table or in flat files for each application server. The overall data quantity is only restricted by the database or file system. Swapping does not occur in the same way as with the main memory cache mode.
MODE 4 - Persistent Cache Across Each Application Server This mode is the same as the mode described above (cluster/flat file for each application server), the only difference being that the cache entries of all of the application servers in a system are used together.
NOTE: If you use a flat file as persistent storage for modes 3 or 4, select a directory that is close to the application server(s).
MODE 5 - Query Aggregate Cache (default)
The cache data is persistent in database tables. In this mode, no data is displaced and the memory size is not limited. This method requires more space but it is also the most efficient one.
The way in which data is processed and saved has fundamentally changed in this cache mode compared to the cache modes specified above. No lock concept is used, and there is no central directory for cache elements. This improves performance.
Number of Queries per Cache Mode Cache Mode # Queries Total 339 [0] OFF 156 [1] Main Memory w/o Swapping 135 [5] Query Aggregate Cache 30 [ ] InfoProvider Setting 18 Number of InfoCubes per Cache Mode Cache Mode # Infocubes [0] OFF 17 [1] Main Memory w/o Swapping 30 [5] Query Aggregate Cache 30
As of SAP BW 7.40, there is only one OLAP cache mode (D), which makes use of the global OLAP cache. All queries and InfoProviders that were formerly configured to use the global cache (former cache modes 1-5) will be executed with cache mode D, even though they still show the old OLAP cache values in their metadata.
Therefore, the value for cache mode "D" in the tables above represents the sum of all cache modes (1-5 & D) that use the global OLAP cache.
Currently, of your queries and of your InfoProviders are still set up to use the "old" OLAP cache settings (that is, prior to SAP BW 7.40).
Defined PlanBuffers
Plan buffer queries are technical queries (1 <InfoProvider>) used by input-ready queries and planning functions in SAP BW Integrated Planning to read transaction data. Plan buffers are specific to one InfoProvider, which means they are used by all input-ready queries and planning functions that are based on this InfoProvider. Special rules apply to these queries regarding the use of OLAP cache modes for the following two cases:

53
1) The plan buffer often requests extensive result sets. This can be the case for planning function executions that process a large number of records, possibly even the complete InfoProvider dataset. 2) The plan buffer requests data for multiple selections. This leads to a large number of directory entries in the OLAP cache directory.
Both of these cases can lead to long processing times in the OLAP cache area if cache mode 1 or 2 ("Main Memory Cache") is used. The table below shows which plan buffers in your SAP BW system use these cache modes (a maximum of 20).
PlanBuffer Cache Mode
!!1/PBFBI/BF_CUBE 1
!!1ZPBF_C02 5
!!1ZPBF_M01 5
!!1ZPBF_M02 5
Recommendation:
The new OLAP cache mode "BLOB/Cluster Enhanced" is available as of SAP BW Support Package 16 for SAP NetWeaver 7.0.
We recommend that you use this cache mode for plan buffer queries because it processes large result sets more effectively compared to other cache modes. It does not use the OLAP cache directory. For more information, see SAP Note 1026944. To activate the new OLAP cache mode, set RSADMIN parameter RSR_CACHE_ACTIVATE_NEW to "X" using report SAP_RSADMIN_MAINTAIN and select the cache mode for the relevant InfoProviders in transaction RSRT or RSDIPROP.
Executed Queries

54
The following table provides an overview of the number of navigation steps executed and shows how many query results the OLAP cache was able to provide/ how often the database had to be accessed. Note that RSRDI queries cannot be stored in the OLAP cache and are, therefore, listed separately in the table.
Task type
# Query Executions
Accessed DB [%]
Accessed Cache [%]
RSDRI Queries [%]
All Queries 611 54 46 0
There are two types of caches: The local cache and the transactional cache (OLAP cache). The local cache belongs to a query session and therefore cannot be used by other sessions. The OLAP cache can store query data on the application server and can have a swap file or use a swap cluster table. The OLAP memory cache is located in the Export/Import buffer SHM (parameter rsdb/esm/buffersize_kb). Since the global cache size is a logical value and the Export/Import SHM gives a physical limit, and also considering that other applications (such as BCS) might use the Export/Import SHM, we recommend that you set the global cache parameter maximally to 90% of the Export/Import SHM buffer.
Note: The OLAP cache was optimized in SAP BW 3.0B SP19, SAP BW 3.1C SP13, and SAP BW 3.5 SP02. For more information, see SAP Note 683194).
Rating Description Current Value Recommendation
Cache active Active Active
Cache Persistence Mode Flat File N/A
Flat File Name BW_OLAP_CACHE N/A
Comprehensive Flat File Name for AppServer N/A
Local Cache Size (MB) 4 N/A
Global Cache Size (MB) 4 Please check SAP Notes 656060 and 702728.
Exp/Imp SHM (KB) on Instance PBD01_PBD_01 4096 4096
Recommendation:
Check your cache settings carefully using transaction RSRCACHE or RSCUSTV14. We recommend that you set the OLAP cache to active and the global cache size to 90% of the size of the Export/Import SHM buffer. Please note that the global cache size is defined in MB while the Export/Import SHM buffer parameter is configured in KB.
15.3 BW Warehouse Management
55
15.3.1 Upload Statistics
15.3.1.1 Number of weekly requests
Week Requests to source
Requests to myself
Requests schedule w/o Process Chain
Requests scheduled by a Process Chain Total
15/2015 11 0 1 10 11
14/2015 1 0 1 0 1
13/2015 7 0 7 0 7
12/2015 10 0 10 0 10
11/2015 5 0 5 0 5
15.3.1.2 Number of weekly received records
Records sent to BW by external source
Week PSA and the into Data Targets
PSA and Data Targets in parallel
Only PSA Data Targets Only
Total number of records
15/2015 0 0 1,107,683 0 1,107,683 14/2015 0 0 26,977 0 26,977 13/2015 0 0 161,799 0 161,799 12/2015 0 0 150,038 0 150,038 11/2015 0 0 300,942 0 300,942 Records sent by source system Week Logical system name Source Type Total records 15/2015 FLATFILES F 1,412 15/2015 R3PCLNT300 D 1,106,271 14/2015 FLATFILES F 26,977 13/2015 BWPCLNT100 D 26,235 13/2015 FLATFILES F 80,935 13/2015 R3PCLNT300 D 54,629 12/2015 FLATFILES F 3,891 12/2015 R3PCLNT300 D 146,147 11/2015 BWPCLNT100 D 205,915 11/2015 R3PCLNT300 D 95,027
15.3.1.3 Transactional data load statistics (RSDDSTATWHM)
This section provides an overview of the execution of InfoPackages that do not only load into PSA but also (or only) into InfoProviders. Only transactional data uploads are taken into account.
We could not detect any uploads of transactional data from 04/13/2015 to 04/20/2015. This means that either no such InfoPackage was executed in the analyzed period or that the statistics are not properly

56
collected in the system. To rule out the latter, check the activation status of the BW WHM statistics as described below.
Collection of BW Statistics Call the Administrator Workbench (transaction RSA1) and choose Tools -> "Settings for BI Statistics", or call transaction RSDDSTAT: --> Switch to the InfoProvider tab and activate the statistics settings.
15.3.1.4 Top DTP Load
The following table provides an overview of the load caused by data transfer processes in your BW system during the past week. Note that the cumulated times displayed may be larger than the total times. When cumulated times are calculated, all times are added together, whereas parallel processing is considered when total times are calculated.
Total
# Sources
# Targets
# Requests
Time Total
Time Total Cum.
Time Source
Time Errorfilter
Time Transformation
Time Target
# recs. Source
# recsTarget
2 1 4 00:06:38 00:02:56 00:01:52 00:00:03 00:00:59 00:00:01 1,419,281 1,419,2Source Systems
Source System
Source Type
# Sources
# Targets
# Requests
Time Total
Time Total Cum.
Time Source
Time Target
# recs. Source
# recs. Target
PBDCLNT001 M 0 1 4 00:06:38 00:02:56 00:01:52 00:00:01 1,419,281 1,419,281 Sources
Source Source System
Source Type
# Targets
# Requests
Time Total
Time Total Cum.
Time Source
Time Target
# recs. Source
# recsTarge
/PBFBI/HRPAO07 PBDCLNT001 ODSO 1 2 00:05:48 00:02:29 00:01:34 00:00:00 1,225,673 1,225,/PBFBI/HRPAO08 PBDCLNT001 ODSO 1 2 00:00:50 00:00:27 00:00:17 00:00:00 193,608 193,Targets
Target Target Type
# Sources
# Requests
Time Total
Time Total Cum.
Time Source
Time Target
# recs. Source
# recs. Target
/PBFBI/PROJ_1 CUBE 2 4 00:06:38 00:02:56 00:01:52 00:00:01 1,419,281 1,419,281
15.3.1.5 Top Requests per Number of Data Packages
The table below provides an overview of the number of data packages used by the requests started last week. Note The more data packages created for a request, the worse the system performance during the loading job. We recommend that you do not create more than 1000 data packages per request. For more information, see SAP Note 892513.
Request ID # Data Packages Source
908 25 /PBFBI/HRPAO07

57
Request ID # Data Packages Source
909 4 /PBFBI/HRPAO08
906 1 /PBFBI/HRPAO07
907 1 /PBFBI/HRPAO08
15.3.2 Process Chains - Runtime Overview
The process chain runtime analysis is based on the last 7 days before the download.
The table contains statistical information of all chains that were not started by another (local) process chain. This includes process chains that are started by the service API or remotely by a chain from another system. Note that only the top 20 chains with the longest runtimes are displayed.
The '# Total Subchains' and '# Total Steps' columns represent the summarized values of the main chain and its subchains. The runtimes have a range from the start of the main chain up to the end of the last process type executed within the main chain and its subchains. This means that the real runtime of the main chain and its subchains is displayed here.
Main Chain #Total Sub chains
#Total Steps #Runs
Total Run time [min]
Avg. Run time [min]
Med. Run time [min]
Avg. Proc.Type Runt. [min]
/PBFBI/PEP_PC0400_01 0 9 2 27 14 14 14
15.3.3 Change-Run Analysis
The table below shows information about change runs executed during the last 10 weeks, aggregated by calendar week. It displays their number and total runtime (rounded up to whole minutes).
Week # Change-Runs Total Runtime [min]
15.2015 10 1
10.2015 1 1
09.2015 3 1
08.2015 17 1
07.2015 3 1
06.2015 6 1
05.2015 1 1

58
15.3.4 Source System Overview
Source System Release Information
The tables below contain information about the source systems attached to the analyzed BW system. The first table lists all source systems, regardless of their type. The second table shows detailed release information about R/3 source systems, while the third table is dedicated to BW source systems, potentially including the analyzed system itself (data mart). If one of the last two tables is missing, there are no source systems of the respective type.
Attached Source Systems Logical System Name Type Status BWPCLNT100 Datamart active PBDCLNT001 Datamart active R3PCLNT300 Datamart active FLATFILES Flat file active BW Source Systems Logical System Name Release Support Pack ABAP Patch Basis Patch BWPCLNT100 701 0010 701 0010 701 0010 PBDCLNT001 731 0008 731 0008 731 0008 R3PCLNT300 731 0012 731 0012 731 0012
Data Transfer Customizing
Customization of SAP Source Systems Data transfer settings of all SAP source systems attached to the analyzed BW system are maintained in transaction SBIW and stored in table ROIDOCPRMS. These settings influence data package size, the frequency of InfoIDocs, and, depending on the transfer method, the number of processes used for the data transfer. If no values are maintained in ROIDOCPRMS, the system uses hard-coded default values.
Data Transfer Settings of SAP Source Systems Source System MAXSIZE MAXLINES STATFRQU MAXPROCS BWPCLNT100 30,000 100,000 5 3 PBDCLNT001 0 0 0 0 R3PCLNT300 20,000 50,000 5 3
MAXSIZE [kB] and MAXLINES [#] control the maximam size of a data package. Whichever of the two limits is reached first controls the actual size of the data packages. While the default for MAXLINES (100,000) is reasonable in most cases, the default for MAXSIZE (10,000 kB) leads to rather small, and thus many, data packages. The current standard recommendation is approximately 50,000 (kB). Generally, both values should be low enough to prevent memory issues when processing a data package and to allow some degree of parallelism, but high enough to prevent too many data packages from being created.
Please note that it is not mandatory for extractors to follow these limitations. Nevertheless, most SAP DataSources do. Whether your custom developments take these parameters into account depends on your coding.
STATFRQU controls the frequency of InfoIDocs containing statistical information about the loading that are sent during InfoPackage processing. A value of X means that one InfoIDoc is sent after every X data packages. The default value of 1 leads to an overhead of IDoc processing; our standard recommendation is 10.

59
MAXPROCS determines how many dialog processes are maximally used by each InfoPackage to send the prepared data packages to the BW system. Whether this parameter is taken into account, however, depends on the release and the settings of the source system. In most cases, this parameter is only relevant for InfoPackages that upload not only into PSA, but also (or only) into data targets. This way of transferring data packages is usually referred to as SBIW-controlled or SAPI-controlled. The default value of 2 may easily result in a bottleneck, especially if the extractor needs less time to prepare a data package then the time needed to send and process it in the BW system. The number of maximam processes for InfoPackages loading only into PSA is usually limited by the configuration in transaction SMQS (tRFC scheduler). While MAXPROCS limits the number of processes per InfoPackage, SMQS limits the number of concurrent connections between the source and the BW system, that is, the number of processes that all concurrently executed InfoPackages may use in total. Here, the default value of 2 can also have a negative effect on extraction performance. For more information about the two different loading methods, see SAP Note 1163359 - Load methods using SMQS or SAPI-controlled to transfer to BW.
To ensure that your SBIW configurations do not have a negative effect on the performance of your InfoPackages, we checked the data transfer settings of all attached source systems.
Customization of Flat File DataSources Data transfer settings for flat file uploads are customized in transaction RSCUSTV6 and stored in table RSADMINC. You can control the maximam number of records per data package (Package Size) as well as the InfoIDoc frequency (FrequencyStatus-IDOC).
Data Transfer Settings for Flat File Source Systems Source System IDOCPACKSIZE INFOIDOCFRQ FLATFILES 1,000 10
Verification of Data Transfer Settings To avoid potential extraction problems, adjust the data transfer settings in the respective source systems as indicated in the tables below. Note that we strongly recommend changes if the settings are lower than expected, unless you experience memory issues with higher values. If, on the other hand, the recommendation table suggests decreasing certain parameters but you do not face any of the related problems described above (memory dumps, no parallelism), please ignore this particular recommendation.
Implementation a) For SAP source systems, you can change the data transfer settings centrally from the BW system within transaction RSA1. In the 'Source Systems' area, right-click the particular system and choose "Customizing Extractors", which calls transaction SBIW in the selected system. There, choose "General Settings" --> "Maintain Control Parameters for the Data Transfer". Obviously, you can also call transaction SBIW directly in the source systems.
b) For flat file source systems, use transaction RSCUSTV6 in your BW system.
Source System Parameter Current value Recommended value
BWPCLNT100 Max. (kB) 30,000 50,000
BWPCLNT100 Frequency 5 10
BWPCLNT100 Max. proc. 3 5
PBDCLNT001 Max. (kB) 0 50,000
PBDCLNT001 Frequency 0 10

60
Source System Parameter Current value Recommended value
PBDCLNT001 Max. proc. 0 5
R3PCLNT300 Max. (kB) 20,000 50,000
R3PCLNT300 Max. lines 50,000 100,000
R3PCLNT300 Frequency 5 10
R3PCLNT300 Max. proc. 3 5
Recommendations for Flat File Source Systems Source System Parameter Current value Recommended value FLATFILES Package Size 1,000 50,000
16 Database server load from expensive SQL statements - PBD
The SQL statements identified did not lead to performance problems. The load overview is listed in the table below for reference, and further details of the most expensive statements are included at the end of the section.
Database Load From Expensive Statements Rating Logical reads [%] Physical reads [%] Elapsed time [%]
73 0 24
The table above shows the cumulative amount of problematic statements identified. If the database was inactive for more than one day before the analysis was performed, the information provided may not be entirely accurate.
Note: The overall section rating is linked to the above table rating; the ratings are described in SAP Note 2021756. If the table rating is RED, there are SQL statements that cause a high percentage of the overall load on your SAP system. If the table rating is YELLOW, there are SQL statements that cause a considerable percentage of the overall load on your SAP system. If the table rating is GREEN, your system SQL statement cache contains no significant problems. If the table rating is UNRATED, the total reads of your system's SQL statement cache were <= 100,000,000, or some analysis data was unavailable.
The following table lists the load of each SQL statement individually. The load of the statement is evaluated against the total load since database startup.

61
Note: If an object name in this table contains the character "/", it may indicate a join. If an object is not in the ABAP Dictionary (transaction SE12) with the object name listed, check for each part of the join (items separated by "/").
17 Database and ABAP Load Optimization of PBD
We analyzed your SAP system and found expensive SQL statements or transaction design or performance problems. Follow the recommendations below to improve performance of this SAP system.
17.1 Analysis of DB SQL CACHE on 04/20/2015 04:36:56 Expensive SQL Statements Overview
Object Name Elapsed time [%]
Calls [%] Calls Total
rows
Logical reads [%]
Physical reads [%]
CPU time [%]
16 0 33692 36771 64 0 20 0 0 2 42 1 0 0 TESTDATRNRPART0 4 14 28889118 28889118 1 0 5 TESTDATRNRPART0 4 14 28889118 28889118 1 0 5 0 0 2 42 1 0 0 0 0 2 48 1 0 0 0 0 1 21 1 0 0 0 0 3 48 1 0 0 0 0 1 21 1 0 0 0 0 1 21 1 0 0
The statements were selected for analysis and optimization based on the "Logical reads [%]" column. Logical reads are a measure of the workload on a database server because they cause CPU and memory utilization.
The "Total Rows expected" column indicates the expected number of rows returned by the statement.
17.1.1 Access on

62
Statement Data:
Cache Statistics
Object type
Total executions
Total elapsed time[ms]
Elapsed time[ms]/Record Records/Execution Estimated
Records/Execution
JOIN 33692 6229094 169.40 1 1
SELECT p.partition_number AS [PartitionNumber], p.data_compression AS [DataCompression] FROM sys.tables AS tbl INNER JOIN sys.indexes AS i ON (i.index_id > @_msparam_0 and i.is_hypothetical = @_msparam_1) AND (i.object_id=tbl.object_id) LEFT OUTER JOIN sys.all_objects AS allobj ON allobj.name = 'extended_index_' + cast(i.object_id AS varchar) + '_' + cast(i. index_id AS varchar) AND allobj.type='IT' INNER JOIN sys.partitions AS p ON p.object_id=CAST((CASE WHEN i.type = 4 THEN allobj.object_id ELSE i.object_id END) AS int) AND p. index_id=CAST((CASE WHEN i.type = 4 THEN 1 ELSE i.index_id END) AS int) LEFT OUTER JOIN sys.destination_data_spaces AS dds ON dds.partition_scheme_id = i.data_space_id and dds.destination_id = p.partition_number LEFT OUTER JOIN sys.partition_schemes AS ps ON ps.data_space_id = i.data_space_id WHERE (i.name=@_msparam_2)and((tbl.name=@_msparam_3 and SCHEMA_NAME(tbl.schema_id)=@_msparam_4)) ORDER BY [PartitionNumber] ASC
Execution Plan |-- Sort ORDER BY: [sysrowsets].numpart ASC |-- Filter WHERE: [PBD].[sys].[sysrowsets].[idmajor] as [rs].[idmajor]=CASE WHEN [PBD] .[sys].[sysidxstats].[type] as [i].[type]=(4) THEN [PBD].[sys].[sysschobjs].[id] as [o].[id] ELSE [PBD].[sys].[sysidxstats].[id] as [i].[id] END |-- Nested Loops |-- Hash Match |-- Index Scan WHERE: [PBD].[sys].[syssingleobjrefs].[class] as [ds].[class]= (8) AND [PBD].[sys].[syssingleobjrefs].[depsubid] as [ds].[depsubid]<=(1) |-- Nested Loops

63
|-- Merge Join |-- Sort ORDER BY: [sysschobjs].id ASC |-- Nested Loops |-- Filter WHERE: schema_name([PBD].[sys].[sysschobjs].[nsid] as [o]. [nsid])=[@_msparam_4] AND has_access('CO',[PBD].[sys].[sysschobjs]. [id] as [o].[id])=(1) |-- Index Seek SEEK: [sysschobjs].name EQ [@_msparam_3] ORDERED 1 WHERE: [PBD].[sys].[sysschobjs].[nsclass] as [o].[nsclass]=(0) |-- Clustered Index Seek SEEK: [sysschobjs].id EQ [PBD].[sys]. [sysschobjs].[id] as [o].[id] ORDERED 1 WHERE: [PBD].[sys]. [sysschobjs].[pclass] as [o].[pclass]=(1) AND [PBD].[sys]. [sysschobjs].[type] as [o].[type]='U' |-- Nested Loops WHERE: [PBD].[sys].[sysrowsets].[idminor] as [rs].[idminor] =[Expr1101] |-- Nested Loops |-- Filter WHERE: has_access('CO',[PBD].[sys].[sysidxstats].[id] as [i].[id])=(1) |-- Index Seek SEEK: [sysidxstats].name EQ [@_msparam_2] ORDERED 1 WHERE: [PBD].[sys].[sysidxstats].[indid] as [i].[indid] >CONVERT_IMPLICIT(int,[@_msparam_0],0) |-- Clustered Index Seek SEEK: [sysidxstats].id EQ [PBD].[sys]. [sysidxstats].[id] as [i].[id] AND [sysidxstats].indid EQ [PBD]. [sys].[sysidxstats].[indid] as [i].[indid] ORDERED 1 WHERE: CONVERT(bit,[PBD].[sys].[sysidxstats].[stat |-- Clustered Index Scan |-- Clustered Index Seek SEEK: [sysidxstats].id EQ [PBD].[sys].[sysschobjs]. [id] as [o].[id] ORDERED 1 |-- Nested Loops |-- Filter WHERE: has_access('AO',[PBD].[sys].[sysschobjs].[id] as [o].[id])= (1) |-- Index Seek SEEK: [sysschobjs].name EQ [Expr1100] ORDERED 1 |-- Clustered Index Seek SEEK: [sysschobjs].id EQ [PBD].[sys].[sysschobjs].[id] as [o].[id] ORDERED 1 WHERE: [PBD].[sys].[sysschobjs].[type] as [o].[type]= 'IT'
SQL Scripts
This statement comes from an expensive SQL script or from a stored procedure (SP) which exists at DB level and is not originated from the ABAP stack. We cannot analyze this statement in detail. Recommendation: Check if: a) The script or SP has to be run at all. b) The script or SP can be run less frequently. c) The script or SP can be tuned so that it consumes fewer database resources.
17.1.2 Access on
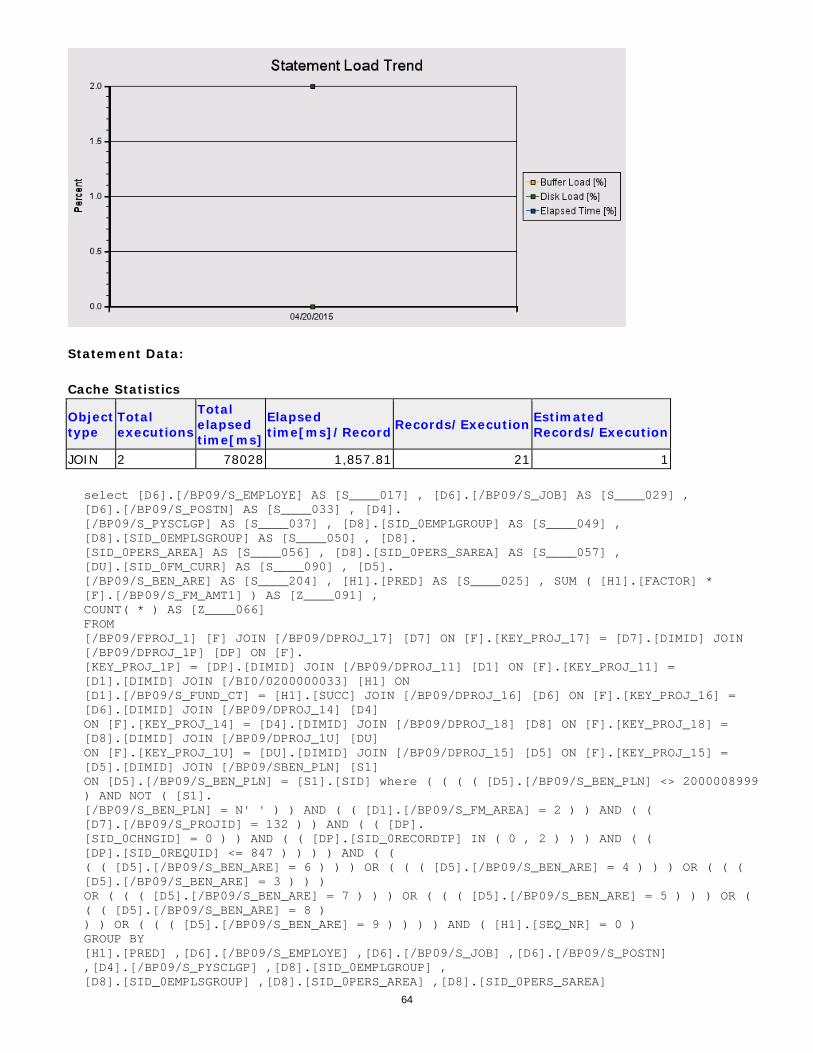
64
Statement Data:
Cache Statistics
Object type
Total executions
Total elapsed time[ms]
Elapsed time[ms]/Record Records/Execution Estimated
Records/Execution
JOIN 2 78028 1,857.81 21 1
select [D6].[/BP09/S_EMPLOYE] AS [S____017] , [D6].[/BP09/S_JOB] AS [S____029] , [D6].[/BP09/S_POSTN] AS [S____033] , [D4]. [/BP09/S_PYSCLGP] AS [S____037] , [D8].[SID_0EMPLGROUP] AS [S____049] , [D8].[SID_0EMPLSGROUP] AS [S____050] , [D8]. [SID_0PERS_AREA] AS [S____056] , [D8].[SID_0PERS_SAREA] AS [S____057] , [DU].[SID_0FM_CURR] AS [S____090] , [D5]. [/BP09/S_BEN_ARE] AS [S____204] , [H1].[PRED] AS [S____025] , SUM ( [H1].[FACTOR] * [F].[/BP09/S_FM_AMT1] ) AS [Z____091] , COUNT( * ) AS [Z____066] FROM [/BP09/FPROJ_1] [F] JOIN [/BP09/DPROJ_17] [D7] ON [F].[KEY_PROJ_17] = [D7].[DIMID] JOIN [/BP09/DPROJ_1P] [DP] ON [F]. [KEY_PROJ_1P] = [DP].[DIMID] JOIN [/BP09/DPROJ_11] [D1] ON [F].[KEY_PROJ_11] = [D1].[DIMID] JOIN [/BI0/0200000033] [H1] ON [D1].[/BP09/S_FUND_CT] = [H1].[SUCC] JOIN [/BP09/DPROJ_16] [D6] ON [F].[KEY_PROJ_16] = [D6].[DIMID] JOIN [/BP09/DPROJ_14] [D4] ON [F].[KEY_PROJ_14] = [D4].[DIMID] JOIN [/BP09/DPROJ_18] [D8] ON [F].[KEY_PROJ_18] = [D8].[DIMID] JOIN [/BP09/DPROJ_1U] [DU] ON [F].[KEY_PROJ_1U] = [DU].[DIMID] JOIN [/BP09/DPROJ_15] [D5] ON [F].[KEY_PROJ_15] = [D5].[DIMID] JOIN [/BP09/SBEN_PLN] [S1] ON [D5].[/BP09/S_BEN_PLN] = [S1].[SID] where ( ( ( ( [D5].[/BP09/S_BEN_PLN] <> 2000008999 ) AND NOT ( [S1]. [/BP09/S_BEN_PLN] = N' ' ) ) AND ( ( [D1].[/BP09/S_FM_AREA] = 2 ) ) AND ( ( [D7].[/BP09/S_PROJID] = 132 ) ) AND ( ( [DP]. [SID_0CHNGID] = 0 ) ) AND ( ( [DP].[SID_0RECORDTP] IN ( 0 , 2 ) ) ) AND ( ( [DP].[SID_0REQUID] <= 847 ) ) ) ) AND ( ( ( ( [D5].[/BP09/S_BEN_ARE] = 6 ) ) ) OR ( ( ( [D5].[/BP09/S_BEN_ARE] = 4 ) ) ) OR ( ( ( [D5].[/BP09/S_BEN_ARE] = 3 ) ) ) OR ( ( ( [D5].[/BP09/S_BEN_ARE] = 7 ) ) ) OR ( ( ( [D5].[/BP09/S_BEN_ARE] = 5 ) ) ) OR ( ( ( [D5].[/BP09/S_BEN_ARE] = 8 ) ) ) OR ( ( ( [D5].[/BP09/S_BEN_ARE] = 9 ) ) ) ) AND ( [H1].[SEQ_NR] = 0 ) GROUP BY [H1].[PRED] ,[D6].[/BP09/S_EMPLOYE] ,[D6].[/BP09/S_JOB] ,[D6].[/BP09/S_POSTN] ,[D4].[/BP09/S_PYSCLGP] ,[D8].[SID_0EMPLGROUP] , [D8].[SID_0EMPLSGROUP] ,[D8].[SID_0PERS_AREA] ,[D8].[SID_0PERS_SAREA]

65
,[DU].[SID_0FM_CURR] ,[D5].[/BP09/S_BEN_ARE] ORDER BY [S____017] , [S____029] , [S____033] , [S____037] , [S____049] , [S____050] , [S____056] , [S____057] , [S____025] OPTION ( MAXDOP 2 ) /* R3:CL_SQL_STATEMENT==============CP:494 T:/BP09/FPROJ_1 M:001 */
Execution Plan |-- Stream Aggregate GROUP BY: [/BP09/DPROJ_16]./BP09/S_EMPLOYE, [/BP09/DPROJ_16]. /BP09/S_JOB, [/BP09/DPROJ_16]./BP09/S_POSTN, [/BP09/DPROJ_14]./BP09/S_PYSCLGP, [/BP09/DPROJ_18].SID_0EMPLGROUP, [/BP09/DPROJ_18].SID_0EMPLSGROUP, [/BP09/DPROJ_18].S |-- Sort ORDER BY: [/BP09/DPROJ_16]./BP09/S_EMPLOYE ASC, [/BP09/DPROJ_16]. /BP09/S_JOB ASC, [/BP09/DPROJ_16]./BP09/S_POSTN ASC, [/BP09/DPROJ_14]. /BP09/S_PYSCLGP ASC, [/BP09/DPROJ_18].SID_0EMPLGROUP ASC, [/BP09/DPROJ_18]. SID_0EMPLSGROUP ASC, [/BP |-- Nested Loops |-- Nested Loops |-- Nested Loops |-- Nested Loops |-- Nested Loops |-- Nested Loops |-- Nested Loops |-- Nested Loops |-- Nested Loops |-- Nested Loops |-- Index Seek SEEK: [/BP09/DPROJ_1P].SID_0CHNGID EQ (0) AND [/BP09/DPROJ_1P].SID_0RECORDTP EQ (0) AND [/BP09/DPROJ_1P].SID_0CHNGID EQ (0) AND [/BP09/DPROJ_1P] .SID_0RECORDTP EQ (2)[/BP09/DPROJ_1P].SID_0CHNGID EQ (0) AND |-- Clustered Index Seek SEEK: .PtnId1000 EQ RangePartitionNew([PBD].[pbd].[/BP09/DPROJ_1P].[DIMID] as [DP].[DIMID],(1),(3),(4),(5),(6),(7),(8),(9),(10), (11),(12),(13),(14),(15),(16),(17),(18),(19),(20),(21), (22),(23),(2 |-- Clustered Index Seek SEEK: [/BP09/DPROJ_15].DIMID EQ [PBD] .[pbd].[/BP09/FPROJ_1].[KEY_PROJ_15] as [F].[KEY_PROJ_15] ORDERED 1 WHERE: [PBD].[pbd].[/BP09/DPROJ_15]. [/BP09/S_BEN_PLN] as [D5].[/BP09/S_BEN_PLN]<>(2000008999 |-- Index Seek SEEK: [/BP09/SBEN_PLN].SID EQ [PBD].[pbd]. [/BP09/DPROJ_15].[/BP09/S_BEN_PLN] as [D5].[/BP09/S_BEN_PLN] ORDERED 1 WHERE: [PBD].[pbd].[/BP09/SBEN_PLN]. [/BP09/S_BEN_PLN] as [S1].[/BP09/S_BEN_PLN]<>N' ' |-- Clustered Index Seek SEEK: [/BP09/DPROJ_16].DIMID EQ [PBD]. [pbd].[/BP09/FPROJ_1].[KEY_PROJ_16] as [F].[KEY_PROJ_16] ORDERED 1 |-- Clustered Index Seek SEEK: [/BP09/DPROJ_11].DIMID EQ [PBD].[pbd] .[/BP09/FPROJ_1].[KEY_PROJ_11] as [F].[KEY_PROJ_11] ORDERED 1 WHERE: [PBD].[pbd].[/BP09/DPROJ_11].[/BP09/S_FM_AREA] as [D1]. [/BP09/S_FM_AREA]=(2) |-- Clustered Index Seek SEEK: [/BP09/DPROJ_18].DIMID EQ [PBD].[pbd]. [/BP09/FPROJ_1].[KEY_PROJ_18] as [F].[KEY_PROJ_18] ORDERED 1 |-- Clustered Index Seek SEEK: [/BP09/DPROJ_14].DIMID EQ [PBD].[pbd]. [/BP09/FPROJ_1].[KEY_PROJ_14] as [F].[KEY_PROJ_14] ORDERED 1 |-- Clustered Index Seek SEEK: [/BI0/0200000033].SUCC EQ [PBD].[pbd]. [/BP09/DPROJ_11].[/BP09/S_FUND_CT] as [D1].[/BP09/S_FUND_CT] ORDERED 1 WHERE: [PBD].[pbd].[/BI0/0200000033].[SEQ_NR] as [H1].[SEQ_NR]=(0) |-- Clustered Index Seek SEEK: [/BP09/DPROJ_1U].DIMID EQ [PBD].[pbd]. [/BP09/FPROJ_1].[KEY_PROJ_1U] as [F].[KEY_PROJ_1U] ORDERED 1 |-- Index Seek SEEK: [/BP09/DPROJ_17]./BP09/S_PROJID EQ (132) AND [/BP09/DPROJ_17].DIMID EQ [PBD].[pbd].[/BP09/FPROJ_1].[KEY_PROJ_17] as [F]. [KEY_PROJ_17] ORDERED 1

66
SQL Scripts
This statement comes from an expensive SQL script or from a stored procedure (SP) which exists at DB level and is not originated from the ABAP stack. We cannot analyze this statement in detail. Recommendation: Check if: a) The script or SP has to be run at all. b) The script or SP can be run less frequently. c) The script or SP can be tuned so that it consumes fewer database resources.
17.1.3 Access on TESTDATRNRPART0
Statement Data:
Cache Statistics
Object type
Total executions
Total elapsed time[ms]
Elapsed time[ms]/Record Records/Execution Estimated
Records/Execution
TABLE 28889118 1425964 0.05 1 1
INSERT INTO "TESTDATRNRPART0" ( "RNR" ) VALUES( @P1 ) /* R3:RTAB:0 T:TESTDATRNRPART0 */
Execution Plan Statement not in PBD
17.1.4 Access on TESTDATRNRPART0

67
Statement Data:
Cache Statistics
Object type
Total executions
Total elapsed time[ms]
Elapsed time[ms]/Record Records/Execution Estimated
Records/Execution
TABLE 28889118 1680983 0.06 1 1
DELETE FROM "TESTDATRNRPART0" WHERE "RNR" = @P1 /* R3:SAPLRSSM:35525 T:TESTDATRNRPART0 */
Execution Plan Statement not in PBD
17.1.5 Access on

68
Statement Data:
Cache Statistics
Object type
Total executions
Total elapsed time[ms]
Elapsed time[ms]/Record Records/Execution Estimated
Records/Execution
JOIN 2 49673 1,182.68 21 1
select [D6].[/BP09/S_EMPLOYE] AS [S____017] , [D6].[/BP09/S_JOB] AS [S____029] , [D6].[/BP09/S_POSTN] AS [S____033] , [D4]. [/BP09/S_PYSCLGP] AS [S____037] , [D4].[/BP09/S_PYSCLVL] AS [S____039] , [D8].[SID_0EMPLGROUP] AS [S____049] , [D8]. [SID_0EMPLSGROUP] AS [S____050] , [D8].[SID_0PERS_AREA] AS [S____056] , [D8].[SID_0PERS_SAREA] AS [S____057] , [DU]. [SID_0FM_CURR] AS [S____090] , [D5].[/BP09/S_BEN_ARE] AS [S____204] , [H1].[PRED] AS [S____025] , SUM ( [F]. [/BP09/S_FM_AMT1] ) AS [Z____091] , COUNT( * ) AS [Z____066] FROM [/BP09/FPROJ_1] [F] JOIN [/BP09/DPROJ_17] [D7] ON [F].[KEY_PROJ_17] = [D7].[DIMID] JOIN [/BP09/DPROJ_1P] [DP] ON [F]. [KEY_PROJ_1P] = [DP].[DIMID] JOIN [/BP09/DPROJ_11] [D1] ON [F].[KEY_PROJ_11] = [D1].[DIMID] JOIN [/BI0/0200000026] [H1] ON [D1].[/BP09/S_FUND_CT] = [H1].[SUCC] JOIN [/BP09/DPROJ_16] [D6] ON [F].[KEY_PROJ_16] = [D6].[DIMID] JOIN [/BP09/DPROJ_14] [D4] ON [F].[KEY_PROJ_14] = [D4].[DIMID] JOIN [/BP09/DPROJ_18] [D8] ON [F].[KEY_PROJ_18] = [D8].[DIMID] JOIN [/BP09/DPROJ_1U] [DU] ON [F].[KEY_PROJ_1U] = [DU].[DIMID] JOIN [/BP09/DPROJ_15] [D5] ON [F].[KEY_PROJ_15] = [D5].[DIMID] JOIN [/BP09/SBEN_PLN] [S1] ON [D5].[/BP09/S_BEN_PLN] = [S1].[SID] where ( ( ( ( [D5].[/BP09/S_BEN_PLN] <> 2000008999 ) AND NOT ( [S1]. [/BP09/S_BEN_PLN] = N' ' ) ) AND ( ( [D1].[/BP09/S_FM_AREA] = 2 ) ) AND ( ( [D7].[/BP09/S_PROJID] = 132 ) ) AND ( ( [DP]. [SID_0CHNGID] = 0 ) ) AND ( ( [DP].[SID_0RECORDTP] IN ( 0 , 2 ) ) ) AND ( ( [DP].[SID_0REQUID] <= 847 ) ) ) ) AND ( [H1].[SEQ_NR] = 0 ) GROUP BY [H1].[PRED] ,[D6].[/BP09/S_EMPLOYE] ,[D6].[/BP09/S_JOB] ,[D6].[/BP09/S_POSTN] ,[D4].[/BP09/S_PYSCLGP] ,[D4].[/BP09/S_PYSCLVL] , [D8].[SID_0EMPLGROUP] ,[D8].[SID_0EMPLSGROUP] ,[D8].[SID_0PERS_AREA] ,[D8].[SID_0PERS_SAREA] ,[DU].[SID_0FM_CURR] ,[D5]. [/BP09/S_BEN_ARE] ORDER BY [S____017] , [S____029] , [S____033] , [S____037] , [S____039] , [S____049] , [S____050] , [S____056] , [S____057] , [S____025] OPTION ( MAXDOP 2 ) /* R3:CL_SQL_STATEMENT==============CP:494 T:/BP09/FPROJ_1 M:001 */
Execution Plan |-- Stream Aggregate GROUP BY: [/BP09/DPROJ_16]./BP09/S_EMPLOYE, [/BP09/DPROJ_16]. /BP09/S_JOB, [/BP09/DPROJ_16]./BP09/S_POSTN, [/BP09/DPROJ_14]./BP09/S_PYSCLGP, [/BP09/DPROJ_14]./BP09/S_PYSCLVL, [/BP09/DPROJ_18].SID_0EMPLGROUP, [/BP09/DPROJ_18].S |-- Sort ORDER BY: [/BP09/DPROJ_16]./BP09/S_EMPLOYE ASC, [/BP09/DPROJ_16]. /BP09/S_JOB ASC, [/BP09/DPROJ_16]./BP09/S_POSTN ASC, [/BP09/DPROJ_14]. /BP09/S_PYSCLGP ASC, [/BP09/DPROJ_14]./BP09/S_PYSCLVL ASC, [/BP09/DPROJ_18]. SID_0EMPLGROUP ASC, [/BP |-- Nested Loops |-- Nested Loops |-- Nested Loops |-- Nested Loops |-- Nested Loops |-- Nested Loops

69
|-- Nested Loops |-- Nested Loops |-- Nested Loops |-- Nested Loops |-- Index Seek SEEK: [/BP09/DPROJ_1P].SID_0CHNGID EQ (0) AND [/BP09/DPROJ_1P].SID_0RECORDTP EQ (0) AND [/BP09/DPROJ_1P] .SID_0CHNGID EQ (0) AND [/BP09/DPROJ_1P].SID_0RECORDTP EQ (2)[/BP09/DPROJ_1P].SID_0CHNGID EQ (0) AND [/ |-- Clustered Index Seek SEEK: .PtnId1000 EQ RangePartitionNew([PBD].[pbd].[/BP09/DPROJ_1P].[DIMID] as [DP].[DIMID],(1),(3),(4),(5),(6),(7),(8),(9),(10),(11), (12),(13),(14),(15),(16),(17),(18),(19),(20),(21),(22), (23),(24) |-- Clustered Index Seek SEEK: [/BP09/DPROJ_1U].DIMID EQ [PBD]. [pbd].[/BP09/FPROJ_1].[KEY_PROJ_1U] as [F].[KEY_PROJ_1U] ORDERED 1 |-- Index Seek SEEK: [/BP09/DPROJ_17]./BP09/S_PROJID EQ (132) AND [/BP09/DPROJ_17].DIMID EQ [PBD].[pbd].[/BP09/FPROJ_1]. [KEY_PROJ_17] as [F].[KEY_PROJ_17] ORDERED 1 |-- Clustered Index Seek SEEK: [/BP09/DPROJ_15].DIMID EQ [PBD].[pbd] .[/BP09/FPROJ_1].[KEY_PROJ_15] as [F].[KEY_PROJ_15] ORDERED 1 WHERE: [PBD].[pbd].[/BP09/DPROJ_15].[/BP09/S_BEN_PLN] as [D5]. [/BP09/S_BEN_PLN]<>(2000008999) |-- Index Seek SEEK: [/BP09/SBEN_PLN].SID EQ [PBD].[pbd]. [/BP09/DPROJ_15].[/BP09/S_BEN_PLN] as [D5].[/BP09/S_BEN_PLN] ORDERED 1 WHERE: [PBD].[pbd].[/BP09/SBEN_PLN].[/BP09/S_BEN_PLN] as [S1].[/BP09/S_BEN_PLN]<>N' ' |-- Clustered Index Seek SEEK: [/BP09/DPROJ_14].DIMID EQ [PBD].[pbd]. [/BP09/FPROJ_1].[KEY_PROJ_14] as [F].[KEY_PROJ_14] ORDERED 1 |-- Clustered Index Seek SEEK: [/BP09/DPROJ_18].DIMID EQ [PBD].[pbd]. [/BP09/FPROJ_1].[KEY_PROJ_18] as [F].[KEY_PROJ_18] ORDERED 1 |-- Clustered Index Seek SEEK: [/BP09/DPROJ_11].DIMID EQ [PBD].[pbd]. [/BP09/FPROJ_1].[KEY_PROJ_11] as [F].[KEY_PROJ_11] ORDERED 1 WHERE: [PBD].[pbd].[/BP09/DPROJ_11].[/BP09/S_FM_AREA] as [D1].[/BP09/S_FM_AREA] =(2) |-- Index Seek SEEK: [/BI0/0200000026].SEQ_NR EQ (0) AND [/BI0/0200000026]. SUCC EQ [PBD].[pbd].[/BP09/DPROJ_11].[/BP09/S_FUND_CT] as [D1]. [/BP09/S_FUND_CT] ORDERED 1 |-- Clustered Index Seek SEEK: [/BP09/DPROJ_16].DIMID EQ [PBD].[pbd]. [/BP09/FPROJ_1].[KEY_PROJ_16] as [F].[KEY_PROJ_16] ORDERED 1
SQL Scripts
This statement comes from an expensive SQL script or from a stored procedure (SP) which exists at DB level and is not originated from the ABAP stack. We cannot analyze this statement in detail. Recommendation: Check if: a) The script or SP has to be run at all. b) The script or SP can be run less frequently. c) The script or SP can be tuned so that it consumes fewer database resources.
17.1.6 Access on

70
Statement Data:
Cache Statistics
Object type
Total executions
Total elapsed time[ms]
Elapsed time[ms]/Record Records/Execution Estimated
Records/Execution
JOIN 2 50016 1,042.00 24 1
select [D5].[/BP09/S_BEN_PLN] AS [S____205] , [D6].[/BP09/S_EMPLOYE] AS [S____017] , [D6].[/BP09/S_JOB] AS [S____029] , [D6]. [/BP09/S_POSTN] AS [S____033] , [D4].[/BP09/S_PYSCLGP] AS [S____037] , [D4].[/BP09/S_PYSCLVL] AS [S____039] , [D8]. [SID_0EMPLGROUP] AS [S____049] , [D8].[SID_0EMPLSGROUP] AS [S____050] , [D8].[SID_0PERS_AREA] AS [S____056] , [D8]. [SID_0PERS_SAREA] AS [S____057] , [D5].[/BP09/S_BEN_ARE] AS [S____204] , [DU].[SID_0FM_CURR] AS [S____090] , [H1].[PRED] AS [S____025] , SUM ( [F].[/BP09/S_CALCFTE] ) AS [Z____104] , SUM ( [F].[/BP09/S_FM_AMT1] ) AS [Z____091] , COUNT( * ) AS [Z____066] FROM [/BP09/FPROJ_1] [F] JOIN [/BP09/DPROJ_11] [D1] ON [F].[KEY_PROJ_11] = [D1].[DIMID] JOIN [/BI0/0200000026] [H1] ON [D1]. [/BP09/S_FUND_CT] = [H1].[SUCC] JOIN [/BP09/DPROJ_16] [D6] ON [F].[KEY_PROJ_16] = [D6].[DIMID] JOIN [/BP09/DPROJ_14] [D4] ON [F].[KEY_PROJ_14] = [D4].[DIMID] JOIN [/BP09/DPROJ_18] [D8] ON [F].[KEY_PROJ_18] = [D8].[DIMID] JOIN [/BP09/DPROJ_1U] [DU] ON [F].[KEY_PROJ_1U] = [DU].[DIMID] JOIN [/BP09/DPROJ_17] [D7] ON [F].[KEY_PROJ_17] = [D7].[DIMID] JOIN [/BP09/DPROJ_1P] [DP] ON [F].[KEY_PROJ_1P] = [DP].[DIMID] JOIN [/BP09/DPROJ_15] [D5] ON [F].[KEY_PROJ_15] = [D5].[DIMID] JOIN [/BP09/SBEN_PLN] [S1] ON [D5].[/BP09/S_BEN_PLN] = [S1].[SID] where ( ( ( ( [D5].[/BP09/S_BEN_PLN] <> 2000008999 ) AND NOT ( [S1].[/BP09/S_BEN_PLN] = N' ' ) ) AND ( ( [D1].[/BP09/S_FM_AREA] = 2 ) ) AND ( ( [D7].[/BP09/S_PROJID] = 132 ) ) AND ( ( [DP].[SID_0CHNGID] = 0 ) ) AND ( ( [DP].[SID_0RECORDTP] IN ( 0 , 2 ) ) ) AND ( ( [DP].[SID_0REQUID] <= 847 ) ) ) ) AND ( [H1].[SEQ_NR] = 0 ) GROUP BY [D5].[/BP09/S_BEN_PLN] ,[H1].[PRED] ,[D6].[/BP09/S_EMPLOYE] ,[D6].[/BP09/S_JOB] ,[D6].[/BP09/S_POSTN] ,[D4].[/BP09/S_PYSCLGP] , [D4].[/BP09/S_PYSCLVL] ,[D8].[SID_0EMPLGROUP] ,[D8].[SID_0EMPLSGROUP] ,[D8].[SID_0PERS_AREA] ,[D8].[SID_0PERS_SAREA] ,[D5]. [/BP09/S_BEN_ARE] ,[DU].[SID_0FM_CURR]

71
ORDER BY [S____017] , [S____029] , [S____033] , [S____037] , [S____039] , [S____049] , [S____050] , [S____056] , [S____057] , [S____204] , [S____205] , [S____025] OPTION ( MAXDOP 2 ) /* R3:CL_SQL_STATEMENT==============CP:494 T:/BP09/FPROJ_1 M:001 */
Execution Plan |-- Stream Aggregate GROUP BY: [/BP09/DPROJ_16]./BP09/S_EMPLOYE, [/BP09/DPROJ_16]. /BP09/S_JOB, [/BP09/DPROJ_16]./BP09/S_POSTN, [/BP09/DPROJ_14]./BP09/S_PYSCLGP, [/BP09/DPROJ_14]./BP09/S_PYSCLVL, [/BP09/DPROJ_18].SID_0EMPLGROUP, [/BP09/DPROJ_18].S |-- Sort ORDER BY: [/BP09/DPROJ_16]./BP09/S_EMPLOYE ASC, [/BP09/DPROJ_16]. /BP09/S_JOB ASC, [/BP09/DPROJ_16]./BP09/S_POSTN ASC, [/BP09/DPROJ_14]. /BP09/S_PYSCLGP ASC, [/BP09/DPROJ_14]./BP09/S_PYSCLVL ASC, [/BP09/DPROJ_18]. SID_0EMPLGROUP ASC, [/BP |-- Nested Loops |-- Nested Loops |-- Nested Loops |-- Nested Loops |-- Nested Loops |-- Nested Loops |-- Nested Loops |-- Nested Loops |-- Nested Loops |-- Nested Loops |-- Index Seek SEEK: [/BP09/DPROJ_1P].SID_0CHNGID EQ (0) AND [/BP09/DPROJ_1P].SID_0RECORDTP EQ (0) AND [/BP09/DPROJ_1P] .SID_0CHNGID EQ (0) AND [/BP09/DPROJ_1P].SID_0RECORDTP EQ (2)[/BP09/DPROJ_1P].SID_0CHNGID EQ (0) AND [/ |-- Clustered Index Seek SEEK: .PtnId1000 EQ RangePartitionNew([PBD].[pbd].[/BP09/DPROJ_1P].[DIMID] as [DP].[DIMID],(1),(3),(4),(5),(6),(7),(8),(9),(10),(11), (12),(13),(14),(15),(16),(17),(18),(19),(20),(21),(22), (23),(24) |-- Clustered Index Seek SEEK: [/BP09/DPROJ_1U].DIMID EQ [PBD]. [pbd].[/BP09/FPROJ_1].[KEY_PROJ_1U] as [F].[KEY_PROJ_1U] ORDERED 1 |-- Index Seek SEEK: [/BP09/DPROJ_17]./BP09/S_PROJID EQ (132) AND [/BP09/DPROJ_17].DIMID EQ [PBD].[pbd].[/BP09/FPROJ_1]. [KEY_PROJ_17] as [F].[KEY_PROJ_17] ORDERED 1 |-- Clustered Index Seek SEEK: [/BP09/DPROJ_15].DIMID EQ [PBD].[pbd] .[/BP09/FPROJ_1].[KEY_PROJ_15] as [F].[KEY_PROJ_15] ORDERED 1 WHERE: [PBD].[pbd].[/BP09/DPROJ_15].[/BP09/S_BEN_PLN] as [D5]. [/BP09/S_BEN_PLN]<>(2000008999) |-- Index Seek SEEK: [/BP09/SBEN_PLN].SID EQ [PBD].[pbd]. [/BP09/DPROJ_15].[/BP09/S_BEN_PLN] as [D5].[/BP09/S_BEN_PLN] ORDERED 1 WHERE: [PBD].[pbd].[/BP09/SBEN_PLN].[/BP09/S_BEN_PLN] as [S1].[/BP09/S_BEN_PLN]<>N' ' |-- Clustered Index Seek SEEK: [/BP09/DPROJ_14].DIMID EQ [PBD].[pbd]. [/BP09/FPROJ_1].[KEY_PROJ_14] as [F].[KEY_PROJ_14] ORDERED 1 |-- Clustered Index Seek SEEK: [/BP09/DPROJ_18].DIMID EQ [PBD].[pbd]. [/BP09/FPROJ_1].[KEY_PROJ_18] as [F].[KEY_PROJ_18] ORDERED 1 |-- Clustered Index Seek SEEK: [/BP09/DPROJ_11].DIMID EQ [PBD].[pbd]. [/BP09/FPROJ_1].[KEY_PROJ_11] as [F].[KEY_PROJ_11] ORDERED 1 WHERE: [PBD].[pbd].[/BP09/DPROJ_11].[/BP09/S_FM_AREA] as [D1].[/BP09/S_FM_AREA] =(2) |-- Index Seek SEEK: [/BI0/0200000026].SEQ_NR EQ (0) AND [/BI0/0200000026]. SUCC EQ [PBD].[pbd].[/BP09/DPROJ_11].[/BP09/S_FUND_CT] as [D1]. [/BP09/S_FUND_CT] ORDERED 1 |-- Clustered Index Seek SEEK: [/BP09/DPROJ_16].DIMID EQ [PBD].[pbd]. [/BP09/FPROJ_1].[KEY_PROJ_16] as [F].[KEY_PROJ_16] ORDERED 1
SQL Scripts

72
This statement comes from an expensive SQL script or from a stored procedure (SP) which exists at DB level and is not originated from the ABAP stack. We cannot analyze this statement in detail. Recommendation: Check if: a) The script or SP has to be run at all. b) The script or SP can be run less frequently. c) The script or SP can be tuned so that it consumes fewer database resources.
17.1.7 Access on
Statement Data:
Cache Statistics
Object type
Total executions
Total elapsed time[ms]
Elapsed time[ms]/Record Records/Execution Estimated
Records/Execution
JOIN 1 43272 2,060.58 21 1
select [D6].[/BP09/S_EMPLOYE] AS [S____017] , [D6].[/BP09/S_JOB] AS [S____029] , [D6].[/BP09/S_POSTN] AS [S____033] , [D4]. [/BP09/S_PYSCLGP] AS [S____037] , [D4].[/BP09/S_PYSCLVL] AS [S____039] , [D8].[SID_0EMPLGROUP] AS [S____049] , [D8]. [SID_0EMPLSGROUP] AS [S____050] , [D8].[SID_0PERS_AREA] AS [S____056] , [D8].[SID_0PERS_SAREA] AS [S____057] , [DT]. [SID_0FISCYEAR] AS [S____089] , [DU].[SID_0FM_CURR] AS [S____090] , [D5].[/BP09/S_BEN_ARE] AS [S____204] , [H1].[PRED] AS [S____025] , SUM ( [F].[/BP09/S_FM_AMT1] ) AS [Z____091] , COUNT( * ) AS [Z____066] FROM [/BP09/FPROJ_1] [F] JOIN [/BP09/DPROJ_17] [D7] ON [F].[KEY_PROJ_17] = [D7].[DIMID] JOIN [/BP09/DPROJ_1P] [DP] ON [F]. [KEY_PROJ_1P] = [DP].[DIMID] JOIN [/BP09/DPROJ_11] [D1] ON [F].[KEY_PROJ_11] = [D1].[DIMID] JOIN [/BI0/0200000026] [H1] ON [D1].[/BP09/S_FUND_CT] = [H1].[SUCC] JOIN [/BP09/DPROJ_16] [D6] ON [F].[KEY_PROJ_16] = [D6].[DIMID] JOIN [/BP09/DPROJ_14] [D4] ON [F].[KEY_PROJ_14] = [D4].[DIMID] JOIN [/BP09/DPROJ_18] [D8] ON [F].[KEY_PROJ_18] = [D8].[DIMID] JOIN [/BP09/DPROJ_1T] [DT] ON [F].[KEY_PROJ_1T] = [DT].[DIMID] JOIN [/BP09/DPROJ_1U] [DU] ON [F].[KEY_PROJ_1U] = [DU].[DIMID] JOIN [/BP09/DPROJ_15] [D5] ON [F].[KEY_PROJ_15] = [D5].[DIMID] JOIN [/BP09/SBEN_PLN] [S1] ON [D5].[/BP09/S_BEN_PLN] = [S1].[SID] where ( ( ( ( [D5]. [/BP09/S_BEN_PLN] <> 2000008999 ) AND NOT ( [S1].[/BP09/S_BEN_PLN] = N' ' ) ) AND ( ( [D1].[/BP09/S_FM_AREA] = 2 ) ) AND

73
( ( [D7].[/BP09/S_PROJID] = 132 ) ) AND ( ( [DP].[SID_0CHNGID] = 0 ) ) AND ( ( [DP].[SID_0RECORDTP] IN ( 0 , 2 ) ) ) AND ( ( [DP].[SID_0REQUID] <= 847 ) ) ) ) AND ( [H1].[SEQ_NR] = 0 ) GROUP BY [H1].[PRED] ,[D6].[/BP09/S_EMPLOYE] ,[D6].[/BP09/S_JOB] ,[D6].[/BP09/S_POSTN] ,[D4].[/BP09/S_PYSCLGP] ,[D4].[/BP09/S_PYSCLVL] , [D8].[SID_0EMPLGROUP] ,[D8].[SID_0EMPLSGROUP] ,[D8].[SID_0PERS_AREA] ,[D8].[SID_0PERS_SAREA] ,[DT].[SID_0FISCYEAR] ,[DU]. [SID_0FM_CURR] ,[D5].[/BP09/S_BEN_ARE] ORDER BY [S____017] , [S____029] , [S____033] , [S____037] , [S____039] , [S____049] , [S____050] , [S____056] , [S____057] , [S____089] , [S____025] OPTION ( MAXDOP 2 ) /* R3:CL_SQL_STATEMENT==============CP:494 T:/BP09/FPROJ_1 M:001 */
Execution Plan |-- Stream Aggregate GROUP BY: [/BP09/DPROJ_16]./BP09/S_EMPLOYE, [/BP09/DPROJ_16]. /BP09/S_JOB, [/BP09/DPROJ_16]./BP09/S_POSTN, [/BP09/DPROJ_14]./BP09/S_PYSCLGP, [/BP09/DPROJ_14]./BP09/S_PYSCLVL, [/BP09/DPROJ_18].SID_0EMPLGROUP, [/BP09/DPROJ_18].S |-- Sort ORDER BY: [/BP09/DPROJ_16]./BP09/S_EMPLOYE ASC, [/BP09/DPROJ_16]. /BP09/S_JOB ASC, [/BP09/DPROJ_16]./BP09/S_POSTN ASC, [/BP09/DPROJ_14]. /BP09/S_PYSCLGP ASC, [/BP09/DPROJ_14]./BP09/S_PYSCLVL ASC, [/BP09/DPROJ_18]. SID_0EMPLGROUP ASC, [/BP |-- Nested Loops |-- Nested Loops |-- Nested Loops |-- Nested Loops |-- Nested Loops |-- Nested Loops |-- Nested Loops |-- Nested Loops |-- Nested Loops |-- Nested Loops |-- Nested Loops |-- Index Seek SEEK: [/BP09/DPROJ_1P].SID_0CHNGID EQ (0) AND [/BP09/DPROJ_1P].SID_0RECORDTP EQ (0) AND [/BP09/DPROJ_1P].SID_0CHNGID EQ (0) AND [/BP09/DPROJ_1P] .SID_0RECORDTP EQ (2)[/BP09/DPROJ_1P].SID_0CHNGID EQ (0) AND |-- Clustered Index Seek SEEK: .PtnId1000 EQ RangePartitionNew([PBD].[pbd].[/BP09/DPROJ_1P].[DIMID] as [DP].[DIMID],(1),(3),(4),(5),(6),(7),(8),(9),(10), (11),(12),(13),(14),(15),(16),(17),(18),(19),(20),(21), (22),(23),(2 |-- Clustered Index Seek SEEK: [/BP09/DPROJ_15].DIMID EQ [PBD] .[pbd].[/BP09/FPROJ_1].[KEY_PROJ_15] as [F].[KEY_PROJ_15] ORDERED 1 WHERE: [PBD].[pbd].[/BP09/DPROJ_15]. [/BP09/S_BEN_PLN] as [D5].[/BP09/S_BEN_PLN]<>(2000008999 |-- Index Seek SEEK: [/BP09/SBEN_PLN].SID EQ [PBD].[pbd]. [/BP09/DPROJ_15].[/BP09/S_BEN_PLN] as [D5].[/BP09/S_BEN_PLN] ORDERED 1 WHERE: [PBD].[pbd].[/BP09/SBEN_PLN]. [/BP09/S_BEN_PLN] as [S1].[/BP09/S_BEN_PLN]<>N' ' |-- Clustered Index Seek SEEK: [/BP09/DPROJ_16].DIMID EQ [PBD]. [pbd].[/BP09/FPROJ_1].[KEY_PROJ_16] as [F].[KEY_PROJ_16] ORDERED 1 |-- Clustered Index Seek SEEK: [/BP09/DPROJ_11].DIMID EQ [PBD].[pbd] .[/BP09/FPROJ_1].[KEY_PROJ_11] as [F].[KEY_PROJ_11] ORDERED 1 WHERE: [PBD].[pbd].[/BP09/DPROJ_11].[/BP09/S_FM_AREA] as [D1]. [/BP09/S_FM_AREA]=(2) |-- Clustered Index Seek SEEK: [/BP09/DPROJ_18].DIMID EQ [PBD].[pbd]. [/BP09/FPROJ_1].[KEY_PROJ_18] as [F].[KEY_PROJ_18] ORDERED 1 |-- Clustered Index Seek SEEK: [/BP09/DPROJ_14].DIMID EQ [PBD].[pbd]. [/BP09/FPROJ_1].[KEY_PROJ_14] as [F].[KEY_PROJ_14] ORDERED 1

74
|-- Clustered Index Seek SEEK: [/BP09/DPROJ_1T].DIMID EQ [PBD].[pbd]. [/BP09/FPROJ_1].[KEY_PROJ_1T] as [F].[KEY_PROJ_1T] ORDERED 1 |-- Index Seek SEEK: [/BI0/0200000026].SEQ_NR EQ (0) AND [/BI0/0200000026]. SUCC EQ [PBD].[pbd].[/BP09/DPROJ_11].[/BP09/S_FUND_CT] as [D1]. [/BP09/S_FUND_CT] ORDERED 1 |-- Clustered Index Seek SEEK: [/BP09/DPROJ_1U].DIMID EQ [PBD].[pbd]. [/BP09/FPROJ_1].[KEY_PROJ_1U] as [F].[KEY_PROJ_1U] ORDERED 1 |-- Index Seek SEEK: [/BP09/DPROJ_17]./BP09/S_PROJID EQ (132) AND [/BP09/DPROJ_17].DIMID EQ [PBD].[pbd].[/BP09/FPROJ_1].[KEY_PROJ_17] as [F]. [KEY_PROJ_17] ORDERED 1
SQL Scripts
This statement comes from an expensive SQL script or from a stored procedure (SP) which exists at DB level and is not originated from the ABAP stack. We cannot analyze this statement in detail. Recommendation: Check if: a) The script or SP has to be run at all. b) The script or SP can be run less frequently. c) The script or SP can be tuned so that it consumes fewer database resources.
17.1.8 Access on
Statement Data:
Cache Statistics
Object type
Total executions
Total elapsed time[ms]
Elapsed time[ms]/Record Records/Execution Estimated
Records/Execution
JOIN 3 46572 970.25 16 1
select [F].[KEY_PROJ_13] AS [S____014] , [D2].[/BP09/S_GRANT] AS [S____027] , [DU].[SID_0FM_CURR] AS [S____090] , [D5]. [/BP09/S_BEN_ARE] AS [S____204] , [D7].[/BP09/S_PROJID] AS [S____035] , [H1].[PRED] AS [S____025] , SUM ( [H1].[FACTOR] * [F].[/BP09/S_FM_AMT1] ) AS [Z____091] , COUNT( * ) AS [Z____066] FROM [/BP09/FPROJ_1] [F] JOIN [/BP09/DPROJ_11] [D1] ON [F].[KEY_PROJ_11] = [D1].[DIMID] JOIN [/BI0/0200000036] [H1] ON [D1]. [/BP09/S_FUND_CT] = [H1].[SUCC] JOIN [/BP09/DPROJ_12] [D2] ON [F].[KEY_PROJ_12] = [D2].[DIMID] JOIN [/BP09/DPROJ_1U] [DU] ON

75
[F].[KEY_PROJ_1U] = [DU].[DIMID] JOIN [/BP09/DPROJ_15] [D5] ON [F].[KEY_PROJ_15] = [D5].[DIMID] JOIN [/BP09/DPROJ_17] [D7] ON [F].[KEY_PROJ_17] = [D7].[DIMID] JOIN [/BP09/DPROJ_1P] [DP] ON [F].[KEY_PROJ_1P] = [DP].[DIMID] where ( ( ( ( [D1]. [/BP09/S_FM_AREA] = 2 ) ) AND ( ( [DP].[SID_0CHNGID] = 0 ) ) AND ( ( [DP].[SID_0RECORDTP] IN ( 0 , 2 ) ) ) AND ( ( [DP].[SID_0REQUID] <= 847 ) ) ) ) AND ( ( ( ( [D5].[/BP09/S_BEN_ARE] = 9 ) ) AND ( ( [D7].[/BP09/S_PROJID] = 132 ) ) ) OR ( ( ( [D5].[/BP09/S_BEN_ARE] IN ( 3 , 4 , 5 , 6 , 7 , 8 ) ) ) AND ( ( [D7].[/BP09/S_PROJID] = 132 ) ) ) ) AND ( [H1].[SEQ_NR] = 0 ) GROUP BY [H1].[PRED] ,[F].[KEY_PROJ_13] ,[D2].[/BP09/S_GRANT] ,[DU].[SID_0FM_CURR] ,[D5].[/BP09/S_BEN_ARE] ,[D7].[/BP09/S_PROJID] ORDER BY [S____014] , [S____027] , [S____025] OPTION ( MAXDOP 2 ) /* R3:CL_SQL_STATEMENT==============CP:494 T:/BP09/FPROJ_1 M:001 */
Execution Plan
SQL Scripts
This statement comes from an expensive SQL script or from a stored procedure (SP) which exists at DB level and is not originated from the ABAP stack. We cannot analyze this statement in detail. Recommendation: Check if: a) The script or SP has to be run at all. b) The script or SP can be run less frequently. c) The script or SP can be tuned so that it consumes fewer database resources.
17.1.9 Access on
Statement Data:
Cache Statistics
Object type
Total executions
Total elapsed time[ms]
Elapsed time[ms]/Record Records/Execution Estimated
Records/Execution
JOIN 1 44991 2,142.43 21 1

76
select [D6].[/BP09/S_EMPLOYE] AS [S____017] , [D2].[/BP09/S_FUND] AS [S____023] , [D6].[/BP09/S_JOB] AS [S____029] , [D6]. [/BP09/S_POSTN] AS [S____033] , [D4].[/BP09/S_PYSCLGP] AS [S____037] , [D8].[SID_0EMPLGROUP] AS [S____049] , [D8]. [SID_0EMPLSGROUP] AS [S____050] , [D8].[SID_0PERS_AREA] AS [S____056] , [D8].[SID_0PERS_SAREA] AS [S____057] , [DU]. [SID_0FM_CURR] AS [S____090] , [D5].[/BP09/S_BEN_ARE] AS [S____204] , [H1].[PRED] AS [S____025] , SUM ( [H1].[FACTOR] * [F]. [/BP09/S_FM_AMT1] ) AS [Z____091] , COUNT( * ) AS [Z____066] FROM [/BP09/FPROJ_1] [F] JOIN [/BP09/DPROJ_17] [D7] ON [F].[KEY_PROJ_17] = [D7].[DIMID] JOIN [/BP09/DPROJ_1P] [DP] ON [F]. [KEY_PROJ_1P] = [DP].[DIMID] JOIN [/BP09/DPROJ_11] [D1] ON [F].[KEY_PROJ_11] = [D1].[DIMID] JOIN [/BI0/0200000033] [H1] ON [D1].[/BP09/S_FUND_CT] = [H1].[SUCC] JOIN [/BP09/DPROJ_16] [D6] ON [F].[KEY_PROJ_16] = [D6].[DIMID] JOIN [/BP09/DPROJ_12] [D2] ON [F].[KEY_PROJ_12] = [D2].[DIMID] JOIN [/BP09/DPROJ_14] [D4] ON [F].[KEY_PROJ_14] = [D4].[DIMID] JOIN [/BP09/DPROJ_18] [D8] ON [F].[KEY_PROJ_18] = [D8].[DIMID] JOIN [/BP09/DPROJ_1U] [DU] ON [F].[KEY_PROJ_1U] = [DU].[DIMID] JOIN [/BP09/DPROJ_15] [D5] ON [F].[KEY_PROJ_15] = [D5].[DIMID] JOIN [/BP09/SBEN_PLN] [S1] ON [D5].[/BP09/S_BEN_PLN] = [S1].[SID] where ( ( ( ( [D5]. [/BP09/S_BEN_PLN] <> 2000008999 ) AND NOT ( [S1].[/BP09/S_BEN_PLN] = N' ' ) ) AND ( ( [D1].[/BP09/S_FM_AREA] = 2 ) ) AND ( ( [D7].[/BP09/S_PROJID] = 132 ) ) AND ( ( [DP].[SID_0CHNGID] = 0 ) ) AND ( ( [DP].[SID_0RECORDTP] IN ( 0 , 2 ) ) ) AND ( ( [DP].[SID_0REQUID] <= 847 ) ) ) ) AND ( ( ( ( [D5].[/BP09/S_BEN_ARE] = 6 ) ) ) OR ( ( ( [D5].[/BP09/S_BEN_ARE] = 4 ) ) ) OR ( ( ( [D5].[/BP09/S_BEN_ARE] = 3 ) ) ) OR ( ( ( [D5].[/BP09/S_BEN_ARE] = 7 ) ) ) OR ( ( ( [D5].[/BP09/S_BEN_ARE] = 5 ) ) ) OR ( ( ( [D5].[/BP09/S_BEN_ARE] = 8 ) ) ) OR ( ( ( [D5].[/BP09/S_BEN_ARE] = 9 ) ) ) ) AND ( [H1].[SEQ_NR] = 0 ) GROUP BY [H1].[PRED] ,[D6].[/BP09/S_EMPLOYE] ,[D2].[/BP09/S_FUND] ,[D6].[/BP09/S_JOB] ,[D6].[/BP09/S_POSTN] ,[D4].[/BP09/S_PYSCLGP] , [D8].[SID_0EMPLGROUP] ,[D8].[SID_0EMPLSGROUP] ,[D8].[SID_0PERS_AREA] ,[D8].[SID_0PERS_SAREA] ,[DU].[SID_0FM_CURR] ,[D5]. [/BP09/S_BEN_ARE] ORDER BY [S____017] , [S____023] , [S____029] , [S____033] , [S____037] , [S____049] , [S____050] , [S____056] , [S____057] , [S____025] OPTION ( MAXDOP 2 ) /* R3:CL_SQL_STATEMENT==============CP:494 T:/BP09/FPROJ_1 M:001 */
Execution Plan
SQL Scripts
This statement comes from an expensive SQL script or from a stored procedure (SP) which exists at DB level and is not originated from the ABAP stack. We cannot analyze this statement in detail. Recommendation: Check if: a) The script or SP has to be run at all. b) The script or SP can be run less frequently. c) The script or SP can be tuned so that it consumes fewer database resources.
17.1.10 Access on

77
Statement Data:
Cache Statistics
Object type
Total executions
Total elapsed time[ms]
Elapsed time[ms]/Record Records/Execution Estimated
Records/Execution
JOIN 1 44718 2,129.41 21 1
select [D6].[/BP09/S_EMPLOYE] AS [S____017] , [D2].[/BP09/S_FUND] AS [S____023] , [D2].[/BP09/S_GRANT] AS [S____027] , [D6]. [/BP09/S_JOB] AS [S____029] , [D6].[/BP09/S_POSTN] AS [S____033] , [D4].[/BP09/S_PYSCLGP] AS [S____037] , [D8]. [SID_0EMPLGROUP] AS [S____049] , [D8].[SID_0EMPLSGROUP] AS [S____050] , [D8].[SID_0PERS_AREA] AS [S____056] , [D8]. [SID_0PERS_SAREA] AS [S____057] , [DU].[SID_0FM_CURR] AS [S____090] , [D5].[/BP09/S_BEN_ARE] AS [S____204] , [H2].[PRED] AS [S____025] , SUM ( [H2].[FACTOR] * [F].[/BP09/S_FM_AMT1] ) AS [Z____091] , COUNT( * ) AS [Z____066] FROM [/BP09/FPROJ_1] [F] JOIN [/BP09/DPROJ_17] [D7] ON [F].[KEY_PROJ_17] = [D7].[DIMID] JOIN [/BP09/DPROJ_1P] [DP] ON [F]. [KEY_PROJ_1P] = [DP].[DIMID] JOIN [/BP09/DPROJ_11] [D1] ON [F].[KEY_PROJ_11] = [D1].[DIMID] JOIN [/BI0/0200000033] [H2] ON [D1].[/BP09/S_FUND_CT] = [H2].[SUCC] JOIN [/BP09/DPROJ_16] [D6] ON [F].[KEY_PROJ_16] = [D6].[DIMID] JOIN [/BP09/DPROJ_12] [D2] ON [F].[KEY_PROJ_12] = [D2].[DIMID] JOIN [/BP09/DPROJ_14] [D4] ON [F].[KEY_PROJ_14] = [D4].[DIMID] JOIN [/BP09/DPROJ_18] [D8] ON [F].[KEY_PROJ_18] = [D8].[DIMID] JOIN [/BP09/DPROJ_1U] [DU] ON [F].[KEY_PROJ_1U] = [DU].[DIMID] JOIN [/BP09/DPROJ_15] [D5] ON [F].[KEY_PROJ_15] = [D5].[DIMID] JOIN [/BP09/SBEN_PLN] [S2] ON [D5].[/BP09/S_BEN_PLN] = [S2].[SID] where ( ( ( ( [D5]. [/BP09/S_BEN_PLN] <> 2000008999 ) AND NOT ( [S2].[/BP09/S_BEN_PLN] = N' ' ) ) AND ( ( [D1].[/BP09/S_FM_AREA] = 2 ) ) AND ( ( [D7].[/BP09/S_PROJID] = 132 ) ) AND ( ( [DP].[SID_0CHNGID] = 0 ) ) AND ( ( [DP].[SID_0RECORDTP] IN ( 0 , 2 ) ) ) AND ( ( [DP].[SID_0REQUID] <= 847 ) ) ) ) AND ( ( ( ( [D5].[/BP09/S_BEN_ARE] = 6 ) ) ) OR ( ( ( [D5].[/BP09/S_BEN_ARE] = 4 ) ) ) OR ( ( ( [D5].[/BP09/S_BEN_ARE] = 3 ) ) ) OR ( ( ( [D5].[/BP09/S_BEN_ARE] = 7 ) ) ) OR ( ( ( [D5].[/BP09/S_BEN_ARE] = 5 ) ) ) OR ( ( ( [D5].[/BP09/S_BEN_ARE] = 8 ) ) ) OR ( ( ( [D5].[/BP09/S_BEN_ARE] = 9 ) ) ) ) AND ( [H2].[SEQ_NR] = 0 ) GROUP BY

78
[H2].[PRED] ,[D6].[/BP09/S_EMPLOYE] ,[D2].[/BP09/S_FUND] ,[D2].[/BP09/S_GRANT] ,[D6].[/BP09/S_JOB] ,[D6].[/BP09/S_POSTN] ,[D4]. [/BP09/S_PYSCLGP] ,[D8].[SID_0EMPLGROUP] ,[D8].[SID_0EMPLSGROUP] ,[D8].[SID_0PERS_AREA] ,[D8].[SID_0PERS_SAREA] ,[DU]. [SID_0FM_CURR] ,[D5].[/BP09/S_BEN_ARE] ORDER BY [S____017] , [S____023] , [S____027] , [S____029] , [S____033] , [S____037] , [S____049] , [S____050] , [S____056] , [S____057] , [S____025] OPTION ( MAXDOP 2 ) /* R3:CL_SQL_STATEMENT==============CP:494 T:/BP09/FPROJ_1 M:001 */
Execution Plan
SQL Scripts
This statement comes from an expensive SQL script or from a stored procedure (SP) which exists at DB level and is not originated from the ABAP stack. We cannot analyze this statement in detail. Recommendation: Check if: a) The script or SP has to be run at all. b) The script or SP can be run less frequently. c) The script or SP can be tuned so that it consumes fewer database resources.
18 Trend Analysis This section contains the trend analysis for key performance indicators (KPIs). Diagrams are built weekly once the EarlyWatch Alert service is activated.
In this report, historical data for "Transaction Activity", "System Performance", and "Database Performance" is taken directly from workload monitor ST03, because EarlyWatch Alert data has been accumulated for less than 20 sessions.
In this section, a "week" is from Monday to Sunday. The date displayed is the Sunday of the week.
18.1 System Activity The following diagrams show the system activity over time.
The "Transaction Activity" diagram below depicts transaction activity in the system over time.
- Total Activity: Transaction steps performed each week (in thousands)
- Dialog Activity: Transaction steps performed in dialog task each week (in thousands)
- Peak Activity: Transaction steps (in thousands) during the peak hour; this peak hour is calculated as the hour with the maximum dialog activity in the ST03 time profile divided by 5 working days per week.
(Peak Activity is absent if "Activity Data" is taken from ST03 data directly).
Historical data for "Transaction Activity" is obtained from the Workload Monitor (ST03).

79
The "User Activity" diagram below shows the user activity on the system over time.
- Total Users: Total users that logged on in one week.
- Active Users: Users who performed more than 400 transaction steps in one week.
18.2 Response Times The following diagrams show how the response time varies over time. The "System Performance" diagram below shows the average response time in dialog tasks for the previous week.
Historical data for "System Performance" is obtained from the Workload Monitor (ST03).

80
The "Database Performance" diagram below shows the average DB response time in dialog tasks.
The "Top 5 transactions" diagram below shows the average response time in dialog tasks for the top 5 transactions.
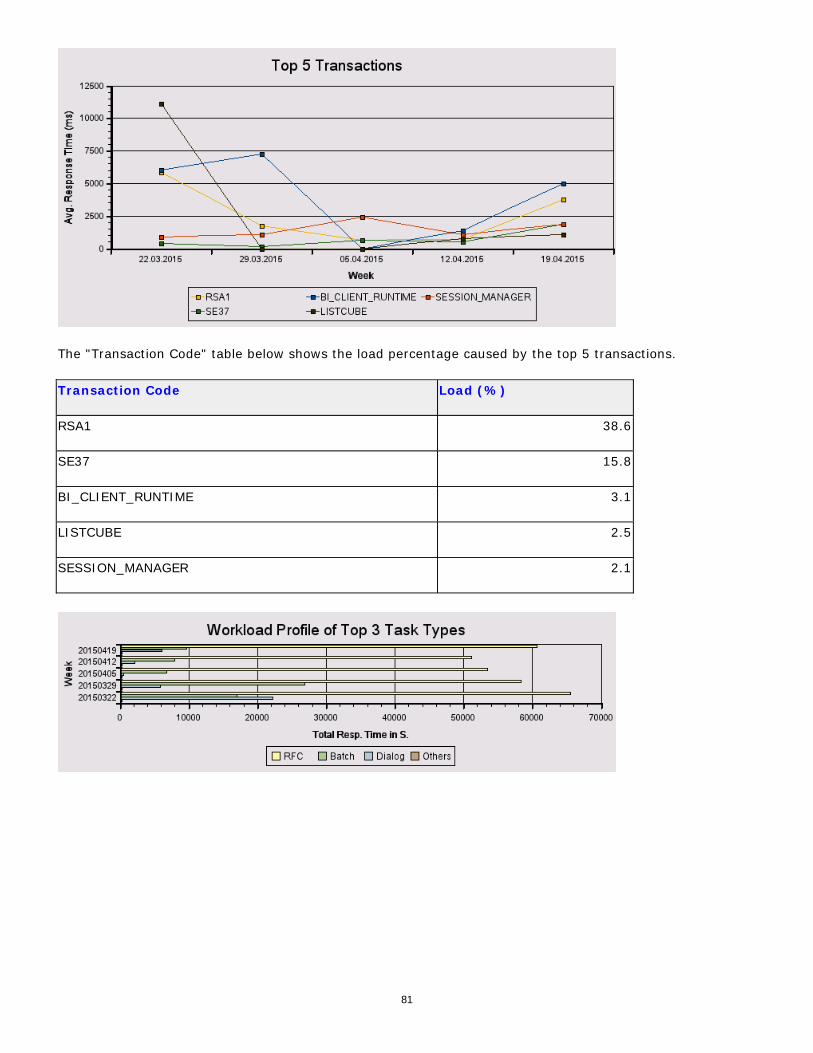
81
The "Transaction Code" table below shows the load percentage caused by the top 5 transactions.
Transaction Code Load (%)
RSA1 38.6
SE37 15.8
BI_CLIENT_RUNTIME 3.1
LISTCUBE 2.5
SESSION_MANAGER 2.1
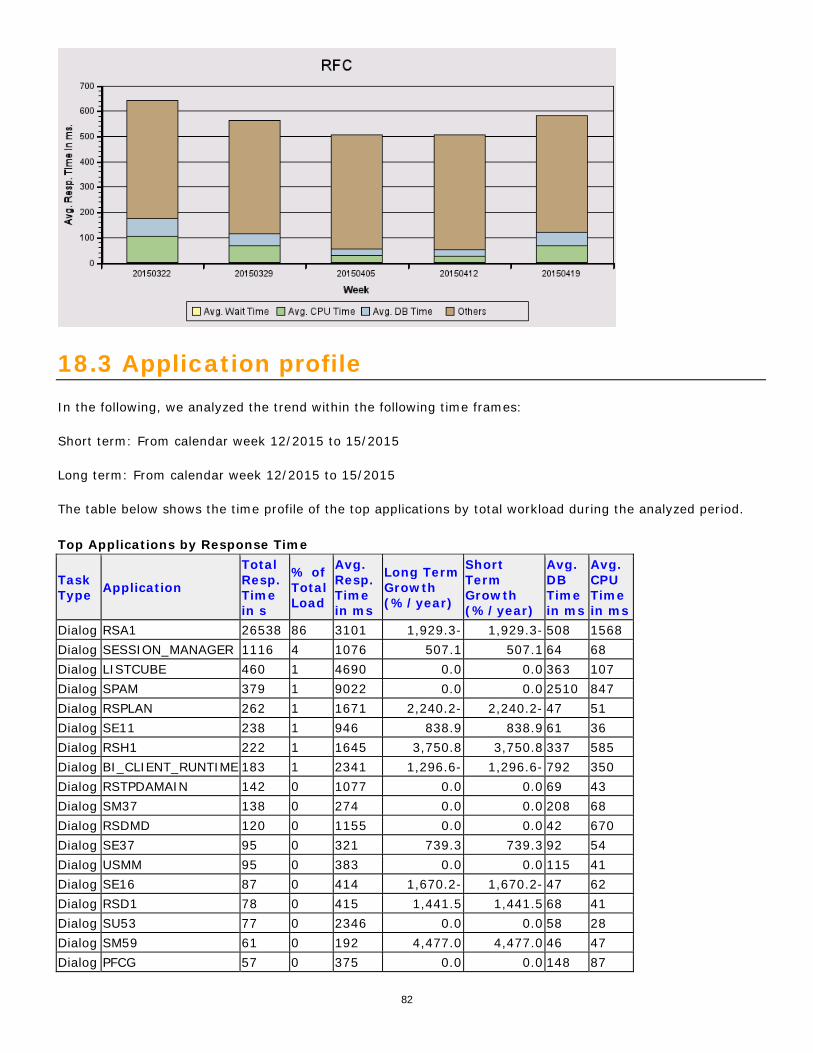
82
18.3 Application profile In the following, we analyzed the trend within the following time frames:
Short term: From calendar week 12/2015 to 15/2015
Long term: From calendar week 12/2015 to 15/2015
The table below shows the time profile of the top applications by total workload during the analyzed period.
Top Applications by Response Time
Task Type Application
Total Resp. Time in s
% of Total Load
Avg. Resp. Time in ms
Long Term Growth (%/year)
Short Term Growth (%/year)
Avg. DB Time in ms
Avg. CPU Time in ms
Dialog RSA1 26538 86 3101 1,929.3- 1,929.3- 508 1568 Dialog SESSION_MANAGER 1116 4 1076 507.1 507.1 64 68 Dialog LISTCUBE 460 1 4690 0.0 0.0 363 107 Dialog SPAM 379 1 9022 0.0 0.0 2510 847 Dialog RSPLAN 262 1 1671 2,240.2- 2,240.2- 47 51 Dialog SE11 238 1 946 838.9 838.9 61 36 Dialog RSH1 222 1 1645 3,750.8 3,750.8 337 585 Dialog BI_CLIENT_RUNTIME 183 1 2341 1,296.6- 1,296.6- 792 350 Dialog RSTPDAMAIN 142 0 1077 0.0 0.0 69 43 Dialog SM37 138 0 274 0.0 0.0 208 68 Dialog RSDMD 120 0 1155 0.0 0.0 42 670 Dialog SE37 95 0 321 739.3 739.3 92 54 Dialog USMM 95 0 383 0.0 0.0 115 41 Dialog SE16 87 0 414 1,670.2- 1,670.2- 47 62 Dialog RSD1 78 0 415 1,441.5 1,441.5 68 41 Dialog SU53 77 0 2346 0.0 0.0 58 28 Dialog SM59 61 0 192 4,477.0 4,477.0 46 47 Dialog PFCG 57 0 375 0.0 0.0 148 87

83
Top Applications by Response Time
Task Type Application
Total Resp. Time in s
% of Total Load
Avg. Resp. Time in ms
Long Term Growth (%/year)
Short Term Growth (%/year)
Avg. DB Time in ms
Avg. CPU Time in ms
Dialog RSINPUT 49 0 481 0.0 0.0 140 147 Dialog SAPMSEU0 43 0 1491 0.0 0.0 196 96
The graph below shows how the average response time of the top five applications varies over time. Data is normalized to 100% equaling the average value.
18.4 System Operation The following diagram or table shows important KPIs for system operation.
18.5 Hardware Capacity
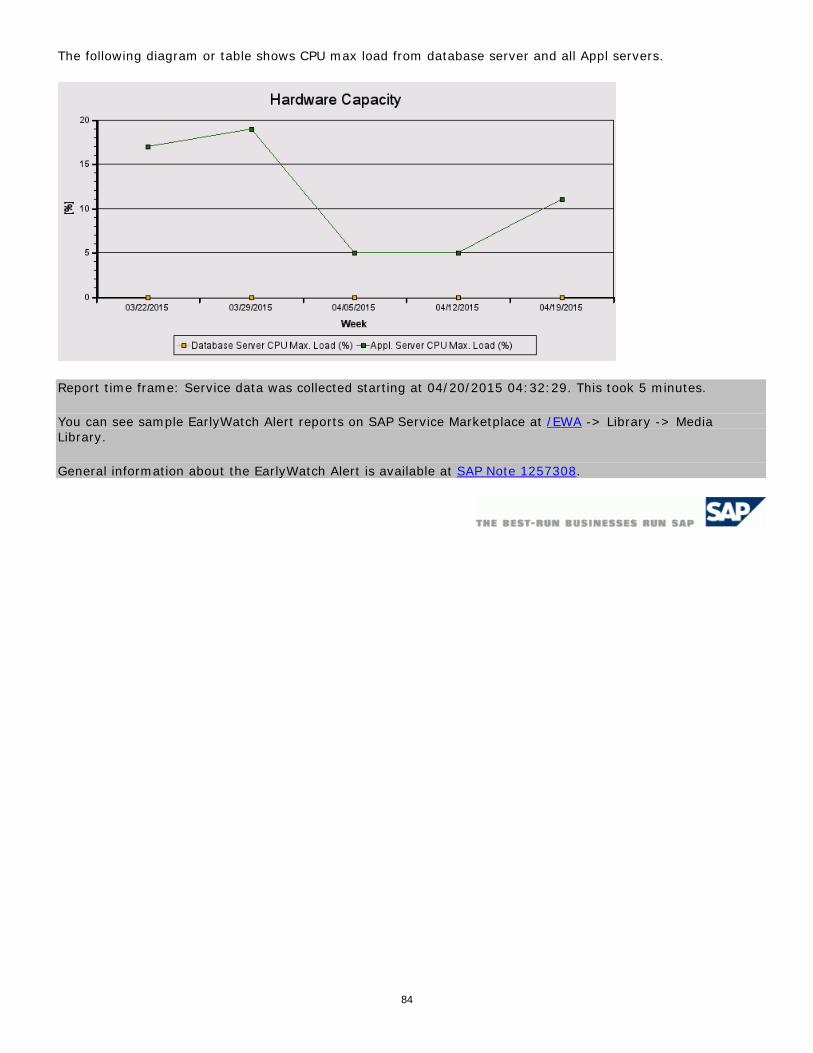
84
The following diagram or table shows CPU max load from database server and all Appl servers.
Report time frame: Service data was collected starting at 04/20/2015 04:32:29. This took 5 minutes.
You can see sample EarlyWatch Alert reports on SAP Service Marketplace at /EWA -> Library -> Media Library.
General information about the EarlyWatch Alert is available at SAP Note 1257308.

![uky; h; f'A{A.A o la'Aks/Au] - Maharashtra · DMER MAHICTICH lapky ekfgr A ADHIKAR uky; hpk 2013]oS|d vf/Ad 17 c h; f' kj vf kchof A{A.A /Afu; jy e o la' e 2 kfgrh Aks/Au] 005 v 1](https://img.pdfslide.net/doc/110x75/600895306cd6be1a60096217/uky-h-faaa-o-laaksau-maharashtra-dmer-mahictich-lapky-ekfgr-a-adhikar.jpg)