Embed Size (px)
Citation preview

�brookings April 2008
Findings
This report examines the changing geographic distribution of recipients of the federal Earned Income Tax Credit (EITC) across large cities and suburbs, smaller metro areas, and rural communities in the United States. An analysis of IRS data on EITC recipients in tax years 2000 and 2005 reveals that:
In tax year 2005, the greatest number of EITC filers lived in the suburbs of large metropolitan areas. More than 8 million EITC filers lived in the sub-urbs, though big-city and rural taxpayers were more likely to receive the EITC. In both large cities and rural areas, more than one in five low-income workers claimed the credit in tax year 2005.
In the South and West, rural taxpayers were most likely to receive the EITC, while Northeastern and Midwestern EITC recipients were more concentrated in large cities. Over a quarter of rural taxpayers in the South claimed the EITC in tax year 2005. Similar, though slightly smaller, proportions of low-income workers in Northeastern central cities received the credit that year.
Total EITC filers increased by 3.2 million between tax years 2000 and 2005, and almost half that growth (1.6 million) occurred in large suburbs. While large suburbs captured much of the increase in actual EITC filers, rural areas—especially in the Midwest—experienced faster growth in the share of taxpayers claiming the EITC over the first half of the decade.
Almost 47 percent of EITC filers claimed the Additional Child Tax Credit (ACTC) in tax year 2005, for a total of $9.4 billion. EITC filers living in large suburbs were the most likely to also benefit from the ACTC, followed by EITC recipients in smaller metropolitan areas.
Together, the EITC and ACTC provided more than $51 billion to low-income work-ers in tax year 2005, acting as critical wage supplements for working poor families throughout the country. Proposals to expand and streamline these credits to help more working families across all types of communities—urban, suburban, and rural—deserve consideration from policymakers, practitioners, and researchers.
■
■
■
■
Bridging the Gap: Refundable Tax Credits in Metropolitan and Rural AmericaElizabeth Kneebone
EARNED INCOME TAX CREDIT SERIES FROM THE METROPOLITAN POLICY PROGRAM AT BROOKINGS
“The EITC
and
ACTC provide
much-needed
wage
supplements
to low-income
workers in
urban,
suburban,
and rural
communities
across the
country.”

�brookings April 2008
Introduction
Between 2000 and 2005, families across the United States watched prices for everyday necessities—food, housing, utilities, gas—rise consistently. But while costs climb year after year, wages, especially for those towards the lower end of the income distribu-tion, have not kept pace. A labor market with rising unemployment and an abundance of low-wage, low-skill jobs has made it increas-ingly difficult for working families to meet their growing financial obligations.1
Increasingly, working families turn to provisions in the tax code to help close the resource gap between rising costs and stagnat-ing wages. The federal Earned Income Tax Credit (EITC) is currently the largest such provi-sion. A refundable tax credit, the EITC plays an important role in supplementing wages and alle-viating poverty across the United States.2
Previous research showed the importance of the EITC to low-income families in a range of communities—urban, suburban, and rural—throughout the coun-try in tax year (TY) 2001.3 This paper provides a mid-decade look at the growing role the EITC played as a work support for low-income families in these differ-ent geographies. This analysis further refines the methodology used in that earlier assessment and makes use of the most recent data available to bring the analysis forward to TY 2005. In addition, this paper includes new information on the Additional Child Tax Credit (ACTC), another important refundable tax credit that benefits lower-income work-ers with children.
After briefly reviewing the meth-odology, the paper examines TY 2005 EITC receipt across met-
ropolitan and rural communities throughout the country. It also assesses the extent to which EITC receipt across different communities changed since TY 2000. The paper concludes by evaluating the additional benefit EITC filers in urban and rural areas received from the ACTC in TY 2005.
Methodology
This paper first assesses the geographic distribution of EITC filers and benefits across the United States in TY 2005, as well as changes in EITC receipt from TY 2000. The EITC—a refund-able tax credit claimed through the federal tax return—increases with earned income over a certain range, levels off at a maximum credit level, and eventually phases out as earnings continue to rise. As currently structured, the bulk of EITC dollars go to workers with children (Figure 1). In TY 2005, the EITC provided workers with two or more children a 40 cent boost for every dollar earned over the phase-in range. Depending on marital status, parents making between $7,830 and $16,370 were eligible for the largest credits (up to $4,400 for parents with two or more children and $2,662 for parents with one child), while childless workers and non-custodial parents could claim a much smaller version of the credit (up to $399).
In addition to assessing patterns of EITC receipt, this paper also evaluates the extent to which EITC filers benefit from the re-fundable portion of the Child Tax Credit (CTC), referred to in this analysis as the Additional Child Tax Credit (ACTC). To claim the ACTC in TY 2005, workers had to have at least one qualifying child and earn above $11,000. The re-fundable nature of this credit pro-vides an important supplement to the tax refunds of lower-income workers and, in combination with the EITC, further increases the value of work for many recipi-ents.4
To understand how these credits benefit low-income workers and their families in different com-munities throughout the country, this assessment delineates four “geography types.” Building on

�brookings April 2008
previous research, the area types analyzed here include Large City, Large Suburb, Small Metro, and Rural.5 Large cities comprise the central cities of the 100 largest metropolitan areas in the United States.6 The large suburbs cat-egory represents the remainder of the top 100 metropolitan areas. The 261 metropolitan areas that fall outside the top 100 make up the small metros geography type. All other counties not located in an official metropolitan area are considered rural.7 As of 2005, 20.8 percent of the U.S. popula-tion lived in large cities, 44.5 percent lived in large suburbs, 18.0 percent lived in small metro areas, and 16.8 percent lived in rural counties.8
ZIP code-level data for tax years 2000 and 2005 provide the build-ing blocks of this geographic analysis. Data on total taxpay-ers, EITC recipients, and ACTC claims come from IRS’ Stake-holder Partnerships, Education, and Communications (SPEC) division, which aggregates indi-
vidual tax return information to the ZIP code-level.
ZIP codes often do not align with city and county boundaries, so before the SPEC data can be aggregated to create discrete totals for larger geographies, any overlapping ZIP codes must first be allocated. This analysis uses a combination of mapping and statistical software to “split” the ZIP code-level data as needed. Where ZIP codes cross city or county boundaries, the data are apportioned according to the share of the ZIP code population that falls within each jurisdiction, based on the distribution of the 2000 census block population.9 Because ZIP code boundaries change from year to year, and as such overlap differently with other geographies depending on the year, this process is undertaken for both TY 2000 and TY 2005.
Finally, to examine how EITC receipt varies in different parts of the country, this analysis assigns each ZIP code to one of four cen-
Figure 1. Value of the EITC by Income, TY 2005
$0
$500
$1,000
$1,500
$2,000
$2,500
$3,000
$3,500
$4,000
$4,500
$5,000
$0 $5,000 $10,000 $15,000 $20,000 $25,000 $30,000 $35,000 $40,000
Income
Cre
dit V
alue
No ChildrenOne ChildTwo or More Children
$4,400
$2,662
$399
*Married couples filing jointly begin phase-out and reach maximum income limits $2,000 above unmarried filers (shown by dashed lines).Source: Internal Revenue Service
sus-defined regions (Northeast, Midwest, South, and West) based on the state in which the ZIP code is located. The paper presents patterns in EITC receipt by geog-raphy type for each region, and assesses regional trends in EITC receipt between tax years 2000 and 2005.10

�brookings April 2008
Findings
A. In tax year 2005, the greatest number of EITC filers lived in the suburbs of large metropoli-tan areas.
Over 22 million filers—roughly 17 percent of all tax filers in the country—received the EITC in TY 2005 for a total of $41.8 bil-lion. However, EITC filers and the credit amounts they receive are not evenly spread throughout the country. Figure 2a shows
Though suburban EITC recipients claim the largest share of total EITC dollars, Figure 2a shows that EITC filers in big cities qualify for the largest credits on aver-age. Nationally, the average EITC credit amount was $1,894 in TY 2005. EITC filers in large cities claim an average credit of $1,952—higher than the national average and over $100 more than the average suburban credit. A number of factors can contribute to these differences in average
credits, including differences in family structure and size as well as variations in average incomes between geography types.11
While Figure 2a sheds light on which types of communities contain the highest numbers of EITC filers, Figure 2b reveals which geography types contain the highest concentrations of EITC recipients. Though home to the largest number of EITC filers, large suburbs actually have
the national distribu-tion of EITC recipients and dollar amounts in TY 2005. Among the four geography types, large suburbs contain the greatest number of EITC filers. Fully 8 million EITC recipients live in large suburbs—almost double the number of EITC filers in either small metros or rural areas. Moreover, EITC filers in large suburbs exceed their central city counterparts by more than 2.5 million taxpayers.
Given that large sub-urbs contain the great-est number of EITC filers, it follows that suburban filers receive the greatest share of EITC funds (Figure 2a). In fact, suburban EITC recipients claimed over one-third of all EITC dollars in TY 2005. Rural and small metro areas each received more than $8 billion through the EITC, and central city taxpayers claimed almost $10.8 billion. At the same time, suburban EITC filers received nearly $14.8 billion through the credit.
Figure 2b. Share of Filers Receiving EITC by Geography Type, TY 2005
21.5%
13.5%
18.1%
20.4%
0.0%
5.0%
10.0%
15.0%
20.0%
25.0%
Large City Large Suburb Small Metro Rural
Geography Type
Shar
e R
ecei
ving
EIT
C
Source: Brookings Institution analysis of Internal Revenue Service data
Figure 2a. EITC Recipients and Dollars by Geography Type, TY 2005
5,505
8,025
4,2844,205
$10,746,301
$14,773,635
$8,163,275$8,028,281
0
1,000
2,000
3,000
4,000
5,000
6,000
7,000
8,000
9,000
Large City Large Suburb Small Metro Rural
EITC
Rec
ipie
nts
(1,0
00s)
Geography Type
$0
$2,000,000
$4,000,000
$6,000,000
$8,000,000
$10,000,000
$12,000,000
$14,000,000
$16,000,000
EITC
Dol
lars
(1,0
00s)
EITC Recipients
EITC Dollars
$1,952 $1,841 $1,909 $1,906
Average Credit

�brookings April 2008
the lowest share (13.5 percent) of their taxpayers claiming the credit among the four geography types. In contrast, low-income workers living in large cities and rural areas prove most likely to receive the EITC. In TY 2005, 21.5 percent of filers in large cit-ies claimed the EITC, while one in five rural taxpayers received the credit. Small metro areas experience lower levels of EITC receipt (18.1 percent) than large cities and rural areas, yet outpace the national average by more than a percentage point. Thus, a plurality of EITC recipients live in large suburbs but make up a smaller share of total suburban taxpayers, while large cities and
rural areas have smaller recipi-ent populations overall but higher rates of credit receipt. B. In the South and West, rural taxpayers were the most likely to receive the EITC, while Northeastern and Midwestern EITC recipients were more con-centrated in large cities.
This section explores the extent to which patterns of EITC re-ceipt vary not just across types of geographies, but also across regions of the United States. As Map 1 illustrates, considerable differences exist in the concentra-tions of EITC filers throughout the country. Clearly, ZIP codes with
the highest shares of EITC filers tend to cluster in the South, while the Northeast shows the largest clusters of “low EITC receipt” ZIP codes.12 Indeed, almost half of all taxpayers in the South live in ZIP codes with rates of EITC receipt that exceed the national average (Table 1). On the other hand, the largest share of total taxpayers in the Northeast (46.3 percent) live in ZIP codes where less than 10 percent of filers re-ceive the EITC, and another third live in ZIP codes with rates of EITC receipt between 10 and 20 percent. Though less apparent in Map 1, higher rates of urban EITC receipt in the Northeast also mean that close to 1 million
% Receiving EITC
0 - 5%
5 - 10%
10 - 15%
15 - 20%
20 - 30%
30 - 40%
> 40%
No Data
Map 1. EITC Recipients as a Percentage of Total Returns by ZIP Code, TY 2005
MIDWEST NORTHEAST
SOUTH
WEST
�brookings April 2008
taxpayers live in ZIP codes where more than 40 percent of filers claim the EITC. The South is the only region with a higher share of taxpayers in that category.
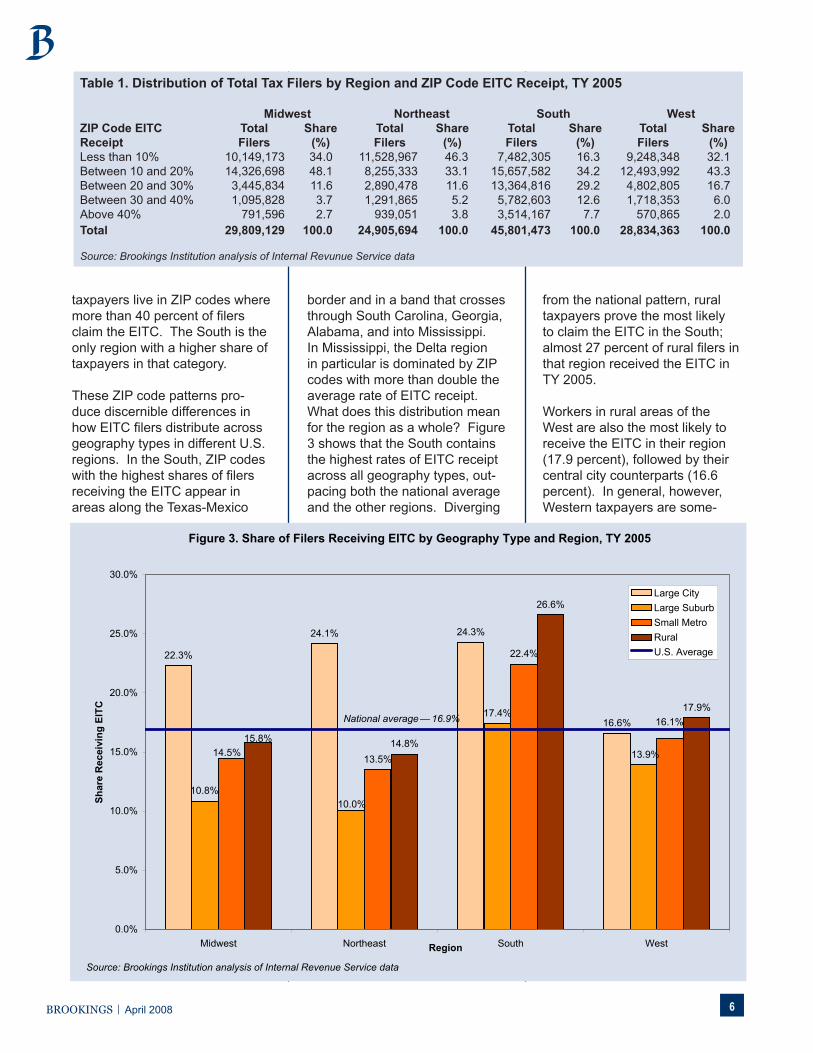
These ZIP code patterns pro-duce discernible differences in how EITC filers distribute across geography types in different U.S. regions. In the South, ZIP codes with the highest shares of filers receiving the EITC appear in areas along the Texas-Mexico
border and in a band that crosses through South Carolina, Georgia, Alabama, and into Mississippi. In Mississippi, the Delta region in particular is dominated by ZIP codes with more than double the average rate of EITC receipt. What does this distribution mean for the region as a whole? Figure 3 shows that the South contains the highest rates of EITC receipt across all geography types, out-pacing both the national average and the other regions. Diverging
from the national pattern, rural taxpayers prove the most likely to claim the EITC in the South; almost 27 percent of rural filers in that region received the EITC in TY 2005.
Workers in rural areas of the West are also the most likely to receive the EITC in their region (17.9 percent), followed by their central city counterparts (16.6 percent). In general, however, Western taxpayers are some-
Table 1. Distribution of Total Tax Filers by Region and ZIP Code EITC Receipt, TY 2005 Midwest Northeast South West ZIP Code EITC Total Share Total Share Total Share Total ShareReceipt Filers (%) Filers (%) Filers (%) Filers (%)Less than 10% 10,149,173 34.0 11,528,967 46.3 7,482,305 16.3 9,248,348 32.1Between 10 and 20% 14,326,698 48.1 8,255,333 33.1 15,657,582 34.2 12,493,992 43.3Between 20 and 30% 3,445,834 11.6 2,890,478 11.6 13,364,816 29.2 4,802,805 16.7Between 30 and 40% 1,095,828 3.7 1,291,865 5.2 5,782,603 12.6 1,718,353 6.0Above 40% 791,596 2.7 939,051 3.8 3,514,167 7.7 570,865 2.0Total 29,809,129 100.0 24,905,694 100.0 45,801,473 100.0 28,834,363 100.0
Source: Brookings Institution analysis of Internal Revunue Service data
Figure 3. Share of Filers Receiving EITC by Geography Type and Region, TY 2005
22.3%
24.1% 24.3%
16.6%17.4%
13.5%
22.4%
14.8%
26.6%
17.9%
13.9%
10.0%10.8%
14.5%
16.1%15.8%
0.0%
5.0%
10.0%
15.0%
20.0%
25.0%
30.0%
Midwest Northeast South WestRegion
Shar
e R
ecei
ving
EIT
C
Large CityLarge SuburbSmall MetroRuralU.S. Average
Source: Brookings Institution analysis of Internal Revenue Service data
National average — 16.9%
�brookings April 2008
what less likely than average to claim the EITC. As Map 1 shows, Arizona, New Mexico, and Mon-tana each have pockets of high EITC receipt—areas that largely correspond with American Indian reservations in each state—but for the most part, the Western region exhibits a much more even concentration of EITC filers across geography types than the other three regions. Large sub-urbs—which have the lowest rate of EITC receipt in the West—only trail the rural rate of EITC receipt by four percentage points.
The Midwest and Northeast each show a much different geographic
distribution of EITC filers than the West or the South. In many ways the distribution of filers by geography type for these two regions more closely resembles the national average; however, each shows a much starker divide between EITC receipt in large cities versus large suburbs. In the Northeast, 24.1 percent of large-city taxpayers claim the EITC, while only 10.0 percent of suburban filers do. The Midwest exhibits a similar, though not quite as disparate, distribution, with 22.3 percent of central-city filers receiving the EITC versus 10.8 percent in the suburbs.
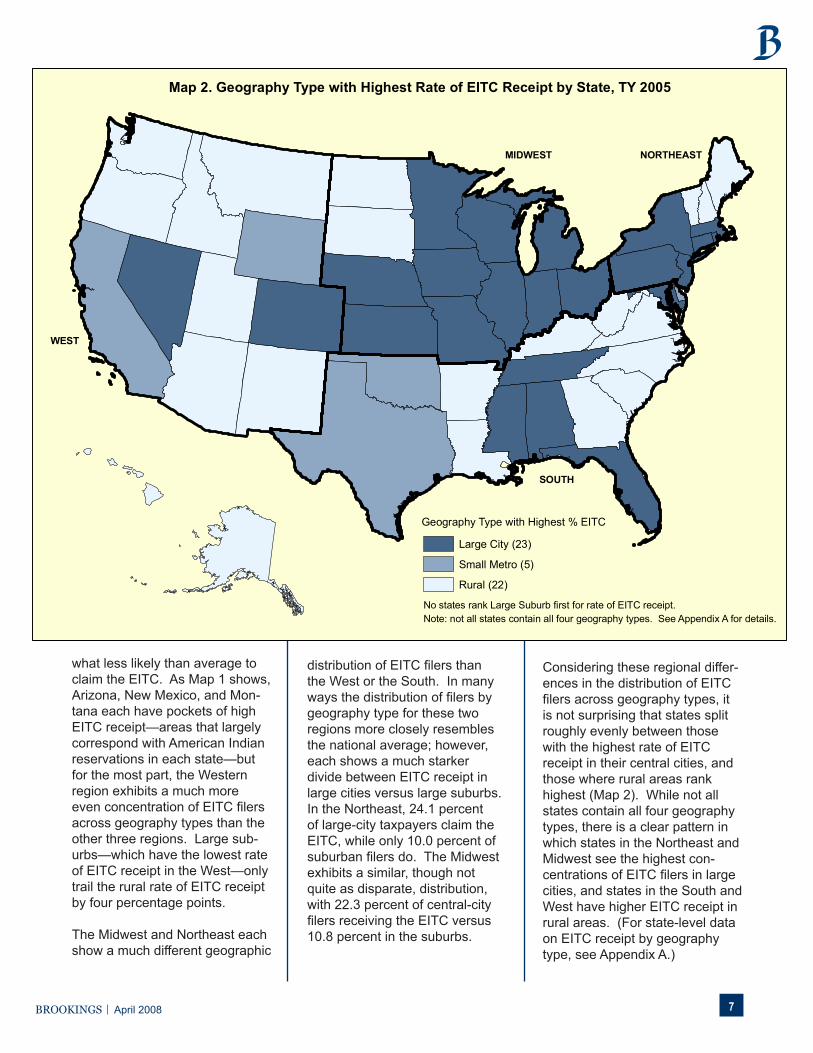
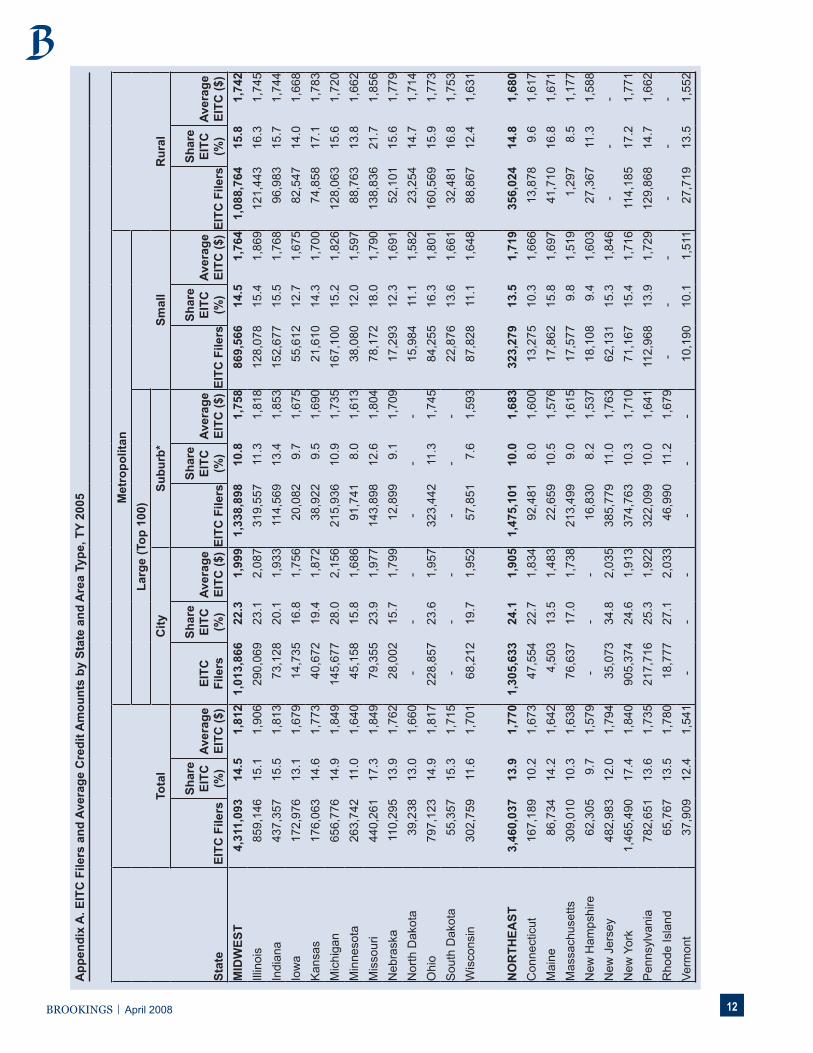
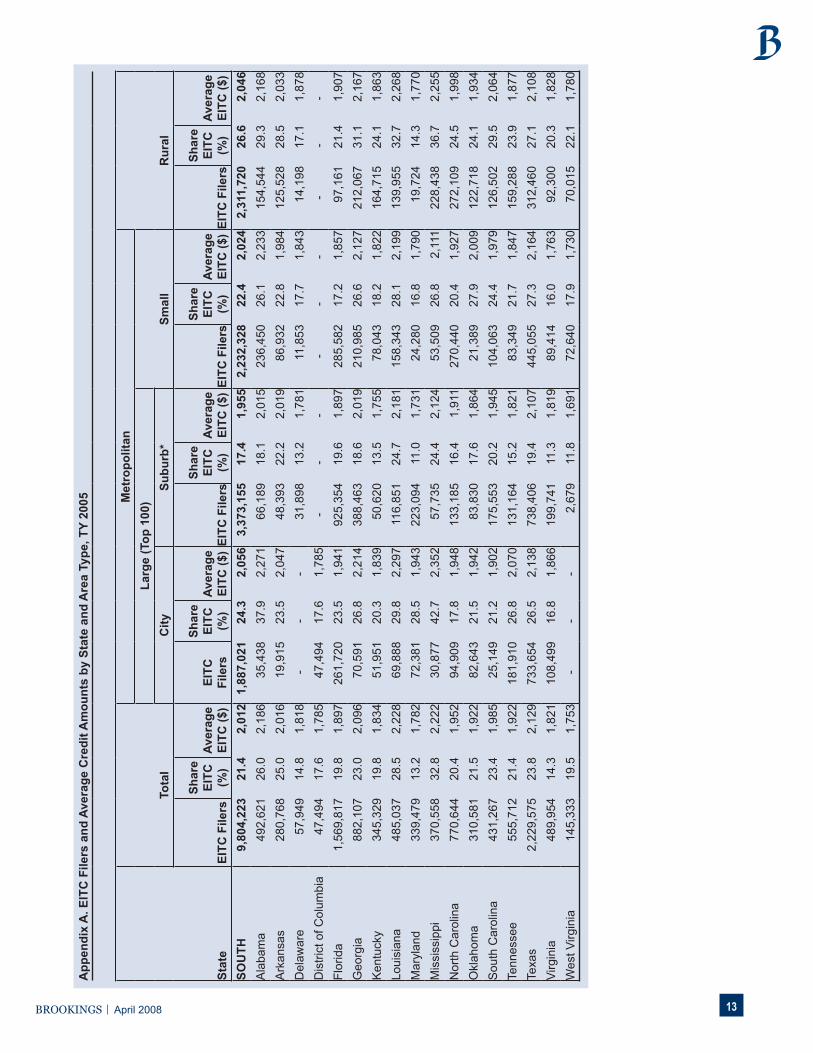
Considering these regional differ-ences in the distribution of EITC filers across geography types, it is not surprising that states split roughly evenly between those with the highest rate of EITC receipt in their central cities, and those where rural areas rank highest (Map 2). While not all states contain all four geography types, there is a clear pattern in which states in the Northeast and Midwest see the highest con-centrations of EITC filers in large cities, and states in the South and West have higher EITC receipt in rural areas. (For state-level data on EITC receipt by geography type, see Appendix A.)
Map 2. Geography Type with Highest Rate of EITC Receipt by State, TY 2005
MIDWEST NORTHEAST
SOUTH
WEST
Large City (23)
Small Metro (5)
Rural (22)
Geography Type with Highest % EITC
No states rank Large Suburb first for rate of EITC receipt.Note: not all states contain all four geography types. See Appendix A for details.

�brookings April 2008
Table 2. Change in Rate of EITC Receipt and Dollar Amounts by Geography Type, TY 2000 to TY 2005
Tax Year 2005 Geography Type Total Filers EITC Filers EITC Amount ($) Share EITC Average Credit ($)Large City 25,562,718 5,505,193 10,746,300,579 21.5% 1,952Large Suburb 59,643,775 8,025,063 14,773,635,445 13.5% 1,841Small Metro 23,189,825 4,205,387 8,028,280,768 18.1% 1,909Rural 20,954,340 4,283,990 8,163,275,344 20.4% 1,906 Tax Year 2000* Geography Type Total Filers EITC Filers EITC Amount ($) Share EITC Average Credit ($)Large City 25,797,950 5,011,438 9,681,143,523 19.4% 1,932Large Suburb 56,670,149 6,473,656 11,888,379,355 11.4% 1,836Small Metro 22,413,425 3,557,122 6,763,602,702 15.9% 1,901Rural 20,772,219 3,774,997 7,195,418,574 18.2% 1,906
Changes, TY 2000 to TY 2005 Percent Change Difference** Geography Type Total Filers EITC Recipients Dollar Amount Share EITC Average Credit ($)Large City -0.9% 9.9% 11.0% 2.1% 20Large Suburb 5.2% 24.0% 24.3% 2.0% 5Small Metro 3.5% 18.2% 18.7% 2.2% 8Rural 0.9% 13.5% 13.5% 2.3% -1
*TY 2000 dollar amounts have been adjusted for inflation **Differences are based on unrounded figures
Source: Brookings Institution analysis of Internal Revunue Service data
C. Total EITC filers increased by 3.2 million between tax years 2000 and 2005, and al-most half that growth (1.6 mil-lion) occurred in large suburbs.
In TY 2005, 3.2 million more tax-payers benefited from the EITC than in TY 2000—a 17 percent growth in total EITC filers. As a result, total EITC dollars claimed increased by $6.2 billion. The increases in the EITC seen over this time period arise from a number of factors, including the overall growth in U.S. house-holds, slight expansions to the structure of the credit, as well as a sluggish economy over the first half of the decade that saw wages stagnate and incomes fall for many families.13
Growth in the rate of EITC receipt between 2000 and 2005 occurred in urban, suburban, small met-ropolitan, and rural areas alike. Table 2 presents the changes in EITC receipt experienced by each geography type over the
first half of the decade. All four geography types saw boosts of at least 2 percentage points in the share of their tax filers claim-ing the EITC. Among the four categories, rural areas, followed closely by small metro areas, saw the largest percentage-point increase in EITC receipt.
Though each geography type saw a similar increase in the rate of EITC receipt, there was a further shift in low-wage workers claim-ing the credit toward suburbs and small metro areas over this period. Both of these geography types experienced an uptick in their overall number of tax filers, coupled with even larger increas-es in the number of their filers receiving the EITC. The number of EITC filers living in large sub-urbs grew by almost 1.6 million between 2000 and 2005—more than three times the increase experienced by large cities or rural areas and more than twice the growth recorded in small metro areas. Total EITC dollars
received by suburban residents increased 24.3 percent, with the result that suburban EITC filers claimed an additional $2.9 billion dollars in TY 2005 compared to TY 2000. These numbers sup-port previous research that has shown that, just as more poor Americans live in the suburbs of large metropolitan areas than the central cities, the “working poor”—as measured by EITC receipt—lean even more heavily towards the suburbs.14
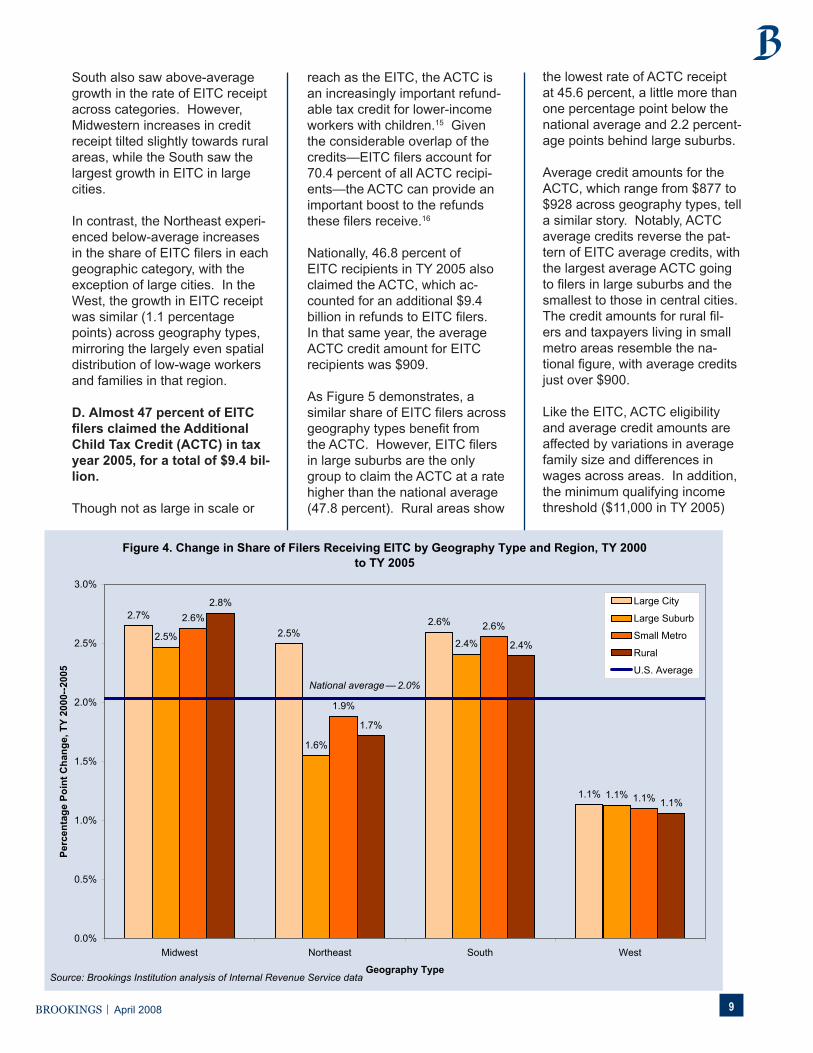
Some regions of the country were better able to weather the economic challenges of the early 2000s, and these differences play out in the changing levels of EITC receipt over this period. Figure 4 presents the regional changes in EITC receipt by geography type. The Midwest, hit particularly hard by job losses in the manufactur-ing sector over this time period, experienced increases of at least 2.5 percentage points in the rate of EITC receipt across all geog-raphy types. A close second, the
�brookings April 2008
South also saw above-average growth in the rate of EITC receipt across categories. However, Midwestern increases in credit receipt tilted slightly towards rural areas, while the South saw the largest growth in EITC in large cities.
In contrast, the Northeast experi-enced below-average increases in the share of EITC filers in each geographic category, with the exception of large cities. In the West, the growth in EITC receipt was similar (1.1 percentage points) across geography types, mirroring the largely even spatial distribution of low-wage workers and families in that region.
D. Almost 47 percent of EITC filers claimed the Additional Child Tax Credit (ACTC) in tax year 2005, for a total of $9.4 bil-lion.
Though not as large in scale or
reach as the EITC, the ACTC is an increasingly important refund-able tax credit for lower-income workers with children.15 Given the considerable overlap of the credits—EITC filers account for 70.4 percent of all ACTC recipi-ents—the ACTC can provide an important boost to the refunds these filers receive.16
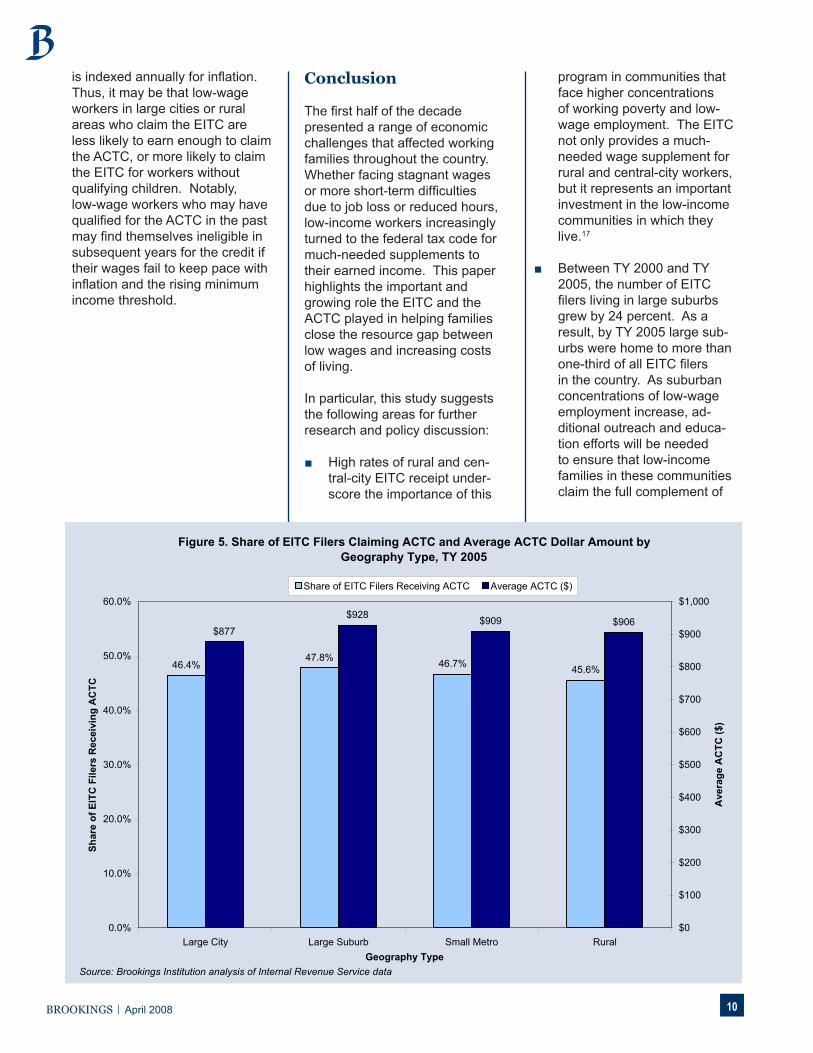
Nationally, 46.8 percent of EITC recipients in TY 2005 also claimed the ACTC, which ac-counted for an additional $9.4 billion in refunds to EITC filers. In that same year, the average ACTC credit amount for EITC recipients was $909.
As Figure 5 demonstrates, a similar share of EITC filers across geography types benefit from the ACTC. However, EITC filers in large suburbs are the only group to claim the ACTC at a rate higher than the national average (47.8 percent). Rural areas show
the lowest rate of ACTC receipt at 45.6 percent, a little more than one percentage point below the national average and 2.2 percent-age points behind large suburbs.
Average credit amounts for the ACTC, which range from $877 to $928 across geography types, tell a similar story. Notably, ACTC average credits reverse the pat-tern of EITC average credits, with the largest average ACTC going to filers in large suburbs and the smallest to those in central cities. The credit amounts for rural fil-ers and taxpayers living in small metro areas resemble the na-tional figure, with average credits just over $900.
Like the EITC, ACTC eligibility and average credit amounts are affected by variations in average family size and differences in wages across areas. In addition, the minimum qualifying income threshold ($11,000 in TY 2005)
Figure 4. Change in Share of Filers Receiving EITC by Geography Type and Region, TY 2000 to TY 2005
2.7%
2.5%2.6%
1.1%
2.5%
1.6%
2.4%
1.1%
2.6%
1.9%
2.6%
1.1%
2.8%
1.7%
2.4%
1.1%
0.0%
0.5%
1.0%
1.5%
2.0%
2.5%
3.0%
Midwest Northeast South West
Geography Type
Perc
enta
ge P
oint
Cha
nge,
TY
2000
--200
5
Large City
Large Suburb
Small Metro
Rural
U.S. Average
Source: Brookings Institution analysis of Internal Revenue Service data
National average — 2.0%
�0brookings April 2008
is indexed annually for inflation. Thus, it may be that low-wage workers in large cities or rural areas who claim the EITC are less likely to earn enough to claim the ACTC, or more likely to claim the EITC for workers without qualifying children. Notably, low-wage workers who may have qualified for the ACTC in the past may find themselves ineligible in subsequent years for the credit if their wages fail to keep pace with inflation and the rising minimum income threshold.
Conclusion
The first half of the decade presented a range of economic challenges that affected working families throughout the country. Whether facing stagnant wages or more short-term difficulties due to job loss or reduced hours, low-income workers increasingly turned to the federal tax code for much-needed supplements to their earned income. This paper highlights the important and growing role the EITC and the ACTC played in helping families close the resource gap between low wages and increasing costs of living.
In particular, this study suggests the following areas for further research and policy discussion:
High rates of rural and cen-tral-city EITC receipt under-score the importance of this
■
program in communities that face higher concentrations of working poverty and low-wage employment. The EITC not only provides a much-needed wage supplement for rural and central-city workers, but it represents an important investment in the low-income communities in which they live.17
Between TY 2000 and TY 2005, the number of EITC filers living in large suburbs grew by 24 percent. As a result, by TY 2005 large sub-urbs were home to more than one-third of all EITC filers in the country. As suburban concentrations of low-wage employment increase, ad-ditional outreach and educa-tion efforts will be needed to ensure that low-income families in these communities claim the full complement of
■
Figure 5. Share of EITC Filers Claiming ACTC and Average ACTC Dollar Amount by Geography Type, TY 2005
46.4%47.8% 46.7% 45.6%
$877
$928 $909 $906
0.0%
10.0%
20.0%
30.0%
40.0%
50.0%
60.0%
Large City Large Suburb Small Metro RuralGeography Type
Shar
e of
EIT
C F
ilers
Rec
eivi
ng A
CTC
$0
$100
$200
$300
$400
$500
$600
$700
$800
$900
$1,000
Ave
rage
AC
TC ($
)
Share of EITC Filers Receiving ACTC Average ACTC ($)
Source: Brookings Institution analysis of Internal Revenue Service data

��brookings April 2008
work supports for which they are eligible.
Almost half of all EITC filers also benefited from the ACTC in TY 2005, taking home an additional $9.4 billion in wage supplements via that credit. However, as of 2011, the CTC is set to decrease from $1,000 to $500 a child, and it will no longer be refund-able to families with less than three children.18 In addition to making the ACTC perma-nent, policymakers should consider proposals to lower and/or freeze the minimum income requirement—mea-sures which, taken together, would preserve the reach and impact of this credit and ensure that workers whose incomes do not keep pace with inflation do not lose eligibility for this credit over time. Moreover, given the overlap in the beneficiaries of these two credits, recommen-dations to further align the eligibility requirements of the EITC and ACTC should also be assessed.19
Finally, this analysis has dem-onstrated the importance of the EITC to urban, suburban, and rural communities alike. To fur-ther enhance the effectiveness of the EITC as a wage supplement and poverty alleviation tool in communities across the country, proposals for expanding aspects of the current credit—whether for workers living without children, families with more than two chil-dren, or couples facing a mar-riage penalty—deserve further analysis and consideration.20
■
��brookings April 2008
App
endi
x A
. EIT
C F
ilers
and
Ave
rage
Cre
dit A
mou
nts
by S
tate
and
Are
a Ty
pe, T
Y 20
05
Stat
e
Tota
l
Met
ropo
litan
Rur
alLa
rge
(Top
100
)Sm
all
City
Subu
rb*
EITC
File
rs
Shar
eEI
TC
(%)
Aver
age
EITC
($)
EITC
Fi
lers
Shar
eEI
TC
(%)
Aver
age
EITC
($)
EITC
File
rs
Shar
eEI
TC
(%)
Aver
age
EITC
($)
EITC
File
rs
Shar
eEI
TC
(%)
Aver
age
EITC
($)
EITC
File
rs
Shar
eEI
TC
(%)
Aver
age
EITC
($)
MID
WES
T4,
311,
093
14.5
1,81
21,
013,
866
22.3
1,99
91,
338,
898
10.8
1,75
886
9,56
614
.51,
764
1,08
8,76
415
.81,
742
Illin
ois
859,
146
15.1
1,90
629
0,06
923
.12,
087
319,
557
11.3
1,81
812
8,07
815
.41,
869
121,
443
16.3
1,74
5In
dian
a43
7,35
715
.51,
813
73,1
2820
.11,
933
114,
569
13.4
1,85
315
2,67
715
.51,
768
96,9
8315
.71,
744
Iow
a17
2,97
613
.11,
679
14,7
3516
.81,
756
20,0
829.
71,
675
55,6
1212
.71,
675
82,5
4714
.01,
668
Kan
sas
176,
063
14.6
1,77
340
,672
19.4
1,87
238
,922
9.5
1,69
021
,610
14.3
1,70
074
,858
17.1
1,78
3M
ichi
gan
656,
776
14.9
1,84
914
5,67
728
.02,
156
215,
936
10.9
1,73
516
7,10
015
.21,
826
128,
063
15.6
1,72
0M
inne
sota
263,
742
11.0
1,64
045
,158
15.8
1,68
691
,741
8.0
1,61
338
,080
12.0
1,59
788
,763
13.8
1,66
2M
isso
uri
440,
261
17.3
1,84
979
,355
23.9
1,97
714
3,89
812
.61,
804
78,1
7218
.01,
790
138,
836
21.7
1,85
6N
ebra
ska
110,
295
13.9
1,76
228
,002
15.7
1,79
912
,899
9.1
1,70
917
,293
12.3
1,69
152
,101
15.6
1,77
9N
orth
Dak
ota
39,2
3813
.01,
660
--
--
--
15,9
8411
.11,
582
23,2
5414
.71,
714
Ohi
o79
7,12
314
.91,
817
228,
857
23.6
1,95
732
3,44
211
.31,
745
84,2
5516
.31,
801
160,
569
15.9
1,77
3S
outh
Dak
ota
55,3
5715
.31,
715
--
--
--
22,8
7613
.61,
661
32,4
8116
.81,
753
Wis
cons
in30
2,75
911
.61,
701
68,2
1219
.71,
952
57,8
517.
61,
593
87,8
2811
.11,
648
88,8
6712
.41,
631
NO
RTH
EAST
3,46
0,03
713
.91,
770
1,30
5,63
324
.11,
905
1,47
5,10
110
.01,
683
323,
279
13.5
1,71
935
6,02
414
.81,
680
Con
nect
icut
167,
189
10.2
1,67
347
,554
22.7
1,83
492
,481
8.0
1,60
013
,275
10.3
1,66
613
,878
9.6
1,61
7M
aine
86,7
3414
.21,
642
4,50
313
.51,
483
22,6
5910
.51,
576
17,8
6215
.81,
697
41,7
1016
.81,
671
Mas
sach
uset
ts30
9,01
010
.31,
638
76,6
3717
.01,
738
213,
499
9.0
1,61
517
,577
9.8
1,51
91,
297
8.5
1,17
7N
ew H
amps
hire
62,3
059.
71,
579
--
-16
,830
8.2
1,53
718
,108
9.4
1,60
327
,367
11.3
1,58
8N
ew J
erse
y48
2,98
312
.01,
794
35,0
7334
.82,
035
385,
779
11.0
1,76
362
,131
15.3
1,84
6-
--
New
Yor
k1,
465,
490
17.4
1,84
090
5,37
424
.61,
913
374,
763
10.3
1,71
071
,167
15.4
1,71
611
4,18
517
.21,
771
Pen
nsyl
vani
a78
2,65
113
.61,
735
217,
716
25.3
1,92
232
2,09
910
.01,
641
112,
968
13.9
1,72
912
9,86
814
.71,
662
Rho
de Is
land
65,7
6713
.51,
780
18,7
7727
.12,
033
46,9
9011
.21,
679
--
--
--
Verm
ont
37,9
0912
.41,
541
--
--
--
10,1
9010
.11,
511
27,7
1913
.51,
552
��brookings April 2008
App
endi
x A
. EIT
C F
ilers
and
Ave
rage
Cre
dit A
mou
nts
by S
tate
and
Are
a Ty
pe, T
Y 20
05
Stat
e
Tota
l
Met
ropo
litan
Rur
alLa
rge
(Top
100
)Sm
all
City
Subu
rb*
EITC
File
rs
Shar
eEI
TC
(%)
Aver
age
EITC
($)
EITC
Fi
lers
Shar
eEI
TC
(%)
Aver
age
EITC
($)
EITC
File
rs
Shar
eEI
TC
(%)
Aver
age
EITC
($)
EITC
File
rs
Shar
eEI
TC
(%)
Aver
age
EITC
($)
EITC
File
rs
Shar
eEI
TC
(%)
Aver
age
EITC
($)
SOU
TH9,
804,
223
21.4
2,01
21,
887,
021
24.3
2,05
63,
373,
155
17.4
1,95
52,
232,
328
22.4
2,02
42,
311,
720
26.6
2,04
6A
laba
ma
492,
621
26.0
2,18
635
,438
37.9
2,27
166
,189
18.1
2,01
523
6,45
026
.12,
233
154,
544
29.3
2,16
8A
rkan
sas
280,
768
25.0
2,01
619
,915
23.5
2,04
748
,393
22.2
2,01
986
,932
22.8
1,98
412
5,52
828
.52,
033
Del
awar
e57
,949
14.8
1,81
8-
--
31,8
9813
.21,
781
11,8
5317
.71,
843
14,1
9817
.11,
878
Dis
trict
of C
olum
bia
47,4
9417
.61,
785
47,4
9417
.61,
785
--
--
--
--
-Fl
orid
a1,
569,
817
19.8
1,89
726
1,72
023
.51,
941
925,
354
19.6
1,89
728
5,58
217
.21,
857
97,1
6121
.41,
907
Geo
rgia
882,
107
23.0
2,09
670
,591
26.8
2,21
438
8,46
318
.62,
019
210,
985
26.6
2,12
721
2,06
731
.12,
167
Ken
tuck
y34
5,32
919
.81,
834
51,9
5120
.31,
839
50,6
2013
.51,
755
78,0
4318
.21,
822
164,
715
24.1
1,86
3Lo
uisi
ana
485,
037
28.5
2,22
869
,888
29.8
2,29
711
6,85
124
.72,
181
158,
343
28.1
2,19
913
9,95
532
.72,
268
Mar
ylan
d33
9,47
913
.21,
782
72,3
8128
.51,
943
223,
094
11.0
1,73
124
,280
16.8
1,79
019
,724
14.3
1,77
0M
issi
ssip
pi37
0,55
832
.82,
222
30,8
7742
.72,
352
57,7
3524
.42,
124
53,5
0926
.82,
111
228,
438
36.7
2,25
5N
orth
Car
olin
a77
0,64
420
.41,
952
94,9
0917
.81,
948
133,
185
16.4
1,91
127
0,44
020
.41,
927
272,
109
24.5
1,99
8O
klah
oma
310,
581
21.5
1,92
282
,643
21.5
1,94
283
,830
17.6
1,86
421
,389
27.9
2,00
912
2,71
824
.11,
934
Sou
th C
arol
ina
431,
267
23.4
1,98
525
,149
21.2
1,90
217
5,55
320
.21,
945
104,
063
24.4
1,97
912
6,50
229
.52,
064
Tenn
esse
e55
5,71
221
.41,
922
181,
910
26.8
2,07
013
1,16
415
.21,
821
83,3
4921
.71,
847
159,
288
23.9
1,87
7Te
xas
2,22
9,57
523
.82,
129
733,
654
26.5
2,13
873
8,40
619
.42,
107
445,
055
27.3
2,16
431
2,46
027
.12,
108
Virg
inia
489,
954
14.3
1,82
110
8,49
916
.81,
866
199,
741
11.3
1,81
989
,414
16.0
1,76
392
,300
20.3
1,82
8W
est V
irgin
ia14
5,33
319
.51,
753
--
-2,
679
11.8
1,69
172
,640
17.9
1,73
070
,015
22.1
1,78
0

��brookings April 2008
App
endi
x A
. EIT
C F
ilers
and
Ave
rage
Cre
dit A
mou
nts
by S
tate
and
Are
a Ty
pe, T
Y 20
05
Stat
e
Tota
l
Met
ropo
litan
Rur
alLa
rge
(Top
100
)Sm
all
City
Subu
rb*
EITC
File
rs
Shar
eEI
TC
(%)
Aver
age
EITC
($)
EITC
Fi
lers
Shar
eEI
TC
(%)
Aver
age
EITC
($)
EITC
File
rs
Shar
eEI
TC
(%)
Aver
age
EITC
($)
EITC
File
rs
Shar
eEI
TC
(%)
Aver
age
EITC
($)
EITC
File
rs
Shar
eEI
TC
(%)
Aver
age
EITC
($)
WES
T4,
444,
279
15.4
1,81
21,
298,
673
16.6
1,81
11,
837,
910
13.9
1,81
978
0,21
516
.11,
820
527,
482
17.9
1,78
0A
lask
a39
,590
12.0
1,60
8-
--
--
-24
,313
10.9
1,63
615
,277
14.2
1,56
3A
rizon
a39
9,75
516
.81,
887
169,
925
16.9
1,88
212
3,74
713
.21,
829
44,9
9421
.81,
915
61,0
9025
.71,
998
Cal
iforn
ia2,
376,
882
16.1
1,85
081
6,46
617
.71,
852
1,25
6,73
414
.81,
847
251,
146
18.3
1,90
552
,535
15.6
1,64
2C
olor
ado
264,
118
12.6
1,69
783
,527
15.1
1,74
977
,291
9.9
1,68
061
,294
12.9
1,66
542
,006
15.0
1,67
4H
awai
i83
,799
14.0
1,65
823
,983
12.6
1,57
333
,363
14.0
1,75
4-
--
26,4
5415
.61,
614
Idah
o10
2,58
317
.21,
801
11,8
3113
.21,
620
24,5
8717
.11,
866
27,8
7817
.51,
821
38,2
8718
.81,
801
Mon
tana
72,4
4016
.61,
701
--
--
--
24,4
5815
.71,
641
47,9
8317
.11,
731
Nev
ada
163,
667
14.9
1,75
554
,405
16.2
1,76
667
,165
15.3
1,79
426
,725
12.6
1,66
115
,372
13.6
1,71
1N
ew M
exic
o19
5,13
523
.71,
887
40,0
8918
.01,
720
27,9
6820
.51,
834
50,1
9825
.81,
974
76,8
8028
.71,
937
Ore
gon
221,
675
14.0
1,70
334
,563
13.8
1,53
055
,054
11.0
1,73
071
,910
14.7
1,71
360
,148
17.4
1,76
5U
tah
140,
523
14.1
1,80
312
,130
15.3
1,68
247
,307
13.0
1,77
862
,677
13.9
1,82
918
,410
17.3
1,85
9W
ashi
ngto
n35
1,57
012
.41,
711
51,7
5410
.21,
515
124,
695
10.5
1,68
612
3,90
615
.11,
800
51,2
1515
.51,
756
Wyo
min
g32
,542
13.4
1,68
2-
--
--
-10
,717
14.4
1,71
321
,825
12.9
1,66
6
TOTA
L**
22,0
19,6
3316
.91,
894
5,50
5,19
321
.5%
1,95
28,
025,
063
13.5
%1,
841
4,20
5,38
718
.1%
1,90
94,
283,
990
20.4
%1,
906
*In
som
e ca
ses,
met
ropo
litan
are
as c
ross
sta
te b
ound
arie
s; th
eref
ore,
a s
tate
that
doe
s no
t con
tain
a “l
arge
city
” may
stil
l con
tain
a “l
arge
sub
urb”
(e.g
., N
ew H
amps
hire
).**
Tota
ls a
re a
ggre
gate
d fro
m Z
IP c
ode-
leve
l dat
a; s
ee M
etho
dolo
gy.
Sou
rce:
Bro
okin
gs In
stitu
tion
anal
ysis
of I
nter
nal R
even
ue S
ervi
ce d
ata

��brookings April 2008
Endnotes
1 For more on these dynamics, see Alan Berube, David Park, and Elizabeth Kneebone, “Metro Raise: Boosting the EITC to Help Urban and Suburban Workers and Families” (Washington: Brookings Institution, forthcoming 2008).
2 As of tax year 2007, 22 states and the District of Columbia offer a state version of the EITC that builds on the federal credit. While state and local credits further increase the value of the EITC, this paper examines only the federal credit.
3 Alan Berube and Thatcher Tiffany, “The ‘State’ of Low-Wage Workers: How the EITC Benefits Urban and Rural Communities in the 50 States” (Washington: Brookings Institution, 2004).
4 Alan Berube, “The New Safety Net: How the Tax Code Helped Low-In-come Working Families During the Early 2000s” (Washington: Brookings Institution, 2006).
5 Berube and Tiffany, “The ‘State’ of Low-Wage Workers.”
6 This paper uses the official met-ropolitan statistical area (MSA) definitions announced by the U.S. Office of Management and Budget in December of 2003. The 100 largest metropolitan areas are identified based on population counts as of Census 2000, and in 2006 had populations of roughly 500,000 or more. For this analysis, to be des-ignated a central city in the top 100 MSAs a city must (1) appear first in the official MSA name; or (2) appear second or third in the MSA name and have had a population greater than 100,000 in the 2000 decennial census. See Alan Berube and Eliza-beth Kneebone, “Two Steps Back: City and Suburban Poverty Trends 1999-2005” (Washington: Brookings Institution, 2006).
7 As with any typology, these geogra-phy types suggest starker divisions than may actually exist between cat-egories. For example, most metro-politan areas in fact contain portions of rural land. Although this paper treats metro areas outside of the top 100 as a separate geographic category, in truth the urban/suburban divisions of the 101st metropolitan area may not be that different from those of the 100th. However, these criteria create broad working catego-ries that facilitate comparisons of EITC receipt across different types of
communities throughout the country.
8 Brookings Institution analysis of 2005 U.S. Census Bureau data.
9 Due to confidentiality rules, the IRS suppresses return counts of less than 10 at the ZIP code level. Because this analysis sums ZIP code-level data, totals taken from this assessment may not match other totals published by the IRS that do not face suppression issues.
10 It is important to note for both the national and regional analyses that the trends presented in this paper represent two points in time, and as such they do not suggest that any changes in EITC receipt between the midpoint and beginning of this decade occurred evenly across the time period analyzed.
11 For instance, higher average incomes at the local level could qualify workers for lower credits in the phase-out range of the EITC. Similarly, a community with a greater share of childless workers might see lower average EITC amounts than a community dominated by young working families.
12 As noted previously, demographics—population density, family size and composition—and local labor market considerations—the prevalence of low-skill work or low wages—can influence the share of filers that claim the EITC in a given geography. For instance, Southern states tend to have relatively lower costs of living and lower household incomes on av-erage. According to the 2006 Ameri-can Community Survey, Mississippi ranked 50th among all states for median household income ($34,473), while seven others among the 10 lowest ranking states were also from the South. At the same time, North-eastern states, including New Jersey ($64,470), Connecticut ($63,422), and Massachusetts ($59,963), were among the top five for highest me-dian household incomes in the same year.
13 In 2001, the phase-out range of the EITC was extended slightly for married couples to help reduce the marriage penalty associated with the credit. See Figure 1.
14 Elizabeth Kneebone, “A Local Ladder for Low-Income Workers: Recent Trends in the Earned Income Tax Credit” (Washington: Brookings Institution, 2007).
15 Full data on ACTC claims and dollar
amounts did not become available until TY 2004; therefore, this paper does not assess trends in ACTC receipt.
16 Slightly different eligibility rules apply to the two credits, includ-ing qualifying income thresholds, definitions of qualifying children, and residency requirements. See Center on Budget and Policy Priorities, “Facts About Tax Credits for Working Families—The Earned Income Credit and Child Tax Credit: Tax Time Can Pay for Working Families” (2006).
17 Alan Berube, “Using the EITC to Stimulate Local Economies” (New York: Living Cities, 2006).
18 Gregg Esenwein and Maxim Shve-dov, “The Child Tax Credit” (Wash-ington: Congressional Research Service, 2007).
19 See, e.g., Paul Weinstein, Jr. “Family Friendly Tax Reform” (Washing-ton: Progressive Policy Institute, 2005); President’s Advisory Panel on Federal Tax Reform, “Simple, Fair, and Pro-Growth: Proposals to Fix America’s Tax System” (2005); Robert Cherry and Max Sawicky, “Giving Credit Where Credit is Due: A ‘Universal Unified Child Credit’ that Expands the EITC and Cuts Taxes for Working Families” (Washington: Economic Policy Institute, 2000).
20 These proposals and their impacts on tax filers in cities and suburbs are the subject of Berube, Park, and Kneebone, “Metro Raise.”

��brookings April 2008
AcknowledgmentsThe author thanks Alan Berube, Bill O’Hare, and John Wancheck for their helpful comments. The Brookings Institution Metropolitan Policy Pro-gram thanks the Annie E. Casey Foundation for its generous support of its research on policies to support low-income working families, and the Fannie Mae Foundation, the John D. and Catherine T. MacArthur Foundation, the George Gund Foundation, the Rockefeller Foundation, and the Heinz Endowments, for their general support of the program.
For More InformationElizabeth KneeboneResearch AnalystBrookings Institution Metropolitan Policy Program(202) [email protected]
For General InformationBrookings Institution Metropolitan Policy Program(202) 797-6139www.brookings.edu/metro
BROOKINGS1775 Massachusetts Avenue, NWWashington, DC 20036telephone 202.797.6000fax 202.797.6004web site www.brookings.edu
telephone 202.797.6139fax 202.797.2965web site www.brookings.edu/metro


![Volunteer Income Tax Assistance “VITA” Earned Income Tax ... · Volunteer Income Tax Assistance “VITA” Earned Income Tax Credit “EITC” Revised 1/28/19 [DOCUMENT TITLE]](https://img.pdfslide.net/doc/110x75/5fa5a5c85aa0bb13122ce462/volunteer-income-tax-assistance-aoevitaa-earned-income-tax-volunteer-income.jpg)