Embed Size (px)
Citation preview

i
Earnings Growth and Employment Creation
An Assessment of World Bank Support in Three Middle-Income Countries

ii
International Bank for Reconstruction and Development / The World Bank 1818 H Street NW Washington, DC 20433 Telephone: 202-473-1000 Internet: www.worldbank.org E-mail: [email protected] All rights reserved 1 2 3 4 8 9 10 11 This volume is a product of the staff of the International Bank for Reconstruction and Development / The World Bank Group. The findings, interpretations, and conclusions expressed in this vo-lume do not necessarily reflect the views of the Executive Direc-tors of The World Bank or the governments they represent. The World Bank does not guarantee the accuracy of the data in this work. The boundaries, colors, denominations, and other infor-mation shown on any map in this work do not imply any judg-ment on the part of The World Bank concerning the legal status of any territory or the endorsement or acceptance of such boun-daries. Rights and Permissions The material in this publication is copyrighted. Copying and/or transmitting portions or all of this work without permission may be a violation of applicable law. The International Bank for Re-construction and Development / The World Bank encourages a dissemination of its work and will normally grant permission to reproduce portions of the work promptly. For permission to photocopy or reprint any part of this work, please send a request with complete information to the Copy-right Clearance Center Inc., 222 Rosewood Drive, Danvers, MA 01923, USA; telephone: 978-750-8400; fax: 978-750-4470; In-ternet: www.copyrights.com. All other queries on rights and licenses, including subsidiary rights, should be addressed to the Office of the Publisher, The World Bank, 1818 H Street, NW, Washington, DC 20433, USA: fax:202-522-2422; email:[email protected].
ISBN: 978-1-60244-144-6 Library of Congress Cataloging-in-Publication data have been applied for.

iii
Contents
ABBREVIATIONS .................................................................................................... VII
ACKNOWLEDGEMENTS ......................................................................................... IX
COLOMBIA, TUNISIA, AND TURKEY: BANK PROGRAM OUTCOME RATINGS .. X
EVALUATION SUMMARY ....................................................................................... XV
CHAIRPERSON’S SUMMARY: COMMITTEE ON DEVELOPMENT EFFECTIVENESS ................................................................................................. XXIII
CHAPTER 1................................................................................................................. 1
INTRODUCTION ......................................................................................................... 1
Objective ................................................................................................................... 2
Questions and Methods .......................................................................................... 2
CHAPTER 2................................................................................................................. 7
COLOMBIA ................................................................................................................. 7
Introduction .............................................................................................................. 7
Growth, Employment, and Earnings Outcomes .................................................... 9
Factors Underlying the Outcomes ....................................................................... 11
Link of Outcomes to Exogenous Factors and Policies ...................................... 13
The Bank’s Strategy and Contribution ................................................................. 14
CHAPTER 3............................................................................................................... 23
TUNISIA .................................................................................................................... 23
Introduction ............................................................................................................ 23
Growth, Employment, and Earnings Outcomes .................................................. 25
Factors Underlying the Outcomes ....................................................................... 26
Link of Outcomes to Exogenous Factors and Policies ...................................... 27

iv
The Bank’s Strategy and Contribution ................................................................ 29
CHAPTER 4 .............................................................................................................. 37
TURKEY ................................................................................................................... 37
Introduction ............................................................................................................ 37
Growth, Employment, and Earnings Outcomes ................................................. 39
Factors Underlying the Outcomes ....................................................................... 40
Link of Outcomes to Exogenous Factors and Policies ...................................... 41
The Bank’s Strategy and Contribution ................................................................ 43
CHAPTER 5 .............................................................................................................. 51
KEY FINDINGS ......................................................................................................... 51
Comparison of Outcomes Across the Three Countries ..................................... 51
Comparisons of Overall Bank Support Across the Three Countries ............... 56
Bank Support on the Specific MILES Areas: Similarities and Differences Across the Three Countries .................................................................................. 59
The Current Global Employment Crisis ............................................................... 66
Appendixes
Appendix A. Country Assistance Strategy (CAS) Objectives .................................... 71 Appendix B. Colombia: Baseline and Latest Outcome Indicators by MILES Component ................................................................................................................ 72 Appendix C. Colombia: World Bank Program by MILES Component ....................... 74 Appendix D. Colombia: Annex Tables ....................................................................... 79 Appendix E. Colombia: List of People Met ................................................................ 85 Appendix F. Tunisia: Baseline and Latest Outcome Indicators by MILES Components .................................................................................................................................. 88 Appendix G. Tunisia: World Bank Program by MILES Component ........................... 90 Appendix H. Tunisia: Annex Tables .......................................................................... 97 Appendix I. Tunisia: List of People Met ................................................................... 103 Appendix J. Turkey: Baseline and Latest Outcome Indicators by MILES Component ................................................................................................................................ 105 Appendix K. Turkey: World Bank Program by MILES Component .......................... 106 Appendix L. Turkey: Annex Tables ........................................................................ 111 Appendix M. Turkey: List of People Met .................................................................. 118 Appendix N. Cross-Country Comparisons .............................................................. 120 Appendix O. Colombia, Tunisia, and Turkey: External Assistance ......................... 151 Appendix P. Colombia, Tunisia, and Turkey: At a Glance Tables ........................... 152 Appendix Q. Colombia, Tunisia, and Turkey: Millennium Development Goals ....... 158

v
Appendix R. Colombia, Tunisia, and Turkey: Total Cost of Bank Programs ............ 161 Appendix S. Colombia, Tunisia, and Turkey: Average Cost of Tasks, Total and by MILES ...................................................................................................................... 162 Appendix T. Colombia, Tunisia, and Turkey: Bank Senior Management ................. 163 References .............................................................................................................. 166
Boxes
Box 3.1. Tunisia: Areas of Support Under the Employment PAAA ............................ 33
Figures
Figure 2.1 Evolution of Relative Formal/Informal Sector Sizes and Wages .............. 15
Tables
Table 1.1. The MILES Framework: Summary .............................................................. 3 Table 2.1. Colombia: Ratings Summary ...................................................................... 8 Table 2.2 Colombia: Key Economic Trends, 1970–2007 ......................................... 10 Table 3.1 Tunisia: Ratings Summary ........................................................................ 24 Table 3.2 Tunisia: Key Economic Trends, 1970–2007 ............................................. 28 Table 3.3 Tunisia: Targets Established in the Fourth Economic Competitiveness Adjustment Loan (ECAL) ........................................................................................... 31 Table 4.1 Turkey: Ratings Summary........................................................................ 38 Table 4.2 Turkey, Key Economic Trends, 1970–2007 .............................................. 42 Table 5.1 Colombia, Tunisia, and Turkey: Outcome Indicators ................................ 52


Abbreviations
AAA Analytic and Advisory Activities ALMP Active Labor Market Policies APL Adaptable Program Loan ARIP Agricultural Reform Investment Project BR Banco de la República CAE Country Assistance Evaluation CAS Country Assistance Strategy CEDE Centro de Estudios Sobre Desarrollo Económico CCT Conditional Cash Transfer CPI Consumer Price Index CEDPL Competiveness and Employment Development Policy Loans CEM Country Economic Memorandum CPS Country Partnership Strategy DANE Departamento Administrativo Nacional de Estadística (National Department of Statistics- Colombia) DNP Departamento Nacional de Planeación DPL Development Policy Loan ECA Europe and Central Asia ECAL Economic Competitiveness Adjustment Loans EFIL Export Finance Intermediation Project ERL Economic Reform Loan ESW Economic and Sector Work ETP Employment-to-Population ratio EU European Union FDI Foreign Direct Investment FIAL Programmatic Fiscal and Institutional Adjustment Loan FIAS Foreign Investment Advisory Service FSAL Financial Sector Adjustment Loan FSAP Financial Sector Assessment Program GDP Gross Domestic Product GNI Gross National Income ICA Investment Climate Assessment ICR Implementation Completion Report ICT Information and Communications Technology ICRG International Country Risk Guide IEG Independent Evaluation Group IMF International Monetary Fund LCU Local Currency Units LPR Labor Participation Rate MDBs Multilateral Development Banks MDGs Millennium Development Goals MENA Middle East and North Africa MICs Middle Income Countries

viii
MILES Macroeconomic Conditions, Investment Climate and infrastructure, Labor market regulations and institutions, Education and skill development; and Social safety net
OECD Organization for Economic Co-operation and Development PAAA Programmatic Analytic and Advisory Assistance PER Public Expenditure Review PLaSSAL Programmatic Loans Supporting Labor Reform and Social Development Policy PPI Private Sector Participation in Infrastructure PPP Purchasing Power Parity QAG Quality Assurance Group SBA Stand-by Arrangement SENA Servicio Nacional de Aprendizaje (National Learning Service, Colombia) SME Small and medium enterprises SOE State-owned enterprise TA Technical Assistance TAL Technical Assistance Loan TEPAV Türkiye Ekonomi Politikaları Araştırma Vafı (Economic Policy Research Foundation of Turkey) TFP Total Factor Productivity WDI World Development Indicators

ix
Acknowledgements This evaluation was prepared by Mauricio Carrizosa (task manager, advisor, Country Evaluation and Regional Relations, IEG). Background papers were prepared by David Goldsbrough and Carolina Mary Rojas Hayes (consultants, Colombia), Robert Lacey (consultant, Tunisia), and William Tyler (consultant, Turkey). Ms. Rojas Hayes also provided technical support on Tunisia and Turkey. Gary Fields (Professor of Labor Economics, Cornell University) and Steven Benjamin Webb (Advisor, Public Sector, Latin America and the Caribbean Regional Office) were peer reviewers. Pursuant to IEG policy, Mr. Carrizosa was recused from the analysis and findings of the Colombia assessment, owing to his former role as Sector Manager for economic policy in the Latin America and Caribbean regional office during the period covered by the evaluation. To formalize the recusal arrangements, Helena Tang provided oversight of the Colombia assessment independently of the broader preparation work on the report. Mr. William Hurlbut provided editorial support. Mr. Roderick L. De Asis provided administrative support. _____________________________________________
Director-General, Evaluation: Vinod Thomas Director, IEG-World Bank: Cheryl Gray
Senior Manager, IEG-World Bank: Ali M. Khadr Task Manager, IEG-World Bank: Mauricio Carrizosa

Colombia, Tunisia, and Turkey: Bank Program Outcome Ratings
Policies Bank objectives Instruments Outcome and Bank contribution Bank Program Outcome Rating
COLOMBIA
Macroeconomic Conditions
Lending: Improve tax, public expenditure and debt management, public administration, procurement, intergovernmental transfers, and capacity to manage/mitigate financial system weaknesses; reduce contingent liabilities.
1 investment loan; 4 fiscal and 2 financial adjustment loans: US$1.24 billion
Outcome: Considerable gains in restoring fiscal and financial sector stability, to which the Bank contributed significantly. Key revenue and expenditure rigidities remain and are an obstacle to reforming the financing of social insurance and high payroll taxes. Bank Contribution: Lending operations in the fiscal area overestimated what could be delivered, given political economy constraints. However, operations did support a major reversal in adverse fiscal trends, albeit through partial, “second best” reforms. The Bank contributed significantly in improving tax administration and restructuring the financial sector.
Moderately satisfactory
AAA: Procurement, corporate governance, financial management, fiscal performance, and financial sector development.
9 AAA reports
Investment Climate
Lending: Reduce transaction costs, facilitate trade and foreign investment; improve competitiveness, quality standards and technological innovation framework.
3 business product and efficiency loans (FY05-08): US$1.1 billion
Outcome: Private investment recovered after 2000. Streamlining of administrative procedures. Frameworks for private participation in infrastructure and quality standards were strengthened, albeit less than expected, as were frameworks for expansion of credit to underserved groups. Bank Contribution Operations supported improvements in competition, a strong country priority. Bank AAA and lending operations helped to catalyze a policy debate on how to push forward the competitiveness agenda.
Satisfactory
AAA: Infrastructure, competitiveness, trade, logistics and innovation.
4 AAA reports
Labor Regulations and Institutions
Lending: Increase employment, particularly of the poor and the young. Improve labor regulations. Strengthen the ability of the Planning Department to carry out the PLaRSSAL reform.
1 social sector loan (training), 3 PLaRSSALs, and one Technical Assistance Loan for US$857 million.
Outcome: Increased flexibility of labor market contracts and moderate gains in public training regime. However, there was no progress in addressing key obstacles of high non-wage costs and high minimum wages. Bank Contribution: Bank AAA consistently and competently diagnosed the key issues but did not use its convening power assertively enough to advance its policy proposals.
Moderately satisfactory
AAA: Labor market flexibility policies, payroll taxes, training, informality and active labor market policies.
6 AAA reports
Education Policies
Lending: Improve access, retention rates, and learning in primary and secondary education, and quality and equity in tertiary education.
7 projects. US$662 million
Outcome: Substantial gains in coverage, including in rural areas, with the Bank making significant contributions to innovative approaches to rural education and financing access of the poor to tertiary education. Conversely, although test scores in international assessments improved modestly between 2003 and 2006, these scores remained below-average. Bank Contribution: Significant contributions to innovative approaches to rural education and financing access of the poor to tertiary education.
Satisfactory
AAA: Contracting education services and on priorities for tertiary education.
2 AAA reports
Social Protection
Lending: Better schooling, nutrition, and health outcomes for poor children.
3 projects. US$341 million
Outcome: Significant gains in coverage of social safety nets. However, longer-term financing of social protection (including health insurance) in a manner that does not impose an undue burden on the formal sector remains a challenge. Bank Contribution: Important contributions to improving the design and implementation of CCTs and to broadening the scope of health insurance for informal sector workers. However, more attention should have been paid to longer-term financing and sustainability from the outset.
Satisfactory
AAA: Access to social protection, including expansion of pension coverage and of informal sector workers.
4 AAA reports
Combined rating of MILES outcomes and of higher order outcomes (at right).
Most relevant CAS Objectives: Develop human capital (1997 and 1999), achieving fast and sustainable growth (2002 and 2004).
Higher-order outcomes during the decade ending in:
1997 2007 Moderately satisfactory: Bank-supported policies increased earnings growth and lowered poverty, even though unemployment increased.
Slower per capita GDP growth (average.)
2.0 1.4
Lower Poverty (eop) 52.7 45.0
Stable Employment Growth (average.) 2.3 2.3
Higher Unemployment (eop) 9.8 10.7
Higher Adj. per capita GNI Growth (average)
1.2 1.6

xi
Policies Bank objectives Instruments Outcome and Bank contribution Bank Program
Outcome Rating
TUNISIA
Macroeconomic Conditions
Lending: Macroeconomic stability, fiscal sustainability, debt management, banking reforms
3 Economic Competitiveness and Adjustment Loans (FY1999-2005). US$562 million
Outcome: Fiscal stability achieved before 1998 and sustained throughout the review period. Basically sound macroeconomic framework with less than 3 percent deficit sustained. Considerable achievements in opening economy to international competition. Shortfalls in reducing non-performing loans of banking system. Bank Contribution: marginal albeit positive on the fiscal front, but significant progress in supporting trade liberalization/ facilitation and the financial sector. Medium-term challenges include reducing subsidies and addressing expenditure rigidities.
Satisfactory
AAA: Growth; debt management; financial management; financial system strengths, vulnerabilities and risks, and corporate accounting and auditing
11 AAA reports
Investment Climate
Lending: Foster investment, including private participation; improve export promotion, including access to markets and finance; facilitate trade logistics; improve agricultural, municipal and ICT infrastructure and municipal management and finance; achieve sustainable growth of public transport; ICT and municipal infrastructure
7 investment loans US$436 million, excluding ECALs, which addressed some of the key investment climate issues
Outcome: Private investment remains low despite a wide range of policies and actions with substantial Bank and AAA support, partly due to weaknesses in the public sector accountability component of economic governance. Reduced discrimination against onshore economy. Opened ICT sector. Impetus of infrastructure privatization waned. Bank Contribution: Substantial Bank lending and AAA support. Interventions are of high technical quality and in most cases well-appreciated by the authorities. Significant breakthroughs in trade facilitation and improvements to business climate. Main outstanding issues relate to governance, a very difficult area to tackle.
Satisfactory
AAA: Exports, trade, investment, infrastructure, ICT, and agricultural competitiveness
17 AAA reports
Labor Regulations
No lending
Outcome: Little progress in addressing high minimum wages and labor market rigidities impeding formal sector job creation especially for highly educated young. Most active labor market policies were of limited effectiveness and fiscally expensive. Bank Contribution: AAA consistently diagnosed key issues, but efforts to formulate agreed employment strategy lost momentum. Persistent gender issues in labor market performance require analysis.
Moderately satisfactory AAA: Constraints to job creation, skills
development, active labor market policies, and development of analytical capacity
4 AAA reports
Education Policies
Lending: Increase coverage and quality at all levels
4 projects; US$385 million
Outcome: Increases in coverage at the secondary and tertiary levels and improvement in test scores. Near-universal primary coverage and literacy for both genders. Improvements in vocational training and rapid expansion in tertiary education. Primary and secondary quality issues being addressed. Key challenges remain in the tertiary sub-sector, which is failing to meet requirements of rapidly increasing graduate population and labor market. Potential for outward migration of educated labor and policy implications require analysis. Bank Contribution: Long-term support has been critical in achieving near-universal primary and high secondary coverage for both genders. The focus on quality improvement at primary and secondary levels is appropriate. Diagnostic AAA on tertiary education has been useful.
Satisfactory 2 AAA reports
Social Protection
No lending Outcome: Substantial coverage of pensions, health care, and direct subsidies for low-income households. Significant gains in coverage of social safety nets. However, longer-term financing of social protection (including health insurance) in a manner that does not impose an undue burden on formal sector remains a challenge. Bank Contribution: Analytical contribution to social security reform. Lack of unemployment insurance contributes to labor market rigidities.
Satisfactory
AAA: Strategy to increase coverage and quality
3 AAA reports
Combined rating of MILES outcomes and of higher order outcomes at right.
Most relevant CAS Objectives: Human capital development (1996), support economic reforms to enhance competitiveness and increase employment (2000), enhance skills and employability of graduates and labor force in a knowledge economy (2004 and 2007).
Outcomes during the decade ending in: 1997 2007 Satisfactory: Bank supported policies increased GDP and earnings growth, lowering poverty. Unemployment declined.
Faster per capita GDP growth (average) 2.3 3.9
Lower Poverty (eop) 6.2 3.8
Stable Employment Growth (average) 2.7 2.7
Lower Unemployment (eop) 15.9 14.1
Higher Adj. per capita GNI Growth (average)
2.4 4.3

xii
Policies Bank objectives Instruments Outcome and Bank contribution Bank Program
Outcome Rating
TURKEY
Macroeconomic Conditions
Lending: Increase macroeconomic stability through support in key structural areas (fiscal, financial, and public sector).
6 public sector/fiscal/ financial adjustment loans; US$5 billion
Outcome: Inflation was reduced from 85 percent in 1998 to 9 percent in 2007. Under the FY01 FSAL, the absence of a stable macroeconomic environment contributed to a banking crisis two months after loan approval. Later, major improvements occurred in the fiscal accounts and in strengthening the financial system. A major challenge remains in reducing the continuing external vulnerability, as evidenced by high current account deficits (6 percent in 2007). Bank Contribution: High-quality AAA prepared the Bank to provide support for government finances, agricultural subsidies and personnel outlays, taxes, social security, and SOEs, all critical structural areas in need of reform. Support initially failed to duly account for macroeconomic risks to the success of financial sector reforms.
Satisfactory
AAA: Structural policies to generate fiscal surpluses, including financial reform, banking sector, agriculture, social security, and budget institutions and management.
6 AAA reports
Investment Climate
Lending: Improve financial intermediation; develop export credit finance, severance payments by agricultural parastatals.
3 credit line loans; 1 adjustment loan, 1 Agricultural Reform Investment project (for severance payments) and 1 DPL; US$1.96 billion, excluding Economic Reform Loan, which also covered investment climate issues
Outcome: Private investment increased largely due to stabilization. Improved legal and regulatory treatment of FDI contributed to increasing FDI net inflow from 0.4 percent of GDP in 1998 to over 3 percent by 2007). There were improvements in some business transactions costs (e.g., starting a new business), but little or no progress in others. Bank Contribution: FIAS was especially effective in supporting improvements in FDI policy. High-quality AAA (ICA report) generated private sector interest, but was followed by somewhat disappointing engagement, apart from some lending support, of the Bank with the government.
Moderately satisfactory
AAA: Foreign investment and institutional arrangement for public/private collaboration on investment climate improvements (FIAS) reports), Caspian oil and gas management, water, energy, infrastructure, investment climate (ICA) and deregulation.
7 AAA reports
Labor Regulations
Lending: Set foundations for reform of labor market regulations.
Competitiveness and employment DPL; US$500 million
Outcome Labor regulations were made more rigid and labor taxes increased. Bank Contribution: AAA consistently and competently diagnosed the key issues, and the Bank’s convening power was used to advance its policy proposals. Moderately
satisfactory AAA: Labor reform, severance payments, labor dispute resolution mechanisms, active labor market policies, and labor taxes.
8 AAA reports
Education Policies
Lending: Expand capacity of primary education in low-income areas; improve conditions for student learning.
2 APLs and 1 project; US$704 million
Outcome: Important improvements were made in enrollments, coverage and gender equality in the educational system. Major challenges remain in improving quality and in strengthening secondary education to better adapt it to changing labor force requirements. Bank Contribution: Even though its AAA was of good quality, the Bank’s role was marginal in relation to the recorded sector gains.
Moderately unsatisfactory
AAA: Preschool through secondary education policies. Adapt higher education policies t to be more attuned to EU standards. Reducing regressivity of education expenditures (PER). Adopt measures to get the school population into and through the basic education system.
Social Protection
Lending: Reform of social protection system, including social security, unemployment insurance, health and social assistance reform.
2 lending operations ( plus assistance under 4 ERLs)
Outcome: Establishment of an unemployment insurance system and initiation of a conditional cash transfer system in 2001, which now reaches over 2.8 million children in poor households. Increased coverage of social protection. Bank Contribution: Bank played an effective role through AAA and lending support.
Satisfactory
AAA: Access to social security (Poverty Assessment)
xiii
Policies Bank objectives Instruments Outcome and Bank contribution Bank Program
Outcome Rating
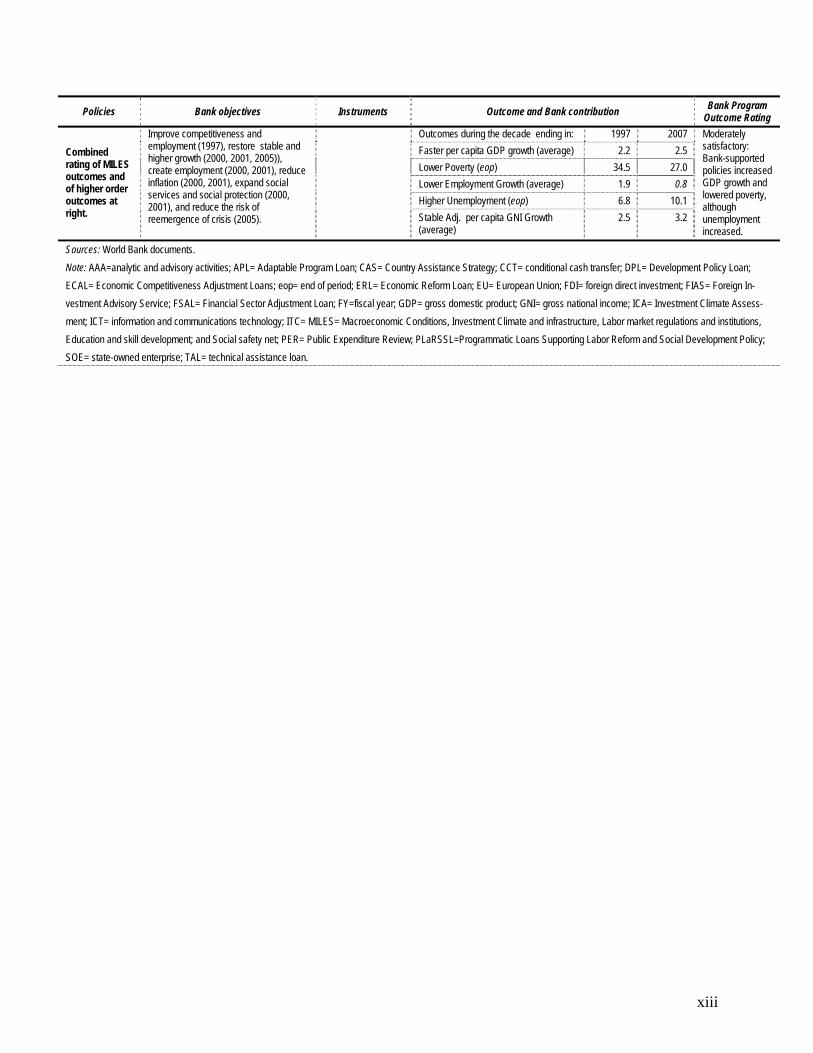
Combined rating of MILES outcomes and of higher order outcomes at right.
Improve competitiveness and employment (1997), restore stable and higher growth (2000, 2001, 2005)), create employment (2000, 2001), reduce inflation (2000, 2001), expand social services and social protection (2000, 2001), and reduce the risk of reemergence of crisis (2005).
Outcomes during the decade ending in: 1997 2007 Moderately satisfactory: Bank-supported policies increased GDP growth and lowered poverty, although unemployment increased.
Faster per capita GDP growth (average) 2.2 2.5
Lower Poverty (eop) 34.5 27.0
Lower Employment Growth (average) 1.9 0.8
Higher Unemployment (eop) 6.8 10.1
Stable Adj. per capita GNI Growth (average)
2.5 3.2
Sources: World Bank documents.
Note: AAA=analytic and advisory activities; APL= Adaptable Program Loan; CAS= Country Assistance Strategy; CCT= conditional cash transfer; DPL= Development Policy Loan;
ECAL= Economic Competitiveness Adjustment Loans; eop= end of period; ERL= Economic Reform Loan; EU= European Union; FDI= foreign direct investment; FIAS= Foreign In-
vestment Advisory Service; FSAL= Financial Sector Adjustment Loan; FY=fiscal year; GDP= gross domestic product; GNI= gross national income; ICA= Investment Climate Assess-
ment; ICT= information and communications technology; ITC= MILES= Macroeconomic Conditions, Investment Climate and infrastructure, Labor market regulations and institutions,
Education and skill development; and Social safety net; PER= Public Expenditure Review; PLaRSSL=Programmatic Loans Supporting Labor Reform and Social Development Policy;
SOE= state-owned enterprise; TAL= technical assistance loan.


Evaluation Summary
Earnings Growth and Employment Creation: An Assessment of World Bank Support in Three Middle-Income Countries Employment creation and earnings growth are critical to poverty reduction, the mission of the World Bank. The Bank has identified five policy areas that affect employment: macroeconomic conditions, investment cli-mate, labor regulations, education, and social protection. This MILES framework, as it is known, is useful for evaluating employment creation and earnings growth performance. This study uses it to assess the Bank’s as-sistance to three middle-income countries (MICs)—Colombia, Tunisia, and Turkey—during 1998-2007. The three countries faced major employment challenges during the past decade, received significant overall Bank support, had sufficient data available, and provided cross-regional representation. The assessment considers the impact of the Bank on policies, and the impact of these policies on employment and earnings. The com-parative analysis of a set of country programs is an approach to drawing lessons that may be useful in other situations, such as the current global financial crisis, where numerous MICs face similar employment creation and earnings growth challenges.
The three countries had very different experiences during the evaluation period. Colombia went through a deep recession during 1998-99 that increased its unemployment rate to unprecedented levels. Its employment-to-population ratio ceased to grow after many years of increasing female labor participation. Despite its satis-factory rate of economic growth, Tunisia experienced a high unemployment rate that resisted efforts to reduce it for decades, although the employment ratio increased modestly. Turkey also saw a sharp rise in unemploy-ment as it implemented structural reforms to stabilize its economy after many years of double-digit inflation, and its employment ratio continued its long-term decline.
Three sets of findings are worth highlighting. First, employment-related outcomes in the three countries were mixed, with notable progress in economic growth, earnings, and poverty reduction, but not in the employ-ment-to-population ratio or the unemployment rate. This finding underscores the desirability of focusing on the full set of employment-related variables (gross domestic product (GDP), poverty, employment, unem-ployment, and earnings) in an integrative fashion rather than just on employment when setting the objectives of Bank support. A related point is that many countries need to improve the delivery of employment-related statistics to allow timely monitoring and analysis of these variables, an area where the Bank has helped and can be of further assistance.
Second, Bank program objectives in the three countries focused more on MILES components than on em-ployment itself. The focus on MILES components suggests that employment-related issues, which span three Bank Networks ( Human Development, Poverty Reduction and Economic Management (PREM) and Private Sector Development (PSD), may fall by the wayside unless the Country Partnership Strategy serves as a vehicle for diagnosis, priority setting, and programming cross-sectoral work. Employment-related analytic and advisory activities (AAA), for example, is largely cross-sectoral in nature, covering such issues as structural unemployment, labor market rigidities and taxes, gender differences in labor participation, migration and re-mittances, and the impact of education on the extent of skills mismatch in the job market. From this perspec-tive the Bank could usefully strengthen its role as knowledge provider, broker, and/or facilitator of knowledge creation.
Third, Bank support in the three countries achieved differential progress in the individual MILES components, with the most progress on macroeconomic stabilization, followed in approximate order by progress on the in-

xvi
vestment climate, education, social protection, and labor taxation and regulations. The experience of the three countries illustrates how AAA can be the main instrument of support in these areas (for example, labor regula-tions and taxes) where progress in reform is difficult and the need for building engagement and consensus is crit-ical.
uring 1998-2007, Colombia, Turkey, and Tunisia faced difficult employment chal-lenges, as shown in the figure below. Over
the first half of the review period, Colombia and Turkey experienced sharp increases in the unem-ployment rate as deep recessions reduced employ-ment demand. As these three economies recovered, Colombia’s unemployment declined and Turkey’s remained higher. Despite Tunisia’s economic sta-bility, it had the highest unemployment rate of the three countries, although unemployment declined moderately during the review period (Panel A). Fur-thermore, the employment-to-population ratio ceased growing in Colombia during the review pe-riod after many years of increases in female partici-pation. However, in Turkey it continued declining. Tunisia’s employment-to-population ratio increased by a few percentage points (Panel B) because female participation increased from a very low level. Progress was made in reducing gender differences in two countries. From 1997 to 2006, the excess of male over female labor participation rates declined from 27.2 to 18.8 percentage points in Colombia and from 49.7 to 45.8 percentage points in Tunisia. It remained unchanged in Turkey at about 48.5 percen-tage points. Earnings declined and poverty increased during the recessions in Colombia and Turkey, but these improved toward the end of the review period. Earnings in Tunisia increased and poverty declined.
Employment Performance in Colombia, Tunisia, and Turkey A. Unemployment Rate: 1997–2007
B. Employment-to-Population Ratio: 1997-2007
Sources: The World Bank (World Development Indicators); Colombia Statistical Office (DANE); Turkey Statistical Office (Turkstat).
This report evaluates World Bank support for em-ployment and earnings growth in Colombia, Tunisia, and Turkey during 1998-2007. It aims at drawing findings that may help guide the Bank’s work in this area, including its response during the current global crisis. The review looks at Bank support for the five areas embodied in the MILES framework developed by the Human Development and PREM networks: macroeconomic, investment climate, labor market, education, and social protection conditions and poli-cies. These areas cover the key factors that affect the demand for labor, the workings of the labor market, and the supply of skills. Although the de-mand for labor is expected to respond positively to economic growth, the two need not move in tan-dem, as the sources of economic growth include growth in skills, physical capital, and total factor productivity, in addition to growth in employment.
Although the MILES framework was not explicitly used in formulating the objectives of the country pro-grams reviewed in this report, the framework can be used to identify binding constraints to employment creation and earnings growth. Thus, it offers an orga-nizing framework for the evaluation into which the three country programs can be retrofitted and as-sessed. This approach thus differs in some (though not all) respects from the standard approach in many IEG evaluations of “evaluating against objectives,” where the outcome of the Bank program is assessed relative to objectives stated at the outset. In this case, although the programs in the three countries sought to help increase employment, the employment-related objectives were not always formulated and unbundled into more proximate objectives.
The table below shows that the largest amounts of lending support in the three countries were for ma-
5
10
15
20
1997
1998
1999
2000
2001
2002
2003
2004
2005
2006
2007
Year
Per
cent
Colombia Tunisia Turkey
40
45
50
55
1997
1998
1999
2000
2001
2002
2003
2004
2005
2006
2007
Year
Per
cent
Colombia Tunisia Turkey
D

EVALUATION SUMMARY
xvii
croeconomic policies (including financial sector poli-cies) followed by investment climate.
Bank Lending (US$ million) and AAA (number of tasks) by MILES Area: 1998–2007 Country Colombia Tunisia Turkey MILES Area Loans AAA Loans AAA Loans AAA Macroeconomic conditions 1,235 9 562 11 4,988 6
Investment climate 1,100 4 436 17 1,961 7
Labor regulations 857 6 0 11 500 7
Education policy 662 3 385 10 704 2
Social protection 341 4 0 3 1,715 1
Total 4,195 26 1,383 52 9,868 23 Source: Appendixes D, I, and N. Note: AAA= analytic and advisory activities; MILES=Macroeconomic conditions, Investment Climate and Infrastructure, Labor market regulations and institutions, Education and skill development; and Social safety net.
Colombia
Throughout the evaluation period, the Bank was en-gaged in the five areas of the MILES framework in varying degrees. Following the 1998-99 crisis, the Bank supported the government’s efforts to streng-then fiscal performance (revenue collection, efficiency in the provision of health services, contingent liabili-ties, public administration, and public expenditure and debt management) and the financial system. These improvements were critical in redressing growth and earnings and in dampening a surge in cyclical unem-ployment. They did not, however, achieve a reduction in structural unemployment, which remained high due to, among other things, an excessive minimum wage and high payroll taxes.
Beginning in 2002, reflecting the government’s prior-ities and concerns that the economic recovery was slow to yield better employment and social out-comes, especially for the poor, there was increased emphasis by the Bank on improving competitiveness (through investment climate strengthening and labor market reforms) and on improving the social risk management system.
Bank-supported objectives in the MILES areas were largely achieved, although the Bank was over opti-mistic about the elimination of fiscal structural rigidi-ties given the political economy constraints. It did not adequately factor in the fiscal implications of the conditional cash transfer program. Nonetheless, Co-lombian counterparts acknowledged the contribu-tion of the Bank in several areas, such as tax admin-istration. In some areas, the Bank missed certain opportunities to use its convening power. For ex-ample, a number of stakeholder consultations sug-
gested that the Bank (as well as the IMF) had been too timid in pressing the policy implications of its labor market diagnostics (particularly regarding the minimum wage and labor taxes), which were of good quality. In general, the Bank’s interventions were re-levant and AAA, technical assistance, and lending operations adapted to the government’s changing priorities.
Bank-supported policies improved employment per-formance. The improvements in macroeconomic policy and the investment climate helped increase average yearly GDP growth from 0.5 percent during 1997-2002 to 5.6 percent during 2002-07, primarily through an increase in total factor productivity (TFP) growth. Faster GDP growth allowed the un-employment rate to decline and earnings to grow despite a slowdown in employment growth.
IEG rates the outcome of the Bank program in Co-lombia with respect to progress in employment and earnings growth as moderately satisfactory. Key achievements can be summarized as follows:
Higher-order outcomes: increased earnings growth and lower poverty with stable em-ployment growth; mitigation of cyclical un-employment, particularly during the second part of the review period.
Intermediate outcomes: the restoration of fiscal stability, substantial progress in the invest-ment climate, gains in the coverage and fi-nancing of education, and broader safety net coverage.
Bank interventions: significant Bank contribu-tions in tax administration, bank restructur-ing, business climate improvements, labor market diagnostics, coverage and financing of education, and design of the conditional cash transfer (CCT) system. There were shortfalls in resolving Colombia’s revenue and expenditure rigidities, as well as in lo-wering the minimum wage and the burden of non-wage costs, relative to objectives. There was also lower growth and higher structural unemployment.
Tunisia
In Tunisia, the Bank was also engaged in the five pil-lars of the MILES framework, though there were important differences of emphasis. Regarding ma-

EVALUATION SUMMARY
xviii
croeconomic policy, performance was the best among the three countries. The Bank’s role was positive, albeit marginal on the fiscal front. It was most important for trade liberalization and facilita-tion and financial sector reform, both of which be-nefited from AAA and lending, including high-quality diagnostic financial sector work undertaken jointly with the IMF. Regarding the investment cli-mate, Bank support addressed important reforms, including a reduction in the regulatory gap that fa-vored the offshore over the onshore economy, im-proving competition law, opening the information and communications technology sector, and devel-oping the regulatory framework for infrastructure.
The Bank had little impact on policies governing the labor market. The Bank conducted AAA of good quality, but the government did not adopt any of the Bank’s key recommendations. With respect to edu-cation, a great deal was achieved at the primary and secondary levels, and the Bank played a major role. The results of Bank support were more muted at the tertiary level, where there was less-than-full agree-ment on some key policy issues (such as financing and cost recovery reforms). Aggressive expansion in tertiary level coverage has been responsible for a de-terioration of quality.
The key policies that improved GDP, employment, and earnings growth in Tunisia were macroeconomic stabi-lization and trade integration with the European Union (EU). The latter was largely established before the re-view period. Improvements in the investment climate may have further contributed to the growth in earnings suggested by rising formal sector wages through im-provements in productivity growth. These improve-ments have not yet had a discernible effect on invest-ment levels. Although education has contributed to rising productivity and earnings, it has also led to in-creased unemployment among the educated due to both skills mismatches and low investment levels. Un-employment has been persistently high, but declined moderately during the review period. Inadequate skills appear to be behind the high level of unemployment. This may also reflect the effect of minimum wages.
The outcome of the Bank program in Tunisia relating to employment and earnings growth is rated satisfacto-ry. Key achievements can be summarized as follows:
Higher-order outcomes: increased earnings growth and lower poverty with stable em-ployment growth, lower structural unem-ployment, and increased GDP growth.
Intermediate outcomes: sustained macroeco-nomic stability, significant progress in trade facilitation and the business environment, progress in the investment climate, and gains in coverage of education.
Bank interventions: significant Bank contribu-tion to trade, the investment climate, and coverage in education. However, there were shortfalls in making labor markets more flexible, in improving education quality, and in strengthening public sector governance.
Turkey
In Turkey, the Bank was heavily engaged in the five areas of the MILES framework, but to varying de-grees. In the earlier years, the Bank concentrated on macroeconomic stabilization and attendant structural reforms. Bank support was delivered primarily through policy advice and development policy lend-ing. Following the 2001-02 crises, the Bank sup-ported reforms to strengthen fiscal performance and the financial system. This set of reforms was critical in redressing economic growth and earnings growth in Turkey. However, the reforms did not help reduce unemployment, which in fact increased. In later years, greater attention was devoted to employment and competitiveness issues. Within the scope of the MILES framework, the remaining problem areas are labor market regulations, education, and the invest-ment climate.
Bank-supported objectives were largely achieved. Stabilization and related structural reforms were achieved, although the support was initially unsuc-cessful because weak macroeconomic stabilization undermined financial sector reforms. Regarding in-vestment climate matters, active Foreign Investment Advisory Service (FIAS) participation supported im-portant changes in foreign direct investment legisla-tion. The more recent Investment Climate Assess-ment (ICA) has, however, been less successful and would benefit from stronger client engagement and dissemination. With respect to labor policy issues, the Bank provided high-quality advice, although this did not translate into policies to ease the rigid regula-tions and high labor taxes that had been diagnosed. Regarding education, the first operation was unfo-cused and suffered from procurement problems; however, follow-on lending fared better. Despite these operations and several pieces of AAA, the Bank’s engagement in the education sector was less successful than in other areas relating to employ-ment.

EVALUATION SUMMARY
xix
Bank-supported policies, particularly those in the macroeconomic area, helped reignite growth and the demand for employment, with the employment ratio stabilizing somewhat after a long-term decline. Higher productivity triggered by some of the sup-ported reforms helped increase the earnings of the poor. However, structural adjustment, particularly migration away from agriculture, continued to de-crease labor participation and increase productivity. On balance, average earnings declined until about 2003 and recovered thereafter.
The outcome of the Bank program in Turkey with respect to employment and earnings is rated moderate-ly satisfactory. Key achievements can be summarized as follows:
Higher-order outcomes: increased earnings, lower poverty, and higher GDP growth.
Intermediate outcomes: the restoration of fiscal stability and gains in the coverage of education.
Bank interventions: significant Bank contribu-tions towards macroeconomic stability and the CCT program. There were shortfalls in the effectiveness of support for the busi-ness climate, lowering non-wage costs, and relaxing labor regulations (though some progress was achieved the year after the end of the review period). Effectiveness in con-tributing to education gains was also limited. Employment growth declined and unem-ployment increased.
Findings
Three sets of findings are worth highlighting. The first set concerns outcomes. In the three countries, progress in economic growth and earnings was nota-ble, but not for the employment-to-population ratio or the unemployment rate. This finding underscores that higher economic growth does not always lead to lower unemployment. It also highlights the need to consider the full set of employment-related outcomes, not just employment, wherever employment objec-tives feature prominently in Bank strategies and pro-grams. The full set of outcomes would cover em-ployment growth, the employment-to-population-ratio, the unemployment rate and earnings growth, as well as the impact (including the uncertainties of the impact) of these measures on poverty. . Thus, policies and programs need to be understood in terms of their possible combined effects on those variables. As monitoring employment-related outcomes requires
adequate data, the Bank can provide a valuable service by continuing to help client countries reduce the long lags with which critical data on employment perfor-mance (for example, earnings) are produced and dis-seminated.
A second set of findings involves Bank country strategies and programs. In the three countries cov-ered in this evaluation, the Bank primarily targeted multiple objectives with a bearing on employment (for example, objectives relating to MILES compo-nents) rather than explicit employment outcomes. This points to the usefulness of situating Bank sup-port for employment and earnings growth within an integrative framework. For client countries where employment-related objectives underlie Bank sup-port, the Country Partnership Strategy takes on add-ed importance as a vehicle for diagnosis, priority-setting, and cross-sector work on employment is-sues, which span the three networks ( Human De-velopment, PREM and PSD) and which may not otherwise get the requisite attention.
AAA has been an important component of the Bank’s assistance for employment and earnings. Al-though the impact that it had was unclear, the Bank’s AAA was generally of good quality. It addressed the right employment issues competently, and was well appreciated by the three clients. This experience suggests that where it is judged that employment-related outcomes are central to country strategies, it would be advisable to deploy AAA in the critical areas, including: understanding and addressing the roots of unemployment, including its cyclical, clas-sical, frictional, and structural components; and as-sessing labor market regulations and institutions and their effects. In particular, the Bank can help im-prove and extend the coverage of estimates and cross-country comparisons of labor rigidities and labor taxes.
In some cases, the Bank was not sufficiently engaged in labor market issues. The experience of the three countries shows varying degrees of engagement, which in turn are likely to be driven by differences in the political economy of labor reform and by Bank proactivity regarding engagement on such issues. Where labor reform issues are deemed important to its country strategy, the Bank would be well advised to conduct the required AAA and find the right windows of opportunity to support the government (as was the case in Turkey).

EVALUATION SUMMARY
xx
Sustained macroeconomic and financial stability in Tunisia and stabilization in Colombia and Turkey, as well as higher education levels, explain increased or recovered economic growth and earnings in the three countries. Some additional role can also be attributed to improvement in the investment climate. However, progress in these three areas did not reduce unem-ployment rates in Colombia and Turkey, and reduced them only moderately in Tunisia. High remaining un-employment is likely to reflect skill mismatches, rigid wages, or other structural conditions.
A third set of findings concerns the specific areas of support. Bank support for macroeconomic policies contributed to efforts on the macroeconomic-financial crisis resolution in Colombia and Turkey and to trade and financial development in Tunisia. These efforts were the main factor that helped restore GDP growth in the first two countries and also contributed to sustaining higher growth in the third. Restored GDP growth increased the demand for labor, result-ing primarily in the higher earnings growth docu-mented earlier. Bank support for investment climate reforms in the three countries contributed to im-provements in specific policy areas that helped raise investment or total factor productivity to varying de-grees.
Support for labor market regulations and institutions occurred primarily through AAA that was relevant and technically competent. However, the impact was un-clear. Labor rigidity and labor taxes remained a con-straint to employment, particularly formal employment, in the three countries. Support for education contributed primarily to extensions in access and to an increased supply of the skills needed to raise output and earnings growth. However, the impact on quality was more limited. Finally, support for social protection arrangements contributed successfully to conditional cash transfer (CCT) programs in Colombia and Turkey, and less so to the unemployment insurance programs that are needed to move from job protection to worker protec-tion. The three countries’ experiences attest to the dif-ficulties of setting up unemployment insurance sys-tems.
From a more general cross-cutting perspective, the Bank could usefully strengthen its role as knowledge provider, broker, and facilitator of knowledge crea-tion. The Bank is in a good position to exercise lea-dership on employment issues as it has demonstrat-ed capacity to use research for developing operationally relevant policy. In this regard, AAA, not lending, is often the best instrument to deal with
the more sensitive policy issues that affect employ-ment outcomes. As with the three countries re-viewed in this report, the Bank can contribute to un-derstanding employment issues where those issues are a central concern. This would include advising countries on how to use available resources judi-ciously to address various employment challenges (such as unemployment insurance) while ensuring macroeconomic stability. It would also include look-ing at education quality, possibly with greater em-phasis on addressing skills mismatches, which may be behind much of the structural unemployment ob-served in countries such as the three reviewed in this report.
The Current Global Jobs Crisis
The findings of this report suggest ways in which the Bank can strengthen its response to the current global economic crises. The crisis has reduced out-put growth from 5.2 percent in 2007 to -1.3 percent in 2009, and increased the world unemployment rate from 5.7 percent in 2007 to 6.8 percent in 2009 (with the higher increases in developed economies, Central and South Eastern Europe (non-EU) and Com-monwealth of Independent States (CIS), and Latin America and the Caribbean). The findings suggest the following three directions:
Country programs can respond by focusing on both employment and earnings outcomes, which determine poverty outcomes. Country Di-rectors are well positioned to deploy the Bank’s mul-tisector capacity to engage with client countries on how policies and adjustments to Bank programs can help improve the full set of employment-related out-comes, not just employment. Such engagement will require an understanding of how policies in different areas (including macroeconomy and labor market) can redress both employment and earnings in specif-ic countries, presumably through increased demand for labor and skills and through higher labor produc-tivity. Many governments have made adjustments to their policies in response to the financial crisis and/or may need well-tailored advice in these areas. Diagnoses and recommendations are likely to differ according to specific country circumstances, such as the degree of openness of the economy.
The Bank’s effectiveness will be stronger as it integrates across networks to focus on those is-sues that are likely to be relevant during crises. Examples include: improving employment and earn-ings monitoring; assessing the impact of global re-cession on structural unemployment; developing

EVALUATION SUMMARY
xxi
strategies to promote job flexibility and worker pro-tection; finding the right balance between macroe-conomic stability and the fiscal cost of other em-ployment-related policies; strengthening the interaction between macroeconomic and microeco-nomic conditions affecting growth and employment demand; understanding the interface between quality of education and absorption of labor services; and assessing the possible effect of differential changes in employment and earnings on migration.
Country programs will be more effective as they focus on areas where progress in the enabling conditions has been slow but where windows of opportunity for reform surface. The area where progress has typically been slow is in making labor regulations more flexible and in lowering labor taxes. Conversely, the Bank can also help countries maintain progress where it has been achieved, as was the case with macroeconomic stability in the three countries reviewed. In this regard, the Bank can deploy its mul-tisector capacity to help countries avoid conflicts among employment policies (e.g., ensuring that stimu-lus packages or extended social protection are afford-able).


xxiii
Chairperson’s Summary: Committee on Development Effectiveness
On June 29, 2009, the Informal Subcommittee (SC) of the Committee on Development Effectiveness (CODE) considered an Independent Evaluation Group (IEG) report entitled Earnings Growth and Employ-ment Creation: an Assessment of World Bank Support in Three Middle-Income Countries. This new IEG initiative reviews World Bank sup-port for earnings growth and employment creation during 1998-2007 in three middle income countries (Colombia, Turkey, and Tunisia), and blends features of a thematic evaluation with those of a country evaluation.
Overall Conclusions. CODE welcomed the opportunity to discuss the IEG report. It noted the relevance of the topic for poverty reduc-tion. Members sought to better understand the objectives and lessons emerging from the report on the Bank’s role in supporting employ-ment and earnings growth in client countries. In this connection, some felt that despite detailed analysis of the employment and earn-ings growth issues, the report was not clear as to what changes could be made in the Bank’s lending policies. They remarked that poverty reduction as the ultimate objective of the Bank’s assistance to coun-tries can be achieved only through earnings growth and increased employment.
Questions were asked about the criteria for selecting the three coun-tries and applicability of the findings to the International Develop-ment Association (IDA) countries. Members noted that the report could have included more analysis on gender and demographic di-mensions of labor markets, as well as more information about South-South cooperation and learning. They expressed interest in the effec-tiveness of a knowledge component in the Bank’s programs.
Main issues raised at the meeting
Lessons learned from the evaluation. Some members sought clarifi-cations on the report’s objectives and main message emerging from the evaluation on the Bank’s role in supporting employment and earnings growth. In this regard, a member noted that none of the three country programs included employment creation as a priority. IEG clarified that it focused on the key systemic issues; evaluated consistency of the Bank’s approaches in the three countries; and suggested directions for the Bank to move forward on employment creation and earnings growth. Management appreciated the depth and quality of the report as well as the fact that it draws attention to employment as a critical input for poverty re-duction.

xxiv
Growth and employment. Members took note of the report finding about the weakness of employment-related outcomes in spite of nota-ble progress in economic growth and poverty reduction. Some felt that employment generation should be a primary objective for the Bank so as more favorable outcomes can be developed. Management acknowledged that over the last ten years employment was not considered a central development objective, but rather a growth-derived outcome. A member queried as to changes in the Bank’s approaches for targeting unemployment. Another member opined that employment and earn-ings growth can be influenced directly only through investments in labor intensive sectors (that is, crop production, cottage industry, and handicraft sector), that were not analyzed in the report. He also pointed out major marketing challenges which exist in these sectors. The need to analyze the situation from the perspective of equal distri-bution of employment opportunities among the population (that is, access to growth outcomes and job opportunities) was stressed. Man-agement agreed that the real challenge in the three countries was their inabil-ity to generate broad-based growth that provided employment to everyone who joined the labor force. IEG added that structural unemployment cannot be used as a single indicator by which to judge the success of the Bank’s in-terventions in the areas of earnings growth and employment creation.
MILES framework and agenda for action. Members appreciated the usefulness of the Macroeconomic conditions, Investment climate and infrastructure, Labor market regulations and institutions, Education and skill development; and Social safety net (MILES) framework and its multi-sector approach for employment outcomes of countries. In this vein, questions about an “endorsement” of the MILES framework and its continued use were raised. IEG responded that it found the MILES framework to be very useful in dealing with the unemployment is-sues. Management clarified that the MILES approach was finalized only in 2007 and is still under testing. While very promising and highly appreciated by countries, more experience needs to be gained in particular in identifying the barriers to job creation. Some members were interested in Manage-ment’s future agenda, particularly in social protection (that is, em-ployment insurance vis-à-vis conditional cash transfers) and policy advice. A speaker also reiterated the request for an IEG evaluation of social protection programs.
Country related issues. Some members wondered about the criteria for selecting the three countries for the evaluation, and the applicabili-ty of the findings for other countries including IDA countries. IEG re-sponded that the three countries were chosen based on similar levels of per capita income, similar economic backgrounds, and similar structural unem-ployment issues. For the future, a member suggested reviewing a country with satisfactory outcomes in terms of employment creation and summarizing lessons learned based on its positive experience. A

xxv
speaker sought elaboration on the political economy of the labor mar-ket reforms.
Gender and demographics. Members stressed the importance of con-sidering gender and demographic (including youth unemployment and migration) dimensions. A member remarked that an analysis of gender aspects in the evaluation should have been included, observ-ing that the Bank seem to be making limited progress in addressing significant gender issues in the labor markets. IEG responded that there is a comprehensive on-going evaluation of the Bank’s work on gender. IEG also added that none of the three country programs had targeted reduction of gender inequality on labor markets.
Knowledge. A member sought elaboration on the impact of the Bank’s advice and knowledge work on government policies and wondered what Management should do differently. In response, IEG noted a close link between AAA and lending in the area of macroeconomic stabilization in both Colombia and Turkey. As for the regulatory and insti-tutional aspects, the link was not that direct, but it existed, for example, the Bank’s engagement in the policy dialogue on employment with the Turkish government resulted in a reduction of labor taxes. Management added that a research program to support labor market interventions was launched. With regard to the labor taxes, a member opined that it is not a correct term for the costs associated with labor and employment (for example, la-bor insurance, injury insurance, and pension insurance).
Another member queried as to the Bank’s role in sharing knowledge created in its client countries vis-à-vis redistributing knowledge created in the Bank itself. In this connection, he suggested to learn more about the China experience in linking strong economic growth to employment generation. The importance of South-South know-ledge sharing was also emphasized. A speaker asked for a compari-son between the report findings and the International Labor Organi-zation (ILO) recommendations. IEG explained that the evaluation focused on earnings growth and employment creation from the labor econom-ic prospective, while ILO primarily focused on the quality of employment, child employment, and other multisectoral issues. Giovanni Majnoni, Chairperson


1
Chapter 1 Introduction
This evaluation has elements of both a country evaluation and a the-matic evaluation. It focuses on employment creation and earnings growth, but is country-focused in that it looks in depth at the out-comes of Bank support in three middle-income countries (MICs), Co-lombia, Tunisia, and Turkey, during 1997-2007. Its main purpose is to extract lessons that may be useful for Bank operations, both in the three MICs considered here and in other Bank client countries where specific focus on employment and earnings issues are judged pivotal to the poverty reduction and development agenda. It is a pilot Inde-pendent Evaluation Group (IEG) product for this approach.
The evaluation looks at employment and earnings challenges using an integrative framework that covers macroeconomic, investment cli-mate, labor market, education, and social protection conditions and policies (MILES). This MILES framework, developed by the Human Development (HD) and Poverty Reduction and Economic Manage-ment (PREM) Networks, can be used to identify binding constraints to employment creation and earnings growth. It is used here to cover the relevant aspects of the Bank’s programs in the three selected coun-tries.
Although the MILES framework was not explicitly used in develop-ing or formulating the objectives of the country programs reviewed in this report, the framework offers a useful organizing device for the evaluation. These country programs can be easily accommodated or “retrofitted” into the framework and assessed in the light of their support for employment creation and earnings growth, which are critical for the Bank’s goal of reducing poverty. Thus, the approach used in this report differs in some (though not all) respects from the standard approach in many IEG evaluations of “evaluating against objectives” where the outcome of the Bank program is assessed rela-tive to objectives stated at the outset. The individual country assess-ments in this report focus both on the intermediate objectives sought by each country in each of the MILES areas, and on the extent to which each country achieved employment creation, earnings growth, and poverty reduction.
Evaluation Essentials The evaluation develops
lessons for employment creation and earnings growth from the experience of Colombia, Tunisia, and Turkey during 1997-2007.
It assesses the effect of Country Assistance Strategies (CASs), lending, and Analytic and Advisory Activities (AAA) on policies affecting employment creation and earnings growth.
It uses the MILES framework, which is based on the idea that employment problems reflect multiple sector influences on labor supply and demand.

2
This first chapter provides the context for the evaluation, namely an ac-count of the Bank’s role in supporting employment creation and earn-ings growth, a statement and justification of the goal of the evaluation, and the methodological approach used. Chapters 2, 3 and 4 discuss the three country cases. Each includes an analysis of the country’s issues relating to employment and an assessment of the relevance, effective-ness, and efficiency of the Bank’s support. Chapter 5 integrates the findings from these cases by comparing employment outcomes, key employment policies, and the role of the Bank in supporting those poli-cies across the three country cases.
Objective The primary aim of this evaluation is to develop lessons from the Bank’s experience in the three selected countries regarding assistance aimed at employment creation and earnings growth. The evaluation focuses on employment creation and earnings growth because these have a strong bearing on the extent to which the central objective of poverty reduction is achieved.
Employment creation is an explicit or implicit objective in most Coun-try Assistance Strategies, as it was in the cases of Colombia, Tunisia, and Turkey. Appendix A summarizes the explicit CAS objectives in the three countries. It shows employment creation or human capital development as part of these objectives in most of the CASs. In some CASs, employment is absent from the explicit objectives, as in the case of Colombia (2002, 2005, and 2008 CASs). However, Colombia’s CASs increasingly contain references to employment beginning with the 1999 CAS progress report, reflecting the unprecedented rise in unem-ployment that was taking place at the time. Some of these references point to country actions that the Bank intended to support in order to address the problem. The focus on employment is further justified be-cause, as the appendix shows, other CAS objectives closely bear on the employment objectives. This is the case, for example, with eco-nomic growth and stabilization objectives.
Questions and Methods The evaluation assesses the impact of the Bank’s assistance on em-ployment outcomes. This means assessing the effect of the Bank’s CASs, lending, and analytic and advisory activities (AAA) on policies with a bearing on employment and earnings and, in turn, the effect of such policies on employment creation and earnings growth, as well as on economic growth and poverty reduction. The evaluation attempts to indicate whether impacts are significant, but does not attempt to ar-rive at any quantitative estimates of the impacts.
The evaluation aims to develop lessons from assistance for employment creation and earnings growth from three middle-income countries during 1997-2007
The evaluation assesses the impact of the Bank’s assistance (CASs, lending and AAA) on policies affecting employment creation and earnings growth.

3
Table 1.1 The MILES Framework: Summary
Macroeconomic stability A predictable and stable macroeconomic environment gives firms the incentive to create jobs.
Investment climate Firms will expand and create formal sector jobs when the costs of doing business (for example, from regulation or poor infrastructure) are low and predictable.
Labor market policies
When employment regulations are strict and non-wage costs of labor are high, firms may be more reluctant to hire new formal sector workers. Labor market policies also influence decisions to enter the labor force.
Education and skills Higher productivity jobs require appropriate skills, so better education and training improves the chances of finding the type of job demanded by firms.
Social safety net A strong safety net protects workers from shocks to employment and, if linked to human capital improvement and active labor market policies, can stimulate better employment matching.
The relevant relationships governing the assessment are as follows: employment outcomes result from policies, exogenous variables, and economic growth. In turn, policies result from the interplay of domes-tic actors, external actors, exogenous forces, and past employment and growth outcomes. Clearly, many policies—not just those directly concerning the labor market—affect employment and earnings out-comes. Disentangling these various influences, let alone identifying the particular impact of the World Bank, is difficult.
Since virtually all policies can influence labor demand or supply, this report organizes the discussion of the various policy influences around the MILES framework developed within the World Bank. The idea underlying the framework is that problems of unemployment and underemployment or low pay are not just labor market problems but reflect multisector influences on the supply and demand for labor. The relevant considerations are summarized in Table 1.1
In the MILES framework, policies are classified as follows:
Macroeconomic policies—including fiscal, monetary, foreign exchange, trade, and financial sector stability.
Investment climate—including policies affecting labor and capital productivity, access to finance, impact of health on the private sector, the cost of doing business, and exports.
Labor market policies—including payroll taxes, labor flexibili-ty, worker protection, and active employment policies, such as placement services, retraining, and public works.
Education policies—including policies affecting coverage and/or quality of education.
The underlying idea of the MILES framework is that employment problems reflect multiple sector influences on labor supply and demand.

4
Social protection—including unemployment insurance, and pension coverage.
There are of course multiple linkages across MILES components that will ideally be considered in employment strategies. Four key linkag-es across MILES elements with a bearing on the cases discussed in this report can be highlighted: (i) Macroeconomic conditions and the mi-croeconomic indicators normally covered under investment climate (e.g., taxes, labor regulations) work to increase investment and growth; (ii) education conditions, specifically technical quality and alignment to business needs, also shape the investment climate, and ideally will be built upon to accelerate employment and earnings growth; (iii) social protection conditions are critical for enabling and designing labor regulations, with the latter affecting the relative use of labor vis-à-vis capital and/or the relative size of the formal sector, largely independently of growth; and (d) the financing of enhanced social protection needs to be aligned to fiscal constraints to help main-tain macroeconomic stability. Linkages within a MILES component may also be of interest, such as the need to include the interaction be-tween the minimum wage and labor taxes in policies regarding labor regulations and institutions.
The evaluation focuses on questions on relevance and effectiveness as follows:
Relevance: Were the employment/unemployment objectives the Bank sought to support well aligned with the govern-ment’s program? Did the Bank diagnose the relevant con-straints that needed to be addressed and give sensible advice to its clients on how to improve employment performance? Were the policies finally supported by the Bank necessary and sufficient to improve employment performance? Were such policies consistent with the country’s overall development pol-icy program?
Effectiveness: Did employment, earnings, and overall eco-nomic outcomes improve? Were the short-term and long-term effects different? Did the AAA and research linked to the Bank’s lending or on a free-standing basis support or enhance the adoption and effectiveness of policies with a bearing on employment? To what extent did finance extended by the Bank help the borrowers’ overall employment outcomes?
The choice of countries was guided first by a classification of all those countries that had received Bank assistance for employment into three groups: transition countries, non-transition countries with long-term de-clining or stagnant employment, and non-transition countries with growing employment. The transition countries were excluded from se-lection as they faced a very specific set of challenges and consequently
The evaluation focuses on relevance and effectiveness of Bank engagement on employment issues.
The countries chosen—Colombia, Tunisia, and Turkey—cover conditions of either long-term growing, declining, or stagnant employment.

5
were not comparable with other countries. The selection from the other two groups sought countries that satisfied four criteria : (i) they faced major employment challenges during the past decade; (ii) they received significant overall Bank support; (iii) they had sufficient data available; and (iv) they provided cross-regional representation.
Following a review of all countries with employment and unem-ployment data,2 Colombia, Tunisia, and Turkey were selected as use-ful examples that have presented policy makers with challenging and contrasting employment and earnings performance experiences and that have also received attention in recent Bank assistance programs.3 Colombia, a country that experienced long-term growth in the em-ployment-to-population ratio, suffered from a severe unemployment shock in the late 1990s from which it recovered slowly. Turkey, a country that experienced a long-term decline in the employment-to-population ratio, has been challenged by a long-term decline in its employment ratio and a more recent sharp increase in the unem-ployment rate following its macroeconomic crises at the turn of the century. Tunisia, a country with an almost stagnant and low em-ployment-to population ratio, has experienced exceptionally high un-employment for many years. Within the middle-income group, these three countries offer a wide range of income and poverty levels. In 2007, per capita gross domestic product (GDP) levels at purchasing power parity (PPP) prices were $8,587 for Colombia, $7,520 for Tuni-sia, and $12,955 for Turkey. Poverty levels (head count ratio for a $2.50 a day poverty line at PPP prices for the last year available) were respectively 35 percent (2006) in Colombia, 21 percent (2000) in Tuni-sia, and 15 percent (2005) in Turkey.

6
The country studies draw on a wide range of evidence, including a review of World Bank loan documents, AAA reports, CASs and completion reports and government documents; academic research papers; previous IEG reviews of relevant components of the Bank’s activities; impact evaluations of specific programs undertaken in each country; a client survey conducted as part of the IEG review of Bank support for middle-income countries4 and interviews with a wide range of individuals in Colombia, Tunisia, and Turkey as well as in the World Bank (see Appendix E,
Appendix I, and Appendix M). The interviews in the field were con-ducted during visits that took place from October 23-November 11, 2008.
The country studies draw on a wide range of evidence.

7
Chapter 2 Colombia
Introduction
During the past decade Colombia’s labor market performance was challenged by: (i) the recession of 1998-99 that was driven by reduced global growth, curtailed access to capital, the adverse security situa-tion, poor fiscal performance, and disruptions to the financial sector; (ii) an inflexible labor market with high payroll taxes and minimum wages; and (iii) an increased labor supply driven by rising female par-ticipation. Urban unemployment more than doubled from 8.8 percent in 1995 to 20.2 percent in 2000. It declined only slowly as growth re-covered after 2002, reflecting better external conditions, improved se-curity, and policy actions that facilitated the operation of businesses. Fiscal performance had improved by the middle of the period, albeit without resolving many of the underlying fiscal rigidities. Once the fiscal and financial sector concerns were eased, the focus was on the slow response of employment and unemployment to the output re-covery, suggesting that policies influencing the investment climate and the functioning of labor markets, including the matching of skills to the needs of the economy, were the most significant constraints. Rates of informality remain high by cross-country comparisons.
Throughout the evaluation period, the Bank has been heavily engaged in all of the five areas of the MILES framework, but the relative emphasis has changed over time. Following the 1998-99 crisis, the Bank supported the government’s macroeconomic stabilization efforts through a series of adjustment loans focused on the fiscal and financial sectors. Since 2002, reflecting the government’s priorities and concerns that the ongoing eco-nomic recovery was slow to yield better employment and social out-comes, especially for the poor, there has been greater emphasis on im-proving competitiveness (through the investment climate and labor market reforms), as well as on improving the social risk management system.
The Bank’s strategy and interventions were highly relevant in address-ing Colombia’s key employment and earnings-related issues. This is despite strategic planning that failed to anticipate well country priori-ties or that was not well timed to country planning cycles. The Bank’s
Evaluation Essentials Unemployment outcomes
in Colombia mirrored the recession-recovery cycle in GDP growth.
Major progress has been made on policies affecting economic performance and the labor market.
Labor market outcomes are attributable to both exogenous factors and to inflexibility in the market and high unemployment among women.
The Bank CASs had few employment and earnings objectives, but the Bank engaged heavily in all areas of the MILES framework.
The Bank made significant contributions to financial sector reforms and improved economic performance.
Analytic work on labor market issues was of high quality and identified clear reform priorities.

8
support, through its AAA, technical assistance, and lending operations, adapted to the government’s changing priorities and generally ad-dressed (or attempted to address) the most critical policy constraints
Table 2.1 Colombia: Ratings Summary
Outcomes Bank Contribution Bank Program Outcome Rating
Macroeconomy
Considerable gains in restoring fiscal and financial sector stability, to which the Bank contributed significantly. Key revenue and expenditure rigidities remain and are an obstacle to reforming the financing of social insurance and high payroll taxes.
Lending operations in the fiscal area overestimated what could be delivered, given political economy constraints. However, the Bank did assist in a major reversal in adverse fiscal trends, albeit through partial, “second best” reforms. The Bank contributed significantly to improving tax administration and restructuring the financial sector.
Moderately satisfactory1
Investment climate
Private investment recovered after 2000. Streamlining of administrative procedures. Frameworks for private participation in infrastructure and quality standards were strengthened, albeit less than expected, as were frameworks for expansion of credit to underserved groups.
Operations supported improvements in competition, a strong domestic priority. Bank AAA and lending operations helped to catalyze a policy debate on how to push forward the competitiveness agenda. Satisfactory
Labor Regulations and Institutions
Increased flexibility for labor market contracts and moderate gains in the public training regime. However, no progress in addressing key obstacles of high non-wage costs and high minimum wages.
Bank AAA consistently and competently diagnosed key issues, but the Bank did not use its convening power aggressively to advance its policy proposals.2
Moderately satisfactory
Education Policies
Substantial gains in coverage, including in rural areas, with the Bank making significant contributions to innovative approaches to rural education and financing access of the poor to tertiary education. Although test scores in international assessments improved modestly between 2003 and 2006, these scores remain below-average.
Bank made significant contributions to innovative approaches to rural education and financing access of the poor to tertiary education.
Satisfactory
Social protection
Significant gains in coverage of social safety nets. However, longer-term financing of social protection (including health insurance) in a manner that does not impose an undue burden on formal sector remains a challenge
The Bank contributed importantly to improving the design and implementation of CCTs and to broadening the scope of health insurance for informal sector workers. More attention should have been paid to longer-term financing and sustainability from the outset.3
Satisfactory
Combined rating of MILES outcomes and of higher order outcomes (at right).
Outcomes during ten years ending in:
1997 2007
Moderately satisfactory
Slower (per capita) GDP growth (average)
2.0 1.4
Lower Poverty (eop) 52.7 45.0
Stable Employment Growth (average).
2.3 2.3
Higher Unemployment (eop) 9.8 10.7
Higher Adjusted (per capita) GNI Growth (average).
1.2 1.6
Note: AAA= analytic and advisory activities; CCT= conditional cash transfers; eop=end of period; GDP= gross domestic product; GNI= gross national income; MILES= Macroeconomic conditions, Investment climate and infrastructure, Labor market regulations and institutions, Education and skill development; and Social safety net.

9
(as reflected, for example, in investment surveys and econometric anal-ysis of constraints on productivity and employment).
In terms of effectiveness, the picture is more mixed. Much has been achieved: fiscal stability and financial sector soundness have been res-tored; the investment climate significantly improved; some greater flexibility was injected into labor contracts and training systems im-proved, even if weaknesses remain; and social safety nets have been widened. Although attribution is difficult, the evidence discussed in this chapter suggests that Bank activities made an important contribu-tion in all of these areas.
The main areas where little has been achieved concern the intercon-nected issues of high payroll costs and the financing of social insur-ance, which cannot be resolved without addressing the considerable remaining rigidities in the tax and expenditure systems that Bank-supported macroeconomic programs failed to remove. In this area, al-though the Bank-supported fiscal adjustment operations contributed importantly to the restoration of fiscal stability, they promised more than could be delivered to eliminate structural rigidities given politi-cal economy constraints. A summary of the ratings for overall out-comes and Bank performance is shown in Table 2.1.
This chapter summarizes the employment and earnings growth out-comes, the exogenous factors and policies with a bearing on those outcomes, the impact of those factors and policies on the outcomes, and the Bank’s support for the policies.
Growth, Employment, and Earnings Outcomes Table 2.2 provides key indicators of Colombia’s performance relating to growth, employment, and earnings. Colombia’s GDP growth from 1970 to 2007 averaged 4.0 percent but decelerated markedly, with ma-jor recessions in the early 1980s and late 1990s. The latter recession (1998-99) was especially severe, with real GDP contracting by 4.2 per-cent in 1999. Average annual per capita GDP growth declined from 2.0 percent during the 1988-97 decade to 1.5 percent during 1998-07, the period covered by this study. Long-term poverty trends show a substantial decline that was disrupted by the 1998-99 recession, but eventually resumed as growth recovered. Inequality also increased through the recession and then declined. However, unlike poverty, inequality does not show a net long-term decline.
Average growth rates of 4 percent over 1970-2007 were punctuated by major recessions in the early 1980s and late 1990s.

10
Table 2.2 Colombia: Key Economic Trends, 1970–2007
Indicator (percent, except wage index) 1970–1975
1976–1980
1980–1985
1986–1990
1991–1995
1996–2000
2001–2005
2006–2007
GDP growth (period average)1/ 5.7 5.4 2.2 4.9 4.1 0.9 3.4 7.2
Per Capita GDP Growth (period
average 1/ 3.2 3.0 0.1 2.9 2.2 -0.8 1.8 5.8
Poverty (Headcount Ratio) (end year) 1/ 48.6 46.2 51.7 50.3 47.9
Gini Coefficient (end year) 1/ 52.8 54.5 53.2 49.1 55.9 56.3 58.0 59.0
Labor Participation Rate (end year) 2/ 57.1 56.9 61.8 60.0 57.6
Employment-to-Population (end year) 3/ 52.8 52.3 51.5 53.3 52.1
Unemployment (end year) 4/ 7.6 8.1 16.7 11.2 10.7
Wage Index (Manufacturing) (end year) 5/ 89.8 109.6 130.1 133.7 136.5
Sources: See Appendix D. Colombia: Annex Tables 1/ Table D.1 2 / Table D.2 ; 3/ Table D.3 4/ Table D.5 5/ Table D.4 Note: GDP= gross domestic product.
Labor market outcomes are influenced by both policies and exogen-ous factors that determine the supply and demand for labor, interact-ing in complex ways to affect both wages and employment. For ex-ample, in Colombia it appears that a combination of influences--some stemming from domestic policies (e.g. tax policies favoring invest-ment and hence more capital-intensive production) and some from changes in the structure of global demand and technology—have in-creased the demand for skilled labor relative to unskilled labor. This combined with factors that have increased the supply of unskilled la-bor, especially in rural areas (e.g., increased female participation rates from poor households and the displacement of rural population by the armed conflict), has meant an increase in relative wages for skilled workers. This trend has coincided with the substantial segmenta-tion/informalization of Colombia’s labor markets—which most ana-lysts attribute in large part to specific domestic policies.
The participation rate rose by about 5 percentage points during the recession, but has declined steadily since then (see table 2.2). These changes largely reflect fluctuations in female participation caused by the interaction of two factors: (i) a long-term trend of structural in-crease in women’s participation in the labor force that is attributable to their rising educational levels, increases in the proportion of households headed by women, and declines in fertility rates (see Arango and Posada 2002); and (ii) a substantial cyclical component as women sought work during the recession to offset declining house-hold incomes. As a result, the female participation rate rose by a strik-ing 10 percentage points (to over 57percent) during 1995-2000 as large numbers of adult females, especially from poorer households, joined the labor force. The participation rate declined again in recent years as stronger growth reduced pressure on household incomes.

11
Unemployment outcomes mirrored the recession-recovery cycle in GDP growth. The unemployment rate rose sharply during the 1998-99 recession and was only slowly reversed. The rise in the unemploy-ment rate occurred primarily through an increase in the labor partici-pation rate driven by rising female labor participation, although a short-lived decline in the employment-to-population ratio was also a contributory factor. Annual employment growth averaged 2.7 per-cent during the review period (equal to employment growth during the prior decade) and the employment-to-population ratio declined briefly during the recession. It increased during the economic recov-ery and declined toward the end of the review period to about its original level in 1997.
Female unemployment rates were consistently higher than those of men. The female urban unemployment rate (in 7 major cities) reached a peak of 24.5 percent in 2000 and was still 14.5 percent in 2007. The unemployment rate fell as growth rebounded, with labor participa-tion rates declining slowly and the employment-to-population ratio recovering. Unemployment remained high for a number of years, not regaining its pre-recession levels until 2006-07.
Labor earnings reflect two contrasting trends: an increase in formal sector wages combined with a reduction in the relative size of formal sector employment and a decline in informal sector wages combined with an increase in informal sector employment.4 GNI and household survey data suggest that average incomes declined after 1997 and up to some point of the first half of the 2000, and then recovered after about 2003 (see Appendix D, Table D.4
Factors Underlying the Outcomes Exogenous Factors. The performance depicted above was influenced by both exogenous factors and policies determining growth as well as the supply and demand for labor, all interacting in complex ways to affect both wages and employment. Three key exogenous (non-policy) factors influenced Colombia’s economic and employment perfor-mance during the period reviewed:
The country’s security situation deteriorated toward the end of the Pastrana administration (1998-2002) and improved the-reafter.
After deteriorating in the late 1990s, Colombia’s terms of trade improved dramatically—rising by about 50 percent in the last five years as prices for oil, coffee, and other commodities boomed because of strong global growth.
Access to capital markets declined in the late 1990s following the Asian crisis, but increased in recent years.
Unemployment outcomes mirrored the growth cycle, with employment growth averaging 2.7 percent over the period. Unemployment rates were consistently higher for women. Earnings were influenced by increased formal sector wages offset by a reduction in the size of the formal sector and a decline in informal sector wages.

12
Policies. Partly in response to the above developments, Colombia made major progress over the 1998-2007 period in policies that affected economic performance and the labor market. Some problems have not been resolved, however, and new challenges have arisen. Appendix B presents detailed outcome indicators in 1998 and 2007, the two end years of this evaluation.
Policy progress and the remaining challenges are summarized as fol-lows.
Policy Achievements
After deteriorating at the end of the 1990s, macroeconomic stability was restored, with lower fiscal deficits and public debt, as well as a stronger financial sector.
Following stabilization, other policies influencing the invest-ment climate were greatly improved.
Some better flexibility was introduced into labor market con-tracts.
Coverage of primary and secondary education was expanded, and opportunities for access to tertiary education by the less well off were improved. However, improving the quality of education has been more difficult.
Social safety nets were expanded, most notably through the in-troduction and rapid expansion of conditional cash transfer (CCT) programs, linked to school attendance and health inter-ventions for children.
Remaining Challenges
Many fiscal rigidities remain (for example, the tax system is not sufficiently broad-based and widespread earmarking of expenditures continues).
High non-wage (payroll) charges interact with high minimum wages to constrain job growth in the formal sector.
An exit strategy for participants in the rapidly expanding CCT programs in a manner that maintains their fiscal sustainability and fosters good incentives for employment has not yet been designed.
The remaining challenges are closely interlinked, since reducing the heavy non-wage charges would require shifting the financing of so-cial insurance and other expenditures away from payroll taxation to-ward the general budget. This is not possible without further fiscal reform.
Colombia has made major progress in policies affecting economic performance and the labor market.
Some closely interlinked challenges remain.

13
Link of Outcomes to Exogenous Factors and Policies Colombia’s recession (Table 2.2) and poor total factor productivity (TFP) performance in the late 1990s should be attributed partly to dete-riorating external conditions, including reduced global growth and cur-tailed access to capital in Latin America. However, Colombia’s reces-sion was deeper than normal, with the first decline in the level of GDP in several decades. This was due, in part, to the poor investment cli-mate resulting from adverse security conditions and the weak fiscal performance and disruptions to the financial sector at the time. Con-versely, recovering growth after 2002 reflected better external condi-tions and an improved investment climate. These improvements were due to improved security and policy actions to facilitate the operation of businesses. Poverty and inequality trends mirror the cycle described above. These trends can ultimately be largely explained by the same exogenous and policy developments that determined the GDP reces-sion and recovery.
The path of labor market outcomes is also largely attributable to the factors behind the GDP cycle. In addition, the inflexibility of the labor market in response to a fall in demand, together with an increased supply because of higher, primarily female labor force participation, caused a doubling of urban unemployment to about 20 percent in 2000. Female unemployment rates were consistently higher than those of men. The unemployment rate declined as growth rebounded, but it remained high for a number of years, not regaining its pre-recession levels until 2006-07. It increased again more recently, possibly in re-sponse to the global economic crisis.
Trends in labor participation largely reflect changes in female partic-ipation, which had increased over a long period (since about 1970) as a result of increased education, an increased share of female heads of households, reduced fertility, and an increased average age of child-ren in households (Arango and Posada, 2005). During the period re-viewed, female participation increased further and then declined again as women sought to offset changes in the earnings of other household members. The employment-to-population ratio declined briefly because of the recession and then increased again as the econ-omy recovered.
However, the pace of employment growth in recent years did not match the acceleration in output growth. In particular, while formal employment has been facilitated by more flexible labor contracts, it was hampered by high minimum wages and payroll taxes. Without any downward wage flexibility, the formal market adjusted to the de-cline in labor demand during the recession through job losses; in con-trast, the self-employed market increased in size—absorbing about one-third of laid-off wage earners5—through large reductions in aver-
Labor market outcomes are attributable not only to the factors affecting the GDP cycle, but also to inflexibility in the labor market, as well as high unemployment among women.

14
age earnings Accordingly, Figure 2.1 shows that the ratio of salaried workers to self-employed workers declined as the ratio of salaries to self-employed earnings increased.
The Bank’s Strategy and Contribution Overall strategy, objectives, and political constraints. The Bank’s support for Colombia was aligned with the national development strategies of the Pastrana (1998–2002) and Uribe administrations (2002-2010). How-ever, this reflected flexibility in adapting the Bank’s program as cir-cumstances evolved. In practice, the role of the Country Assistance Strategy as a strategic planning instrument was limited for much of the period. The 1997 CAS was soon overtaken by the 1998-99 crisis. The 2002 CAS was prepared based on discussions with the incoming Uribe administration, but was finalized six months before the government’s own National Development Plan. Differences in approaches between the two meant that the Bank’s program had to be adapted to keep it aligned with the government’s strategy. The judgment of the 2008 re-view of the CAS Completion Report was that “the scope of the CAS was very large and (at least in hindsight) overly ambitious. The Bank committed itself to deliver on some reforms which ended up having no government buy-in or not being its priorities or not being realistic giv-en the country’s political economy. As a result, these reforms and re-lated Bank support foreseen in the CAS did not materialize….”6 These conclusions were supported by the views of a number of interviewees for this evaluation, who said that the Bank had adapted well to the government’s strategy and objectives. However, the CASs had not played a central role in setting priorities for Bank activities.
The Bank’s support was aligned with Colombia’s development strategies, adapting to several governmental administrations.

15
The CASs contained few explicit objectives for employment and earn-ings against which the overall effectiveness of Bank support in this dimension can be judged. The only employment-related quantitative objectives mentioned are: (i) in the 1999 CAS Progress Report, the training of 60,000 youths for the job market (achieved) and creating 80,000 jobs through labor-intensive public works (not achieved) and, (ii) in the 2002 CAS, reducing by half the gap between female and male unemployment rates (no reduction achieved).
Throughout the evaluation period, the Bank was heavily engaged in all areas of the MILES framework, although that framework was nev-er used in the various CAS papers. However, the relative emphasis changed over time. Following the 1998-99 crisis, the Bank supported the government’s macroeconomic stabilization efforts through a series of adjustment loans focused on the fiscal and financial sectors. It also pioneered approaches to using conditional cash transfers to streng-then the social safety net. Since 2002, reflecting the government’s priorities and concerns that the ongoing economic recovery was slow to yield better employment and social outcomes, there has been a greater emphasis on improving competitiveness (through the invest-ment climate and labor market reforms), and on improving the social risk management system.
Three general points about the Bank’s contribution emerged from the interviews. First, almost all interviewees characterized the relation-
Figure 2.1: Evolution of Relative Formal/Informal Sector Sizes and Wages and
Salaried/Self-employment, 1984–2006
Source: World Bank estimates from Household Surveys. See also Mondragon-Velez et. al. (2009). The smooth lines are included to depict the trends in relative employment (-------------) and relative wages(- - - -).
The CASs had few employment and earnings objectives, but the Bank engaged heavily in all areas of the MILES framework.
Relations between the Bank and the Colombia were excellent, but many observers thought that the Bank had been too timid on some politically sensitive matters.

16
ship between the Bank and Colombia as excellent. The quality of the Bank’s policy analysis was judged to be high and the practice (fol-lowed frequently but not always) of involving Colombia-based re-searchers had helped to ground the analysis in country-specific reali-ties. Second, the custom of preparing a set of “policy notes” on key issues for each new government has had an important impact on the domestic policy debate. Third, despite this very positive overall view, many (but not all) of those interviewed in Colombia thought that the Bank had been “too timid” in advancing its views on some critical, but politically sensitive, matters—most notably the interlinked issues of high payroll charges, the financing of social safety nets, and incen-tives for formal sector employment.
Bank assistance and interventions. Discussion of the Bank’s contribution is organized around each component of the MILES framework. Ap-pendix C provides details of major loan operations with substantial MILES components, together with any available IEG assessments of outcomes and Bank performance.
Macroeconomic policy. Helping Colombia restore fiscal and financial sector stability was a central element of the Bank’s strategy from 1999 onward. The key vehicles for this purpose were seven structural ad-justment and development policy loans approved between FY2000 and FY2005.
The outcomes of the four loans to support fiscal and institutional reform, negotiated in close collaboration with the International Mone-tary Fund (IMF),7 collectively fell well short of target, both in the overall magnitude of fiscal adjustment and progress in addressing the key rigidities. Nevertheless, although the outcome was messy—with many “second best” solutions to the institutional challenges (such as the arrangements for transfers to sub-national governments) and the eventual fiscal adjustment aided by stronger growth and higher oil prices—the result was still a major reversal in an unsustainable trend for Colombia’s fiscal deficit and public debt. The Bank contributed to this turnaround, even if the outcome was not fully satisfactory. Key messages are:
The loan targets overpromised the amount of fiscal adjustment that could be delivered, especially in the early years, given the political constraints on the government.
The Bank’s response to the Executive branch of government’s difficulties in moving its proposals through Congress was of-ten to set ever finer loan benchmarks on stages of processing the reform packages. This was not effective.
Nevertheless, Bank support did have a significant positive im-pact. For example, its technical support for strengthening of
Outcomes relating to fiscal and institutional reform fell short of targets.

17
tax administration was identified by many interviewees, in-cluding IMF staff, as a critical contribution.
The main unmet challenge is how to finance social insur-ance/protection in a manner that will not hamper strong em-ployment growth. The Bank’s AAA has clearly identified the problem, but has not been successful so far in helping the gov-ernment to address it.
The Bank has been heavily involved in supporting Colombia’s finan-cial sector reforms through an initial financial sector adjustment op-eration undertaken at the height of the banking crisis and two subse-quent programmatic loans. It has also provided critical diagnostic inputs, including a 2004 report on the supervision of financial con-glomerates. More recent reforms, including preparation of a new in-solvency law, have been supported under the series of Business Prod-uctivity and Efficiency development policy loans (DPLs).
Interviews with officials confirmed the judgment of earlier IEG as-sessments (IEG 2008) that the Bank had made significant contribu-tions in the following areas: (i) completing the clean-up of the bank-ing system, including the upgrading of mechanisms for bank resolution and the disposal of assets; (ii) the design and implementa-tion of strengthened banking regulation; (iii) reforms to strengthen the housing finance market which had been severely weakened by the 1998-99 crisis; and (iv) reforms to strengthen the institutional frame-work of capital markets. The first two reforms contributed to the im-proved outcomes for the financial health of the banking system. In-terviewees generally agreed that two types of inputs from the Bank had been especially useful. First, the Bank’s influence on the policy debate through its convening power had been high (for example, it had helped to initiate the process of formulating the financial sector reform law now in Congress, through a series of high-level seminars with policy makers and outside experts). Second, it had contributed specialized technical knowledge to help the authorities draft laws and regulations following the broad direction set by the government.
The components of the Bank’s operations aimed at improving finan-cial soundness have had more success in terms of identifiable out-comes than those aimed at financial deepening. Regarding the latter, the institutional frameworks have been strengthened (for example, for mortgage finance and through a new Securities Law), but the out-comes so far have been mixed. For example, housing credit still re-mains low almost a decade after the crisis. Two important constraints to financial deepening could not be addressed comprehensively pri-marily because of political economy reasons. The financial transac-tions tax remains a significant obstacle to efficient financial intermedi-ation and interest rate caps have crowded some borrowers out of the
The Bank made significant contributions to financial sector reforms.
Operations aimed at improving financial soundness were more successful than those aimed at financial deepening.

18
formal financial system. However, the Bank’s operations have contri-buted to some improvements at the margin.
Investment climate. The Bank’s support for actions to improve the business environment increased substantially in the past 4-5 years as competitiveness became a greater priority for the government. Ana-lytical work undertaken jointly with the government, most notably the 2005 Country Economic Memorandum (CEM) on Competitive-ness, but also AAA that analyzed impediments in particular sectors, provided the basis for a series of three Business Productivity and Effi-ciency DPLs.
Although it is too early to assess the outcomes of some of these activi-ties, the evidence suggests that the Bank support was focused on is-sues that were most critical to economic performance and made sig-nificant contributions on a number of issues:
The reforms supported by the loans addressed many of the most critical constraints identified in investment climate sur-veys and in econometric analysis of firm-level productivity. The only variable with a sizable influence on productivity not addressed was the degree of labor informality.
A major streamlining of administrative procedures affecting business activities and foreign trade was implemented during 2005-07. These reforms were high on the government’s agen-da, so they cannot be attributed specifically to the Bank’s op-erations. Nevertheless, officials said the Bank had played a catalytic role through its lending and the Doing Business rank-ings. Its detailed studies on particular issues (administrative procedures for doing business, intellectual property regula-tions, foreign trade procedures) also had a substantial influ-ence on the changes implemented.
Many interviewees said that the 2007 Bank report on regional competitiveness8 had a major effect on the domestic policy de-bate on how to push forward the competitiveness agenda. Many officials flagged this as an example of the kind of inno-vative, fast-response analytical work—tailored to Colombia’s specific circumstances—that is wanted from the Bank.
The business productivity DPLs supported regulatory changes to strengthen private participation in the provision of infra-structure. Interviewees said these inputs had helped to im-prove the framework, but that problems still existed with the public/private concession contracts in some areas, most nota-bly for roads. The Bank had provided policy advice on the is-sues, but some thought it could have been more proactive.
Some interviewees in the Bank noted that some of the more ambitious agenda items set out in the first business productivi-
The Bank focused on investment climate issues critical to economic performance and made significant contributions.

19
ty DPL in 2005 had been scaled back in the subsequent loans as the government lost momentum in pushing its reforms through Congress.
Labor market policies. The Bank has undertaken a wide range of analyti-cal work on Colombia’s labor market, most notably an assessment of the links between labor market outcomes and poverty (The World Bank, 2002a); and the 2005 report on Labor Market Adjustment, Reform and Productivity (2005a), which analyzed factors underlying labor mar-ket segmentation. Currently, the Bank is providing advice on income generation, including active labor market policies. Lending operations with significant direct labor market components included the FY02 Community Works project, which supported the Empleo en Accion pro-gram, the FY03 Social Sector Structural Adjustment Loan (SAL), and three programmatic loans supporting labor reform and social devel-opment policy (Programmatic Loan Supporting Labor Reform and So-cial Development Policy (PLaSSALs); see Appendix C).
The review of the documentary record and interviews in Colombia and with Bank staff suggest the following messages:
The Bank’s analyses of labor market issues were of high quali-ty and provided convincing, evidence-based analysis. They were conducted in close collaboration with Colombian re-searchers and focused on key elements of the domestic policy debate, as well as identifying a short list of clear reform priori-ties. The AAA outputs gave a clear message about the impor-tance of easing the disincentives to formal sector employment caused by high minimum wages and high non-wage charges, as well as emphasizing the close links with reform of social in-surance.
Although there was widespread praise for the quality of the Bank’s analysis, many of those interviewed in Colombia thought the Bank had been too timid in pressing the implica-tions of its analysis in the broader policy debate.
The impact of the Bank’s support on the 2002 labor reforms is not clear. Its most significant, indirect contribution was prob-ably through the influence of its analysis on the domestic poli-cy debate, beginning many years before the reforms were eventually implemented. The PLaSSALs probably had little ef-fect on the reform, which was approved by Congress well be-fore the first of the loans was negotiated. Rather, the main contributions of these loans in the area of labor market policies was in implementing some aspects of the law, especially im-provements in the training system and in fostering a few use-ful changes at the margin to the social insurance system that
Analytic work on labor market issueswas of high quality, and identified a short list of clear reform priorities.

20
helped reduce disincentives to employment even though they did not address the central obstacles noted earlier.
Bank support for a range of government pilot schemes to boost employment of vulnerable groups in the years following the recession were unsuccessful. For example, a community works project to provide temporary employment to poor workers had high costs per job created and low ratios of in-come transferred to the poor. In another case, tax waivers and temporary wage subsidies for hiring hard-to-employ groups had very low uptake.
Looking ahead, interviewees said the Bank’s main inputs on labor market policies in the next few years should cover two areas (although considerable differences of view existed on their relative importance). The first was a sustained effort to use the Bank’s policy analysis and convening power to influence the policy debate on the central issues of high payroll taxes and the minimum wage. (Many of those interviewed said that, without progress on these issues, other policy actions would yield limited gains. In contrast, a few thought the Bank had already said all it could on the issue). The second area was to draw on its inter-national experience to bring fresh ideas on how to promote better qual-ity employment and wage growth in the informal sector. This should include further analysis of how to refine social protection policies to decrease disincentives to employment and to strengthen the links with human capital development to make recipients more productive and employable.
Education and training. The Bank’s assistance in education involved a combination of policy and investment lending as well as AAA that ad-dressed specific issues. Other policy loans, notably the PLaSSALs, in-cluded a significant education component. The Bank also conducted a review of public training reform issues (the role of Servicio Nacional de Apprendizaje (SENA) in 2004, but—at the government’s request—the report was never finalized or made public. The Bank’s strategy was to support the government’s agenda of expanding coverage and improv-ing the quality of basic and secondary education. These goals were rec-ognized as key to improving competitiveness and growth, although no explicit link was made to employment objectives. It is difficult to identi-fy the specific impact of Bank operations on overall outcomes, but the following points are worth noting:
Targets for the expansion of primary and secondary enroll-ment were met or exceeded. Total net enrollment increased from 7.8 million in 2002 to 9.2 million in 2007, in line with the target under the PLaSSALs. Bank support for policy reforms helped to generate efficiency gains and improve incentives to local authorities to enroll students.
Future efforts should focus on high payroll taxes and the minimum wage, and bring fresh ideas on promoting better quality employment and wage growth in the informal sector.

21
Bank technical and financial support helped the government introduce a number of initiatives to improve quality, including teacher quality testing mechanisms and systematic student testing. However, student performance on recent international assessments was below average.
Many interviewees in Colombia said that the Bank’s Rural Education project had played a major catalytic role in helping the authorities reform its approach to delivering education services in poor, hard-to-reach rural communities. The Bank’s technical and financial support for innovative curriculum me-thodologies was especially influential.
The Bank contribution most frequently mentioned by inter-viewees was the higher education project, ACCES (Acceso con Calidad a la Educacion Superior). It provided financial resources and technical assistance to develop a student loan scheme ad-dressing the problems of demand for formal education. It is estimated to have increased access to tertiary education by 30 percent, especially among lower-income students.
In the area of non-formal training, the Bank contributed signif-icantly to what was only a “partial” success. SENA used to be a virtual monopoly, with high unit costs and output not well suited to private sector employment needs. Substantial head-way has been made in some areas (such as a quadrupling of graduates from SENA training courses, lower costs of training, and progress toward a national framework for defining train-ing standards and needs). However, although private sector training groups have been allowed entry, there are still prob-lems in matching training to private sector needs. SENA con-tinues to play the triple role of financier, provider, and regula-tor of training. Nonetheless, a number of officials said less progress would have been made without Bank involvement. For example, the benchmarks in the PLaSSALs helped to cata-lyze progress, even if less than originally expected.
Social protection. The Bank’s AAA work concerning social protection is-sues included a Social Safety Net Assessment (2002a), and the Poverty Re-port (2002b). Key lending included the FY01 Human Capital Protection project, which supported the introduction of the Familias en Accion condi-tional cash transfer program and three subsequent social sector opera-tions that provided additional financing. In addition, the three PLaSSALs heavily emphasized actions to strengthen Colombia’s social risk man-agement system and improve health insurance coverage for the poor.
The evidence suggests that the Bank has made a major contribution to the government’s efforts to expand the coverage and improve the effi-ciency of its social safety net. However, it needs to do more to help ad-dress issues of long-term fiscal sustainability.9
Targets for expansion of primary and secondary enrollment were met or exceeded, but success in the area of non-formal training was only partial.
The Bank has made a major contribution to efforts to expand coverage and improve the efficiency of the safety net.

22
The Bank was one of the principal catalysts behind the introduction of the Familias en Accion CCT program in 2000. The Bank and the Inter-American Development Bank (IADB) have been the main sources of program financing since its inception.10 Interviewees in Colombia at-tributed to the Bank significant improvements in the program’s initial design (including targeting and administration) through an effective mixture of AAA, lending, and close technical collaboration. They also said that the Bank had pressed for a strong monitoring and evaluation system.
Evaluation results showed a significant impact on nutritional health status as well as school attendance in rural areas, with much smaller effects in urban areas. Nevertheless, the government took a political decision to expand the program in urban areas. In light of this rapid expansion, many interviewees said the Bank should have given more emphasis to helping Colombia manage the challenges of sustaining the program efficiently, with suitable exit policies for participants.

23
Chapter 3 Tunisia
Introduction
Tunisia’s economic performance during the review period was im-pressive. Of the three countries reviewed in this report, Tunisia had the highest GDP growth rate, which contributed to its sustained record of poverty reduction. Yet, despite this impressive perfor-mance, Tunisia’s high rate of unemployment of over 14 percent was a major continuing challenge. A particular cause for concern is the fact that more than 20 percent of highly educated young people are unem-ployed. The economy is creating between 75,000 and 80,000 jobs per year and producing about 70,000 university graduates. This means that, unless the demand for skilled labor can be dramatically increased, or an outlet found for this skilled labor in other countries, unemployment could grow further.
The underlying causes of persistent high unemployment are many and complex. Tunisia’s rate of growth is insufficient to absorb the surplus supply of labor. Achieving higher growth is impeded by weak national private investment performance. Investment is under-mined by deficiencies in the business environment. Labor market in-stitutions and regulations impede job creation in the formal sector. There is an incongruity between the skills supplied by the tertiary education system and the demands of the labor market, and current social protection policies do not sufficiently encourage labor mobility and enterprise restructuring. There is, as yet, no coherent strategy for increasing employment that simultaneously embraces all of the key factors behind employment creation.
In general, the Bank is well regarded in Tunisia. Using a wide range of instruments, both lending and analytical, it has demonstrated itself to be a useful and relevant partner to the country in meeting its de-velopment aspirations. National priorities, expressed in a series of five-year development plans, have found both resonance and support in the Bank’s strategy for the country and in its operations.
Throughout the period, the Bank engaged in all five pillars of the MILES framework, though there have been important differences of
Evaluation Essentials Though growth averaged
5 percent during the 1997-2007period, unemployment was persistently high, particularly among women and highly educated young people.
Growth and stability have helped to spur a modest rise in incomes at the low end of the distribution, contributing to poverty reduction.
The Bank’s strategies have reflected mounting government concern about employment.
Analytic work contributed to financial sector reforms and helped narrow the gap between the onshore and offshore economies.
Unfinished reforms have resulted in a disappointing private investment response.
Labor market policies have been addressed in programmatic AAA, but the advisory work has had very little influence so far.

24
emphasis. By far the most significant intervention targeted banking and the investment climate. Lending covering these two areas and
Table 3.1 Tunisia: Ratings Summary
Outcomes Bank Contribution Rating
Macroeconomy
Fiscal stability achieved before 1998 and sustained throughout the review period. Basically sound macroeconomic framework with less than 3 percent deficit sustained. Considerable achievements in opening economy to international competition. Shortfalls in reducing non-performing loans of banking system.
Bank contribution marginal but positive on fiscal front. Bank support significant in supporting trade liberalization and facilitation. Medium-term chal-lenges include reducing subsidies and addressing expenditure rigidities.
Satisfactory
Investment climate
Private investment remains low despite a wide range of policies and actions with substantial Bank and AAA support. This is partly due to weaknesses in the public sector accountability component of governance. Reform agenda in most areas unfinished. Key governance issues in onshore economy still to be tackled. Reduced discrimination against onshore economy. Opened information and communications technologies (ITC) sector. Impetus of infrastructure privatization waned.
Substantial Bank lending and AAA support. Inter-ventions are of high technical quality and in most cases well appreciated by the authorities. Signifi-cant breakthroughs in trade facilitation and im-provements to business climate. Main outstanding issues relate to governance, a very difficult area to tackle. Satisfactory
Labor market
Little progress in addressing high minimum wages and labor market rigidities impeding formal sector job creation especially for highly educated young. Most active labor market policies of limited effectiveness and fiscally expensive.
Bank AAA consistently diagnosed key issues but efforts to formulate agreed employment strategy lost momentum. Persistent gender issues in labor market performance require analysis.
Moderately satisfactory
Education
Near universal primary coverage and literacy for both genders. Improvements in vocational training and rapid expansion in tertiary education. Primary and secondary quality issues being addressed. Key challenges remain in the tertiary sub-sector, which is failing to meet requirements of rapidly increasing graduate population and labor market. Potential for outward migration of educated labor and policy implications require analysis.
Long-term support has been critical in achieving near-universal primary and high secondary cover-age for both genders. The focus on quality im-provement at primary and secondary levels is appropriate. Diagnostic AAA on tertiary has been useful.
Satisfactory
Social protection
Substantial coverage of pensions, health care and direct subsidies for low income households. Bank analytical contribution to social security reform. Lack of unemployment insurance contributes to labor market rigidities.
Satisfactory
Combined rating of MILES outcomes and of higher order outcomes at right.
Moderately satisfactory
Outcomes during ten years ending in:
1997 2007
Satisfactory
Faster per capita GDP growth (average)
2.3 3.9
Lower Poverty (eop) 6.2 3.8 Stable Employment Growth (average)
2.7 2.7
Lower Unemployment (eop) 15.9 14.1 Higher Adj. per capita GNI Growth (average)
2.4 4.3
Note: AAA= analytic and advisory services; eop=end of period; GDP= gross domestic product; GNI= gross national income; ICT= information and communications technology: MILES= Macroeconomic conditions, Investment climate and infrastructure, Labor market regulations and institutions, Education and skill development; and Social safety net.

25
underpinned by a substantial body of analytical work, has totaled nearly three times as much as that of the other four pillars combined. While the Bank’s programs were largely successful, its efforts failed in a number of areas, including the development of more effective di-alogue on public governance issues that affect investment. So too, its good diagnostic work on labor market policies could have had a stronger impact. In addition, Bank support could have had a better impact on education expenditures to improve education quality, par-ticularly of higher education.
Table 3.1 summarizes the main factors considered in this assessment of Bank support for employment creation and earnings growth as well as the corresponding ratings. As a whole, the Bank’s strategy and inter-ventions were highly relevant in addressing Tunisia’s key employ-ment and earnings-related issues. Results, however, have been mixed. In macroeconomic policy, the Bank’s role has been positive but mar-ginal on the fiscal front. Trade liberalization and facilitation have be-nefited from both AAA and lending. Regarding the investment cli-mate, although considerable progress has been achieved in specific policy areas, the reform agenda is far from complete, and private in-vestment has not yet convincingly responded.
Until now, the Bank has had little impact on policies governing the institutions and operations of the labor market. Despite six years of programmatic analytical work and technical assistance, the govern-ment has not adopted any of the Bank’s key policy recommendations. With respect to education, a great deal has been achieved at the pri-mary and secondary levels, and the Bank has played a major role in this. The impact on policy has been more muted at the tertiary level where, once again, there is less than full agreement on some key poli-cy issues.
This chapter summarizes the employment and earnings growth out-comes, the exogenous factors and policies with a bearing on those outcomes, the impact of those factors and policies on the outcomes, and the role of the Bank’s support for the policies.
Growth, Employment, and Earnings Outcomes Viewed from a long-term perspective, Tunisia’s real per capita in-comes have nearly quadrupled since independence in 1954. Tunisia’s GDP growth averaged 5.1 from 1970 to 2007, decelerating through the late 1980s and accelerating during the first half of the 1990s. The aver-age GDP growth rate increased from 4.1 percent during 1987-97 to 5.0 percent during 1997-2007, with the acceleration of growth taking place in 1996, just before the beginning of the period under review.
GDP growth averaged 5 percent during 1997-2007, outpacing the preceding two decades.

26
The 1997-2007 growth was faster than growth in the previous two decades (4.6 percent and 4.1 percent), but less rapid than during 1967-77. Average annual per capita GDP growth increased from 2.3 per-cent during the 1988-97 decade to 3.9 percent during 1998-2007. The headcount poverty ratio, which had already fallen to about 6.2 per-cent by 1995, declined further to 3.8 by 2005.1 Income inequality de-clined in the late 1990s and increased thereafter through 2000, the last year for which data are available.
Annual employment growth in Tunisia averaged 2.7 percent during the review period (equal to employment growth during the prior dec-ade) and the employment-to-population ratio increased by about 2.1 percentage points, the result of a 1.5 percentage point increase in par-ticipation and a 1.9 percentage point decline in unemployment. These changes do not reflect any strong long-term trends. Indeed, there has been no discernable trend in both the labor participation rate and the employment-to-population ratio since 1984, the first year for which statistics are available.
There is very little data regarding earnings. Formal sector wages in-creased during the period, as well as income in general, as indicated by GNI data. There is no information on informal sector wages.
Factors Underlying the Outcomes Since 1999, Tunisia’s performance has been influenced by both ex-ogenous (non-policy) factors and by policies. These have interacted in complex ways to affect outcomes, including growth, poverty, em-ployment, and wages.
Exogenous Factors. The main exogenous phenomena have been:
Strong external economic growth in the main destination countries for Tunisian exports.
Increasing international competition for Tunisia’s main ex-port products, especially textiles, following the ending of the Multi-Fiber Arrangement and the enlargement of the EU.
Avoidance of direct participation in Middle East conflicts. Vulnerability to political turbulence in the region, particu-
larly after the events of September 11, 2001. Susceptibility of the agricultural sector to periodic drough-
ts (four consecutive droughts during 1999-02) Demographic transition, leading to high growth of the la-
bor force and especially of the expected number of gra-duates from the secondary schools and the universities.
Employment growth averaged 2.7 percent, but there has been no discernable trend in participation and employment since 1984.
Exogenous factors include economic growth in export destination countries, competition for exports, and a demographic transition leading to higher growth in the labor force.

27
Policies. At the same time, the authorities have carried out a wide range of policies affecting economic and employment performance. Policy progress and remaining challenges are summarized as follows:
Policy Achievements
Sustained macroeconomic stability. Continued trade openness, particularly under the EU-Tunisia
Association Agreement, signed in 1995. Continued foreign investment openness, particularly with the
establishment of the offshore economy from 1972 and the modified investment code in 1992.
A strong defense and promotion of women’s rights. Implementation of active labor market policies, including
wage subsidies, training schemes and other forms of assis-tance.
Substantial investment in education since the 1970s which has led to greatly increased enrollment rates.
Some improvements in the business climate.
Remaining Challenges
Tunisia currently faces increased fiscal pressures. Private investment performance remains weak. Many of the ways in which the labor market is governed, and
the nature of labor laws and institutions, impede or fail to en-courage job creation in the formal sector.
Tunisia’s higher education system is currently failing to cater to the needs either of its clients (that is, the graduates) or of the economy as a whole, a factor that may have an adverse impact on investment.
Current social protection policies, particularly the absence of an unemployment insurance system, do not provide adequate income protection to workers.
Link of Outcomes to Exogenous Factors and Policies Acceleration of Tunisia’s GDP growth rate, from 3.4 percent during 1986-95 to 5.1 during 1990-99, coincides with the structural adjust-ment program started in 1987. This program covered increased com-petition, financial sector liberalization, integration with the EU, public enterprise reform, and privatization of certain sectors. The increased stability of the growth rate has been another factor behind increased growth levels after 1995. This increased stability has been attributed to export diversification2 and declining inflation, the latter also achieved before 1998. Despite its satisfactory level, Tunisia’s GDP growth rate may well be less than its potential because private in-vestment levels have been considerably below those attained by other
Policy achievements include macroeconomic stability, openness to trade and foreign investment, and promotion of women’s rights.
Challenges remain in all of the MILES framework areas.
Acceleration of the growth rate from 1986-1995 coincided with the structural adjustment program.

28
successful emerging countries. This could possibly be due to defi-ciencies in the investment climate.
Table 3.2 Tunisia: Key Economic Trends, 1970–2007
Indicator (percent, except Formal Wage Index) 1970–75
1976– 80 1980–85 1986–90 1991–95
1996–2000
2001–05 2006–07
GDP growth period average. 1/ 7.9 6.3 4.2 3.0 3.9 5.6 4.4 5.9 Per Capita GDP Growth period average 1/ 6.5 3.6 1.5 0.6 1.9 4.2 3.4 4.9 Poverty (Headcount Ratio), end year 1/ 22.0 12.9 7.7 6.7 6.2 4.2 3.8 Gini Coefficient, end year 1/ 44.0 43.4 40.2 41.7 39.8 40.0 Employment Growth period average 6/ 3.0 3.1 2.6 2.8 2.6 2.8 2.6 Labor Participation end year 2/ 47.6 46.1 45.3 45.3 46.3 46.8 Employment-to-Population, end year 3// 39.8 38.8 38.1 38.1 39.7 40.2 Unemployment end year 4/ 14.0 12.8 16.43 15.9 15.8 15.7 14.2 14.1 Formal Wage Index, end year 5/ 103.7 100.0 110.9 114.2 Unemployment, end year (Higher Education) 4/ 2.3 5.0 3.8 8.6 14.8 19.0 Sources: See Appendix H, Tunisia: Annex Tables: 1/ Table H.1 2/ Table H.2 3/ Table H.3 4/ Table H.5 ; 5/ Table H.4 6/ Tunisia, National Institute of Statistics.
Still, growth and its stability have been the major drivers of poverty reduction, as measured by growth-incidence curves that have been pro-poor (with the exception of the 1990-95 period). The modest rise in employment and increased productivity and wages, supported by investment in human and physical capital, may explain rising in-comes at the low end of the income distribution. Increases in em-ployment resulted from increased demand driven by GDP growth in a rather predictable way. The employment elasticity of growth has been around 0.4 for many years, a level consistent with positive labor productivity and employment growth, and above average in an inter-national comparison for 1999-2003 (see Kapsos 2005, p. 4). Although female employment has increased in recent years, its level remains constrained by the diverse set of factors.
However, despite Tunisia’s satisfactory rates of economic growth, its unemployment rate, at 14 percent, remains high by international standards. Indeed, the unemployment rate has been persistently high and fairly constant over a long period. This persistency appears to oc-cur because investment-driven increases in productivity that appear to lower unemployment and raise real wages are offset by exogenous real wage shocks (for example, minimum wages) that lead to increas-es in unemployment.3 In addition, a demographic bunching of labor force growth and high growth of university graduates due to a signif-icant expansion of universities has also put pressure on the unem-ployment rate, particularly at high skill levels.
Disaggregation helps explain the performance of unemployment. Un-employment rates vary by level of schooling, from 5.9 percent for the
Growth and its stability have helped to modestly raise incomes at the low end of the distribution, contributing to poverty reduction.
Unemployment remains high by international standards.

29
illiterate level to 19 percent for those with post secondary and by gender, with widening differences over time. The unemployment rate for university graduates more than doubled from 8.6 percent in 1999 to 19.0 percent in 2007. There are now over 100,000 unemployed people with tertiary education qualifications. Due to the significant expansion of universities, and rapid increase in the number of sec-ondary students obtaining a Baccalaureate,4 a growing share of new entrants to the labor force will be university graduates. Already, some 70,000 students are graduating each year from the universities. With the 80,000 total jobs generated by the economy each year, graduate unemployment is rising rapidly. Evidence from a tracer study carried out by the Ministry of Education and supported by the Bank suggests that inadequate skills are another reason for the high unemployment rate among those with tertiary education.5
The gender dimension of participation, employment and unemploy-ment presents something of a puzzle. Despite Tunisia’s unswerving defense and support of women’s rights, the overall female labor par-ticipation rate has risen only slightly since 1999. At about 26 percent today, it remains far below that of men. Although it is somewhat higher than the average for the MENA region (though lower than Morocco, for instance) it is low by middle-income country standards. The survey of 2004 graduates also found significant gender differenc-es: 40 months after graduation, 71 percent of the men had found work compared with only 55 percent of the women.
Even in the informal sector, female participation is low compared with other countries.6 Five factors may explain this low participation. First, registered labor participation rates are considerably lower among rural than urban women. The level of education is lower and both the absolute and relative illiteracy rates are higher, hence there is a strong rural-urban divide. Second, the relatively weak maternity leave regulations and the limited coverage provided by the child care system may impede labor force participation by women. Third, re-strictive employment termination regulations, which protect primary workers (usually male and experienced) and those employed at the expense of those seeking employment, may also limit the demand for female workers. Fourth, women show a strong preference for public sector as opposed to private sector employment, and the expansion of the public sector has slowed markedly in recent years. Fifth, notwith-standing Tunisia’s progressive record, cultural factors may still play a role.
The Bank’s Strategy and Contribution Overall strategy, objectives, and political constraints. At least since the early 1990s, there has been a close correlation between Tunisia’s over-
Overall women’s labor participation rate has risen only slightly since 1999, though it remains low by middle-income country standards.
Unemployment rates vary by levels of schooling and by gender.

30
all development objectives and the Bank’s country strategy. The Bank’s strategic documents have often been used by the Tunisian au-thorities in the preparation of their plans, drawing on an extensive and in-depth policy dialogue.
The government’s mounting concern regarding the employment is-sue, dating roughly from the mid-1990s, has been reflected in the in-creasing attention given to the topic in the Bank’s strategic docu-ments. While the 1996 CAS made little reference to employment per se, the focus sharpened considerably in the 2000 CAS, and even more so in the 2004 CAS. The 2004 CAS stated that the “the first and most pressing challenge” facing Tunisia was to reduce unemployment. Added urgency stemmed from the evidence that an increasing pro-portion of the unemployed were highly educated. In order to meet this challenge, the CAS emphasized the second and fourth pillars of the MILES framework—improving the investment climate and re-forming the education system, especially the tertiary subsector. Sig-nificantly, the CAS also explicitly recognized the importance of the governance dimension—for the first time in a publicly available Bank document on Tunisia.
None of the CASs contains any quantitative performance or output indicators specifically related to the employment issue. , there are no qualitative indicators related to the reform of labor market institu-tions. Except for a number of quantitative and policy targets in the education sector, the detailed Results Framework, which is used to assess advances in the 2007 CAS Progress Report, is lacking em-ployment-related indicators against which the effectiveness of Bank interventions could be measured.
Bank Group Assistance and Interventions. The following discussion of the Bank’s contribution is organized around each component of the MILES framework. Appendix G gives details of major loan operations with substantial MILES components, together with available IEG assess-ments of outcomes and Bank performance.
Macroeconomic Policy. Tunisia’s principal external partner on the fiscal front is the IMF. The Bank’s focus has been on trade liberalization and facilitation, though it has supported improved fiscal management at the margin. There has been extensive analytical work on the challenges posed by the evolving external environment, and both AAA and lend-ing operations in trade promotion and facilitation. Two Export Devel-opment Loans totaling $72 million were more successful in furthering facilitation than promotion. Among the important achievements have been the modernization of the customs service, dramatic reductions in clearance delays for exports and imports, and simplification of trade documentation. However, there is no convincing evidence that in-struments chosen to promote exports were appropriate or that they had
Since the mid-1990s, the Bank’s strategic documents have reflected the government’s mounting concern over employment issues.
The Bank’s focus on macroeconomic policy has mainly been on trade liberalization and facilitation.

31
the desired effect. The very rapid expansion in manufactured exports is difficult to attribute to Bank intervention.
In reforming the financial sector, Bank interventions were based on high-quality diagnostic work, notably a 2002 FSAP, updated in 2006, and undertaken jointly with the IMF. There have been a number of important reforms—two publicly owned banks have been privatized, regulation and supervision have been strengthened, the Civil Code has been revised to facilitate loan recovery, and vulnerability indica-tors have improved. However, results were less satisfactory than the Bank had anticipated, and the dialogue was sometimes challenging. Even when acknowledging the need for reform, the government pre-ferred a considerably more gradual approach than that advocated by the Bank and the IMF. Moreover, not all the government’s policies or actions had the support of the Bank. The proliferation of public credit institutions, with their overlapping responsibilities, less than fully transparent criteria, and potential for crowding out the private sector, were not in accordance with Bank advice.
Investment Climate. The Bank has been very active in supporting investment climate improvements. Three policy-based loans (ECALs) were approved, and were underpinned by a substantial body of analyti-cal work. Results, however, have been mixed. Al-though considerable progress has been achieved in specific policy areas, the reform agenda is far from complete, and private investment has lagged below target (Table 3.3 Investors, especially Tunisian na-tionals, have not yet convincingly responded.
Bank support has been focused on the following policy areas:
The gap between the onshore and offshore economies has been narrowed by a series of measures including: (i) reduc-tions in the regulatory and administrative obstacles to starting and running a business in the onshore economy; (ii) reforming and simplifying the taxation regime to reduce the relative ad-vantages of offshore businesses; (iii) extending the simplifica-tion of customs procedures to onshore transactions; (iv) per-mitting offshore enterprises to sell up to 30 percent of their output in the local market; (v) widening the availability of ex-port promotion facilities to onshore firms; (vi) establishment of a one-stop window, publication of all administrative proce-
Table 3.3 Tunisia: Targets Established in the Fourth Economic Competitiveness Adjustment Loan (ECAL)
Investment growth
2004-2007
Onshore investment
Offshore investment
Target value +9.7% +37.9%
Actual value achieved +6.1% 17.7%
Source: Economic Competitiveness Adjustment Loans IV Implementation Completion Report (ICR) and ICR Review
High-quality diagnostic work contributed to financial sector reforms.
The lending program had a very strong focus on improving the investment climate.
Analytic work focused on narrowing the gap between the onshore and offshore economies.

32
dures, and commitment to a time frame with the user having the right to claim damages in the event of delay; (vii) reduc-tions in prior authorizations for foreign direct investment (FDI) in onshore activities; and (viii) substantial reductions in the legal capital requirements to start a business. Moreover, in December 2007, a new Economic Initiative Law was passed that aims to further simplify procedures, facilitate access to fi-nancing for small and medium enterprises (SMEs), and reduce the tax burden for onshore businesses. These accomplishments are the result of a productive policy dialogue in which the Bank has successfully brought to bear its international know-ledge and experience.
Unfair competition has been addressed through amendments to the Competition Law promulgated in 2006. It is too early to judge the effects of the new legislation, since businesses have not been surveyed since it came into effect.
The Bank has played an important role in transforming Tuni-sia’s Information and Communications Technology (ICT) sec-tor. Reforms were based on a sector strategy note formally de-livered in 2002, after more than two years of intense and productive dialogue. This was followed by a lending opera-tion. According to interview sources, the authorities were par-ticularly impressed by the technical excellence of the Bank team. The result was a decision to open the sector to private investment and to international competition. Issues yet to be addressed include the predominance of the still 65 percent state-owned Tunisia Telecom, limited collaboration between enterprises and universities, a weak and fragmented regulato-ry framework, and poor connectivity among small firms which are the basis of Tunisia’s industry.
The Bank has also played an important role in addressing in-frastructure bottlenecks. In addition to lending to finance in-frastructure improvements, the Bank helped to develop a legal and regulatory framework permitting private sector participa-tion in large-scale infrastructure investments (PPI). The AAA was of good quality. However, early government enthusiasm waned in the face of departmental rivalries. Although the gov-ernment agreed to adopt a strategy to encourage PPI, subse-quent progress has been limited.
The disappointing private investment response to business environ-ment reforms is due, first, to the unfinished reform agenda and, second, to prevailing weaknesses in economic governance. Although Tunisia is given relatively favorable ratings in many of the interna-tional investment climate indices, it does less well when indicators isolate the governance factor more precisely. Such indicators have been published every year since 2005 in the Bank’s “Economic Devel-
The Bank also helped transform the country’s information and communications technology sector, and addressed infrastructure bottlenecks.
An unfinished reform agenda for infrastructure has resulted in a disappointing private investment response.

33
opments and Prospects for the Middle East and North Africa (MENA) Region.” Although Tunisia is ranked in the top half of countries worldwide for Trade Policy, Business Climate, and Quality of Public Administration, it is ranked in the bottom quartile worldwide for cur-rent status and in the bottom half for progress made since 2000 re-garding Public Sector Accountability.
The Bank has approached this difficult issue through informal dialo-gue, where senior country and regional management engaged with the Authorities, and constructive criticism of some policies. The Bank also sharpened its analytical tools for measuring perceived compara-tive performance in the governance area. Finally, the Bank took firm action where it perceived governance issues in areas where it is di-rectly affected.7 It is hoped, that by such measures, the Bank’s reputa-tion in a difficult situation will be protected.
Labor Market Policies. The Bank has no lending program in Tunisia in the area of labor market institutions and regulation. Rather, it has re-lied on programmatic analytical and advisory assistance (PAAA), a multiyear program of studies, technical assistance,8 and capacity building. During the first stage, which ended in 2004, a major piece of diagnostic analytical work was completed covering all aspects of the demand for and supply of labor, as well as the functioning of the la-bor market. The program identified five areas for Bank assistance
Box 3.1 Tunisia: Areas of Support Under the Employment Programmatic Analytic and Advisory Assistance (PAAA)
1. Development of modeling tools to evaluate the employment im-pact of different sectoral growth patterns.
2. Survey of the business environment, including employment is-sues.
3. Diagnosis of the constraints in employment creation from the point of view of SMEs.
4. Improvement of labor market information and dissemination for both enterprises and households.
5. Evaluation of employment programs (ALMPs, including train-ing), and a review of policy options, based on international expe-rience, to improve the social protection system.
Source: 2004 Country Assistance Strategy and Mission Findings Note: ALMP= Active Labor Market Policies; PAAA= Programmatic Analytical and Advisory Assistance; SME= small and medium enterprise.

34
over the coming three years (Box 3.1 ). Work on these topics com-menced following the signing of a Memorandum of Understanding with the government. Based on this work, an integrated strategy for employment creation covering all dimensions of the MILES frame-work was to be developed. A Policy Note containing the outlines of such a strategy was completed in mid-2008.
Although the exercise started well and at the right strategic moment, the Bank’s PAAA has had almost no influence on labor market policies. The early momentum of the diagnostic phase has not been sustained. The 2008 Policy Note is of a high technical quality and contains detailed recommendations on all aspects of labor market policy, including the demand for and supply of labor. However, it is clear from the inter-views with Tunisian officials that the recommendations, and even the analysis, do not reflect a consensus within the government. The PAAA task team has changed composition and leadership a number of times since the outset of the program. The Tunisians perceive that the degree of engagement of the Bank—frequency and length of missions, depth of discussions—is insufficient given the complexities and sensitivities of the task. The question was raised as to whether the budgetary re-sources made available were still adequate. In these circumstances, it is unsurprising that the set of active labor market policies (ALMPs) put in place by the authorities have not, for the most part, evolved from the PAAA (indeed, they are contrary to the thrust of its recommenda-tions), and do not have the support of the Bank.
Education and Training. The Bank has had substantial involvement in Tunisia’s education system. Two Education Quality Improvement Loans ($99 million and $135 million) supported, respectively, the uni-versal completion of primary education and improved quality and school management at both primary and secondary levels. The second loan also aims to enhance vocational training, which is now the re-sponsibility of the Education Ministry.
Two further loans (of $80 million and $76 million) support reforms in the higher education subsector, including: increased access to, and enhanced quality of, higher education; greater autonomy in university management; greater market relevance of university study programs; development of a system of quality assurance; and a sustainable fi-nancial strategy with cost-sharing mechanisms and grants and loans for needy students. The projects draw upon a Higher Education Strat-egy Paper completed in 2004.
The Higher Education projects proceeded without full consensus be-tween the Bank and the authorities concerning reform. Notably, there was no agreement on financing and cost recovery reforms. It is, there-fore, not surprising that the extent of reform achieved is somewhat tentative. This has affected the Bank’s credibility in the Tunisian high-
The PAAA program has had very little influence on the labor market policies so far.
Substantial involvement in education focused on improving coverage and quality at all levels, including vocational training.
Programmatic analytical and advisory assistance has been the principal tool in addressing labor market policies.

35
er education subsector. Several independent interviewees (notably from the academic community) perceive the Bank’s interventions as being restricted to areas in which the government feels comfortable. The decision to proceed with the projects was made in order to keep the Bank’s “seat at the table” and to push forward the reform agenda, albeit more slowly than had been hoped.
Outward Migration. One policy option that has received little attention so far, but that would merit in-depth study, is encouraging outward migration as a source of employment for educated Tunisians. This would be especially relevant given the likelihood that the supply of skilled labor in the domestic market will exceed the demand for some years to come. Historically, outward migration from the Maghreb countries, including Tunisia, has been predominantly low-skilled. However, there may be an important potential for highly educated emigration to the Gulf States and, to a lesser extent, to Europe. Pre-viously, the Tunisian authorities considered skilled labor only in terms of domestic needs. Recently, there has been a change in focus. The Bank is preparing a preliminary report on the subject. A strategic approach would include: coherent and coordinated analysis of the migration; the implications for the education sector—which skills are likely to be needed, what type of certificate would be required, etc.; and the possibilities of financial assistance and contributions from re-ceiving countries, especially the Gulf States.
Social Protection. No action has been taken on the Bank’s recommen-dation to study the introduction of employment insurance with a view to encouraging greater labor mobility.
Future work may consider outward migration as a source of employment for educated Tunisians


37
Chapter 4 Turkey
Introduction The beginning of the period 1998-2007 saw a major change in Tur-key’s economic policies and an attendant change in the relations be-tween the World Bank and the Turkish government. A number of events spurred the change. These events were exogenous to the Bank, and included: (i) a persistent macroeconomic crisis that had eroded the political resistance to economic reform and given rise to the politi-cal will to proceed with reform; (ii) the emergence of a single party government that reinforced this political will; (iii) the earthquakes of 1999 that dramatized the Turkish government’s need for outside as-sistance, presenting an opportunity for the Bank and paving the way for a much closer and more productive Bank-government relation-ship; (iv) improved prospects for accession into the European Union, strengthening incentives to modernize the economy and body politic and to implement reforms to comply with EU standards and direc-tives in all the MILES categories; and (v) a favorable international economic environment over the 2001-07 period, consisting of expand-ing world markets and high commodity prices.
The role and support of the Bank have undergone a gradual change over the review period. In the early years, the Bank concentrated, ap-propriately and effectively, on macroeconomic stabilization and ac-companying structural reforms. In more recent years, greater atten-tion has been devoted to employment and competitiveness issues.
Within the scope of the MILES framework, the remaining problem areas are labor market regulations, education, and the investment climate. The role played by the Bank in reforming labor regulations, although perhaps a bit belated, has been relevant, effective, and even decisive. The Bank Group’s involvement on investment climate mat-ters has also been productive, especially in the early part of the period with active Foreign Investment Advisory Service (FIAS) participation. Overall, and in relation to employment generation and earnings growth, the Bank has pursued relevant objectives, which for the most part have been well aligned with the government’s program and gen-
Evaluation Essentials Growth during the 1997-
2007 period was unstable. However, per capita GDP increased and poverty likely declined, although the unemployment rate has increased.
The main constraints to employment generation and earnings growth are in education, labor market regulations, and the investment climate.
Bank support for macroeconomic and financial sector stabilization helped improve the investment climate.
Analytic work on the labor market was followed by lending operations to overhaul labor regulations.
Though the Bank has supported education for many years in Turkey, its role in the sector’s progress has been limited.
Important safety net features—pension reform and unemployment insurance—received effective Bank support.

38
eral development objectives. Moreover, seen as a whole over the five MILES categories, the Bank has been effective in pursuing such em-ployment-generating objectives. Table 4.1 presented below, summa-rizes the evaluation and provides the ratings.
Table 4.1 Turkey: Ratings Summary
Outcomes Bank Contribution Rating
Macro
Inflation was reduced from 85 percent in 1998 to 9 percent in 2007. Under the FY01 FSAL, the absence of a stable macroeconomic environment contributed to a banking crisis two months after loan approval. Later, major improvements occurred in the fiscal accounts and in strengthening the financial system. A major challenge remains in reducing the continuing external vulnerability, as evidenced by the high current account deficits (6 percent in 2007).
High-quality AAA prepared the Bank to provide support for government finances, agricultural subsidies and personnel outlays, taxes, social security, and SOEs, all critical structural areas in need of reform. Support initially failed to duly account for macroeconomic risks to the success of financial sector reforms. Satisfactory
Investment Climate
Private investment increased, but largely due to stabilization. Improved legal and regulatory treatment of FDI contributed to increased FDI net inflow from 0.4 percent of GDP in 1998 to over 3 percent by 2007). There were improvement s in some business transactions costs (for example, starting a new business), but little or no progress in others.
FIAS was especially effective in supporting improvements in FDI policy. High-quality AAA (ICA Report) generated private sector interest but was accompanied by a somewhat disappointing subsequent engagement, apart from some lending support, of the Bank with the government.
Moderately satisfactory
Labor Market Labor regulations were made more rigid and labor taxes increased.
Bank AAA consistently and competently diagnosed the key issues, and used its convening power to advance its policy proposals.
Moderately Satisfactory
Education
Important improvements were made in enrollments, coverage, and gender equality in the educational system. Major challenges remain in improving quality and in strengthening secondary education to better adapt it to changing labor force requirements.
The Bank’s role was largely ineffective and even marginal in relation to the recorded sector gains. The Bank’s AAA was of good quality. Moderately
unsatisfactory
Social Protection
Establishment of an unemployment insurance system and the initiation of a conditional cash transfer (CCT) system in 2001, which now reaches over 2.8 million children in poor households.
The Bank played an effective role through AAA and lend-ing support. Satisfactory
Combined rating of MILES outcomes and of higher order outcomes (at right)
Outcomes during ten years ending in: 1997 2007
Moderately satisfactory
Faster per capita GDP growth (average) 2.2 2.5
Lower Poverty (eop) 34.5 27.0
Lower Employment Growth (average). 1.9 0.8
Higher Unemployment (eop) 6.8 10.1
Stable Adj. per capita GNI Growth (average.)
2.5 3.2
Note: AAA= analytic and advisory activities; CCT= conditional cash transfer; eop=end of period; FDI= foreign direct investment; FIAS= Foreign Investment Advisory Service; FSAL= Financial Sector Adjustment Loan; FY= fiscal year; GDP= gross domestic product; GNI= gross national income; ICA= Investment Climate Assessment; MILES= Macroeconomic conditions, Investment Climate and infrastructure; Labor market regulations and institutions; Education and skill development; and Social safety net; SOE= state-owned enterprise.

39
This chapter summarizes the employment and earnings growth out-comes, the exogenous factors and policies with a bearing on those outcomes, the impact of those factors and policies on the outcomes, and the role of the Bank’s support for the policies.
Growth, Employment, and Earnings Outcomes Turkey’s average annual GDP growth rate from 1970 to 2007 was 4.5 percent, albeit with considerable instability, including recessions in 1980, 1994, 1999, and 2001. Growth became higher and more stable after 2002, and despite the 1999 and 2001 recessions. The average rate of growth declined from 4.3 percent during 1987-97 to 3.9 percent during the decade under review (1997-07) but annual per capita GDP increased from 2.2 percent during the 1988-97 decade to 2.5 percent during 1997-07.
Poverty most likely declined during this period. Between 1994 and 2002, the years for which comparable survey data are available, the proportion of the population with incomes beneath the national po-verty line declined from 28.3 percent to 27.0 percent.1 Additional in-formation, not fully comparable, suggests that the downward trend of the poverty headcount ratio continued (down to 18 percent in 2006). This decline was probably uneven, with likely temporary increases during the recession years. A slight increase in inequality is observed between 1994 and 2002. Although less comparable, GINI coefficient estimates show a further increase in inequality since 2002.
At the beginning of the period under review, the labor participation rate and the employment-to-population ratio continued to decline, as they had for many years before, with female employment rates much lower than men’s. The labor participation rate and the employment-to-population ratio stabilized after 2002. The unemployment rate in-creased markedly between 2000 and 2002 and remained high thereaf-ter, despite the recovery in GDP growth.
In 2007, the Turkish labor force participation rate was 51 percent of the 15-64 year old population. This was the lowest of any OECD country and compared poorly with the OECD average of 70.9 percent. With respect to female labor force participation, the comparison was more striking—26.6 percent for Turkey versus 61.1 percent for the OECD average, with Turkey having by far the lowest rate.2
Extensive labor earnings information is limited. An index for real la-bor compensation for the manufacturing sector indicates high real wage volatility and a decline in real average manufacturing wages since 1999. However, agricultural wages recovered after 2004 and broader household survey and GNI data (Appendix L, Table L.4 in-
Growth was unstable during the 1997-2007 period, but per capita GDP increased and poverty most likely declined.
While labor participation stabilized or increased after 2001, the employment-to-population ratio continued to decline; hence, the unemploy-ment rate increased despite GDP recovery.
Information on labor earnings is limited.

40
dicate that incomes and earnings declined sharply in 2001, but began to recover in 2002.
Factors Underlying the Outcomes Exogenous Factors. When attempting to assess the effects of policies on economic growth, employment, and earnings, it is important at the outset to identify the relevant exogenous economic factors that have had a bearing on Turkey’s economic performance. These factors have, on balance, been positive:
Robust (3.1 percent) world GDP growth during the period 1998-2007, as during the prior decade; and increased GDP growth in the Europe and Central Asia region from about -2.3 percent to 5.0 percent between the two decades.
Stronger terms of trade after 2001. The ascendency of Turkey’s candidacy for full European Un-
ion. Expansion of international financial markets during the pe-
riod.
Policies. During the period reviewed, Turkey implemented a number of policies that are relevant for economic and employment outcomes. With the exception of labor market regulations and taxes, policies have, on balance, been positive. They can be summarized as follows:
Macroeconomic stabilization after 2002 that required fiscal re-forms to bring the deficit down, establishment of central bank independence to ensure monetary stability, and banking re-forms to stabilize the financial system.
Additional policies to improve the investment climate, includ-ing relaxation of requirements to open new businesses, con-duct border trade, and to a lesser extent to pay taxes.
Establishment of a new employment service agency. Increased mandatory school attendance, from 5 to 8 years,
massive new school construction, and increased resources for education.
Creation of an unemployment insurance system and a condi-tional cash transfer arrangement.
Challenges
While the current account balance in the early stages of stabili-zation was reduced (as a percentage of GDP), it reemerged re-cently as a sign of macroeconomic imbalance and vulnerabili-ty.
A number of business climate areas still rate relatively low. These cover mainly the categories of obtaining credit, dealing
On balance, exogenous factors have had a positive impact on Turkey’s economic performance.
A number of policies relevant for economic and employment outcomes were implemented during the period.
Remaining challenges include increasing the current account balance, business climate issues, and coverage and quality of education.

41
with construction permits, registering property, employing workers, protecting investors, enforcing contracts, and closing a business.
Labor reforms in 2002-03 made job dismissal, subcontracting, and temporary employment more restrictive.3 The minimum wage increased as a percentage of average GDP and the over-all tax rate on wages also increased. Both were among the highest in OECD countries.4
Although much progress has been achieved, the coverage and quality of education in Turkey still have considerable room for improvement.
Again, in comparison with other OECD countries, Turkey lags in terms of social protection afforded to workers “outside the firm.”
Drawing from the discussion of existing policies and their effects, it would appear that, at present, the main binding constraints to em-ployment generation and earnings growth lie in the MILES categories of education, labor market regulations, and investment climate. The main economic problem affecting employment at the beginning of the 1998-2007 period—the adverse macroeconomic policy environment—has been largely removed through concerted policy action and reform.
Link of Outcomes to Exogenous Factors and Policies During the 1990s, growth and labor productivity growth slowed, largely due to macroeconomic instability. GDP and TFP growth acce-lerated after 2002 primarily because of macroeconomic stabilization. Other contributing factors included: accession prospects and privati-zation, which also helped encourage private investment; openness, which encouraged competitiveness and demand under a robust world and regional economy; and availability of international finance.
The impact of stabilization occurred not only through better fiscal performance, which was needed to contain inflation. Central Bank in-dependence also improved confidence regarding fiscal probity. Stabi-lization after 2002 went hand in hand with policies to strengthen and develop the banking system after the previous failed stabilization at-tempt undermined efforts to strengthen banking and trigger financial development, which has been shown to have an effect, at least in the short run, on growth in Turkey. Finally, the removal of agricultural subsidies that was needed to achieve fiscal balance encouraged reallo-cation of resources to the more productive economic activities.
The main constraints to employment generation and earnings growth concern education, labor market regulations, and the investment climate.
Growth and total factor productivity accelerated after 2002 primarily because of macroeconomic stabilization.

42
Table 4.2 Turkey, Key Economic Trends, 1970–2007
Indicator (percent, except formal wage index)
1970–1975
1976–1980
1980–1985
1986–1990
1991–1995
1996–2000
2001–2005
2006–2007
GDP Growth period average a 5.4 2.5 4.9 5.7 3.3 4.1 4.7 5.7
Per Capita GDP Growth period average. a 3.2 0.2 2.3 3.3 1.3 2.2 3.2 4.4
Poverty (Headcount Ratio) end year f 16.9 14.7
Gini Coefficient end year a -- -- -- 43.0 41.5 44.0 38.0
Labor Force Participation Rate end year b/ 68.9 66.3 58.9 56.6 54.1 49.9 48.3 48.2
Employment-to-population end year c 63.9 61.1 54.8 52.1 50.0 46.7 43.3 43.5
Unemployment end year d 7.2 7.9 6.9 8.0 7.6 6.5 10.3 9.7
Formal Wage Index end year e 77.8 77.5 72.2 102.7 93.7 100.0 75.7 69.3
Sources: See Appendix L: Turkey: Annex Tables: a/ Table L.1 b/ Table L.2 ;c/ Table L.3 d/ Table L.5 ;e/ Table L.4 ; f/ Staff estimates from multiple sources. Note: GDP= gross domestic product.
Higher per capita GDP growth played a strong role in explaining, at least in part, the reduction in poverty between 1997 and 2007. Avail-able research suggests that poverty reduction is also attributable to reductions in income inequality observed between the mid-1990s and mid-2000s, which in Turkey originate in declines in the income shares of the bottom and top quintiles. The declines in poverty may well be linked to rural-urban migration, as urban wages are higher than rural wages.
Despite increased economic growth, the declining trend in the em-ployment-to-population ratio was not reversed. There are four prima-ry explanations. First and most dramatic is the structural change away from agriculture—especially relevant in explaining declining female labor force participation, as women who have been commonly active in the agricultural labor force as unpaid family labor are more apt to find their skills unsuited to the urban labor markets, particular-ly in the formal sector. Second, productivity in agriculture is low and growing slowly, and productivity in industry and services are seen to be growing fast. Third, there is a mismatch of labor demand and skills in the growing sectors, with employers complaining that they are un-able to locate qualified employees for the positions that they seek to fill. Finally, rigid labor market regulations and institutions have also restrained employment growth.
The question of the falling labor participation rate for women has been a special concern of the government and the topic of some empirical analyses.5 The sector shift of employment out of agriculture and the ac-companying rural-to-urban migration, as indicated above, explains much of the falling female labor participation ratio. The agricultural sector still employs the greatest share of women, and most of these
Higher per capita GDP growth strongly influenced the reduction in poverty during the period 1997-2007.

43
women are unpaid family workers, that is, unregistered, informal sec-tor workers. With continuing structural transformation and urbaniza-tion these jobs disappear.
Beyond this sector shift, there are other important dimensions and de-terminants as well. Most importantly, educational attainment directly affects female labor market participation, with the most marked in-creases coming from university-level education. There are also consi-derable regional variations in female labor market participation, with Turkey’s poorest regions, such as the southeast, having the lowest rates. One study, based upon econometric analysis of time series and regional data, presents evidence supporting the U-shaped curve hypo-thesis (for female labor force participation rates) and contends that it is likely that “there will be a secular upturn in female participation rates during the coming decades.”6 This conclusion is based upon: the even-tual decline of the workforce shift out of agriculture; increased female enrollments and educational attainment; and the reduction of regional income disparities and the eventual economic catch up of the poorer regions to those in the more prosperous western areas (the Aegean and Mediterranean regions).
Unemployment rates have not decreased appreciably, even with higher growth since 2002. The accelerated structural transformation occurring over the past six years, which has been an important expla-nation for the noted slow overall employment generation, unquestion-ably has had a bearing on the inertia in the unemployment rate, with female unemployment rates for urban areas substantially higher than those for males (but lower than those for males in the rural sector). With the shift of resources out of agriculture, females have faced in-creased employment difficulties in urban labor markets.
The Bank’s Strategy and Contribution Overall strategy and objectives. In the periodic economic plans and pro-nouncements of the Turkish government, employment generation has been a constant objective and priority for policy action. This was the case for the Seventh Five Year Development Plan (for 1996-2000) and for the Eighth Development Plan as well. In the Ninth Development Plan (for 2007-13), increasing employment was ranked second out of five main economic objectives. Under the overall employment genera-tion objective, more specific objectives include: improving the func-tioning of the labor market; increasing the sensitivity of education to labor demand; and developing active labor market policies.
The employment generation theme and objective in Bank strategy documents has been less explicitly articulated than in Turkish gov-ernment plans and policy statements. The four CAS-type documents
Unemployment rates have not decreased appreciably, even with higher growth since 2002.
The issue of employment generation has been less common in Bank strategy documents than in government strategies and plans.

44
examined (dated 1997, 2000, 2003, and 2008) mention employment generation and/or earnings. However, if indicated as an objective, it has been subdued and, until recently, not actively pursued as a part of Bank Group strategy.
In the 1997 CAS, presented to the Board in FY98, employment genera-tion was explicitly identified as a part of one (enhancing competitive-ness and employment growth) of three broad development priorities for Turkey, along with accelerating structural reforms and addressing poverty and social development. The CAS correctly emphasized that substantial employment could only come through private sector ex-pansion. No specific employment, labor force, or labor market progress benchmarks were included.
In the 2000 CAS, employment generation was also set forth as a theme for Bank action and support, but no benchmarks were included. With the Turkish economic crisis in 2001, a Progress Report related to the 2000 CAS was prepared and discussed by the Board in June 2001. It dealt primarily with Bank support to Turkey during the crisis and fo-cused on various dimensions of macroeconomic stabilization such as public finances, public sector reform, and financial sector issues. There was little mention of employment questions.
The 2003 CAS does not contain an explicit mention of employment generation as part of one of the pillars for Bank support, although the emphasis on macroeconomic stability, growth, and increased compe-titiveness indirectly involves job generation.
The most recent CAS-type document, now called a Country Partner-ship Strategy (CPS) and presented to the Board in January 2008, in-cludes a specific and explicit mention of increased employment as one of the four components of the first pillar for Bank strategy entitled “Improved Competitiveness and Employment Opportunities.” It closely reflects a similar objective expressed in the government’s Ninth Development Plan, as well as a number of other government objectives. In line with expressed government priorities, the CPS also explicitly mentions “enhancing the educational system and increasing the sensitivity of education to labor demand.”7
Throughout the 1998-2007 review period, the major pillars for Bank strategy have entailed: macroeconomic stability; economic growth, competitiveness, and productivity; and poverty reduction and social development. These building blocks of the Bank’s strategy have evolved over time, but have been consistently present.8 The pursuit of assistance under these pillars has been consistent, albeit indirectly, with a general objective of employment generation and earnings growth. After the urgency of macroeconomic stability abated through
The most recent strategy includes a component on increasing employment.

45
policy changes and economic reform, employment generation objec-tives been more explicitly pursued in recent years.
Bank Group Assistance and Interventions. The Bank has been active and heavily involved in all five of the MILES areas, with differing emphases over the 1998-2007 period. To the extent that the investment climate encompasses the infrastructure sectors, there is little in the Bank’s pro-gram that is not included in the MILES areas.9 Appendix K presents a summary of Bank assistance in accordance with the five MILES catego-ries. Lending and analytical work are listed separately.
In general terms, Bank involvement in Turkey has intensified dramat-ically over the 1998-2007 period. Lending commitments grew from $18.5 million in FY97 to $1.16 billion in FY07. AAA and other non-lending support have increased commensurately. The lending portfo-lio improved from a problematic one to one without major problems.
Macroeconomic Policies. The mid-1990s were characterized by macroe-conomic volatility, Bank ESW outlining the means to macroeconomic stabilization and adjustment,10 and low scale Bank-government rela-tions. For some time preceding 1998, the Bank had identified macroe-conomic instability as the major economic challenge for Turkey and pursued AAA on those issues. However, Bank advice frequently fell upon deaf ears within the government. Indeed, Bank persistence on such matters at times ruffled government sensitivities and served to undermine Bank-government relations.
When the government’s political will to proceed with stabilization emerged, the Bank through its previous analytical work was in a good position to play a useful role to provide support.11 Because of the re-levance and timeliness of Bank economic and sector work (ESW) and the government’s need for international financial support, the Bank became an important actor having considerable influence, along with the IMF, in the design of the government’s macroeconomic policy re-forms, especially those related to public finances and the financial sec-tor.
In the initial stages, from 1999-2000, the Bank played a secondary role to the Fund in the design and pursuit of financial and banking sector measures.12 However, this role evolved subsequently with later lend-ing operations. Accordingly, the Bank’s risky investment in pursuing macroeconomic issues in its AAA ultimately paid high dividends for both the country and the Bank.
Collaboration with the IMF on the first Stand-by Arrangement (SBA) in 1999 was intense, and this work gave rise to the period’s first quick disbursing, policy-based adjustment loan—the Economic Reform Loan (ERL) in FY00. The milestone ERL operation focused its macroe-
The Bank collaborated with the IMF on the first Stand-by Agreement.
Bank involvement has intensified over the period and covers all five MILES areas.

46
conomic support on improved fiscal measures, the beginning of so-cial security reform, and the introduction of an unemployment insur-ance system.
The Bank also advised Turkey on bank failure resolution, deposit in-surance, and restructuring and privatization of state-owned banks. After the ERL, an FSAL supporting a strengthening of prudential reg-ulations and banking supervision for the financial sector was made effective. The FSAL had one major shortcoming from the outcomes perspective: the absence of a stable macroeconomic environment based on a robust fiscal program. These conditions contributed to a major banking crisis two months after loan approval.
Learning from difficulties experienced in the ERL, the Bank modified lending instrument design with the introduction of programmatic ad-justment loans. Fairly quickly, a series of three programmatic financial and public sector adjustment loans ( PFPSALs, approved in FY02 and FY04) was initiated. These were followed by the two programmatic development policy loans (PPDPLs approved in 2007 and 2008). The PPDPLs supported the structural reform program to maintain a ma-croeconomic stability framework, financial controls and expenditure management of public resources, and to improve the administration and governance of the public sector. In FY07, a new programmatic de-velopment policy loan series was initiated—the Competiveness and Employment Development Policy Loans (CEDPLs); these loans, like their predecessors, are anchored in the maintenance of a stable macroe-conomic policy environment. Over the 1998-2007 period, a total of nine such adjustment loans were made, amounting to $6.29 billion.
There can be little doubt that the policies supported by the Bank and implemented by the authorities had a beneficial effect in achieving macroeconomic stabilization. Without the involvement of the Bank, and the Fund, it is doubtful that the necessary adjustment for the Tur-kish economy could have been so successfully achieved. The resump-tion of robust growth during the 2002-07 period is an outcome of those policy reforms. Indirectly, the demand for labor and employ-ment has increased (or, rather, declined less) as a result.
Investment Climate. The more general AAA led to an emphasis on growth, competitiveness, the financial sector and private sector de-velopment, and the investment climate in general. Analytical work on investment climate issues has involved a number of infrastructure sector analyses and studies (including for electric energy, gas and oil, and water); a series of FIAS reports (starting in FY2000) focusing on the treatment and role of foreign direct investment, the private sector regulatory environment, tax issues for private sector development and investment promotion; and the recently disclosed Investment Climate Assessment (2007).
Bank-supported policies had a beneficial effect in achieving macroeconomic stabilization.
The Bank also advised Turkey on bank failure resolution, deposit insurance, and restructuring and privatization of state-owned banks.

47
Regarding lending support, the Economic Reform Loan (ERL, FY00) contained, apart from its strictly macroeconomic (and financial sector) areas, elements related to privatization, the reduction of agricultural subsidies, and deregulation of the energy sector. Subsequent lending for agriculture (the Agricultural Reform Investment Project, or ARIP) provided resources for severance payments in agricultural state-owned enterprises as part of their privatization or closure, and the further reduction of agricultural subsidies. A number of credit line projects (the Export Finance Intermediation Loan (EFIL) series) were also pursued, as were several projects in the electrical energy sector. In 2007, the first CEDPL was approved. In addition to maintaining the macroeconomic policy framework, it supported various measures to improve the investment climate.
The Bank’s support for macroeconomic and financial sector stabiliza-tion was perhaps most important for improving the investment cli-mate, as it was macroeconomic stabilization that really made the differ-ence in spurring investment and growth. After the macroeconomic and financial sector reforms, the area where the Bank Group has had the greatest impact in improving the investment climate has been with var-ious features of the business legal and regulatory environment. The FIAS reports and engagement in the early part of the 1998-2007 period were of high quality and had a major impact. The successful FIAS en-gagement with the government resulted in close working collaboration, including the drafting and passage of the Foreign Investment Law of 2003 that eliminated the legal discrimination against foreign-owned firms operating in Turkey. It also reduced the top corporate income tax rate from 30 percent to 20 percent, and led to the establishment of go-vernmental institutions more effective at pursuing private sector in-vestment promotion and improving the business enabling environ-ment.
These regulatory and policy changes, attributed in large part to FIAS initiatives and subsequent engagement, have been partly responsible for the expansion of private sector investment in general and foreign direct investment in particular. The FIAS engagement also resulted in a number of institutional changes designed to facilitate private and gov-ernment collaboration on investment climate impediments.
Another AAA effort of potential usefulness and importance is the re-cently disclosed Investment Climate Assessment (2007). It was carried out, based in large part on an insightful survey of manufacturing firms, in conjunction with a leading Turkish research and academic organization (TEPAV). To date, the report’s dissemination and en-gagement of Turkish stakeholders on these matters have not ad-vanced very far, perhaps due to inadequate budgeting of Bank re-sources for such important follow-up activities.
Macroeconomic and financial sector stabilization was perhaps most important for the improvement in the investment climate.

48
Labor Regulations and Institutions. The Bank’s Labor Market Study in-itiated more active and direct Bank participation on employment is-sues. This effort was planned in the 2000 CAS, but was delayed be-cause of shifting Bank priorities related to the 2001 economic crisis, as well as staffing difficulties, including the reassignment of the Task Manager to additional functions in the study’s final stages. There was considerable interest on the part of the government, and after some initial discussions of results and recommendations, the report was fi-nally disclosed (in grey cover) in April 2006. This is a high-quality report, and it has had a considerable impact within the government. Additional government requests for work on related topics were ex-tended, and the original report spawned additional AAA, including separate reports on estimating the impact of payroll taxes and youth employment.
This analytical work and related government policy actions paved the way for directly related lending operations. The first programmatic CEDPL supported initial actions to overhaul labor market regulations. The second loan (CEDPL2), approved in November 2008, supports measures undertaken in the 2008 Employment Package along with var-ious other measures designed to increase competitiveness.
As with reforms in the macroeconomic framework, the financial sector, and some investment climate measures, the Bank exercised a decisive and key role in supporting improvements in the labor market regulato-ry environment, but only toward the end of the review period. While the Bank’s Labor Market Study was considerably delayed, it has served as a milestone in the Bank’s involvement on such issues. It established the basis for a productive partnership between the government and Bank on labor market questions, spawning additional reports and col-laborative work. The measures implemented as part of the Employ-ment Package of May 2008 were a result of that work, and are being supported by the Competitiveness and Employment DPL series. These measures included, in particular, a general 5 percent reduction in em-ployer social security contributions, as well as a reduction of social se-curity contributions for the young and women for firms hiring young people and women who have been out of the formal sector for at least six months.13 These are now being covered by the treasury. Excessive payroll taxation has been one of the issues that the Bank has focused on for a number of years. Bank employment-related advice was devel-oped in particular by the 2006 Labor Market Study (The World Bank (2006b)), the 2007 ICA (The World Bank (2007a)), and the 2008 CEM (The World Bank (2008e). Research conducted by Betcherman and Pagés (2008) was also instrumental in addressing the labor taxation is-sue.14
Analytic work on the labor market led to related lending operations to overhaul labor regulations.

49
Education. Education has been a central focus of the Bank’s activity and lending in Turkey over an extended period. In 1997, the Educa-tion Reform Law imposed sweeping changes in the educational sys-tem and extended mandatory education from five to eight years. There was a large school construction program to try to meet the new-ly expanded demand, as well as other efforts. The Bank responded with a Basic Education Loan (an Adaptable Program Loan — APL), totaling $300 million in 1999—at a critical juncture in Bank-government relations. Although the project was beset with problems from the beginning, including thorny procurement issues,15 it did come at an important time and was commonly seen as a willingness on the part of the Bank to support Turkey.
Additional educational sector lending, although also problematic, has fared better than the first Basic Education project. A second Basic Education Loan (APL2 in FY03) had much more specific project objec-tives—increasing coverage and improving the quality of basic educa-tion for low-income children. A Secondary Education project was ap-proved in FY05.
As a means of supporting lending and conducting a meaningful di-alogue with the government, the Bank undertook an Education Sector Report (The World Bank (2005b), which was disseminated in Decem-ber 2005. It is a finished piece of analysis, drawing on considerable Turkish expertise and experience. It is unclear why this effort has not been more effective in pursuing a productive engagement with the government education authorities. A more recent Higher Education Assessment (The World Bank (2007b) raises equally relevant issues and also warrants more attention.
In many countries, the education sector has proved to be a difficult challenge for the Bank. This has indeed been the case for Turkey. While substantial and important advances have been made in the Turkish educational system, as witnessed by the increased enrollment rates, the Bank’s role in this progress has been quite limited and per-haps even marginal. Effective engagement with the Ministry of Edu-cation over recent years has been, and continues to be, a challenge.
Social Protection. The ERL (FY00) included provisions and measures to address initial reforms of the pension system and the establishment of an unemployment insurance system in 2001. Those two systems remain at the forefront of Bank-government discussions on social pro-tection. The PPDPL (FY06) supported government measures to fur-ther reform the pension system, revamp universal health insurance, and revise other social assistance programs. The pension (social secu-rity) system has recently undergone a new round of Bank-supported revisions (in the 2008 Employment Package). In addition, drawing from the earlier Living Standards Study (The World Bank (2000b), the
Although the Bank has long provided education support to Turkey, its role in the sector’s progress has been limited.
The Bank continuously encouraged pension reforms and supported the establishment of unemployment insurance.

50
Bank’s Social Risk Mitigation Project (SRMP) of FY02 provided re-sources for conditional cash transfers to the poorest six percent of Turkish families. Monthly stipends were provided to poor families conditioned upon school attendance and basic health care for their children. By mid-2008, 2.8 million children were benefitting from this program.
The Bank has played an effective, important, and even decisive role in strengthening social protection. It has effectively pushed for ongoing reforms in the pension system, supported the nascent unemployment insurance system, and pioneered the conditional cash transfer (CCT) program to poor families.

51
Chapter 5 Key Findings
The cases reviewed in the preceding three chapters of this report depict a range of experiences relating to Bank support for addressing em-ployment challenges. This chapter discusses a set of findings that can be drawn from Bank experiences assisting Colombia, Tunisia, and Tur-key. The discussion focuses on the country’s achievement of outcomes (GDP, poverty, employment, and earnings growth) and the contribu-tion of Bank inputs, first from a cross-cutting perspective and then with reference to each of the five MILES areas of support. The chapter con-cludes with implications for Bank support during the current jobs cri-sis.1
Comparison of Outcomes Across the Three Countries Two findings in connection with outcomes across the three countries are highlighted. First, progress in economic growth and earnings was better than progress in employment and unemployment. Second, al-though the availability of statistics on employment and earnings out-comes has improved, there are still significant deficiencies.
When comparing the decade reviewed (1997-2007) with the previous decade, the broad outcomes (Table 5.1 are as follows: Tunisia per-formed the best. With stable employment growth, Tunisia increased its employment-to-population ratio and reduced the unemployment rate. Per capita GDP, GNI, and earnings growth rates also increased and poverty declined at a higher rate. Colombia also registered stable employment growth and a minor increase in the employment-to-population ratio, but the unemployment rate increased. The per-capita GNI and GDP growth rates declined, but earnings growth may have increased due to a decline in the growth of inequality. Poverty declined after having increased during the recession years of the late 1990s. Turkey experienced declines in employment growth and in the employment-to-population ratio, and an increase in the unemploy-ment rate. The per-capita GNI and GDP growth rates increased. Earn-ings growth may also have increased due to an improved income dis-tribution. Poverty declined at an increasing rate, particularly after 2002. The last column of Table 5.1 shows per worker output growth
Evaluation Essentials Progress on economic
growth and earnings was better than progress on employment and unemployment.
Availability of data has improved, but more progress is needed.
Bank support addressed areas with a bearing on employment more than on employment outcomes.
The Bank’s AAA was generally of good quality and was appreciated by the three clients, though its impact is unclear.
The Bank’s proactivity and engagement on employment issues may not always have been well matched to country circumstances.
The Bank provided some successful support in all of the MILES areas.
All three countries are facing employment challenges in the current crisis.

52
and TFP. Although Turkey, like Tunisia, increased TFP growth mar-kedly, Turkey’s growth, unlike Tunisia’s, was “jobless.” Based on this data, this assessment rates the Tunisia outcomes “satisfactory,” and the Colombia and Turkey outcomes “moderately satisfactory.”
Although employment growth is positively correlated with GDP growth, as indicated by the International Labour Organization (ILO) (2009) estimates of the GDP elasticity of employment, changes in av-erage GDP growth rates between 1987-97 and 1997-2007 were re-flected primarily in changes in earnings growth, not in employment growth. A positive relationship between GDP and employment growth is to be expected because growth triggers demand for labor and because employment is one of the sources of growth. However, the simple correlation between employment and GDP growth is wea-kened by the relationship that has also been found between changes in GDP growth and changes in TFP growth (another source of GDP growth), particularly when fundamental changes in relevant policies have taken place. In fact, worldwide acceleration of GDP growth dur-ing the review period was linked to worldwide acceleration of TFP growth, and the three countries were no exception. Changes in factor productivity growth allowed earnings growth to increase in Tunisia and Turkey, but possibly not in Colombia, where average TFP growth declined considerably during the recession years (see Annex N, Table N.2 ).
Table 5.1 Colombia, Tunisia, and Turkey: Outcome Indicators
Employment Unemployment Income Poverty Income distribution Output/TFP
Average annual change
(%)
Employment-to-population
ratio (%)
Unemployment
Rate
Real per capita GNI
growth
Headcount ratio
(not comparable across countries)
Data at or closest to (as indicated):
Gini coefficient
(not comparable across countries)
Data closest to (as indicated)
Per-worker GDP
growth/of which: TFP
Year/ period
1987-97
1997-07
1997 2007 1997 2007 1987-
97 1997-
07 1987 1997 2007 1987 1997 2007
1989-95
1995-05
Colombia 2.3 2.3 51.0 51.4 9.8 10.7 2.2 1.9 51.2 49.4
47.9 52.5 57.4 58.6 1.58/ -0.01
1.16/ -0.18
Tunisia 2.7 2.7 38.11/ 40.2 16.02/ 14.1 2.1 4.0 7.73/ 6.24/ 3.85/ 43.43/ 41.74/ 40.05/ 2.37/ 0.75
3.04/ 1.42
Turkey 1.9 0.8 49.0 43.5 6.8 9.7 2.3 2.5 38.5 28.36/ 30.37/
27.07/
9.5 43.0 8/ 41.56/
42.09/ 42.77/
38.010/
43.25/ 2.83/ -0.05
3.61/ 1.50
World average
1.7 1.6 63.0 61.8 6.1 6.0 1.4 1.9 71.8 67.2 56.6 61.911/ 64.212/
65.113/
63.414/ 0.83/ -0.44
2.99/ 1.32
Sources and Note: GNI, Population and working age population: The World Bank( WDI). Employment and Unemployment: DANE (Colombia), Tunisia Institute of Statistics (Tunisia), OECD (Turkey), The World Bank (WDI) and ILO, “Global Employment Trends”, 2009 (World). Poverty Headcount Ratio: DNP (Colombia); Tunisia Institute of Statistics (Tunisia); The World Bank (2005c) and Turkish Statistical Institute (Turkey); The World Bank (WDI) (World). Gini Coefficient: DNP (Colombia); World Bank updated (2008) poverty estimates (<www..worldbank.org>) (Tunisia); Turkish Statistical Institute and World Bank updated (2008) poverty estimates (<www.worldbank.org>) (Turkey). Output/TFP: staff estimates from Dale W. Jorgenson; Khuong Vu, "Information Technology and the World Growth Resurgence", hdl:1902.1/10702 UNF:3:vE7B5m3aMRtK6ZZi4lP4DA==; Average of 122 Economies. Indicated years: 1/1999; 2/ 1999; 3/1985 4/ 1995; 5/ 2005; 6/ 1994; 7/ 2002; 8/ 1986; 9/ 1996; 9/ 2002 10/ 2006; 11/ 1988 and 12/ 1998: Milanovic (2005), p. 108; 13/ 2000 and 14/ 2005: Hillebrand (2008), Table 2. Note: GDP= gross domestic product; GNI= gross national income; TFP= total factor productivity.
Although employment growth is positively correlated with GDP growth, changes in average growth over two decades were reflected primarily in changes in earnings growth.

53
Differences in outcomes across the three countries were linked pri-marily to differences in local exogenous forces and policies. External forces were favorable. Improvements in the world and regional eco-nomic environment increased local demand for labor in the three countries. World per capita GDP growth rose from 1.4 percent during 1987-97 to 1.8 percent during 1997-2007, with even larger increases in Latin America, Europe and Central Asia, and the Middle East and North Africa. Access to international finance improved and the cost of finance declined.
Improvements in macroeconomic policies and other investment climate pol-icies were also a factor in helping to increase investment and the de-mand for labor in the three countries. However, good macroeconom-ic policies were already in place at the outset of the review period in Tunisia, but these policies initially deteriorated in Colombia and Turkey. Labor market rigidity, non-wage costs, and minimum wages increased throughout the period in Turkey and remained unchanged in Tunisia. Rigidity was somewhat relaxed in Colombia, but non-wage costs and the minimum wage also increased.
Regarding education, the three countries achieved increases in enroll-ment, particularly at the secondary and tertiary levels, that is, toward the working-age range. These increases as well as a demographic transition that reduced working-age population growth contributed to tame aggregate labor supply growth. Past education efforts also generated the supply of skills that allowed earnings to increase. Ru-ral-urban migration spurred by economic sector adjustment in Turkey and rural violence in Colombia produced a shock to urban labor supply. Furthermore, in Colombia, deteriorated security during the first half of the review period discouraged economic activity. Local exogenous forces and policies were most favorable in Tunisia, less so in Turkey, and least so in Colombia.
In Tunisia and Turkey, poverty declined at an accelerating pace dur-ing the review period (Table N.3 Appendix N. ). This development does not come as a surprise because economic growth accelerated in these two countries. Conversely, with slower growth, poverty reduc-tion also slowed down in Colombia. At the same time, the experiences of the three countries suggest that periods of economic distress, with low productivity growth, hit the poor harder. This is demonstrated by growth incidence curves in Tunisia and Colombia, which depict the incidence of growth by percentile of the income distribution. These curves indicated a pro-rich pattern during distress years.
Employment abroad has been an important source of in-come/transfers for nationals of the three countries, both for those liv-ing and employed abroad and for those living in their country and re-ceiving remittances. In Colombia, the economic and security crisis at
Improved policies helped to increase investment and labor demand in all three countries.
Increases in education enrollment and a demographic transition helped tame labor supply growth.

54
the turn of the century triggered a substantial rise in the stock of emi-grants (up to 4 percent of population) and in remittances (up to 7 per-cent of GNI), the latter declining as the economy improved (See Fig-ure N.1 Appendix N. ). In Tunisia, there was a gradual rise in the stock of emigrants after the year 2000 (up to 10 percent of population in 2007), and a rise in the level of remittances (up to a little over 10 percent of GNI; (See Figure N.2 Appendix N). Turkey had a sharp decline in remittances as the economy improved, as well as a decline in the stock of emigrants (See Figure N.3 Appendix N).
The dynamics of labor participation rates varied significantly across the three countries. Turkey’s long-term decline in participation rates continued and is primarily correlated with the decline in the share of the agricultural sector,2 a decline that was given additional impetus by the removal of agricultural subsidies as part of the structural ad-justment measures underpinning stabilization. Colombia’s long-term increase in labor participation rates, primarily explained by increased education levels that raised female participation rates, ceased during the period under review. This reflected the diminished capacity of the economy to generate employment due to lower growth and pos-sibly minimum wages. Participation rates in Tunisia increased, re-flecting higher economic growth.
Similarly, the experience of unemployment in the three countries also varied considerably. It suggests that changes in unemployment (Table N.3 , Appendix N) in Colombia during the decade were primarily cyclical. It also suggests that changes in Turkey’s unemployment re-flected changes in the cyclical component prior to 2002, when indeed there were wide swings of economic activity, with a rise in structural and/or frictional unemployment during stabilization, possibly as structural policies accelerated the rural-urban human resource reallo-cation. In Tunisia, changes in unemployment were minor, reflecting the absence of cycles or major structural changes.
In the three countries, unemployment rates remained very high. In 2007, these rates were 10.7 percent in Colombia, 14.1 percent in Tuni-sia, and 10.1 in Turkey. These rates were high even by regional stan-dards in Colombia and Tunisia. They are not likely to reflect signifi-cant cyclical unemployment, for in 2007 output was close to potential in the three economies. They are more likely to reflect classical unem-ployment due to high minimum wages or structural unemployment due, for example, to skill mismatches, both issues of considerable im-portance in the three countries. Some frictional unemployment due to imperfect information may also be at work.
The data suggest that the Bank might usefully consider putting more resources into elucidating the hysteresis and structural roots of un-employment, including its cyclical, classical, frictional and structural
Labor participation rates varied widely, as did the reasons for particular patterns.
Unemployment rates remained high in all three countries, regardless of growth.

55
components, as there appears to have been little success in reducing the long-term level of unemployment. The 10-year experience of the three countries reviewed in this report is striking in terms of the im-pact (or lack thereof) of policies on structural unemployment. Under-standing better the “classical unemployment” implications of mini-mum wages and the other sources of long-term unemployment may help sharpen engagement and dialogue on this critical issue.3
There are also considerable differences in performance in employment indicators by gender. In both Tunisia and Turkey, female participation rates are much lower than male participation rates for a variety of rea-sons discussed in the country chapters. These include structural (for example, rural-urban migration in Turkey) and cultural factors (strong views of female roles at home). In Colombia, female participa-tion rates, the highest of the three countries, declined after 2000— this after several years of increasing. In addition, male participation rates declined after many years of constancy. As with employment trends, the decline is linked primarily to slower economic growth, with some decline attributed to minimum wage and labor taxes. In Turkey, fe-male participation continued declining slowly, with no net changes in male participation. In Tunisia, female participation continued increas-ing and male participation continued declining.
In all three countries, the authorities have been proactive in support-ing women’s right to work. Nevertheless, female unemployment rates are higher than male unemployment rates in Tunisia. They are even higher in Colombia. The gap between male and female unem-ployment rates increased in Tunisia largely as a result of skill mis-matches. Turkey’s unemployment rates do not vary by gender. A dis-tinguishing feature in Tunisia is that unemployment is higher among the educated, again due to a skills (quality) mismatch.
The experience regarding employment outcomes suggests that Bank programs with employment objectives would benefit by considering the full set of employment-related outcomes when designing country programs. Outcomes to be considered would cover employment growth, the employment-to-population-ratio, the unemployment rate and earnings growth, and the impact of these on growth and poverty, as well as the uncertainties of that impact. This is not to say that pro-grams necessarily need to have quantitative targets for these va-riables, but that policies and programs need to be understood in terms of their possible effects on those variables.
A review of the data that was available for this report concludes that while much progress has been achieved in collecting information, there are still important shortcomings. For example, in Colombia, da-ta is now being produced on a monthly basis and at the national level since 2001. However, limited comparability with previous years con-
Gender employment indicators differed significantly across the three countries.

56
strains the analyses. Delays in production of the data, particularly on earnings, prevent timely monitoring. Furthermore, sources (official, ILO, Bank) sometimes conflict with one another. Although Colombian national data indicate that the participation rate ceased growing dur-ing the review period, both ILO and World Bank (World Develop-ment Indicators-WDI) estimates indicate that the participation rate continued growing. The Bank could increase its support, in coordina-tion with other institutions, for better information gathering and availability on employment and earnings. The Bank has already been active in assisting countries in strengthening their household survey data. But more could be done. One good area to target is the timeli-ness of data dissemination. For example, the last available household survey data on earnings for Colombia, which allowed analysis of formal/informal sector differences at the time of writing of this report (2009), was for 2006. The implied delays are too long for the needs of analysts, observers, and policy makers. In Tunisia and Turkey, the situation is not any better.
Comparisons of Overall Bank Support Across the Three Countries Three findings are highlighted in connection with country program strategies. First, Bank objectives targeted primarily areas with a bear-ing on employment (e.g., MILES areas) rather than explicit employ-ment outcomes. Second, although its impact is unclear, the Bank’s AAA was generally of good quality in terms of addressing the right employment issues competently. The AAA was well appreciated by the three clients. Third, the Bank’s proactivity and engagement on employment issues may not always have been well-matched to coun-try circumstances.
Although employment objectives have not been an explicit part of Bank programs, most policies supported by the Bank in the three countries had some bearing on employment. Bank strategies by and large have focused on growth and poverty reduction as “grand objec-tives.” Their references to employment or unemployment objectives are common, albeit often included only in passing.
However, in the three countries covered by this report, references to employment in Bank programs increased during the review period, reflecting the greater importance assigned to employment growth by authorities. Furthermore, the more concrete objectives generally in-cluded the policy areas with a bearing on employment, that is, the MILES areas.
This experience suggests that where employment issues are impor-tant, Bank strategies could move from noting employment as an ob-
Most policies supported by the Bank in the three countries had implications for employment.
Data collection has improved, but more progress is needed.

57
jective to better articulating how its support in different areas will af-fect the full set employment outcomes and poverty. Where employ-ment issues are pivotal, country programs could articulate their im-pacts on employment outcomes by indicating the links between concrete intermediate outcome indicators and employment outcomes, as defined above. This will enable employment objectives to be more easily tracked and to be more credible, and employment impacts more explicit or transparent. The rationale for this suggestion is that employment outcomes are the key channel through which country programs affect poverty, and poverty reduction is the Bank’s overrid-ing Bank objective.
The Bank’s strategy and interventions were highly relevant in address-ing key employment and earnings-related issues in the three countries. Bank support (through its AAA, TA, and lending operations) adapted to the governments’ changing priorities, and generally addressed (or attempted to address) the most critical policy constraints. The Bank’s ideas and its international perspective and experience mattered consi-derably. High-quality AAA was important in establishing and main-taining the extent and depth of the Bank’s access to senior policy mak-ers.
This suggests that the Bank could usefully strengthen its role as know-ledge provider and engage more strongly with its clients on employ-ment policy. The Bank is in a strong position to strengthen its leader-ship on employment issues for a number of reasons. First, it has developed an integrative framework to identify constraints to em-ployment. This framework allows the Bank to develop balanced views on policies affecting employment outcomes. Second, it has demonstrat-ed a capacity, as in other areas, to bring research into operationally re-levant policy implications. AAA is the key instrument to deal with some of the more sensitive policy issues with a bearing on employment outcomes. Third, its mandate of poverty reduction involves strong at-tention to employment outcomes. The Bank contributed to understand-ing employment issues in the three countries reviewed in this report. It can do so in many other countries that would benefit from this know-ledge, even if the benefit takes time to materialize.
In terms of the effectiveness of Bank inputs, the picture is mixed. Much has been achieved. In Colombia and Turkey, the Bank correctly identified macroeconomic instability and financial sector weaknesses as the key constraints to growth at the beginning of the review period. Both macroeconomic stability and financial sector soundness were restored partly as a result of Bank supported policies. During the lat-ter part of the review period, the Bank’s focus rightly shifted to im-proving the investment climate, and was successful in supporting achievements in this area. Furthermore, the Bank provided AAA on labor market issues that have proved useful in informing the debate
The Bank is in a strong position to strengthen its leadership on employment issues.

58
on labor market policies in these two countries. The Bank’s contribu-tion on education was probably stronger in Colombia than in Turkey, both in terms of engagement and innovation. In both countries, the Bank was helpful in helping develop social protection (CCT and/or unemployment insurance) arrangements.
In Tunisia, macroeconomic and financial sector stability, which was already in place prior to the period under review, was sustained dur-ing this period. Indeed, stability was maintained despite a challenging combination of shocks in the early 2000s. Sustained macroeconomic stability clearly contributed to growth and better outcomes. Partly as a result of Bank support, the government made further progress in the macroeconomic areas relating to export development and financial sector reform. The Bank was more focused on investment climate is-sues than in the other two countries and successfully supported the achievement of a more balanced playing field between the offshore and on-shore economies and the transformation of the ICT sector. The Bank also engaged with effectiveness in improving coverage of education. However, its impact on improving social protection ar-rangements was limited.
Other goals remain elusive. The three countries did not resolve a number of constraints relating to MILES policies. For example, there are considerable remaining rigidities in the tax and expenditure sys-tems in Colombia. In Tunisia, governance problems which con-strained private investment did not receive enough attention. Little or no improvements in labor flexibility or in reducing the taxation of la-bor while financing social insurance were achieved in Tunisia or Tur-key, and progress in Colombia was modest. Minimum wages re-mained binding, and could possibly explain part of the informality and high unemployment rates in the three countries. There was not much progress with respect to education quality in any of the three countries, with a particular concern regarding the quality of higher education in Tunisia. A broad-based financing of social insurance that would ease payroll taxes and contributions and remaining fiscal-ly sound was not put in place. In Colombia, social safety nets were widened, although they generated discernible fiscal pressures which cannot be resolved without addressing the considerable remaining ri-gidities in the tax and expenditure systems.
In the final analysis, while rigorous “attribution” of results to Bank support is virtually impossible, the evidence discussed and summa-rized in the country chapters suggests that most Bank activities made important contributions. Bank AAA has been generally appreciated for its quality in the three countries. It appeared most critical in Tuni-sia, where the Bank is possibly the foremost provider of development knowledge products. The Bank’s AAA covered all of the MILES areas. Regarding lending, Bank-supported fiscal adjustment operations con-

59
tributed importantly to the restoration of fiscal stability in Colombia and Turkey.
However, some of the Bank’s lending operations supported messy, “second-best” reforms. The Bank was right to do so, but overpro-mised as to what could be achieved. In Colombia fiscal adjustment operations promised more than could be delivered to eliminate struc-tural rigidities given political economy constraints. Other specific ex-amples include support for the reform of the public training system, the Investment Stability Law in Colombia for secondary education in Turkey, and infrastructure in Tunisia. The Bank’s involvement con-tributed to better outcomes in these areas even though the results were less than expected.
Bank Support on the Specific MILES Areas: Similarities and Differences Across the Three Countries Key findings are summarized as follows:
(i) Bank support for macroeconomic policies effectively contri-buted to country efforts regarding stabilization and financial crisis resolution in Colombia and Turkey, and to trade and fi-nancial development in Tunisia. These efforts were the main force that helped restore GDP growth in the first two coun-tries, and also contributed to sustaining higher growth in the third. Restored GDP growth increased the demand for labor, resulting primarily in higher earnings growth;
(ii) Bank support for investment climate policies covered the three countries and contributed to improvements in specific policy areas that helped raise investment or total factor prod-uctivity to varying degrees;
(iii) Support for labor market regulations and institutions oc-curred primarily through AAA of good quality in terms of re-levance and competence, but with somewhat uncertain and perhaps limited impact;
(iv) Support for education contributed primarily to coverage and supported the increased supply of skills needed to raise output and earnings growth;
(v) Support for social protection arrangements contributed suc-cessfully to CCT programs in Colombia, albeit with an unsus-tainable fiscal cost. and less so to unemployment insurance programs.
Some of the Bank’s lending operations were “second-best” reforms.

60
Macroeconomic Policies. Growth in Colombia and Turkey would have been less were it not for the stabilization that brought both countries out of recession during the first half of the review period. Bank sup-port for macroeconomic policies was most important for employment growth in Turkey and Colombia. In Turkey, macroeconomic policies that, on balance, enhanced growth included reduction of fiscal deficits through both tax and expenditure measures that involved important structural reforms in the financial system, pensions, privatization and agriculture. Although initial stabilization efforts failed, the IMF and Bank provided considerable support to the macroeconomic stabiliza-tion efforts that were ultimately successful, with the exception of pension reforms. Similarly, the Bank assisted Colombia in its macroe-conomic stabilization efforts with success in helping tax administra-tion. However, it failed in its support to lessen fiscal rigidities. Clear-ly the structural reform challenges to stabilize were far more challenging in Turkey than in Colombia and, accordingly, the Bank’s engagement in this area was correspondingly stronger in Turkey. Re-garding trade, the Bank successfully helped Tunisia in the area of faci-litation and this may have contributed to positive employment out-comes.
This experience suggests that the Bank needs to work with the IMF in advising countries to ensure fiscal prudence and use available policies and resources judiciously in terms of addressing varying employment challenges. This requires relying largely on automatic stabilizers (al-lowing moderate deficits as revenue growth falters in recession and building treasury reserves during booms) rather than on discretionary policies that have often been biased toward increased public expendi-ture and that risk remission into fiscal distress. Discretion is likely to make more sense in expenditure allocation, with periods of employ-ment distress requiring more resources into unemployment insurance and CCT programs. Alternatively, periods of employment booms would allow more resources to be spent on public investment. The Bank can help in this area through its Public Expenditure Reviews (PERs), which typically involve multi-sector analyses. . The rationale to avoid expenditure expansions to any significant degree is illu-strated by the experience of Colombia and Turkey. In both countries, the first half of the review period was characterized by recession and deteriorating employment outcomes originating in declining confi-dence from an unsustainable fiscal stance (and deteriorating security in Colombia).
Investment Climate. In Tunisia, private investment was relatively stable as compared with Colombia and Turkey, where the crises at the turn of the century led to a major decline in the ratio of investment to GDP (figure N.4, Appendix N). The ratio declined until after the time when the recessions bottomed out in Colombia and Turkey and then
Bank support for macroeconomic policies contributed to country efforts to crisis resolution in Colombia and Turkey, and to trade and financial development in Tunisia,

61
recovered significantly, even surpassing the prior maximum ratio in Colombia. The cyclical behavior of private investment in Colombia and Turkey and the relative macroeconomic stability in Tunisia reflect the major role of macroeconomic conditions in determining private decisions to invest, although a deterioration of security may also have played an important role in diminishing investment around the turn of the century in Colombia.4 No progress was achieved in raising Tu-nisia’s low private investment ratio, possibly due to concerns with public governance noted above. Foreign direct investment was more erratic, but displayed a clear upward trend towards the end of the period under review in the three countries, reflecting both buoyant international capital markets as well as strong domestic recovery.
Stabilization in Colombia and Turkey, improved security in Colom-bia, and the prospect of accession in Turkey helped these countries to recover their investment performance. Policies in the areas normally covered by investment climate analyses also improved, with legisla-tion providing for insurance against changes in most laws and regula-tions in Colombia and legislation removing discrimination against foreign investment in Turkey being some of the successful reforms supported by the Bank. These improvements may have contributed more to total factor productivity growth than to the investment-to-GDP ratios.
Given the close relationship between investment and growth, it would be worthwhile for the Bank’s PREM and PSD units to work more closely together to better integrate macroeconomic with micro-economic approaches to growth. Although macroeconomic changes probably explain increases in investment in Colombia and Turkey, improvements in investment in the restricted business climate va-riables (that is, excluding macroeconomic and trade variables) may have been primarily reflected in increased productivity, rather than captured by aggregate private investment. Some of the increases in TFP observed in the three countries toward the second half of the pe-riod reviewed may be due to better product market regulations. Fur-thermore, the Bank can strengthen its diagnostic work by following IEG recommendations on the Doing Business indicators, particularly with regard to tracing the impact of reforms and using more of the available analyses to choose indicators.
Labor Regulations and Institutions. The Bank’s analytical work on labor market issues in the three countries has been of high quality. It has provided convincing, evidence-based analysis, and was conducted in close collaboration with local researchers and/or stakeholders. The work focused on key elements of the domestic policy debate, and iden-tified reform priorities. The analysis also took clear account of the inte-raction between policies in different areas (that is, it often effectively
Support for labor market regulations and institutions —primarily through AAA was of good quality, but with somewhat uncertain and perhaps limited impact.
Bank support for investment climate policies contributed to improvements in specific policy areas that helped raise investment or total factor productivity.

62
applied to a varying extent a broad framework similar to MILES). It addressed the two key components of the gap between the demand price and the supply price for labor that discourage employment: the rigidity of labor contract regulations, which creates a cost expectation to businesses, and payroll taxes and contributions. The Bank’s work on contributions has been closely linked to its work on the social services that these contributions finance. Not surprisingly given the sensitivity of labor policy issues, this AAA work was delinked from lending.
Unfortunately, moving toward less rigid regulations or lower contri-butions is rarely an objective that countries pursue on any sustained basis. The idea of making contracts more flexible is controversial and politically sensitive and reducing taxes faces either fiscal constraints or reductions in government services on which it can be difficult to reach consensus. Data on Colombia, Tunisia, and Turkey suggest little or no movement in these directions, although measuring rigidity of labor markets is not easy and available indices are sometimes contra-dictory.5
Continuing and extending AAA on labor markets can help improve labor market performance. Using AAA capitalizes on the Bank’s ca-pacity for labor market analysis and lowers the risks of undermining reform that often come with the difficult political economy of labor reform. In particular, the Bank can help improve and extend (perhaps in partnership with the OECD and the Bank’s Doing Business report) estimates and cross-country comparisons of labor rigidities and labor taxes. It can also further the understanding of low female participa-tion and employment rates in countries such as Tunisia and Turkey. The dialogue, dissemination, and advice part of AAA, although chal-lenging, can make this instrument more effective. At the same time, though, there are always risks such as the weakened dialogue on this matter in Tunisia.
Education. Key standard aims of education policies in most if not all countries have been to increase coverage, technical quality, and fit to the needs of labor markets. This has been the case as well in the three countries reviewed. To achieve these aims, and in addition to higher expenditures, policies in Colombia combined decentralization of ex-penditures, programs to target hard-to-reach populations, changes in curricula aimed at improving below-average quality of education, and expansion of non-formal training in an effort to improve the re-levance of courses. Policies in Tunisia were aimed at increasing cover-age and reducing gender gaps. In Turkey, the key policy was to ex-pand coverage by extending mandatory schooling from five to eight years. Progress in the three countries is summarized as follows (see also table N.5, Appendix N):
Support for education contributed primarily to coverage and the increased supply of skills needed to raise output and earnings growth.

63
Based on increases in average years of schooling for the popu-lation 15 years and older, progress during the past decade has been fastest in Tunisia, followed by Turkey.
Net enrollment in primary education did not change in Co-lombia during the evaluation period and declined in Tunisia and more so in Turkey. It had increased considerably in Co-lombia and Tunisia during the previous decade.
Net enrollment in secondary education increased most in Tur-key, followed by Colombia.
Gross enrollment in tertiary education increased most in Tur-key, followed by Tunisia.
Average years of education continued increasing at a rate of about 0.1 per year in Colombia and Tunisia, and 0.04 per year in Turkey. During the previous decade, years of education had increased faster in Turkey, at about the same rate in Tunisia, and more slowly in Colombia.
Expected years of schooling today are somewhat higher in Tunisia, followed by Turkey.
Improvements in test scores between 2003 and 2006 suggest an increase in the quality of education during the review period.
The increase in the percentage of businesses that view the workforce as inadequately educated, particularly large in Tur-key, suggests that increases in quality through education and training are not keeping pace with the changes in market re-quirements.
The Bank supported policies and expenditures to achieve the progress reflected in the results outlined above. Of Bank support in the three countries, support in Colombia, which included both AAA and project lending, was appreciated the most. This support helped im-prove quality, delivery of education services in poor, hard-to-reach rural communities, develop a student loan scheme for formal higher education, set up information systems within the Ministry of Educa-tion, and improve the effectiveness of non-formal training. Neverthe-less, from an evaluation perspective, some of these projects were not entirely satisfactory either because they did not fully meet the original objectives or because these objectives were not clearly articulated.
The Bank’s support in Turkey during the review period aimed to im-prove vocational training, help Turkey meet the Organisation of Eco-nomic Co-operation and Development’s (OECD’s) educational stan-dards, and expand coverage and quality of basic education. IEG Implementation Completion Report (ICR) reviews rated these projects less than fully satisfactory to varying degrees in that they did not en-tirely meet their original objectives, or where the objectives were not clearly articulated, or where implementation, particularly of pro-curement, was difficult. AAA contributions have been of good quality

64
and highlighted important policy issues directed to improving educa-tion of the poor. Among the three countries, however, the education sector in Turkey has proved the most difficult sector for the Bank’s work, where its impact has probably been more limited.
The Bank’s support in Tunisia focused on training to improve the fit of the labor force to market opportunities, restructuring of higher education to improve its responsiveness to the country’s needs, ex-panded coverage in anticipation of expected increases in enrollment, and enhanced quality to address the concern that large numbers of students fail to master basic skills. The projects have been rated satis-factory but the perceptions of stakeholders are that the Bank’s support of higher education has not been sufficiently far-reaching, particularly in addressing issues of quality. As noted in Chapter 3, exceptionally high unemployment of university graduates must be, at least in part, attributable to the poor quality and/or fit of university education.
In the higher education sub-sector in Tunisia, the Bank’s credibility has been damaged in the eyes of some observers because it has sup-ported a rapid and quality– compromising expansion in physical uni-versity facilities without first insisting on critical policy changes to in-crease university autonomy and accountability.
The Bank may find it appropriate to continue focusing on advice and projects to improve coverage and quality. With regard to quality, greater emphasis might usefully be ascribed to addressing skill mis-matches, which appear to be behind much of the structural unem-ployment observed in these countries Mismatches of skills between supply and demand are thought to be an important source of struc-tural unemployment, triggered, for example, by sector restructuring in Turkey and poor technical quality and inadequate skills in Tunisia. As discussed in the section on results, structural unemployment is an area where little or no progress was made in any of the three coun-tries. Indeed, the data indicate that skill mismatches may be increas-ing. In this regard, the Bank’s Education Network could work more closely with the PSD Network. The Bank should also continue its pur-suit of gender equality in education and gender balance in labor force participation. Social Protection. Social protection policies may have an impact on employment when they assure worker protection. They can substitute for job protection, thereby facilitating labor flexibility and mobility. Indeed, there is some evidence of this trade off in interna-tional comparisons,6 albeit separating countries in the Anglo-American tradition, where social protection “buys” more labor flex
ibility, from those in the European tradition. The key social protection instrument to substitute for job protection is unemployment insur-ance, but old age and health insurance, and cash transfer systems will also be relevant. There was little movement in this direction during
Support for social protection addressed different issues in the three countries.

65
the period under review. In Turkey, job protection was strengthened and an unemployment insurance system was introduced in August 1999 (it started paying benefits in 2002) as well as a CCT arrangement, together with pension reform. In Tunisia, there was no change in ei-ther. Colombia provides the richer experience as some relaxation of worker protection and a strengthening of a CCT system took place during the period reviewed.
Bank support in the three countries addressed different issues. In Turkey— which has a three-tier social insurance system comprised of pension, health, and unemployment insurance (including both formal unemployment insurance and mandatory severance payments)— the Bank recommended measures to improve the financial viability of the pension system. It also recommended developing a system that fin-ances and purchases a basic system from a pluralistic provider mar-ket, and eliminating mandatory severance in view of the presence of unemployment insurance. In addition, the Bank promoted the intro-duction of unemployment benefit rates that decline with unemploy-ment duration to encourage job search.7
In Colombia, the Bank played a strong role, together with the Inter-American Development Bank (IADB), acting as a catalyst of the condi-tional cash transfer program. In Tunisia, the Bank recommended in-troduction of employment insurance with a view to encouraging greater labor mobility.
Strategies for dealing with the long-term fiscal costs of expanding so-cial protection networks need to be built into the program design from the outset. The Bank (and the IADB) helped to improve the de-sign and finance the implementation of the main CCT program, Fami-lias en Accion, which has had a positive impact on a range of social outcomes. However, the program is growing rapidly, well beyond its original role as a temporary response to alleviate the social conse-quences of the 1999 crisis. The Bank should have given more attention earlier to the longer-term fiscal implications of the program, including how it would be financed when external financing was no longer available.
The apparently insurmountable problems have led to establishing par-tial and imperfect systems that are unlikely to fit the bill from the pers-pective of delinking worker protection from job protection. The Bank needs to continue working on implementing worker protection instead of job protection. This has not been easy, as the Colombian and Turkish experiences demonstrate. The key constraints, affordability on the one hand and a correct incentive structure on the other, need to compatible. Efforts in this area should also factor in the informal sector, as an afford-able and efficient unemployment insurance system may help encourage formality.

66
The Current Global Employment Crisis As world GDP growth declined sharply as a result of the solvency and credit crises in world financial markets during 2008-09, unem-ployment rates increased and employment and earnings growth de-clined. In its 2009 Global Employment Trends Report, the Internation-al Labor Office estimated that world unemployment would increase from 5.7 percent in 2007 and 6.0 percent in 2008, and to within 6.1 percent and 7.1 percent by the end of 2009.8 In its “Scenario 2” projec-tion, where the “negative impact on unemployment is taken in each country at the time of the largest year-on-year drop in GDP,“ and IMF November 2008 GDP growth projections are used (2.2 percent in 2009), the unemployment rate would have reached 6.5 percent by the end of 2009, resulting in an increase of 31 million unemployed com-pared to 2007.
Increases in world unemployment may have been even higher (to 6.8 percent) under the most recent (October 2009) IMF growth projections for 2009 of minus 1.1 percent.9 The largest increases in the unem-ployment rate are probably occurring in developed economies, Cen-tral and South Eastern Europe (non-EU) and CIS, and Latin America and the Caribbean. The employment-to-population ratio, which had been recovering since 2004, already declined by 0.2 percentage points in 2008 and possibly declined further in 2009. With declining output growth, declining earnings growth is projected to raise $2-a-day po-verty rates by up to 5 percentage points between 2007 and 2009.10 All of these projections are of course quite fluid and likely to change sig-nificantly. Although world GDP growth has started to recover with an IMF October 2009 projection of 3.1 percent for 2010, unemploy-ment effects are likely to linger for a while longer.
The major economies have responded to the crisis primarily by in-creasing public expenditure (bailouts, infrastructure, education, health) and lowering interest rates, with the expectation that these measures will rekindle growth in late 2009 or 2010. The United States is also raising its low unemployment benefits. Many European coun-tries are subsidizing part-time employment, and the United Kingdom is subsidizing hiring and training. Middle-income economies are reacting in various ways.
Performance and policy response in the three economies covered by this report provide a sample of the challenges being faced:
In Colombia, the government (Central Bank/National Planning Department [DNP]) estimates that growth de-clined to 2.5 percent in 2008 and to about 0.0 percent in 2009, down from 6.9 percent and 7.5 percent respectively in 2006 and 2007. Average annual (past 12 months) urban
Countries are introducing a variety of policies to help contain the deepening of global unemployment.

67
unemployment increased steadily from 10.4 percent in May 2008 to 11.6 percent in July 2009. Colombia’s response to the crisis includes countercyclical fiscal policies with some tax reduction, and expenditures on infrastructure and business subsidies; increasing access to international financing, expanded business finance, training and em-ployment services, and conditional cash transfers. The Bank is supporting the CCT program and private sector ef-ficiency and competitiveness programs.
In Tunisia, the unemployment rate had remained stable at a rate of just over 14 percent in 2008. As in Colombia and Turkey, both fiscal and monetary policies are expansionary at this point. Macroeconomic/investment climate policies are designed in part to combat the possible adverse impact of recession in Europe and to target enhancements in glob-al integration, business climate, and the financial sector. The Bank is supporting these policies.
In Turkey, growth is estimated to decline to 0.9 percent in 2008, and is expected to decline further to -8.0 percent in 2009, down from 6.9 percent and 4.7 percent respectively in 2006 and 2007. Unemployment increased from 9.9 per-cent in 2007 to 10.7 percent in 2008 and may increase fur-ther to 13.4 percent in September 2009 as a result of declin-ing growth. The Bank is supporting programs in education, competitiveness, employment and finance.
The following points summarize a number of the implications con-cerning Bank support during job crises:
The Bank may adjust its programs to emphasize more strongly its support for employment-related objectives. Country Directors are the logical focal points to engage with country authorities on ways to in-crease the impact of Bank programs on employment outcomes. Many governments have made adjustments to their policies in reaction to the financial crisis. The Bank can follow suit by emphasizing those areas it can support that best address constraints to employment crea-tion and earnings growth. One obvious adjustment is to emphasize more AAA to diagnose constraints to employment in many of the countries (as the program in Turkey is doing at present).
The Bank’s integrative capability can be put to good use in providing support in the different areas affecting employment outcomes. The current exogenous factors are likely to raise challenges in the macroe-conomic, investment climate, labor regulation, education, and social protection areas. As current exogenous shocks to output in develop-ing countries raise unemployment, the Bank is well-positioned to help develop policy options in the various areas that have a bearing on the

68
full set of employment outcomes, including unemployment and earn-ings. In a recession, slow employment growth, cyclical unemploy-ment, and declining earnings or declining earnings growth become major issues. The Bank has a good integrative framework to help countries address these issues with a good balance between counter-cyclical policies and fiscal prudence, measures to speed up improve-ments in the business climate, measures to encourage employers to hire, training arrangements for those unemployed to speed up their rehiring, and safety nets. These are of course unlikely to apply un-iformly. For example, the macroeconomic policy component will like-ly be more critical in a country like Turkey than in one such as Tuni-sia.
Monitoring and analyzing employment and earnings conditions as they evolve has now become more of a priority. Yet there are impor-tant gaps in developing country employment and earnings statistics in particular. The Bank can work in concert with other partners, in-cluding the ILO, the Organisation for Economic Co-operation and Development (OECD), the International Monetary Fund (IMF), and the regional Multilateral Development Banks (MDBs) to help coun-tries speed up the delivery and improve the quality of employment and employment-related data (such as earnings, taxation of wages, minimum wages, and others).
Given that employment policy issues span across several Bank net-works— particularly Poverty Reduction and Economic Management (PREM), Human Development and private sector development (PSD)— integrative work across these networks is likely to strengthen the Bank’s effectiveness. Examples of key employment policy issues of interest with regard to the current crisis include:
Improving monitoring of how the employment and earnings situations evolve and diagnosing evolving constraints to em-ployment in many of the countries. To assist in this endeavor, the Bank can consider work in concert with other partners, in-cluding the ILO, the OECD, the IMF and the regional MDBs to help affected countries speed up the delivery and improve the quality of data on employment-related variables. This data is sorely needed to assess the jobs and earnings situation as it unfolds.
The impact of the global recession on structural unemployment. As economies restructure in the face of recession, much of the new cyclical unemployment is likely to become structural. This strengthens the case for the Bank to consider helping de-sign policies to reduce skills mismatches. Bank engagement might also usefully spotlight minimum wages and their inte-raction with non-wage costs, which in the three countries re-

69
viewed may have caused unemployment and informality. These effects are likely to deepen during recession.
Strategies to promote job flexibility and worker protection. Develop-ing job flexibility today is likely to help bolster employment and earnings growth, particularly as economies recover. Strengthening worker protection will help the unemployed, particularly as unemployment rates increase under the present crisis.
Finding the right balance between macroeconomic stability and the fiscal cost of other employment-related policies. The experience re-viewed in this report (Colombia) calls attention to ensuring the financing sustainability of expansion in social protection sys-tems.
Strengthening the interaction between macroeconomic and microeconomic conditions affecting growth and employment demand. As this evaluation report argues, an improved in-vestment climate, that good macroeconomic policies will help achieve, may increase total factor productivity growth and in-vestment and thereby encourage employment and earnings growth.
Understanding the interface between quality of education and absorption of labor services. Skill mismatches remain an im-portant source of structural unemployment that education pol-icies may help address.
Assessing the possible effect of differential changes in employment and earnings on migratory flows. Some countries are likely to be more adversely affected than others. This may trigger migra-tory flows with multiple effects on employment–related and other key macroeconomic variables.
Country programs will be more effective as they focus on areas where progress in the enabling conditions has been slow but where windows of opportunity for reform may surface as a result of the crisis, as has happened in Colombia and Turkey. The area where progress has been typically slow is in making labor regulations more flexible and labor taxes lower. Employment crises in Colombia and Turkey created windows of opportunity for reform in this area, and the current global crisis may also create further opportunities in this and other areas.
Conversely, the Bank can also help countries maintain progress where it has been achieved, as was the case with macroeconomic stability in the three countries reviewed. In this regard, the Bank can deploy its multi-sector capacity to help countries avoid conflicts between em-ployment policies (e.g., making sure that stimulus packages or ex-tended social protection are affordable).


71
Appendix A. Country Assistance Strategy (CAS) Objectives
Colombia, Tunisia, and Turkey
Country CAS Date CAS Objectives: 1997-2008
Colombia
1997/10/15 1) Promoting peace and development through a focus on the socio-economic determinants of violence, 2) promoting rural development, 3) developing human capital, 4) attaining public sector efficiency, 5) improving infrastructure services, and 6) ensuring sustainable development. (CAS, p. 10).
1999/11/01 (Progress Report)
1) Promoting peace and development through a focus on the socio-economic determinants of violence, 2) promoting rural development, 3) developing human capital, 4) attaining public sector efficiency, 5) improving infrastructure services, and 6) ensuring sustainable development. (CAS Progress Report, p. 2).
2002/12/24 Supporting Colombia's quest for peace in three essential areas: (1) achieving fast and sustainable growth; (2) sharing the fruits of growth; and, (3) building efficient, accountable, and transparent governance. (CAS, p.22).
2005/09/09 (1) Achieving fast and sustainable growth; (2) sharing the fruits of growth; (3) building efficient, accountable and transparent governance; and (4) building the foundations for peace. (CAS, p.11)
2008/03/04 (1) Peace and Security for Citizens, promotion of Equity; (2) high and sustainable growth; (3) a state at the service of its citizens; and (4) promotion of Environmental Sustainability, as well as support for its Transversal Themes1 (CAS, p. 14).
Tunisia
1996/06/25 (1) Deepening structural reforms; (2) human capital development; (3) modernization of services; (4) environmental management. (CAS, p. 15)
2000/03/28
(1) Consolidating long-term development through activities in sectors of traditional Bank involvement; (2) supporting economic reforms to enhance competitiveness and increase employment; (3) new initiatives of a catalytic nature to strengthen local institutions launching new development niches (e.g., information technology), and mobilizing external finance. (CAS, p. 21)
2004/06/03
(1) Strengthening the business environment to support the development of a more competitive, internationally integrated private sector and improving competitiveness of the Tunisian economy; (2) enhancing the skills and employability of graduates and labor force in a knowledge economy; and (3) improving the quality of social services through enhanced efficiency of public expenditures. (CAS, p. i-ii)
2007/08/13 (Progress Report)
1) Strengthening the investment climate and competitiveness, (2) improving education quality and graduate employability for an increasingly knowledge-based economy, and (2) improving social services through more efficient public expenditure. (CAS, p.3)
Turkey
1997/08/06
1) Improving economic management (privatization, social security, agricultural subsidies, public financial management, banking); 2) reducing poverty and increasing social development (agricultural productivity, universal schooling through 8th grade; health indicators; health insurance, pensions); and 3) improving competitiveness and employment (government’s policy and regulatory role). (CAS, p.14-17)
2000/11/28 Reducing vulnerability through: 1) restoring stable and higher growth; 2) creating employment; 3) reducing inflation; 4) improving public management and accountability; and 5) expanding social services and social protection. (CAS, p.ii).
2001/07/10 (Progress Report)
Reducing vulnerability through: 1) restoring stable and higher growth; 2) creating employment; 3) reducing inflation; 4) improving public management and accountability; and 5) expanding social services and social protection. (p 14)
2003/10/02 1) Mitigating the impact of financial and tectonic crises on people, and (2) supporting the modernization and strengthening of institutions for the future. (CAS, p.8)
2005/11/08 (Progress Report)
1) Reducing economic vulnerability; 2) achieving high and stable growth; 3) reducing the risk of a reemergence of crisis; and 4) addressing the many challenges of preparing for EU membership. (CAS, p.3)
2008/01/25
Unlocking Turkey’s potential for fast and sustained growth while establishing equal opportunity and allowing more citizens to share in the benefits of growth, through reforms that also facilitate Turkey’s EU accession. Three pillars: 1) improved competitiveness and employment; 2) equitable human and social development, and efficient provision of high quality public services; 3) with emphasis on the reduction of regional differences. (CAS, p.23)

72
Appendix B. Colombia: Baseline and Latest Outcome Indicators by MILES Component
Colombia: Indicators of Outcomes Organized Along the MILES Framework
Indicator Baseline
1998 Latest 2007/8
Comments
Macroeconomic
Inflation (12-month, %) 16.7 5.7 Major improvements in inflation and external debt service indictors.
External debt service ratio (%) 48.7 27.9 [2006]
Central government deficit (% of GDP) 5.4 3.3
Non-financial public sector deficit (% of GDP)
4.6 1.0 Deficit peaked at 6.4 percent in 1999; sustained reduction began in 2003.
Tax revenue (% of GDP) 17.6 24.1 Most of the gains in tax revenue/GDP occurred in the last three years covered.
Public capital expenditure (% of GDP) 8.0 7.2
Public debt (% of GDP) 34.1 38.3 Public debt reached a peak of 60 percent of GDP in 2002, and has fallen sharply since.
Capital adequacy of banks: capital to risk-weighted assets (%)
9.4 [2000] 13.6 [Aug 2008]
Dramatic improvements in all financial soundness indicators.
Non-performing loans (% of total) 10.7 4 [Aug 2008]
Provisions to non-performing loans 37.9 120 [Aug 2008]
Investment Climate
Ranking in WEF Global Competitiveness survey (% of countries ranked lower)
13 45
ICRG score for corruption a/ 1.5 2.5
Time required to start a business (days) b/ 60 [2003] 36
Average time to enforce a contract (days) c/ 1,510 [2004] 1,346
Average time to file all business tax returns (hours) d/
456 [2004] 256
Time required to complete foreign trade procedures (days) e
Export 34 [2006] 14
Import 48 [2006] 15
Domestic credit to private sector (% of GDP)
36.7 39.6
(check)
Credit to private sector slumped to 25 percent of GDP in 2003 before rebounding.
Foreign direct investment, net ($ billion) 2.03 8.66 Large increases in FDI inflows in last few years.
Private investment (% of GDP) 14.3 17.6

73
Colombia: Indicators of Outcomes Organized Along the MILES Framework
Indicator Baseline
1998 Latest 2007/8
Comments
Labor Market
Non-wage payroll costs (% of wage) 52.2 55.2 The non-wage costs of employing labor in the formal sector rose from under 40 percent to about 52 percent in the mid-1990s, and increased 3 more percentage points in 2002-03 as a result of increased pension and unemployment insurance costs.
Numbers of apprenticeship contracts (annually)
of which: from non-SENA training institutions
33,000
[2000]
0
75,000
[2005]
16,000
Substantial expansion in apprenticeship contracts, with growing share for non-SENA courses.
Average dismissal costs (months of wages) 13.4 10.1 [2004] Dismissal costs reduced moderately as a result of the 2002 reform.
Rigidity of employment index f/ 27 [2004] 24
Number of graduates from SENA training courses (annually)
0.9 million
[2003]
4.1 million
Education
School enrollment (% net) Significant increases in primary and secondary enrollment
Primary 87.3 88.5 [2006]
Secondary 53.6 64.9
Tertiary (% gross) 22.0 31.0 [2006]
Primary completion rate (% of relevant age group)
90.1 105.2 [2006] Increased primary completion rates.
Male 87.9 103.4 [2006]
Female 92.3 107.1 [2006]
Social Protection
Number of beneficiaries of unemployment subsidies; of which:
0 110,000 [2005]
Share of informal sector workers (%) (0) (46)
Number of beneficiaries of conditional cash transfer schemes (million)
0 1.5
Number of beneficiaries of subsidized health insurance (million)
10.7
[2002]
18.6
[2006]
a 0=worst; 6=best. b From World Bank “Doing Business” reports. c Ibid; d Ibid. e Ibid. f From World Bank “Doing Business” reports. The rigidity of employment index is the average of three sub-indices: difficulty of hiring, rigidity of hours, and difficulty of firing. Index range is 0-100, with higher values indicating greater rigidity. Sources: Banco de la Republica,, National Administrative Department of Statistics (DANE), Ministry of Finance, Ministry of Labor and So-cial Protection, Superintendency of Financial Institutions, National Planning Department, World Development Indicators (World Bank), World Economic Forum: Global Competitiveness Survey Indicators, Doing Business Indicators (The World Bank). Note: FDI= foreign direct investment; GDP= gross domestic product; ICRG= International Country Risk Guide; MILES= Macroeconomic Conditions, Investment climate and infrastructure, Labor market regulations and institutions, Education and skills development; and Social safety net; SENA= Servicio Nacional de Aprendizaje (National Learning Service, Colombia); WEF= World Economic Forum

74
Appendix C. Colombia: World Bank Program by MILES Component
Colombia
Bank Program Amount
(US$ millions)
IEG Outcome Rating
Comment (Including conclusions of IEG reviews)
Macroeconomic Policy
Lending
Public Financial Management II [FY01]-P040109
35 Satisfactory The objective was to strengthen the institutional capacity of the tax agency (DIAN) and public expenditure management. Improvements in tax administration targeted were judged as very likely to be sustained, but the project did not significantly improve the discretionary tax policies.
Structural Fiscal Adjustment Loan [FY02]-P073572
400 Moderately Satisfactory Rationalize the system of transfers to local governments; improve efficiency in the provision of public health services; pension-related contingent liabilities; reorganization of public agencies and their current expenditures; manage public debt. Structural improvements achieved across a number of areas, but failure to reduce actual fiscal deficit in 2002 and unsatisfactory Social Service Institute reform detracted from the benefits achieved in other areas.
Fiscal and Institutional Adjustment Loans: FIAL I [FY03]-P080831 FIAL II [FY04]-P083905 FIAL III [FY05]-P084762
300 150 100
Moderately Satisfactory Moderately Satisfactory Moderately Unsatisfactory
The project’s objective was to support fiscal sustainability in the long term through a series of reforms to the tax system, expenditure, procurement, and the rationalization of public administration. The results were mixed: fiscal adjustment was achieved, but envisaged improvements in the legal and institutional frameworks in many areas were not achieved.
Financial Sector Adjustment Loans: FSAL I [FY03]-P078869 FSAL II [FY05]-P082597
150 100
Satisfactory Moderately Satisfactory
Strengthen capacity to manage and mitigate weaknesses in the financial system; reduce outstanding fiscal contingent liabilities; also focus on housing mortgage market, and securities regulatory framework. The overall objective was judged highly relevant and most immediate objectives were achieved, but design of the FSAL II was judged deficient in some respects because of: i) lack of a clear link between project components and outcomes; ii) limited interval for implementation between FSAL I and II; and iii) failure to address the financial transactions tax.
Analytical Work
CPAR [FY01]-P076038 Analysis of public procurement and contract management.
Corporate Governance ROSC [FY03]-P082535
Corporate governance ROSC assessment in Colombia.
Auditing and Accounting - ROSC [FY04]-P085186
Within the ROSC Initiative, review and identify the strengths and weaknesses of accounting and auditing standards in Colombia.
CFFA [FY04]-P078889 Analyzes Colombia's current system of public sector financial management.

75
Bank Program Amount
(US$ millions)
IEG Outcome Rating
Comment (Including conclusions of IEG reviews)
Improved Public Expenditure Efficiency [FY04]-P066038
Reviews Colombia's fiscal performance, including fiscal sustainability, tax policy, allocation of expenditures, and financial management.
CEM [FY05]-P089795 Country economic memorandum that investigates competitiveness, fiscal efficiency, and the impact of the US FTA on agriculture and SMEs.
CPAR [FY05]-P090009 Updates progress on the Country Procurement Assessment Report since 2001. Concludes that the process of modernization and procurement reform is evolving slowly in spite of government commitment.
FSAP Update [FY05]-P090046 Assists authorities in assessing the development needs of the financial sector, and identifying potential vulnerabilities of financial institutions and markets to macroeconomic shocks.
Policy Notes [FY06]-P094861 Notes for incoming government. Discusses macroeconomic stability and fiscal performance.
Investment Climate
Lending
1st Business Product and Efficiency [FY06]-P094301
250 Enhances business environment by reducing transaction costs for entrepreneurial activities, facilitates foreign trade, legal framework for secure foreign direct investment.
2nd Business Product and Efficiency [FY07]-P095213
300 Enhances foreign trade competitiveness, improves quality standards and technological innovation framework.
3rd Business Product and Efficiency [FY08]-P105029
550 Improves the quality standards and technological innovation framework; and strengthens infrastructure and logistics.
Analytical Work
Recent Economic Development in Infrastructure [FY04]-F086806
Provides an integral evaluation of recent economic developments in Colombia's infrastructure sectors: electricity, natural gas, telecommunications, water, and transport sectors.
CEM [FY05]-P089795 Country economic memorandum that will investigate, competitiveness, fiscal efficiency, and the impact of the US FTA on agriculture and SMEs. Discusses private sector participation.
Competitiveness Study [FY06]-P090870
Reviews the logistics chain and quality assurance for Colombian foreign trade products.
Regional Competitiveness & Infrastructure [FY07]-P101348
Explores overall investment climate, infrastructure and logistics, and human capital and innovation at the regional level to increase competitiveness.
Labor Market Policies
Lending
Community Works [FY00]-P068762
100 Moderately Unsatisfactory
Financed small, labor-intensive public workers to provide temporary employment to poor workers. Also known as Empleo en Accion. Project design inefficiencies led to substantial delays in implementation. The cost per job generated was significantly higher than that of similar programs and the share of income transferred to program participants was low.

76
Bank Program Amount
(US$ millions)
IEG Outcome Rating
Comment (Including conclusions of IEG reviews)
Social Sector SAL [FY03]-P069861
155 Satisfactory In terms of labor market policy supports Jovenes en Accion (cash grants to choose on the job training), implement legislation to encourage incentive on-the-job training. Impact evaluation of Empleos en Accion.
Labor Reform and Social Development Policy Loans: PLaRSSAL I [FY04]-P079060 PLaRSSAL II [FY05]-P082865 PLaRSSAL III [ FY07]-P094097
200
200 200
Satisfactory Satisfactory Highly Satisfactory
Supported the following objectives: (a) increase employment; (b) raise human capital formation; and (c) strengthen social protection. In terms of LMP, support reform of labor regulations to reduce non-wage costs and wages, reducing structural inefficiencies, employer incentives, and training infrastructure. The program as a whole and 3rd loan in particular achieved most of the planned outcomes, in several cases surpassing targets. The Bank was also judged to have provided high-quality technical assistance.
TAL to support the PLaRSSAL [FY05]-P094097
2 Assists the Department of National Planning (DNP) and the Ministries of Social Protection (MSP) and Education (MEN) to improve their knowledge, develop effective instruments, and strengthen their ability to carry out reforms supported by the PLaRSSALs.
Analytical Work
Colombia Poverty Report [FY02]-P066036
Analyzes impact of economic development, or lack thereof, on the welfare of the Colombian population. Analyzes labor market outcomes and proposes more flexibility in the labor market.
Public Training Reform Issues [FY04]-P074786
Analyzes the effectiveness, efficiency and equity of SENA's programs and lays out reform options to optimize its contribution to skill upgrading.
Labor Reform Agenda [FY05]-P074781
Analyzed the labor market and gauges the impact of the 2002 reform.
Informality /Soc Protection Study [FY07]-P095603
Background papers analyzing informality in Colombia's labor market.
Informality /Soc Protection Study II [FY08]-P100322
Phase II uses the surveys from Phase I and collects qualitative data from firms and workers to better understand the dynamics of the informal sector.
Poverty & Jobs [FY08]-P110542
Expands on poverty work done in 2006. Provides advice on income generation, including active labor market policies (ALMP)
Education Policies
Lending
Antioquia Education [FY98]-P006891
40 Moderately Satisfactory
Objective was to improve access and retention rates and improve effectiveness of delivery of educational services. Objectives only partly achieved (more in urban than in rural areas, possibly because of armed conflict). Targets for dropout, repetition and student math achievements were not met. Communities were not able to assume management responsibilities as expected. Many of the activities under the project were plans, and their sustainability was not known.

77
Bank Program Amount
(US$ millions)
IEG Outcome Rating
Comment (Including conclusions of IEG reviews)
Pasto Education [FY98]-P046112
7.2 Satisfactory The objective was to improve access, retention, and learning in Pasto. Objectives partly achieved. Vouchers to low-income students greatly exceeded targets and the poorest students were effectively reached. The quality enhancement objective was not met.
Cundinamarca Education Quality Improvement [FY04]-P077757
15 Highly Unsatisfactory Most activities under the project were not implemented because of changes in municipal political leadership
Antioquia Basic Education [FY08]-P082908
40 Increases equitable access and retention in primary education.
Antioquia Secondary Education [FY08]-P052608
20 Increases equitable access and retention in upper-secondary education. Increases the proportion of public school secondary-education graduates who continue on to tertiary education.
Rural Education APL I [FY00]-P050578
20 Satisfactory Objectives and program design judged highly relevant, including focus on “access to quality” and recognition that problem of urban-rural disparities could be solved only with long-term support. Project served many more municipalities and students than originally targeted, but gaps in the definition of outcomes indicators, including quality measures, complicated measurement. Efficacy of project rated as substantial.
Higher Education - Improving Access [FY03]-P074138
200 Improve quality and equity in tertiary education through targeted and merit–based student loans and a quality– enhancement framework.
Second Student Loan Support Project [FY08]-P105164
300 Provides student loans to talented but needy students and improves management practices to allow ICETEX to operate more efficiently and increase sustainability.
Analytical Work
Higher Education Strategy [FY02]-P077435
Highlighted the priorities for the tertiary education sector. Delivered results in close collaboration with local counterparts.
Contracting Education Services [FY05]-P085591
Technical assistance on the practice of contracting education services.
Education Quality Program I [FY08]-P106710
In progress.
Social Protection
Lending
Human Capital Prot. - Cash Transfers [FY01]-P069964
150 Satisfactory Supports Colombia's conditional cash transfer program, Familias en Accion. Considered a social protection intervention. Project objectives and design judged highly relevant, drawing on similar programs tested elsewhere in Latin America. Objectives of better schooling, nutrition, and health outcomes for poor children substantially achieved
Social Safety Net Project [FY06]-P089443
86 Satisfactory Consolidates and expands the successful Familias en Accion Conditional Cash Transfer program. Considered a social protection intervention.

78
Bank Program Amount
(US$ millions)
IEG Outcome Rating
Comment (Including conclusions of IEG reviews)
Social Safety Additional Financing [FY07]-P104507
105 Consolidates and expands the successful Familias en Accion Conditional Cash Transfer program. Considered a social protection intervention.
Analytical Work
Colombia Poverty Report [FY02]-P066036
Analyzes the impact of economic development, or lack thereof, on the welfare of the Colombian population. Discusses access of social protection for poverty alleviation.
Social Sector Review [FY02]-P064857
Analysis of Colombia's social safety net system.
Informality /Soc Protection Study [FY07]-P095603
Discusses expansion of pension coverage.
Informality program II [FY08]-P100322
Discusses social protection mechanisms for informal sector workers.
Source: Project Documents, AAA Reports, and IEG Evaluation. Note: ALMP= Active Labor Market Policies; APL= Adaptable Program Loan; CEM= Country Economic Memorandum; CFAA= Country Financial Accountability Assessment; CPAR= Country Procurement Assessment Review; DIAN= National Tax Office (Colombia); DNP= Department of National Planning (Colombia); FIAL=Fiscal and Institutional Adjustment Loan; FSAL= Financial Sector Adjustment Loan; FSAP= Financial Sector Assessment Program; FTA= free trade agreement; FY= fiscal year; ICETEX= Colombian Public Student Loan Bank; IEG= Independent Evaluation Group; LMP= labor market participation; MEN= Ministry of Education; MSP= Ministry of Social Pro-tection; PLaSSAL= Programmatic Loans Supporting Labor Reform and Social Development Policy; ROSC=Report on the Observance of Standards and Codes; SAL= Structural Adjustment Loan; SENA= National Education Service; SME= small and medium enterprises; TAL=technical assistance loan.

79
Appendix D. Colombia: Annex Tables
Table D.1 Colombia: Growth, Poverty, and Income Distribution Indicators
(percent, except first row)
COLOMBIA 1990 1991 1992 1993 1994 1995 1996 1997 1998 1999 2000 2001 2002 2003 2004 2005 2006 2007
Per Capita GDP ( Constant 2000 International Dollars) a/ 5571 5590 5763 5791 6018 6218 6234 6336 6263 5900 5974 5965 5987 6124 6329 6536 6886 7314
GDP (LCU) growth a/ 6.0 2.3 5.0 2.4 5.8 5.2 2.1 3.4 0.6 -4.2 2.9 1.5 1.9 3.9 4.9 4.7 6.8 7.5
Per Capita GDP Growth a/ 4.0 0.3 3.1 0.5 3.9 3.3 0.3 1.6 -1.1 -5.8 1.2 -0.1 0.4 2.3 3.3 3.3 5.4 6.2
Poverty headcount ratio b/ 11.2 13.5 16.1 16.5 16.8 15.4 16.0
Poverty headcount ratio c/ 31.0 33.0 37.6 36.9 33.1 34.8
Poverty headcount ratio d/ 18.7 20.9 17.7 17.6 15.5 17.2 18.5 20.8 25.4 19 18.7 20.7 15.8 17.4 14.7 11.3
Poverty headcount ratio e/ 48.6 49.2 49.6 46.7 46.6 46.2 47.6 49.4 52.0 54.2 51.7 51.9 53.7 51.2 51.0 50.3 50.0 47.9
Poverty headcount ratio f/ 45.0
Gini Coefficient g/ 57.2 56.1 57.9 57.5 58.8 58.5
Gini Coefficient h/ 49.1 54.6 55.5 55.4 55.9 55.9 56.7 57.4 57.9 60.1 56.3 55.8 59.0 57.0 58.0 58.0 58.3 58.6 Sources: a/ The World Bank (World Development Indicators). b/ $1.25-a–day poverty line (World Bank updated (2008) poverty estimates (<www..worldbank.org>). c/ $2.50-a-day poverty line (World Bank updated (2008) poverty estimates (<www..worldbank.org>). d/ Poverty line: cost of food basket meeting minimum nutritional needs (1991-05): Official DNP estimate: See Nina Baltazar et. al. (2007). 2006: staff estimate based on DNP data); e/ Poverty line: 2.1 times (4/), based on ratio of total to food expenditure for the poorest 25 percent of the population: (1991-05: Official NPD estimate; See Baltazar et. al. (2007). 2006-07: staff estimates based on DANE/DNP (2009). f/The World Bank (World Development Indicators) g/ World Bank updated (2008) poverty estimates (<www.worldbank.org>); 8/ Staff estimates from data in Acevedo et. al. (2007), Figure 4, p. 57; Montenegro (2006); and DANE/DNP (2009). Note: GDP= gross domestic product; LCU= local currency unit.

80
Table D.2 Colombia: Population and Labor Force Participation (LFP) Rates
(percentages except first row)
COLOMBIA 1990 1991 1992 1993 1994 1995 1996 1997 1998 1999 2000 2001 2002 2003 2004 2005 2006 2007
Population, total (millions) a/ 34.9 35.5 36.2 36.9 37.6 38.3 38.9 39.6 40.3 41.0 41.7 42.4 43.0 43.7 44.3 44.9 45.6 46.1 Population growth (annual %) a/ 2.0 1.9 1.9 1.9 1.8 1.8 1.8 1.8 1.7 1.7 1.7 1.6 1.6 1.5 1.5 1.4 1.4 1.2 Urban population (% of total) a/ 68.3 68.7 69.2 69.6 70.1 70.5 70.8 71.1 71.5 71.8 72.1 72.4 72.7 73.0 73.3 73.6 73.9 74.2 Total LFP Rate (DANE) b/ 57.1 57.6 56.8 56.2 56.4 56.9 56.4 56.6 58.5 59.4 61.8 62.3 60.2 63.0 60.0 60.0 56.3 57.6 Total LFP Rate by Gender (DANE) – Total c/ 63.3 62.2 63.0 60.7 60.8 56.8 59.0
Male c/ 76.3 75.2 75.2 74.1 73.9 71.3 72.2 Female c/ 51.2 50.4 52.1 48.6 49.0 43.9 47.2
Total LFP Rate by Gender (ILO) – Total d/ 60.1 62.4 63.2 64.0 62.8 63.1 63.3 64.1 64.8 67.7 68.1 68.5 68.9 69.3 69.7 70.1 70.5 70.9 Male d/ 76.7 77.8 78.1 78.9 77.9 78.0 78.0 77.5 77.2 78.9 78.9 78.9 78.9 78.8 78.6 78.4 78.1 78.7 Female d/ 44.2 47.8 49.0 49.8 48.5 49.0 49.5 51.5 53.1 57.0 57.9 58.7 59.6 60.4 61.3 62.2 63.2 63.6
Total LFP Rate by Gender (WDI) – Total e/ 62.9 64 64.3 64.9 65.2 65.5 66 66.5 67.2 68.2 68.6 69.1 69.7 70 70.5 70.9 71.2 Male e/ 81.2 81.4 81.3 81.4 81.3 81.2 81.2 81.1 81.2 81.4 81.3 81.3 81.3 81.1 81.1 81 80.9 Female e/ 45.5 47.3 48 49.1 49.9 50.7 51.7 52.7 54 55.7 56.5 57.7 58.7 59.6 60.4 61.3 62.1
Total LFP Rate by Gender - Total (WDI) f/ 66.4 67.6 67.9 68.6 68.9 69.3 69.8 70.4 71.1 72.3 72.7 73.3 73.9 74.3 74.8 75.3 75.7 Male f/ 84.9 85.2 85.2 85.3 85.1 85 85 84.9 85.1 85.4 85.3 85.3 85.3 85.2 85.2 85.1 85.1 Female f/ 48.5 50.5 51.3 52.5 53.4 54.2 55.3 56.4 57.8 59.7 60.6 61.9 63 63.9 64.9 65.8 66.7
Total LFP Rate by Sector - Total (WDI) g/ 56.4 56.6 58.5 59.4 61.8 61.9 61.5 62.1 60.8 59.9 58.4 Urban g/ 57.1 57.5 59.1 60.4 63.1 62.8 62.5 63.0 61.7 61.0 59.8 Rural g/ 54.7 54.4 57.2 56.7 58.3 59.5 58.8 59.6 58.2 56.8 54.4
Urban LFP Rate (7 Cities) h/ 59.8 59.6 59.9 62.2 63.1 64.3 64.6 65.0 65.3 64.0 63.7 62.2 62.0 54.6 54.3 55.0 54.4 55.1 Urban LFP Rate (13 cities) h/ 63.5 64.4 64.8 65 63.6 63.3 62 61.8 Urban LFP Rate by Gender (13 Cities) c/ 65.1 65.0 65.4 63.1 63.5 59.6 61.5
Male c/ 75.1 74.5 74.4 72.8 73.1 70.1 70.8 Female c/ 56.6 57.2 57.9 55.1 55.4 50.9 53.8
Sources: a/ The World Bank (WDI). b/ 1990-96: Lopez, Castaño (2001). 1996-00: DANE (National Statistical Office),< www.dane.gov.co>, “Mercado Laboral, Encuesta Nacional de Hogares. 2001-07”: DANE (National Statistical Office), <www.dane.gov.co>, (new methodology), “Mercado Laboral, Gran Encuesta Integrada de Hogares (Serie Mensual 01-08).”. Data are for September and cover ages 10 and older (12 and older for urban population until 2000). c/ DANE (National Statistical Office),< www.dane.gov.co>, “Mercado Laboral, Boletín de Sexo.” Data are for the 4th quarter and for ages 10 and older. d/ ILO 1990-2007. Data are for ages 15 and older. e/ The World Bank (WDI). Data are for ages 15 and more. f/ The World Bank, World Development Indicators. Data are for ages 15-64. g/ 1996-00: DANE (National Statistical Office),< www.dane.gov.co>, “Mercado Laboral, Encuesta Nacional de Hogares”. Data are for September and cover ages 10 and older (12 and older for urban population). 2001-07: DANE (National Statistical Office), (new methodology), <www.dane.gov.co>, “Mercado Laboral, Gran Encuesta Integrada de Hogares (Serie Mensual 01-08).” Data are yearly averages and cover ages 10 and older (12 and older for urban population until 2000). h/ Banco de la República,< www.banrep.gov.co>. Data are yearly averages. Note: DANE= National Department of Statistics (Colombia); ILO= International Labour Organization; LFP= labor participation rate; WDI= World Development Indicators.

81
Table D.3 Colombia: Employment-to-Population Ratio (percent) and Number of Hours Worked per Week
COLOMBIA 1990 1991 1992 1993 1994 1995 1996 1997 1998 1999 2000 2001 2002 2003 2004 2005 2006 2007
Total Ratio (DANE) (September) a/ 52.8 53.4 52.7 53.1 52.3 52.3 51.0 51.0 51.3 49.8 51.5 53.4 51.5 54.3 52.5 53.3 49.0 51.4 Total Ratio by Sector (DANE) b/ 51.0 51.0 51.3 49.8 51.5 53.1 51.9 54.2 52.9 53.6 49.8 52.1
Urban 50.7 51.0 50.5 49.1 50.9 52.7 52.0 54.3 52.9 53.7 50.8 53.1 Rural 51.6 51.2 53.6 51.3 52.9 54.2 51.8 54.0 52.7 53.6 47.2 49.3
Total Ratio by Gender (DANE) c/ 54.5 52.8 54.8 53.4 54.6 50.3 53.2 Male c/ 67.9 65.9 67.6 67.3 68.2 64.9 66.9 Female c/ 42.1 41.0 43.4 40.7 42.4 37.4 41.1
Urban Ratio (7 Cities) d/ 53.5 53.7 55.6 55.3 55.8 55.6 53.0 54.1 52.9 52.3 51.9 54.6 55.4 56.8 55.6 56.9 53.7 56.6 Urban Ratio (7 Cities) e/ 52.2 53.5 54.7 55.0 54.7 54.6 52.9 52.5 52.7 50.9 51.3 52.8 53.5 54.6 54.3 55.0 54.4 55.1 Urban Ratio (13 Metro Areas) f/ 52.6 52.7 53.4 54.2 53.8 54.5 54.0 54.8 Urban Ratio by Gender (13 Metro Areas) c/ 54.3 54.8 55.8 54.5 55.8 52.3 55.4
Male c/ 64.6 64.4 65.3 64.5 65.5 62.6 65 Female c/ 45.5 46.8 47.8 46.2 47.6 43.8 47.5
Hours Worked (7 Major Cities) g/ 48.2 47.8 48.2 48.3 47.9 48.0 47.5 47.0 46.7 45.3 Hours Worked per Week (Total) g/ 42.4 42.3 43.6 44.2 46.8 46.0
Male g/ 45.9 46.0 45.8 46.3 48.6 48.5 Female g/ 37.3 37.1 38.9 39.4 42.3 45.7
Hours Worked per Week (Manufacturing) g/ 41.6 41.6 42.7 43.6 46.6 45.1 Male g/ 46.5 46.4 46.3 47.1 49.5 49.2 Female g/ 36.8 36.2 38.2 39.6 42.8 40.0
Sources: a/ September of each year, age 10 and older (12 and older for urban population until 2000. Sources: 1990-95: Lopez Castaño (2001).1996-00: DANE (National Statistical Office), www.dane.gov.co, Mercado Laboral, Encuesta Nacional de Hogares; 2001-07 (new methodology): DANE (National Statistical Office), www.dane.gov.co, Mercado Laboral, Gran Encuesta Integrada de Hogares (Serie Mensual 2001-2008). b/ Same source as (1/), but: data for 2001-07 are August-October averages. c/ DANE, www.dane.gov.co, Mercado Laboral, Boletin de Sexo. Data are for 4th quarter and for ages 10 and older. d/ Banco de la Republica. <www.banrep.gov.co>. 4th quarter. e/ Banco de la Republica. <www.banrep.gov.co>. Yearly average. f/ Banco de la Republica. <www.banrep.gov.co>. Yearly Average. g/ ILO, LABORSTAT, http://laborsta.ilo.org Note: DANE=National Department of Statistics (Colombia); ILO= International Labour Organization; LABORSTAT=labor statistics database of ILO.

82
Table D.4 Colombia: Per Capita Gross National Income (GNI), Earnings by Education, Gender, and Sector, and Manufacturing Wage Index.
(US Dollar equivalent at year 2000 domestic prices except last two rows)
COLOMBIA 1990 1991 1992 1993 1994 1995 1996 1997 1998 1999 2000 2001 2002 2003 2004 2005 2006 2007
Real GNI per worker a/ 2240 2239 2325 2325 2482 2552 2591 2615 2525 2445 2381 2235 2312 2230 2398 2448 2848 2947 Earnings by Years of Education: - None b/ 1687 1613 1515 1685 1853 1858 1697 1562 1655 1554 1359 1411 1362 1341 1459 1407 Earnings by Years of Education: 1-5 b/ 1922 1862 1851 2046 2102 2080 1984 1958 1914 1891 1696 1630 1614 1598 1642 1710 Earnings by Years of Education: 6-10 b/ 2373 2306 2261 2486 2492 2468 2350 2339 2271 2172 1996 1786 1734 1713 1735 1786 Earnings by Years of Education: 11 b/ 3087 3007 2995 3234 3229 3163 3067 3122 3033 2998 2637 2314 2272 2206 2245 2265 Earnings by Years of Education: 12-15 b/ 3855 3765 3843 4174 4409 4154 4095 4048 4166 4179 3867 3188 3292 3155 3086 3202 Earnings by Years of Education: 16+ b/ 6565 6417 6745 7587 7717 8139 7923 8000 8422 8528 7437 6700 6740 6333 6636 6953 Earnings by Gender – Males b/ 3482 3444 3518 3881 3904 4006 3849 4009 4268 4140 3612 3242 3251 3224 3392 3369 Earnings by Gender – Females b/ 2428 2425 2428 2698 2879 2816 2838 2978 3090 3101 2771 2653 2733 2598 2745 2835 Earnings by Sector – Industry b/ 2911 2902 2883 3118 3148 3153 3044 3160 3423 3424 3011 2715 2645 2711 2800 2804 Earnings by Sector – Utilities b/ 3576 3472 3571 3827 3969 3710 4525 4616 4716 4554 4397 5103 5050 4772 4935 5356 Earnings by Sector – Construction b/ 2445 2524 2560 2740 2803 3001 2854 2834 2881 2686 2446 1710 1463 1490 1617 1498 Earnings by Sector – Trade b/ 1433 1410 1434 1601 1605 1612 1485 1509 1523 1446 1238 1091 1049 1049 1090 1082 Earnings by Sector – Transport b/ 3139 3105 3207 3387 3588 3422 3459 3568 3421 3270 3210 2541 2629 2511 2807 2448 Earnings by Sector – Finance b/ 6294 6016 6200 6753 7164 7462 6858 7490 8312 7773 7195 6241 6833 6202 6622 7274 Earnings by Sector – Government b/ 2240 2172 2220 2539 2770 2776 2836 3097 3412 3270 3412 3402 3582 3439 3356 3471 Earnings by Sector – Social Services b/ 739 739 749 865 876 871 897 920 987 991 841 866 896 871 929 948 Earnings by Sector – Other b/ 1571 1460 1511 1937 1701 1789 1723 1774 1799 2053 1678 1899 2474 2067 2211 2447 Net Minimum Wage c/ 58.9 58.7 58.7 57.1 45.8 44.9 45.8 46.7 48.8 53.3 51.7 53.5 54.4 52.9 51.3 50.1 48.4 46.6 Formal Sector Wage Index d/ 89.8 91.2 96.0 101.1 107.4 109.6 109.1 115.7 115.5 124.7 130.1 126.1 127.8 128.0 130.2 133.7 138.1 136.5 Sources: a/ The World Bank (WDI) for GNI; DANE for Employment. Nominal local currency GNI data was deflated with CPI (WDI, Index 2000=100) and converted to US dollars using the average exchange rate for the year 2000 (BR). b/ Staff estimates with DNP/DANE Household Survey data. Real annual earnings in US dollars at the 13 major metropolitan areas projected backwards from 2000 to 1990 with data for the 7 major cities. The nominal incomes data was deflated using CPI index (Year 2000=100). c/ BR and DANE, Percent of per capita GDP. Average daily net minimum wage for each year was multiplied by 250 days and divided by nominal per capita GDP. d/ Index (1990=100) Banco de la Republica. Real wages in manufacturing. Excludes coffee threshing (trilla). Note: BR= Banco de la Republica; CPI= Consumer Price Index; DANE= National Administrative Department of Statistics (Colombia); GDP= gross domestic product; GNI- gross national income; WDI= World Development Indicators.

83
Table D.5 Colombia: Unemployment Rate and Duration
(percentages, except last row)
COLOMBIA 1990 1991 1992 1993 1994 1995 1996 1997 1998 1999 2000 2001 2002 2003 2004 2005 2006 2007
Total unemployment rate (DANE) a/ 7.6 7.3 7.2 7.1 7.3 8.1 9.6 9.8 12.3 16.3 16.7 14.3 14.3 13.9 12.5 11.2 12.9 10.7 Total unemployment rate by Gender (DANE) b/ 13.8 15.1 13.1 12.1 10.2 11.4 9.8
Male b/ 10.9 12.4 10.2 9.1 7.8 8.9 7.4 Female b/ 17.8 18.7 16.8 16.2 13.5 14.9 13.0
Total unemployment rate by Gender (ILO) c/ 14.7 15.7 14.2 13.6 11.8 12.7 10.9 Male c/ 11.6 12.7 11 10.6 9.0 9.7 8.7 Female c/ 19.1 19.7 18.5 17.7 15.6 16.8 13.8
Total unemployment rate by Sector d/ 9.6 9.8 12.3 16.3 16.7 15.0 15.7 14.1 13.6 11.7 12.0 Urban d/ 11.2 11.3 14.6 18.7 19.2 17.4 17.2 15.8 15.1 13.3 13.2 Rural d/ 5.6 6.0 6.2 9.5 9.3 8.1 11.2 9.3 9.1 7.2 8.3
Urban unemployment rate (BR) e/ 10.5 10.2 10.2 8.6 8.9 8.8 11.2 12.4 15.2 19.4 20.2 18.2 17.7 16.4 15.1 13.6 12.6 11.1 Urban unemployment rate by Gender (ILO) f/ 10.2 9.8 9.2 7.8 7.6 8.7 12.0 12.1 15.0 20.1 20.5
Male f/ 8.1 7.4 6.5 5.3 4.9 6.8 9.6 9.8 12.5 17.2 16.9 Female f/ 13.2 13.1 12.6 11.0 11.2 11.3 15.1 15.1 18.0 23.3 24.5
Urban unemployment rate by Gender (DANE) b/ 16.7 15.8 14.8 13.7 12.1 12.3 9.9 Male b/ 14.0 13.6 12.3 11.4 10.3 10.7 8.2 Female b/ 19.7 18.1 17.4 16.1 14.2 14.0 11.7
Urban unemployment rate (BR) g/ 17.3 18.2 17.6 16.6 15.3 13.9 12.9 11.4 Unemployed: No. of Weeks of Job Search h/ 44.8 43.0 44.6 43.2 39.6 32.2 25.0
Male h/ 42.1 40.6 41.3 40.7 37.6 31.4 23.5 Female h/ 47.3 45.4 47.2 45.2 41.3 32.9 26.2
Unemployed: No. of Weeks of Job Search h/ 48.0 48.7 49.1 48.3 42.6 34.6 Male h/ 46.8 47.5 48.1 46.7 41.1 36.2 Female h/ 49.1 49.7 49.8 49.6 43.7 36.7
Sources: a/ September. 1990-96: Lopez Castaño, Hugo (2001). 1996-00: DANE (National Statistical Office), www.dane.gov.co, Mercado Laboral, Encuesta Nacional de Hogares; 2001-07 (new methodology): DANE (National Statistical Office), www.dane.gov.co, Mercado Laboral, Gran Encuesta Integrada de Hogares (Serie Mensual 01-08). ). National, age 10 and older (12 and older for urban population until 2000) b/ DANE (National Statistical Office), www.dane.gov.co, Mercado Laboral, Boletin de Sexo. Data are for the 4th quarter and for ages 10 and older . c/ ILO (DANE). Data are for the 3rd quarter and for ages15 and older. d/ 1996-00: DANE (National Statistical Office), www.dane.gov.co, Mercado Laboral, Encuesta Nacional de Hogares. Data are for September and cover ages 10 and older (12 and older for urban population). 2001-07 (new methodology): DANE (National Statistical Office), www.dane.gov.co, Mercado Laboral, Gran Encuesta Integrada de Hogares (Serie Mensual 01-08). ). Data are yearly averages and cover ages 10 and older (12 and older for urban population until 2000). e/ Banco de la Republica (BR). Data are yearly averages for the 7 major cities. f/ ILO. Data are for 7 cities in each September. g/ Banco de la Republica. Data are yearly averages for 13 metropolitan areas h/ DANE, (National Statistical Office). Gran Encuesta Integrada de Hogares, Anexos Boletin, www.dane.gov.co Note: BR= Banco de la Republica; DANE=National Department of Statistics (Colombia); ILO= International Labour Organization.

84
Table D.6 Colombia: MILES Indicators
COLOMBIA 1990 1991 1992 1993 1994 1995 1996 1997 1998 1999 2000 2001 2002 2003 2004 2005 2006 2007 2008 Macroeconomic Conditions Inflation, consumer prices (annual %) a/ 29.1 30.4 27.0 22.6 23.8 21.0 20.2 18.5 18.7 10.9 9.2 8.0 6.3 7.1 5.9 5.0 4.3 5.4 Non-financial public sector deficit (% of GDP) b/ -3.0 -3.9 -4.6 -6.4 -3.5 -3.5 -4.2 -3.2 -1.3 0 -1 -0.8 Central Government Balance (% of GDP) b/ -5.4 -7.4 -5.8 -5.8 -4.5 -5.4 -4.7 -4.1 -3.4 -2.7 Public debt (% of GDP) b/ 34.1 42.2 47.7 51.8 60.2 53.3 42.4 38.8 35.9 32.8 Investment Climate Ranking of WEF Global Competitiveness Index c/ 47.0 54.0 65.0 56.0 63.0 64.0 57.0 65.0 69.0 74.0
WEF Global Competitiveness Index (% of countries ranked lower) c/ 11.3 8.5 10.9 13.3 30.0 38.2 38.5 51.3 48.0 47.3 44.8 WEF Total Number of Countries c/ 53 59 75 80 102 104 117 125 131 134
Time required to start a business, Doing Business Survey (days) d/ 60.0 43.0 43.0 44.0 42.0 36.0 GFCF, private sector (% of GDP) b/ 11.5 11.7 6.7 5.8 6.2 7.7 9.0 12.7 14.1 18.7 17.6 FDI (US$ billions)b/ 0.5 0.4 0.7 0.7 1.3 0.7 2.8 4.8 2.0 1.4 2.1 2.5 1.3 0.8 2.9 5.6 5.4 8.7
Labor Regulations and Institutions Employment Law Index, Doing Business (smaller numbers are better) d/ 27.0 27.0 27.0 27.0 27.0 24.0 Labor Freedom factor, Index of Economic Freedom (larger numbers are better) e/ 60.3 61.4 61.2 61.4 Non-Labor Costs (percent of wage) f/ 38.2 38.2 38.2 38.2 52.2 52.2 52.2 52.2 52.2 52.2 52.2 52.2 53.2 55.2 55.2 55.2 55.2 55.2 55.2 Education Average Years of Schooling (Urban Workers) 7.9 8.1 8.2 8.2 8.4 8.5 8.6 9.0 9.1 9.0 9.0 9.1 9.3 9.4 9.6 9.6 Primary enrollment rate a/
Gross 102.6 114.6 114.1 114.5 112.0 113.1 113.4 114.7 115.7 116.0 Net 68.3 87.3 89.4 90.2 88.7 89.7 85.7 89.7 88.5
Secondary enrollment rate a/ Gross 50.4 70.1 70.3 69.3 64.9 70.7 71.1 75.3 79.2 82.2 Net 34.5 53.6 53.8 56.1 53.2 55.2 .. 55.5 60.9 64.9
Tertiary enrollment a/ 14.0 22.3 22.0 23.1 23.9 24.0 23.8 26.6 29.0 30.8 Social Protection Health expenditure, private (% of total health expenditure) a/ 20.0 18.0 16.0 16.0 15.0 Health expenditure, public (% of total health expenditure) a/ 80.0 82.0 84.0 84.0 85.0 Sources: a/ The World Bank (World Development Indicators) b/ IMF Article IV consultations c/ The Global Competitiveness Report, World Economic Forum, 2002-2007. The index is not comparable from year to year because the average sample of countries increases. d/ The World Bank. Doing Business (DB) Indicators. / Doing Business (DB) Indicators Range from 0 to 100. The higher the number, the more difficult it is to hire. Years correspond to the years DB's data is collectied, i.e., one year before DB report. e/ The Heritage Foundation. Ranges from 0 to 100. The higher the number the greater freedom to hire labor. f/ Staff estimates with data in World Bank (2005a), Vol.2, p.35. Includes paid vacation; mandatory bonuses; unemployment benefits (cesantía); welfare, training, and family service taxes (parafiscales); unemployment and health insurance, and professional risks insurance. Note: FDI= foreign direct investment; GDP= gross domestic product; GFCF=gross fixed capital formation; MILES= Macroeconomic conditions, investment climate and infrastructure, Labor market regulations and institutions, Education and skill Development; and Social safety net; WEF= World Economic Forum.

85
Appendix E. Colombia: List of People Met
Central Bank
Miguel Urrutia Former Governor of the Central Bank, currently, researcher at Economics Department Universidad de los Andes
José Dario Uribe Governor of Central Bank
Carlos Esteban Posada Senior researcher in Labor markets
National Planning Department
Andrés Escobar Deputy Director
José Fernando Arias Director of Social Development Unit
Natalia Ariza Deputy Director of Employment and Social Security
Omar Rodríguez Director of Private Sector Development
Bertha Briceño Director Public Policy Evaluation
Natalia Bargans Director of Credit
Carolina Gonzales Advisor to Director of Credit
Ingrid Abaunza Advisor to Director of Credit
Juan Carlos Echeverri Former Deputy Director National Planning Department (DNP), currently professor at Universidad de los Andes and independent consultant
Ministry of Education
María Victoria Angulo Directora de Fomento Educación Superior
Jose Ricardo Puyana Advisor for International Cooperation
Ministry of Finance
Alejandro Gamboa Former Coordinator of Multilateral Institutions, currently advisor to Colombian representative World Bank
Dora Lucia Solana Advisor to Coordinator of Multilateral Institutions

86
Ministry of Social Protection
Jairo Nuñez Former Technical Vice Minister
SENA
Juan Bayona Director of Employment
OTHER INSTITUTIONS
NGOs/ Think tanks
Sergio Clavijo Director of National Association of Financial Institutions, National Association of Financial Institutions (ANIF)
Imelda Restrepo Director of Center of Economic Studies, National Association of Industrialists (ANDI)
Ximena Fajardo Specialist in Sector Studies, ANDI
Mauricio Santamaría Adjunt Director, Fedesarrollo
Multilaterals/ Bilaterals
Robert Rennhack Advisor, Western Hemisphere Department
Ivan Duque Advisor to Colombian representative Inter-American Development Bank (IADB)
Marcelo Castro S. Representative in Colombia, International Labour Organization (ILO)
Margaret Enis Director of Economic Unit, United States Agency for International Developpment (USAID) Colombia
Francisco Gonzalez Economic Specialist, USAID Colombia
Universidad de los Andes, Economics Department
Ana María Ibañez Director Centro de Estudios sobre Desarrollo Económico-CEDE
Ximena Peña Assistant Professor
WORLD BANK
Diana Cardenas Member of Colombia social and labor team
Wendy Cunningham Task Team Leader, Labor & Social Reform Programmatic Structural Adjustment Loans

87
David Gould Former Country Economist
Martha Laverde Task Team Leader, several education projects
Gladys Lopez-Acevedo Task Team Leader Labor, Market Policy Analytic and Advisory Activities and the Poverty and Jobs Technical Assistance
Jose Guillerme Reis Task Team Leader, AAA on Regional Competitiveness and logistics
Andrew Mason Task Team Leader, Informality AAA
Juan Carlos Mendoza Former Task Team Leader, Financial Sector Adjustment Loan projects
Harry Patrinos Task Team Leader, Concessions Schools AAA
Alberto Rodriguez Task Team Leader, Higher Education Loans
David Rosenblatt Current Country Economist
Eduardo Somesatto Country Manager

88
Appendix F. Tunisia: Baseline and Latest Outcome Indicators by MILES Components
Tunisia: Indicators of Outcomes Organized Along the MILES Framework
Indicator Baseline
1999 Latest 2007/8
Comments
Macroeconomic
Inflation (12-month, %) 2.7 5.1 Higher inflation reflects rising food and fuel prices.
External debt service ratio (%) 18.5 9.9
Central govt. deficit (% of GDP) 3.5 2.6
Non-financial public sector Deficit (% of GDP) 3.7 3.0
Tax revenue (% of GDP) 21.1 21.2
Public capital expenditure (% of GDP) 6.9 6.2
Public debt (% of GDP) 62.7 55.0
Capital adequacy of banks: capital to risk-weighted assets (%)
10.6(2001) 11.0
Non-performing loans (% of total) 19.2 (2001) 17.0 NPLs worsened to 24% in 2003 before improving again.
Provisions to non-performing loans 49.2 53.8
Investment Climate
Ranking in WEF Global Competitiveness survey (% of countries ranked lower)
36
Transparency International CPI score for corruption a 5.3 4.4
Time required to start a business (days) b n.a. 93
Average time to enforce a contract (days) c
Average time to file all business tax returns (hrs) d n.a. 250
Time required to complete foreign trade procedures (days) e
Export 19 7
Import 15 5
Domestic credit to private sector (% of GDP) 42.7 63.2
Foreign direct investment, net ($ million) 420 (2001) 1,100 (2007)
Private investment (% of GDP) 14.6 14.2
Labor Market
Non-wage payroll costs (% of wage) n.a. 28
Numbers of VET graduates finding jobs n.a. 43,000
Average dismissal costs (months of wages)

89
Tunisia: Indicators of Outcomes Organized Along the MILES Framework
Indicator Baseline
1999 Latest 2007/8
Comments
Rigidity of employment index
Hiring 29
Rigidity of hours 40
Dismissal 80
Number of graduates from VET training courses (annually)
n.a. 110,000 (2007)
Education
School enrollment (% net) Significant increases in primary and secondary enrollment
Primary 91.1 98.8
Secondary 68.4 75.2
Tertiary (% gross) 12.0 33.0
Primary completion rate (% of relevant age group) 91.1 98.0 Increased primary completion rates.
Male 87.9 97.4
Female 92.3 99.6
Social Protection
Number of beneficiaries of unemployment subsidies 0 39,800 (2007)
Share of informal sector workers (%) 28 41
Number of beneficiaries of conditional cash transfer schemes (million)
1.2 1.5
Number of beneficiaries of subsidized health insurance (million)
Note: a 0=worst; 6=best. b From World Bank “Doing Business” reports. c Ibid. d Ibid.
Sources: Central Bank of Tunisia, Tunisian Institute of Statistics, Ministry of Finance, World Development Indicators (World Bank), World
Economic Forum: Global Competitiveness Survey Indicators, Doing Business Indicators (The World Bank) Note: CPI= Corruption Perceptions Index; GDP= gross domestic product; MILES= Macroeconomic Conditions, Investment Climate and Infrastructure, Labor market regulations and institutions, Education and skill development; and Social safety net; NPL= non-performing loans; VET= vocational education and training; WEF= World Economic Forum.

90
Appendix G. Tunisia: World Bank Program by MILES Component
Bank Program Amount
(US$ millions)
IEG Outcome
Rating Comment
Macroeconomic Policy
Lending
ECAL II [FY99]-P053255 159 Satisfactory The project aimed to support macroeconomic stability (debt, balance of payments) and reforms in the banking sector (prudential requirements, privatization). The project performance was satisfactory in helping to: (i) accelerate implementation of the Free Trade Agreement with the EU, (ii) increase the private sector role in economic activity, and (iii) improve the regulatory framework for private business, and (iv) increase labor flexibility.
ECAL III [FY02]-P055815 253 Satisfactory The project aimed to support reinforcement of the regulatory and supervisory framework in the financial sector, in particular in insurance, stable macroeconomic framework, and strengthen debt management and fiscal sustainability. The project contributed in sustaining a stable macroeconomic environment, in substantially improving the investment climate, and in facilitating government divestiture from the banking, insurance and telecommunications sectors.
ECAL IV [FY05]-P075893 150 Moderately Satisfactory
Intended to support reforms in the business climate and financial sector, including improving bank vulnerability indicators. The main development objective – a stronger national private investment performance – has not yet materialized. Macroeconomic performance during project implementation was good overall. The contribution to the private investment climate was positive and tangible, and led to an increase in investment opportunities. Support to the financial sector helped to reduce the levels of non-performing loans and to strengthen the regulatory framework of the financial sector
Analytical Work
Social and Structural Review (CEM) [FY00]-P057056
The report reviews the growth performance, macroeconomic management including debt, and public sector contributions to growth.
External Sustainability [FY01]-P067220
Assessment of Tunisia's external sustainability in terms of integration and vulnerability of the economy towards external shocks.

91
Bank Program Amount
(US$ millions)
IEG Outcome
Rating Comment
Municipal Management and Finance Strategy Note [FY02]-P071950
Discusses the institutional structure of communes, revenue structure and transfers from the state, management capacity, and financing of local investment. It recommends changes to legislation and regulation.
FSAP [FY02]-P073876 Identifying the strengths, vulnerabilities, and risks of the financial system. No information available in iris
Debt Management Study [FY03]-P075087
Assessment and design of an action plan for the implementation of the public debt management strategy.
Accounting and Auditing Assessment (ROSC) [FY04]-P082200
Strengths and weaknesses of the accounting and auditing environment that influence the quality of corporate financial reporting.
CFAA [FY04]-P083644 Analyzes Tunisia's current system of public sector financial management and finds it requires strengthening and improvement.
Development Policy Review [FY04]-P083860
Addresses sources of growth and future challenges including: internal and external imbalances, promoting an efficient financial sector, strengthening management of the public financial sector.
CPAR [FY04]-P084318 Encouraged the creation of a new procurement system in the country.
FSPA Update [FY06]-P099317 Discusses the banking sector, financial conditions and stress testing, non-bank financial institutions, pension funds, capital markets and the financial infrastructure of Tunisia.
Performance-Based Budgeting Reform [FY06]-P094359
Analyses the deficiencies of the present budget system, and describes a clear path of budget reform, based the progressive introduction of program/performance budgeting.
Investment Climate
Lending
Transport Sector Investment I [FY98]-P043700 Transport Sector Investment II [FY01]-P064082
50 38
Moderately Satisfactory
The project aimed to finance ports and railway infrastructure improvements and supported regulatory reform to promote private sector investment in this field. Project implementation permitted significant implication of the private sector (local and foreign) in transport investments; however, privatizations of ports services, promoting private investments in ports, and commercializing the railway parastatal were partly achieved.
Export Development [FY99]-P055814 Export Development II [FY04]-P071115 Export Development II (additional Finance) [FY08]-P106274
35
36 6
Satisfactory The project aimed to support export promotion activities including provision of grants, collateral finance and trade facilitation, notably a review of procedures.
Important achievements were reached in simplification of trade documentation, customs procedures and adoption of international standards. Survey of exporting firms confirmed good prospects for sustained export

92
Bank Program Amount
(US$ millions)
IEG Outcome
Rating Comment
development.
Second Agricultural Sector Investment Loan (ASIL 2) [FY98]-P050418
42 Moderately Satisfactory
The project intended to improve agricultural infrastructure (irrigation and drainage systems) as well as research and training in agricultural issues. The project had positive impact on policy and institutions related to small-scale irrigation; net income for all farm models increased ten times; targeted irrigated perimeters were achieved, cropping intensities increased, and research outcomes were satisfactory. Project shortcomings were (i) irrigation infrastructure was not fully used, because of inadequate quantity and quality of water, and (ii) average cropping intensity was lower than estimated.
Agricultural Support Services [FY01]-P050418
21 Supports creation of networks and institutions to improve market access of rural products.
ECAL II [FY99]-P053255 ECAL III [FY02]-P055815 ECAL IV [FY05]-P075893
159 253 150
Satisfactory Satisfactory Moderately Satisfactory
The project helped (i) to accelerate implementation of the Free Trade Agreement with the EU, (ii) to increase the private sector role in economic activity, and (iii) to improve the regulatory framework for private business, and (iv) to increase labor flexibility.
The project contributed in sustaining a stable macroeconomic environment, in substantially improving the investment climate, and in facilitating Government divestiture from the banking, insurance and telecommunications sectors.
Contribution in private investment climate was positive and noticeable, and led to increase in investments opportunities. Support to the financial sector helped to reduce the levels of non-performing loans and to strengthen the regulatory framework of the financial sector. However the project ICR was poor, as it didn’t indicate whether the intended actions to strengthen the institutional capacity or the expected economic impacts were achieved
Municipal Development III [FY03]-P074398
78 Strengthens the institutional environment for the delivery of municipal basic services and infrastructure.
ICT Sector Development Project [FY05]-P088929
13 Support ICT sector through institutional and sector reforms, improving ICT infrastructure and promote participation in the private sector.
Urban Water Supply [FY06]-P064836
38 Improves water supply in Tunis.
Sustainable Municipal Solid Waste Mgt [FY07]-P095012
22 Strengthens key elements of sustainability of municipal solid waste management.
Tunis West Sewerage [FY07]-P099811
67 Improve the quality of sanitation services in Greater Tunis.
Analytical Work
Export Promotion [FY98]-P054615 No information available.
Trade Sector Note [FY99]-P058506 No information available.

93
Bank Program Amount
(US$ millions)
IEG Outcome
Rating Comment
Social and Structural Review (CEM) [FY00]_P057056
The report reviews the growth performance, and macroeconomic management in Tunisia. In Investment Policy proposes improving infrastructure for private sector development.
Private Sector Assessment Update [FY00]-P057771
Highlights the need of improved competitiveness for external markets. Includes suggested reforms to improve infrastructure and better financial resources for exporting companies.
Trade Strategy Note [FY02]-P071926
Analyzes Tunisia's trade sector. Identifies challenges and suggests strategies.
IT Strategy Note [FY02]-P072034
Sector strategy note to the Government of Tunisia to assist them in formulating a plan for the development of the country's ICT sector.
Agric. Competitiveness Policy Note [FY02]-P073169
Assessment of agricultural sector with the objective of increasing competitiveness in lieu of upcoming trade negotiations.
Tourism Strategy Note [FY03]-P075227
Report on the perspectives of a tourism strategy study for Tunisia.
Private Participation in Infrastructure [FY03]-P075551
Approach to stimulate the development of capital markets and private industries within the infrastructure sector nationwide.
Employment Strategy [FY03]-P075087
General employment assessments. In terms of Investment Climate discusses constraints to SME development to create jobs.
WTO Commitments on Telecommunications [FY03]-P078944
Compliance with Tunisia’s WTO commitments of proposed telecommunications liberalization.
Development Policy Review [FY04]_083860
Suggests strategies to foster private investment like lowering transaction costs for business entry and operations, improving regulations and conditions for competition.
Agriculture Policy Review [FY06]-P089047
Addresses status and challenges of the agricultural sector, including increasing competitiveness to support trade openess.
SME Study [FY07]-P076448 Study focused on Technical centers of Ministry of Industry and Access to and management of industrial zones for SME development.
Cost Assessment of Water Degradation [FY07]-P099094
Assesses water degradation and its implications over agriculture.
Water & Wastewater Strategy [FY08]-P089416
Assessment of the water sector and proposed regulatory framework.
Global Integration Study [FY08]-P089681
Take's stock of Tunisia's recent integration policies and discuss opportunities and challenges associated with greater international integration. In Investment Climate discusses strategies to improve competitiveness of export sector.
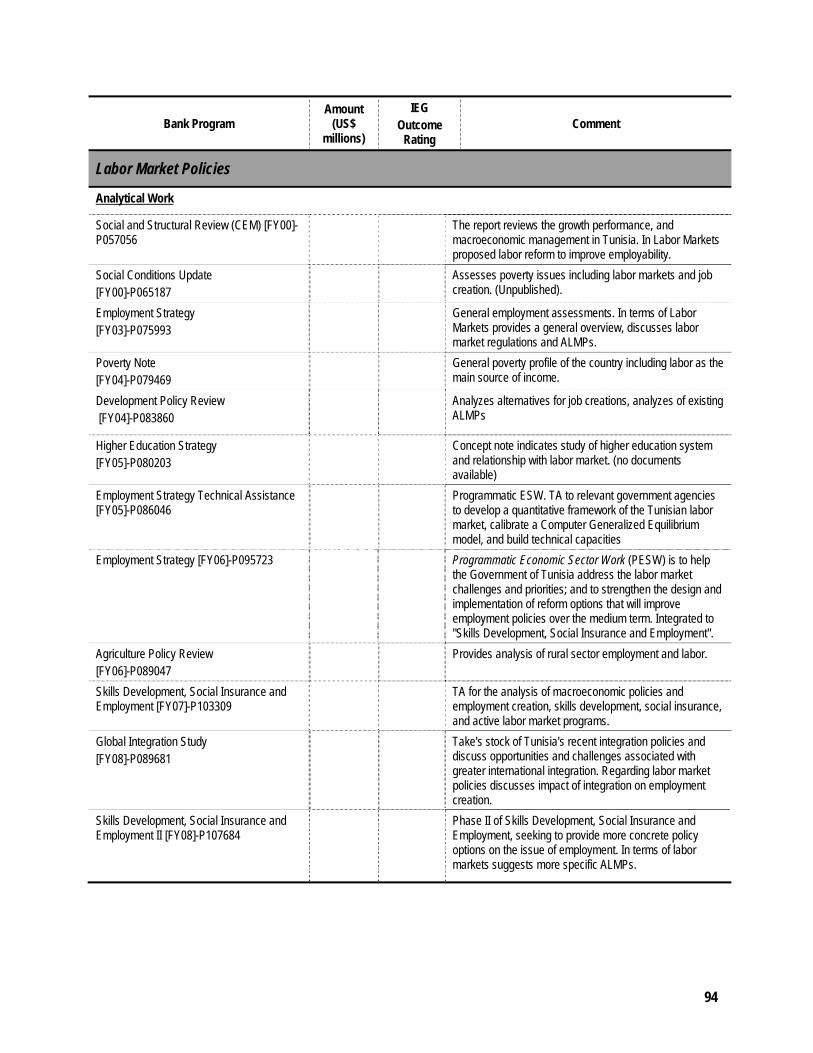
94
Bank Program Amount
(US$ millions)
IEG Outcome
Rating Comment
Labor Market Policies
Analytical Work
Social and Structural Review (CEM) [FY00]-P057056
The report reviews the growth performance, and macroeconomic management in Tunisia. In Labor Markets proposed labor reform to improve employability.
Social Conditions Update [FY00]-P065187
Assesses poverty issues including labor markets and job creation. (Unpublished).
Employment Strategy [FY03]-P075993
General employment assessments. In terms of Labor Markets provides a general overview, discusses labor market regulations and ALMPs.
Poverty Note [FY04]-P079469
General poverty profile of the country including labor as the main source of income.
Development Policy Review [FY04]-P083860
Analyzes alternatives for job creations, analyzes of existing ALMPs
Higher Education Strategy [FY05]-P080203
Concept note indicates study of higher education system and relationship with labor market. (no documents available)
Employment Strategy Technical Assistance [FY05]-P086046
Programmatic ESW. TA to relevant government agencies to develop a quantitative framework of the Tunisian labor market, calibrate a Computer Generalized Equilibrium model, and build technical capacities
Employment Strategy [FY06]-P095723 Programmatic Economic Sector Work (PESW) is to help the Government of Tunisia address the labor market challenges and priorities; and to strengthen the design and implementation of reform options that will improve employment policies over the medium term. Integrated to "Skills Development, Social Insurance and Employment".
Agriculture Policy Review [FY06]-P089047
Provides analysis of rural sector employment and labor.
Skills Development, Social Insurance and Employment [FY07]-P103309
TA for the analysis of macroeconomic policies and employment creation, skills development, social insurance, and active labor market programs.
Global Integration Study [FY08]-P089681
Take's stock of Tunisia's recent integration policies and discuss opportunities and challenges associated with greater international integration. Regarding labor market policies discusses impact of integration on employment creation.
Skills Development, Social Insurance and Employment II [FY08]-P107684
Phase II of Skills Development, Social Insurance and Employment, seeking to provide more concrete policy options on the issue of employment. In terms of labor markets suggests more specific ALMPs.

95
Bank Program Amount
(US$ millions)
IEG Outcome
Rating Comment
Education Policies
Lending
Higher Education Reform Support I [FY98]-P005741 Higher Education Reform Support II [FY06]-P075809
80 76
Satisfactory The projects aimed to promote access to higher education, improve internal and external efficiency of the public higher education sector, and enhance the financial sustainability of public institutions of higher education. The two first objectives were fully achieved, while the third one was partially achieved. Noteworthy was the improvement in enrolment rates of women that jumped from 13.5 percent to 32.4 percent in four years. Project’s weak spots were the handling of cost-recovery and the restructuring of scholarship and loan schemes.
Education Quality Improvement Program (PAQSET I) [FY00]-P050945 Education Quality Improvement Program (PAQSET II) [FY04]-P082999
99 130.3
Moderately Satisfactory
The projects aimed to promote excellence in teaching and learning and achieve near universal primary and expanded secondary coverage. The project performance for the first activity was rated substantial, while the second activity achieved modest results. But the project ICR didn’t use appropriate indicators to ascertain whether the project outcomes were fully reached.
Analytical Work
Education Sector Strategy [FY99]-P052766
Education [FY99]-P059268
Social Conditions Update [FY00] P065187
Assesses poverty issues including education levels of the population. (unpublished).
Employment Strategy [FY03]-P075993
General Employment Assessments. In terms of Education provides assessment of skills mismatch.
Poverty Note [FY04]-P079469 General poverty profile of the country including education levels analysis.
Development Policy Review [FY04]-P083860
Analyzes challenges of the education system for knowledge economy.
Higher Education Strategy [FY05]-P080203
Concept note indicates study of higher education system. (no documents available)
Skills Development, Social Insurance and Employment [FY07]-P103309
TA for the analysis of macroeconomic policies and employment creation, skills development, social insurance, and active labor market programs.
Skills Development, Social Insurance and Employment II [FY08] P107684
Phase II of Skills Development, Social Insurance and Employment, seeking to provide more concrete policy options on the issue of employment. In education suggests more specific reforms to match education with demand for skills
Global Integration Study [FY08]-P089681
Take's stock of Tunisia's recent integration policies and discuss opportunities and challenges associated with greater international integration. In education discusses human resource base to address integration challenges.

96
Bank Program Amount
(US$ millions)
IEG Outcome
Rating Comment
Social Protection
Analytical Work
Employment Strategy [FY03]-P075993
General Employment Assessments. In terms of Social Protection: Discusses unemployment insurance.
Skills Development, Social Insurance and Employment [FY07]-P103309
TA for the analysis of macroeconomic policies and employment creation, skills development, social insurance and active labor market programs.
Skills Development, Social Insurance and Employment II [FY08]-P107684
Phase II of Skills Development, Social Insurance and Employment, seeking to provide more concrete policy options on the issue of employment. In Social Protection it will discuss Pension reform.
Source: Project Documents, AAA Reports, and IEG Evaluations.
Note: ALMP= Active Labor Market Policies; ASIL= Agriculture Sector Investment Loan; CEM= Country Economic Memorandum; CFAA=
Country Financial Accountability Assessment; CPAR= EU= European Union; FSAP= Financial Sector Assessment Program; FY= fiscal
year; ICR= Implementation Completion Report; ICT= information and communications technology; IT= information technology; IEG= In-
dependent Evaluation Group; ECAL= Economic Competitiveness Adjustment Loans; ESW= economic and sector work; MILES= Macroe-
conomic conditions, investment climate and infrastructure, Labor market regulations and institutions, Education and skill development;
and Social safety nets; ROSC= Report on the Observance of Standards and Codes; SME= small and medium enterprise; TA= technical
assistance; WTO= World Trade Organization.

97
Appendix H. Tunisia: Annex Tables
Table H.1 Tunisia: Growth, Poverty, and Income Distribution Indicators
(percent except first row)
TUNISIA 1990 1991 1992 1993 1994 1995 1996 1997 1998 1999 2000 2001 2002 2003 2004 2005 2006 2007
Per Capita GDP (Constant 2000 International Dollars) a/ 4635 4721 4986 4997 5063 5100 5385 5601 5795 6066 6279 6513 6548 6871 7218 7451 7758 8171
GDP (LCU) growth a/ 7.9 3.9 7.8 2.2 3.2 2.4 7.1 5.4 4.8 6.1 4.7 4.9 1.7 5.6 6.0 4.0 5.7 6.3
Per Capita GDP (LCU) Growth a/ 5.3 1.9 5.6 0.2 1.3 0.8 5.5 4.0 3.4 4.7 3.5 3.7 0.5 4.9 5.1 3.0 4.7 5.1
Poverty (Headcount Ratio) b/ 28.4 29.7 21.0
Poverty (Headcount Ratio) c/ 5.9 6.5 2.6
Poverty (Headcount Ratio) d/ 6.7 8.1 4.1
Poverty (Headcount Ratio) e/ 6.7 6.2 4.2 3.8
Gini Coefficient b/ 40.2 41.7 39.8 40.0
a/ The World Bank (World Development Indicators).
b/ $1.25-a–day poverty line (World Bank updated (2008) poverty estimates (<www.worldbank.org>). The Source for the 2005 estimate of the GINI coefficient is the CIA World Factbook.
c/ $2.50-a-day poverty line (World Bank updated (2008) poverty estimates (<www.worldbank.org>).
d/ The World Bank (2003d), as reported in Ayadi et. Al. (2005).
e/ Tunisia National Institute of Statistics. Note: GDP= gross national product; LCU= local currency unit.

98
Table H.2 Tunisia: Population and Labor Participation (LFP) Rate
(percent except first row)
TUNISIA 1990 1991 1992 1993 1994 1995 1996 1997 1998 1999 2000 2001 2002 2003 2004 2005 2006
Population, total (millions) a/ 8.2 8.3 8.5 8.7 8.8 9.0 9.1 9.2 9.3 9.5 9.6 9.7 9.8 9.8 9.9 10.0 10.1 10.2
Population growth (annual percent) a/ 2.4 2.0 2.0 2.0 1.8 1.6 1.5 1.4 1.3 1.3 1.1 1.1 1.1 0.6 0.9 1.0 1.0 1.2
Urban population (percent of total) a/ 57.9 58.6 59.3 60.1 60.8 61.5 61.9 62.3 62.6 63.0 63.4 63.8 64.2 64.5 64.9 65.3 65.7 66.1
Total LFP Rate by Gender b/ 46.1 f/ 45.3 45.3 45.8 46.3 46.6 46.8
Male b/ 71.6 f/ 69.1 67.9 67.8 68.6 68.5 68.8
Female b/ 20.0 f/ 21.4 22.8 24.2 24.4 25.0 25.3
Total LFP Rate by Gender c/ 48.2 48.2 48.3 48.4 48.4 48.5 48.6 48.7 48.5 48.4 48.3 48.2 48.2 48.1 48.1 48.0 48.2 48.3
Male c/ 75.5 75.3 75.0 74.8 74.5 74.2 74.0 73.7 73.3 72.9 72.5 72.1 71.8 71.4 70.9 70.6 70.5 70.9
Female c/ 20.8 21.2 21.6 21.9 22.3 22.8 23.2 23.6 23.8 24.0 24.2 24.4 24.7 24.9 25.2 25.6 26.0 25.7
Total LFP Rate by Gender c/ 48.2 48.2 48.3 48.3 48.4 48.5 48.6 48.7 49.0 49.4 49.7 50.1 50.5 50.9 51.3 51.7 52.1
Male d/ 75.6 75.3 75 74.8 74.5 74.2 74.0 73.7 73.9 74 74.2 74.3 74.5 74.8 74.7 74.8 75.0
Female d/ 20.8 21.2 21.6 21.9 22.3 22.7 23.2 23.6 24.2 24.8 25.3 25.9 26.5 27.1 27.9 28.5 29.2
Total LFP Rate by Gender e/ 50.5 50.6 50.7 50.9 51.0 51.1 51.2 51.4 51.8 52.2 52.6 53 53.5 53.9 54.3 54.8 55.2
Male e/ 79.1 78.9 78.7 78.4 78.1 77.9 77.6 77.3 77.4 77.5 77.7 77.8 78.0 78.2 78.1 78.2 78.3
Female e/ (15-64) 22.1 22.5 23.0 23.5 24.0 24.4 24.9 25.5 26.2 26.8 27.4 28.1 28.8 29.5 30.4 31.1 31.9
a/ The World Bank (World Development Indicators).
b/ Ministry of Employment and Professional Integration of Youth, http://www.info-emploi.tn/observatoire/up_pdf/151226.PDF. Data are for ages 15 and older.
c/ ILO, < http://laborsta.ilo.org/STP/do>. Data are for ages 15 and older.
d/ The World Bank (WDI). Data are for ages 15 and older.
e/ The World Bank (WDI). Data are for ages 15 to 64.
f/ 1989.

99
Table H.3 Tunisia: Employment-to-Population Ratio (ETP)
(percent)
TUNISIA 1990 1991 1992 1993 1994 1995 1996 1997 1998 1999 2000 2001 2002 2003 2004 2005 2006 2007
Total a/ 40.5 40.5 40.6 40.7 40.8 40.7 40.8 41.0 40.8 40.7 40.7 40.9 40.8 41.1 41.4 41.2 41.3 41.5
By Gender: Total b/ 38.8 c/ 38.1 38.1 39.3 39.7 39.9 40.2
Males b/ 61.4 c/ 58.5 57.3 58.8 59.6 59.5 60.0
Females b/ 15.6 c/ 17.7 18.9 20.1 20.2 20.7 20.8
a/ Bank estimates with data from the International Labour Organization, Institute National de Statistiques, and Ministry of Employment and Professional Integration of Youth ( http://www.info-emploi.tn/observatoire/up_pdf/151226.PDF)
b/ Ministry of Employment and Professional Integration of Youth, http://www.info-emploi.tn/observatoire/up_pdf/151226.PDF.
c/ 1989.

100
Table H.4 Tunisia: Earnings and Private Sector Wage Index
(percent except last row)
TUNISIA 1990 1991 1992 1993 1994 1995 1996 1997 1998 1999 2000 2001 2002 2003 2004 2005 2006 2007
Real GNI per Worker a/ 6130 6060 6299 6166 6197 6325 6593 6797 6934 7151 7257 7458 7381 7506 7677 7757 8034 8215
Formal Sector Real Wage Index b/ 103.1 103.7 97.7 97.5 103.7 99.6 101.2 100.4 100.1 100.0 102.4 104.4 107.5 108.9 110.9 112.8 114.2
Minimum Wage b/ 74.1 70.6 69.2 66.9 67.5 65.4 62.8 60.5 57.5 55.2
a/ The World Bank (World Development Indicators): US Dollar equivalent at year 2000 domestic prices. b/ Ministry of Employment and Professional Integration of Youth ( http://www.info-emploi.tn/observatoire/up_pdf/151226.PDF) for employment. Nominal local currency GNI data was deflated with CPI (WDI, Index 2000=100) and converted to US dollars using the average exchange rate for the year 2000 (IMF).
b/ Staff estimates from data in World Bank (1995), Vol. II, Table 42, p. 38 and at the Tunisia National Statistics Institute. (www.ins.net.tn).
Note: GNI= gross national income.

101
Table H.5 Tunisia: Unemployment Rate (percent)
TUNISIA 1990 1991 1992 1993 1994 1995 1996 1997 1998 1999 2000 2001 2002 2003 2004 2005 2006 2007
Total a/ 15.9 15.9 15.9 15.9 15.8 16.0 16.0 15.9 15.9 16.0 15.7 15.1 15.3 14.5 14.2 14.2 14.3 14.1
By Gender: Total b/ 15.8 15.9 16.0 15.7 15.1 15.3 14.5 14.2 14.2 14.3 14.1
Male b/ 15.3 15.5 15.6 15.3 14.8 14.9 13.9 13.2 13.1 13.2 12.8
Female b/ 17.5 17.4 17.2 16.9 16.2 16.3 16.2 17.1 17.3 17.3 17.8
By Level of Education: Total b/ 15.8 16.0 15.7 15.1 15.3 14.5 14.2 14.2 14.3 14.1
Illiterate b/ 16.8 11.9 10.1 12.8 11.3 12.7 7.8 8.0 5.9
Primary b/ 19.2 18.9 17.1 16.6 15.8 15.7 15.7 15.2 13.5
Secondary b/ 13 16.4 16.4 15.9 15.3 14.7 14.9 14.3 15.4
Higher b/ 3.8 8.6 10.4 11.6 11.7 10.2 14.8 17.5 19.0
a/ 1990-93: interpolation; 1994 and 1999: Ministry of Employment and Professional Integration of Youth, <http://www.info-emploi.tn/observatoire/up_pdf/151226.PDF>; 1995-96 and 1998: Interpolation; 1997 and 2000-03: ILO, < http://laborsta.ilo.org/STP/do>. 2004-07: National Institute of Statistics, http://www.ins.nat.tn/indexfr.php.
b/ Institute Nationale de Statistiques and Ministry of Employment and Professional Integration of Youth ( http://www.info-emploi.tn/observatoire/up_pdf/151226.PDF). “Evolution du marché de l’emploi en Tunisie» Data for 1997 taken form ILO, Labostat.

102
Table H.6 Tunisia: MILES Indicators
TUNISIA 1990 1991 1992 1993 1994 1995 1996 1997 1998 1999 2000 2001 2002 2003Macroeconomic Conditions Inflation, consumer prices (annual %) a/ 6.5 8.2 5.8 4.0 4.7 6.2 3.7 3.7 3.1 2.7 2.9 2.0 2.7 2.7Central Gov't Balance, excl. grants and privatization (% of GDP) b/ -4.5 -5.1 -4.6 -3.6 -3.9 -3.9 -3.8 -3.5 -3.5
Government Debt (% of GDP) b/ 58.4 60.6 62.2 58.2 60 60.8 62.8 61.6 60.9Investment Climate Ranking in WEF Global Competitiveness Index c/ 32.0 38.0WEF Global Competitiveness Index (% of countries ranked lower) c/ 60.0 62.7
Time required to start a business, Doing Business survey (days) c/ 10.0
GFCF, private sector (% of GDP) a/ 4.6 7.5 7.2FDI (US$ billions) a/ 0.1 0.1 0.5 0.6 0.4 0.3 0.2 0.3 0.7 0.3 0.8 0.5 0.8 0.5Labor Regulations and Institutions Employment Law Index, Doing Business (smaller numbers are better) d/
49.0
Labor Freedom factor, Index of Economic Freedom (larger numbers are better) e/
Education Primary enrollment rate a/ Gross 113.2 113.5 112.9 112.0 111.0 110.4 Net 93.5 92.9 93.8 94.7 96.3 97.0Secondary enrollment rate a/ Gross 44.6 72.4 74.6 76.6 77.9 76.4 Net .. 67.8 68.8 66.8 64.5Tertiary enrollment a/ 8.5 17.0 19.0 21.3 22.8 26.1Social Protection Health expenditure, private (% of total health expenditure) a 50.0 53.0 54.0
Health expenditure, public (% of total health expenditure) a/
50.0 47.0 46.0
Population Population, total (millions) a/ 8.2 8.3 8.5 8.7 8.8 9.0 9.1 9.2 9.3 9.5 9.6 9.7 9.8 9.8Population growth (annual %) a/ 2.4 2.0 2.0 2.0 1.8 1.6 1.5 1.4 1.3 1.3 1.1 1.1 1.1 0.6Urban population (% of total) a/ 57.9 58.6 59.3 60.1 60.8 61.5 61.9 62.3 62.6 63.0 63.4 63.8 64.2 64.5Sources: WDI on December 5, IMF Article IV consultations, Doing Business, Heritage Foundation a/ The World Bank (WDI); b/ IMF Article IV consultations c/ The Global Competitiveness Report, World Economic Forum, 2002-2007. The index is not comparable from year to year bincreases. d/ The World Bank, Doing Business Reports, Years correspond to DB's data collection dates, which are one year before DB report date. e The World Bank, Doing Business Rthe number, the more difficult it is to hire. f/ Ranges from 0 to 100. The higher the number the greater the freedom to hire labor. Note: FDI= foreign direct investment; GDP= gross domestic product; GFCF= gross fixed capital formation; MILES= Macroeconomic conditions, Investment climate and infrastructure, Laboand skill development; and Social safety net; WEF= World Economic Forum.

103
Appendix I. Tunisia: List of People Met
Government
Abelhamid Triki Vice Minister (Secrétaire d'État), Ministry of Development and International Cooperation.
Kamel Ben Rejeb Director General of International Cooperation Ministry of Development and International Cooperation.
Brahim Toumi Ministry of Education and Vocational Training
Mohamed Tonn Ministry of Education and Vocational Training
Mohsen Ketari Ministry of Education and Vocational Training
Slim Chaker Executive Director, Export Access Market Fund (FAMEX)
Moncef Youzbachi Director, Ministry of Development and International Cooperation
Ali Sana Director, General Ministry of Employment
Meftah Amara Director, "Mise à Niveau" Program Ministry of Industry and Energy
Saloua Ben Zaghou Director, Institute of Quantitative Economics Ministry of Development and International Cooperation.
Abdelmalek Saadoui Director, General of Resources Ministry of Finance
Said Faouzia Budget Director, Ministry of Finance
Habib Lahouij Budget Administration, Ministry of Finance
Raouf Sfar Director General, Fiscal Incentives Ministry of Finance
Mohamed Ali Ben Malik Ministry of Finance
Jamel Bel Haj Ministry of Finance
Borchol Moudhu Ministry of Finance
Ben Abrahim Mondprer Ministry of Finance
Abdalla Riahi Ministry of Higher Education and Scientific Research
Habib Fourati National Statistical Institute
Noureddine Zekri Director General, Foreign Investment Ministry of Development and International Cooperation
Private Sector and Other Non-Government
Chekib Nouira Managing Director, CNI Group (textile manufacturer)
Maher Kallel Managing Director, Group Poulino
Hassen Zargouni Managing Director, Sigma Consulting
Riadh Bey Marketing Consultant, Sigma Consulting
Essma Ben Hamida Director, Enda Inter-Arabe
Michael Philip Cracknell Co-Director, Enda Inter-Arabe

104
Zoubeïr Daly Public Services Consultant
Berhouma UTICA (Employers' Organization)
Sami Sallini UTICA
Professor Zouari Abrazak Academic
Professor Azzam Mahjoub. Academic
Odoardo Como First Secretary, Delegation of the European Commission
Nabil Ben Nacef Vocational Training and Employment Officer Delegation of the European Commission
Abdourahomene Charaf-Eddine Principal Program Officer, African Development Bank
Natsuko Obayashi Country Economist, African Development Bank
Bank Staff
Linda English Task Team Leader, Higher education projects
August Kouame Lead Economist
Fareed Hassan Task Team Leader, Country Assistance Evaluation
Hamid Alavi Task Team Leader, Private Sector Development projects and activities
Ndiame Diop Country Economist (based in Tunis)
Rebekka Grun Task Team Leader, Employment Strategy
Setareh Razmara Former Task Team Leader, Employment Strategy
David Robalino Former Task Team Leader, Employment Strategy
Cecile Fruman Task Team Leader, Country Assistance Strategy
Mats Karlsson Country Director
Theodore Ahlers Former Country Director
Mourad Ezzine Sector Manager, Human Development
Carmen Niethammer Gender and Employment Issues
Nadereh Chamlou Gender and Employment Issues
Adriana Jaramillo Task Team Leader, Skills Development and Vocational Training
Gordon Betcherman Labor Economist

105
Appendix J. Turkey: Baseline and Latest Outcome Indicators by MILES Component
Indicator Baseline
1998 Latest 2007/8 Comment
Macroeconomic Policies GDP growth rate (%) 3.1 4.5 Average growth for 2002-07 was 6.8% annually. Inflation (12-month, %) 84.6 8.4 Unemployment rate (%) 6.9 10.1 Current account balance (% of GDP) 1.0 - 5.7 Gross external debt (% of GDP) 57.7 (2001) 33.7 National income accounts were revised in 2008, but
only back to 2001. Public sector primary balance (% of GDP) 4.6 3.5 Net public sector debt (% of GDP) 66.4 (2001) 38.8 National income accounts were revised in 2008, but
only back to 2001. Exports (% of GDP) 21.3 24.9 Investment Climate WEF Global Competitiveness Index ranking 54 (2001) 53 Index nonexistent before 2001. Increase in country
sample over time. Gross investment (% of GDP) 22.1 22.2 Foreign direct investment (% of GDP) 0.4 3.0 Labor Market and its Regulations Employment Rate (% for 15-64 year olds) 49.2 45.8 Labor force participation rates (% total) 52.8 51.0 Male participation rate (%) 76.7 75.5 Female participation rate (%) 29.3 26.6 See discussion in text. OECD Employment Protection Legislation Index Ranking (for OECD)
26 (1999) 26 (2003) For the 26 OECD countries examined Turkey rated as the most restrictive.
Education School enrollment (% gross) Significant increases at all levels. Primary 88.5 94.2 (2006) Male 97.0 96.4 (2006) Female 79.5 92.0 (2006) Secondary 77.6 (2001) 78.6 (2006) Tertiary 20.9 34.6 (2006) Ratio of girls to boys in primary and secondary schools (expressed as a %)
78.9 90.1 (2006)
Ratio of females to males in tertiary education (expressed as a %)
68.3 75.4 (2006)
Social Protection Coverage of unemployment insurance 0 4 % (2004) Coverage of unemployed still limited. Number of beneficiaries of conditional cash transfer schemes (million)
0 2.8
Sources: World Bank reports, Central Bank of Turkey, Turkish Statistical Office, Turkish Ministry of Finance, World Development Indicators (World Bank), World Economic Forum: Global Competitiveness Survey Indicators, Doing Business Indicators (The World Bank), , IMF Article IV Reports, OECD Statistics.

106
Appendix K. Turkey: World Bank Program by MILES Component
Bank Program Amount
(US$ million)
IEG Outcome Rating*
Comment
Macroeconomic Policy
Lending
ERL [FY00]-P068792 760 Satisfactory In order to underpin country economic stabilization effort, the project supported reforms in key structural areas including fiscal and real sector reforms and provided back up to IMF programs. Most macroeconomic indicators improved as GDP grew by 7.9 in 2002 and 5.9 in 2003. Inflation dropped and fiscal performance improved as significant reform achievements were completed in the fiscal area.
FSAL [FY01]-P066511 778 Moderately Satisfactory
The project aimed to strengthen regulation and supervision of the banking sector. A banking regulatory and supervisory framework was created and strengthened and an action plan to deal with failing banks and the privatization of state-owned banks was adopted. Major shortcomings included: (i) a weak macroeconomic environment that provoked a major banking crisis, and (ii) lack of time-bound privatization plan for state banks,
PFPSAL [FY02]-P070560 PFPSAL II [FY02]-P070561 PFPSAL III [FY04]-P082996
1,100 1,350 1,000
Satisfactory Moderately Satisfactory Satisfactory
The programmatic projects aimed to support key public and financial sector reforms in the aftermath of the 2000 crisis. Achievements were as follows: (i) Regulatory and supervisory framework for the banking activity was further strengthened and upgraded; some progress in public finance management and governance reforms; (ii) Legal and regulatory framework for banking activity was strengthened; importance of state-owned banks diminished; public sector financial structure, management, and accountability strengthened and improved; public procurement enhanced, (iii) Financial sector stabilized and strengthened; substantial progress towards sustained fiscal adjustment and effective and transparent government, and noticeable improvements in financial transparency; fiscal and debt outcomes improved. On the flip side, social expenditures fell short of targets, privatization of one bank was not completed, and Savings Deposits Insurance Funds were not totally resolved.
PPDPL [FY06]-P071052 500 Structural reform program to maintain an macroeconomic framework, financial controls and expenditure management of public resources, and improving the administration and governance of the public sector.

107
Bank Program Amount
(US$ million)
IEG Outcome Rating*
Comment
CEDPL [FY07]-P071052 500 Includes maintaining currently enabling macroeconomic framework and privatization of state owned enterprises (SOEs).
Analytical Work
Living Standards [FY99]-P074181 Economic reforms, living standards and social welfare study- Stressed links between growth, employment and poverty reduction. Suggested policies to make agricultural sector more productive to absorb jobs.
CEM [FY00]-P057226 CEM: Structural Reform for Sustainable Growth. Included analysis of Turkey's macroeconomic framework. Recommends structural policies to generate fiscal surpluses, financial reform, banking sector, agriculture and social security.
CEM [FY03]-P59617 CEM: Towards Macroeconomic Stability and Sustainable Growth. Analyzed the context after de 2001 crisis, including issues of macroeconomic stability.
CEM [FY06]-P077776 CEM: Promoting Sustained Growth and Convergence with the European Union. Analysis determinants of growth and public financial management.
PER [FY01]-P088836 Public Expenditure Review. Analyses the budget, institutions of public expenditure management, and accountability.
PER [FY07]-P093169 Public Expenditure Review. Includes discussion on the effects of Social security reform over expenditure.
Investment Climate
Lending
EFIL [FY00]-P065188 EFIL II [FY04]-P082801 EFIL 3 [FY05]-P093568
253 303 305
Satisfactory Highly Satisfactory
The first project intended to provide a credit line to banks supplying medium term credit to exporting firms and to SMEs at a time of tight credit and crisis in 2001. Private Banks were evaluated against prudential ratios and most of their ratios improved; strategic dialogue between the Bank and Turkish banking sector was established, and set the stage for Bank programmatic support to the financial sector. The second project aimed to provide adequate finance to facilitate export growth, and improve financial intermediation. There was a rise in export growth resulting from increased financial intermediation targeting the export sector; Credit line to export sector facilitated export growth (number of exporters, volume and value of exports); Increased competition in the financial sector.
ERL [FY00]-P065188 760 Satisfactory The project aimed to reform key structural areas and contained elements related to privatization, reduction of agricultural subsidies and deregulation of the energy sector. Significant reform achievements in the fiscal and social security systems; reform progress in the agricultural,

108
Bank Program Amount
(US$ million)
IEG Outcome Rating*
Comment
energy and telecommunication sectors and in the privatization of SOEs.
ARIP [FY02]-P070286 600 Provided resources for severance payments for agricultural parastatals and helped government reduce their role in provision of inputs and marketing.
CEDPL [FY07]-P0741181 500 Structural reform program. In terms of Investment Climate includes improving investment climate generally, access to investment capital, and promoting knowledge and innovation, and adopting new technologies.
Analytical Work
Caspian Oil & Gas 1 [FY00]-P066699 Caspian Oil & Gas 2 [FY01]-P071503 Caspian Oil & Gas 3 [FY02]-P075254 Caspian Oil & Gas 4 [FY03]-P080288
Explored options for moving away from the Turkish National Gas Company (BOTAS) as a sole-source gas buyer.
Water Sector Review [FY03]-P079023
Review of the present situation of water sector in Turkey and private sector participation.
Energy Strategy [FY03]-P081072
Energy strategy note reviewing main issues and policy options in power and gas sectors.
Gas Sector Note [FY04]-P083619
Assists the Government of Turkey in developing a strategy to expand gas distribution and utilization in Turkey.
Infrastructure Note [FY06]-P089034
Infrastructure financing study. The results were incorporated into the full PER.
CEM [FY06]-P088836 CEM: Promoting Sustained Growth and Convergence with the European Union. Includes analysis of issues regarding deregulation and investment climate.
Investment Climate Assessment [FY07]-P084255
Analyzes Investment Climate based on a survey to 1,300 Turkish firms on issues such as industrial restructuring, administrative barriers for business operation, entry and exit dynamics.
Labor Market Policies
Lending
PSSP 1 [FY01]-P069894 PSSP 2 [FY05]-P094167
250 465
Satisfactory The project intended to support the Government’s program to privatize state-owned enterprises (SOE), and to serve as a cushion to social impact of the economic reform program, including compensation for deployed workers. The privatization of state enterprises was successful; job compensation was provided to 18,261 laid off workers, and surveys to monitor the social impact of the reform program were conducted, albeit with some delay.

109
Bank Program Amount
(US$ million)
IEG Outcome Rating*
Comment
CEDPL [FY07]-P094167 500 Structural reform program. In terms of Labor Market policies includes setting the foundations for overhauling labor market regulations.
Analytical Work
CEM [FY06]-P088836 CEM: Promoting Sustained Growth and Convergence with the European Union. Includes issues regarding labor market reform agenda.
Poverty Assessment [FY05]-P084809
Joint with the Turkish Statistical Agency: General poverty profile of the country including labor market analysis.
Labor Market Study [FY05]-P079189
Labor Market Study. Comprehensive study of labor market including suggested reforms to Labor codes, severance payments, labor dispute resolution mechanisms and active labor market programs.
Education Sector Assessment [FY05]-P084761
Sustainable Pathways to an Effective, Equitable, and Efficient Education System for Preschool through Secondary School Education. Includes background papers of the relationship between education policies and labor market.
Investment Climate Assessment [FY07]-P084255
Analyzes Investment Climate based on a survey to 1,300 Turkish firms on issues such as industrial restructuring, administrative barriers for business operation, entry and exit dynamics.
Estimating the Impact of Labor Taxes [FY08]-P111557
Estimating the Impact of Labor Taxes on Employment and the Balances of the Social Insurance Funds in Turkey. Studies more detailed effects of the proposed reforms to labor taxes and regulations.
Youth Labor Markets [FY08]-102193
Investing in Turkey's Next Generation Study. Analyzes youth labor market issues including education systems, government programs for worker placement, and regulations.
Education Policies
Lending
Basic Education (APL) [FY98]-P009089
300 Unsatisfactory The education project focused on capacity expansion and teaching materials in low-income rural and slum areas, and on introducing IT equipment and programs in selected schools. Activities concentrated on increasing coverage and improving quality among the children of low-income families and children with special needs. Weak project performance was due to (i) lack of articulation between the project objectives and related components, (ii) absence of outputs indicators in some instances, (iii) move to second phase despite some failures in the first phase of the project, (iv) lack of data related to outcomes achievement, (iv) the PIU disconnected from the Ministry, this leading to poor institutional capacity building, and (vi) poor supervision in a difficult administrative setting

110
Bank Program Amount
(US$ million)
IEG Outcome Rating*
Comment
Basic Education (APL2) [FY03]-P059872
300 Moderately Unsatisfactory
The project aimed to expand basic education coverage in low income families and children with special needs. School infrastructure was expanded and renovated, and package of learning material reached an additional 3 million schoolchildren. However, project design was inappropriate, leading to inability to provide evidence on how funded outputs link to the stated project objective, and making project evaluation difficult.
Secondary Education [FY05]-P066149
104 Supported reform of general secondary and vocational education by improving conditions for student learning, establishing a career guidance system and enhancing foreign language teaching.
Analytical Work
Education Sector Assessment [FY05]-P084761
Sustainable Pathways to an Effective, Equitable, and Efficient Education System for Preschool through Secondary School Education. Comprehensive analysis regarding reform of the education sector.
Higher Education Assessment [FY07]-P098400
Study on Turkey's higher education system to make it more attuned with EU standards and to prepare Turkish workers with the adequate set of analytical skills.
Social Protection
Lending
ERL [FY00]-P068792 760 Satisfactory Reform of key structural areas. In Social Protection they include: initial reforms of pensions and start of unemployment insurance.
Social Risk Mitigation Project (SRMP) [FY02]-P074408
500 Funded conditional cash transfers to poorest 6%. Grants for employability (skills) training, social service sub-projects, rehabilitation of schools, and temporary employment.
PPDPL [FY06]-P071052 500 Structural reform program. In terms of Social Protection includes reforming substantially the country's social protection system, which covers social security, universal health insurance, and social assistance.
Analytical Work
Poverty Assessment [FY05]-P084809
Joint with the Turkish Statistical Agency: General poverty profile of the country includes analysis of access to social security.
Source: Project Documents, AAA Reports, and IEG Evaluations. Note: APL= Adaptable Program Loan; ARIP= Agricultural Reform Investment Project; CEDPL= Competitiveness and Employment De-velopment Policy Loan; CEM= Country Economic Memorandum; EFIL= Export Finance Intermediation Project; ERL=Economic Reform Loan; EU= European Union; FSAL= Financial Sector Adjustment Loan; FY= fiscal year; IEG= Independent Evaluation Group; IT= infor-mation technology; MILES=Macroeconomic conditions, investment climate and infrastructure, Labor market regulations and institutions, Education and skill development; and Social safety net; PER= Public Expenditure Review; PFPSAL= Programmatic Financial and Public Sector Adjustment Loan; PIU= Project Implementation Unit; PPDPL=Programmatic Public Sector Development Policy Loan; PSSP= Pri-vatization of Social Support Project; SME= small and medium enterprise; SOE= state-owned enterprise.

111
Appendix L. Turkey: Annex Tables
Table L.1 Turkey: Growth, Poverty, and Income Distribution Indicators
(percent)
TURKEY 1990 1991 1992 1993 1994 1995 1996 1997 1998 1999 2000 2001 2002 2003 2004 2005 2006 2007 Per Capita GDP (International Prices) 7458 7367 7590 8018 7502 7945 8378 8852 8897 8451 8872 8231 8601 8915 9690 10370 10947 11293 GDP (LCU) growth a/ 9.3 0.7 5 7.7 -4.7 7.9 7.4 7.6 2.3 -3.4 6.8 -5.7 6.2 5.3 9.4 8.4 6.9 4.5 Per Capita GDP (LCU) Growth a/ 6.9 -1.2 3.0 5.7 -6.5 5.9 5.5 5.6 0.5 -5.0 5.0 -7.2 4.5 3.6 8.6 7.1 5.6 3.2 Poverty (Head Count Ratio) b/ 2.1 2.0 2.7 Poverty (Head Count Ratio) c/ 16.9 16..5 14.7 Poverty (Head Count Ratio) d/ 1.3 1.3 1.3 0.9 0.7 0.5 Poverty (Head Count Ratio) e/ 27.0 28.1 25.6 20.5 17.8 18.6 Poverty (Head Count Ratio) f/ 30.3 23.7 20.8 16.3 13.3 9.5 Poverty (Headcount Ratio) g/ 28.3 27.0 Gini Coefficient h/ 41.5 42.7 43.2 Gini Coefficient 49.0 44.0 42.0 40.0 38.0 38.0 a/ The World Bank (WDI). Constant 2000 International Dollars. b/ $1.25-a–day poverty line, (World Bank updated (2008) poverty estimates (www..worldbank.org). c/ $2.50-a-day poverty line: (World Bank updated (2008) poverty estimates (www..worldbank.org). d/ Food Poverty; e/ Food + Non-Food Poverty; f/ $4.3-a-day per capita poverty line. Turkish Statistical Institute: Official estimates. g/ The World Bank (2005c), p. 8, Table 1.8, h/ (World Bank updated (2008) poverty estimates (www..worldbank.org). Note: GDP= gross domestic product; LCU= local currency unit.

112
Table L.2 Turkey: Population and Labor Force Participation (LFP) Rates
(percent except first row)
TURKEY 1990 1991 1992 1993 1994 1995 1996 1997 1998 1999 2000 2001 2002 2003 2004 2005 2006 2007 Population, total (millions) a/ 56.2 57.3 58.4 59.5 60.6 61.7 62.9 64.0 65.2 66.3 67.4 68.5 69.6 70.7 71.1 72.1 73.0 73.9 Population growth (annual %) a/ 2.3 2.0 1.9 1.9 1.9 1.9 1.8 1.8 1.8 1.7 1.7 1.6 1.6 1.6 0.6 1.3 1.3 1.3 Urban population (% of total) a/ 59.2 59.8 60.4 60.9 61.5 62.1 62.6 63.1 63.7 64.2 64.7 65.2 65.7 66.3 66.8 67.3 67.8 68.2 LFP rate by Gender (Official): Total b/ 56.6 57.0 56.0 52.1 54.6 54.1 53.7 52.6 52.8 52.7 49.9 49.8 49.6 48.3 48.7 48.3 48.0 48.2
Male b/ 79.7 80.2 79.6 78.0 78.5 77.8 77.3 76.7 76.7 75.8 73.7 72.9 71.6 70.4 72.3 72.2 71.5 69.3 Female b/ 34.1 34.1 32.7 26.8 31.3 30.9 30.6 28.8 29.3 30 26.6 27.1 27.9 26.6 25.4 24.8 24.9 23.6
LFP by Gender (WDI): Total c/ 58.1 57.8 56.8 53.1 55.6 55 54.6 53.3 53.4 53.3 50.5 50.3 50 48.7 52.3 52.2 52.0 Male c/ 81.5 80.9 80.4 78.8 79.3 78.5 78.0 77.4 77.2 76.3 74 73.1 71.8 70.6 76.7 76.5 76.2 Female c/ 34.4 34.3 32.9 26.9 31.4 31.1 30.7 28.9 29.3 30.1 26.6 27.1 27.9 26.6 27.8 27.7 27.7
LFP by Gender (WDI): Total d/ 60.7 60.4 59.3 55.7 58.1 57.4 57.0 55.8 55.8 55.7 52.8 52.7 52.6 51.3 55 54.8 54.6 Male 84.5 83.9 83.4 82 82.4 81.4 81.0 80.5 80.3 79.4 77.1 76.3 75.2 74 80.3 80.1 79.8 Female 36.2 36.2 34.6 28.5 33.1 32.7 32.3 30.4 30.7 31.4 27.9 28.5 29.4 28.1 29 28.9 28.8
a/ The World Bank (WDI) b/ Turkish Statistical Office. Data is for ages 15 and older. Data for 2007 are from the OECD, adjusted to cover the same age range. c/ The World Bank (WDI), Ages 15 and above. d/ The World Bank (WDI), ages 15-64. Note: WDI= World Development Indicators.

113
Table L.3 Turkey: Employment-to-Population (ETP) Ratio (percent) and Number of Hours Worked per Week
TURKEY 1990 1991 1992 1993 1994 1995 1996 1997 1998 1999 2000 2001 2002 2003 2004 2005 2006 2007 ETP ratio by Gender: Total a/ 52.1 52.3 51.2 47.5 49.9 50.0 50.2 49.0 49.2 48.6 46.7 45.6 44.5 43.2 43.7 43.3 43.2 43.5
Male 73.5 73.2 72.6 71.1 71.6 71.7 72.0 71.7 71.4 70.0 68.8 66.6 63.9 62.9 64.7 64.8 64.6 67.9 Female 31.2 31.7 30.2 24.3 28.8 28.6 28.8 26.6 27.3 27.8 24.9 25.1 25.3 23.9 22.9 22.2 22.3 23.8
ETP ratio - Vulnerable Employment b/ 48.8 50.6 46.3 47.5 44.7 44.4 44.5 40.7 48.8 Male 41.3 42.7 39.8 40.4 37.7 37.9 38.9 35.6 41.3 Female 68.4 70.1 64.0 66.1 62.0 61.2 59.9 55.3 68.4 ETP ratio - Child Labor c/ 8.8 5.1 2.6 Male c/ 10.2 5.6 3.3 Female c/ 7.3 4.6 1.8 ETP ratio - Child Labor Employment Rates c/ 3.2 1.6 1.5 Male c/ 4.8 2.4 2.2 Female c/ 1.5 0.8 0.8 ETP ratio - Rural Child Labor c/ 14.9 9.6 4.1 Male c/ 16.0 9.7 5.0 Female c/ 13.7 9.5 3.3 Hours Worked per Week (Total) d/ 47.2 45.2 46.5 48.6 48.7 48.7 49.3 51.4 51.3 49.0
Male d/ 49.8 49.2 49.6 51.1 51.3 51.3 52.0 54.1 54.2 51.9 Female d/ 36.8 38.7 38.2 42.4 42.3 42.0 42.1 43.8 43.2 41.1
Hours Worked per Week (Manufacturing) d/ 51.3 51.4 51.9 52.2 52.1 53.7 54 51.8 Male d/ 52.6 52.6 53.1 53.3 53.3 55.1 55.3 53.1 Female d/ 46.0 46.5 47.4 47.8 47.4 47.9 48.7 46.7
Sources and Note: a/ Staff estimates from official data on labor participation and unemployment rates. b/. Includes self-employed and informal sector jobs; c/ Age 6-14), by Gender, Rural and Urban, Selected Years, 1994-2006 (in % of Age Category); Source: ILO, Working Child 2006, based on TURKSTAT, Working Child Statistics, 2006. d/ ILO. www.laborstat.ilo.org.

114
Table L.4 Turkey: Gross National Income per Worker, Earnings per year by Quintile, and Manufacturing, Agriculture, and Minimum Wage Indices.
(US Dollar equivalent at year 2000 prices except last three rows TURKEY 1990 1991 .1992 1993 1994 1995 1996 1997 1998 1999 2000 2001 2002 2003 2004 2005 2006 2007
Real Gross National Income per worker a/ 6042 5899 6207 7102 6270 6646 6991 7547 7559 7226 7886 7388 7964 8480 9115 9844 10430 10735 Public Sector b/ 5747 8251 8746 9450 9446 8056 6044 7205 7107 10102 10803 9555 8682 8795 8341 8567 8341 8605 Private Sector b/ 5052 6932 7351 7475 6117 5772 5880 5705 6671 7444 7522 6000 5940 5744 5940 5977 5934 6081 Civil Servant Salary b/ 3844 4124 4690 4790 3740 3666 3945 4594 4534 4740 4194 4037 4269 4232 4215 4327 4596 4776 Minimum Wage b/ 1076 1213 1323 1400 1177 1130 1339 1468 1396 1877 1607 1380 1491 1547 1894 1968 2049 1960 Average Household Income c/ 4905 3906 3840 4126 4265 Household Income - 1st Quintile c/ 1191 1033 1151 1246 1290 Household Income - 2nd Quintile c/ 2116 1916 1974 2205 2362 Household Income - 3rd Quintile d/ 3093 2738 2778 3139 3377 Household Income - 4th Quintile c/ 4667 4069 4019 4514 4820 Household Income - 5th Quintile c/ 13460 9773 9276 9525 9475 Per Capita Household Income c/ 1104 939 929 1004 1045 Per capita Household Income - 1st Quintile c/ 314 279 287 301 311 Per capita Household Income - 2nd Quintile c/ 489 466 493 552 619 Per capita Household Income - 3rd Quintile c/ 675 636 670 772 834 Per capita Household Income - 4th Quintile c/ 999 927 947 1083 1150 Per capita Household Income - 5th Quintile c/ 2776 2281 2179 2276 2259 Minimum Wage d/ 23.7 27.8 30.5 30.0 27.4 24.7 29.6 30.7 31.7 48.0 40.7 38.0 41.5 42.2 53.5 53.7 48.4 43.4 Formal Wage Index e/ b/ 102.7 127.3 117.4 120.8 92.4 93.7 94.0 96.0 95.9 102.0 100.0 87.4 80.2 74.9 75.1 75.7 72.1 69.3 Agricultural Wage f/b/ 104.3 118.4 100.0 93.1 78.8 77.4 82.9 88.4 98.4 Sources and Note: a/ The World Bank (WDI) b/ Ministry of Planning. <http://www.dpt.gov.tr>, c/ US dollars per year. Staff estimates using annual nominal household income survey data available at www.turkstat.gov.tr. These are estimates converted to US dollars at the average 2000 exchange rate. d/ 1990-2005: Secretary of Planning; 2006-2007: www.turkisheconomy.org.uk. Data is percent of Per Capita GDP. e/ Index of real wages in private manufacturing (Index, 2000=100). f/ Index of Wage of Permanent Agricultural Workers (Males), (Index, 2000=100). Nominal values deflated by the CPI. (Turkish Statistical Institute)

115
Table L.5 Turkey: Unemployment Rates (percent)
TURKEY 1990 1991 1992 1993 1994 1995 1996 1997 1998 1999 2000 2001 2002 2003 2004 2005 2006 2007
Unemployment a/ 8.0 8.2 8.5 8.9 8.6 7.6 6.6 6.8 6.9 7.7 6.5 8.4 10.3 10.5 10.3 10.3 9.9 9.7
Male a/ 7.8 8.7 8.8 8.8 8.8 7.8 6.9 6.5 6.9 7.7 6.6 8.7 10.7 10.7 10.5 10.3 9.7 10.0
Female a/ 8.5 7.1 7.7 9.3 8.0 7.3 5.9 7.7 6.8 7.3 6.3 7.5 9.4 10.1 9.7 10.3 10.3 10.5 Unemployed: No. of Weeks of Job Search b/ 34.2 33.8 42.9 38.6 57.2 58.5 53.3 46.4
Male b/ 31.2 31.2 40.7 36.0 55.0 55.9 50.3 43.3
Female b/ 42.5 42.9 49.8 45.5 63.7 66.3 61.1 55.0 Sources and Note. a/ Turkish Statistical Institute. Statistical Indicators1923-2007. <www.turkstat.gov.tr>. Series published by ILO and OECD are very similar. b/ Turkish Statistical Institute. <www.turkstat.gov.tr>. Labor Force Statistics.

116
Table L.6 Turkey: MILES Indicators Table TURKEY 1990 1991 1992 1993 1994 1995 1996 1997 1998 1999 2000 2001 2002 2003 2004 2005 2006 2007 2008 Macroeconomic Stability Inflation, consumer prices (annual %) 60.3 66.0 70.1 66.1 106.3 88.1 80.3 85.7 84.6 64.9 54.9 54.4 45.0 25.3 10.6 10.1 10.5 8.8 Central Government primary balance (% of GNP)a/ 1.5 4.6 4.8 3.5 4.9 5.3 5.5 5.8 5.2 Central Government overall balance (% of GNP)a/ -11.6 -11.2 -17.4 -13.8 -11.2 -7.1 -2.2 0.1 -0.7 Overall Balance of Public Sector a/ -17.1 -12.5 -9.1 -4.6 -0.3 -0.4 4.6 2.1 2.3 3.8 3.3 5.0 5.4 5.1 5.1 3.5 Public debt (% of GDP) 66.4 61.5 55.2 49.1 41.6 34.2 38.8 Gross External Debt 57.7 56.3 47.3 41.2 35.1 39.5 33.7 Gross Investment 22.1 19.1 20.8 15.1 17.6 17.6 19.4 20 22.1 22.2 Exports 21.3 19.7 21.4 23.6 23.8 24.1 24.5 24.4 24.4 24.9 Current Account Balance (% of GDP) 1.0 -0.7 -4.9 1.7 -0.7 -2.6 -4.0 -4.6 -6.0 -5.7 REER Index 2000=100, Year Endb 100 78.9 85.1 95.3 97.1 116.2 108.5 129.0 Investment Climate Ranking of WEF Global Competitiveness Index b/ 40.0 44.0 54.0 69.0 65.0 66.0 66.0 59.0 53.0 63.0 WEF Global Competitiveness Index (%of countries ranked lower) 24.5 25.4 28.0 13.8 36.3 36.5 43.6 52.8 59.5 53.0 WEF Total Number of Countries 53 59 - 75 80 102 104 117 125 131 134 Time required to start a business, Doing Business survey (days) b/ 13.0 9.0 9.0 6.0 6.0 6.0 GFCF, private sector (% of GDP) a/ 7.7 7.6 7.5 FDI (US$ billions) 0.7 0.8 0.8 0.6 0.6 0.8 0.6 0.6 0.6 0.1 0.1 2.9 1.0 1.3 2.0 8.7 19.1 FDI (% of GDP) 0.4 0.3 0.4 1.7 0.5 0.6 0.7 2.1 3.8 3.0 Labor Regulations and Institutions Employment Law Index, Doing Business (smaller numbers are better) c/ 38 38 42 42 42 38 Labor Freedom factor, Index of Economic Freedom (larger numbers are better) d/ 47.4 47.4 50.1 48.0 Total Tax Wedge Including Payroll Taxes Education Primary enrollment rate Gross 98.9 88.5 94.3 95.4 96.9 98.8 94.5 93.6 94.1 94.2 Male 97.0 99.9 99.9 101.0 102.5 97.6 96.4 96.7 96.4 Female 79.5 88.5 90.7 92.7 94.9 91.3 90.7 91.5 92.0 Net 89.2 91.9 89.3 89.6 90.2 91.4 Secondary enrollment rate Gross 48.0 77.6 81.1 84.6 78.4 74.4 78.6 Male 88.7 92.0 96.7 89.6 81.8 85.9 Female 66.2 69.9 72.2 66.9 66.8 71.1 Net 42.0 66.0 68.7 Ratio of Girls to Boys in Primary and Secondary Schools (%) 78.9 81.0 83.9 84.5 85.5 85.1 85.8 89.4 90.1 Tertiary enrollment 12.7 20.9 21.5 23.2 23.4 24.4 28.0 28.9 31.0 34.6 Male 24.8 25.5 27.5 27.2 28.1 31.8 33.4 35.6 39.4 Female 16.9 17.4 18.7 19.4 20.5 24.0 24.3 26.3 29.7 Ratio of Females to Males in Tertiary Education (%) 68.3 68.4 68.2 71.3 72.9 75.3 72.6 73.9 75.4 Social Health expenditure, private (% of total health expenditure) 32 30 28 28 29 Health expenditure, public (% of total health expenditure) 68 70 72 72 71 Population Population, total (millions) 56.2 57.3 58.4 59.5 60.6 61.7 62.9 64.0 65.2 66.3 67.4 68.5 69.6 70.7 71.1 72.1 73.0 73.9 Population growth (annual %) 2.3 2.0 1.9 1.9 1.9 1.8 1.8 1.8 1.8 1.7 1.7 1.6 1.6 1.5 0.6 1.3 1.3 1.2 Urban population (% of total) 59.2 59.8 60.4 60.9 61.5 62.1 62.6 63.1 63.7 64.2 64.7 65.2 65.7 66.3 66.8 67.3 67.8 68.2 Sources: All data from World Bank WDI consulted on December 5 2008, unless otherwise noted. a/ IMF Article IV consultations; b/ World Economic Forum (WEF). The index is not comparable from year to year because the average sample of countries increases. c/ Doing Business (DB) Indicators. Years correspond to DB's data collection timeline, one year before DB report d/ Doing Business (DB) Indicators. Ranges from 0 to 100. The higher the number, the more difficult it is to higher. Note: GFCF= gross fixed capital formation; FDI= foreign direct investment; GDP= gross domestic product; GNP= gross national product; MILES= Macroeconomic conditions, Investment climate and infrastructure, Labor market regulations and institutions, Education and skill development; and Social safety net; REER= real effective exchange rate; WEF= World Economic Forum.

117
Table L.7 World Economic Forum Global Competitiveness Index Rankings, Selected Countries, 2007
Country Overall Infrastructure Public Institutions
Macro Economy
Health & Primary
Education
Higher Education &
Training
Goods Market
Efficiency
Labor Market
Efficiency
Financial Market
Sophistication
Turkey 53 59 55 83 77 60 43 126 61
Colombia 69 86 79 63 64 69 85 74 72
Tunisia 32 32 21 72 24 30 31 79 66
Azerbaijan 66 60 83 23 103 89 95 46 91
Poland 51 80 82 56 36 35 69 49 64
Croatia 57 53 65 73 44 46 71 56 68
Ukraine 73 77 115 82 74 53 101 65 85
Portugal 40 25 27 81 32 34 41 83 35
Cyprus 55 26 36 55 18 38 37 80 39
Bolivia 105 118 124 49 91 91 125 121 106
Spain 29 19 43 32 37 31 40 95 34
Armenia 93 87 96 57 99 95 104 40 110
Source: World Economic Forum, Global Competitiveness Report, 2007-08 (Geneva: WEF, 2007).

118
Appendix M. Turkey: List of People Met
WORLD BANK
Aristomene Varoudakis Country Manager for Armenia
Ina Ruthenberg Country Program Coordinator
Jeanine Braithwaite Senior Social Protection Economist
Basil Kavalsky Consultant, IEGCR
Arup Banerji Senior Adviser, IEGWB
James Parks Adviser, MDW
Fernando Montes Sector Director, ECSPF
Paulo Guilerme Correa Senior Economist, ECSPF
Jesko Hentchel Country Sector Coordinator, ECSHD
Raif Can Consultant
Carlos Pinerua Country Sector Coordinator, ECSPF
Mark Thomas Lead Economist, ESCPE
Mediha Agar Economist, ECSPE
Maureen Anne McLaughlin Lead Education Specialist, ECSHD
Kamer Karakurum-Ozdemir Economist, ECSPE
Keiko Sato Lead Operations Officer, ECCU6
Ulrich Zachau Country Director, ECCU6
Ismail Arslan Sr Evaluation Officer, IEGCR
James Hanson Consultant, MNSED
Gordon Betcherman Sector Manager, ECSHD
International Monetary Fund
Hossein Samiei
Davide Lombardo
Turkish Government Officials, Private Sector Representatives and Other Turkey-based Individuals
Ferudun Giresun Department Head, ISKUR Turkish Employment Organization
Asim Keskin Advisor to Minister of Labor, Ministry of Labor
Mehmet Akkul Department Head, State Owned Enterprises, Treasury
Ozgur Pehlivan Deputy General Director, Foreign Economic Relations, Treasury
Elvan Ongun Department Head, Foreign Economic Relations, Treasury
Murat Alici Deputy General Director, Foreign Investment, Treasury

119
Fatma Uluc Education Project Officer, UNICEF
Mustafa Balci Education Sector Manager, Economic Commission, European Union
Halil Ibrahim Alca SPO State Planning Organization
Kemal Madenoglu SPO
Guven Sak Executive Director, TEPAV Economic Policy Research Foundation of Turkey
Emim Dedeoglu Director, Governance Studies, TEPAV
Ozan Acar Research Associate, TEPAV
Enver Tasti Director of Social Statistics, TURKSTAT State Institute of Statistics
Didem Sozer TURKSTAT
Gulay Aslantepe Director, ILO
Ertan Tanriyakul Deputy General Manager, TURK EXIM BANK
Neslihan Topbas Funding Manger, TURK EXIM BANK
Ahmet Aksu Vice President, Privatization Administration
Gunden Peker Cinar Head of Project Group, Privatization Organization
Ozge Alpay Coordinator, Project Coordination Unit, Privatization Organization
Irem Guner Project Consultant, Privatization Organization
Zafer Ali Yavan TUSIAD Turkish Industrialists' and Businessmen's Association
Orhan Beskok Executive Vice President, Industrial Development Bank of Turkey TSKB
Gunduz Findikcioglu Chief Economist, TSKB
Refik Akinci Department Head, Economics and Engineering, TSKB
Hakan Altinay Executive Director, Open Society Institute Assistance Foundation
Neyyir Berktay Coordinator, Education Reform Initiative ERG
Batuhan Aydagul Deputy Coordinator, ERG
Ayla Goksel Gocer Vice President and CEO, Mother Child Education Foundation ACEV
Necdel Kenar Director General, MESS Training Foundation

120
Appendix N. Cross-Country Comparisons
The cases reviewed in chapters 2, 3, and 4 of this report depict a range of experiences relat-ing to Bank support for addressing employment challenges. This appendix provides more detail of the issues discussed in Chapter 5, namely on the set of findings that can be drawn from Bank experiences assisting Colombia, Tunisia and Colombia. The discussion focuses on findings related to the country’s achievement of outcomes (GDP, poverty, employment, and earnings growth), and the contribution of Bank inputs, first from a cross-cutting pers-pective and then with reference to each of the five MILES areas of support. The appendix concludes with implications for Bank support during the current jobs crisis.
Comparison of Outcomes across the Three Countries Two findings in connection with outcomes across the three countries are highlighted. First, progress in economic growth and earnings was better than progress in employment and un-employment. Second, although the availability of statistics on employment and earnings outcomes has improved, there are still significant deficiencies.
Outcomes, Exogenous Forces and Policies. When comparing the decade under review (1997-07) with the previous decade, the broad outcomes (Table N.1 are as follows.
Tunisia did best. With stable employment growth, Tunisia increased its employment-to-population ratio and reduced the unemployment rate. Per capita GDP, GNI and earnings growth rates also increased, and poverty declined at an increased rate.
Colombia also registered stable employment growth and an increase in the employment-to-population ratio, but the unemployment rate increased. The per-capita GNI and GDP growth rates declined but earnings growth may have increased towards the end of the re-view period due to a decline in inequality. Poverty fell after having increased during the previous decade.
Turkey experienced declines in employment growth and in the employment-to-population ratio, and an attendant increase in the unemployment rate. The per-capita GNI and GDP growth rates increased and earnings growth possibly remained stable. Poverty declined at an increasing rate, particularly after 2002. The last column of Table N.1 shows per worker output growth and TFP. Although Turkey, like Tunisia, increased TFP growth markedly, Turkey’s growth— unlike Tunisia’s— was “jobless”.

121
Table N.1 Colombia, Tunisia, and Turkey: Outcome Indicators
Employment Unemploy-ment
Income Poverty Income distribution Output/TFP
Average annual change
(%)
Employment-to-population
ratio (%)
Unemploy-ment
Rate
Real per capita GNI
growth
Headcount ratio
(not comparable across countries)
Data at or closest to (as indicated):
Gini coefficient
(not comparable across countries)
Data closest to (as indicated)
Per-worker GDP growth/of which:
TFP
Year/ Period 1987-97 1997-07 1997 2007 1997 2007 1987-97 1997-07 1987 1997 2007 1987 1997 2007 1989-95 1995-05
Colombia 2.3 2.3 51.0 51.4 9.8 10.7 2.2 1.9 51.2 49.4
47.9 52.5 57.4 58.6 1.58/
-0.01 1.16/ -0.18
Tunisia 2.7 2.7 38.1a/ 40.2 16.0b/ 14.1 2.1 4.0 7.7c/ 6.2d/ 3.8e/ 43.4c/ 41.7d/ 40.0e/ 2.37/ 0.75
3.04/ 1.42
Turkey 1.9 0.8 49.0 43.5 6.8 9.7 2.3 2.5 38.5 28.3f/
30.3g/ 27.0g/
9.5 43.0
h/ 41.5f/
42.0i/ 42.7g/
38.0j/
43.2e/ 2.83/ -0.05
3.61/ 1.50
World average
1.7 1.6 63.0 61.8 6.1 6.0 1.4 1.9 71.8 67.2 56.6 61.9k/ 64.2l/
65.1m/
63.4n/ 0.83/ -0.44
2.99/ 1.32
Sources and Note: GNI, population and working age population: The World Bank( WDI). Employment and Unemployment: DANE (Colombia), Tunisia Institute of Statistics (Tunisia), OECD (Turkey), The World Bank (WDI) and ILO, “Global Employment Trends”, 2009 (World). Poverty Headcount Ratio: DNP (Colombia); Tunisia Institute of Statistics (Tunisia); The World Bank (2005c) and Turkish Statistical Institute (Turkey); The World Bank (WDI) (World). Gini Coefficient: DNP (Colombia); World Bank updated (2008) poverty estimates (<www..worldbank.org>) (Tunisia); Turkish Statistical Institute and World Bank updated (2008) poverty estimates (<www..worldbank.org>) (Turkey). Output/TFP: staff estimates from Dale W. Jorgenson; Khuong Vu, "Information Technology and the World Growth Resurgence", hdl:1902.1/10702 UNF:3:vE7B5m3aMRtK6ZZi4lP4DA==; Average of 122 Economies. Indicated years: a/1999 b/ 1999 c/1985 d/ 1995 e/ 2005 f/ 1994 g/ 2002 h/ 1986 i/ 1996 j/ 2002 k/ 2006 l/ 1988 m/ 1998: Milanovic (2005), p. 108; 13/ 2000 and 14/ 2005: Hillebrand (2008), Table 2. Note: GDP= gross domestic product; GNI= gross national income; TFP= total factor productivity; WDI= World Development Indicators.
Although employment growth has been positively correlated with GDP growth, as indi-cated by ILO (2005) estimates of the GDP elasticity of employment, changes in average GDP growth rates between 1987-97 and 1997-07 were reflected primarily in changes in earnings growth, but not in employment growth. A positive relationship between GDP and em-ployment growth is to be expected because growth triggers demand for labor and because employment is one of the sources of growth.
However, the simple correlation between employment and GDP growth is weakened by the relationship that has also been found between changes in GDP growth and changes in TFP growth (another source of GDP growth), particularly when fundamental changes in relevant policies have taken place. In fact, worldwide acceleration of GDP growth during the review period was linked to worldwide acceleration of TFP growth and the three countries were no exception. Increases in total factor productivity growth allowed earnings growth to increase in Tunisia and Turkey, but possibly not in Colombia, where average TFP growth declined considerably during the recession years (compare the first two periods in Table N.2

122
Table N.2 Colombia, Tunisia, and Turkey: Sources of Growth
Period 1989–1995 GDP Growth Capital Labor TFP Per worker Total Hours Quality Colombia 1.58 4.35 1.18 2.77 0.42 -0.01 Tunisia 2.37 4.44 1.16 2.07 0.46 0.75 Turkey 2.83 4.11 2.46 1.28 0.41 -0.05
World a/ 0.83 1.66 0.83 0.87 0.41 -0.44 Period 1995–2000 GDP Growth Capital Labor TFP Per worker Total Hours Quality Colombia -0.25 0.91 1.38 1.16 0.38 -2.01 Tunisia 3.45 5.47 1.26 2.02 0.42 1.77 Turkey 3.06 3.87 2.39 0.81 0.34 0.34 World a/ 2.63 3.75 1.33 1.11 0.36 0.95 Period 2000–2006 GDP Growth Capital Labor TFP Per worker Total Hours Quality Colombia 2.57 3.85 0.80 1.28 0.13 1.64 Tunisia 2.63 4.49 1.29 1.86 0.26 1.08 Turkey 4.17 4.51 1.39 0.34 0.11 2.67 World a/ 3.35 4.51 1.42 1.15 0.24 1.70
Source: Dale W. Jorgenson; Khuong Vu, "Information Technology and the World Growth Resurgence", hdl:1902.1/10702 UNF:3:vE7B5m3aMRtK6ZZi4lP4DA== a/ Average of 122 Economies Note: GDP= gross domestic product; TFP= total factor productivity.
Differences in outcomes across the three countries were linked primarily to differences in local exogenous forces and policies. External forces were favorable. Improvements in the world and regional economic environments increased local demand for labor in the three countries. Per capita world GDP growth increased from 1.4 percent during 1987-97 to 1.8 percent during 1997-07, with even larger increases in Latin America, Europe and Central Asia, and the Middle East and North Africa. Access to international finance improved nota-bly and the cost declined.
Improvements in macroeconomic policies and other investment climate policies were also a factor in helping to increase investment and the demand for labor in the three countries. Good macroeconomic policies were already in place at the outset of the review period in Tunisia, while these policies initially deteriorated in Colombia and Turkey and improved later during the review period.
Labor market rigidity, non-wage costs, and minimum wages increased throughout the pe-riod in Turkey and remained unchanged in Tunisia. Rigidity was somewhat relaxed in Co-lombia, but non-wage costs and the minimum wage also increased.
Regarding education, the three countries achieved increases in enrollment, particularly in secondary and tertiary, that is, toward the working-age range. These increases as well as the demographic transition that reduced working-age population growth contributed to taming aggregate labor supply growth. Past education efforts also generated the supply of skills that allowed earnings to increase. Rural-urban migration spurred by economic sector ad-

123
justment in Turkey and rural violence in Colombia led to urban labor supply shocks. Fur-thermore, in Colombia, deteriorating security during the first half of the review period dis-couraged economic activity. In sum, the environment of local exogenous forces and poli-cies was most favorable in Tunisia, less so in Turkey, and least so in Colombia.
In Tunisia and Turkey, poverty declined at an accelerating pace during the review period (Table N.3 This acceleration in poverty reduction does not come as a surprise, as economic growth increased in these two countries. Likewise, with slower growth, poverty reduction also slowed down in Colombia. However, the experiences of the three countries suggest that periods of economic distress, with low productivity growth, hit the poor harder. In Tu-nisia, growth incidence curves, which depict the incidence of growth by percentile of the in-come distribution, show that growth has been pro-poor for several years, with the exception of the drought years during the early part of the century.1 There were significant reductions in poverty toward the end of the review period in both Colombia and Turkey. Research by Cardozo and Grosse (2007) uses growth incidence curves to show that growth in Colombia was pro-poor for the overall 1996-05 period, particularly in the rural sector. Growth (or ra-ther recession), however, was pro-rich (that is, with the poor hit hardest) during 1996-99 and pro-poor (i.e., with the poor benefitting the most) during the rest of the period, when the economy recovered. There are no available incidence curves for Turkey, but available Gini estimates suggest that during the crisis of the early 2000s, poverty increased and growth may have been pro-rich. Comparison of wage growth across the three countries shows the contrast between Colombia, where minimum wage regulations pushed formal sector wages up (and informal wages down), and Turkey, where inflation was allowed to bring real for-mal sector wages down during the period of structural adjustment.
Table N.3 Colombia, Tunisia, and Turkey: Poverty and Wages
Year/Period
Total Change in Poverty Headcount
Ratio Change (Percentage Points)
Average Change of Real Wages in Manufacturing
(Percent per Annum)
Change in the Unemployment Rate (Percentage Points)
Colombia a/ 1987-97 -1.8 3.7a/ -1.2 1997-07 -1.5 1.7 0.9 Tunisia b/ 1985-95 -1.5 3.0 -0.6d/ 1995-05 -2.4 1.2 -1.9e/ Turkey c/ 1987-97 -4.3 -0.9a/ -1.5 1997-07 -7.1 -3.2 +2.9
Source: a/ Change in Poverty: Staff estimates from DNP data (See Appendix D, Table D.1) Average Change in Real Wages: Central Bank (See Appendix D, Table D.4 . Change in Unemployment: DANE (See Appendix D, Table D.5 b/ Change in Poverty: Data from Tunisia’s Statistical Institute (See Appendix H, Table H.1 ); Average Change in Real Wages: 1995-05: Data from Tunisia’s Statistical Institute; 1985-95: Data from Tunisia’s Statistical Institute and from World Bank (1995) (See Appendix H, Table H.4 ) Change in Unemployment: (See Appendix H, Table H.5 c/ Change in Poverty: 1984-94: Förster, M. F. (2000), Table 5.2, p. 97; Average Change in Real Wages: Data from Turkish Statistical Institute (See Appendix L, Table L.4 Change in Unemployment (Turkish Statistical Institute) . d/ 1984-94; e/1994-04.

124
The dynamics of participation rates varied significantly across the three countries. Turkey’s long term decline in participation continued. It is primarily correlated with the decline in the share of the agricultural sector2, a decline that was given additional impetus by the re-moval of agricultural subsidies as part of the structural adjustment measures underpinning stabilization. Colombia’s long term increase in participation, primarily explained by in-creased education levels that raised female participation rates, ceased during the period un-der review. This reflected the diminished capacity of the economy to generate employment due to lower growth and possibly minimum wages. Participation rates in Tunisia increased, reflecting higher economic growth.
Similarly, the experience of unemployment in the three countries also varied considerably. It suggests that changes in unemployment in Colombia (Appendix D, Table D.5 ) during the decade were primarily cyclical. In Turkey, changes unemployment (Appendix L, Table L.5 reflected changes in the cyclical component prior to 2002, when there were wide swings in economic activity, with a rise in structural or frictional unemployment during stabilization, possibly as structural policies accelerated the rural-urban human resource reallocation. In Tunisia, changes in unemployment (Appendix H, Table H.5 were minor, reflecting the ab-sence of cycles or major structural changes.
In the three countries, unemployment rates remained very high. In 2007, these rates were 10.7 percent in Colombia, 14.1 percent in Tunisia, and 9.7 percent in Turkey— high even by regional standards in Colombia and Tunisia. These rates are not likely to reflect significant cyclical unemployment because in 2007 output was close to potential in the three economies. The rates are more likely to reflect classical unemployment due to high minimum wages or to structural unemployment stemming, for example, from skill mismatches. Both issues are of considerable importance in the three countries. Some frictional unemployment due to imperfect information may also be at work.
All of this suggests that the Bank may usefully help elucidate the hysteresis and structural roots of unemployment, including its cyclical, classical, frictional and structural compo-nents, as there has been little success in reducing the long-term level of unemployment. During the 10-years reviewed in this report, the three countries made little or no progress in reducing unemployment on a sustained basis. Understanding better the classical and struc-tural unemployment implications of minimum wages and of the other sources of long-term unemployment may help sharpen engagement and dialogue on this critical issue.3
There are also considerable differences in performance in employment indicators by gender. In both Tunisia and Turkey, female participation rates are much lower than male participa-tion rates for a variety of reasons discussed in the country chapters, including structural (for example, rural-urban migration in Turkey) and cultural factors (strong views of female roles at home). In Colombia, female participation rates, the highest of the three countries, de-clined after 2000, after several years of increasing, and male participation declined after many years of constancy. As with employment trends, the decline is linked primarily to slower economic growth, with some attribution due to minimum wage and labor taxes. In Turkey, female participation continued declining slowly, with no net changes in male par-ticipation. In Tunisia, female participation continued increasing and male participation con-tinued declining.

125
In all three countries, the authorities have been proactive in supporting women’s rights to work. Nevertheless, female unemployment rates are higher than male unemployment rates in Tunisia and more so in Colombia, with the gap between the two increasing in Tunisia largely as a result of skill mismatches. Turkey’s unemployment rates do not vary by gender. A distinguishing feature in Tunisia is that unemployment is higher among the educated, again due to a skill (quality) mismatch.
The experience with respect to employment outcomes suggests that Bank programs with employment objectives would benefit by considering the full set of employment-related outcomes when designing country programs. This set would cover employment growth, the employment-to-population-ratio, the unemployment rate and earnings growth, and the im-pact of these on poverty— as well as the uncertainties of that impact. This is not to say that programs necessarily need to have quantitative targets for these variables, but that policies and programs need to be understood in terms of their possible effects on those variables.
Employment abroad has been an important source of income/transfers for nationals of the three countries, both for those living and employed abroad as for those living in their country and receiving remittances. In Colombia, the economic and security crisis at the turn of the century triggered a substantial rise in the stock of emigrants (up to 4 percent of popu-lation) and in remittances (up to 7 percent of GNI), the latter declining as the economy im-proved (See Figure N.1 ). In Tunisia, there was a gradual rise in the stock of emigrants after the year 2000 (up to 10 percent of population in 2007), and a rise in the level of remittances (up to a little over 10 percent of GNI; (See Figure N.2 ). Turkey shows a sharp decline in remittances as the economy improved as well as a decline in the stock of emigrants (See Fig-ure N.3 ).
Figure N.1 Colombia—Number of Colombian Nationals Living Outside Colombia (Percent of Colombia's
Population) and Workers' Remittances to Colombia (Percent of GNI)
Figure N.2 Tunisia—Number of Tunisian Nationals Living Outside Tunisia (Percent of Tunisia's Population) and Workers' Remittances to Tunisia (Percent of GNI)
Sources: The World Bank (WDI): Population and Remittances. Organizacion Internacional para las Migraciones: Stock of Co-lombian Nationals Abroad. Note: GNI= gross national income; WDI= World Development Indicators.
Sources: The World Bank (WDI): Population and Remittances. Ministry of Foreign Affairs: Stock of Tunisians Living Abroad. Note: GNI= gross national income; WDI= World Development Indicators.
0.00
1.00
2.00
3.00
4.00
5.00
6.00
1995
1996
1997
1998
1999
2000
2001
2002
2003
2004
2005
2006
2007
Year
Per
cen
t
0.0
2.0
4.0
6.0
8.0
10.0
12.0
Per
cen
t
Workers' Remittances/GNI (percent, Left Axis)Tunisians Living Abroad/Population (Percent, Right Axis)
0.0
0.5
1.0
1.5
2.0
2.5
3.0
3.5
4.0
4.51970
1973
1976
1979
1982
1985
1988
1991
1994
1997
2000
2003
2006
Year
Per
cen
t
0.0
1.0
2.0
3.0
4.0
5.0
6.0
7.0
8.0
Per
cen
t
Workers' Remittances/GNI (Percent, Left Axis)Colombians Liiving Abroad/Population (Percent, Right Axis)

126
Adequacy of Employment Data. A review of the data that was available for this report con-cludes that although much progress has been achieved in collecting information, there are still important pitfalls. For example, in Colombia, data is now being produced on a monthly basis and at the national level since 2001. However, limited comparability with previous years limits the usefulness of analyses. Delays in production of the data, particu-larly with respect to earnings, prevents timely monitoring. Furthermore, sources (official, ILO, Bank) sometimes conflict with one another. Although Colombian national data indi-cate that the participation rate ceased growing during the review period, both the ILO and the World Bank (WDI) estimates indicate that the participation rate continued growing.
The Bank could step up its support, in coordination with other institutions, for better infor-mation gathering and availability on employment and earnings. The Bank has already been active in assisting countries in strengthening their household survey data. But more could be done. A good area to target is the timeliness of dissemination. For example, the last available household survey data regarding earnings in Colombia at the time of writing of this report (2009), which allows anal-ysis of formal/informal sector differ-ences, was for 2006. The implied de-lays are too long for the needs of analysts, observers, and policy mak-ers. In Tunisia and Turkey, the situa-tion is similar.
Comparisons of Overall Bank Support across the Three Countries Three findings are highlighted in connection with country program strategies. First, Bank objectives targeted primarily areas with a bearing on employment ( for example, MILES areas) rather than explicitly targeting employment outcomes. Second, although its impact is uncertain, the Bank’s AAA was generally of good quality in terms of addressing the right employment issues competently, and was well appreciated by the three clients. Third, the Bank’s proactivity and engagement on employment issues may not always have been well matched to country circumstances.
Bank Objectives. Although employment objectives have not been very explicit in Bank pro-grams, most policies supported by the Bank in the three countries had some bearing on em-
Figure N.3 Turkey—Number of Turkish Nationals Living Out-side Turkey ((Percent of Turkey's Population) and Workers'
Remittances to Turkey (Percent of GNI)
Sources: The World Bank (WDI) Population and Remittances. The World Bank; Icduygu, Ahmet, “Turkey and International Migration, 2004 - Sopemi Report For Turkey. Department of International Rela-tions, Koç University, Gökdere, Ahmet, “An Evaluation Of Turkish Migration Towards End-1995.” Note: GNI= gross national income; WDI= World Development Indicators.
0.0
0.5
1.0
1.5
2.0
2.5
3.0
3.5
4.0
19
73
19
75
19
77
19
79
19
81
19
83
19
85
19
87
19
89
19
91
19
93
19
95
19
97
19
99
20
01
20
03
20
05
20
07
Year
Per
cen
t
0.0
1.0
2.0
3.0
4.0
5.0
6.0
Per
cen
t
Workers' Remittances/GNI (Percent, Left Axis)Turks Living Abroad/Population (Percent, Right Axis)

127
ployment. Bank strategies by and large focus on growth and poverty reduction as “grand objectives.” References to employment or unemployment objectives are common, albeit of-ten included only in passing. However, in these three countries, references to employment in Bank programs increased during the review period, reflecting the rising importance as-signed to employment growth by authorities. Furthermore, the more concrete objectives generally included the policy areas with a bearing on employment, that is, the MILES areas.
This experience suggests that where employment issues are important, Bank strategies could better articulate how support in different areas will affect the full set of employment outcomes and poverty. Where employment issues are pivotal, country programs could arti-culate their impact on employment outcomes by indicating the links between their concrete intermediate outcome indicators and employment outcomes ( that is, participation, em-ployment, unemployment and earnings, as well as growth and poverty reduction). This will make employment objectives more tractable and credible, and employment impact more explicit or transparent. The rationale for this suggestion is that employment outcomes are the key channel through which country programs affect poverty, and poverty reduction is the Bank’s overriding objective.
Country programs should be more concerned with the consistency of the policies supported that include shared employment objectives, than with any precise targets regarding these objectives. Bank strategy regarding employment and earnings growth is constrained by uncertainties in outcomes, country priorities, and political economy considerations. Bank programs typically aim at broad and general growth objectives and even broader employ-ment objectives, primarily reflecting the similar generality observed in government pro-grams. This is probably inevitable given the considerable uncertainties in outcomes. Moreo-ver, the timing of support to policies to address the different MILES issues in a country’s strategy is unlikely to be driven solely by employment/unemployment/earnings considera-tions, but will consider political economy constraints the country faces in all areas, particu-larly with regard to labor regulations and institutions.
The Bank’s strategy and interventions were highly relevant in addressing key employment and earnings-related policy issues in the three countries. Bank support— through its AAA, TA, and lending operations— adapted to governments’ changing priorities and generally addressed (or attempted to address) the most critical policy constraints. The Bank’s ideas and its international perspective and experience mattered considerably. High quality AAA played a key role in establishing and maintaining the extent and depth of the Bank’s access to senior policy makers.
In terms of the effectiveness of Bank inputs, the picture is mixed. Much has been achieved. In Colombia and Turkey, the Bank correctly identified macroeconomic instability and finan-cial sector weaknesses as the key constraints to growth at the beginning of the review pe-riod. Both macroeconomic stability and financial sector soundness were restored partly as a result of Bank–supported policies. During the latter part of the period, the Bank’s focus rightly shifted to improving the investment climate and was successful in supporting achievements in this area. Furthermore, the Bank provided AAA on labor market issues that proved useful in informing the debate on labor market policies in these two countries. The Bank’s contribution to education was probably stronger in Colombia than in Turkey, both

128
in terms of engagement and innovation. In both countries, the Bank was helpful in helping develop social protection (CCT and/or unemployment insurance) arrangements.
In Tunisia, macroeconomic and financial sector stability, which was already in place prior to the period under review, was sustained during this period, despite a challenging combina-tion of shocks in the early 2000s. Sustained macroeconomic stability clearly contributed to growth and better outcomes. Partly as a result of Bank support, the government made fur-ther progress in the macroeconomic areas relating to export development and financial sec-tor reform. The Bank was more focused on investment climate issues than in the other two countries and successfully supported the achievement of a more balanced playing field be-tween the offshore and on-shore economies and the transformation of the ICT sector. The Bank also engaged with effectiveness in improving coverage of education. However, its en-gagement in improving social protection arrangements was limited.
Other goals remain elusive. The three countries did not resolve a number of constraints re-lating to MILES policies. For example, considerable remaining rigidities in the tax and ex-penditure systems exist in Colombia; governance problems in Tunisia, which constrained private investment, did not receive enough attention. Little or no improvement in labor flex-ibility or in reducing the taxation of labor while financing social insurance was achieved in Tunisia or Turkey, and progress in Colombia was modest. Minimum wages remained bind-ing and possibly explain part of the informality and high unemployment rates in the three countries. There was not much progress in education quality in any of the three countries, with a particular concern regarding the quality of higher education in Tunisia. A broad-based financing of social insurance that eases payroll taxes and contributions while remain-ing fiscally prudent was not put in place. In Colombia, social safety nets were widened, al-beit generating discernible fiscal pressures which cannot be resolved without addressing the considerable remaining rigidities in the tax and expenditure systems.
In summary, although rigorous “attribution” of results to Bank support is virtually im-possible, the evidence in the country chapters suggests that most Bank activities made im-portant contributions. Bank AAA is generally appreciated for its quality in the three coun-tries. It appeared most critical in Tunisia, where the Bank is possibly the foremost provider of development knowledge products. The Bank’s AAA covered all of the MILES areas. with regard to lending, Bank-supported fiscal adjustment operations contributed importantly to the restoration of fiscal stability in Colombia and Turkey.
However, some of the Bank’s lending operations supported messy, “second-best” reforms. It was right to do so, but overpromised what could be achieved. In Colombia, fiscal adjust-ment operations promised more than could be delivered to eliminate structural rigidities given political economy constraints. Other specific examples include support for the reform of the public training system, for the Investment Stability Law in Colombia, for secondary education in Turkey, and for infrastructure in Tunisia. The Bank’s involvement contributed to better outcomes in these areas even though the results were less than expected.
To improve effectiveness, the Bank could usefully strengthen its role as knowledge provider and engage more strongly with its clients on employment policy. For example, use of AAA in an anticipatory fashion can position the Bank to be ready with support, including policy-based lending, when circumstances change. This may be particularly relevant for work on

129
labor regulations and institutions, as in Turkey. The Bank is in a strong position to streng-then its leadership regarding understanding of employment issues for a number of reasons. First, it has developed an integrative framework to identify constraints to employment. This framework allows the Bank to develop balanced views on policies affecting employment outcomes. Second, it has demonstrated a capacity, as in other areas, to bring research into operationally relevant policy implications. AAA is the key instrument to deal with some of the more sensitive policy issues with a bearing on employment outcomes. Third, its mandate of poverty reduction again claims strong attention to employment outcomes. Thus, the Bank contributed to a better understanding of employment issues in the three countries reviewed. It can do so in many other countries that would benefit from this knowledge, even if the benefit takes time to materialize.
Using AAA in an anticipatory fashion can position the Bank to be ready with support, in-cluding policy-based lending, when circumstances change. In the case of Turkey, Bank staff and management had a clear understanding in the late 1990s that the major constraint to the country’s economic growth (and indirectly employment generation) was the existing ma-croeconomic instability. Despite some reluctance on the part of the government, the Bank continued to pursue macroeconomic and related structural reform issues as an important part of its AAA. When circumstances finally changed with the emergence of the political will to pursue stabilization and related objectives, the Bank was ready. After having in-vested patiently, and rather expensively, in AAA, the Bank was in an excellent position to respond quickly to government requests to support such economic reform, including assis-tance in the design of the government’s macroeconomic and related structural reform pro-gram. In another case, dialogue at the technical level has been facilitated by staff working on labor markets. These staff also liaised effectively with former staff working in the coun-try.
The conduct of AAA with substantive local involvement in the form of consultants and counterparts, although more time-consuming and administratively difficult, can be more effective in the longer term. In those efforts in Turkey where such involvement has been in-tensive, institution-building has occurred. Individuals involved go on and assume impor-tant policy-making roles. Promoting reform has yielded positive, and sometimes unfore-seen, externalities.
Dissemination and engagement after an AAA report preparation needs to be adequately budgeted and anticipated. The inability of the Bank to effectively follow through can result in missed opportunities for supporting reform. A case in point for Turkey may have been with the Bank’s excellent Investment Climate Assessment. A similar example may also be the recently completed Financial Sector Assessment. Along similar lines, facilitating the “Revolving Door Effect” for Bank staff and government officials ( for example, facilitating secondments in the form of unpaid external leave for Bank staff to accept temporary, time-bound assignments in their national governments) can yield important dividends for eco-nomic reform and policy change. In the case of Turkey, the appointment of a Bank staff member as Minister of the Treasury in March 2001, just as the 2001 crisis was unfolding, had a major impact. The Bank-government relationship, already quite solid and productive since 1999, was further strengthened. The new Minister, who in the end exercised a major influ-ence over the country’s economic reforms, had from his own professional experience consi-derable confidence in the Bank’s work. As a result, an ease in professional communication

130
was quickly established. He relied upon Bank advice and technical assistance in the design of the ongoing reforms. This arrangement proved beneficial to the Bank, the government, and ultimately the country.
Technical excellence needs to be accompanied by a fuller appreciation of political economy considerations if consensus building for reform is to be attained. Regarding labor market regulations and institutions, there may be a need to broaden dialogue well beyond the circle of the Bank’s normal interlocutors in the government. Sometimes agreement with these in-terlocutors is achieved, but policies are still not implemented because of impediments from interest groups elsewhere. Experience with the series of development policy loans support-ing business climate improvements in Tunisia suggests that the reason reform measures were taken was not that they were DPL conditions; rather, prior agreement through dialo-gue was a necessary requirement for including the measures as loan conditions.
Proactivity and Engagement. The patient, resource-consuming, consensus-building efforts on policy issues requires strong engagement. This implies a permanent Bank presence in the country, which the three countries have. Relying on periodic missions often is not adequate, as demonstrated, for example by dialogue on education issues in Tunisia. In a number of policy areas and in economic dialogue generally, the beneficial presence of the Senior Coun-try Economist resident in Tunis has already been felt. The Turkey and Tunisia cases show how a local Bank presence helped develop the relationships with these countries. It also shows instances where support that was occasional and scattered in time did not help de-velop the relationship.
Cooperation between the Bank and other international organizations can provide greater benefits to the recipient country than the sum of their individual contributions. In the case of Turkey, the World Bank Group, the IMF, the European Union, the OECD, the ILO, the United Nations Children’s Fund (UNICEF) and other UN agencies have all contributed po-sitively to Turkey’s modernization, economic growth, and employment generation through different, but frequently related, dimensions of the MILES framework. In most instances co-operation has been fruitful, and the messages provided have been similar and consistent. The combined effect has been to reinforce the resolve of the Turkish Government to proceed with a reform agenda.
Similarities and Differences Across the Three Countries in Bank Support on the Specific MILES areas. Key findings are summarized as follows:
Bank support for macroeconomic policies contributed effectively to country efforts re-garding stabilization and financial crisis resolution in Colombia and Turkey, and re-garding trade and financial development in Tunisia. These efforts were the main force that helped restore GDP growth in the first two countries, and also contributed to sustaining higher growth in the third. Restored GDP growth increased the de-mand for labor resulting primarily in the documented higher earnings growth.

131
Bank support for investment climate policies covered the three countries and contri-buted to improvements in specific policy areas that helped raise investment or total factor productivity in varying degrees.
Support for labor market regulations and institutions has occurred primarily through AAA of good quality in terms of relevance and competence, but with somewhat un-certain and perhaps limited impact.
Support for education contributed primarily to coverage, and supported the in-creased supply of skills needed to raise output and earnings growth.
Support for social protection arrangements contributed successfully to CCT pro-grams in Colombia, and less so to unemployment insurance programs.
Macroeconomic Policies. The three country cases attest to the close connection between ma-croeconomic policy and cyclical unemployment, with Colombia and Turkey experiencing simultaneous cyclical movements in both GDP growth and unemployment, and Tunisia ex-periencing stability in both. Growth in Colombia and Turkey during the review period would have been less were it not for the stabilization that brought both countries out of re-cession during the first half of the review period. Bank support for macroeconomic policies was most important for employment growth in Turkey and Colombia. In Turkey, macroe-conomic policies that, on balance, enhanced growth included reduction of fiscal deficits through both tax and expenditure measures that involved important structural reforms in the financial system, pensions, privatization and agriculture. Although initial stabilization efforts failed, the IMF and Bank provided considerable support to the macroeconomic stabi-lization efforts that were ultimately successful with the exception of pension reforms. Simi-larly, the Bank assisted Colombia in its macroeconomic stabilization efforts with success in helping tax administration, but failing in its support to lessen fiscal rigidities. However, structural reform challenges to achieve stabilization were far more challenging in Turkey than in Colombia and, accordingly, the Bank’s engagement in this area was correspondingly stronger in Turkey. In Tunisia, the Bank successfully helped in the area of trade facilitation and this may have contributed to better economic and employment outcomes.
An important finding in Turkey is that the impact of policies on economic growth was probably larger than the impact on employment growth. In Turkey, where the partial elas-ticity of employment with respect to growth has been estimated at around 0.5,4 macroeco-nomic policies that on balance enhanced growth included reduction of fiscal deficits through both tax and expenditure measures that involved important structural reforms in the financial system, pensions, privatization and agriculture. A most visible manifestation of these policies was the reduction in inflation, which had been shown to have a positive im-pact on economic growth through the “Phillips Curve” mechanism, lower uncertainty, or the real exchange rate.5 Moreover, the structural reforms that were required for stabilization may also have encouraged growth: privatization, through improved investment and TFP; reduced agricultural subsidies through improvements in resource allocation; strengthening of the financial system through improved access to finance; and monetary independence through reduced macroeconomic uncertainty.

132
However, although these policies may well have raised the rate of economic growth, not all need have increased employment growth. Specifically, the reduction in agricultural subsi-dies probably accelerated the rural-urban migration that has reduced labor participation and employment, particularly of women. In Colombia, the impact of policies on economic growth was also probably larger than the impact on employment growth. Indeed, employ-ment growth has been contained by the adverse effect of higher minimum wages and labor taxes.
The experiences in Colombia and Turkey suggest that the Bank can usefully work with the IMF in advising countries on how to ensure fiscal prudence while using available policies and resources judiciously in terms of addressing varying employment challenges. This is likely to mean, on the one hand, relying largely on automatic stabilizers (allowing moderate deficits as revenue growth falters in recession and building treasury reserves during booms) rather than on discretionary changes in aggregate expenditure that have often been biased toward increased public expenditure and that risk remission into fiscal distress. On the oth-er hand, discretion is likely to make more sense in expenditure allocation, with epochs of employment distress deserving more resources into unemployment insurance and CCT programs, and periods of employment booms allowing for more resources to be spent on public investment. The Bank can help in this area through its PERs, which are typically mul-ti-sector tasks. The rationale for the suggestion to avoid expenditure expansions to any sig-nificant degree is illustrated by the experience of Colombia and Turkey, where the first half of the review period was one of recession and deteriorating employment outcomes originat-ing in declining confidence from an unsustainable fiscal stance (further undermined by de-teriorating security in Colombia).
In Turkey, the IMF and Bank provided considerable and mostly successful support to the macroeconomic stabilization efforts. One reason for the success of the Bank’s assistance in supporting Turkey’s macroeconomic stabilization efforts was its readiness to help, includ-ing its preparedness to tackle the different issues and its building of confidence, dialogue, and partnership with the authorities. The Bank has a long-standing history of monitoring and analyzing macroeconomic conditions in Turkey in considerable depth. The substance of the Bank’s AAA work that was particularly relevant for its support during the review pe-riod is reflected in several Bank reports (particularly 1993, 1996, 2000a, and 2003a),. These reports cover fiscal and debt sustainability, privatization, financial sector strengthening, pensions, and agricultural subsidies, and the major issues surrounding macroeconomic sta-bility. They monitored evolving policy, analyzed the key fiscal balance and related struc-tural reform issues, and provided policy recommendations.
With this knowledge, the policy dialogue and the partnership that had continued during the 1990s particularly in the education sector, the Bank was ready to help when the time was right for macroeconomic adjustment. It is only natural that as growth collapsed in the late 1990s and early 2000s, the Turkish government had a strong incentive to reform and to seek the support of the Bank and the IMF in identifying, designing and implementing the re-quired reforms.
Regarding lending support, the Economic Reform Loan (ERL, FY00) contained, apart from its strictly macroeconomic (and financial sector) areas, elements related to privatization, the reduction of agricultural subsidies and deregulation of the energy sector. Subsequent lend-

133
ing for agriculture (the Agricultural Reform Investment Project [ARIP]) provided resources for severance payments in agricultural state–owned enterprises as part of their privatization or closure and the further reduction of agricultural subsidies. An early credit line project (EFIL, FY2000) concentrated on the provision of medium–term credit to exporting firms at a time of tight credit and crisis in 2001. Successor credit line lending operations, also eva-luated positively in ICRs, extended this framework in an attempt to reach SMEs. At the same time, several projects were pursued in the electrical energy sector. In 2007, the first Competitiveness and Employment Development Policy Loan (CEDPL) was approved. In addition to maintaining the macroeconomic policy framework, it supported various meas-ures to improve the investment climate.
In justifying its rating of outcomes from country assistance to Turkey in the area of Macroe-conomic Stability (“moderately satisfactory”), IEG ‘s 1993-04 Country Assistance Evaluation (CAE) assessed the outcomes as follows:
Substantial growth with declining inflation and rising primary surplus af-ter 2001, following years of volatility and three financial crises. Most extra budgetary funds eliminated and fiscal controls streamlined.,,,,, Large SOE losses converted to modest surpluses; agricultural subsidies substantially reduced and made less distorting; and scope for financing of off-budget subsidies by state-owned banks sharply curtailed, all contributing to sus-tainable fiscal improvement.” but,…pension system deficits have risen ra-pidly, offsetting much of this gain….6
But even in the case of pensions, the Turkey CAE attributed to the Bank a positive contribu-tion, indicating its support for measures that “if not enacted would have meant a still larger deficit today”7.
Similarly, the Bank assisted Colombia in its macroeconomic stabilization efforts with success in improving tax administration. However, the structural reform challenges to stabilize the economy were far more challenging in Turkey than in Colombia. Accordingly, the Bank’s engagement in this area was correspondingly stronger.
The Bank was involved in trade primarily through AAA in the three countries. The Bank has, of course, recommended trade opening normally on a neutral basis, but a trade open-ing in the three countries as in most of the world has been on a preferential basis. Increased trade is important for employment as it may have raised the relative demand for skilled la-bor as occurred during the 1980s.8 It may also have accounted for some of the unemploy-ment that occurred as economies restructured.
As the experience with Colombia shows, outcomes will depend on how supportive the polit-ical economy and institutional conditions are. These need to be factored in when assessing the macroeconomic reforms to be supported. In Colombia, the considerable amount of ex-penditure mandates and earmarking of public revenues were institutional conditions that impeded the stronger fiscal adjustment that the Bank was expecting.
In the spirit of the MILES framework, the experience of the three countries suggests that Bank work on employment issues needs be more closely integrated with macroeconomic work and social safety net policies. An important area covers the implications of trade for

134
employment. During the recessions of the turn of the century, the demand for imports de-clined in Colombia but continued increasing in Turkey, as trade liberalization proceeded there. Sluggish world demand for exports was one source of declining growth. Some attribute at least part of the unemployment increases that these economies suffered to trade. Indeed, some of those increases may have responded to lower exports or higher imports.
These economies remained open, letting resource reallocation across sectors work itself out instead of reacting with higher protection. This may indeed be a reasonable approach in that it avoids higher import tariffs and controls that may be difficult to reverse and that hurt consumers. What was (and is) missing at the time was a social safety system that could pro-vide relief to the unemployed. In this regard, the three countries do not yet have satisfactory unemployment insurance systems in place. Indeed, they demonstrated that setting up these systems face considerable financial and design challenges. The current crisis may provide an opportunity for reform in this area aimed at a sharper targeting of social assistance that takes into account the more limited resources that will become available.
Investment Climate. The Bank’s support for macroeconomic and financial sector stabilization was perhaps its most important contribution in improving the investment climate, as it was macroeconomic stabilization that really made the difference for investment and growth. The second area where the World Bank Group has had the greatest impact in improving the investment climate has been with various features of the business legal and regulatory envi-ronment. In Turkey, the FIAS reports and engagement in the early part of the review period were of high quality and had a major impact. The successful engagement on the part of FIAS with the government resulted in a close working collaboration in the drafting and passage of the Foreign Investment Law of 2003. This law eliminated the legal discrimina-tion against foreign-owned firms operating in Turkey. It reduced the top corporate income tax rate from 30 percent to 20 percent, and helped with the establishment of governmental institutions to more effectively pursue private sector investment promotion and to improve the business enabling environment. These regulatory and policy changes, attributed in large part to FIAS initiatives and subsequent engagement, have been partly responsible for the expansion of private sector investment in general and foreign direct investment in particu-lar. The FIAS engagement also resulted in a number of institutional changes including the establishment of a Coordination Council for the Improvement of the Investment Environ-ment (YOIKK), which involves active private and government collaboration on investment climate issues.
In Tunisia, private investment was relatively stable when compared with Colombia and Turkey, where the crises of the turn of the century led to a major decline in the ratio of in-vestment to GDP (Figure N.4 This ratio declined until after the time when the recessions bottomed out in Colombia and Turkey, and then recovered significantly, even surpassing the prior maximum ratio in Colombia. The cyclical behavior of private investment in Co-lombia and Turkey and the relative macroeconomic stability in Tunisia reflect the major role of macroeconomic conditions in determining private decisions to invest, although a deteri-oration of security may also have played an important role in diminishing investment around the turn of the century in Colombia.9 No progress was achieved in raising Tunisia’s low private investment/GDP ratio, possibly due to concerns with public governance. For-eign direct investment behaved more erratically, but displayed a clear upward trend to-wards the end of the review period in the three countries, reflecting both buoyant interna-tional capital markets as well as a strong domestic recovery.

135
Figure N.4 Colombia, Tunisia, and Turkey: Private Investment and Foreign Direct Investment
Sources: Private Investment: Colombia: 1990-96: Rubio M.,Orlando; Ojeda J., Jair and Montes , Enrique, “Deuda Externa, Inversión Y Crecimiento En Colombia, 1970 – 2002”, Banco de la Republica, 2003,. Por: U.1, 3 de Diciembre de 2003, Grafico 2, p.6, 8. 1997-07: IMF Article IV Consultation Reports; Tunisia: 1990-01: Staff estimates from Anos Casero, Paloma and Varoudakis, Aristome, “Private Investment and the Cost of Doing Business in Tunisia”, The World Bank, Middle East and North Africa Working Paper No. 34 , 2004, Figure 10; 2002-2006: Country Assistance Strategy Progress Report FY05-08”, The World Bank, 2005, Table 1, p. 2. ; 2007: The World Bank, “Tunisia’s Global Integration: Second Generation of Reforms to Boost Growth and Em-ployment, Social and Economic Development Sector Unit Middle East and North Africa Region, The World Bank, Draft Report No. 40129-TN, May 2008;, p. 45. Turkey: Turkish Statistical Institute, Statistical Indicators, < http://www.turkstat.gov.tr/Start.do> FDI: The World Bank: World Development Indicators, except Tunisia and Turkey for 2007 (IMF). Note: FDI= foreign direct investment; GDP= gross domestic product.
Stabilization in Colombia and Turkey, improved security in Colombia, and the prospect of EU accession in Turkey helped them to recover in terms of investment performance. Bank support for macroeconomic stability is a key factor of its support for the investment climate. Accordingly, the experience of the three countries suggests that macroeconomic stabiliza-tion is the “low hanging fruit” in accelerating private investment, and was probably more important than simplification of business regulations. It was critical in Colombia and Tur-key in order to redress investment and growth. In addition, prospects of joining the EU may also explain the rise in private investment in Turkey after 2003. The Tunisia case exemplifies how macroeconomic stability, not surprisingly, also helps stabilize investment. The Colom-bia case captures the effect of both stabilization and enhanced security. It confirms that sup-port to adjustment lending in Colombia at the time, despite its failings, had a measure of success in helping the country recover.
Policies in the areas normally covered by investment climate analyses also improved. Suc-cessful reforms supported by the Bank include legislation providing for insurance against changes in most laws and regulations in Colombia, and legislation removing discrimination against foreign investment in Turkey. These improvements may have contributed more to total factor productivity growth than to the investment-to-GDP ratios.
Given the close relationship between investment and growth, it would be worthwhile for the PREM and PSD networks to work more closely together to better integrate macroeco-nomic and microeconomic approaches to growth. Although macroeconomic changes prob-ably explain increases in investment in Colombia and Turkey, improvements in the re-stricted business climate variables (that is, excluding macroeconomic and trade) may have been primarily reflected in increased productivity, rather than captured by aggregate pri-vate investment. Some of the increases in TFP observed in the three countries toward the second half of the review period may be due to better product market regulations. Further-more, the Bank can strengthen its diagnostic work by following IEG recommendations on
Panel A: Colombia, Tunisia and Turkey: Private Investment (Percent of GDP)
0.0
5.0
10.0
15.0
20.0
25.0
1990
1992
1994
1996
1998
2000
2002
2004
2006
Year
Per
cent of G
DP
Colombia - Private InvestmentTunisia - Private InvestmentTurkey - Private Investment
Panel B: Colombia, Tunisia and Turkey: Foreign Direct Investment (Percent of GDP)
0.0
2.0
4.0
6.0
8.0
10.0
12.0
1990
1992
1994
1996
1998
2000
2002
2004
2006
Year
Per
cent of G
DP
Colombia - FDI Tunisia - FDI
Turkey - FDI

136
the Doing Business indicators, particularly with regard to tracing the impact of reforms and using more of the available analyses to choose indicators.
The topics covered by investment climate analyses are captured in the Bank’s Doing Busi-ness surveys.10 Some of these – for example, employing workers – overlap with other MILES categories discussed elsewhere in this report. These variables have been shown to have an impact on productivity.11 Taking all of the conditions together, Turkey (43) ranked above Tunisia (68), and Tunisia above Colombia (91) in the 2008 survey, reflecting condi-tions at the end of the review period. Ranks are not available for earlier years, but a look at the bulk of the individual components of the survey suggests that this order was preserved since the first year of the survey (2003).
Comparing the 2008 with the 2009 survey, the three countries seem to be making some progress in the ease of doing business index, with most progress in Colombia, followed by Tunisia and then Turkey, suggesting a pattern of convergence. In the survey, progress ap-pears in a few categories: (i) starting a business, paying taxes, and trade in Colombia; (ii) starting a business, registering property, getting credit, and trade in Tunisia; and (iii) start-ing a business, getting credit, paying taxes and closing a business in Turkey. A more de-tailed review identifies progress as follows:
Colombia. Progress was evidenced by the reduction in the time and cost of administrative procedures faced by businesses, enactment of legislation that provides for insurance against changes in most laws and regulations; unification of banking supervision; and improvement in the framework for private sector participation in infrastructure. Bank support included AAA on competitiveness and impediments in particular sectors, and three DPLs covering five policy areas (business environment, foreign trade competitiveness, financial system and capital markets, quality standards and technological innovation, and infrastructure and lo-gistics). Chapter 2 concludes that this support addressed most of the critical investment cli-mate issues identified as critical, with the exception of labor informality. Feedback from stakeholders indicated that the Bank’s work was positive, albeit not proactive enough.
Tunisia. Progress was evidenced by a reduction of the gap between the treatments of the onshore and offshore economies, a reduction of unfair competition from the informal sector and discriminatory application of regulation, a strengthening of the soundness of the finan-cial system, and development of the ICT sector. However, private investment (Figure N.4 appears to have been impervious to these changes, a result that may reflect the lack of pre-dictability and transparency of the regulatory framework, limited market contestability, un-due discretion by the government, and weak voice and participation. Bank support included AAA (a private sector assessment, an investment climate assessment, a Financial Sector As-sessment Program (FSAP), a Private Sector in Infrastructure (PPI) strategy paper, and a re-cent report addressing the on-shore and offshore gaps), and three adjustment loans. The feedback from stakeholders indicates that the AAA, more than the loans, has been the criti-cal Bank support that helped with reforms, except in infrastructure, where early govern-ment enthusiasm waned in the face of internal rivalries.
Turkey. Progress was evidenced by the elimination of discrimination against foreign in-vestment, which very likely helps explain, together with macroeconomic stabilization and the prospect of accession to the EU, the amount of net foreign direct investment flowing in-to Turkey increasing from 0.4 percent of GDP in 2003 to 3.6 percent of GDP in 2006. The Bank’s AAA on investment climate issues has involved a number of infrastructure sector

137
analyses and studies (including for electric energy, gas and oil, and water), a series of FIAS reports (starting in FY2000) focusing on the treatment and role of foreign direct investment, the private sector regulatory environment, tax issues for private sector development and in-vestment promotion, and the recently divulged Investment Climate Assessment (2007). The Bank’s advice in connection with the structural reforms underpinning macroeconomic stabi-lization, including the strengthening of the financial sector and privatization of SOEs, had positive effects on the investment climate. Similarly, its advice on product market regula-tions helped Turkey relax some of those regulations.
Labor Regulations and Institutions. The Bank’s analytical work on labor market issues in the three countries has been of high quality. It has provided convincing, evidence-based analysis. It conducted in close collaboration with local researchers and/or stakeholders, and focused on key elements of the domestic policy debate, and identifying reform priorities. The analy-sis also took account of the interaction between policies in different areas ( that is, it often ef-fectively applied, to a varying extent, a broad framework similar to MILES). It addressed the two key components of the gap between the demand price and the supply price for labor that discourage employment: the rigidity of labor contract regulations, which creates a cost expec-tation to businesses, and payroll taxes and contributions. For example, Box N.1 discusses non-wage costs in Colombia and highlights the Bank’s contribution. The Bank’s work on la-bor taxes and contributions has been closely linked to its work on the social services that these contributions finance. The Bank has also paid considerable attention to the impact of mini-mum wages. The case study of Colombia provides an important example of how a rising minimum wage encouraged informal employment as well as disparities between formal and informal sector wages.
Table N.4 Colombia, Tunisia, Turkey, France, and Singapore: Labor Market Rigidity
Country
Average Labor
Flexibility (percent of
Singapore’s)
Percent Change in Labor Flexibility Indicator (+ means more flexible)
World Economic
Forum
1996–2007
Heritage Foundation
2005–08
Doing Business
Report
2003–08
International Institute for
Management Development
1995–2007
Fraser Institute 1995–2006
Colombia 58.5 0.3 1.8 0.1 8.3 14.6
Tunisia 47.0 0.1 -1.9 0.0 n.d. 9.6
Turkey 62.2 -0.3 -4.4 0.0 -41.4 -28.8
France 25.2 -0.1 -16.4 0.0 -44.6 28.0
Singapore 100.0 0.1 -0.1 0.0 -3.2 10.3
Sources: Staff estimates with data from the World Economic Forum, the Heritage Foundation, the World Bank’s Doing Business Report, International Institute for Management Development and the Fraser Institute. Note: It should be underscored that these indicators are measures of flexibility in employment regulations but do not capture other key dimensions of employment policies, such as the worker protection measures also covered by this report. Note: n.d.= no data.
A key feature of this AAA work is that it has been delinked from lending. This is not sur-prising given the sensitivity of labor policy issues. For example, in the one instance of expli-

138
cit lending support for labor reform (Colombia, see Box N.2 ), support was not based on Bank advice, even though Bank AAA had provided contributions of high quality to the un-derstanding of labor market issues. The sensitivity of labor market issues suggests that Bank support should not necessarily be linked to lending, and that AAA may be a preferred mode of assistance.
Independent exercises, such as the study of Tunisia’s integration into the global market and the first employment strategy report, were highly appreciated by the government. Like-wise, the study on Turkey’s Labor Market was also highly appreciated by the government. Indeed, avoiding automatic links with the lending program and its frequently demanding timetables offers greater opportunity for consensus building. The Bank’s AAA work, to the extent that is expands knowledge, is likely to have an impact on policy when the time is right. Such was the case of the AAA that the Bank did on labor market issues before the 2008 labor reform initiative that Turkey implemented.
Government receptivity towards Bank work on labor issues varied across the three coun-tries, with less receptivity in Tunisia than in Colombia or Turkey. A number of the intervie-wees in Colombia actually suggested that the Bank should be less timid in advancing its views on some critical, but politically sensitive, issues (especially high payroll costs). In par-ticular, many (although not all) thought that the Bank should use its ‘convening’ power more proactively to influence the policy debate on these critical issues.

139
Bank work on labor regulations and institutions in the three countries has addressed the two key components of the wedge between the demand price and the supply for labor, namely, the rigidity of labor contract regulations which creates a cost expectation to busi-nesses and payroll taxes and contributions. The Bank’s work on contributions has been closely linked to its work on the social services financed by these contributions. In addition, the work on payroll or income taxes that help finance the general budget has been ad-dressed more in the context of fiscal and tax policy.
Box N.1 High Non-Wage Costs in Colombia: Causes and Consequences
Colombia has among the highest levels of non-wage costs in Latin America. They include pay-roll tax contributions used to finance health insurance (including transfers to the subsidized, non-contributory regime), pensions, and severance funds. In addition, three sets of taxes (para-fiscales) fund the operations of special organizations at a cost of 8 percent of payrolls: training (SENA), child and family welfare services, and workers clubs (Cajas de Compensacion Familiar, CCF). Total non-wage costs averaged about 55 percent of the wage bill, compared with 35 per-cent in the mid-1980s. Most of this increase occurred as a result of higher payroll charges intro-duced in 1993 (Law 100) as part of a reform of the systems of social security for health and pensions. The reform introduced contributory and subsidized regimes for health insurance.
Payroll taxes should not affect employment if they are passed on completely to workers as lower wages. This is more likely to occur if the workers’ valuation of the services financed by the taxes coincide with their cost (and if minimum wages are not binding). In practice, however, empirical evidence from Latin America and elsewhere indicates that high rates of payroll taxation discou-rage formal sector employment and contribute to higher levels of informality by influencing both labor demand and supply (see, for example, Perry et. al., 2007). Evidence for Colombia supports similar conclusions:
Kugler and Kugler (2003) estimate that the increase in payroll charges of about 10 percen-tage points in the early 1990s dampened demand for formal sector workers and led to a de-cline in formal employment of about 4-5 percent during the period. Only about one–fifth of the higher taxes were shifted to workers as lower wages, likely reflecting the weak linkages between the taxes and benefits and the presence of downward wage rigidities (most notably the minimum wage).
Bernal and Cardenas (2004) estimate a relatively high cost of elasticity of labor demand and conclude that non-wage costs were responsible for much of the rise in unemployment in the 1990s.
Studies undertaken for the World Bank (2005a) and a report on labor adjustment in Colom-bia estimated the impact of the higher non-wage charges on labor demand and on participa-tion rates. The analysis found that the net effect was to raise unemployment by between 1 and 1.8 percentage points, depending on the estimates of the elasticity of labor demand. The study also finds that shifts in the relative sizes of formal/informal employment are co-integrated with non-wage costs, confirming the major role that these costs have played in the segmentation of Colombia’s labor markets.

140
Box N.2 The 2002 Labor Reform and Evidence on its Effects
Colombia has historically had strict regulations regarding the work week, overtime wages, sever-ance payments, and job security. Such regulations may act as a disincentive to job creation in the formal sector. The 2002 labor reform (Law 789 of 2002) introduced a series of measures designed to encourage formal sector employment by creating greater flexibility in labor contracts and bringing down firing costs. It also introduced incentives for employment of vulnerable groups and initiated an unemployment insurance scheme. Key measures included:
1. Increased flexibility of labor contracts. Restrictions on the length of the work day and work week were relaxed, making it easier to hire for peak periods and to use multiple shifts. Man-datory overtime charges for nighttime, Sunday, and holiday work were slightly reduced. Se-verance payments for unilateral dismissal were lowered. Apprenticeship contracts were made much more flexible, allowing easier dismissal and remuneration below minimum wage dur-ing the training phases.
2. Incentives for employment of disadvantaged groups. Firms employing groups ( for exam-ple, poor heads of households, workers between the ages of 16 and 25 or over 50 years of age, and ex-guerillas) were exempt from parafiscales payroll charges.
3. An unemployment insurance scheme was introduced, financed by a redirection of 1 percen-tage point of the parafiscales charges managed by the CCFs (see Box 3.1). A small proportion of the resources were to go to the unemployed without a previous contribution record (that is, in-formal workers).
Research in Colombia, including background studies conducted for World Bank (2005a), mostly agree that it had a moderately positive impact on employment generation, especially for the young. It reduced underemployment informality, although it is hard to disentangle the impact from other factors such as the security situation.
Using estimates of employment elasticity with respect to quarterly GDP growth before and af-ter the reforms, Lopez et al (2004) conclude that employment was 3.4 percent higher in 2004 (a net increase of 260,000 jobs) because of the reforms, with a shift from informal to formal em-ployment.
Nunez (2004) estimates the impact of the increased flexibility of labor contracts by comparing movements between unemployment and employment in the formal sector (where flexibility was improved by the law) with similar movement in and out of the informal sector. He con-cludes that increased flows out of unemployment into the formal sector did reduce the dura-tion of unemployment spells, with the biggest effect on younger and less-qualified workers.
In a survey of firms conducted by the Ministry of Social Protection, among the 27 percent of firms that increased employment in 2003, only 4.5 percent cited the labor reform as a determi-nant (World Bank, 2005). More flexible regulations for work schedules and reduced overtime charges were most frequently cited as positively influencing firms’ job-creation decisions.
Gaviria (2004) compares employment trends in the commercial and service sectors with those in manufacturing (assumed to be unaffected by the labor reforms). Finding little difference in employment growth across the sectors, he concludes the reforms had little impact. However, the use of manufacturing as a control group may not be justified, since it could also have been affected by the reforms.

141
Less rigid regulations and lower taxes and contributions are of course expected to encourage employment, particularly in the formal sector, although the size of the effect is rather uncer-tain. However, lower contributions may also create further imbalances in the financing of so-cial protection arrangements that are often too generous in terms of the resources available, and that need to be covered by the general budget. It is often thought that to the extent that they are covered by the general budget, their effect on the labor market would be less.
Recent Bank work in Turkey estimated a modest elasticity of employment to taxes, albeit high by international standards. The effect was larger for low– than for high–income levels and for conditions of relatively higher unemployment.12 Several studies for Colombia also point to non-negligible impacts of non-wage costs on employment and the unemployment rate.
However, moving towards less rigid regulations or lower contributions is rarely an objec-tive that countries pursue on any sustained basis. The idea of making contracts more flexible is controversial and politically sensitive. Further, reducing taxes faces either fiscal con-straints or reductions in government services that are not easy to reach consensus upon. Available data (Table N.4 suggests that regulations may have become more rigid in Tur-key and changed little in Colombia and Tunisia, although measuring rigidity of labor mar-kets is not easy and available indices are sometimes contradictory.13 Most countries have tended to increase labor taxes, and Turkey and Colombia have been no exceptions.14 In Co-lombia, the Bank reported that the tax wedge Colombia increased from 47 percent of the payroll in the 1980s to 60 percent in 2004, particularly through reforms in 1993 and 2002. There was a net decline during the review period, as the 2002 reform added 1 point to cover unemployment insurance and 2 points for pensions but reduced by severance payments on unjust dismissals by about seven points.15 For Turkey, the OECD reports an increase of about 2.6 percent of wages, from 40.4 percent to 42.8 percent, between 2000 and 2004.16 Tu-nisia had no changes in labor taxation, reported at 28 percent by the Bank,17 during the re-view period. The 2009 Doing Business Report estimates of labor taxation, which are compa-rable across countries (albeit different from those cited above) indicate that Colombia’s labor taxation (33.4 percent) is considerable higher than Tunisia’s (24.6 percent) or Turkey’s (24.5 percent).
The Bank can help improve labor market performance by continuing and extending AAA on labor markets as the main mode of support. This will take advantage of the Bank’s ca-pacity for labor market analysis, and lower the risks of undermining reform that often come with the difficult political economy of labor reform. In particular, the Bank can help improve and extend (perhaps in partnership with the OECD and the Bank’s Doing Business report) estimates and cross-country comparisons of labor rigidities and labor taxes. It can also fur-ther the understanding of low female participation and employment rate in countries such as Tunisia and Turkey. The dialogue, dissemination, and advice part of AAA, although dif-ficult, can make this instrument more effective— although there are always risks such as the weakened dialogue on the matter in Tunisia.
Measuring rigidity of labor markets is not easy and available indices are sometimes contra-dictory.18 There are today a number of indicators (Table N.4 that provide a better idea of

142
cross-country comparisons and time dynamics, one of which is the “Rigidity of Employ-ment Index” calculated for the Bank’s Doing Business Report. When compared with other countries, labor rigidities in Colombia, Tunisia and Turkey are well within the range de-fined by France (most rigid) and Singapore (least rigid), with Tunisia’s degree of rigidity higher than Colombia’s and Turkey’s, which are similar. The World Economic Forum sur-veys confirm this ranking to some extent, in that the share of businesses that regard labor regulations as most problematic is higher in Tunisia (13.9 percent) than in Colombia (8.4 percent). However, it is also much lower in Turkey (2.4 percent), suggesting that the rigidity “in the books” in Turkey may overstate the rigidity in practice more than in Colombia.
The increased rigidity indicated for Turkey for the review period is even more worrying given that, already in the late 1990s, Turkey had one of the most rigid labor legislations in the world. Relaxing regulatory rigidities would help reduce unemployment in Tunisia, al-though it would not resolve the skill mismatch that also contributes to it.19
Current conditions of rising unemployment provide the Bank with an opportunity to en-gage with governments on labor reform, as has occurred in Colombia and Turkey. Unem-ployment conditions provide an opportunity for reform that improve flexibility and reduce labor costs. Not only is the potential employment effect larger under these conditions than under conditions of boom, the potential would appear to be especially strong for the poor, as suggested by the more recent work on employment elasticities. Furthermore, the political economy for such reforms is also supportive, as the experience of Colombia suggests. Final-ly, given appropriate constraints imposed by fiscal balance, labor tax reductions would ap-pear to be a sensible countercyclical policy. Accordingly, the current financial crisis is a good time to make labor contracts more flexible and to reduce the non-wage component of labor costs. The Bank is in a good position to provide advisory support to these efforts.
Education. Education is of course expected to have a positive impact on participation and earnings, particularly by women. In the short run, increased education coverage may re-duce participation and earnings as more youth leave the labor market to get schooling. In the long run, increased coverage increases participation and earnings as the educated get access to better employment options.
Key standard aims of education policies in most if not all countries have been to increase coverage, technical quality, and adaptability to the labor market. This has been the case as well in the three countries reviewed. To achieve these aims, and in addition to higher ex-penditures, policies in Colombia combined decentralization of expenditures, programs to target hard-to-reach populations, changes in curricula aimed at improving below-average quality of education, and expansion of non-formal training in an effort to improve the relev-ance of courses. Policies in Tunisia aimed at increasing coverage and reducing gender gaps. In Turkey, the key policy was to expanded coverage by extending mandatory schooling from five to eight years. Progress is summarized as follows (Table N.5
Based on increases in average years of schooling for the population 15 years and older, progress during the last decade has been fastest in Tunisia, followed by Tur-key.

143
Net enrollment in primary education did not change in Colombia during the evalua-tion period. It declined in Tunisia and more so in Turkey. Indeed, net enrollment had increased considerably in Colombia and Tunisia during the previous decade.
Net enrollment in secondary education increased most in Turkey followed by Co-lombia.
Gross enrollment in tertiary education increased most in Turkey, followed by Tuni-sia.
Average years of education continued increasing during the decade under review, at a rate of about 0.1 percent per year in Colombia and Tunisia and 0.04 percent per year in Turkey. During the previous decade, years of education had increased faster in Turkey, at about the same rate in Tunisia, and more slowly in Colombia;
Expected years of schooling today are somewhat higher in Tunisia, followed by Tur-key.
Improvements in test scores between the years 2003-06 suggest an increase in the quality of education during the period covered.
However, the increase in the percentage of businesses that view the workforce as in-adequately educated— particularly large in Turkey— suggests that increases in quality through education and training are not keeping pace with the changes in market requirements.
Table N.5 Colombia, Tunisia, and Turkey: Education Outcomes
Year Closest to 1985 Closest to 1997 Closest to 2007
Colombia
Net Enrollment – Primary: T,M,F (year) a/ 65, n.d., n.d., (1985) 87, 87, 88 (1997) 87, 87, 87 (2007)
Net Enrollment -- Secondary: T,M,F (year) 34, n.d., n.d., (1991) 54, 50, 57 (1997) 67, 74 ,61 (2007)
Gross Enrollment – Tertiary : T,M,F (year) 14,14,14 (1991) 22,22,22 (1998) 31,30,32 (2006)
Average Years of Schooling T,M,F (year) 4.6 (1985) 5.0 (1995) 5.6 (2007)
Expected Schooling T,M,F (year) 11,11,11 (1998) 12,12,13 (2006)
PISA Test Score - Math: T,M,F (year) 370, 382, 370 (2006)
PISA Test Score - Reading: T,M,F (year) 385, 375, 394 (2006)
PISA Test Score - Science: T,M,F (year) 388, 393, 384 (2006)
Skills Mismatch 2.1 (2003) 2.4 (2007)
Tunisia
Net Enrollment – Primary: T,M,F (year) 93,99,87 (1985) 98,100,97 (1997) 96,96,97 (2006)
Net Enrollment - Secondary : T,M,F (year) 23,28,17 (1980) 54,54,54 (1997) 64,61,68 (2003)
Gross Enrollment – Tertiary : T,M,F (year) 9,10,7 (1991) 17,17,17 (1999) 31,26,37 (2006)
Average Years of Schooling T,M,F (year) 3.3 (1985) 4.5 (1995) 5.0 (2000)
Expected Schooling T,M,F (year) 13,13,13 (1998) 14,13,14 (2006)
PISA Test Score – Math: T,M,F (year) 359, 365, 353 (2003) 365, 373, 358 (2006)
PISA Test Score - Reading: T,M,F (year) 375, 363, 387 (2003) 380, 361, 398 (2006)
PISA Test Score - Science: T,M,F (year) 385, 380, 390 (2003) 386, 383, 388 (2006)
Skills Mismatch 5.7 (2003) 7.5 (2006)
Turkey
Net Enrollment – Primary: T,M,F (year) 98, n.d., n.d., (1985) 97,100, 94, (1996) 91,93,89 (2006)
Net Enrollment - Secondary : T,M,F (year)
36,n.d.,n.d., (1985) 51,59,43 (1996) 69,74,64 (2006)
Gross Enrollment – Tertiary : T,M,F (year) 13,16,9 (1991) 21,25,17 (1998) 35,39,30 (2006)
Average Years of Schooling T,M,F (year) 3.7 (1985) 5.1 (1995) 5.3 (2000)
Expected Schooling T,M,F (year) 13,13,13 (1998) 13,13,13 (2006)

144
PISA Test Score - Math: T,M,F (year) 423, 430, 415 (2003) 424, 427, 421 (2006)
PISA Test Score - Reading: T,M,F (year) 441, 431, 460 (2003) 447, 427, 471 (2006)
PISA Test Score - Science: T,M,F (year) 434, 438, 434 (2003) 424, 418, 430 (2006)
Skills Mismatch 1.1 (2003) 5.5 (2006) Sources: 1/ Net Enrollment : The World Bank, Education Statistics Average years of Schooling: Barro-Lee Data Set <http://www.cid.harvard.edu/ciddata/ciddata.html>; 2007 for Colombia: estimate based on National Planning Department Data. Expected Schooling: The World Bank, World development Indicators. PISA Test Scores: The World Bank, Education Statistics. Skills Mismatch: World Economic Forum, Global Competitiveness Indicators, 2003-04 and 2007-08: Percent of business responses indicating “inadequately educated workforce” as a problematic factor for doing business. Note :n.d.= no data ; PISA= program for International Student Assessment ; T,M,F: Total, Males, Females.
The Bank supported policies and expenditures to achieve the progress reflected in the re-sults outlined above. Of Bank support in the three countries, support in Colombia, which in-cluded both AAA and project lending, was appreciated the most. This support helped im-prove quality, delivery of educational services in poor, hard-to-reach rural communities, develop a student loan scheme for formal higher education, set up information systems within the Ministry of Education, and improve the effectiveness of non-formal training. Nevertheless, from an evaluation perspective, some of these projects were not entirely satis-factory either because they did not fully meet the objectives they set out to accomplish or because the objectives were not clearly articulated.
The Bank’s support in Turkey during the review period aimed at improving vocational training, helping Turkey to meet the OECD’s educational standards, and expand its cover-age and quality of basic education. IEG ICR reviews rated these projects less than fully satis-factory in varying degrees in that they did not entirely meet the objectives set forth, where the objectives were not clearly articulated, or where implementation, particularly of pro-curement, was difficult. AAA contributions have been of good quality and highlighted im-portant policy issues directed at improving education of the poor. Among the three coun-tries reviewed in this report, however, the education sector in Turkey has proved the most difficult sector for the Bank’s work. Indeed, the Bank’s impact has probably been more li-mited.
The Bank’s support to Tunisia during the review period has focused on training to improve the fit of the labor force to labor opportunities, restructuring of higher education to improve its responsiveness to the country’s needs, the need for coverage in anticipation of expected increases in enrollment, and quality issues to address the concern that large numbers of stu-dents fail to master basic skills. The projects have been rated satisfactory. However, the per-ceptions of stakeholders are that the Bank’s support of higher education has not been suffi-ciently far-reaching, particularly in addressing issues of quality. As noted in Chapter 3, exceptionally high unemployment of university graduates must be at least in part be attri-butable to the poor quality and/or fit of university education to labor market needs. In the higher education sub-sector in Tunisia, the Bank’s credibility has been damaged in the eyes of some observers because it has supported a rapid and quality–compromising expansion in physical university facilities without first insisting on critical policy changes to increase uni-versity autonomy and accountability.
IEGrecommends that the Bank continue focusing on advice and projects to improve cover-age and quality. In looking at quality, perhaps more emphasis might be assigned to address-

145
ing skills mismatches, which are possibly behind much of the structural unemployment ob-served in these countries. Mismatches of skills between supply and demand are thought to be an important source of structural unemployment, triggered for example by sector re-structuring in Turkey and poor technical quality and inadequate skills in Tunisia.
Structural unemployment is an area where little or no progress was made in any of the three countries. The data presented indicate that skill mismatches may be increasing. In this con-text, the Bank’s education network could work more closely with the PSD network. The Bank could also usefully continue its pursuit of gender equality in education as the main lever that it has in supporting progress toward gender balance in labor participation.
Bank advice regarding education will continue to be an important priority as an instrument of policy advice and advocacy of good practice. Accordingly, it also will be a critical com-ponent of its employment support. The role of education policies on employment outcomes is widely acknowledged. At the very least, it is unlikely that the increased education cover-age would have been the same without the allocation of public expenditures to education that is made possible by economic growth. However, improvements in technical quality re-main an elusive objective that is difficult to evaluate due to the paucity of test scores that are comparable through time and the lack of data to assess the impact of increased coverage on average quality. Moreover, education is a challenging sector where satisfaction with out-comes for all stakeholders is difficult to achieve.
The three countries reviewed suggest better success in AAA than in project work. The Bank appears to do a good job in its AAA, despite the controversial nature of some of the issues in education management. However, governments often have difficulties or constraints in adopting some of the Bank’s recommendations (for example, reallocating expenditures to teaching materials, cost recovery in tertiary education, and testing).
Closer and more integrated work between the Bank’s PREM, PSD and Human Develop-ment networks would be advisable, as Bank support for growth is an ingredient in achiev-ing good education outcomes. Progress in education outcomes in the three countries must be attributed in part to the economic growth that raised earnings, the demand for education, and the resources to finance education services. At the same time, improved education out-comes support output, if only through the role of human capital in the production function, and worker earnings. This simultaneity calls for strategies that account for the interactions between the two objectives, specifically for strategies that are cost-effective in financing education.
Social Protection. Social protection policies may have an impact on employment when they achieve worker protection that can substitute for job protection— thereby facilitating labor flexibility and mobility. Indeed, there is some evidence of this trade–off in international comparisons,20 albeit separating countries in the Anglo-American tradition, where social protection “buys” more labor flexibility, from those in the European tradition. The key so-cial protection instrument to substitute for job protection is unemployment insurance. However, old age and health insurance, and cash transfer systems will also be relevant. There was little movement in this direction during the review period. In Turkey, job protec-tion was strengthened and an unemployment insurance system was introduced in August 1999 (and started paying benefits in 2002), as well as a CCT arrangement, together with

146
pension reform. In Tunisia, there was no change in either. Colombia provides the richer ex-perience as some relaxation of worker protection and a strengthening of a conditional cash transfer system took place.
Bank support in the three countries addressed different issues. In Turkey, which has a three tier social insurance system comprised of pension, health and unemployment insurance (in-cluding both formal unemployment insurance and mandatory severance payments), the Bank recommended measures to: (i) improve the financial viability of the pension system; (ii) develop a system that finances and purchases a basic health package from a pluralistic provider market; iii) eliminate mandatory severance in view of the presence of unemploy-ment insurance; and iv) introduce unemployment benefit rates that decline with unem-ployment duration to encourage job search.21 In Colombia, the Bank played a strong role, together with the IADB, as a catalyst of the conditional cash transfer program. In Tunisia, the Bank recommended introduction of employment insurance with a view to encouraging greater labor mobility.
Strategies for dealing with the long-term fiscal costs of expanding social protection net-works need to be built into the program design from the outset. The Bank (and IADB) helped to improve the design and finance the implementation of the main conditional cash transfer program, Familias en Accion, which has had a positive impact on a range of social outcomes. However, the program is growing rapidly, well beyond its original role as a tem-porary response to alleviate the social consequences of the 1999 crisis. The Bank could per-haps have given more attention earlier to the longer-term fiscal implications of the program, including how it would be financed when external financing was no longer available.
The difficult problems of extending social protection have led to establishing partial and imperfect systems that are unlikely to fit the bill from the perspective of delinking worker protection from job protection. The Bank needs to continue working on implementing worker protection instead of job protection. This has not been easy, as the Colombian and Turkish expe-riences demonstrate. The key constraints— affordability and a correct incentive structure— need to compatible. Efforts in this area should also factor in the informal sector, as an affordable and efficient unemployment insurance system may help encourage formality.
Reducing the labor participation of children is an objective that needs joint Bank work by education and social protection staff. Children are often taken out of school when families are subject to economic shocks. In Colombia, there is a clear drop in enrollment rates, ex-cept for the preschool level. In the rather limited literature on the subject, recession leads to a drop in school attendance.22 Moreover, it has been shown that conditional cash transfers can ameliorate this impact.23 The Bank has considerable experience in cash transfer pro-grams and, in the present financial crisis, can help governments reduce the impact of the shock on school attendance.
The Current World Employment Crisis As world GDP growth declined sharply as a result of the solvency and credit crises in world financial markets during 2008-09, unemployment rates increased and employment and earnings growth declined. In its 2009 Global Employment Trends Report, the ILO estimated

147
that world unemployment would increase from 5.7 percent in 2007 and 6.0 percent in 2008, and to within 6.1 percent and 7.1 percent by the end of 2009.24 Using the ILO “Scenario 2” projection, where the “negative impact on unemployment is taken in each country at the time of the largest year-on-year drop in GDP,“ and the IMF November 2008 GDP growth projections (2.2 percent in 2009), the unemployment rate would have reached 6.5 percent by the end of 2009, resulting in an increase of 31 million unemployed compared to 2007. In-creases in world unemployment may have been even higher (to 6.8 percent) under the most recent (October 2009) IMF growth projections for 2009 of minus 1.1 percent.25
The largest increases in the unemployment rate are probably occurring in developed econ-omies, Central and South Eastern Europe (non-EU) and the Commonwealth of Independent States (CIS), and Latin America and the Caribbean. The employment-to-population ratio, which had been recovering since 2004, already declined by 0.2 percentage points in 2008 and possibly declined further in 2009. With declining output growth, earnings growth is pro-jected to raise $2-a-day poverty rates by up to 5 percentage points between 2007 and 2009.26 All of these projections are of course quite fluid and likely to change significantly. Although world GDP growth started to recover, with an IMF October 2009 projection of 3.1 for 2010, unemployment effects are likely to linger. The major economies responded to the crisis pri-marily by increasing public expenditure (bailouts, and spending on infrastructure, educa-tion, health) and lowering interest rates, with the expectation that these measures will re-kindle growth in late 2009 or 2010. The United States is also raising its low unemployment benefits. Many European countries are subsidizing part-time employment, with the UK, for example, subsidizing hiring and training. Middle-income economies are reacting in various ways. Performance and policy response in the three economies covered by this report pro-vide a sample of the challenges being faced:
In Colombia, the Government (Central Bank/DNP) estimates that growth declined to 2.5 percent in 2008 and was 0.0 percent in 2009, down from 6.9 percent and 7.5 percent respectively in 2006 and 2007. Average annual (past 12 months) urban un-employment increased steadily from 10.4 percent in May 2008 to 11.6 percent in July 2009. Colombia’s response to the crisis includes countercyclical fiscal policies with some tax reduction, and expenditures on infrastructure and business subsidies, in-creased access to international financing, expanded business finance, training and employment services, and conditional cash transfers. The Bank is supporting the CCT program, as well as the private sector efficiency and competitiveness programs.
In Tunisia, the unemployment rate had remained stable at just over 14% in 2008. As in Colombia and Turkey, both fiscal and monetary policies are expansionary at this point. Macroeconomic/investment climate policies are designed in part to combat the possible adverse impact of recession in Europe and target enhancements in glob-al integration, business climate, and financial sector. The Bank is supporting these policies.
In Turkey, growth is estimated to decline to 0.9 percent in 2008, and a further 8.0 percent in 2009, from 6.9 percent and 4.7 percent respectively in 2006 and 2007. Un-employment increased from 9.9 percent in 2007 to 10.7 percent in 2008— and may increase further to 13.4 percent in September 2009 as a result of declining growth. The Bank is supporting programs in education, competitiveness and employment and finance.

148
The suggested areas of attention developed above can apply to world employment crises such as the current one by: a) addressing unemployment and earnings during a recession; b) developing and supporting countries efforts to produce updated information on em-ployment–related variables; c) reviewing country programs along MILES or similar lines to assess how they can better target support for employment and earnings growth; d) putting employment issues on governments’ radar screens, and stepping up pro-activity to engage governments on employment issues; e) working with the IMF to help countries balance ma-croeconomic stability with countercyclical needs; f) helping countries with further im-provements to the investment climate, and avoiding short-term policies that may under-mine it as economies recover; g) deepening work on labor regulations and the impact of more flexibility; h) intensifying work on improving technical quality and reducing skills mismatches; and i) doing more to improve CCTs unemployment insurance and pensions.
These findings suggest a number of implications for Bank support during the current global unemployment crisis as follows:
Deploy the Bank’s integrative capability to provide support in the different areas affecting employ-ment outcomes. As exogenous shocks to output in developing countries raise unemployment, the Bank can contribute considerably by developing policy options in relevant areas bear-ing on employment outcomes. In a recession, slow employment growth, cyclical unem-ployment and declining earnings or declining earnings growth become the major issues. The Bank has a useful integrative framework to help countries address these issues with a good balance between countercyclical policies and fiscal prudence; measures to speed up im-provements in the business climate; measures to encourage employers to hire; training ar-rangements for those unemployed to speed rehiring; and safety nets. These are unlikely to apply uniformly. Presumably, the macroeconomic policy component will be more critical in a country like Turkey than in one such as Tunisia.
Focus on the classical, cyclical, and structural sources of unemployment. As economies restructure in the face of recession, much of the new cyclical unemployment is likely to become struc-tural. This strengthens the case for more Bank effort into designing policies to reduce skills mismatches (including through retraining). Also, the Bank needs to engage more proactive-ly on minimum wage issues and their interaction with non-wage costs, which in the three countries reviewed may have caused unemployment and informality. These effects are like-ly to deepen during recession.
Update/improve employment and earnings data. The Bank can work with other partners, includ-ing the ILO, the OECD, the IMF and the regional Multilateral Development Banks on a con-certed basis to help countries speed the delivery and improve the quality of employment and employment–related data (for example, earnings, taxation of wages, minimum wages and others).
Adjust programs to emphasize support with strong employment earnings effects. It is recommend-ed that country directors engage with authorities to discuss adjustments to Bank programs to increase their impact on employment outcomes. Presumably many governments have made adjustments to their policies in reaction to the financial crisis. The Bank can follow suit by emphasizing those areas it can support that best address constraints to employment creation and earnings growth. One obvious adjustment is to emphasize more AAA to diag-

149
nose constraints to employment in many of the countries (as the program in Turkey is doing at present).
Advise countries on affordable fiscal stimuli. It is recommended that the Bank work together with the IMF to advise countries on the appropriate amounts of fiscal stimuli that can be af-forded by affected countries, as well as on policy options to reallocate expenditures to pro-grams addressing the needs of the unemployed.
Support the development of unemployment insurance mechanisms. Bank work on unemployment insurance will be critical in addressing the current wave of unemployment. The three coun-try experiences attest to the difficulty of creating effective social protection systems in de-veloping countries. However, the Bank can assist in defining the focus, targeting, and in-centives that make unemployment insurance affordable and effective. Unemployment insurance, the most relevant form of social insurance to help delink worker protection from jobs, is a daunting challenge in the three countries. The sheer size of the target population that would need to be insured (10 percent to 15 percent of open unemployment rates) and of the informal sector, and the limited financial capacity to cover insurance benefits explains why none of the three countries have set up effective systems. For example, coverage in Turkey is about 4 percent, far lower than the 25-75 percent found in OECD countries. Other social insurance tiers (pensions, health, cash transfers) face similar difficulties. Bank advice has focused on affordability, an incentive-compatible structure of benefits, and a low burden on the payroll tax wedge. Clearly, however, a comprehensive approach will need to also address the roots of the challenge, namely unemployment and informality.
Develop strategies to advance job flexibility and worker protection. Developing job flexibility to-day will help employment and earnings growth, particularly as economies recover. Streng-thening worker protection will help the unemployed, particularly as unemployment rates increase.


151
Appendix O. Colombia, Tunisia, and Turkey: External Assistance
Total Net Receipts (ODA*, OOF**, and Private), 2001–2007 In US$ million
2001 2002 2003 2004 2005 2006 2007
COLOMBIA
Total Net Receipts 595.4 -2,390.0 1,961.7 1,370.3 990.4 6,345.5 7,309.0
o/w ODA 380.1 439.7 801.1 518.4 624.6 987.4 730.8
o/w OOF 627.4 -226.2 1,927.8 -37.3 -866.1 1,248.4 935.0
o/w Private -412.1 -2,603.5 -767.2 889.2 1,231.9 4,109.7 5,643.2
ODA+OOF, total 1,007.5 213.5 2,728.9 481.1 -241.5 2,235.8 1,665.8
o/w Multilateral 792.5 -144.5 2,054.1 148.3 -694.7 1,414.2 1,085.5
o/w IBRD (Net) 136.3 248.8 775.5 199.6 486.9 621.5 132.4
TUNISIA
Total Net Receipts 1,019.0 612.7 563.0 871.8 514.3 34.2 1,435.9
o/w ODA 376.9 264.7 297.7 327.3 364.5 431.9 310.1
o/w OOF 313.8 167.3 120.8 174.5 -73.5 -328.5 228.6
o/w Private 328.2 180.7 144.5 370.0 223.3 -69.3 897.2
ODA+OOF, total 690.8 432.0 418.5 501.8 291.0 103.5 538.7
o/w Multilateral 378.8 320.9 255.0 282.1 138.4 -139.3 472.9
o/w IBRD (Net) 146.9 -36.9 45.8 -88.7 -54.9 -254.8 -8.0
TURKEY
Total Net Receipts 1,385.4 -1,191.9 2,818.7 3,545.2 11,617.2 17,354.2 28,197.4
o/w ODA 168.7 410.3 164.7 285.7 398.7 569.5 797.2
o/w OOF 1,104.6 886.6 359.1 1,853.1 -407.1 1,844.2 3,324.3
o/w Private 112.1 -2,488.8 2,294.8 1,406.5 11,625.7 14,940.4 24,075.9
ODA+OOF, total 1,273.3 1,296.9 523.9 2,138.7 -8.4 2,413.8 4,121.5
o/w Multilateral 1,401.6 1,007.0 350.2 2,007.7 329.7 2,394.5 3,930.1
o/w IBRD (Net) 1,105.7 594.3 -220.2 919.0 -294.0 989.1 557.1
Sources: OECD DAC online database, and Client Connection, retrieved January 27, 2009. *ODA - Official Development Assistance: Grants or loans to countries and territories on Part 1 of the DAC list of Aid Recipients (developing countries) that are: 1) Undertaken by the Official Sector; 2) Have promotion of economic development and welfare as their main objective; and 3) Are granted at concessional terms (the loan has a grant element of at least 25 percent). *OOF - Other Official Flows: Transactions by the official sector with countries on the List of Aid Recipients that do not meet the conditions of ODA or Official Aid eligibility, either because they are not primarily aimed at development, or because they have a grant element of less than 25 percent. Note: IBRD= International Bank for Reconstruction and Development.

152
Appendix P. Colombia, Tunisia, and Turkey: At a Glance Tables
Turkey at a glance 9/24/08
Europe & Upper-POVERTY and SOCIAL Central middle-
Turkey Asia income2007Population, mid-year (millions) 73.9 445 823GNI per capita (Atlas method, US$) 8,020 6,052 6,987GNI (Atlas method, US$ billions) 592.9 2,694 5,750
Average annual growth, 2001-07
Population (%) 1.3 0.0 0.7Labor force (%) 2.5 0.5 1.3
Most recent estimate (latest year available, 2001-07)
Poverty (% of population below national poverty line) 27 .. ..Urban population (% of total population) 68 64 75Life expectancy at birth (years) 71 69 71Infant mortality (per 1,000 live births) 24 23 22Child malnutrition (% of children under 5) 4 .. ..Access to an improved water source (% of population) 97 95 95Literacy (% of population age 15+) 87 97 93Gross primary enrollment (% of school-age population) 94 97 111 Male 96 98 112 Female 92 96 109
KEY ECONOMIC RATIOS and LONG-TERM TRENDS
1987 1997 2006 2007
GDP (US$ billions) 122.3 267.0 529.9 657.1
Gross capital formation/GDP .. .. 22.1 22.2Exports of goods and services/GDP .. .. 22.7 21.9Gross domestic savings/GDP .. .. 17.1 17.1Gross national savings/GDP .. .. 16.2 16.3
Current account balance/GDP -0.7 -1.0 -6.2 -4.9Interest payments/GDP 1.6 1.4 1.4 ..Total debt/GDP 33.5 31.8 39.2 ..Total debt service/exports 41.2 22.4 33.5 ..Present value of debt/GDP .. .. 40.8 ..Present value of debt/exports .. .. 178.6 ..
1987-97 1997-07 2006 2007 2007-11(average annual growth)GDP 4.1 4.2 6.9 4.5 ..GDP per capita 2.1 2.7 5.6 3.2 ..Exports of goods and services .. 7.0 6.6 6.7 ..
STRUCTURE of the ECONOMY1987 1997 2006 2007
(% of GDP)Agriculture .. .. 9.5 8.9Industry .. .. 28.7 28.3 Manufacturing .. .. 19.8 19.0Services .. .. 61.8 62.8
Household final consumption expenditure .. .. 70.5 70.7General gov't final consumption expenditure .. .. 12.3 12.2Imports of goods and services .. .. 27.6 27.0
1987-97 1997-07 2006 2007(average annual growth)Agriculture .. 1.3 1.4 -6.8Industry .. 4.9 10.2 5.4 Manufacturing .. 4.8 8.4 5.4Services .. 5.2 6.0 5.9
Household final consumption expenditure .. 5.1 4.6 4.6General gov't final consumption expenditure .. 3.2 8.4 2.8Gross capital formation .. 7.3 13.3 10.1Imports of goods and services .. 9.9 6.9 11.1
Note: 2007 data are preliminary estimates.
This table was produced from the Development Economics LDB database.
* The diamonds show four key indicators in the country (in bold) compared with its income-group average. If data are missing, the diamond will be incomplete.
-40
-20
0
20
40
02 03 04 05 06 07
GCF GDP
Growth of capital and GDP (%)
-40
-20
0
20
40
02 03 04 05 06 07
Exports Imports
Growth of exports and imports (%)
Turkey
Upper-middle-income group
Development diamond*
Life expectancy
Access to improved water source
GNIpercapita
Grossprimary
enrollment
Turkey
Upper-middle-income group
Economic ratios*
Trade
Indebtedness
Domesticsavings
Capital formation

153
Turkey
PRICES and GOVERNMENT FINANCE1987 1997 2006 2007
Domestic prices(% change)Consumer prices .. 85.0 9.6 8.1Implicit GDP deflator 88.1 86.1 9.3 8.1
Government finance(% of GDP, includes current grants)Current revenue 16.3 16.9 21.2 21.1Current budget balance 4.3 0.2 -7.7 -7.3Overall surplus/deficit -4.1 -5.5 0.2 -0.8
TRADE1987 1997 2006 2007
(US$ millions)Total exports (fob) 10,190 32,110 91,937 104,235 Agriculture and livestock 3,316 9,969 19,438 .. Mining and quarry products 1,826 4,365 4,521 .. Manufactures 9,050 30,648 87,179 99,023Total imports (cif) 14,158 50,954 138,973 152,421 Food 830 2,425 2,537 .. Fuel and energy 3,275 6,258 29,664 .. Capital goods 3,956 11,353 23,316 ..
Export price index (2000=100) 107 117 138 143Import price index (2000=100) 114 106 149 154Terms of trade (2000=100) 94 111 92 93
BALANCE of PAYMENTS1987 1997 2006 2007
(US$ millions)Exports of goods and services 14,135 51,358 116,427 130,625Imports of goods and services 15,179 55,494 144,304 156,810Resource balance -1,044 -4,136 -27,877 -26,185
Net income -2,085 -3,013 -6,584 -6,940Net current transfers 2,323 4,511 1,687 1,820
Current account balance -806 -2,638 -32,774 -32,228
Financing items (net) 1,775 5,954 36,494 37,526Changes in net reserves -969 -3,316 -3,720 -5,298
Memo:Reserves including gold (US$ millions) 2,740 19,993 60,705 69,438Conversion rate (DEC, local/US$) 8.60E-4 0.2 1.4 1.3
EXTERNAL DEBT and RESOURCE FLOWS1987 1997 2006 2007
(US$ millions)Total debt outstanding and disbursed 40,944 84,785 207,854 .. IBRD 6,290 3,587 6,854 7,541 IDA 170 118 65 59
Total debt service 5,981 11,914 40,511 .. IBRD 776 999 1,135 1,055 IDA 5 7 6 6
Composition of net resource flows Official grants 42 58 415 .. Official creditors 480 -134 720 .. Private creditors 1,285 3,755 33,400 .. Foreign direct investment (net inflows) 115 805 20,070 .. Portfolio equity (net inflows) 0 8 1,939 ..
World Bank program Commitments 957 35 1,909 867 Disbursements 787 266 1,796 1,223 Principal repayments 320 732 813 672 Net flows 467 -466 983 551 Interest payments 461 273 329 389 Net transfers 7 -740 654 162
Note: This table was produced from the Development Economics LDB database. 9/24/08
-8
-6
-4
-2
0
2
4
01 02 03 04 05 06 07
Current account balance to GDP (%)
0
50,000
100,000
150,000
200,000
01 02 03 04 05 06 07
Exports Imports
Export and import levels (US$ mill.)
0
20
40
60
02 03 04 05 06 07
GDP deflator CPI
Inflation (%)
G: 42,315
A: 6,854
D: 1,820
C: 10,762B: 65
F: 141,667
E: 4,371
A - IBRDB - IDA C - IMF
D - Other multilateralE - BilateralF - PrivateG - Short-term
Composition of 2006 debt (US$ mill.)

154
Colombia at a glance 9/24/08
Latin Lower-POVERTY and SOCIAL America middle-
Colombia & Carib. income2007Population, mid-year (millions) 46.1 563 3,437GNI per capita (Atlas method, US$) 3,250 5,540 1,887GNI (Atlas method, US$ billions) 149.9 3,118 6,485
Average annual growth, 2001-07
Population (%) 1.4 1.3 1.1Labor force (%) 2.7 2.1 1.5
Most recent estimate (latest year available, 2001-07)
Poverty (% of population below national poverty line) .. .. ..Urban population (% of total population) 74 78 42Life expectancy at birth (years) 73 73 69Infant mortality (per 1,000 live births) 17 22 41Child malnutrition (% of children under 5) 5 5 25Access to an improved water source (% of population) 93 91 88Literacy (% of population age 15+) 93 90 89Gross primary enrollment (% of school-age population) 116 118 111 Male 117 120 112 Female 115 116 109
KEY ECONOMIC RATIOS and LONG-TERM TRENDS
1987 1997 2006 2007
GDP (US$ billions) 36.4 106.7 135.7 172.0
Gross capital formation/GDP 19.1 20.9 23.6 24.4Exports of goods and services/GDP 17.0 14.8 22.5 19.4Gross domestic savings/GDP 23.1 15.0 21.1 23.3Gross national savings/GDP 21.2 13.3 20.0 ..
Current account balance/GDP -0.1 -5.4 -2.3 -3.4Interest payments/GDP 3.7 1.6 1.8 ..Total debt/GDP 46.8 29.9 29.3 ..Total debt service/exports 38.9 29.4 32.5 ..Present value of debt/GDP .. .. 30.3 ..Present value of debt/exports .. .. 125.7 ..
1987-97 1997-07 2006 2007 2007-11(average annual growth)GDP 4.0 3.0 6.8 7.5 4.8GDP per capita 2.1 1.4 5.4 6.2 3.3Exports of goods and services 7.0 4.5 7.8 1.4 5.2
STRUCTURE of the ECONOMY
1987 1997 2006 2007(% of GDP)Agriculture 18.7 13.7 12.0 10.5Industry 36.0 29.4 35.7 29.3 Manufacturing 21.1 14.9 16.7 12.6Services 45.3 56.9 52.3 60.1
Household final consumption expenditure 68.2 64.6 61.1 63.4General gov't final consumption expenditure 8.7 20.4 17.8 13.3Imports of goods and services 12.9 20.8 24.9 20.5
1987-97 1997-07 2006 2007(average annual growth)Agriculture -1.1 0.6 2.3 2.4Industry 3.2 2.7 9.2 4.3 Manufacturing -0.7 3.0 10.8 3.1Services 4.9 3.4 5.5 9.4
Household final consumption expenditure 3.6 2.5 6.7 -3.2General gov't final consumption expenditure 9.0 1.5 2.1 6.6Gross capital formation 7.8 8.2 26.8 49.3Imports of goods and services 15.4 6.5 20.8 15.4
Note: 2007 data are preliminary estimates.
This table was produced from the Development Economics LDB database.
* The diamonds show four key indicators in the country (in bold) compared with its income-group average. If data are missing, the diamond will be incomplete.
0
20
40
60
02 03 04 05 06 07
GCF GDP
Growth of capital and GDP (%)
-10
0
10
20
30
02 03 04 05 06 07
Exports Imports
Growth of exports and imports (%)
Colombia
Lower-middle-income group
Development diamond*
Life expectancy
Access to improved water source
GNIpercapita
Grossprimary
enrollment
Colombia
Lower-middle-income group
Economic ratios*
Trade
Indebtedness
Domesticsavings
Capital formation

155
Note: cif= cost, insurance and freight; DEC= Development Economics; fob= free on board; GDP= gross domestic product; GNI= gross national income; IBRD= International Bank for Reconstruction and Development; IDA= International Development Association; IMF= International Monetary Fund.
Colombia
PRICES and GOVERNMENT FINANCE1987 1997 2006 2007
Domestic prices(% change)Consumer prices 24.0 17.7 4.5 5.1Implicit GDP deflator 23.4 16.8 5.1 3.8
Government finance(% of GDP, includes current grants)Current revenue 10.5 12.5 20.1 0.0Current budget balance 2.6 0.3 2.2 0.0Overall surplus/deficit 2.0 -3.7 -0.6 0.0
TRADE1987 1997 2006 2007
(US$ millions)Total exports (fob) 5,409 11,549 23,930 25,049 Coffee 1,651 2,259 1,461 1,528 Petroleum products 1,369 2,707 6,328 6,949 Manufactures 1,071 7,466 9,237 9,048Total imports (cif) 4,228 4,083 23,976 26,214 Food 215 1,673 2,332 2,236 Fuel and energy 109 439 681 563 Capital goods 1,518 5,826 7,154 10,964
Export price index (2000=100) 12 58 47 ..Import price index (2000=100) 12 57 38 ..Terms of trade (2000=100) 104 102 125 ..
BALANCE of PAYMENTS1987 1997 2006 2007
(US$ millions)Exports of goods and services 6,422 13,690 27,303 30,071Imports of goods and services 5,751 17,958 26,829 31,733Resource balance 670 -4,268 474 -1,662
Net income -1,692 -2,312 -5,983 -8,251Net current transfers 1,001 496 4,450 ..
Current account balance -21 -5,751 -3,057 -5,773
Financing items (net) 43 5,474 3,034 7,632Changes in net reserves -22 277 23 -1,860
Memo:Reserves including gold (US$ millions) .. 9,908 15,440 ..Conversion rate (DEC, local/US$) 242.6 1,141.0 2,361.1 2,078.3
EXTERNAL DEBT and RESOURCE FLOWS1987 1997 2006 2007
(US$ millions)Total debt outstanding and disbursed 17,024 31,937 39,698 .. IBRD 4,113 1,723 4,563 4,756 IDA 17 10 3 2
Total debt service 2,815 4,511 10,640 .. IBRD 618 573 468 688 IDA 1 1 1 1
Composition of net resource flows Official grants 17 89 245 .. Official creditors 234 -452 1,114 .. Private creditors -318 4,194 -147 .. Foreign direct investment (net inflows) 319 5,562 6,463 .. Portfolio equity (net inflows) 0 278 -30 ..
World Bank program Commitments 180 75 683 632 Disbursements 364 189 942 564 Principal repayments 299 437 259 432 Net flows 65 -249 683 132 Interest payments 319 137 210 256 Net transfers -254 -385 473 -124
Note: This table was produced from the Development Economics LDB database. 9/24/08
-4
-3
-2
-1
0
01 02 03 04 05 06 07
Current account balance to GDP (%)
0
10,000
20,000
30,000
01 02 03 04 05 06 07
Exports Imports
Export and import levels (US$ mill.)
0
5
10
15
02 03 04 05 06 07
GDP deflator CPI
Inflation (%)
G: 4,822 A: 4,563
D: 6,277
B: 3
F: 23,219
E: 814
A - IBRDB - IDA C - IMF
D - Other multilateralE - BilateralF - PrivateG - Short-term
Composition of 2006 debt (US$ mill.)

156
Tunisia at a glance 9/24/08
M. East Lower-POVERTY and SOCIAL & North middle-
Tunisia Africa income2007Population, mid-year (millions) 10.2 313 3,437GNI per capita (Atlas method, US$) 3,200 2,794 1,887GNI (Atlas method, US$ billions) 32.8 876 6,485
Average annual growth, 2001-07
Population (%) 1.0 1.8 1.1Labor force (%) 2.8 3.6 1.5
Most recent estimate (latest year available, 2001-07)
Poverty (% of population below national poverty line) .. .. ..Urban population (% of total population) 66 57 42Life expectancy at birth (years) 74 70 69Infant mortality (per 1,000 live births) 19 34 41Child malnutrition (% of children under 5) .. .. 25Access to an improved water source (% of population) 94 89 88Literacy (% of population age 15+) 74 73 89Gross primary enrollment (% of school-age population) 108 105 111 Male 110 108 112 Female 107 103 109
KEY ECONOMIC RATIOS and LONG-TERM TRENDS
1987 1997 2006 2007
GDP (US$ billions) 9.7 18.9 31.0 35.0
Gross capital formation/GDP 23.5 26.4 23.5 23.4Exports of goods and services/GDP 34.8 43.8 53.2 51.8Gross domestic savings/GDP 22.5 24.0 23.6 23.0Gross national savings/GDP 22.5 23.4 25.4 23.9
Current account balance/GDP -1.0 -3.1 -1.1 -1.2Interest payments/GDP 3.6 2.5 2.2 ..Total debt/GDP 70.3 59.4 59.7 ..Total debt service/exports 28.4 15.7 14.5 ..Present value of debt/GDP .. .. 58.4 ..Present value of debt/exports .. .. 103.7 ..
1987-97 1997-07 2006 2007 2007-11(average annual growth)GDP 4.3 4.8 5.7 6.3 5.9GDP per capita 2.4 3.7 4.6 5.1 4.5Exports of goods and services 5.4 3.9 3.9 4.2 5.3
STRUCTURE of the ECONOMY
1987 1997 2006 2007(% of GDP)Agriculture 16.5 13.2 11.1 10.9Industry 29.5 28.6 27.8 27.5 Manufacturing 15.1 18.5 17.0 16.9Services 54.1 58.2 61.1 61.6
Household final consumption expenditure 60.6 60.2 63.0 63.6General gov't final consumption expenditure 16.9 15.8 13.4 13.4Imports of goods and services 35.8 46.2 53.1 52.2
1987-97 1997-07 2006 2007(average annual growth)Agriculture 3.9 2.7 3.0 4.5Industry 4.8 3.8 3.8 4.1 Manufacturing 3.0 4.0 4.2 4.4Services 4.2 5.7 7.1 7.7
Household final consumption expenditure 3.7 5.2 4.8 7.4General gov't final consumption expenditure 3.8 4.4 2.6 6.4Gross capital formation 5.9 3.0 5.6 5.5Imports of goods and services 5.1 3.4 1.4 5.3
Note: 2007 data are preliminary estimates.
This table was produced from the Development Economics LDB database.
* The diamonds show four key indicators in the country (in bold) compared with its income-group average. If data are missing, the diamond will be incomplete.
-10
-5
0
5
10
02 03 04 05 06 07
GCF GDP
Growth of capital and GDP (%)
-5
0
5
10
15
02 03 04 05 06 07
Exports Imports
Growth of exports and imports (%)
Tunisia
Lower-middle-income group
Development diamond*
Life expectancy
Access to improved water source
GNIpercapita
Grossprimary
enrollment
Tunisia
Lower-middle-income group
Economic ratios*
Trade
Indebtedness
Domesticsavings
Capital formation

157
Note: cif= cost, insurance and freight; DEC= Development Economics; fob= free on board; GDP= gross domestic product; GNI= gross national income; IBRD= International Bank for Reconstruction and Development; IDA= International Development Association; IMF= International Monetary Fund.
Tunisia
PRICES and GOVERNMENT FINANCE1987 1997 2006 2007
Domestic prices(% change)Consumer prices 8.1 3.7 2.3 2.2Implicit GDP deflator 5.2 4.0 3.8 2.4
Government finance(% of GDP, includes current grants)Current revenue 28.3 24.0 23.0 22.8Current budget balance 4.9 2.4 3.5 3.6Overall surplus/deficit -1.4 -4.3 -3.0 -2.9
TRADE1987 1997 2006 2007
(US$ millions)Total exports (fob) 2,137 5,559 11,488 11,971 Fuel 505 503 1,737 1,766 Agriculture 276 616 1,228 1,234 Manufactures 959 3,680 7,814 8,288Total imports (cif) 3,028 7,951 14,299 15,246 Food 312 691 900 924 Fuel and energy 318 597 2,075 2,113 Capital goods 520 1,724 2,797 2,997
Export price index (2000=100) 44 82 150 151Import price index (2000=100) 62 114 152 153Terms of trade (2000=100) 71 72 99 99
BALANCE of PAYMENTS1987 1997 2006 2007
(US$ millions)Exports of goods and services 3,377 8,174 15,868 16,790Imports of goods and services 3,473 8,695 15,840 16,919Resource balance -96 -521 27 -129
Net income -486 -863 -2,339 -2,384Net current transfers 484 791 1,974 2,078
Current account balance -99 -593 -338 -435
Financing items (net) 215 917 2,785 959Changes in net reserves -116 -324 -2,447 -524
Memo:Reserves including gold (US$ millions) 535 1,988 6,824 7,348Conversion rate (DEC, local/US$) 0.8 1.1 1.3 1.3
EXTERNAL DEBT and RESOURCE FLOWS1987 1997 2006 2007
(US$ millions)Total debt outstanding and disbursed 6,816 11,228 18,480 .. IBRD 1,052 1,434 1,444 1,571 IDA 63 45 26 24
Total debt service 1,105 1,413 2,520 .. IBRD 177 275 438 236 IDA 2 2 2 2
Composition of net resource flows Official grants 85 137 185 .. Official creditors 131 72 -208 .. Private creditors -121 583 -265 .. Foreign direct investment (net inflows) 92 339 3,270 .. Portfolio equity (net inflows) 17 55 65 ..
World Bank program Commitments 200 167 143 28 Disbursements 166 127 112 161 Principal repayments 100 175 368 172 Net flows 66 -48 -257 -10 Interest payments 79 103 72 67 Net transfers -13 -151 -329 -77
Note: This table was produced from the Development Economics LDB database. 9/24/08
-5
-4
-3
-2
-1
0
01 02 03 04 05 06 07
Current account balance to GDP (%)
0
5,000
10,000
15,000
20,000
01 02 03 04 05 06 07
Exports Imports
Export and import levels (US$ mill.)
0
1
2
3
4
5
02 03 04 05 06 07
GDP deflator CPI
Inflation (%)
G: 3,336
A: 1,444
D: 4,257
B: 26
F: 6,192E: 3,225
A - IBRDB - IDA C - IMF
D - Other multilateralE - BilateralF - PrivateG - Short-term
Composition of 2006 debt (US$ mill.)

158
Appendix Q. Colombia, Tunisia, and Turkey: Millennium Development Goals Colombia 1990 1995 2000 2007
Goal 1: Eradicate extreme poverty and hunger Employment to population ratio, 15+, total (%) .. 58 58 63 Employment to population ratio, ages 15-24, total (%) .. 43 42 46 Income share held by lowest 20% .. 3 3 .. Malnutrition prevalence, weight for age (% of children under 5) .. 6 5 5 Poverty headcount ratio at national poverty line (% of population) .. 60 64 .. Prevalence of undernourishment (% of population) .. .. .. .. Vulnerable employment, total (% of total employment) .. 30 35 44 Goal 2: Achieve universal primary education Literacy rate, youth female (% of females ages 15-24) .. 92 .. 98 Literacy rate, youth male (% of males ages 15-24) .. 89 .. 98 Persistence to last grade of primary, total (% of cohort) .. .. 61 82 Primary completion rate, total (% of relevant age group) 67 80 92 105 Total enrollment, primary (% net) .. .. 93 92 Goal 3: Promote gender equality and empower women Proportion of seats held by women in national parliament (%) 5 .. 12 8 Ratio of female to male enrollments in tertiary education .. .. 109 109 Ratio of female to male primary enrollment .. .. 100 99 Ratio of female to male secondary enrollment .. .. 110 111 Ratio of young literate females to males (% ages 15-24) .. 103 .. 101 Share of women employed in the nonagricultural sector (% of total nonagricultural employment) .. 44.9 48.8 .. Goal 4: Reduce child mortality Immunization, measles (% of children ages 12-23 months) 82 95 75 88 Mortality rate, infant (per 1,000 live births) 26 24 20 17 Mortality rate, under-5 (per 1,000) 35 31 26 21 Goal 5: Improve maternal health Adolescent fertility rate (births per 1,000 women ages 15-19) .. .. 79 67 Births attended by skilled health staff (% of total) 82 86 86 96 Contraceptive prevalence (% of women ages 15-49) 66 72 77 78 Maternal mortality ratio (modeled estimate, per 100,000 live births) .. .. .. 130 Pregnant women receiving prenatal care (%) 83 83 91 94 Unmet need for contraception (% of married women ages 15-49) 11 8 6 6 Goal 6: Combat HIV/AIDS, malaria, and other diseases Children with fever receiving antimalarial drugs (% of children under age 5 with fever) .. .. .. .. Condom use, population ages 15-24, female (% of females ages 15-24) .. 10 18 23 Condom use, population ages 15-24, male (% of males ages 15-24) .. .. .. .. Incidence of tuberculosis (per 100,000 people) 63 57 51 45 Prevalence of HIV, female (% ages 15-24) .. .. .. 0.3 Prevalence of HIV, total (% of population ages 15-49) .. .. .. 1 Tuberculosis cases detected under DOTS (%) .. .. 87 83 Goal 7: Ensure environmental sustainability Annual freshwater withdrawals, total (% of internal resources) .. .. .. .. CO2 emissions (kg per PPP $ of GDP) 0.5 0.3 0.3 .. CO2 emissions (metric tons per capita) 1.7 1.5 1.4 .. Forest area (% of land area) 55 .. 55 55 Improved sanitation facilities (% of population with access) 68 71 74 78 Improved water source (% of population with access) 89 90 91 93 Marine protected areas, (% of surface area) .. .. .. .. Nationally protected areas (% of total land area) .. .. .. .. Goal 8: Develop a global partnership for development Aid per capita (current US$) 3 4 4 22 Debt service (PPG and IMF only, % of exports of G&S, excl. workers' remittances) 35 24 21 19 Internet users (per 100 people) 0 0 2 26 Mobile phone subscribers (per 100 people) 0 1 5 74 Telephone mainlines (per 100 people) 7 10 17 17 Other Fertility rate, total (births per woman) 3 2.8 2.6 2.3 GNI per capita, Atlas method (current US$) 1200 2100 2080 3250 GNI, Atlas method (current US$) (billions) 41.7 80.2 86.8 149.9 Gross capital formation (% of GDP) 18.5 25.8 13.7 24.4 Life expectancy at birth, total (years) 68 70 71 73 Literacy rate, adult total (% of people ages 15 and above) .. 81 .. 93 Population, total (millions) 34.9 38.3 41.7 46.1 Trade (% of GDP) 35.4 35.5 40.9 39.9 Source: World Development Indicators database

159
TUNISIA 1990 1995 2000 2007 Goal 1: Eradicate extreme poverty and hunger Employment to population ratio, 15+, total (%) .. 41 42 45 Employment to population ratio, ages 15-24, total (%) .. 27 27 29 Income share held by lowest 20% 6 6 6 .. Malnutrition prevalence, weight for age (% of children under 5) 9 .. .. .. Poverty headcount ratio at national poverty line (% of population) 7 8 .. .. Prevalence of undernourishment (% of population) .. .. .. .. Vulnerable employment, total (% of total employment) .. .. .. .. Goal 2: Achieve universal primary education Literacy rate, youth female (% of females ages 15-24) .. .. .. .. Literacy rate, youth male (% of males ages 15-24) .. .. .. .. Persistence to last grade of primary, total (% of cohort) .. .. 88 94 Primary completion rate, total (% of relevant age group) 80 91 87 120 Total enrollment, primary (% net) .. .. 95 98 Goal 3: Promote gender equality and empower women Proportion of seats held by women in national parliament (%) 4 .. 12 23 Ratio of female to male enrollments in tertiary education .. .. 97 142 Ratio of female to male primary enrollment .. .. 96 97 Ratio of female to male secondary enrollment .. .. 106 110 Ratio of young literate females to males (% ages 15-24) .. .. .. .. Share of women employed in the nonagricultural sector (% of total nonagricultural employment) .. 23.1 24.6 .. Goal 4: Reduce child mortality Immunization, measles (% of children ages 12-23 months) 93 91 95 98 Mortality rate, infant (per 1,000 live births) 41 32 25 19 Mortality rate, under-5 (per 1,000) 52 40 31 23 Goal 5: Improve maternal health Adolescent fertility rate (births per 1,000 women ages 15-19) .. .. 8 7 Births attended by skilled health staff (% of total) 69 81 90 .. Contraceptive prevalence (% of women ages 15-49) 50 60 66 .. Maternal mortality ratio (modeled estimate, per 100,000 live births) .. .. .. 100 Pregnant women receiving prenatal care (%) 58 .. 92 .. Unmet need for contraception (% of married women ages 15-49) .. .. .. ..
Goal 6: Combat HIV/AIDS, malaria, and other diseases
Children with fever receiving antimalarial drugs (% of children under age 5 with fever) .. .. .. .. Condom use, population ages 15-24, female (% of females ages 15-24) .. .. .. .. Condom use, population ages 15-24, male (% of males ages 15-24) .. .. .. .. Incidence of tuberculosis (per 100,000 people) 31 31 25 25 Prevalence of HIV, female (% ages 15-24) .. .. .. 0.1 Prevalence of HIV, total (% of population ages 15-49) .. .. .. 0 Tuberculosis cases detected under DOTS (%) .. .. 101 81 Goal 7: Ensure environmental sustainability Annual freshwater withdrawals, total (% of internal resources) .. .. .. .. CO2 emissions (kg per PPP $ of GDP) 0.6 0.5 0.4 .. CO2 emissions (metric tons per capita) 1.6 1.8 2.1 .. Forest area (% of land area) 4 .. 6 7 Improved sanitation facilities (% of population with access) 74 78 81 85 Improved water source (% of population with access) 82 86 90 94 Marine protected areas, (% of surface area) .. .. .. .. Nationally protected areas (% of total land area) .. .. .. .. Goal 8: Develop a global partnership for development Aid per capita (current US$) 48 8 23 43 Debt service (PPG and IMF only, % of exports of G&S, excl. workers' remittances) 26 18 21 15 Internet users (per 100 people) 0 0 3 17 Mobile phone subscribers (per 100 people) 0 0 1 77 Telephone mainlines (per 100 people) 4 6 10 12 Other Fertility rate, total (births per woman) 3.5 2.7 2.1 2 GNI per capita, Atlas method (current US$) 1430 1820 2090 3200 GNI, Atlas method (current US$) (billions) 11.6 16.3 20 32.8 Gross capital formation (% of GDP) 27.1 24.7 27.3 23.4 Life expectancy at birth, total (years) 70 71 73 74 Literacy rate, adult total (% of people ages 15 and above) .. .. .. .. Population, total (millions) 8.2 9 9.6 10.2 Trade (% of GDP) 94.2 93.7 92.7 103.9 Source: World Development Indicators database

160
TURKEY
1990 1995 2000 2007 Goal 1: Eradicate extreme poverty and hunger Employment to population ratio, 15+, total (%) .. 51 47 47 Employment to population ratio, ages 15-24, total (%) .. 42 38 39 Income share held by lowest 20% .. 6 .. 5 Malnutrition prevalence, weight for age (% of children under 5) .. 9 7 .. Poverty headcount ratio at national poverty line (% of population) .. 28 .. .. Prevalence of undernourishment (% of population) .. .. .. .. Vulnerable employment, total (% of total employment) .. .. 46 41 Goal 2: Achieve universal primary education Literacy rate, youth female (% of females ages 15-24) 88 .. .. .. Literacy rate, youth male (% of males ages 15-24) 97 .. .. .. Persistence to last grade of primary, total (% of cohort) .. .. .. .. Primary completion rate, total (% of relevant age group) .. .. .. 96 Total enrollment, primary (% net) .. .. .. 90 Goal 3: Promote gender equality and empower women Proportion of seats held by women in national parliament (%) 1 .. 4 9 Ratio of female to male enrollments in tertiary education .. .. 68 75 Ratio of female to male primary enrollment .. .. 91 95 Ratio of female to male secondary enrollment .. .. .. 83 Ratio of young literate females to males (% ages 15-24) 92 .. .. .. Share of women employed in the nonagricultural sector (% of total nonagricultural employment) .. 16.7 19.1 20.3 Goal 4: Reduce child mortality Immunization, measles (% of children ages 12-23 months) 78 65 86 98 Mortality rate, infant (per 1,000 live births) 67 52 38 24 Mortality rate, under-5 (per 1,000) 82 63 44 26 Goal 5: Improve maternal health Adolescent fertility rate (births per 1,000 women ages 15-19) .. .. 51 39 Births attended by skilled health staff (% of total) .. 76 81 .. Contraceptive prevalence (% of women ages 15-49) 63 63 64 .. Maternal mortality ratio (modeled estimate, per 100,000 live births) .. .. .. 44 Pregnant women receiving prenatal care (%) .. 62 68 .. Unmet need for contraception (% of married women ages 15-49) .. 11 10 .. Goal 6: Combat HIV/AIDS, malaria, and other diseases Children with fever receiving antimalarial drugs (% of children under age 5 with fever) .. .. .. .. Condom use, population ages 15-24, female (% of females ages 15-24) .. .. .. .. Condom use, population ages 15-24, male (% of males ages 15-24) .. .. .. .. Incidence of tuberculosis (per 100,000 people) 49 40 31 29 Prevalence of HIV, female (% ages 15-24) .. .. .. .. Prevalence of HIV, total (% of population ages 15-49) .. .. .. .. Tuberculosis cases detected under DOTS (%) .. .. .. 80 Goal 7: Ensure environmental sustainability Annual freshwater withdrawals, total (% of internal resources) .. .. .. .. CO2 emissions (kg per PPP $ of GDP) 0.4 0.4 0.4 .. CO2 emissions (metric tons per capita) 2.6 2.8 3.3 .. Forest area (% of land area) 13 .. 13 13 Improved sanitation facilities (% of population with access) 85 86 87 88 Improved water source (% of population with access) 85 89 93 97 Marine protected areas, (% of surface area) .. .. .. .. Nationally protected areas (% of total land area) .. .. .. .. Goal 8: Develop a global partnership for development Aid per capita (current US$) 21 5 5 8 Debt service (PPG and IMF only, % of exports of G&S, excl. workers' remittances) 30 24 19 16 Internet users (per 100 people) 0 0 4 18 Mobile phone subscribers (per 100 people) 0 1 24 84 Telephone mainlines (per 100 people) 12 21 27 25 Other Fertility rate, total (births per woman) 3 2.8 2.6 2.2 GNI per capita, Atlas method (current US$) 3070 3870 3930 8020 GNI, Atlas method (current US$) (billions) 172.6 238.8 265.2 592.9 Gross capital formation (% of GDP) .. .. 20.8 22.2 Life expectancy at birth, total (years) 66 68 70 71 Literacy rate, adult total (% of people ages 15 and above) 79 .. .. .. Population, total (millions) 56.2 61.7 67.4 73.9 Trade (% of GDP) .. .. 43.2 48.9 Source: World Development Indicators database Note: DOTS= Directly Observed Treatment (short course); G&S= goods and services; GDP= gross domestic product; GNI= gross national income; HIV= human immunodeficiency virus; IMF= International Monetary Fund; PPG= public and publicly guaranteed (debt); PPP= purchasing power parity.

161
Appendix R. Colombia, Tunisia, and Turkey: Total Cost of Bank Programs
Cost of Bank Programs, FY1998–FY2008
Lending Project
Supervision ESW Total
US$ Thousands
Colombia $ 19,450 $ 20,326 $ 11,291 $ 51,067
Tunisia $ 10,036 $ 17,916 $ 9,608 $ 37,561
Turkey $ 23,447 $ 28,196 $ 18,325 $ 69,967
Africa $ 376,284 $ 470,412 $ 347,283 $ 1,193,978
East Asia and Pacific $ 234,403 $ 259,563 $ 214,130 $ 708,096
South Asia $ 176,295 $ 197,805 $ 162,902 $ 537,002
Europe and Central Asia $ 303,703 $ 355,938 $ 305,198 $ 964,839
Middle East and North Africa $ 102,562 $ 127,049 $ 184,532 $ 414,143
Latin America and Caribbean $ 239,838 $ 320,779 $ 204,183 $ 764,800
World Bank $ 1,457,452 $ 1,809,902 $ 1,463,349 $ 4,730,702
Proportion of total
Colombia 38.1 39.8 22.1 100.0
Tunisia 26.7 47.7 25.6 100.0
Turkey 33.5 40.3 26.2 100.0
Africa 31.5 39.4 29.1 100.0
East Asia and Pacific 33.1 36.7 30.2 100.0
South Asia 32.8 36.8 30.3 100.0
Europe and Central Asia 31.5 36.9 31.6 100.0
Middle East and North Africa 24.8 30.7 44.6 100.0
Latin America and Caribbean 31.4 41.9 26.7 100.0
World Bank 30.8 38.3 30.9 100.0
Source: World Bank internal database. Note: ESW= economic and sector work; FY= fiscal year.

162
Appendix S. Colombia, Tunisia, and Turkey: Average Cost of Tasks, Total and by MILES
Average Cost per task, FY2000–07 (thousands of US$)
Total
FY2000–07 INV DPL
ESW
TA
Colombia
All tasks 260.7 118.8 64.7 69.8 7.4
MILES tasks 310.3 112.0 111.5 86.8 0.0
Tunisia
All tasks 287.7 118.2 48.2 115.7 5.6
MILES tasks 309.3 106.6 66.6 134.0 2.1
Turkey
All tasks 367.0 86.4 168.4 90.6 21.6
MILES tasks 633.5 124.5 393.8 115.3 0.0
Latin America and Caribbean 233.5 89.3 41.3 93.0 9.9
Middle East and North Africa 191.0 61.4 15.0 68.8 45.8
Africa 487.4 423.1 30.4 25.5 8.5
Europe and Central Asia 168.5 68.9 13.2 66.3 20.1
South Asia 196.9 67.2 22.2 90.2 17.3
World 255.5 142.0 24.4 68.7 20.3
Source: World Bank internal database. Note: Total cost of projects opened and closed between FY00 and FY07. MILES tasks refer to World Bank Lending, AAA and TA that has a bearing on employment creation and earnings as defined by this evaluation. Note: AAA= analytic and advisory activities; DPL= Development Policy Loan; ESW= economic and sector work; FY= fiscal year; INV= investment operations; MILES= Macroeconomic conditions, Investment Climate and infrastructure; Labor market regulations and institutions, Education and skill development; and Social safety net; TA= technical assistance.

163
Appendix T. Colombia, Tunisia, and Turkey: Bank Senior Management
Colombia: Bank's Senior Management, FY 2000–2008
Year Vice president Country director Chief / resident representative Lead Economist
2000 David de Ferranti Olivier Lafourcade Alberto Chueca Mora David Yuravlivker Marcelo Giugale
2001 David de Ferranti Olivier Lafourcade Alberto Chueca Mora Marcelo Giugale
2002 David de Ferranti Olivier Lafourcade Alberto Chueca Mora Marcelo Giugale
2003 David de Ferranti Isabel Guerrero Alberto Chueca Mora Joaquin Cottani
2004 David de Ferranti Isabel Guerrero Alberto Chueca Mora Joaquin Cottani David Gould
2005 Pamela Cox Isabel Guerrero Alberto Chueca Mora David Gould David Rosenblatt
2006 Pamela Cox Isabel Guerrero Miguel Lopez-Bakovic David Rosenblatt
2007 Pamela Cox Isabel Guerrero Axel van Trotsenburg
Miguel Lopez-Bakovic David Rosenblatt
2008 Pamela Cox Axel van Trotsenburg M.Lopez-Bakovic Eduardo Somensatto
David Rosenblatt
Source: World Bank Group Directory

164
Turkey: Bank's Senior Management, 1991–2008
Year Vice president Country director Chief / resident representative Economist
1991 Willii A. Wapenhaus Michael Wiehen Luis de Azcarate -
1992 Wilfried Thalwitz Michael Wiehen Luis de Azcarate R. Coutinho
1993 Wilfried Thalwitz Michael Wiehen Luis de Azcarate R. Coutinho
1994 Wilfried Thalwitz Michael Wiehen Frederick Thomas Temple S. Otoo
1995 Wilfried Thalwitz Rachel Lomax Frederick Thomas Temple S. Otoo Jacob Kolster
1996 Johannes Linn Kenneth Lay Frederick Thomas Temple S. Otoo Jacob Kolster
1997 Johannes Linn Kenneth Lay Frederick Thomas Temple S. Otoo
1998 Johannes Linn Ajay Chibber S. Otoo
1999 Johannes Linn Ajay Chibber S. Otoo
2000 Johannes Linn Ajay Chibber * S. Otoo
2001 Johannes Linn Ajay Chibber * James Parks *
2002 Johannes Linn Ajay Chibber * James Parks *
2003 Johannes Linn Ajay Chibber * James Parks *
2004 Shigeo Katsu Andrew N. Vorkink * James Parks *
2005 Shigeo Katsu Andrew N. Vorkink * Rodrigo A. Chaves*
2006 Shigeo Katsu Ulrich Zachau * Rodrigo A. Chaves*
2007 Shigeo Katsu Ulrich Zachau * Mark Roland Thomas*
2008 Shigeo Katsu Ulrich Zachau * Mark Roland Thomas*
Source: The World Bank Group Directory 1995 - 2005
Note: * Staff located at the Country Office at Ankara, Turkey.
Andrew N. Vorkink * was the country director from August 2003 to November 2006.
Ulrich Zachau * has been Country Director for Turkey since January 2007.
The title " Chief / resident representative" for Turkey has not existed since 2003.

165
Tunisia: Bank's Senior Management, 1991–2008
Year Vice president Country director Resident Representative
1991 Willii A. Wapenhaus Kemal Dervis -
1992 Caio Koch-Weser Pieter Bottelier -
1993 Caio Koch-Weser Harinder S. Kohli -
1994 Caio Koch-Weser Daniel Ritchie -
1995 Caio Koch-Weser Daniel Ritchie -
1996 Kemal Dervis Daniel Ritchie -
1997 Kemal Dervis Christian Delvoie -
1998 Kemal Dervis Christian Delvoie -
1999 Kemal Dervis Christian Delvoie -
2000 Jean-Louis Sarbib Christian Delvoie -
2001 Jean-Louis Sarbib Christian Delvoie -
2002 Jean-Louis Sarbib Theodore O. Ahlers -
2003 Christiaan J. Poortmann Theodore O. Ahlers -
2004 Christiaan J. Poortmann Theodore O. Ahlers -
2005 Christiaan J. Poortmann Theodore O. Ahlers -
2006 Christiaan J. Poortmann (until 9/7/2006) Theodore O. Ahlers -
Daniela Gressani (from 9/8/2006) -
2007 Daniela Gressani Theodore O. Ahlers (until 7/31/07) -
Mats Karlsson (from 11/1/07)
2008 Daniela Gressani Mats Karlsson -
Source: World Bank Group Directory

166
References Acevedo, T., Gutierrez, F., and Vatela, J.M. (2007). Violent Liberalism? State, Conflict and
Political Regime In Colombia, 1930-2006: An Analytical Narrative on State-Making. Crisis States Working Papers Series No.2. Working Paper No. 19. Development Studies Institute.
Akkemik, K. A. (2007). The Response of Employment to GDP Growth in Turkey: An Econometric Estimation. Applied Econometrics and International Development, 7 (1), 65-74.
Alter Chen, M., Jhabvala, R., and Lund, F. (2002). Supporting Workers in the Informal Economy: A Policy Framework. Employment Sector 2002/2. Geneva: International Labour Office.
Ayache H. (2005). The Education System and Information Technologies in Tunisia. Bilbao: Presentation to the Second World Summit on the Society of Information and the role of local authorities. Retrieved from
http://www.it4all-bilbao.org/ponentes/Hedi_Ayache.pdf.
Arango, L. E., and Posada C.E. (2007). Labor Participation of Married Women in Colombia. Desarrolo y Sociedad, Second Semester, 93-126.
Ayadi, M., Boulila, G., Lahouel, M. andMontigny, P. (2004). Pro-Poor growth in Tunisia. Paris: Interna-tional Development Strategies. Retrieved from http://www.kfw-entwicklungsbank.de/EN_Home/Topics/Poverty_and_MDG/Pro-PoorGr77/oppgtunisia.pdf.
Aydin, Ö., and U. Dumlu. (2008). Estimation of Gini coefficient by econometric models for Turkey for the year 2006. Ege Academic Review 8 (1), 373 – 393.
Baccouche, R. and Boughzala, M. (2003). What causes unemployment hysteresis in Tunisia? Retrieved from
http://depot.gdnet.org:6666/newkb/fulltext/Boughzala_unemployment.pdf
Bernal, R. (2009). The Informal Labor Market in Colombia: Identification and Characterization. Desarrollo y Sociedad, forthcoming.
Bernal, R. and Cardenas, M. (2004). Determinants of Labor Demand in Colombia: 1976-1997. in Heckman, J.J., and Pagés, C., Law and Employment: Lessons from Latin America anda the Caribbean, National Bureau of Economic Research (NBER) conference report. University of Chicago Press.
Betcherman, G. (2000a). Structural Unemployment: How Important are Labour Market Policies and Institutions?. Special Issue on Structural Unemployment , Canadian Public Policy, XXVI Supplement.

167
Betcherman, G., and Pagés, C. (2008). Estimating the Impact of Labor Taxes on Employment and the Balances of the Social Insurance Funds in Turkey. World Bank powerpoint presentation. Retrieved from http://siteresources.worldbank.org/INTLM/Resources/390041-1141141801867/2275364-1201636324556/Turkey_Labor_Tax_BBL.pdf
Bibi, S. (2005). When is economic growth pro-poor? Evidence from Tunisia. Working Paper 05-22. CIRPÉE (Centre interuniversitaire sur le risque, les politiques économiques et l’emploi).
Cardozo, A., and Grosse, M. (2007). Income and non-Income pro-poor growth in Colombia from 1996 to 2005: A multidimensional approach. Retreived from http://www.webmeets.com/files/papers/LACEA-LAMES/2007/614/Income%20and%20Non%20Income%20Pro%20Poor%20Growth%20in%20Colombia.%20A%20Multidimensional%20approach.pdf.
DANE/DNP (2009). Empalme de las series de mercado laboral, pobreza y desigualdad. Bo-gota: Misión para el empalme de las series de empleo, pobreza y desigualdad. Re-trieved from http://www.dnp.gov.co/PortalWeb/LinkClick.aspx?fileticket=sTGqIR2LyJk%3d&tabid=36
de Janvry, A., Finan, F., Sadoulet, E., and Vakis, R., (2006). Can conditional cash transfer programs serve as safety nets in keeping children at school and from working when exposed to shocks?. Journal of Development Economics, Vol 79 (2), 349-373.
Dumlu, U. and Aydin Ozlem, (2008). Estimation of Gini Coefficient by Econometric Models For Turkey for the Year 2006. Ege Academic Review, 8 (1), 373 – 393.
Duryea, S., Lam, D., and Levison, D. (2007). “Effects of economic shocks on children’s employment and schooling in Brazil”, J Development Economics, 84(1): 188–214.
See Epifani, P. and Gancia, G.. (2008). The Skill Bias Of World Trade. The Economic Journal, 118, 927–960.
Escribano, A. and Guasch, J. L. (2005). Assessing the Impact of the Investment Climate on Productivity Using Firm-Level Data: Methodology and the Cases of Guatemala, Honduras, and Nicaragua. World Bank Policy Research Working Paper 3621, June.
Erbaykal, E. and Okuyan, H. (2008), “Does Inflation Depress Economic Growth? Evidence from Turkey”, International Research Journal of Finance and Economics, Issue 17. Favro-Paris, Maria Maddalena (2003), “Job Protection Schemes and Unemployment Benefits: Are They Functional Equivalents? Cuaderni di Ricerca, processed, July.
Favro-Paris, Maria Maddalena (2003), “Job Protection Schemes and Unemployment Benefits: Are They Functional Equivalents?, Cuaderni di Ricerca, processed, July.
Fletcher, Kevin (2007), “Unlocking Turkey's Labor Potential,” IMF, 2007, at http://www.imf.org/external/pubs/ft/survey/so/2007/CAR07
168
Förster, M. F. (2000), "Trends and Driving Factors in Income Distribution and Poverty in the OECD Area", OECD Labour Market and Social Policy Occasional Papers, No. 42, OECD Publishing. doi:10.1787/488747757407
Gaviria, A. (2004). Ley 789 de 2002: Funciono o No? Document No. 2004-45, Bogotá: Centro de Estudios Sobre Desarollo Economico. University of the Andes.
Hillebrand, Evan (2008), “The Global Distribution of Income in 2050”, World Development Vol. 36, No. 5, pp. 727–740.
ILO (2009), “Global Employment Trends, January 2009,” Geneva, 2009.
IMF (2009), Global Economic Policies and Prospects, Meeting of the Ministers and Central Bank Governors, March 13–14, 2009, London, U.K., Note by the Staff of the International Monetary Fund
Ince, M. and Demir, M. (2006), “The Determinants Of Female Labor Force: Empirical Evidence From Turkey” (2006), Eskisehir Osmangazi Üniversitesi IIBF Dergisi, Nisan 2006, 1(1), 71-90
Jansen , Marion (2004): “Income Volatility In Small And Developing Economies: Export Concentration Matters,” ERSD, World Trade Organization, Geneva, Switzerland
Kapsos, Steven, (2005), “The employment intensity of growth: Trends and macroeconomic determinants,” ILO, Employment Strategy Department, 2005/12.
Koranchelian, T. and Fanizza, D., (2005). How does employment protection legislation affect unemployment in Tunisia? A search equilibrium approach. IMF Working Paper, WP/05/92, May.
Kugler, A., and Kugler, M. (2003).The Labor Market Effects of Payroll Taxes in a Middle-Income Country: Evidence from Colombia. IZA Discussion Papers, 852. Institute for the Study of Labor (IZA).
Le, Quan V (2004). “Political and Economic Determinants of Private Investment,” Journal of International Development. 16, 589–604 (2004),
Lin, Zhengxi, (2000) “Payroll taxes—recent trends”, Perspectives, Statistics, Canada, Autumn 2000.
Lopez Castaño, H. (2001), “Características y Determinantes de la Oferta Laboral Colombiana y su Relación con la Dinámica del Desempleo,” in Banco de la República, Empleo y Economía (M. Urrutia, ed.).
Características y Determinantes de la Oferta Laboral Colombiana y su Relación con la Dinámica del Desempleo.
Milanovic, Branko (2005). “Worlds apart: Measuring international and global inequalities”, Princeton: Princeton University Press.

169
Mondragon-Velez, Camilo., Peña, Jimena., and Wills, Daniel. (2009). “ LaborMarket Rigidi-ties and Informality in Colombia. Retrieved from <www.cid.harvard.edu/Economia/XPena%20revised%20sept2009.pdf>
Montenegro, Santiago (2006), “Estimaciones pobreza e indigencia en Colombia 2005 III tri-mester, DNP, January.
Muller, Christophe and Nordman, Christophe (2005): “Human Capital and Wages in Two Leading Industries of Tunisia: Evidence from Matched Worker-Firm Data,” Instituto Valenciano de Investiga-ciones Económicas.
Nas, T. F. and Perry, M..J. (undated), “Inflation and Output Growth in Turkey, 1963-1999,”University of Michigan-Flint.
Nina Baltazar, Esteban., Grillo, Santiago., and Karpf, Elizabeth. (2007). “ ¿Cuál Es El Mejor Indicador De Pobreza En Colombia Para La Orientación Del Gasto Público Social?” Papel Político. Bogotá (Colombia), Vol. 12, No. 1, 117-144, Enero-Junio 2007.
Nunez, J. (2005). Successes and Failures of the Labor Market Reform in Colombia. Colombia: Universidad de los Andes. Retrieved from http://www.banrep.gov.co/documentos/seminarios/pdf/nunezreforma2005.pdf
Republic of Tunisia (2007), “Assessing Development strategies to Achieve MDGs in the Arab Region,” Powerpoint presentation, available in < www.un.org/.../presentations/tunis_country_presentation_2april07.pps>
Pamuk, S. (2007). Economic change in twentieth-century Turkey: is the glass more than half full? Retrieved from http://www.ata.boun.edu.tr/Faculty/Sevket%20Pamuk/publications/2007-Camb%20Hist%20Turkey-pamuk.pdf.
Perry, Guillermo E. Maloney, William. Arias, Omar S. Fajnzylber, Pablo. Mason, Andrew D. Saavedra-Chanduvi, Jaime. (2007). “Informality; Exit and Exclusion”, The World Bank.
Tansel, Ansit (2002), “Economic Development and Female Labor Force Participation in Turkey: Time Series Evidence and Cross-Province Estimates,” Economic Research Center (ERC), Middle Eastern Technical University, ERC Working Papers in Economics 01/05 (May 2002).
Tansel, Ansit (2004), “Education and Labor Market Outcomes in Turkey,” June 2004, p. 75, prepared as a background paper for the World Bank Education Sector Study (2005) and distributed as part of Volume 2 of that report.
Umaña, C. M. (2003). Child Labour and the Economic Recession of 1999 in Colombia. Revista de Economia del Rosario, 6(2), 139-178.
The World Bank. 2008a. Colombia: Inputs for Sub-Regional Competitiveness Policies. World Bank Report No. 42269-CO.

170
________. 2008b. CPS Completion Report-IEG Review. World Bank IEG Report No. R2008-0047/1.
________. (2008c. Tunisia’s Global Integration: Second Generation of Reforms to Boost, Growth and Employment, Social and Economic Development. World Bank Report No. 40129-TN.
________. (2008d. Turkey - Country Partnership Strategy. World Bank Board Document No. R2008-0015; IFC/R2008-0015; MIGA/R2008-0001.
________. (2008e. Turkey: Country Economic Memorandum Sustaining High Growth: Selected Issues. World Bank Report No. 39194-TR.
________. 2007a. Turkey – Investment Climate Assessment, Report No. 41611-TR, in two volumes (Washington: World Bank, November 2007).
________. 2007b. “Turkey : Higher Education Policy Study,” Report No. 39674-TR.
________. 2007c. ”Development Results in Middle-Income Countries: An Evaluation of the World Bank’s Support,” Independent Evaluation Group.
________. 2006a. The World Bank in Turkey: 1993-2004, An IEG Country Assistance Evaluation. Washington: Report No. 36584-TR.
________. 2006b. “Turkey Labor Market Study, Report No. 33254-TR.
________. 2006c. “Turkey Country Economic Memorandum: Promoting Sustained Growth and Convergence with the European Union.” (in two volumes) Volume II: Expanded Report, Report No. 33549-TR, The World Bank, 2006.
________. 2005a. “Labor Market Adjustment, Reform, and Productivity in Colombia” (in two volumes), Report No. 32068-CO.
________. 2005b. Turkey - Education sector study : sustainable pathways to an effective, equitable and efficient education system for preschool through secondary school education. Washington: Report No. 32450-TR.
________. 2005c. “Turkey: Joint Poverty Assessment Report,” Report No. 29619-TU.
________. 2004. Republic of Tunisia Employment Strategy, (in two volumes), Report No. 25456-TUN.
________. 2003a. “Turkey Country Economic Memorandum: Towards Macroeconomic Stability and Sustained Growth,” (in three volumes). Report No. 26301.
________. 2003b. “Turkey – Poverty and Coping After Crises,” Report No. 24185-TR.
________. 2003c. “Republic of Tunisia: Poverty Update, MENA Region Social and Economic Development Group, Washington, DC.

171
________. 2002a. “ Colombia – Social Safety Net Assessment,”, Report No. 22255-CO.
________. 2002b. “Colombia Poverty Report”, Report No. 24524-CO
________. 2000a. “Turkey : Country Economic Memorandum - Structural Reforms for Sustainable Growth” (in two volumes, Report No. 20657-TR.
________. 2000b. “Turkey - Economic reforms, living standards and social welfare study, “ Report No. 20029-TR. The World Bank (2002a), “Colombia Poverty Report,” Report No. 24524-CO.
________. 1996. “Turkey – Challenges for Adjustment,” Report No. 15076-TR, April.
________. 1995. “Republic of Tunisia Poverty Alleviation: Preserving Progress while Prepar-ing for the Future,” Report No. 13993-TUN, August 1995.
________. 1993. Turkey - Recent economic developments. Report No. 1 1903-TU.

172
ENDNOTES
Chapter 1
1. Table 1.1 draws on internal Bank presentations on the MILES framework.
2. The review ranked employment performance indicators for all countries with available information in order to determine which countries presented significant recent shifts in such indicators. The re-view resulted in a pre-selection of 15 cases. This was followed by a discussion of the cases and a se-lection of countries that would be likely to offer the most useful lessons.
3. In 2008, the Bank had 19 active projects with undisbursed amounts of $1.6 billion in Colombia; 14 active projects with undisbursed amounts of $0.5 billion in Tunisia; and 14 active projects with un-disbursed amounts of $4.0 billion in Turkey. Lending and AAA activities in the three countries are listed in Appendixes C, G, and K and summarized in the country ratings tables that follow the Evalu-ation Summary.
4. See Independent Evaluation Group, ”Development Results in Middle-Income Countries: An Eval-uation of the World Bank’s Support,” The World Bank, 2007.
Chapter 2
1. Although the Bank's activities helped Colombia reduce its fiscal deficit and public debt, the Bank was less successful in helping Colombia to address some fiscal rigidities that contribute to the contin-ued reliance on high payroll charges. These charges make it difficult to reverse the high levels of in-formality in Colombia's labor markets.
2. There are limits to what an external agency such as the Bank can do to address politically sensitive policy issues. The Bank's policy work correctly diagnosed the underlying issues. However, many stakeholders interviewed in Colombia said that a bolder use of its convening power would be useful--especially to help lay the groundwork for future policy reforms.
3. The main concern expressed by those interviewed in Colombia was not about the current costs of the CCT but about the implications of the program's continuing rapid growth and the lack of a clear exit strategy. The various Bank documents discussing the CCT do not contain any overall analysis of these medium-term costs, despite the rapid expansion of the program.
4. Low-quality self-employment and other forms of informality of employment are high by interna-tional standards, accounting for about 55-75 percent of total employment depending on how infor-mality is measured. Bernal (Bernal (2009)) discusses 27 possible definitions of worker informality in Colombia. The Bank’s 2008 report on Informality in Colombia, which classified workers as informal if they did not contribute to both contributory health and pension schemes, estimates that, taking ac-count of per capita income levels, informality in Colombia is about 20 percentage points higher than would be expected based on cross-country comparisons (The World Bank, 2008a).
5. As estimated by the Bank (World Bank, 2002a), p. 57.
6. See (World Bank, 2008b), p. 2.
7. Colombia also negotiated a series of arrangements with the IMF during this period, all of which were treated as precautionary (that is, the government announced it did not intend to draw on the resources).
8. The World Bank (2008a).
9. Some areas of social protection where the Bank has made significant contributions (such as child nutrition) are not discussed because they do not have a direct link to labor market issues.
continued

173
10. The United States also provided some initial financing.
Chapter 3
1. There is no question that there has been a major decline in poverty since 1980. However, the period 1990-95 included three consecutive years of severe drought and of a drop in production of almost 25 percent during the years 1993-95 affecting the rural sector, where most of the poor live. Accordingly, Ayadi et al. (2005) estimated an increase in poverty between 1990 and 1995, when a lower poverty line was used; alternatively, there was a decline in poverty when a higher poverty line was used. Other recent research by Muller (2007) suggests that poverty remained stable for a low poverty line and increased for a higher poverty line.
2. See Jansen (2004).
3. See Baccouche and Boughzala (2003).
4. In Tunisia, a holder of the Baccalaureate has a virtually automatic right of entry into a university.
5. According to the tracer study, which covered graduates for 2004, only 43 percent of all 2004 gra-duates had found employment 18 months after graduating and 62 percent after 40 months. Fifty-four percent of the latter group were engaged by the public sector, 12 percent with regular, indefinite con-tracts in the private sector, 19 percent with fixed-term contracts, 5 percent under subsidized arrange-ments, and 10 percent without a contract. About 15 percent of those employed after 40 months, most-ly in the private sector, found themselves with a mismatch between the tasks they perform and the skills they had acquired. In nearly all cases, this involves a de facto downgrading. These data suggest the possible effects of gaps in education. The indicated paucity of regular contracts in the private sec-tor is likely to be influenced by Tunisia’s rigid labor regulations, which lead many workers to the in-formal sector. Although available data does not distinguish between formal and informal sector em-ployment, anecdotal information and data on work status indicates a substantial amount of employment in the informal sector. Workers reporting themselves as self-employed account for just over 25 percent of the labor force in work.
6. See Alter Chen, Jhabvala, and Lund (2002), Table 3, p. 27.
7. For example, the third and final tranche of ECAL III was canceled because of serious doubts con-cerning the bidding process for the second (Global System for Mobile Communications (GSM) li-cense. This was done in the face of strong Tunisian protest and despite the fact that, apart from the bidding process, the transaction achieved its objectives—the successful bidder is a reputable firm, and much needed competition was introduced into the telecoms sector.
8. This technical assistance has been normally financed by the Bank’s budget or by resources made available by other partners but managed by the Bank.
Chapter 4
1. An earlier headcount poverty calculation for 1987 used the 1994 methodology but a less complete survey. It was estimated that in 1987, 38.5 percent of the population was living in poverty, suggesting a significant decline in poverty over the past three decades. Some earlier, but less well documented, estimates show headcount poverty reductions occurring since the early 1970s.
2. Table L.2 and Table L.3 (Appendix L) presents details on labor force participation rates and em-ployment-to-population ratios.
3. An employment reform in 2008 reduced labor taxes.
continued

174
4. See Fletcher (2007).
5. In addition to more general analyses, some specific studies include: Tansel (2002) and Ince, Meltem and Demir, M. Hulusi (2006).
6. See Tansel (2002), p. 20. A related study by the same author Tansel (2004) presents evidence from analysis of the 2002 Household Budget Survey (HBS) data that demonstrate a higher rate of return to education for women than for men.
7. The World Bank (2008d), p. 27. A planned second programmatic Competitiveness and Employ-ment Development Policy Loan (CEDPL2) is intended to address labor market issues.
8. Environmental protection and natural resource management have also been consistent pillars in the Bank’s strategy, as evidenced in successive CASs.
9. The major exceptions are environment and health.
10. A good example is The World Bank (1996).
11. This work included 1993, 1996, and 1997 reports that had developed a solid knowledge of Tur-key’s macroeconomic challenges during the years preceding the structural reforms.
12. In the Bank-Fund discussions on the initial stabilization measures, and the accompanying Stand-By Arrangement (SBA) and ERL, the Bank team wanted banking sector issues addressed up front in the first SBA. However, the Fund decided to leave these related measures for later. The failure to ad-dress such problems up front ultimately contributed to the 2001 crisis.
13. The reform package is described in more detail in The World Bank (2008e), Box 5, p. 33.
14. Specifically, this research focused on two questions: (i) what would be the employment impacts of a reduction in labor taxes and; (ii) what would be the fiscal implications? In order to answer these questions, the research included quantitative estimates of labor demand elasticities and simulated fis-cal effects using World Bank social insurance models.
15. See The World Bank (2006a), pp. 45-47.
Chapter 5
1 Annex N provides more detail on these issues.
2. See Pamuk, Sevket (2007), p. 269.
3. See, for example, Betcherman, Gordon (2000).
4. Private investment is sensitive to economic and political risk. See Le, Quan V. (2004), a paper that analyzes private investment in a set of 19 countries that include Colombia, Tunisia and Turkey. In-creased macroeconomic and political instability will raise risk. investment because it raises risk
5. For example, an OECD study for the late 1990s ranked Turkey near the top of labor rigidity: see The World Bank (2003a), Volume II: Main Report, Table 5.2, p 92. More recent indicators actually suggest that in the late 1990s Turkey’s labor regime was relatively less rigid, although it hardened during the decade.
6. See Favro-Paris (2003). Fig. 1, p. 32. In this paper, Turkey ranks at the top on the strictness of em-ployment protection legislation in a sample of 27 primarily developed economies.
7. See World Bank (2000a), Main report.
8. See ILO (2009) p. 34.
9. See IMF (2009)
continued

175
10. See ILO (2009) p. 38.
Appendix N
1 Gender, Youth, Ethnic Groups and Intercultural Relations, Culture Demography and Development, Science and Technology, Migration Policy, Foundations and Cooperatives, Promotion of Economic Solidarity, International and Regional Dimensions of Development. (CAS, p.10)
1 See Bibi (2005) and Ayadi et.al. (2004)
2 See Pamuk, Sevket (2007). p. 269.
3 See, for example, Betcherman, Gordon (2000a).
4 See Akkemik (2007), pp. 65-74. Note that this econometrically calculated partial elasticity, which in-cludes lagged effects, is not comparable to the elasticities calculated by Kapsos (2005), which are total contemporaneous arc or point elasticities.
5 See, for example, Erbaykal and Okuyan (2008), and Nas and Perry (undated).
6 The World Bank (2006a), p.13.
7 Ibid. p. 22.
8 See Epifani and Gancia(2008), Figure 5, p.950.
9 Private investment is sensitive to economic and political risk. See Le (2004), a paper that analyzes private investment in a set of 19 countries that includes Colombia, Tunisia and Turkey. Increased ma-croeconomic and political instability will reduce investment because it raises risk. 10 The Doing Business surveys cover conditions for starting a business, registering property, getting credit, protecting investors, paying taxes, trading across borders, enforcing contracts, and closing a business.
11 See Escribano and Guasch (2005).
12 The World Bank (2008e), p. 107. Confidence on price elasticities of employment has been slow to build. It is interesting to note though that the Bank’s former employment report was less sanguine on the possible effect of lowering labor taxes than the 2008 report and then the CEM that were simulta-neously prepared. See The World Bank (2006b), p. 32 and The World Bank (2006c), p. 140. 13 For example, an OECD study for the late 1990s ranked Turkey near the top of labor rigidity; see The World Bank (2003a) Table 5.2, p 92. More recent indicators actually suggest that in the late 1990s Turkey’s labor regime was relatively free, although it hardened during the decade.
14 See Lin (2000), Table 2, p.29. 15 See The World Bank (2005a) Volume II, Box 3.5, p. 35.
16 See OECD, “Evolution of the tax burden, 2000-2005 “ http://www.oecd.org/dataoecd/50/41/36371703.pdf 17 See The World Bank (2008c), P.43. See also The World Bank (2004) p. 44, footnote 45.
18 For example, an OECD study regarding the late 1990s ranked Turkey near the top of labor rigidity; see The World Bank (2003a) Table 5.2, p 92. More recent indicators actually suggest that in the late 1990s, Turkey’s labor regime was relatively free, although it hardened during the decade.
19 See Koranchelian and Fanizza (2005).
continued

176
20 See Favro-Paris (2003), Fig 1, p.32. In this paper, Turkey ranks at the top in terms of the strictness of employment protection legislation in a sample of 27 primarily developed economies.
21 See The World Bank (2000b), Main report.
22 See, for example, Umaña (2003) and Duryea et. al. (2007).
23 See de Janvry et. al. (2006).
24. See ILO (2009) p. 34.
25. See IMF (2009)
26. See ILO (2009) p. 38.