Embed Size (px)
Citation preview
1
Earnings of FY2016/3 1H
Oct. 28, 2015FORWARD-LOOKING STATEMENTSForward-looking statements, such as those relating to earnings forecasts and other projections contained in this material, are management’s current assumptions and beliefs based on currently available information. Such forward-looking statements are subject to a number of risks, uncertainties, and other factors. Accordingly, actual results may differ materially from those projected due to various factors.

2
2
Consolidated Performance for FY2016/3 1HConsolidated Performance for FY2016/3 1H((Apr. 2015 Apr. 2015 –– Sep. 2015Sep. 2015))
Performance Summary of FY2016/3 1HPerformance Summary of FY2016/3 1H
(Billions of yen)
FY2015/3 1H FY2016/3 1H Change
1,182.9 1,226.1 43.2100.0% 100.0% +3.6%71.6 80.7 9.16.1% 6.6% +12.7%
75.8 84.6 8.86.4% 6.9% +11.6%
40.6 46.9 6.33.4% 3.8% +15.8%
Exchange US$/¥ ¥103 ¥122 +¥19Rates €/¥ ¥139 ¥135 -¥4
Note: Analysis of operating income (YoY) Exchange rate fluctuations:¥+3.2 billion, Raw material prices: ¥+1.9 billion
¥84.13 ¥98.84
Revenue
Income before Income Taxes
Operating Income
Net Income Attributable toFUJIFILM Holdings
Net Income Attributable toFUJIFILM Holdings per Share ¥14.71
Consolidated revenue for the first half of FY2016/3 totaled ¥1,226.1 billion, up ¥43.2 billion compared with the previous fiscal year due to sales increase in such businesses as photo imaging business, medical systems business, graphic systems business and document business.
Operating income totaled ¥80.7 billion, up 12.7% from the previous fiscal year, reflecting such factors as improvement of profitability in each business.
Income before income taxes amounted to ¥84.6 billion, up 11.6% from the previous fiscal year, and net income attributable to FUJIFILM Holdings totaled ¥46.9 billion, up 15.8% from the previous fiscal year.

3
3
Consolidated Revenue and Operating Income by SegmentsConsolidated Revenue and Operating Income by Segments
Performance Summary of FY2016/3 1HPerformance Summary of FY2016/3 1H
(Billions of yen)1H
FY2015/3 FY2016/3Imaging Solutions 168.9 173.1 4.2 (+2.4%)
Information Solutions 443.6 460.4 16.8 (+3.8%)
Document Solutions 570.4 592.6 22.2 (+3.9%)
Total 1,182.9 1,226.1 43.2 (+3.6%)Note: After elimination of intersegment transaction.
(Billions of yen)1H
FY2015/3 FY2016/3Imaging Solutions 4.6 12.4 7.8 ( 2.7times)
Information Solutions 32.4 34.8 2.4 (+7.4%)
Document Solutions 49.7 48.3 (1.4) (-2.7%)
Corporate Expenses &Eliminations (15.1) (14.8) 0.3
Total 71.6 80.7 9.1 (+12.7%)
Change
Change
Revenue
Operating Income
443.6
168.9
570.4
460.4
173.1
592.6
0
100
200
300
400
500
600
ImagingSolutions
InformationSolutions
DocumentSolutions
(bln yen)
Revenue(1H)
4.6
32.4
49.7
12.4
34.8
48.3
0
10
20
30
40
50
ImagingSolutions
InformationSolutions
DocumentSolutions
(bln yen)Operating
Income(1H)
In the Imaging Solutions segment, revenue amounted to ¥173.1 billion, up 2.4% from the previous fiscal year.Operating income amounted to ¥12.4 billion, which was 2.7 times the level in the previous year.
In the Information Solutions segment, revenue amounted to ¥460.4 billion, up 3.8% from the previous fiscal year. Operating income amounted to ¥34.8 billion, up 7.4% from the previous fiscal year.
In the Document Solutions segment, revenue amounted to ¥592.6 billion, up 3.9% from the previous fiscal year.Operating income amounted to ¥48.3 billion, down 2.7% from the previous fiscal year.
4
4
Summary by Operating SegmentSummary by Operating Segment
Imaging SolutionsImaging Solutions
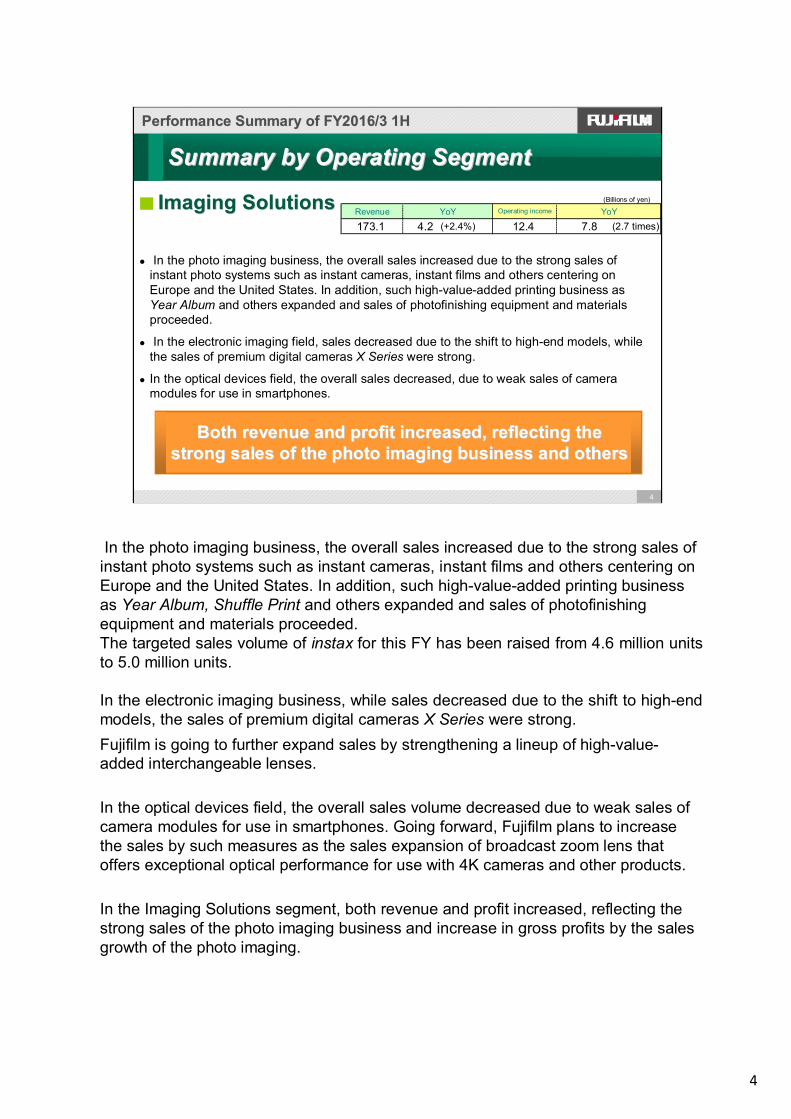
In the photo imaging business, the overall sales increased due to the strong sales of instant photo systems such as instant cameras, instant films and others centering on Europe and the United States. In addition, such high-value-added printing business as Year Album and others expanded and sales of photofinishing equipment and materials proceeded.
In the electronic imaging field, sales decreased due to the shift to high-end models, while the sales of premium digital cameras X Series were strong.
In the optical devices field, the overall sales decreased, due to weak sales of camera modules for use in smartphones.
Both revenue and profit increased, reflecting the Both revenue and profit increased, reflecting the strong sales of the photo imaging business and othersstrong sales of the photo imaging business and others
Performance Summary of FY2016/3 1HPerformance Summary of FY2016/3 1H
(Billions of yen)
173.1 7.8 (2.7 times)12.44.2 (+2.4%)Revenue YoY Operating income YoY
In the photo imaging business, the overall sales increased due to the strong sales of instant photo systems such as instant cameras, instant films and others centering on Europe and the United States. In addition, such high-value-added printing business as Year Album, Shuffle Print and others expanded and sales of photofinishing equipment and materials proceeded.The targeted sales volume of instax for this FY has been raised from 4.6 million units to 5.0 million units.
In the electronic imaging business, while sales decreased due to the shift to high-end models, the sales of premium digital cameras X Series were strong. Fujifilm is going to further expand sales by strengthening a lineup of high-value-added interchangeable lenses.
In the optical devices field, the overall sales volume decreased due to weak sales of camera modules for use in smartphones. Going forward, Fujifilm plans to increase the sales by such measures as the sales expansion of broadcast zoom lens that offers exceptional optical performance for use with 4K cameras and other products.
In the Imaging Solutions segment, both revenue and profit increased, reflecting the strong sales of the photo imaging business and increase in gross profits by the sales growth of the photo imaging.
5
5
Information SolutionsInformation Solutions
Performance Summary of FY2016/3 1HPerformance Summary of FY2016/3 1H
Summary by Operating SegmentSummary by Operating Segment
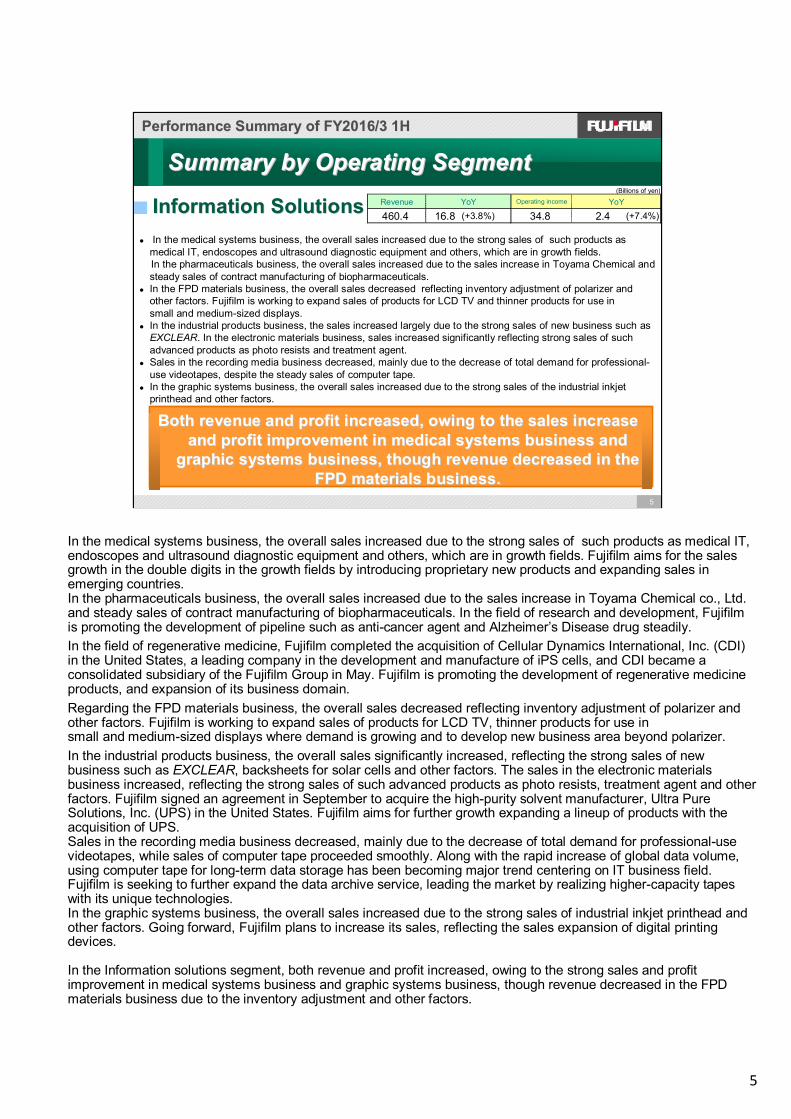
In the medical systems business, the overall sales increased due to the strong sales of such products as medical IT, endoscopes and ultrasound diagnostic equipment and others, which are in growth fields.In the pharmaceuticals business, the overall sales increased due to the sales increase in Toyama Chemical and steady sales of contract manufacturing of biopharmaceuticals.In the FPD materials business, the overall sales decreased reflecting inventory adjustment of polarizer and other factors. Fujifilm is working to expand sales of products for LCD TV and thinner products for use in small and medium-sized displays. In the industrial products business, the sales increased largely due to the strong sales of new business such as EXCLEAR. In the electronic materials business, sales increased significantly reflecting strong sales of such advanced products as photo resists and treatment agent. Sales in the recording media business decreased, mainly due to the decrease of total demand for professional-use videotapes, despite the steady sales of computer tape.In the graphic systems business, the overall sales increased due to the strong sales of the industrial inkjet printhead and other factors.
Both revenue and profit increased, owing to the sales increase Both revenue and profit increased, owing to the sales increase and profit improvement in medical systems business and and profit improvement in medical systems business and
graphic systems business, though revenue decreased in the graphic systems business, though revenue decreased in the FPD materials business.FPD materials business.
(Billions of yen)
2.4 (+7.4%)Operating income YoY
(+3.8%) 34.8Revenue YoY
460.4 16.8
In the medical systems business, the overall sales increased due to the strong sales of such products as medical IT, endoscopes and ultrasound diagnostic equipment and others, which are in growth fields. Fujifilm aims for the sales growth in the double digits in the growth fields by introducing proprietary new products and expanding sales in emerging countries.In the pharmaceuticals business, the overall sales increased due to the sales increase in Toyama Chemical co., Ltd. and steady sales of contract manufacturing of biopharmaceuticals. In the field of research and development, Fujifilm is promoting the development of pipeline such as anti-cancer agent and Alzheimer’s Disease drug steadily.In the field of regenerative medicine, Fujifilm completed the acquisition of Cellular Dynamics International, Inc. (CDI) in the United States, a leading company in the development and manufacture of iPS cells, and CDI became a consolidated subsidiary of the Fujifilm Group in May. Fujifilm is promoting the development of regenerative medicine products, and expansion of its business domain.Regarding the FPD materials business, the overall sales decreased reflecting inventory adjustment of polarizer and other factors. Fujifilm is working to expand sales of products for LCD TV, thinner products for use in small and medium-sized displays where demand is growing and to develop new business area beyond polarizer. In the industrial products business, the overall sales significantly increased, reflecting the strong sales of new business such as EXCLEAR, backsheets for solar cells and other factors. The sales in the electronic materials business increased, reflecting the strong sales of such advanced products as photo resists, treatment agent and other factors. Fujifilm signed an agreement in September to acquire the high-purity solvent manufacturer, Ultra Pure Solutions, Inc. (UPS) in the United States. Fujifilm aims for further growth expanding a lineup of products with the acquisition of UPS.Sales in the recording media business decreased, mainly due to the decrease of total demand for professional-use videotapes, while sales of computer tape proceeded smoothly. Along with the rapid increase of global data volume, using computer tape for long-term data storage has been becoming major trend centering on IT business field. Fujifilm is seeking to further expand the data archive service, leading the market by realizing higher-capacity tapes with its unique technologies.In the graphic systems business, the overall sales increased due to the strong sales of industrial inkjet printhead and other factors. Going forward, Fujifilm plans to increase its sales, reflecting the sales expansion of digital printing devices.
In the Information solutions segment, both revenue and profit increased, owing to the strong sales and profit improvement in medical systems business and graphic systems business, though revenue decreased in the FPD materials business due to the inventory adjustment and other factors.
6
6
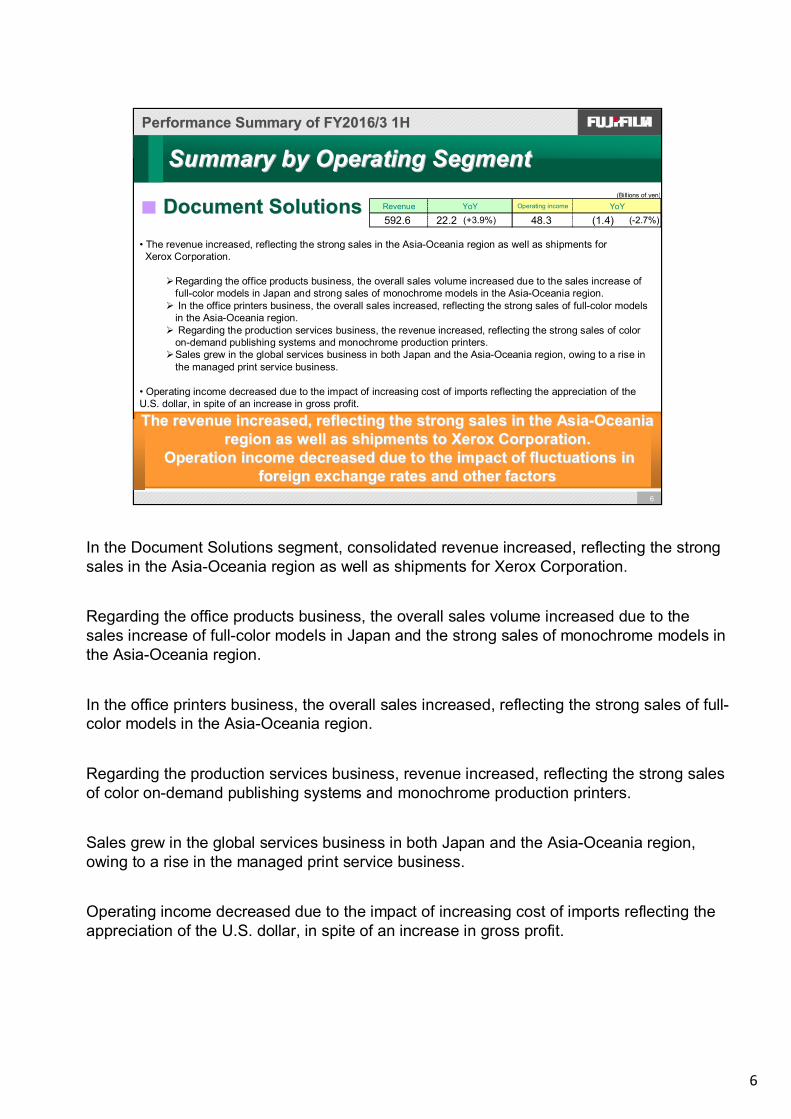
• The revenue increased, reflecting the strong sales in the Asia-Oceania region as well as shipments for Xerox Corporation.
Regarding the office products business, the overall sales volume increased due to the sales increase of full-color models in Japan and strong sales of monochrome models in the Asia-Oceania region.In the office printers business, the overall sales increased, reflecting the strong sales of full-color models
in the Asia-Oceania region.Regarding the production services business, the revenue increased, reflecting the strong sales of color
on-demand publishing systems and monochrome production printers. Sales grew in the global services business in both Japan and the Asia-Oceania region, owing to a rise in the managed print service business.
• Operating income decreased due to the impact of increasing cost of imports reflecting the appreciation of the U.S. dollar, in spite of an increase in gross profit.
Document SolutionsDocument Solutions
The revenue increased, reflecting the strong sales in the AsiaThe revenue increased, reflecting the strong sales in the Asia--Oceania Oceania region as well as shipments to Xerox Corporation.region as well as shipments to Xerox Corporation.
Operation income decreased due to the impact of fluctuations inOperation income decreased due to the impact of fluctuations inforeign exchange rates and other factorsforeign exchange rates and other factors
Performance Summary of FY2016/3 1HPerformance Summary of FY2016/3 1H
Summary by Operating SegmentSummary by Operating Segment(Billions of yen)
(1.4) (-2.7%)592.6 22.2 (+3.9%) 48.3Revenue YoY Operating income YoY
In the Document Solutions segment, consolidated revenue increased, reflecting the strong sales in the Asia-Oceania region as well as shipments for Xerox Corporation.
Regarding the office products business, the overall sales volume increased due to the sales increase of full-color models in Japan and the strong sales of monochrome models in the Asia-Oceania region.
In the office printers business, the overall sales increased, reflecting the strong sales of full-color models in the Asia-Oceania region.
Regarding the production services business, revenue increased, reflecting the strong sales of color on-demand publishing systems and monochrome production printers.
Sales grew in the global services business in both Japan and the Asia-Oceania region, owing to a rise in the managed print service business.
Operating income decreased due to the impact of increasing cost of imports reflecting the appreciation of the U.S. dollar, in spite of an increase in gross profit.
7
7
Consolidated Balance SheetConsolidated Balance SheetPerformance Summary of FY2016/3 1HPerformance Summary of FY2016/3 1H
(Billions of yen)
Mar. 14 Mar. 15 Sep. 15 Change fromMar. 15 Mar. 14 Mar. 15 Sep. 15 Change from
Mar. 15Cash and cashequivalents 604.6 726.9 628.5 (98.4) Short-term and
long-term debt 359.7 349.7 352.7 3.0Notes andaccountsreceivable
636.8 681.0 621.2 (59.8)Notes andaccountspayable
265.9 269.0 242.4 (26.6)
Inventories 363.7 372.5 376.4 3.9 Other liabilities 403.2 470.5 438.4 (32.1)Marketablesecurities andother
156.6 162.8 169.0 6.2 Total liabilities 1,028.8 1,089.2 1,033.5 (55.7)
Total current assets 1,761.7 1,943.2 1,795.1 (148.1)
TotalFUJIFILM Holdingsshareholders' equity
2,020.6 2,232.7 2,153.3 (79.4)
Property, plantand equipment 530.3 527.4 527.4 0.0 Noncontrolling
interests 177.6 234.7 234.7 0.0
Goodwill, net 423.1 505.0 528.3 23.3 Total equity 2,198.2 2,467.4 2,388.0 (79.4)Investmentsecuritiesand other
511.9 581.0 570.7 (10.3) Total liabilities andequity 3,227.0 3,556.6 3,421.5 (135.1)
Total noncurrentassets 1,465.3 1,613.4 1,626.4 13.0 (yen)
Total assets 3,227.0 3,556.6 3,421.5 (135.1) Exchange Rates Mar. 14 Mar. 15 Sep. 15 Change fromMar. 15
US$/¥ ¥103 ¥120 ¥120 -€/¥ ¥142 ¥130 ¥135 +¥5
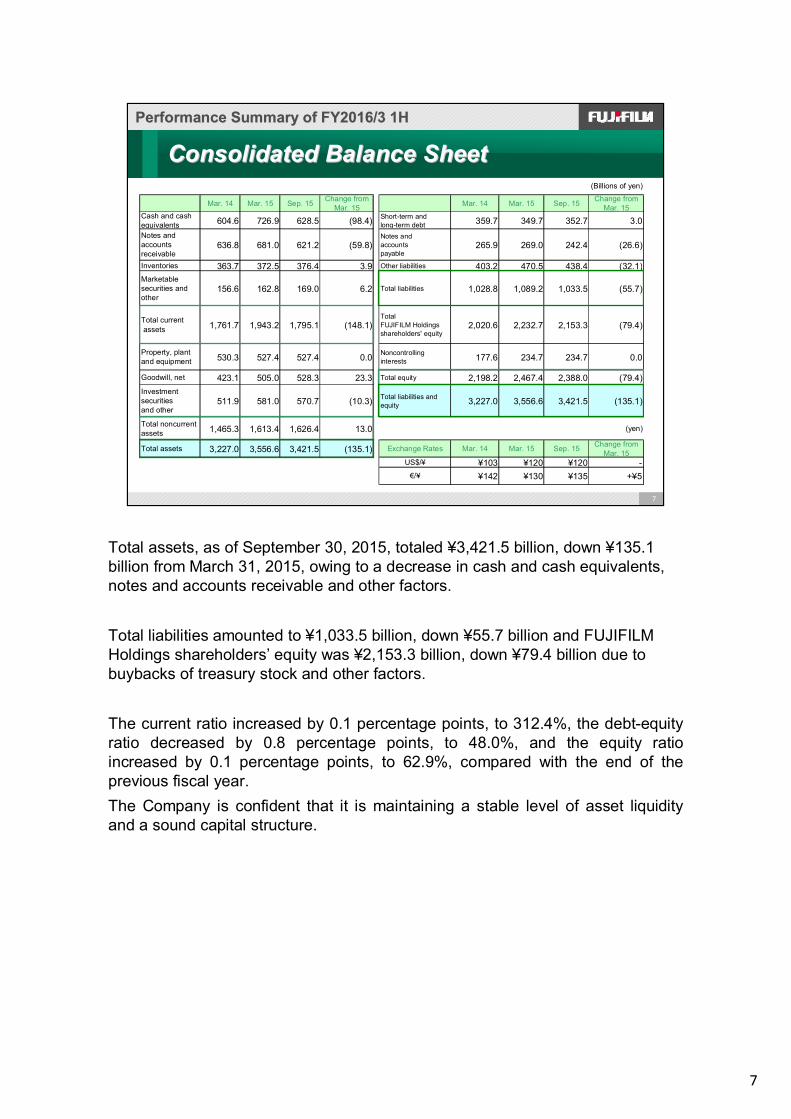
Total assets, as of September 30, 2015, totaled ¥3,421.5 billion, down ¥135.1 billion from March 31, 2015, owing to a decrease in cash and cash equivalents, notes and accounts receivable and other factors.
Total liabilities amounted to ¥1,033.5 billion, down ¥55.7 billion and FUJIFILM Holdings shareholders’ equity was ¥2,153.3 billion, down ¥79.4 billion due to buybacks of treasury stock and other factors.
The current ratio increased by 0.1 percentage points, to 312.4%, the debt-equity ratio decreased by 0.8 percentage points, to 48.0%, and the equity ratio increased by 0.1 percentage points, to 62.9%, compared with the end of the previous fiscal year. The Company is confident that it is maintaining a stable level of asset liquidity and a sound capital structure.
8
8
Cash FlowsCash Flows
Performance Summary of FY2016/3 1HPerformance Summary of FY2016/3 1H
(Billions of yen)FY2014/3
1HFY2015/3
1HFY2016/3
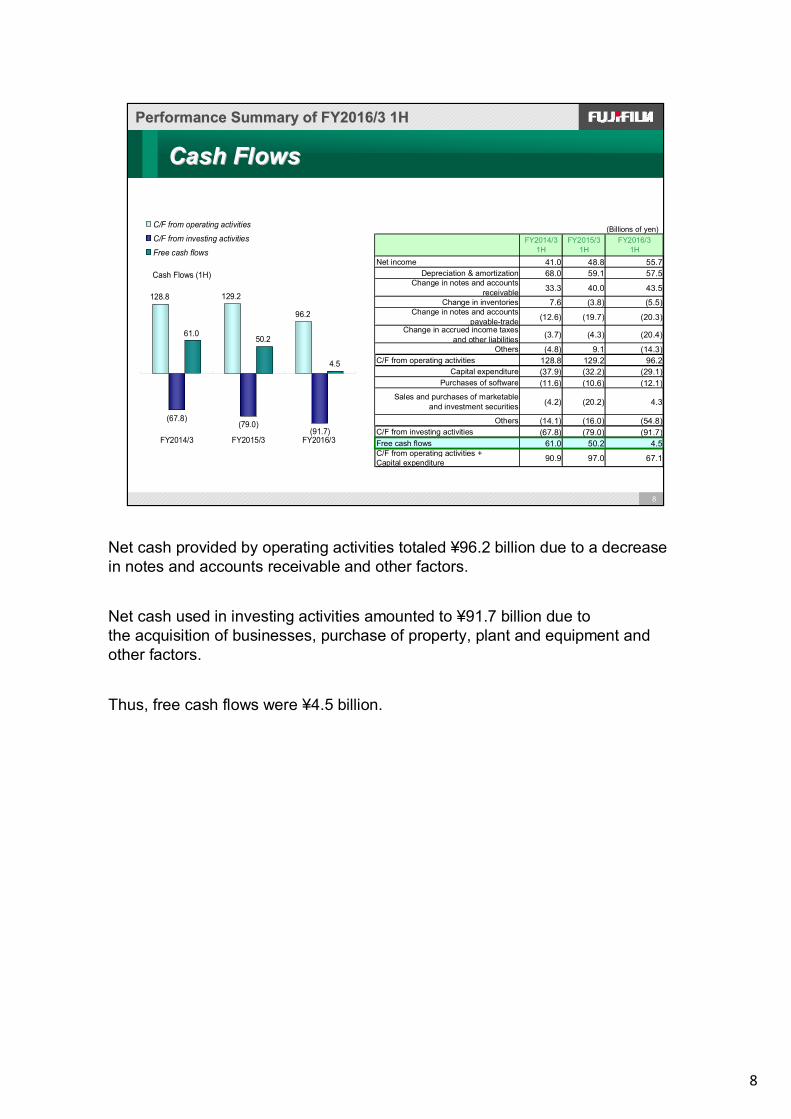
1HNet income 41.0 48.8 55.7
Depreciation & amortization 68.0 59.1 57.5Change in notes and accounts
receivable 33.3 40.0 43.5
Change in inventories 7.6 (3.8) (5.5)Change in notes and accounts
payable-trade (12.6) (19.7) (20.3)Change in accrued income taxes
and other liabilities (3.7) (4.3) (20.4)
Others (4.8) 9.1 (14.3)C/F from operating activities 128.8 129.2 96.2
Capital expenditure (37.9) (32.2) (29.1)Purchases of software (11.6) (10.6) (12.1)
Sales and purchases of marketableand investment securities (4.2) (20.2) 4.3
Others (14.1) (16.0) (54.8)C/F from investing activities (67.8) (79.0) (91.7)Free cash flows 61.0 50.2 4.5C/F from operating activities +Capital expenditure 90.9 97.0 67.1
128.8 129.2
96.2
(67.8)(79.0)
(91.7)
61.050.2
4.5
FY2014/3 FY2015/3 FY2016/3
C/F from operating activitiesC/F from investing activitiesFree cash flows
Cash Flows (1H)
Net cash provided by operating activities totaled ¥96.2 billion due to a decrease in notes and accounts receivable and other factors.
Net cash used in investing activities amounted to ¥91.7 billion due to the acquisition of businesses, purchase of property, plant and equipment and other factors.
Thus, free cash flows were ¥4.5 billion.
9
9
Consolidated Financial Forecast for FY2016/3 Consolidated Financial Forecast for FY2016/3 (as of Oct. 28, 2015)(as of Oct. 28, 2015)
Forecast for FY2016/3Forecast for FY2016/3
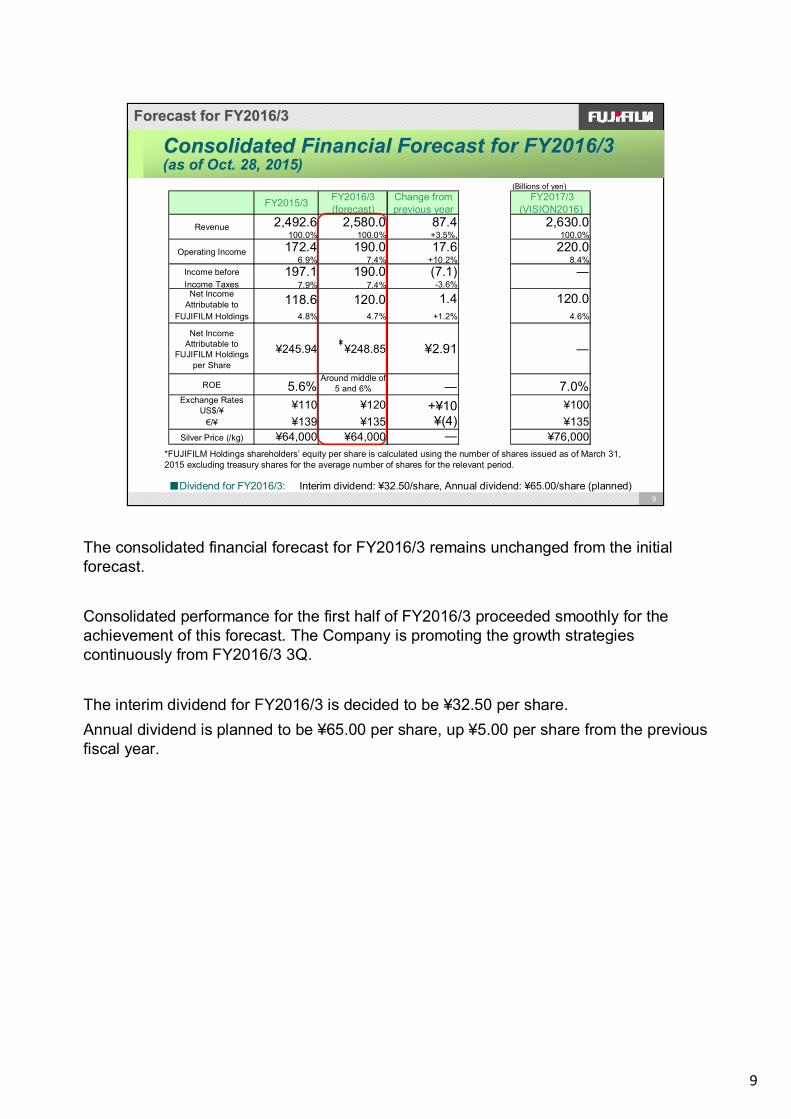
■Dividend for FY2016/3: Interim dividend: ¥32.50/share, Annual dividend: ¥65.00/share (planned)
(Billions of yen)
FY2015/3 FY2016/3(forecast)
Change fromprevious year
FY2017/3(VISION2016)
2,492.6 2,580.0 87.4 2,630.0100.0% 100.0% +3.5%, 100.0%172.4 190.0 17.6 220.0
6.9% 7.4% +10.2% 8.4%Income before 197.1 190.0 (7.1) ―Income Taxes 7.9% 7.4% -3.6%
Net IncomeAttributable to 118.6 120.0 1.4 120.0
FUJIFILM Holdings 4.8% 4.7% +1.2% 4.6%
Net IncomeAttributable to
FUJIFILM Holdingsper Share
¥245.94 ¥248.85 ¥2.91 ―
ROE 5.6%Around middle of
5 and 6% ― 7.0%Exchange Rates
US$/¥ ¥110 ¥120 +¥10 ¥100€/¥ ¥139 ¥135 ¥(4) ¥135
Silver Price (/kg) ¥64,000 ¥64,000 ― ¥76,000
Revenue
Operating Income
*FUJIFILM Holdings shareholders’ equity per share is calculated using the number of shares issued as of March 31, 2015 excluding treasury shares for the average number of shares for the relevant period.
*
The consolidated financial forecast for FY2016/3 remains unchanged from the initial forecast.
Consolidated performance for the first half of FY2016/3 proceeded smoothly for the achievement of this forecast. The Company is promoting the growth strategies continuously from FY2016/3 3Q.
The interim dividend for FY2016/3 is decided to be ¥32.50 per share.Annual dividend is planned to be ¥65.00 per share, up ¥5.00 per share from the previous fiscal year.
10
Corporate Communication Office, Corporate Planning Div.http://www.fujifilmholdings.com/en/index.html
At Fujifilm, we are continuously innovating — creatingnew technologies, products and services that inspire
and excite people everywhere.Our goal is to empower the potential and expand
the horizons of tomorrow’s businesses and lifestyles.

11
11
Earnings for FY2016/3 1H
AppendixAppendix

12
12
FY2016/3 1H AppendixFY2016/3 1H Appendix
Earnings of FY2016/3 2Q/1HEarnings of FY2016/3 2Q/1H
(Billions of yen)
FY2015/3 2Q FY2016/3 2Q Change FY2015/3 1H FY2016/3 1H Change
624.5 635.2 10.7 1,182.9 1,226.1 43.2100.0% 100.0% +1.7% 100.0% 100.0% +3.6%41.8 44.5 2.7 71.6 80.7 9.16.7% 7.0% +6.5% 6.1% 6.6% +12.7%
45.9 40.0 (5.9) 75.8 84.6 8.87.4% 6.3% -13.0% 6.4% 6.9% +11.6%
25.2 22.6 (2.6) 40.6 46.9 6.34.0% 3.6% -10.1% 3.4% 3.8% +15.8%
Exchange US$/¥ ¥104 ¥122 +¥18 ¥103 ¥122 +¥19Rates €/¥ ¥138 ¥136 ¥(2) ¥139 ¥135 -¥4
Note: Analysis of operating income (YoY) Exchange rate fluctuations:¥+3.2 billion, Raw material prices: ¥+1.9 billion
Revenue
Income before Income Taxes
Operating Income
Net Income Attributable toFUJIFILM Holdings
13
13
FY2016/3 1H AppendixFY2016/3 1H Appendix
Earnings of FY2016/3 2Q/1HEarnings of FY2016/3 2Q/1H(Billions of yen)
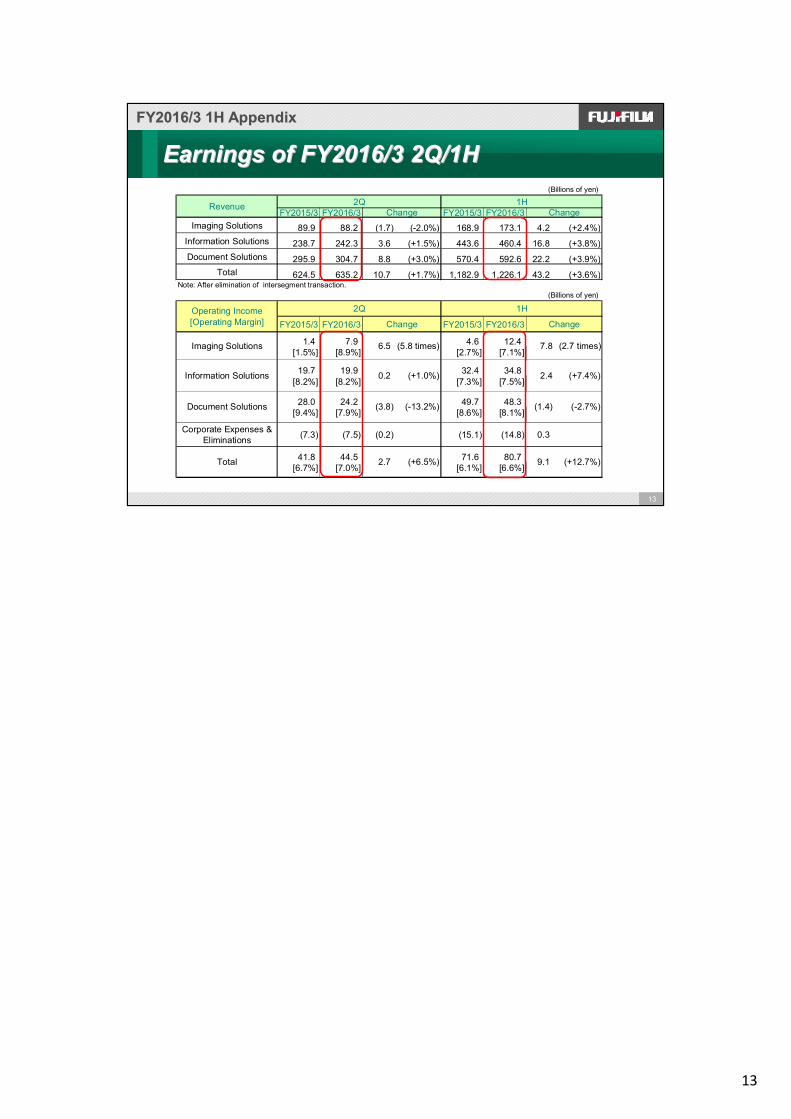
FY2015/3 FY2016/3 FY2015/3 FY2016/3Imaging Solutions 89.9 88.2 (1.7) (-2.0%) 168.9 173.1 4.2 (+2.4%)
Information Solutions 238.7 242.3 3.6 (+1.5%) 443.6 460.4 16.8 (+3.8%)Document Solutions 295.9 304.7 8.8 (+3.0%) 570.4 592.6 22.2 (+3.9%)
Total 624.5 635.2 10.7 (+1.7%) 1,182.9 1,226.1 43.2 (+3.6%)
(Billions of yen)
FY2015/3 FY2016/3 FY2015/3 FY2016/3
1.4 7.9 4.6 12.4[1.5%] [8.9%] [2.7%] [7.1%]
19.7 19.9 32.4 34.8[8.2%] [8.2%] [7.3%] [7.5%]
28.0 24.2 49.7 48.3[9.4%] [7.9%] [8.6%] [8.1%]
Corporate Expenses &Eliminations (7.3) (7.5) (0.2) (15.1) (14.8) 0.3
41.8 44.5 71.6 80.7[6.7%] [7.0%] [6.1%] [6.6%]
Revenue 2Q 1HChange Change
Note: After elimination of intersegment transaction.
Operating Income[Operating Margin]
2Q 1H
Change Change
Imaging Solutions
Information Solutions
Document Solutions
Total
(2.7 times)6.5 (5.8 times)
0.2 (+1.0%)
7.8
2.4
(3.8) (-13.2%)
2.7 (+6.5%)
(1.4)
9.1
(+7.4%)
(-2.7%)
(+12.7%)

14
14
FY2016/3 2Q (3 Months) Performance by Operating SegmentFY2016/3 2Q (3 Months) Performance by Operating Segment
FY2016/3 1H AppendixFY2016/3 1H Appendix
Imaging SolutionsImaging Solutions
Information SolutionsInformation Solutions
Document SolutionsDocument Solutions
In the photo imaging business, the overall sales increased due to the strong sales of instant photo systemscentering on Europe and the United States. In the electronic imaging field, the sales volume of digital camera largely decreased due to the shift to high-end models, compared with the previous year. On the other hand, the sales of X Series especially the new product FUJIFILM X-T10 were favorable.In the optical device field, the sales of camera modules for use in smartphones decreased.
In the medical systems business, especially the sales of ultrasound diagnostic equipment were strong centering on overseas. In the pharmaceuticals business, the overall sales increased due to the sales increase in Toyama Chemical and steady sales of contract manufacturing of biopharmaceuticals.In the FPD materials business, the overall sales decreased reflecting inventory adjustment of polarizer and other factors. In the industrial products business, the overall sales increased largely due to the strong sales of new business such as EXCLEAR and backsheets for solar cell and others. In the electronic materials business, sales increased reflecting strong sales of such advanced products as photo resists and treatment agent.
The overall sales increased, reflecting the strong sales of the office printers business, the production services business and the global services business.Operating income decreased due to the impact of increasing costs of imports reflecting the appreciation of the U.S. dollar.
15
15
Imaging SolutionsImaging Solutions
FY2016/3 1H AppendixFY2016/3 1H Appendix
Earnings of FY2016/3 2Q/1HEarnings of FY2016/3 2Q/1H
(Billions of yen)
2Q 1H
FY2015/3 FY2016/3 Change FY2015/3 FY2016/3 Change
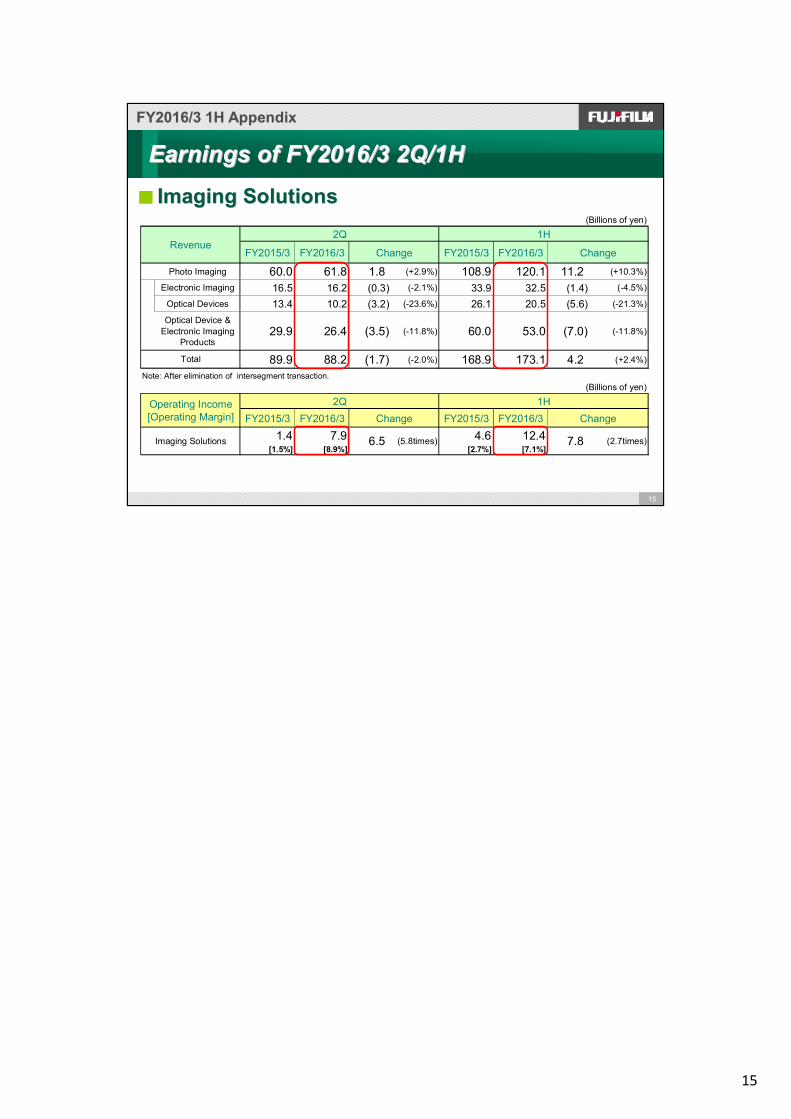
Photo Imaging 60.0 61.8 1.8 (+2.9%) 108.9 120.1 11.2 (+10.3%)
Electronic Imaging 16.5 16.2 (0.3) (-2.1%) 33.9 32.5 (1.4) (-4.5%)
Optical Devices 13.4 10.2 (3.2) (-23.6%) 26.1 20.5 (5.6) (-21.3%)
Optical Device &Electronic Imaging
Products29.9 26.4 (3.5) (-11.8%) 60.0 53.0 (7.0) (-11.8%)
89.9 88.2 (1.7) (-2.0%) 168.9 173.1 4.2 (+2.4%)
Note: After elimination of intersegment transaction.(Billions of yen)
2Q 1HFY2015/3 FY2016/3 Change FY2015/3 FY2016/3 Change
1.4 7.9 4.6 12.4[1.5%] [8.9%] [2.7%] [7.1%]
7.8 (2.7times)(5.8times)6.5
Operating Income[Operating Margin]
Revenue
Imaging Solutions
Total

16
16
12.9 11.8 10.3 10.2
16.5 20.916.3 16.2
60.0
73.8
57.9 58.3 61.8
89.9
107.6
84.5 84.9 88.2
13.4
14.8
7.9
1.4
12.8
3.3
4.5
0
30
60
90
120
14.2Q 14.3Q 14.4Q 15.1Q 15.2Q
Revenue
0.0
5.0
10.0
15.0
20.0
Operating Income
(1.5%)
(11.9%)
(3.9%)
(5.2%)
(8.9%)
Change in Quarterly Earnings by Operating Segment Change in Quarterly Earnings by Operating Segment
Imaging SolutionsImaging Solutions
FY2016/3 1H AppendixFY2016/3 1H Appendix
Photo Imaging
ElectronicImaging
Operating Income for Imaging Solutions(Operating Margin)
Optical Devices
Optical Device & Electronic Imaging
Products
(Billions of yen)

17
17
Information SolutionsInformation Solutions
FY2016/3 1H AppendixFY2016/3 1H Appendix
Earnings of FY2016/3 2Q/1HEarnings of FY2016/3 2Q/1H
(Billions of yen)
2Q 1HFY2015/3 FY2016/3 Change FY2015/3 FY2016/3 Change
96.6 104.0 7.4 (+7.6%) 173.4 192.0 18.6 (+10.7%)
FPD Materials 34.3 24.7 (9.6) (-28.1%) 64.7 45.6 (19.1) (-29.5%)Industrial ProductsElectronic Materials 22.8 26.9 4.1 (+18.0%) 43.0 52.2 9.2 (+21.5%)Highly Functional
Materials 57.1 51.6 (5.5) (-9.7%) 107.7 97.8 (9.9) (-9.2%)
11.9 11.0 (0.9) (-7.0%) 22.4 21.8 (0.6) (-2.3%)
71.8 74.0 2.2 (+2.9%) 137.0 145.5 8.5 (+6.2%)
1.3 1.7 0.4 (+33.8%) 3.1 3.3 0.2 (+6.7%)
238.7 242.3 3.6 (+1.5%) 443.6 460.4 16.8 (+3.8%)
Note: After elimination of intersegment transaction.(Billions of yen)
2Q 1HFY2015/3 FY2016/3 Change FY2015/3 FY2016/3 Change
19.7 19.9 32.4 34.8[8.2%] [8.2%] [7.3%] [7.5%]
Revenue
Healthcare
Recording Media
Graphic Systems
(+7.4%)0.2
OthersTotal
Operating Income[Operating Margin]
Information Solutions 2.4(+1.0%)
18
18
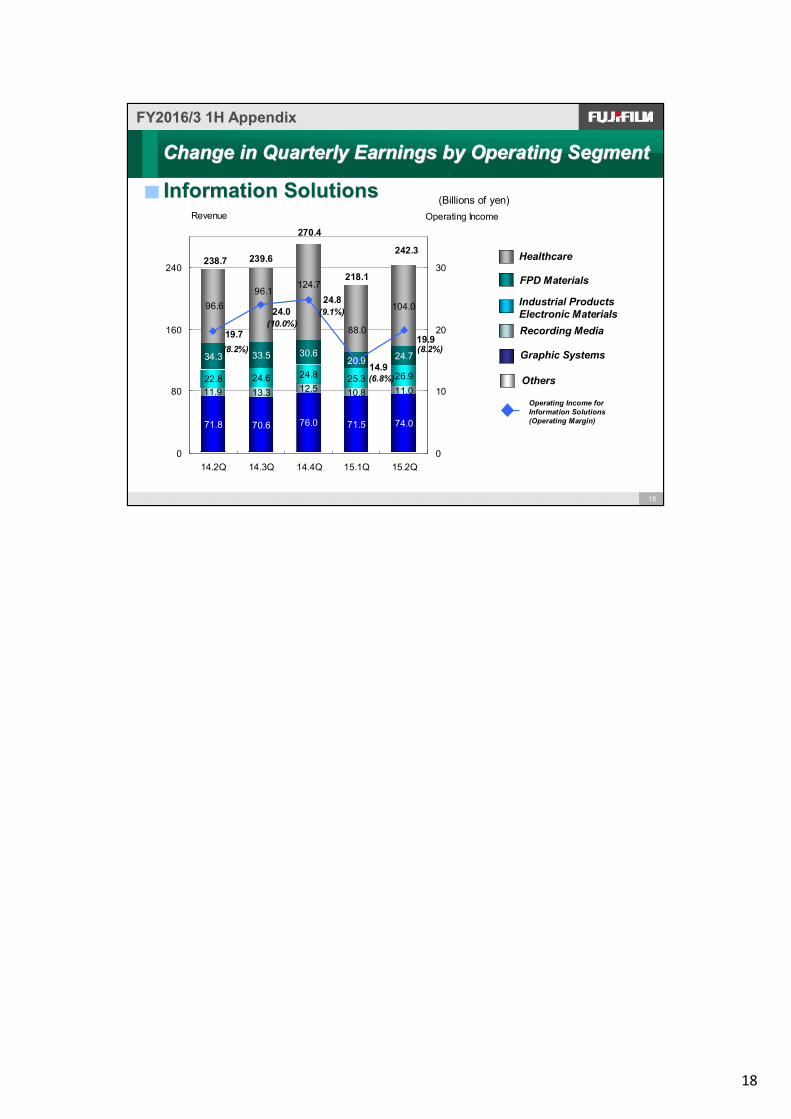
71.8 70.6 76.0 71.5 74.0
13.3 12.5 10.8 11.022.8 24.6 24.8 25.3 26.9
34.3 33.5 30.620.9 24.7
104.0
239.6
11.9
124.7
96.696.1
88.0
242.3238.7
218.1
270.4
24.8
19.7 19.9
14.9
24.0
0
80
160
240
14.2Q 14.3Q 14.4Q 15.1Q 15.2Q
Revenue
0
10
20
30
Operating Income
(8.2%)
(10.0%)(9.1%)
(6.8%)
(8.2%)
Healthcare
Graphic Systems
Information SolutionsInformation Solutions
Change in Quarterly Earnings by Operating Segment Change in Quarterly Earnings by Operating Segment
FPD Materials
Recording Media
Industrial ProductsElectronic Materials
Operating Income for Information Solutions(Operating Margin)
FY2016/3 1H AppendixFY2016/3 1H Appendix
(Billions of yen)
Others
19
19
Document SolutionsDocument Solutions
FY2016/3 1H AppendixFY2016/3 1H Appendix
Earnings of FY2016/3 2Q/1HEarnings of FY2016/3 2Q/1H
(Billions of yen)
2Q 1H
FY2015/3 FY2016/3 Change FY2015/3 FY2016/3 Change
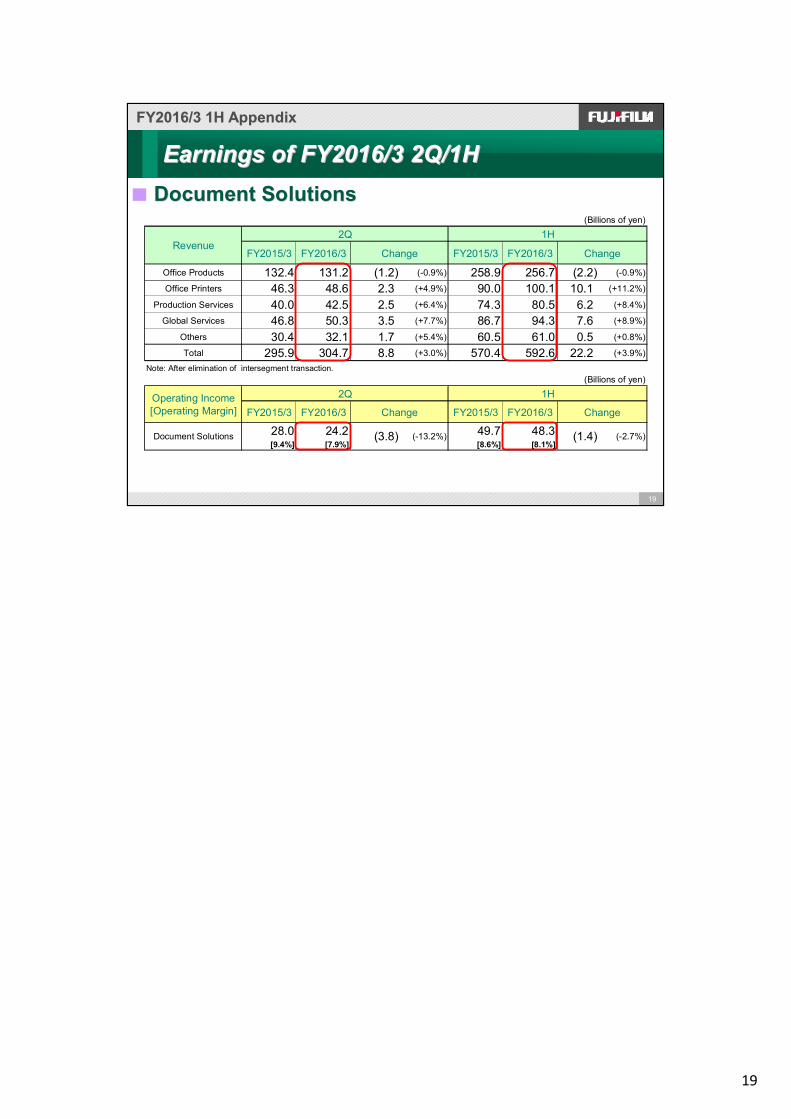
Office Products 132.4 131.2 (1.2) (-0.9%) 258.9 256.7 (2.2) (-0.9%)
Office Printers 46.3 48.6 2.3 (+4.9%) 90.0 100.1 10.1 (+11.2%)
Production Services 40.0 42.5 2.5 (+6.4%) 74.3 80.5 6.2 (+8.4%)
Global Services 46.8 50.3 3.5 (+7.7%) 86.7 94.3 7.6 (+8.9%)
Others 30.4 32.1 1.7 (+5.4%) 60.5 61.0 0.5 (+0.8%)
Total 295.9 304.7 8.8 (+3.0%) 570.4 592.6 22.2 (+3.9%)
Note: After elimination of intersegment transaction.(Billions of yen)
2Q 1H
FY2015/3 FY2016/3 Change FY2015/3 FY2016/3 Change
28.0 24.2 49.7 48.3[9.4%] [7.9%] [8.6%] [8.1%]
(1.4)(-13.2%) (-2.7%)
Revenue
Operating Income[Operating Margin]
Document Solutions (3.8)
20
20
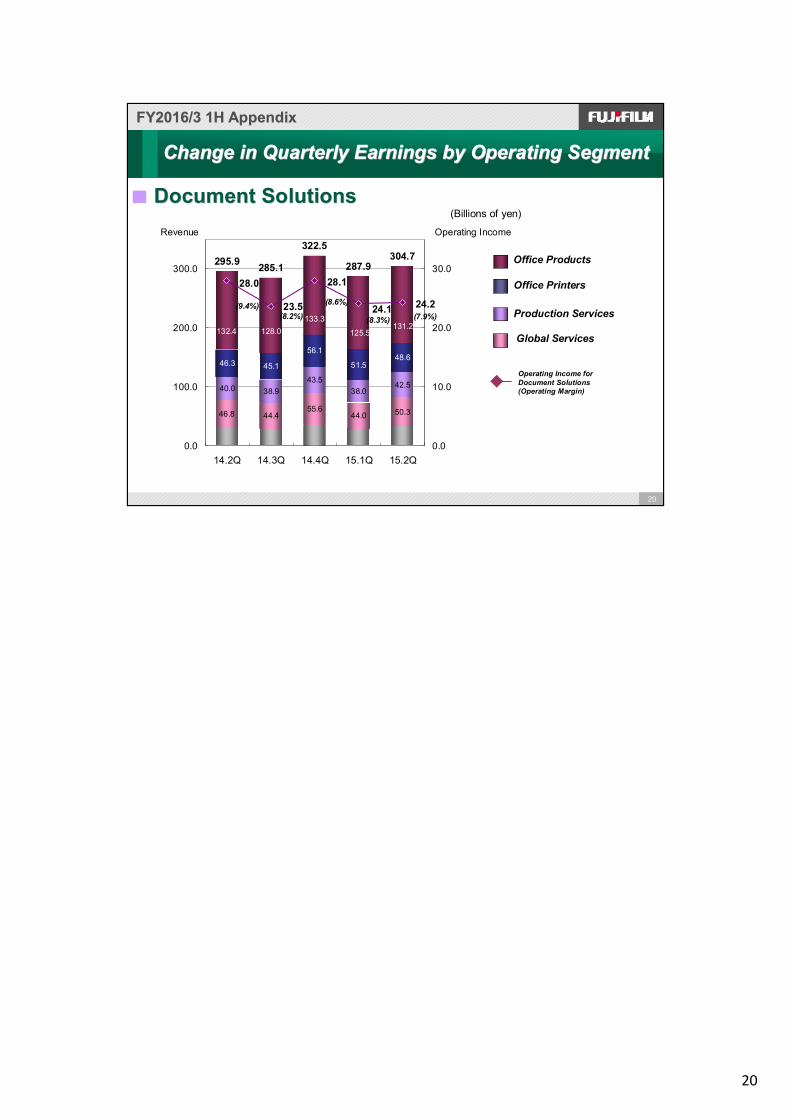
44.455.6
44.0 50.3
40.0 38.943.5
38.042.5
46.3 45.1
56.1
51.548.6
295.9 285.1
322.5
287.9304.7
46.8
128.0132.4 131.2125.5
133.3
24.2
28.0
23.5
28.1
24.1
0.0
100.0
200.0
300.0
14.2Q 14.3Q 14.4Q 15.1Q 15.2Q
Revenue
0.0
10.0
20.0
30.0
Operating Income
(9.4%)(8.2%)
(8.6%)
(8.3%) (7.9%)
Document SolutionsDocument Solutions(Billions of yen)
Change in Quarterly Earnings by Operating Segment Change in Quarterly Earnings by Operating Segment
FY2016/3 1H AppendixFY2016/3 1H Appendix
Office Products
Office Printers
Production Services
Global Services
Operating Income for Document Solutions(Operating Margin)
21
21
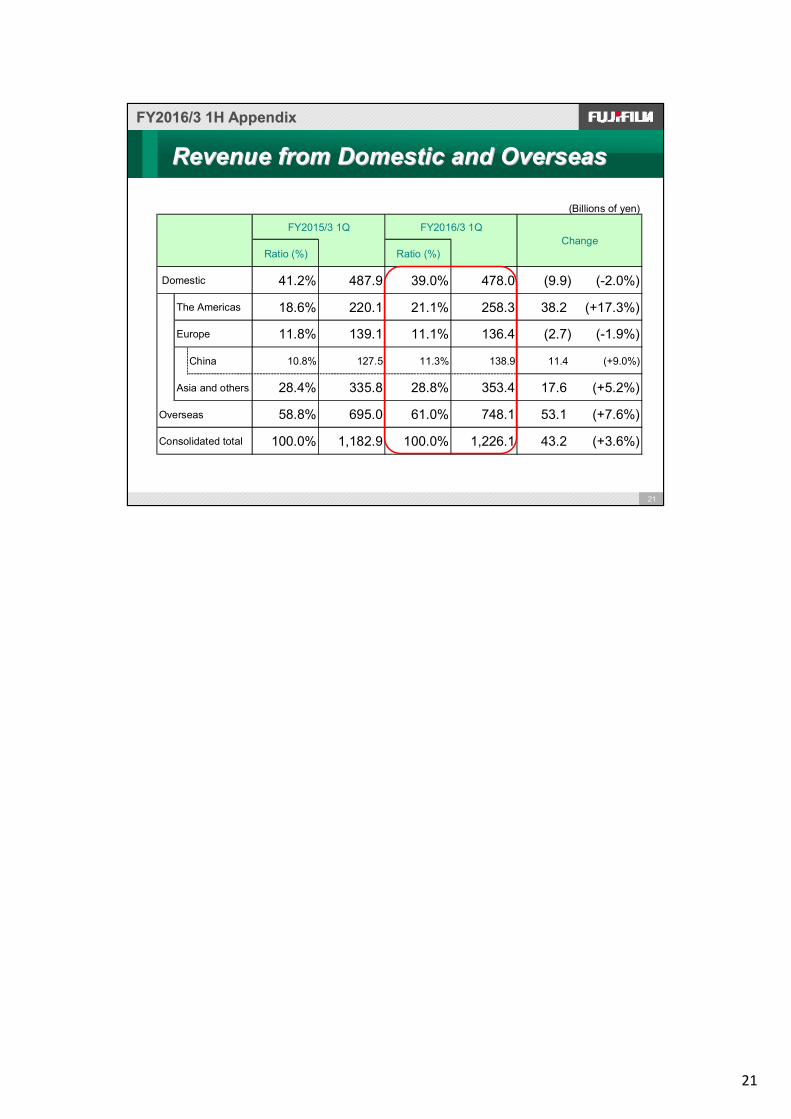
Revenue from Domestic and OverseasRevenue from Domestic and Overseas
FY2016/3 1H AppendixFY2016/3 1H Appendix
(Billions of yen)
Ratio (%) Ratio (%)
41.2% 487.9 39.0% 478.0 (9.9) (-2.0%)
18.6% 220.1 21.1% 258.3 38.2 (+17.3%)
11.8% 139.1 11.1% 136.4 (2.7) (-1.9%)
China 10.8% 127.5 11.3% 138.9 11.4 (+9.0%)
Asia and others 28.4% 335.8 28.8% 353.4 17.6 (+5.2%)
Overseas 58.8% 695.0 61.0% 748.1 53.1 (+7.6%)
100.0% 1,182.9 100.0% 1,226.1 43.2 (+3.6%)
FY2015/3 1Q FY2016/3 1QChange
Europe
Consolidated total
Domestic
The Americas
22
22
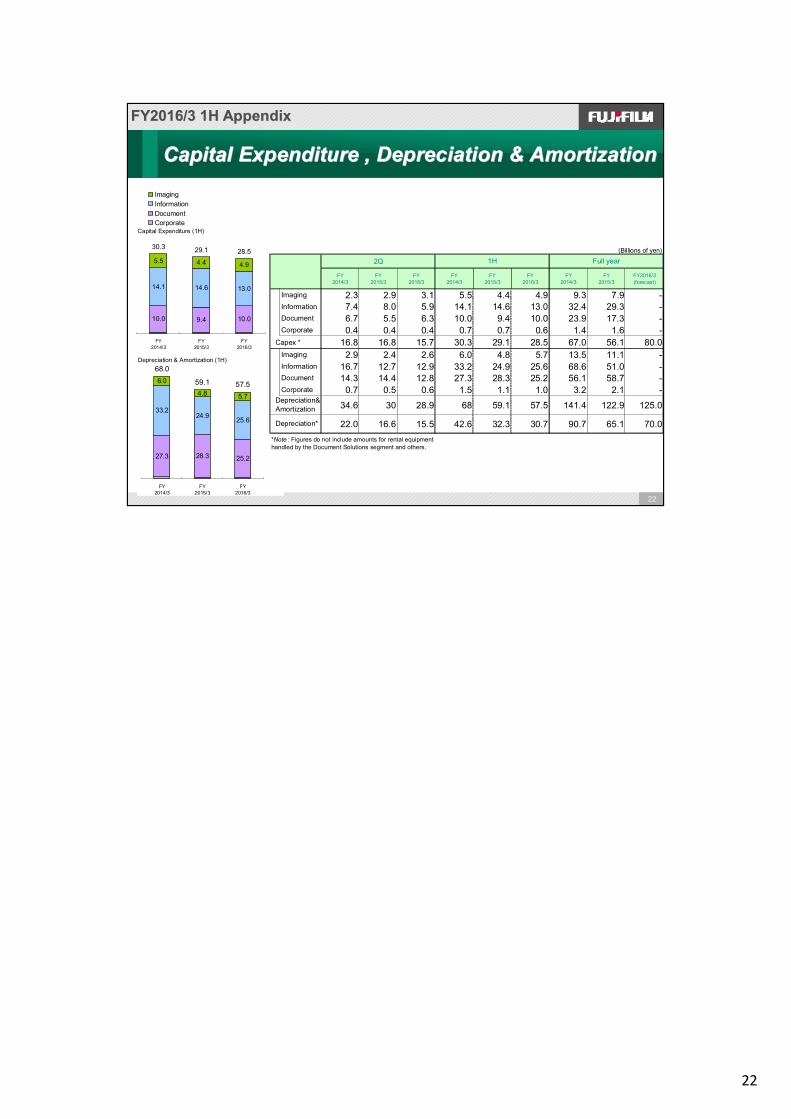
Capital ExpenditureCapital Expenditure , Depreciation & Amortization, Depreciation & Amortization
FY2016/3 1H AppendixFY2016/3 1H Appendix
Capital Expenditure (1H)
10.0 9.4 10.0
14.1 14.6 13.0
5.5 4.4 4.9
30.3 29.1 28.5
FY2014/3
FY2015/3
FY2016/3
Imaging Information Document Corporate
Depreciation & Amortization (1H)
27.3 28.3 25.2
33.224.9 25.6
6.0
4.8 5.7
68.0
59.1 57.5
FY2014/3
FY2015/3
FY2016/3
(Billions of yen)
2Q
FY2014/3
FY2015/3
FY2016/3
FY2014/3
FY2015/3
FY2016/3
FY2014/3
FY2015/3
FY2016/3(forecast)
Imaging 2.3 2.9 3.1 5.5 4.4 4.9 9.3 7.9 -Information 7.4 8.0 5.9 14.1 14.6 13.0 32.4 29.3 -Document 6.7 5.5 6.3 10.0 9.4 10.0 23.9 17.3 -Corporate 0.4 0.4 0.4 0.7 0.7 0.6 1.4 1.6 -
Capex * 16.8 16.8 15.7 30.3 29.1 28.5 67.0 56.1 80.0Imaging 2.9 2.4 2.6 6.0 4.8 5.7 13.5 11.1 -Information 16.7 12.7 12.9 33.2 24.9 25.6 68.6 51.0 -Document 14.3 14.4 12.8 27.3 28.3 25.2 56.1 58.7 -Corporate 0.7 0.5 0.6 1.5 1.1 1.0 3.2 2.1 -
34.6 30 28.9 68 59.1 57.5 141.4 122.9 125.0
22.0 16.6 15.5 42.6 32.3 30.7 90.7 65.1 70.0*Note : Figures do not include amounts for rental equipmenthandled by the Document Solutions segment and others.
Full year
Depreciation*
1H
Depreciation& Amortization

23
23
R&D Expenses (1H)
31.7
31.9 34.8
3.43.9
79.882.9
1212.8
32.2
FY2015/3 FY2016/3
ImagingInformationDocumentCorporate
R&D Expenses, SG&A ExpensesR&D Expenses, SG&A ExpensesFY2016/3 1H AppendixFY2016/3 1H Appendix
(Billions of yen)
FY2015/3 FY2016/3 FY2014/3 FY2015/3 FY2015/3 FY2016/3(Forecast)
Imaging 1.7 2.2 3.4 3.9 6.8 -Information 16.5 17.3 31.9 34.8 65.7 -Document 16.6 16.2 31.7 32.2 62.9 -Corporate 6.4 6.1 12.8 12.0 25.7 -
R&D Expenses 41.2 41.8 79.8 82.9 161.1 165.0
6.6% 6.6% 6.7% 6.8% 6.5% 6.4%
154.8 162.5 304.6 317.0 628.0 -
24.8% 25.6% 25.7% 25.8% 25.2% -
2Q 1H Full year
<ratio to revenue>
SG&A Expenses
<ratio to revenue>
24
24
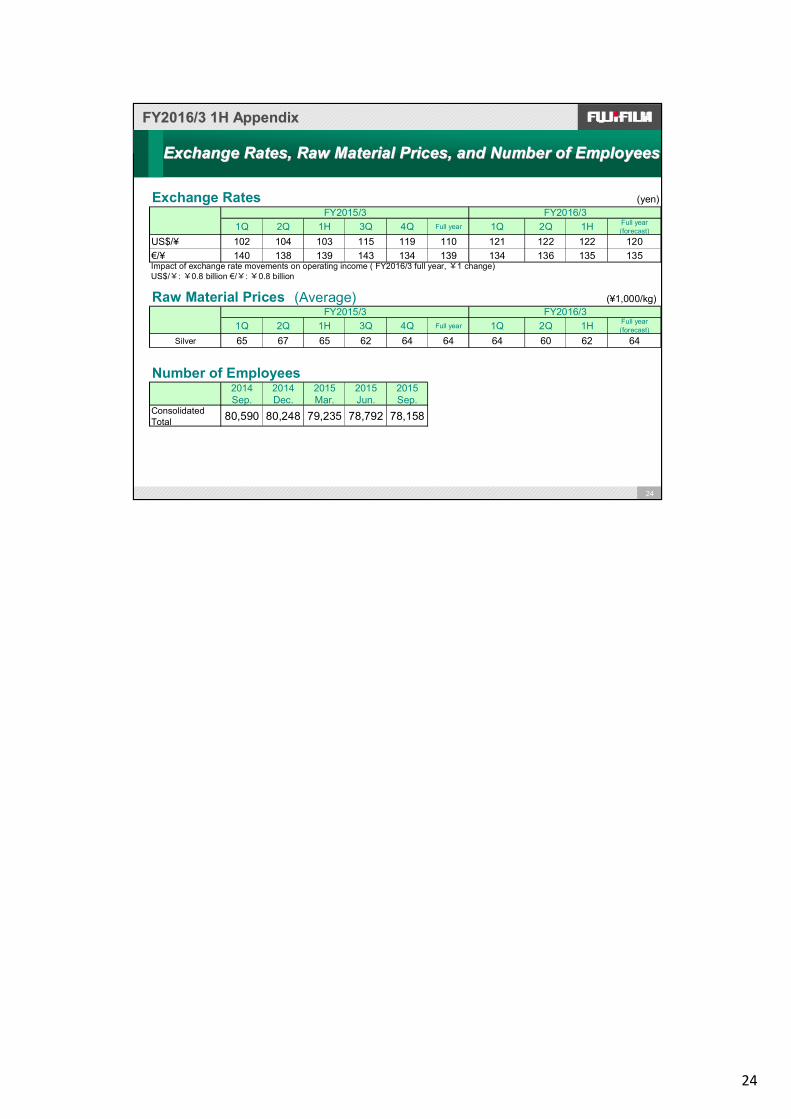
Exchange Rates, Raw Material Prices, and Number of EmployeesExchange Rates, Raw Material Prices, and Number of Employees
FY2016/3 1H AppendixFY2016/3 1H Appendix
Exchange Rates (yen)
1Q 2Q 1H 3Q 4Q Full year 1Q 2Q 1H Full year(forecast)
US$/¥ 102 104 103 115 119 110 121 122 122 120€/¥ 140 138 139 143 134 139 134 136 135 135
US$/¥: ¥0.8 billion €/¥: ¥0.8 billion
Raw Material Prices (Average) (¥1,000/kg)
1Q 2Q 1H 3Q 4Q Full year 1Q 2Q 1H Full year(forecast)
Silver 65 67 65 62 64 64 64 60 62 64
Number of Employees2014Sep.
2014Dec.
2015Mar.
2015Jun.
2015Sep.
ConsolidatedTotal 80,590 80,248 79,235 78,792 78,158
FY2016/3
FY2016/3
FY2015/3
FY2015/3
Impact of exchange rate movements on operating income ( FY2016/3 full year, ¥1 change)

25
25
PipelinePipelineFY2016/3 1H AppendixFY2016/3 1H Appendix
Note: FKB327 (a biosimilar of adalimumab) is under phaseⅢclinical trials in U.S.A. and other countries. FKB238 (a biosimilar of bevacizumab ) is under phase Ⅰ
Under clinical trials utilizing subsidy from the U.S. Department of DefensePⅢU.S.A.
Engaging in the search and identification of biomarkers with the CiRA of Kyoto University
Promoting clinical development with the MD Anderson Cancer Center (U.S.A.)
Under non-clinical trialU.S.A./Europe/Japan
Injection
Advanced/recurrent pancreatic/ovarian cancer drugFF-10502
PⅡJapanDiagnostic drug for prostate cancer(Radiopharmaceuticals)F-1311
Under non-clinical trialU.S.A./Europe/Japan
Injection
Advanced/recurrent non-small celllung/pancreatic cancer drug (armed antibody)
FF-21101
PⅠU.S.A.
PⅠJapanOralRecurrent/intractable myelodysplastic syndrome
drugFF-10501
PⅢJapanInjectionCastration-resistant prostate cancer drug ITK-1
PⅡJapanOralMacrolide antibacterial drugT-4288
PⅡJapan
Undertaking clinical trials with the Alzheimer’s Disease Cooperative Study PⅡU.S.A.
OralAlzheimer's disease drugT-817MA
P ⅠcompletedU.S.A.InjectionAntifungal drugT-2307
Already launched as Geninax in JapanSubmitted an application for permissionChinaOralQuinolone synthetic antibacterial drugT-3811
ApprovedJapan Approved in March 2014 (AVIGAN®)OralAnti-influenza drugT-705
NoteDevelopment stageRegionFormulationTherapeutic categoryDevelopment
code
clinical trial in Europe. Both are from FUJIFILM KYOWA KIRIN Biologics, an equity method affiliated company.
Bio
Bio

26
26
FY2016/3 1H AppendixFY2016/3 1H Appendix
Consolidated Financial Forecast for FY2016/3 by Segments Consolidated Financial Forecast for FY2016/3 by Segments (as of Oct. 28, 2015)(as of Oct. 28, 2015)
(Billions of yen)
Revenue FY2015/3 FY2016/3(forecast)
Change fromprevious year
FY2017/3(VISION2016)
ImagingSolutions 361.0 370.0 9.0 360.0
InformationSolutions 953.6 990.0 36.4 1,030.0DocumentSolutions 1,178.0 1,220.0 42.0 1,240.0
Total 2,492.6 2,580.0 87.4 2,630.0 Note: After elimination ofintersegment transaction.
(Billions of yen)Operating
Income FY2015/3 FY2016/3(forecast)
Change fromprevious year
FY2017/3(VISION2016)
ImagingSolutions 20.7 28.0 7.3 25.0
InformationSolutions 81.2 90.0 8.8 105.0DocumentSolutions 101.3 105.0 3.7 125.0Corporate
Expenses &Eliminations
(30.8) (33.0) (2.2) (35.0)
Total 172.4 190.0 17.6 220.0
27
27
AppendixAppendixFUJIFILM Holdings FUJIFILM Holdings -- Investor RelationsInvestor Relationshttp://www.fujifilmholdings.com/en/investors/index.html
What Kind of Company is Fujifilm?What Kind of Company is Fujifilm?http://www.fujifilmholdings.com/en/investors/guidance/index.html
IRIR Events MaterialsEvents Materialshttp://www.fujifilmholdings.com/en/investors/ir_events/business_presentations/index.html
・ Business presentation materials- Feb. 2015 Business Presentation for Document Business- May.2015 Business Presentation for Photo Imaging Business・ Conference Materials- Mar. 2015 Daiwa Investment Conference Tokyo 2015
Growth Strategy of Fujifilm
FUJIFILM Holdings Annual Report 2015FUJIFILM Holdings Annual Report 2015http://www.fujifilmholdings.com/en/investors/annual_reports/2015/index.html
FY2016/3 1H AppendixFY2016/3 1H Appendix

28
Corporate Communication Office, Corporate Planning Div.http://www.fujifilmholdings.com/en/index.html
At Fujifilm, we are continuously innovating — creatingnew technologies, products and services that inspire
and excite people everywhere.Our goal is to empower the potential and expand
the horizons of tomorrow’s businesses and lifestyles.