Embed Size (px)
Citation preview
Economic Insights
Catalogue no. 11‑626‑X — No. 056ISSN 1927‑503X ISBN 978‑0‑660‑04794‑2
by Marc Frenette and Kristyn Frank
Earnings of Postsecondary Graduates by Detailed Field of Study
Release date: March 11, 2016

Standard table symbolsThe following symbols are used in Statistics Canada publications:
. not available for any reference period
.. not available for a specific reference period
... not applicable 0 true zero or a value rounded to zero 0s value rounded to 0 (zero) where there is a meaningful distinction between true zero and the value that was rounded p preliminary r revised x suppressed to meet the confidentiality requirements of the Statistics Act E use with caution F too unreliable to be published * significantly different from reference category (p < 0.05)
How to obtain more informationFor information about this product or the wide range of services and data available from Statistics Canada, visit our website, www.statcan.gc.ca. You can also contact us by email at STATCAN.infostats‑[email protected] telephone, from Monday to Friday, 8:30 a.m. to 4:30 p.m., at the following toll‑free numbers:
• Statistical Information Service 1‑800‑263‑1136 • National telecommunications device for the hearing impaired 1‑800‑363‑7629 • Fax line 1‑877‑287‑4369
Depository Services Program
• Inquiries line 1‑800‑635‑7943 • Fax line 1‑800‑565‑7757
Published by authority of the Minister responsible for Statistics Canada
© Minister of Industry, 2016
All rights reserved. Use of this publication is governed by the Statistics Canada Open Licence Agreement.
An HTML version is also available.
Cette publication est aussi disponible en français.
Note of appreciationCanada owes the success of its statistical system to a long‑standing partnership between Statistics Canada, the citizens of Canada, its businesses, governments and other institutions. Accurate and timely statistical information could not be produced without their continued co‑operation and goodwill.
Standards of service to the publicStatistics Canada is committed to serving its clients in a prompt, reliable and courteous manner. To this end, Statistics Canada has developed standards of service that its employees observe. To obtain a copy of these service standards, please contact Statistics Canada toll‑free at 1‑800‑263‑1136. The service standards are also published on www.statcan.gc.ca under “Contact us” > “Standards of service to the public.”
1Economic Insights, no. 056, March 2016 • Statistics Canada, Catalogue no. 11-626-X
Earnings of Postsecondary Graduates by Detailed Field of Study
This Economic Insights article documents age‑adjusted mean earnings by detailed field of study among 25‑ to 54‑year‑old university and college graduates who worked full year, full time in 2010. The data are drawn from the 2011 National Household Survey. The results suggest that management sciences and quantitative methods graduates were the top earners among male and female bachelor’s degree holders in 2010. The study also finds that earnings vary considerably among graduates from specific fields of study that are typically grouped together (e.g. economics graduates earn more than graduates from other social science programs, such as sociology and psychology).
Earnings of Postsecondary Graduates by Detailed Field of Study by Marc Frenette and Kristyn Frank, Social Analysis and Modelling Division
IntroductionPerhaps the most important decision that postsecondary students make is what to study since the choice is closely linked to future job satisfaction and earnings. Evidence suggests that students take both factors into consideration. Indeed, while field of study choice is largely determined by students’ individual preferences (Arcidiacono 2004), the expected earnings associated with a field is also an important consideration for most students (Gunderson and Krashinsky 2009). For this reason, producing quality evidence on the association between field of study and earnings has the potential to provide students with data that enable them to become better informed in their decision making. Much of the existing literature provides earnings information for Canadian graduates by broad field of study, generally concluding that graduates of more applied fields, such as engineering, receive higher earnings than graduates of liberal arts fields (e.g., Finnie 2001; Finnie and Frenette 2003; Frank, Frenette and Morissette 2015; Frank and Walters 2012; Ostrovsky and Frenette 2014; Walters 2004). While results by broad field of study may be highly useful to policymakers and education planners, students are typically required to decide among very specific programs. Earnings by detailed fields can provide students with information that may facilitate these decisions. Results can also provide insight into the potential earnings advantages of additional education within specific fields. Findings from the 1996 Census indicate notable earnings differentials within specific fields by different levels of education (Stark 2007); however, more recent data are needed. This study uses the 2011 National Household Survey to compare mean (or average) annual earnings by detailed field of study
for bachelor’s and master’s degree graduates, as well as college graduates (see Data sources, methodology and definitions). Earnings across fields are presented separately for 25‑ to 54‑year‑old men and women who worked full year (49 to 52 weeks), full time (at least 30 hours per week) in 2010. Given the wide age range (necessary to produce adequate sample sizes), the results are age‑adjusted. The fields of study are reported at the four‑digit level of the 2011 Classification of Instructional Programs (CIP). This level of detail allows for useful comparisons within broad fields of study. For example, students interested in postsecondary programs in architecture and engineering may not only examine whether earnings differences exist between architecture and engineering graduates, but also between graduates of different types of engineering programs (e.g., civil, electrical and electronics, and mechanical). Note that results are only reported for fields with a sample size of 200 or more.1 Note that results are only age‑adjusted within sex and education level groupings. For this reason, the analysis in this study focuses exclusively on comparisons across field of study for individuals of the same sex and with the same highest level of completed education. Comparisons between men and women would be particularly challenging since the data do not contain many of the key factors that have been associated with analyzing the gender wage gap, such as accumulated work experience, job tenure, unionization, working in a self‑directed work group, work schedules and flexible work hours, overtime pay, firm size, working for a non‑profit organization, foreign ownership, performance‑based pay, and receipt of workplace training (see Drolet, 2002).
1. Results are not shown for doctoral and professional degree graduates since very few fields were retained with the sample criteria.
2Economic Insights, no. 056, March 2016 • Statistics Canada, Catalogue no. 11-626-XEarnings of Postsecondary Graduates by Detailed Field of Study
0 20,000 40,000 60,000 80,000 100,000 120,000 140,000 160,000
earnings (2010 dollars)
Theological and ministerial studies*Music*
Social work*Linguistic, comparative and related language studies and services*
Fine arts and art studies*Teacher education and professional development, specific levels and methods*
Film/video and photographic arts*Parks, recreation and leisure studies*
Design and applied arts*Philosophy, logic and ethics*
Education, general*Teacher education and professional development, specific subject areas*
Psychology, general*Anthropology*
Communication and media studies*English literature*
Agriculture, general*History*
Forestry*Rehabilitation and therapeutic professions*
English language and literature, general*Journalism*
Biology, general*Sociology*
Microbiological sciences and immunology*Social sciences, general*
Biochemistry/biophysics and molecular biology*Health and physical education/fitness*
Geography and cartography*Registered nursing, nursing administration, nursing research and clinical nursing*
Human resources management and services*Architecture*
Natural resources conservation and research*Chemistry*
Criminology*Biological and physical sciences*
Computer and information sciences and support services, general*Liberal arts and sciences, general studies and humanities*
Management information systems and servicesCity/urban, community and regional planning
Mathematics and computer sciencePolitical science and government
Business administration, management and operationsBusiness/managerial economics
PhysicsComputer scienceAll fields of study
MarketingIndustrial engineering
Economics*Computer engineering*
Electrical, electronics and communications engineering*Mathematics*
Civil engineering*Mechanical engineering*
Business/commerce, general*Accounting and related services*
Engineering, general*Finance and financial management services*Geological and Earth sciences/geosciences*
Chemical engineering*Management sciences and quantitative methods*
Field of study (2011 CIP)
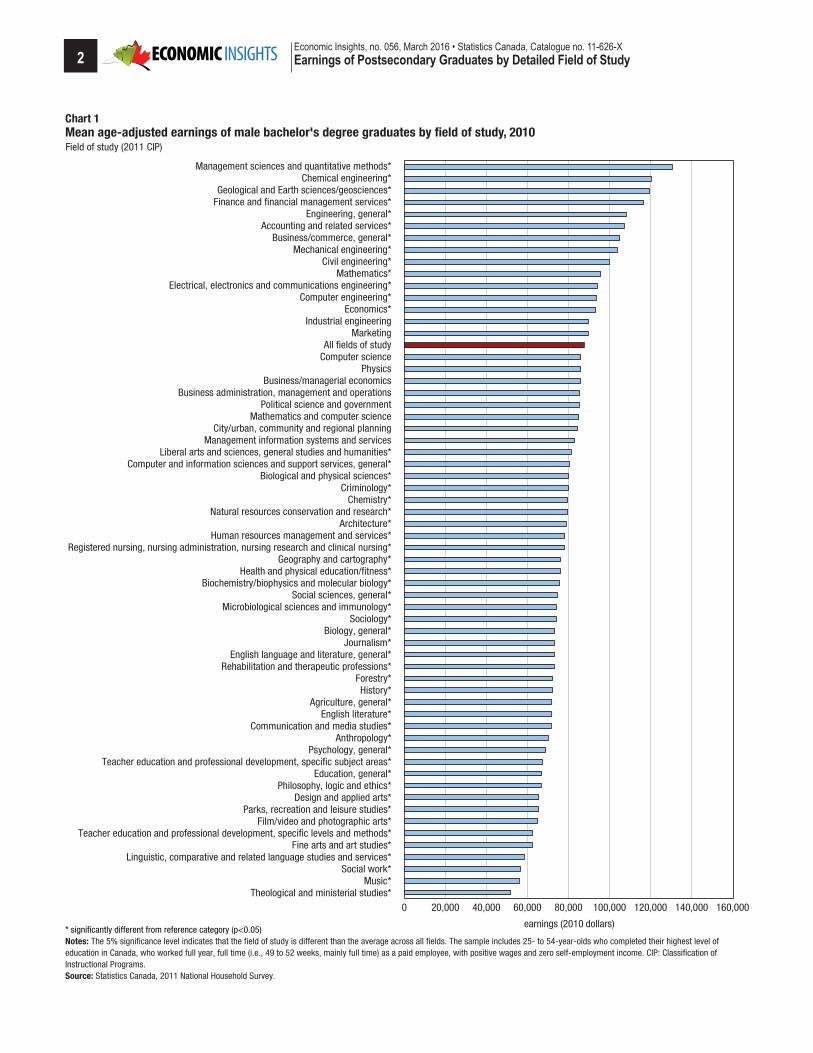
Chart 1Mean age-adjusted earnings of male bachelor's degree graduates by field of study, 2010
* significantly different from reference category (p<0.05)Notes: The 5% significance level indicates that the field of study is different than the average across all fields. The sample includes 25- to 54-year-olds who completed their highest level of education in Canada, who worked full year, full time (i.e., 49 to 52 weeks, mainly full time) as a paid employee, with positive wages and zero self-employment income. CIP: Classification of Instructional Programs. Source: Statistics Canada, 2011 National Household Survey.
3Economic Insights, no. 056, March 2016 • Statistics Canada, Catalogue no. 11-626-X
Earnings of Postsecondary Graduates by Detailed Field of Study
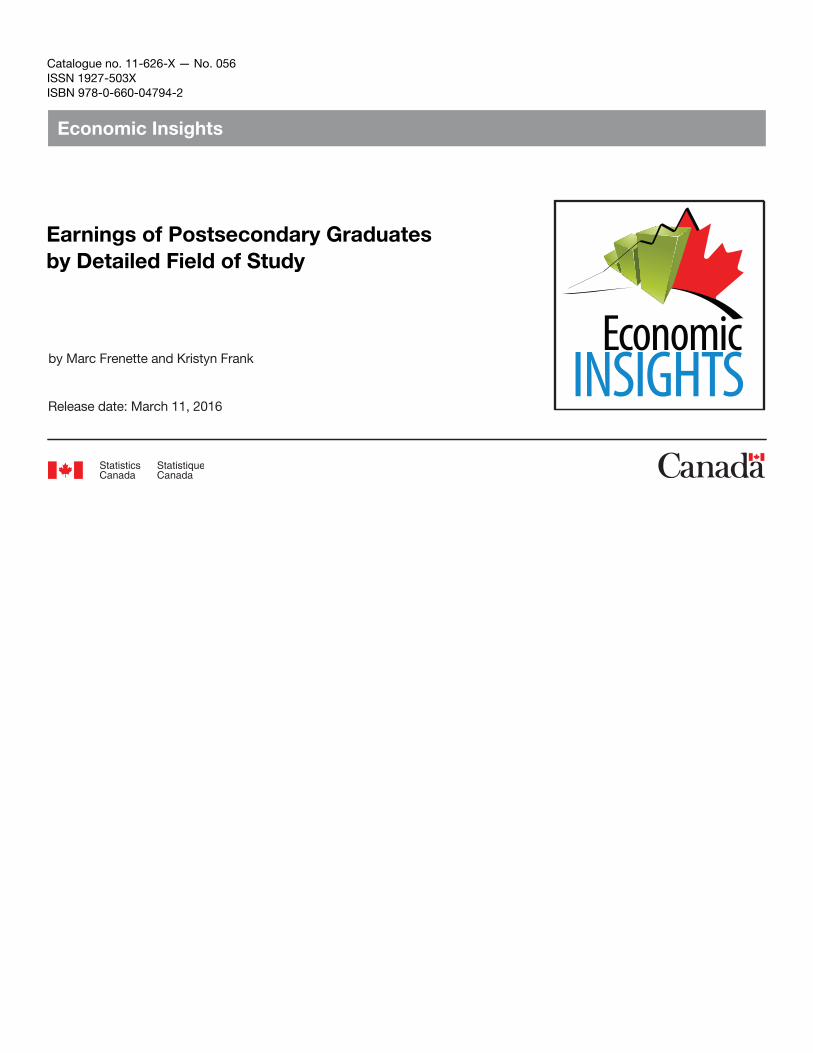
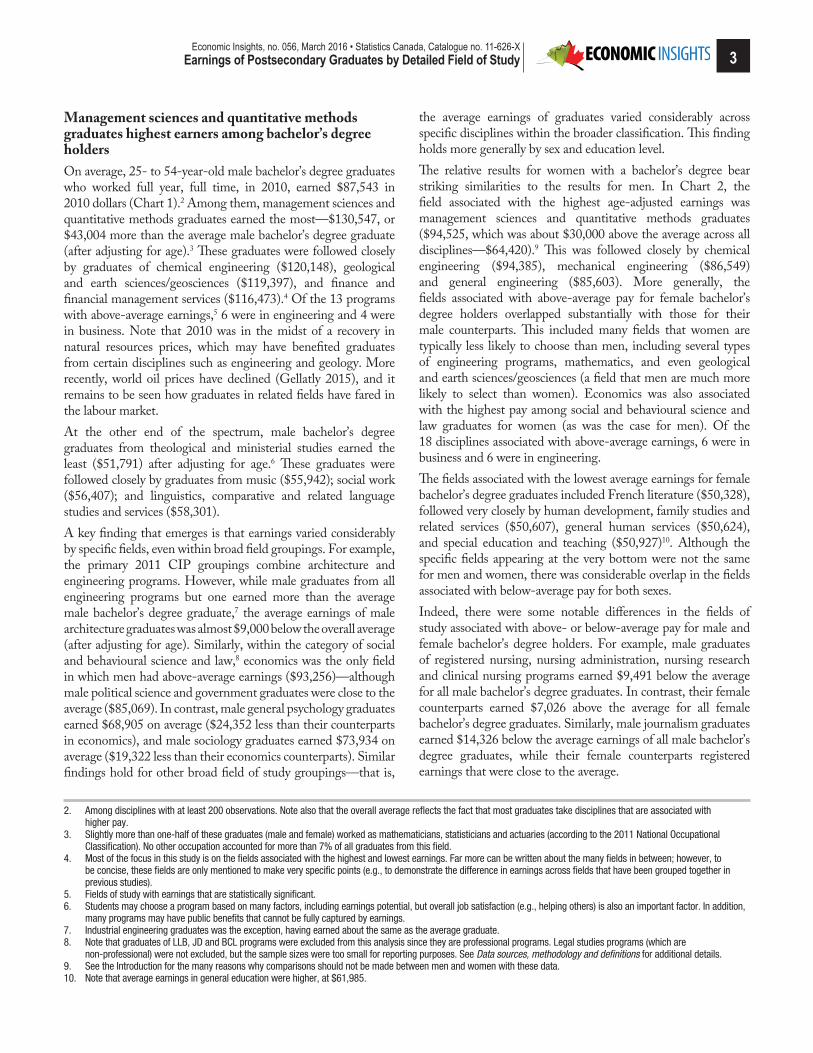
the average earnings of graduates varied considerably across specific disciplines within the broader classification. This finding holds more generally by sex and education level.The relative results for women with a bachelor’s degree bear striking similarities to the results for men. In Chart 2, the field associated with the highest age‑adjusted earnings was management sciences and quantitative methods graduates ($94,525, which was about $30,000 above the average across all disciplines—$64,420).9 This was followed closely by chemical engineering ($94,385), mechanical engineering ($86,549) and general engineering ($85,603). More generally, the fields associated with above‑average pay for female bachelor’s degree holders overlapped substantially with those for their male counterparts. This included many fields that women are typically less likely to choose than men, including several types of engineering programs, mathematics, and even geological and earth sciences/geosciences (a field that men are much more likely to select than women). Economics was also associated with the highest pay among social and behavioural science and law graduates for women (as was the case for men). Of the 18 disciplines associated with above‑average earnings, 6 were in business and 6 were in engineering.The fields associated with the lowest average earnings for female bachelor’s degree graduates included French literature ($50,328), followed very closely by human development, family studies and related services ($50,607), general human services ($50,624), and special education and teaching ($50,927)10. Although the specific fields appearing at the very bottom were not the same for men and women, there was considerable overlap in the fields associated with below‑average pay for both sexes. Indeed, there were some notable differences in the fields of study associated with above‑ or below‑average pay for male and female bachelor’s degree holders. For example, male graduates of registered nursing, nursing administration, nursing research and clinical nursing programs earned $9,491 below the average for all male bachelor’s degree graduates. In contrast, their female counterparts earned $7,026 above the average for all female bachelor’s degree graduates. Similarly, male journalism graduates earned $14,326 below the average earnings of all male bachelor’s degree graduates, while their female counterparts registered earnings that were close to the average.
Management sciences and quantitative methods graduates highest earners among bachelor’s degree holders On average, 25‑ to 54‑year‑old male bachelor’s degree graduates who worked full year, full time, in 2010, earned $87,543 in 2010 dollars (Chart 1).2 Among them, management sciences and quantitative methods graduates earned the most—$130,547, or $43,004 more than the average male bachelor’s degree graduate (after adjusting for age).3 These graduates were followed closely by graduates of chemical engineering ($120,148), geological and earth sciences/geosciences ($119,397), and finance and financial management services ($116,473).4 Of the 13 programs with above‑average earnings,5 6 were in engineering and 4 were in business. Note that 2010 was in the midst of a recovery in natural resources prices, which may have benefited graduates from certain disciplines such as engineering and geology. More recently, world oil prices have declined (Gellatly 2015), and it remains to be seen how graduates in related fields have fared in the labour market. At the other end of the spectrum, male bachelor’s degree graduates from theological and ministerial studies earned the least ($51,791) after adjusting for age.6 These graduates were followed closely by graduates from music ($55,942); social work ($56,407); and linguistics, comparative and related language studies and services ($58,301).A key finding that emerges is that earnings varied considerably by specific fields, even within broad field groupings. For example, the primary 2011 CIP groupings combine architecture and engineering programs. However, while male graduates from all engineering programs but one earned more than the average male bachelor’s degree graduate,7 the average earnings of male architecture graduates was almost $9,000 below the overall average (after adjusting for age). Similarly, within the category of social and behavioural science and law,8 economics was the only field in which men had above‑average earnings ($93,256)—although male political science and government graduates were close to the average ($85,069). In contrast, male general psychology graduates earned $68,905 on average ($24,352 less than their counterparts in economics), and male sociology graduates earned $73,934 on average ($19,322 less than their economics counterparts). Similar findings hold for other broad field of study groupings—that is,
2. Among disciplines with at least 200 observations. Note also that the overall average reflects the fact that most graduates take disciplines that are associated with higher pay.
3. Slightly more than one-half of these graduates (male and female) worked as mathematicians, statisticians and actuaries (according to the 2011 National Occupational Classification). No other occupation accounted for more than 7% of all graduates from this field.
4. Most of the focus in this study is on the fields associated with the highest and lowest earnings. Far more can be written about the many fields in between; however, to be concise, these fields are only mentioned to make very specific points (e.g., to demonstrate the difference in earnings across fields that have been grouped together in previous studies).
5. Fields of study with earnings that are statistically significant.6. Students may choose a program based on many factors, including earnings potential, but overall job satisfaction (e.g., helping others) is also an important factor. In addition,
many programs may have public benefits that cannot be fully captured by earnings.7. Industrial engineering graduates was the exception, having earned about the same as the average graduate.8. Note that graduates of LLB, JD and BCL programs were excluded from this analysis since they are professional programs. Legal studies programs (which are
non-professional) were not excluded, but the sample sizes were too small for reporting purposes. See Data sources, methodology and definitions for additional details. 9. See the Introduction for the many reasons why comparisons should not be made between men and women with these data. 10. Note that average earnings in general education were higher, at $61,985.
4Economic Insights, no. 056, March 2016 • Statistics Canada, Catalogue no. 11-626-XEarnings of Postsecondary Graduates by Detailed Field of Study
French literature*Human development, family studies and related services*
Human services, general*Special education and teaching*
Music*Parks, recreation and leisure studies*
Fine arts and art studies*Drama/theatre arts and stagecraft*
Family and consumer sciences/human sciences, general*Clinical, counselling and applied psychology*
Anthropology*Hospitality administration/management*
Social work*Area studies*
Research and experimental psychology*English literature*
Linguistic, comparative and related language studies and services*History*
Psychology, general*French language and literature, general*English language and literature, general*
Design and applied artsSociology*
Geography and cartography*Agriculture, general
Dietetics and clinical nutrition services*Biology, general*
Liberal arts and sciences, general studies and humanities*Criminology*
Teacher education and professional development, specific subject areas*Health services/allied health/health sciences, general*
Communication and media studies*Social sciences, general
Education, general*Foods, nutrition and related services
Biological and physical sciences*Rehabilitation and therapeutic professions
Health and physical education/fitnessComputer and information sciences and support services, general
Microbiological sciences and immunologyBiochemistry/biophysics and molecular biology
Business administration, management and operationsArchitecture
All fields of studyPublic relations, advertising and applied communication
Natural resources conservation and researchHuman resources management and services
Political science and governmentCity/urban, community and regional planning
JournalismMarketing*
Allied health diagnostic, intervention and treatment professions*Chemistry
Economics*Management information systems and services*
Teacher education and professional development, specific levels and methods*
Registered nursing, nursing administration, nursing research and clinical nursing*Computer science*
Finance and financial management services*Business/commerce, general*
Computer engineering*Accounting and related services*
Mathematics*Geological and Earth sciences/geosciences*
Electrical, electronics and communications engineering*Civil engineering*
Engineering, general*Mechanical engineering*
Chemical engineering*Management sciences and quantitative methods*
Field of study (2011 CIP)
Chart 2Mean age-adjusted earnings of female bachelor's degree graduates by field of study, 2010
0 20,000 40,000 60,000 80,000 100,000 120,000 140,000 160,000
earnings (2010 dollars)* significantly different from reference category (p<0.05)Notes: The 5% significance level indicates that the field of study is different than the average across all fields. The sample includes 25- to 54-year-olds who completed their highest level of education in Canada, who worked full year, full time (i.e., 49 to 52 weeks, mainly full time) as a paid employee, with positive wages and zero self-employment income. CIP: Classification of Instructional Programs. Source: Statistics Canada, 2011 National Household Survey.

5Economic Insights, no. 056, March 2016 • Statistics Canada, Catalogue no. 11-626-X
Earnings of Postsecondary Graduates by Detailed Field of Study
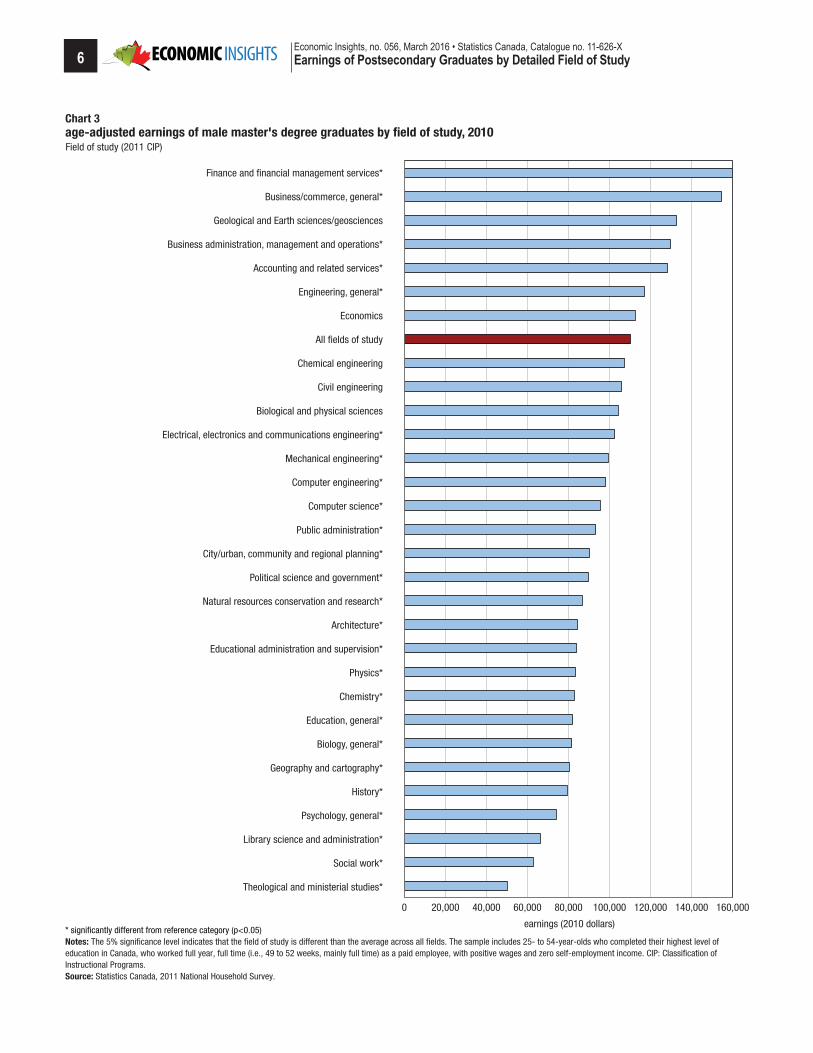
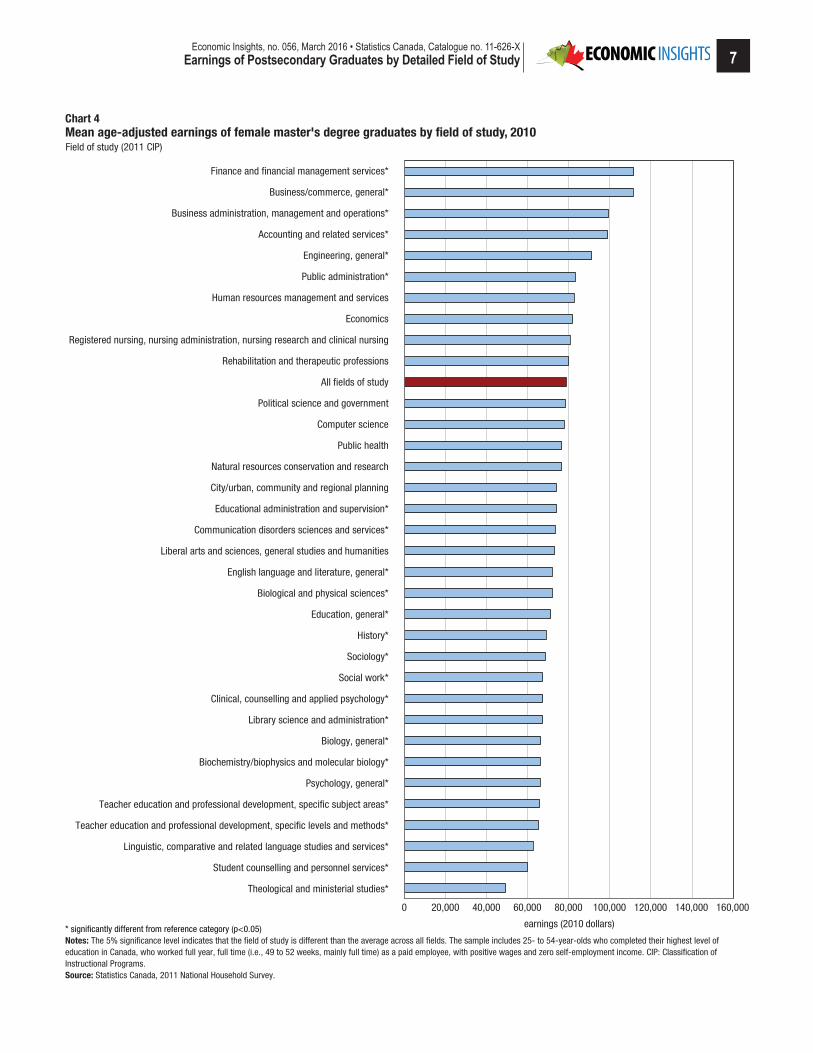
Earnings highest among finance and financial management services graduates at the master’s degree level Turning to men with a master’s degree, finance and financial management services graduates earned the most on average (after adjusting for age). Male graduates from this discipline earned $160,100 on average (in 2010 dollars), which was almost $50,000 more than the average across all fields of study (Chart 3). Of the five disciplines associated with above‑average earnings, four were business‑related, and the fifth was in engineering.11 The field associated with the lowest pay for male master’s degree holders included theological and ministerial studies ($50,184), and is followed by social work ($62,958), library science and administration ($66,456), and general psychology ($74,091). One notable difference between the results for male bachelor’s and master’s degree holders relates to engineering graduates. At the bachelor’s degree level, graduates from six out of seven of the different types of engineering programs registered above‑average earnings in 2010 (the seventh registered average earnings). Among male master’s degree holders, graduates from only one out of the six engineering programs with sufficient samples registered above‑average earnings (general engineering). Women who graduated with a master’s degree in finance and financial management services also earned the most at their level—$111,714 (Chart 4). They were followed closely by three other business‑related disciplines: general business/commerce ($111,327), business administration, management and operations ($99,367), and accounting and related services ($99,060). The fields associated with the lowest pay for women with a master’s degree included theological and ministerial studies ($49,415), followed by student counselling and personnel services ($59,944); linguistic, comparative and related language studies and services ($62,614); and teacher education and professional development, specific levels and methods ($65,342).One interesting difference between men and women with a master’s degree relates to the public administration results. Male graduates from that discipline earned almost $17,000 less than the average male master’s degree graduate. In contrast, female public administration graduates earned more than $4,000 above the average female master’s degree graduate.
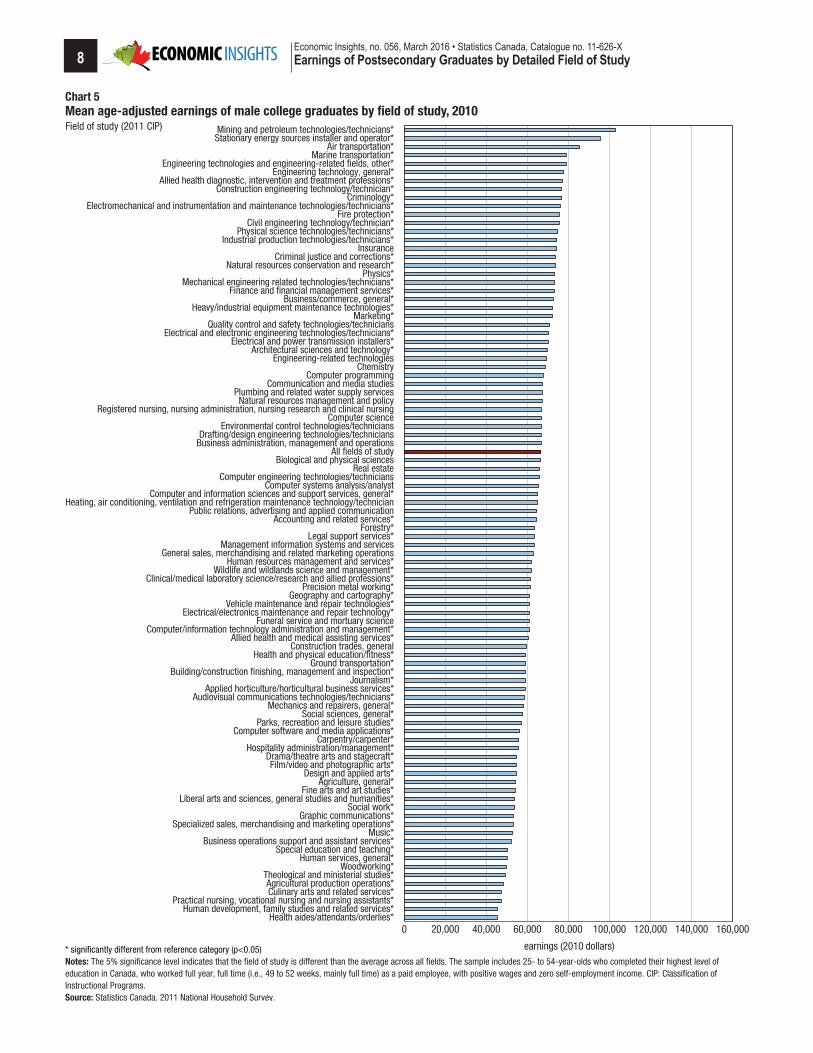
Less earnings variation across fields among college graduates In general, there was far less earnings variation across specific fields of study among college graduates than among bachelor’s and master’s degree graduates. More specifically, male college graduates from 61 of the 93 fields (66%) earned within $10,000 (in 2010 dollars) of the overall average after adjusting for age (Chart 5), compared with 23 of the 61 programs (38%) among male bachelor’s degree graduates
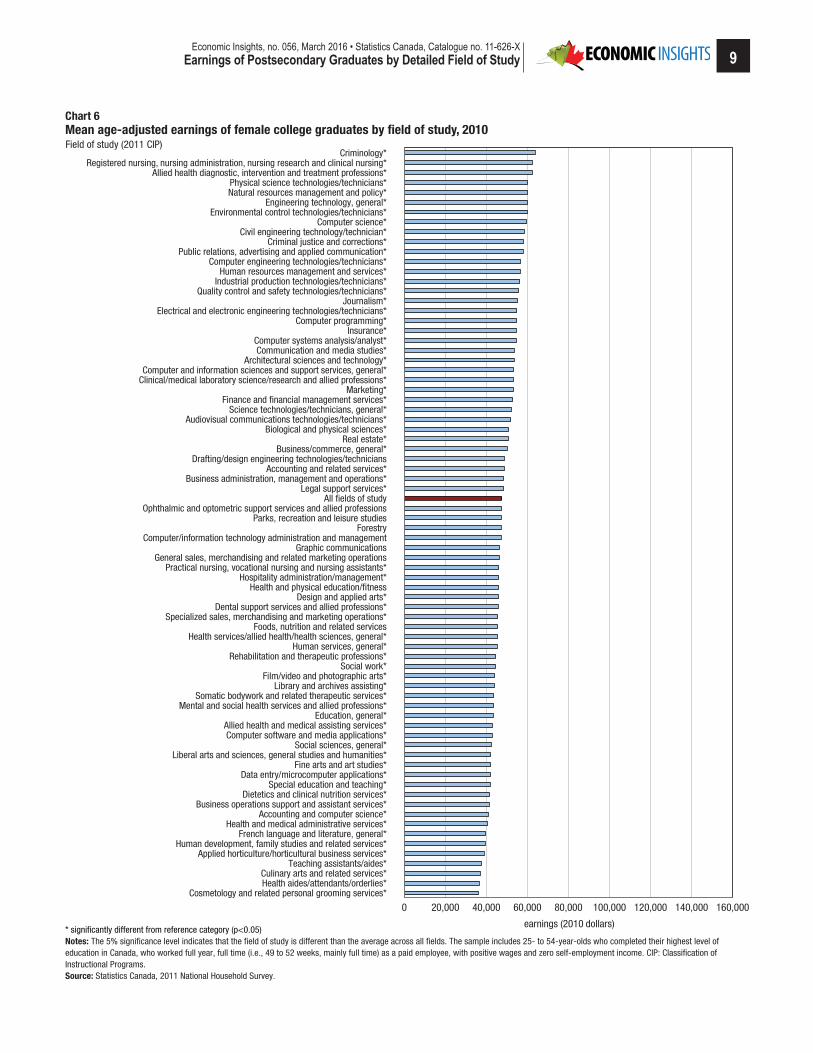
(Chart 1) and 6 of the 30 programs (20%) among male master’s degree graduates (Chart 3). Similarly, female college graduates from 61 of the 75 fields (81%) earned within $10,000 of the overall average (Chart 6), compared with 46 of the 69 disciplines (67%) among female bachelor’s degree graduates (Chart 2) and 17 of the 34 programs (50%) among female master’s degree graduates (Chart 4). That being said, the field associated with the highest average earnings among male college graduates was mining and petroleum technologies/technicians ($102,986), while the lowest was health aides/attendants/orderlies ($45,193). Among female college graduates, average earnings ranged from $63,721 for criminology graduates to $36,158 for cosmetology and related personal grooming services. Another notable difference between the college and university results is the fact that business graduates fared much better at the university level than at the college level. Indeed, university business graduates registered average earnings that were often near the top among all disciplines. In contrast, the average earnings of college business graduates were much closer to the overall college average.
Conclusion The objective of this study has been to compare the age‑adjusted earnings observed among full‑time, full‑year employees disaggregated by detailed fields of study. More specifically, specific fields of study were ranked according to age‑adjusted earnings by sex and education level. Such information provides more useful information to students faced with making program choices than earnings data classified by broader categories.One of the key findings that emerges from the study is the high degree of variability in earnings by specific field of study. For example, although engineering graduates are often grouped with architecture graduates, engineering graduates generally earn considerably more. Similarly, economics graduates typically earn far more than psychology graduates, yet both are often grouped together under social sciences.The relative ranking for certain disciplines depended on the level of study. For example, engineering graduates were typically ranked above average at the bachelor’s degree level. However, at the master’s degree level, male engineering graduates generally registered below‑average earnings. Similarly, university business graduates often ranked near the top of the earnings ladder, but at the college level, they were generally closer to the average. The range of earnings associated with the fields was much smaller among college graduates than among their university counterparts. Male and female college graduates in most disciplines earned, on average, within $10,000 of the overall average. Given the insights provided in this study, future analysis carried out by field of study may benefit from a similar level of detail whenever possible. ■
11. Note that graduates of geological and Earth sciences/geosciences earned $132,787 on average, which was more than $30,000 above the average earnings among male master’s degree graduates. However, this difference was not statistically significant.
6Economic Insights, no. 056, March 2016 • Statistics Canada, Catalogue no. 11-626-XEarnings of Postsecondary Graduates by Detailed Field of Study
0 20,000 40,000 60,000 80,000 100,000 120,000 140,000 160,000
earnings (2010 dollars)
Field of study (2011 CIP)
Chart 3age-adjusted earnings of male master's degree graduates by field of study, 2010
Theological and ministerial studies*
Social work*
Library science and administration*
Psychology, general*
History*
Geography and cartography*
Biology, general*
Education, general*
Chemistry*
Physics*
Educational administration and supervision*
Architecture*
Natural resources conservation and research*
Political science and government*
City/urban, community and regional planning*
Public administration*
Computer science*
Computer engineering*
Mechanical engineering*
Electrical, electronics and communications engineering*
Biological and physical sciences
Civil engineering
Chemical engineering
All fields of study
Economics
Engineering, general*
Accounting and related services*
Business administration, management and operations*
Geological and Earth sciences/geosciences
Business/commerce, general*
Finance and financial management services*
* significantly different from reference category (p<0.05)Notes: The 5% significance level indicates that the field of study is different than the average across all fields. The sample includes 25- to 54-year-olds who completed their highest level of education in Canada, who worked full year, full time (i.e., 49 to 52 weeks, mainly full time) as a paid employee, with positive wages and zero self-employment income. CIP: Classification of Instructional Programs. Source: Statistics Canada, 2011 National Household Survey.
7Economic Insights, no. 056, March 2016 • Statistics Canada, Catalogue no. 11-626-X
Earnings of Postsecondary Graduates by Detailed Field of Study
0 20,000 40,000 60,000 80,000 100,000 120,000 140,000 160,000
earnings (2010 dollars)
Field of study (2011 CIP)
Chart 4Mean age-adjusted earnings of female master's degree graduates by field of study, 2010
Theological and ministerial studies*
Student counselling and personnel services*
Linguistic, comparative and related language studies and services*
Teacher education and professional development, specific levels and methods*
Teacher education and professional development, specific subject areas*
Psychology, general*
Biochemistry/biophysics and molecular biology*
Biology, general*
Library science and administration*
Clinical, counselling and applied psychology*
Social work*
Sociology*
History*
Education, general*
Biological and physical sciences*
English language and literature, general*
Liberal arts and sciences, general studies and humanities
Communication disorders sciences and services*
Educational administration and supervision*
City/urban, community and regional planning
Natural resources conservation and research
Public health
Computer science
Political science and government
All fields of study
Rehabilitation and therapeutic professions
Registered nursing, nursing administration, nursing research and clinical nursing
Economics
Human resources management and services
Public administration*
Engineering, general*
Accounting and related services*
Business administration, management and operations*
Business/commerce, general*
Finance and financial management services*
* significantly different from reference category (p<0.05)Notes: The 5% significance level indicates that the field of study is different than the average across all fields. The sample includes 25- to 54-year-olds who completed their highest level of education in Canada, who worked full year, full time (i.e., 49 to 52 weeks, mainly full time) as a paid employee, with positive wages and zero self-employment income. CIP: Classification of Instructional Programs. Source: Statistics Canada, 2011 National Household Survey.
8Economic Insights, no. 056, March 2016 • Statistics Canada, Catalogue no. 11-626-XEarnings of Postsecondary Graduates by Detailed Field of Study
0 20,000 40,000 60,000 80,000 100,000 120,000 140,000 160,000
earnings (2010 dollars)
Field of study (2011 CIP)
Chart 5Mean age-adjusted earnings of male college graduates by field of study, 2010
Health aides/attendants/orderlies*Human development, family studies and related services*
Practical nursing, vocational nursing and nursing assistants*Culinary arts and related services*Agricultural production operations*
Theological and ministerial studies*Woodworking*
Human services, general*Special education and teaching*
Business operations support and assistant services*Music*
Specialized sales, merchandising and marketing operations*Graphic communications*
Social work*Liberal arts and sciences, general studies and humanities*
Fine arts and art studies*Agriculture, general*
Design and applied arts*Film/video and photographic arts*
Drama/theatre arts and stagecraft*Hospitality administration/management*
Carpentry/carpenter*Computer software and media applications*
Parks, recreation and leisure studies*Social sciences, general*
Mechanics and repairers, general*Audiovisual communications technologies/technicians*
Applied horticulture/horticultural business services*Journalism*
Building/construction finishing, management and inspection*Ground transportation*
Health and physical education/fitness*Construction trades, general
Allied health and medical assisting services*Computer/information technology administration and management*
Funeral service and mortuary scienceElectrical/electronics maintenance and repair technology*
Vehicle maintenance and repair technologies*Geography and cartography*
Precision metal working*Clinical/medical laboratory science/research and allied professions*
Wildlife and wildlands science and management*Human resources management and services*
General sales, merchandising and related marketing operationsManagement information systems and services
Legal support services*Forestry*
Accounting and related services*Public relations, advertising and applied communication
Computer and information sciences and support services, general*Computer systems analysis/analyst
Computer engineering technologies/techniciansReal estate
Biological and physical sciencesAll fields of study
Business administration, management and operationsDrafting/design engineering technologies/technicians
Environmental control technologies/techniciansComputer science
Natural resources management and policyPlumbing and related water supply services
Communication and media studiesComputer programming
ChemistryEngineering-related technologies
Architectural sciences and technology*Electrical and power transmission installers*
Electrical and electronic engineering technologies/technicians*Quality control and safety technologies/technicians
Marketing*Heavy/industrial equipment maintenance technologies*
Business/commerce, general*Finance and financial management services*
Mechanical engineering related technologies/technicians*Physics*
Natural resources conservation and research*Criminal justice and corrections*
InsuranceIndustrial production technologies/technicians*
Physical science technologies/technicians*Civil engineering technology/technician*
Fire protection*
Heating, air conditioning, ventilation and refrigeration maintenance technology/technician
Registered nursing, nursing administration, nursing research and clinical nursing
Electromechanical and instrumentation and maintenance technologies/technicians*Criminology*
Construction engineering technology/technician*Allied health diagnostic, intervention and treatment professions*
Engineering technology, general*Engineering technologies and engineering-related fields, other*
Marine transportation*Air transportation*
Stationary energy sources installer and operator*Mining and petroleum technologies/technicians*
* significantly different from reference category (p<0.05)Notes: The 5% significance level indicates that the field of study is different than the average across all fields. The sample includes 25- to 54-year-olds who completed their highest level of education in Canada, who worked full year, full time (i.e., 49 to 52 weeks, mainly full time) as a paid employee, with positive wages and zero self-employment income. CIP: Classification of Instructional Programs. Source: Statistics Canada, 2011 National Household Survey.
9Economic Insights, no. 056, March 2016 • Statistics Canada, Catalogue no. 11-626-X
Earnings of Postsecondary Graduates by Detailed Field of Study
0 20,000 40,000 60,000 80,000 100,000 120,000 140,000 160,000
earnings (2010 dollars)
Field of study (2011 CIP)
Chart 6Mean age-adjusted earnings of female college graduates by field of study, 2010
Cosmetology and related personal grooming services*Health aides/attendants/orderlies*Culinary arts and related services*
Teaching assistants/aides*Applied horticulture/horticultural business services*
Human development, family studies and related services*French language and literature, general*
Health and medical administrative services*Accounting and computer science*
Business operations support and assistant services*Dietetics and clinical nutrition services*
Special education and teaching*Data entry/microcomputer applications*
Fine arts and art studies*Liberal arts and sciences, general studies and humanities*
Social sciences, general*Computer software and media applications*Allied health and medical assisting services*
Education, general*Mental and social health services and allied professions*
Somatic bodywork and related therapeutic services*Library and archives assisting*
Film/video and photographic arts*Social work*
Rehabilitation and therapeutic professions*Human services, general*
Health services/allied health/health sciences, general*Foods, nutrition and related services
Specialized sales, merchandising and marketing operations*Dental support services and allied professions*
Design and applied arts*Health and physical education/fitness
Hospitality administration/management*Practical nursing, vocational nursing and nursing assistants*
General sales, merchandising and related marketing operationsGraphic communications
Computer/information technology administration and managementForestry
Parks, recreation and leisure studiesOphthalmic and optometric support services and allied professions
All fields of studyLegal support services*
Business administration, management and operations*Accounting and related services*
Drafting/design engineering technologies/techniciansBusiness/commerce, general*
Real estate*Biological and physical sciences*
Audiovisual communications technologies/technicians*Science technologies/technicians, general*
Finance and financial management services*Marketing*
Clinical/medical laboratory science/research and allied professions*Computer and information sciences and support services, general*
Architectural sciences and technology*Communication and media studies*
Computer systems analysis/analyst*Insurance*
Computer programming*Electrical and electronic engineering technologies/technicians*
Journalism*Quality control and safety technologies/technicians*
Industrial production technologies/technicians*Human resources management and services*
Computer engineering technologies/technicians*Public relations, advertising and applied communication*
Criminal justice and corrections*Civil engineering technology/technician*
Computer science*Environmental control technologies/technicians*
Engineering technology, general*Natural resources management and policy*Physical science technologies/technicians*
Allied health diagnostic, intervention and treatment professions*Registered nursing, nursing administration, nursing research and clinical nursing*
Criminology*
* significantly different from reference category (p<0.05)Notes: The 5% significance level indicates that the field of study is different than the average across all fields. The sample includes 25- to 54-year-olds who completed their highest level of education in Canada, who worked full year, full time (i.e., 49 to 52 weeks, mainly full time) as a paid employee, with positive wages and zero self-employment income. CIP: Classification of Instructional Programs. Source: Statistics Canada, 2011 National Household Survey.
10Economic Insights, no. 056, March 2016 • Statistics Canada, Catalogue no. 11-626-XEarnings of Postsecondary Graduates by Detailed Field of Study
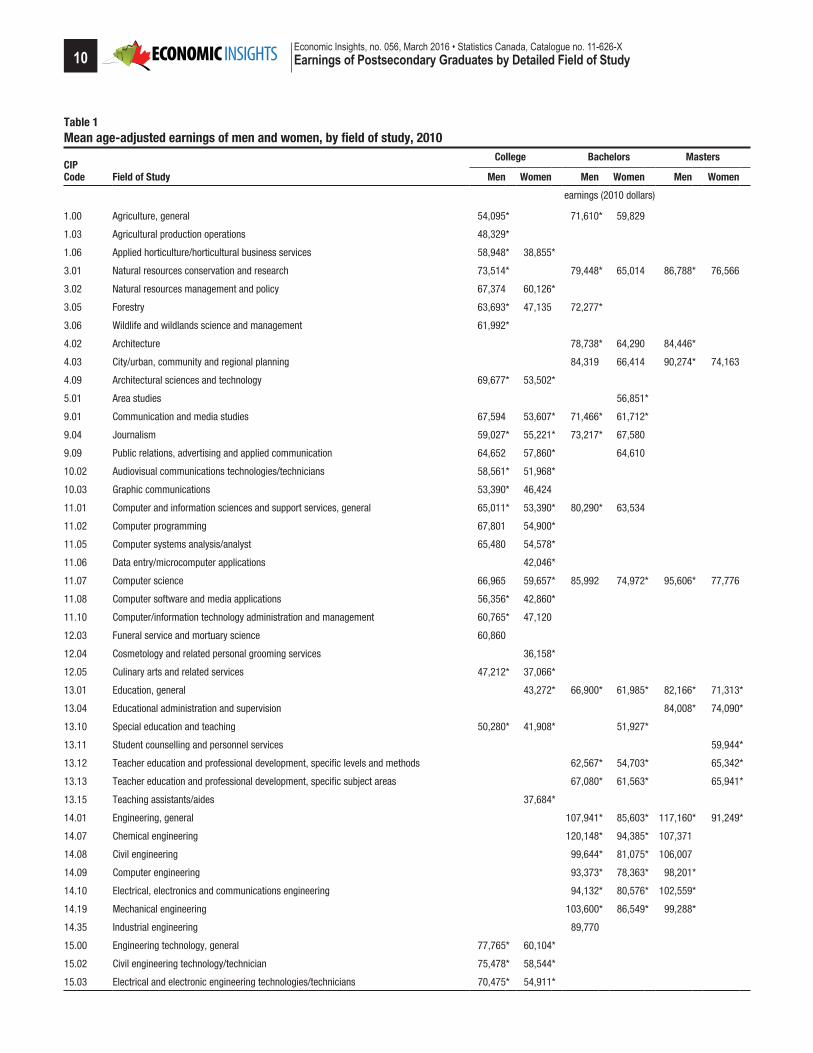
Table 1 Mean age‑adjusted earnings of men and women, by field of study, 2010
CIP Code
College Bachelors Masters
Field of Study Men Women Men Women Men Women
earnings (2010 dollars)
1.00 Agriculture, general 54,095* 71,610* 59,829
1.03 Agricultural production operations 48,329*
1.06 Applied horticulture/horticultural business services 58,948* 38,855*
3.01 Natural resources conservation and research 73,514* 79,448* 65,014 86,788* 76,566
3.02 Natural resources management and policy 67,374 60,126*
3.05 Forestry 63,693* 47,135 72,277*
3.06 Wildlife and wildlands science and management 61,992*
4.02 Architecture 78,738* 64,290 84,446*
4.03 City/urban, community and regional planning 84,319 66,414 90,274* 74,163
4.09 Architectural sciences and technology 69,677* 53,502*
5.01 Area studies 56,851*
9.01 Communication and media studies 67,594 53,607* 71,466* 61,712*
9.04 Journalism 59,027* 55,221* 73,217* 67,580
9.09 Public relations, advertising and applied communication 64,652 57,860* 64,610
10.02 Audiovisual communications technologies/technicians 58,561* 51,968*
10.03 Graphic communications 53,390* 46,424
11.01 Computer and information sciences and support services, general 65,011* 53,390* 80,290* 63,534
11.02 Computer programming 67,801 54,900*
11.05 Computer systems analysis/analyst 65,480 54,578*
11.06 Data entry/microcomputer applications 42,046*
11.07 Computer science 66,965 59,657* 85,992 74,972* 95,606* 77,776
11.08 Computer software and media applications 56,356* 42,860*
11.10 Computer/information technology administration and management 60,765* 47,120
12.03 Funeral service and mortuary science 60,860
12.04 Cosmetology and related personal grooming services 36,158*
12.05 Culinary arts and related services 47,212* 37,066*
13.01 Education, general 43,272* 66,900* 61,985* 82,166* 71,313*
13.04 Educational administration and supervision 84,008* 74,090*
13.10 Special education and teaching 50,280* 41,908* 51,927*
13.11 Student counselling and personnel services 59,944*
13.12 Teacher education and professional development, specific levels and methods 62,567* 54,703* 65,342*
13.13 Teacher education and professional development, specific subject areas 67,080* 61,563* 65,941*
13.15 Teaching assistants/aides 37,684*
14.01 Engineering, general 107,941* 85,603* 117,160* 91,249*
14.07 Chemical engineering 120,148* 94,385* 107,371
14.08 Civil engineering 99,644* 81,075* 106,007
14.09 Computer engineering 93,373* 78,363* 98,201*
14.10 Electrical, electronics and communications engineering 94,132* 80,576* 102,559*
14.19 Mechanical engineering 103,600* 86,549* 99,288*
14.35 Industrial engineering 89,770
15.00 Engineering technology, general 77,765* 60,104*
15.02 Civil engineering technology/technician 75,478* 58,544*
15.03 Electrical and electronic engineering technologies/technicians 70,475* 54,911*
11Economic Insights, no. 056, March 2016 • Statistics Canada, Catalogue no. 11-626-X
Earnings of Postsecondary Graduates by Detailed Field of Study
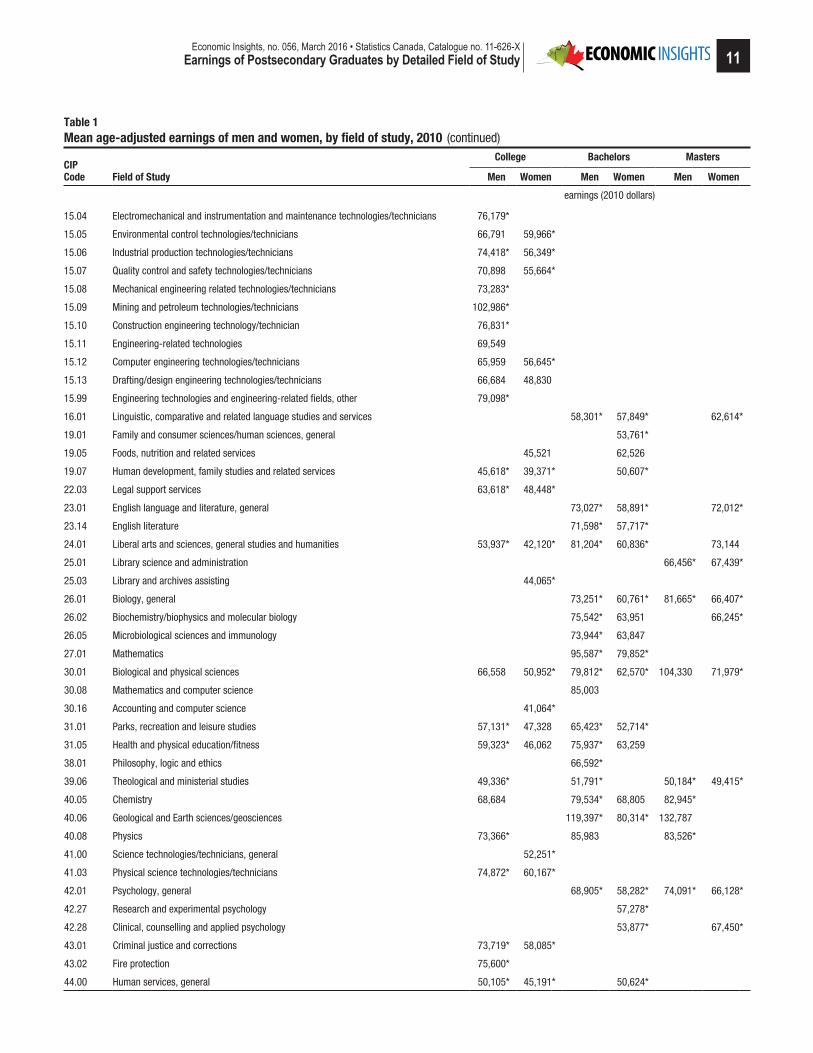
Table 1 Mean age‑adjusted earnings of men and women, by field of study, 2010
CIP Code
College Bachelors Masters
Field of Study Men Women Men Women Men Women
earnings (2010 dollars)
15.04 Electromechanical and instrumentation and maintenance technologies/technicians 76,179*
15.05 Environmental control technologies/technicians 66,791 59,966*
15.06 Industrial production technologies/technicians 74,418* 56,349*
15.07 Quality control and safety technologies/technicians 70,898 55,664*
15.08 Mechanical engineering related technologies/technicians 73,283*
15.09 Mining and petroleum technologies/technicians 102,986*
15.10 Construction engineering technology/technician 76,831*
15.11 Engineering-related technologies 69,549
15.12 Computer engineering technologies/technicians 65,959 56,645*
15.13 Drafting/design engineering technologies/technicians 66,684 48,830
15.99 Engineering technologies and engineering-related fields, other 79,098*
16.01 Linguistic, comparative and related language studies and services 58,301* 57,849* 62,614*
19.01 Family and consumer sciences/human sciences, general 53,761*
19.05 Foods, nutrition and related services 45,521 62,526
19.07 Human development, family studies and related services 45,618* 39,371* 50,607*
22.03 Legal support services 63,618* 48,448*
23.01 English language and literature, general 73,027* 58,891* 72,012*
23.14 English literature 71,598* 57,717*
24.01 Liberal arts and sciences, general studies and humanities 53,937* 42,120* 81,204* 60,836* 73,144
25.01 Library science and administration 66,456* 67,439*
25.03 Library and archives assisting 44,065*
26.01 Biology, general 73,251* 60,761* 81,665* 66,407*
26.02 Biochemistry/biophysics and molecular biology 75,542* 63,951 66,245*
26.05 Microbiological sciences and immunology 73,944* 63,847
27.01 Mathematics 95,587* 79,852*
30.01 Biological and physical sciences 66,558 50,952* 79,812* 62,570* 104,330 71,979*
30.08 Mathematics and computer science 85,003
30.16 Accounting and computer science 41,064*
31.01 Parks, recreation and leisure studies 57,131* 47,328 65,423* 52,714*
31.05 Health and physical education/fitness 59,323* 46,062 75,937* 63,259
38.01 Philosophy, logic and ethics 66,592*
39.06 Theological and ministerial studies 49,336* 51,791* 50,184* 49,415*
40.05 Chemistry 68,684 79,534* 68,805 82,945*
40.06 Geological and Earth sciences/geosciences 119,397* 80,314* 132,787
40.08 Physics 73,366* 85,983 83,526*
41.00 Science technologies/technicians, general 52,251*
41.03 Physical science technologies/technicians 74,872* 60,167*
42.01 Psychology, general 68,905* 58,282* 74,091* 66,128*
42.27 Research and experimental psychology 57,278*
42.28 Clinical, counselling and applied psychology 53,877* 67,450*
43.01 Criminal justice and corrections 73,719* 58,085*
43.02 Fire protection 75,600*
44.00 Human services, general 50,105* 45,191* 50,624*
(continued)

12Economic Insights, no. 056, March 2016 • Statistics Canada, Catalogue no. 11-626-XEarnings of Postsecondary Graduates by Detailed Field of Study
Table 1 Mean age‑adjusted earnings of men and women, by field of study, 2010
CIP Code
College Bachelors Masters
Field of Study Men Women Men Women Men Women
earnings (2010 dollars)
44.04 Public administration 93,377* 83,196*
44.07 Social work 53,919* 44,548* 56,407* 56,717* 62,958* 67,453*
45.01 Social sciences, general 57,877* 42,449* 74,354* 61,836
45.02 Anthropology 69,949* 54,901*
45.04 Criminology 76,813* 63,721* 79,744* 61,410*
45.06 Economics 93,256* 69,814* 112,519 81,987
45.07 Geography and cartography 61,151* 76,031* 59,713* 80,344*
45.10 Political science and government 85,069 66,182 89,773* 78,393
45.11 Sociology 73,934* 59,502* 68,619*
46.00 Construction trades, general 59,776
46.02 Carpentry/carpenter 55,822*
46.03 Electrical and power transmission installers 70,034*
46.04 Building/construction finishing, management and inspection 59,263*
46.05 Plumbing and related water supply services 67,399
47.00 Mechanics and repairers, general 58,229*
47.01 Electrical/electronics maintenance and repair technology 60,968*
47.02 Heating, air conditioning, ventilation and refrigeration maintenance technology/technician 64,987
47.03 Heavy/industrial equipment maintenance technologies 72,339*
47.05 Stationary energy sources installer and operator 95,567*
47.06 Vehicle maintenance and repair technologies 61,136*
48.05 Precision metal working 61,442*
48.07 Woodworking 49,989*
49.01 Air transportation 85,556*
49.02 Ground transportation 59,320*
49.03 Marine transportation 79,132*
50.04 Design and applied arts 54,600* 45,980* 65,476* 59,240
50.05 Drama/theatre arts and stagecraft 54,825* 53,412*
50.06 Film/video and photographic arts 54,651* 44,102* 64,988*
50.07 Fine arts and art studies 54,032* 42,052* 62,189* 53,040*
50.09 Music 52,817* 55,942* 52,516*
51.00 Health services/allied health/health sciences, general 45,423* 61,677*
51.02 Communication disorders sciences and services 73,463*
51.06 Dental support services and allied professions 45,753*
51.07 Health and medical administrative services 40,636*
51.08 Allied health and medical assisting services 60,631* 42,976*
51.09 Allied health diagnostic, intervention and treatment professions 77,286* 62,415* 68,532*
51.10 Clinical/medical laboratory science/research and allied professions 61,537* 53,321*
51.15 Mental and social health services and allied professions 43,645*
51.18 Ophthalmic and optometric support services and allied professions 47,481
51.22 Public health 76,621
51.23 Rehabilitation and therapeutic professions 44,656* 72,888* 63,113 80,090
51.26 Health aides/attendants/orderlies 45,193* 36,485*
51.31 Dietetics and clinical nutrition services 41,547* 60,141*
(continued)
13Economic Insights, no. 056, March 2016 • Statistics Canada, Catalogue no. 11-626-X
Earnings of Postsecondary Graduates by Detailed Field of Study
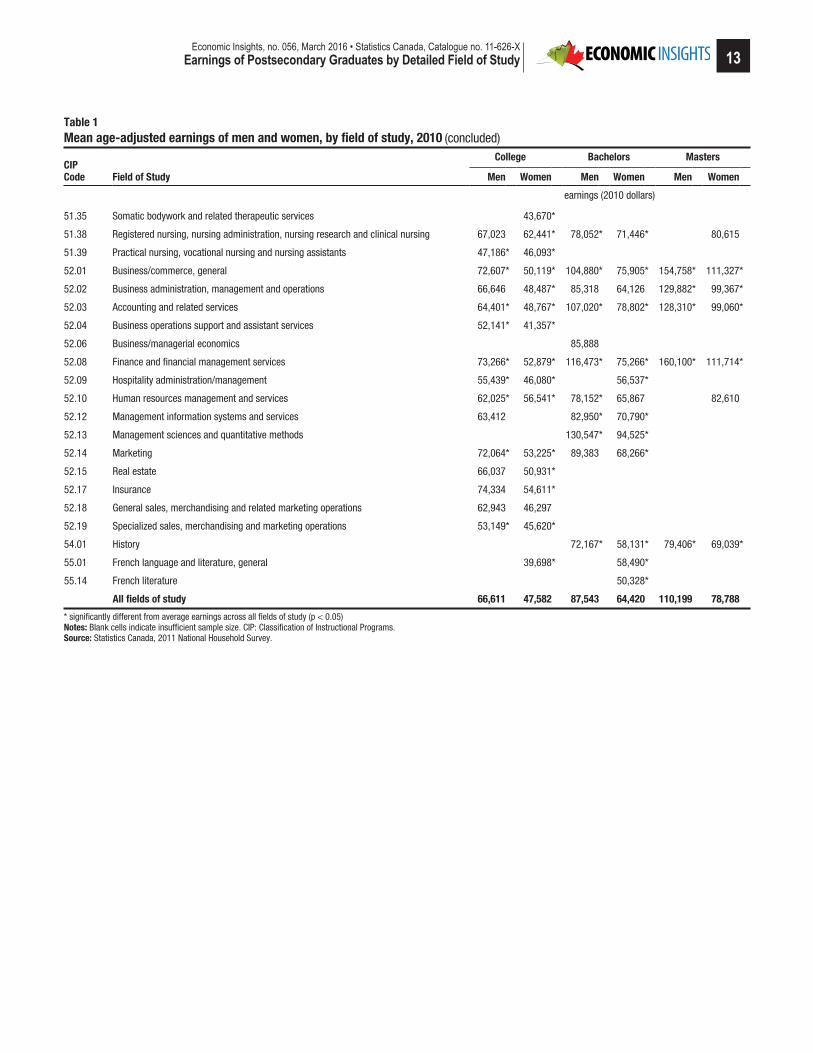
Table 1 Mean age‑adjusted earnings of men and women, by field of study, 2010
CIP Code
College Bachelors Masters
Field of Study Men Women Men Women Men Women
earnings (2010 dollars)
51.35 Somatic bodywork and related therapeutic services 43,670*
51.38 Registered nursing, nursing administration, nursing research and clinical nursing 67,023 62,441* 78,052* 71,446* 80,615
51.39 Practical nursing, vocational nursing and nursing assistants 47,186* 46,093*
52.01 Business/commerce, general 72,607* 50,119* 104,880* 75,905* 154,758* 111,327*
52.02 Business administration, management and operations 66,646 48,487* 85,318 64,126 129,882* 99,367*
52.03 Accounting and related services 64,401* 48,767* 107,020* 78,802* 128,310* 99,060*
52.04 Business operations support and assistant services 52,141* 41,357*
52.06 Business/managerial economics 85,888
52.08 Finance and financial management services 73,266* 52,879* 116,473* 75,266* 160,100* 111,714*
52.09 Hospitality administration/management 55,439* 46,080* 56,537*
52.10 Human resources management and services 62,025* 56,541* 78,152* 65,867 82,610
52.12 Management information systems and services 63,412 82,950* 70,790*
52.13 Management sciences and quantitative methods 130,547* 94,525*
52.14 Marketing 72,064* 53,225* 89,383 68,266*
52.15 Real estate 66,037 50,931*
52.17 Insurance 74,334 54,611*
52.18 General sales, merchandising and related marketing operations 62,943 46,297
52.19 Specialized sales, merchandising and marketing operations 53,149* 45,620*
54.01 History 72,167* 58,131* 79,406* 69,039*
55.01 French language and literature, general 39,698* 58,490*
55.14 French literature 50,328*
All fields of study 66,611 47,582 87,543 64,420 110,199 78,788
* significantly different from average earnings across all fields of study (p < 0.05)Notes: Blank cells indicate insufficient sample size. CIP: Classification of Instructional Programs.Source: Statistics Canada, 2011 National Household Survey.
(concluded)
14Economic Insights, no. 056, March 2016 • Statistics Canada, Catalogue no. 11-626-XEarnings of Postsecondary Graduates by Detailed Field of Study
ReferencesAndrews, F. M., J. N. Morgan, J. A. Sonquist, and L. Klem. 1967. Multiple Classification Analysis: A Report on a Computer Program for Multiple Regression Using Categorical Predictors. Ann Arbor: The Institute for Social Research.
Arcidiacono, P. 2004. “Ability sorting and the returns to college major.” Journal of Econometrics 121(1-2): 343–375.
Drolet, M. 2002. The “Who, What, When, and Where” of Gender Pay Differentials. The Evolving Workplace Series no. 4. Statistics Canada Catalogue no. 71-584-MIE. Ottawa: Statistics Canada and Human Resources Development Canada.
Finnie, R. 2001. “Fields of plenty, fields of lean: The early labour market outcomes of Canadian university graduates by discipline.” Canadian Journal of Higher Education 31 (1): 141–176.
Finnie, R., and M. Frenette. 2003. “Earnings differences by major field of study: Evidence from three cohorts of recent Canadian graduates.” Economics of Education Review 22 (2): 179–198.
Frank, K., and D. Walters. 2012. “Exploring the alignment between post-secondary education programs and earnings: An examination of 2005 Ontario graduates.” Canadian Journal of Higher Education 42 (3): 93–115.
Frank, K., M. Frenette, and R. Morissette. 2015. Labour Market Outcomes of Young Postsecondary Graduates, 2005 to 2012. Economic Insights, no. 50. Statistics Canada Catalogue no. 11-626-X. Ottawa: Statistics Canada.
Gellatly, G. 2015. Recent Developments in the Canadian Economy: Fall 2015. Economic Insights, no. 53. Statistics Canada Catalogue no. 11-626-X. Ottawa: Statistics Canada.
Gunderson, M., and H. Krashinsky. 2009. Do Education Decisions Respond to Returns by Field of Study? Canadian Labour Market and Skills Researcher Network. Working Paper no. 47.
Ostrovsky, Y., and M. Frenette. 2014. The Cumulative Earnings of Postsecondary Graduates Over 20 Years: Results by Major Field of Study. Economic Insights, no. 40. Statistics Canada Catalogue no. 11-626-X. Ottawa: Statistics Canada.
Stark, A. 2007. Which Fields Pay, Which Fields Don’t? An Examination of the Returns to University Education in Canada by Detailed Field of Study. Working Paper 2007-03. Ottawa: Department of Finance.
Statistics Canada. 2011. Classification of Instructional Programs (CIP) Canada. Statistics Canada Catalogue no. 12-590-X. Ottawa: Statistics Canada.
Walters, D. 2004. “A comparison of the labour market outcomes of postsecondary graduates of various levels and fields over a four-cohort period.” Canadian Journal of Sociology 29 (1): 1–27.
15Economic Insights, no. 056, March 2016 • Statistics Canada, Catalogue no. 11-626-X
Earnings of Postsecondary Graduates by Detailed Field of Study
Data sources, methodology and definitions
Data sources
This study uses data from Statistics Canada’s 2011 National Household Survey (NHS). The sample includes men and women aged 25 to 54 whose highest level of postsecondary studies were completed in Canada. In addition, only those who had positive wages, no self‑employment income, worked as paid employees, and had full‑year, full‑time employment (i.e., they worked 49 to 52 weeks, mainly 30 hours or more per week) are included.
Only graduates from fields with 200 or more observations in the sample are retained for analysis. The resulting sample sizes were largest for college graduates, with 138,102 women and 129,843 men; among bachelor’s degree holders, there were 105,129 women and 92,489 men. Sample sizes for master’s degree holders are similar for women (19,226) and men (19,996). Based on the sample criteria, very few fields would have been retained for doctoral and professional degree holders, therefore they are not included in this study.
Methodology
The results presented in this study are based on age‑adjusted regression coefficients estimated by multiple classification analysis (MCA)—a technique that removes the arbitrariness associated with selecting a reference category for the fields of study (Andrews et al. 1967). The approach begins by running an ordinary least squares regression with one omitted category (as per usual). Each coefficient is then adjusted (including the one associated with the omitted category, which is set to zero) by subtracting from each of them the value of the linear combination of all of the coefficients associated with each category and their relative population share. The standard errors can then be estimated with a non‑parametric bootstrapping approach. Although it is not strictly necessary, bootstrapping the standard errors
accounts for the stratification inherent in the NHS. A total of 30 bootstrap iterations were applied in the study.
The resulting coefficients obtained from the MCA models are interpreted as a difference from the average earnings of individuals within a given group based on sex and education level. These coefficients were then used to calculate the average predicted earnings (in 2010 dollars) of graduates from each field of study, assuming they were all the same age (which was the average age for their sex and level).
Definitions
Bachelor’s degree: A univers i ty degree a t the undergraduate level, based on the highest certificate or degree. It excludes university certificates above or below a bachelor’s degree, and first professional degrees in medicine, dentistry, veterinary medicine or optometry. Graduates of LLB, JD and BCL programs, and legal research and advanced professional studies (post‑LLB/JD) programs, as well as pharmacy, pharmaceutical sciences and administration programs were also excluded from the analysis as these are typically associated with professional degrees.
College certificate: A certificate awarded by a college, CEGEP or other non‑university institution (excluding registered apprenticeships or trades certificates), based on the highest certificate or degree.
Field of study: The field of study is based on the 2011 Classification of Instructional Programs (CIP) Canada codes, available for the highest certificate or degree in the 2011 National Household Survey. Fields are reported at the detailed subseries (four‑digit) level (Statistics Canada 2011).
Master’s degree: A university degree at the graduate level, based on the highest certificate or degree.