Embed Size (px)
Citation preview

Second quarter Jan-Jun 12 months Jul 2014- Jun 2015
Full year 2014 SEKm 2015 2014 2015 2014
Group
Net sales 25,542 22,223 49,215 41,978 94,411 87,174
Operating profit before depreciation (EBITDA) 1,448 1,752 2,594 2,780 5,633 5,819
Operating profit (EBIT) excluding non-recurring items 1,018 985 1,793 1,684 4,046 3,937
Operating profit (EBIT) 1,065 1,424 1,842 2,128 3,811 4,097
Profit before tax 961 1,338 1,647 1,953 3,421 3,727
Profit from continuing operations 786 1,145 1,315 1,622 2,798 3,105
Profit for the period 1,965 994 2,504 1,293 3,878 2,667
Cash flow from continuing operating activities 2,685 1,522 2,906 1,723 4,977 3,794
Cash flow from operating activities 2,711 1,544 3,027 1,607 5,032 3,612
Operating margin excluding non-recurring items, % 4.0 4.4 3.6 4.0 4.3 4.5
Operating margin, % 4.2 6.4 3.7 5.1 4.0 4.7
Return on capital employed, % - - 8.9 9.7 8.9 10.1
Return on equity, % - - 15.3 8.6 15.3 9.3
Earnings per ordinary share, SEK 1 9.63 4.65 12.19 6.15 18.57 12.53
Earnings per ordinary share, continuing operations, SEK 1 3.77 5.40 6.28 7.79 13.20 14.71
1 Same figure for ordinary shares and C shares.


Net sales per segment (SEKm)
Second quarter
Jan-Jun
12 months Jul 2014- Jun 2015
Full year 2014 SEKm 2015 2014 2015 2014
ICA Sweden 18,340 17,811
35,364 33,482 71,130 69,248
Rimi Baltic 3,136 2,888
6,068 5,485 12,215 11,632
Apotek Hjärtat1), 2)
3,212 535
5,995 1,004 7,083 2,092
ICA Bank 214 218
420 434 834 848
ICA Real Estate 594 560
1,176 1,116 2,313 2,253
Portfolio Companies 393 587
914 1,152 2,326 2,564
Other 27 22
53 46 104 97
Intra-group sales -374 -398
-775 -741 -1,594 -1,560
Net sales 25,542 22,223
49,215 41,978 94,411 87,174
Operating profit excluding non-recurring items per segment (SEKm)
Second quarter
Jan-Jun 12 months
Jul 2014- Jun 2015
Full year 2014 SEKm 2015 2014 2015 2014
ICA Sweden 864 833 1,558 1,451 3,335 3,228
Rimi Baltic 99 86 177 145 415 383
Apotek Hjärtat1), 2)
79 7 104 0 125 21
ICA Bank 24 47 40 86 143 189
ICA Real Estate 106 108 210 202 417 409
Portfolio Companies -46 -14 -89 -50 14 53
Other -108 -82 -207 -150 -403 -346
Operating profit excluding non-recurring items 1,018 985 1,793 1,684 4,046 3,937
1) Acquisition- and integration-related costs of SEK -27 million in the second quarter and SEK -80 million in January-June. 2) 2014 relates to Cura pharmacies in all periods.
0
3
6
9
12
15
18
21
24
27
0
100
200
300
400
500
Q313
Q413
Q114
Q214
Q314
Q414
Q115
Q215
MSEK %
Lorem ipsum Ipsum lorem
1 110 1 058
699
985
1 172
1 081
775
1 018
0,0
1,0
2,0
3,0
4,0
5,0
6,0
0
200
400
600
800
1 000
1 200
Q313
Q413
Q114
Q214
Q314
Q414
Q115
Q215
SEKm %
EBIT excl. non-recurring items
EBIT margin excl. non recurring items, R12
20 800 21 820
19 755
22 223 22 016 23 180 23 673
25 542
0
20 000
40 000
60 000
80 000
100 000
120 000
0
5 000
10 000
15 000
20 000
25 000
30 000
Q313
Q413
Q114
Q214
Q314
Q414
Q115
Q215
SEKm SEKm
Net sales
Net sales, R12
Consolidated cash flow statement, excluding ICA Bank
Second quarter
Jan-Jun 12 months
Jul 2014- Jun 2015
Full year 2014 SEKm 2015 2014 2015 2014
Cash flow
From operating activities before change in working capital 1,181 1,136 2,183 1,789 4,758 4,364
Change in working capital 721 780 -256 50 -606 -300
From operating activities 1,902 1,916 1,927 1,839 4,152 4,064
Investing activities, net 2,112 95 -1,994 -524 -2,016 -546
Before financing activities 4,014 2,011 -67 1,315 2,136 3,518
0
3
6
9
12
15
18
21
24
27
0
100
200
300
400
500
Q313
Q413
Q114
Q214
Q314
Q414
Q115
Q215
MSEK %
Lorem ipsum Ipsum lorem
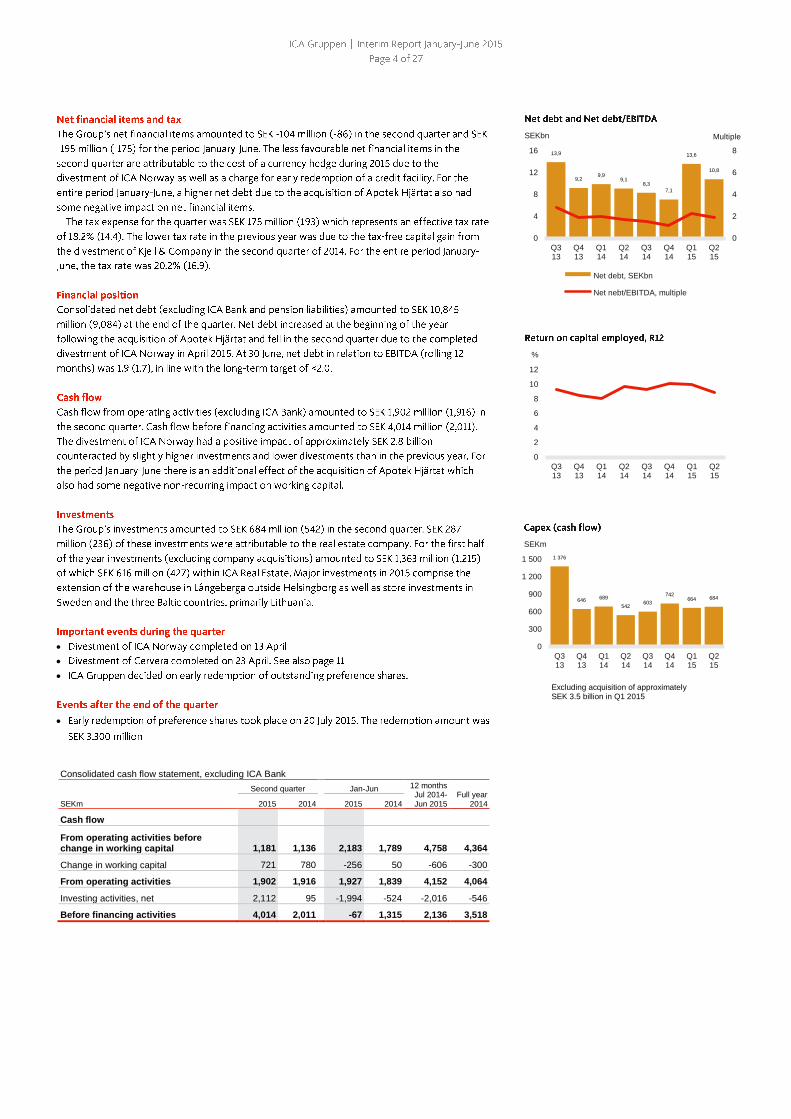
13,9
9,2 9,9
9,1 8,3
7,1
13,6
10,8
0
2
4
6
8
0
4
8
12
16
Q313
Q413
Q114
Q214
Q314
Q414
Q115
Q215
SEKbn Multiple
Net debt, SEKbn
Net nebt/EBITDA, multiple
0
2
4
6
8
10
12
Q313
Q413
Q114
Q214
Q314
Q414
Q115
Q215
%
1 376
646 689
542 603
742 664 684
0
300
600
900
1 200
1 500
Q313
Q413
Q114
Q214
Q314
Q414
Q115
Q215
SEKm
Excluding acquisition of approximately SEK 3.5 billion in Q1 2015

ICA Sweden
Second quarter
Jan-Jun
12 months Jul 2014- Jun 2015
Full year 2014
2015 2014 2015 2014
Net sales, SEKm 18,340 17,811 35,364 33,482 71,130 69,248
Operating profit before depreciation (EBITDA), SEKm 961 914 1,748 1,616 3,713 3,581
Operating profit excl. non-recurring items, SEKm 864 833 1,558 1,451 3,335 3,228
Operating margin excl. non-recurring items, % 4.7 4.7 4.4 4.3 4.7 4.7
Investments, SEKm 158 140 354 276 704 626
Depreciation, SEKm 97 83 190 167 381 358
Number of employees - - 8,061 7,409 - 7,560
Private label share of store sales, % - - 23.4 22.4 - 22.7
16 765 17 251
15 671
17 811 17 550 18 216
17 024 18 340
0
20 000
40 000
60 000
80 000
100 000
0
4 000
8 000
12 000
16 000
20 000
Q313
Q413
Q114
Q214
Q314
Q414
Q115
Q215
SEKm SEKm
Net sales
Net sales, R12
897 828
618
833
970
807
694
864
0,0
1,0
2,0
3,0
4,0
5,0
0
200
400
600
800
1 000
Q313
Q413
Q114
Q214
Q314
Q414
Q115
Q215
SEKm %
EBIT excl. non-recurring items
EBIT margin excl. non recurring items, R12
0
3
6
9
12
15
18
21
24
27
0
100
200
300
400
500
Q313
Q413
Q114
Q214
Q314
Q414
Q115
Q215
MSEK %
Lorem ipsum Ipsum lorem

Store sales in Sweden
April-June 2015
January-June 2015
Store sales excl. VAT SEKm Change all
stores Change like-
for-like SEKm Change all
stores Change like
for like
Maxi ICA Stormarknad 8,413 4.3 1.9 15,934 5.8 3.5
ICA Kvantum 6,694 4.1 2.7 12,862 4.9 3.3
ICA Supermarket 8,349 1.2 1.6 16,066 2.2 2.6
ICA Nära 4,088 1.4 1.9 7,805 2.4 2.9
Total 27,544 2.9 2.0 52,667 3.9 3.1
Number of stores in Sweden
Format December
2014 New Converted Closed June 2015
Maxi ICA Stormarknad 79 2 81
ICA Kvantum 123 1 -1 123
ICA Supermarket 431 1 -1 -1 430
ICA Nära 676 1 -10 667
ICA To Go 5 -1 4
Total 1,314 4 0 -13 1,305

Rimi Baltic
Second quarter
Jan-Jun
12 months Jul 2014-Jun 2015
Full year 2014
2015 2014 2015 2014
Net sales, SEKm 3,136 2,888 6,068 5,485 12,215 11,632
Operating profit before depreciation (EBITDA), SEKm 235 156 385 284 823 722
Operating profit excl. non-recurring items, SEKm 99 86 177 145 415 383
Operating margin excl. non-recurring items, % 3,2 3,0 2,9 2,6 3,4 3,3
Investments, SEKm 98 61 171 321 350 500
Depreciation, SEKm 72 70 144 139 290 285
Number of employees - - 9,228 8,737 - 8,995
Private label share of sales, % - - 21.5 20.0 - 19.9
EUR exchange rate, average 9.3015 9.0505 9.3391 8.9578 9.2960 9.1093
Store sales in the Baltic countries
April-June 2015
January-June 2015
Store sales excl. VAT EURm Change all
stores Change like-
for-like EURm Change all
stores Change like-
for-like
Estonia 93 1.4 0.4 179 1.6 0.7
Latvia 173 4.4 1.3 333 4.8 2.5
Lithuania 69 15.3 2.0 134 16.9 2.0
Total 335 5.6 1.2 646 6.1 1.9
Number of stores in the Baltic countries
Country December
2014 New Close June 2015
Estonia 84 2 -1 85
Latvia 112 2 114
Lithuania 46 4 50
Total 242 8 -1 249
294 320
293 319 320
344 313
337
0
300
600
900
1 200
1 500
0
100
200
300
400
500
Q313
Q413
Q114
Q214
Q314
Q414
Q115
Q215
EURm EURm
Net sales
Net sales, R12
9,8
12,7
6,7
9,5 10,1
15,6
8,4
10,6
0,0
1,0
2,0
3,0
4,0
5,0
0
3
6
9
12
15
Q313
Q413
Q114
Q214
Q314
Q414
Q115
Q215
EURm %
EBIT excl. non-recurring items
EBIT margin excl. non recurring items, R12
0
3
6
9
12
15
18
21
24
27
0
100
200
300
400
500
Q313
Q413
Q114
Q214
Q314
Q414
Q115
Q215
MSEK %
Lorem ipsum Ipsum lorem

Apotek Hjärtat
Second quarter
Jan-June 12 months
Jul 2014-Jun 2015
Full year 2014
2015 2014 2015 2014
Net sales, SEKm Of which: 3,212 535 5,995 1,004 7,083 2,092
– Prescription drugs 2,214 314 4,236 596 4,900 1,260
– OTC drugs 355 128 695 235 931 471
– Other products and services 447 93 868 173 1 056 361
Operating profit before depreciation (EBITDA), SEKm 114 17 175 20 213 58
Operating profit excl. non-recurring items, SEKm 79 7 104 0 125 21
Operating margin excl. non-recurring
items, % 2.5 1.3 1.7 0.0 1.8 1.0
Investments, SEKm 12 9 24 19 35 30
Depreciation, SEKm 35 10 71 20 88 37
Number of employees - - 3,070 633 - 653
Private label share of other products, % - - 17.4 7,1 - 7.2
Number of pharmacies
December
2014 Acquired New Closed June 2015
Apotek Hjärtat 67 307 7 -1 380
0
3
6
9
12
15
18
21
24
27
0
100
200
300
400
500
Q313
Q413
Q114
Q214
Q314
Q414
Q115
Q215
MSEK %
Lorem ipsum Ipsum lorem

ICA Real Estate
Second quarter
Jan-Jun 12 months
Jul 2014-Jun 2015
Full year 2014
2015 2014 2015 2014
Net sales, SEKm 594 560 1,176 1,116 2,313 2,253
Of which rental income owned properties, SEKm 301 289 586 576 1,157 1,147
Operating profit before depreciation
(EBITDA), SEKm 243 238 477 461 989 973
Operating profit excl. non-recurring items, SEKm 106 108 210 202 417 409
Operating margin excl. non-recurring items, % 17.8 19.3 17.9 18.1 18.0 18.2
Investments, SEKm 287 236 616 427 1,244 1,055
Divestments, SEKm 0 6 0 5 1,032 1,037
Depreciation, SEKm 137 129 267 258 524 515
Yield, % - - 6.9 6.9 - 6.9
Occupancy rate, % - - 98.2 97.9 - 98.3
Number of owned properties - - 186 203 - 185
Number of owned square metres, 000 sq. m. - - 841 824 - 716
Number of employees - - 84 77 - 77
564 573 556 560 562 575 582 594
0
500
1 000
1 500
2 000
2 500
3 000
0
100
200
300
400
500
600
Q313
Q413
Q114
Q214
Q314
Q414
Q115
Q215
SEKm SEKm
Net sales
Net sales, R12
126 123
94
108 112
95
104 106
0
5
10
15
20
25
0
25
50
75
100
125
Q313
Q413
Q114
Q214
Q314
Q414
Q115
Q215
SEKm %
EBIT excl. non-recurring items
EBIT margin excl. non recurring items, R12
0
3
6
9
12
15
18
21
24
27
0
100
200
300
400
500
Q313
Q413
Q114
Q214
Q314
Q414
Q115
Q215
MSEK %
Lorem ipsum Ipsum lorem

ICA Bank
Second quarter
Jan-Jun 12 months
Jul 2014-Jun 2015
Full year 2014
2015 2014 2015 2014
Revenues, SEKm 214 218 420 434 834 848
Of which, net interest, SEKm 103 109 201 215 401 415
Operating profit before depreciation (EBITDA), SEKm 31 55 54 101 182 229
Operating profit excl. non-recurring items, SEKm 24 47 40 86 143 189
C/I ratio, % - - 82.9 76.9 - 78.9
Return on equity, % - - 6.2 10.2 - 8.0
Loan loss ratio, % - - -0.3 -0.4 - 0.1
Capital adequacy ratio, % - - 16.5 15.1 - 16.3
Business volume, SEKm - - 27,552 25,361 - 26,353
Number of employees - - 332 320 - 322
213 215 216 218 207 207 206
214
0
200
400
600
800
1 000
0
50
100
150
200
250
Q313
Q413
Q114
Q214
Q314
Q414
Q115
Q215
SEKm SEKm
Revenues
Revenues, R12
64
51
39
47
58
45
16
24
0
10
20
30
40
50
60
70
Q313
Q413
Q114
Q214
Q314
Q414
Q115
Q215
SEKm
0
3
6
9
12
15
18
21
24
27
0
100
200
300
400
500
Q313
Q413
Q114
Q214
Q314
Q414
Q115
Q215
MSEK %
Lorem ipsum Ipsum lorem

Portfolio Companies
Second quarter
Jan-Jun
12 months Jul 2014- Jun 2015
Full year 2014
2015 2014 2015 2014
Net sales, SEKm 393 587 914 1,152 2,326 2,564
Operating profit/loss after depreciation (EBITDA), SEKm -51 437 -81 409 108 598
Operating profit/loss excl. non-recurring items, SEKm -46 14 -89 -50 14 53
Operating margin excl. non-recurring items, % -11.7 -2.4 -9.7 -4.3 0.6 2.1
Investments, SEKm 7 14 24 27 46 49
Depreciation, SEKm 10 11 21 19 43 41
Number of employees - - 804 1,073 - 1,025
Store sales
April-June 2015
January-June 2015
Store sales excl. VAT SEKm Change all
stores Change like-
for-like SEKm Change all
stores Change like-
for-like
Hemtex 228 5.8 4.8 445 6.1 5.4
Number of stores, incl. franchise stores
December 2014 New Closed June 2015
Hemtex 157 1 158
0
3
6
9
12
15
18
21
24
27
0
100
200
300
400
500
Q313
Q413
Q114
Q214
Q314
Q414
Q115
Q215
MSEK %
Lorem ipsum Ipsum lorem

Ownership structure – Largest identified shareholders in ICA Gruppen at 30 June 2015
Number of shares Share of capital
and voting rights, %
ICA-handlarnas förbund 103,163,599 51.3%
Industrivärden 20,990,000 10.4%
Handelsbanken 3,045,752 1.5%
Skandia 2,596,431 1.3%
Robur 1,851,908 0.9%
SEB 1,585,770 0.8%
L Jönsson 1,259,601 0.6%
Länsförsäkringar 905,511 0.5%
Folksam 777,775 0.4%
U Davidson 630,000 0.3%
Ten largest shareholders total: 136,806,347 68.0%
Other shareholders 64,340,448 32.0%
Total 201,146,795 100.0%
Source: Euroclear Sweden AB
Second quarter Jan-Jun
12 months Jul 2014-Jun 2015
Full year 2014
SEKm Note 2015 2014
2015 2014
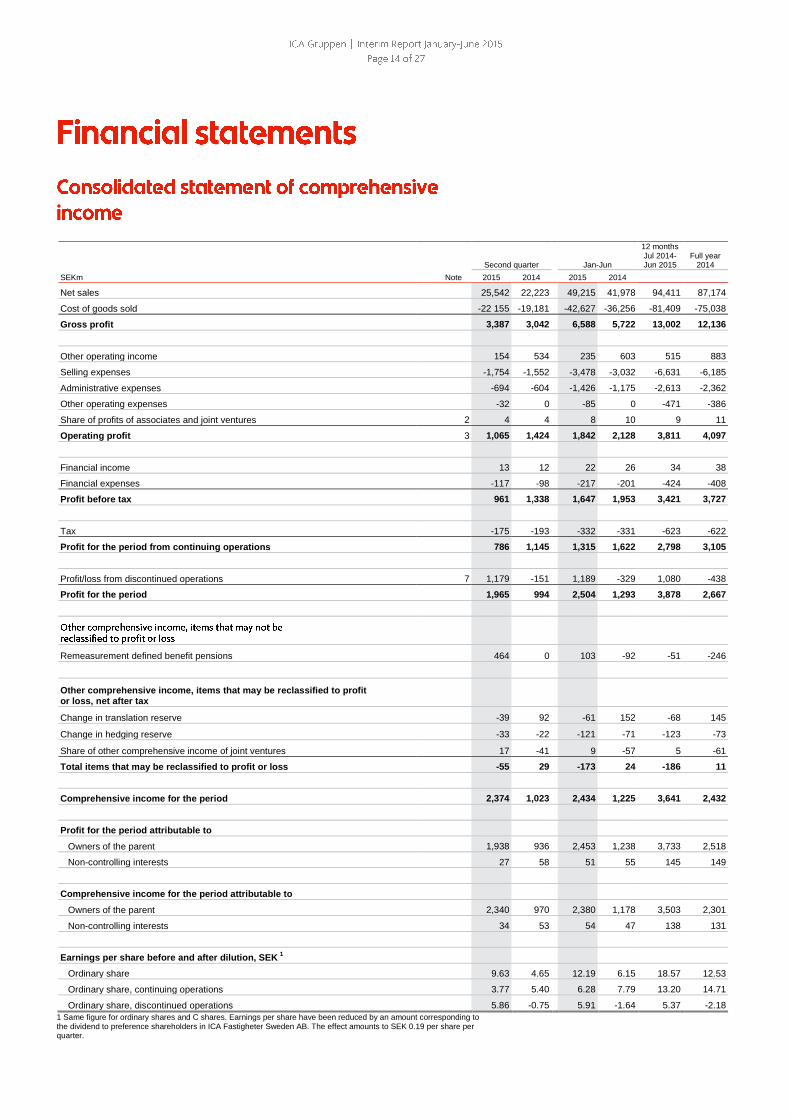
Net sales 25,542 22,223 49,215 41,978 94,411 87,174
Cost of goods sold -22 155 -19,181 -42,627 -36,256 -81,409 -75,038
Gross profit 3,387 3,042 6,588 5,722 13,002 12,136
Other operating income 154 534 235 603 515 883
Selling expenses -1,754 -1,552 -3,478 -3,032 -6,631 -6,185
Administrative expenses -694 -604 -1,426 -1,175 -2,613 -2,362
Other operating expenses -32 0 -85 0 -471 -386
Share of profits of associates and joint ventures 2 4 4 8 10 9 11
Operating profit 3 1,065 1,424 1,842 2,128 3,811 4,097
Financial income 13 12 22 26 34 38
Financial expenses -117 -98 -217 -201 -424 -408
Profit before tax 961 1,338 1,647 1,953 3,421 3,727
Tax -175 -193 -332 -331 -623 -622
Profit for the period from continuing operations 786 1,145 1,315 1,622 2,798 3,105
Profit/loss from discontinued operations 7 1,179 -151 1,189 -329 1,080 -438
Profit for the period 1,965 994 2,504 1,293 3,878 2,667
Remeasurement defined benefit pensions 464 0 103 -92 -51 -246
Other comprehensive income, items that may be reclassified to profit or loss, net after tax
Change in translation reserve -39 92 -61 152 -68 145
Change in hedging reserve -33 -22 -121 -71 -123 -73
Share of other comprehensive income of joint ventures 17 -41 9 -57 5 -61
Total items that may be reclassified to profit or loss -55 29 -173 24 -186 11
Comprehensive income for the period 2,374 1,023 2,434 1,225 3,641 2,432
Profit for the period attributable to
Owners of the parent 1,938 936 2,453 1,238 3,733 2,518
Non-controlling interests 27 58 51 55 145 149
Comprehensive income for the period attributable to
Owners of the parent 2,340 970 2,380 1,178 3,503 2,301
Non-controlling interests 34 53 54 47 138 131
Earnings per share before and after dilution, SEK 1
Ordinary share 9.63 4.65 12.19 6.15 18.57 12.53
Ordinary share, continuing operations 3.77 5.40 6.28 7.79 13.20 14.71
Ordinary share, discontinued operations 5.86 -0.75 5.91 -1.64 5.37 -2.18
1 Same figure for ordinary shares and C shares. Earnings per share have been reduced by an amount corresponding to the dividend to preference shareholders in ICA Fastigheter Sweden AB. The effect amounts to SEK 0.19 per share per quarter.

Note 30 June
2015 30 June
2014 31 December
2014
ASSETS
Non-current assets
Goodwill 16,322 11,867 11,545
Trademarks 13,636 13,086 13,112
Other intangible assets 979 856 803
Interests in joint ventures and associates 2 760 675 757
Deferred tax assets 289 359 254
Lending and investments in ICA Bank 6,932 6,771 7,159
Land, buildings and investment properties 15,277 16,316 15,923
Other non-current assets 1,976 2,477 1,703
Total non-current assets 56,171 52,407 51,256
Current assets
Inventories 4,314 4,139 3,566
Lending and investments in ICA Bank 2,859 2,997 3,075
Other current assets 5,987 4,484 4,926
Cash and cash equivalents in ICA Bank 3,469 2,580 2,380
Cash and cash equivalents 504 599 3,711
Total current assets 17,133 14,799 17,658
Assets held for sale 4 949 1,537 3,520
TOTAL ASSETS 74,253 68,743 72,434
EQUITY AND LIABILITIES
Equity 29,169 26,780 27,911
Non-current liabilities
Provisions 2,289 2,095 2,342
Deferred tax liabilities 4,961 4,895 4,839
Non-current interest-bearing liabilities 9,795 6,941 9,658
Other non-current liabilities 169 71 156
Total non-current liabilities 17,214 14,002 16,995
Current liabilities
Deposits ICA Bank 11,506 10,729 11,031
Current interest-bearing liabilities 1,555 2,695 1,277
Other current liabilities 14,700 14,272 13,298
Total current liabilities 27,761 27,696 25,606
Liabilities held for sale 4 109 265 1,922
TOTAL EQUITY AND LIABILITIES 74,253 68,743 72,434
Pledged assets 2,541 829 2,563
Contingent liabilities 190 203 208
Second quarter
Jan-Jun 12 months Jul 2014-Jun 2015
Full year 2014 SEKm Note 2015 2014
2015 2014
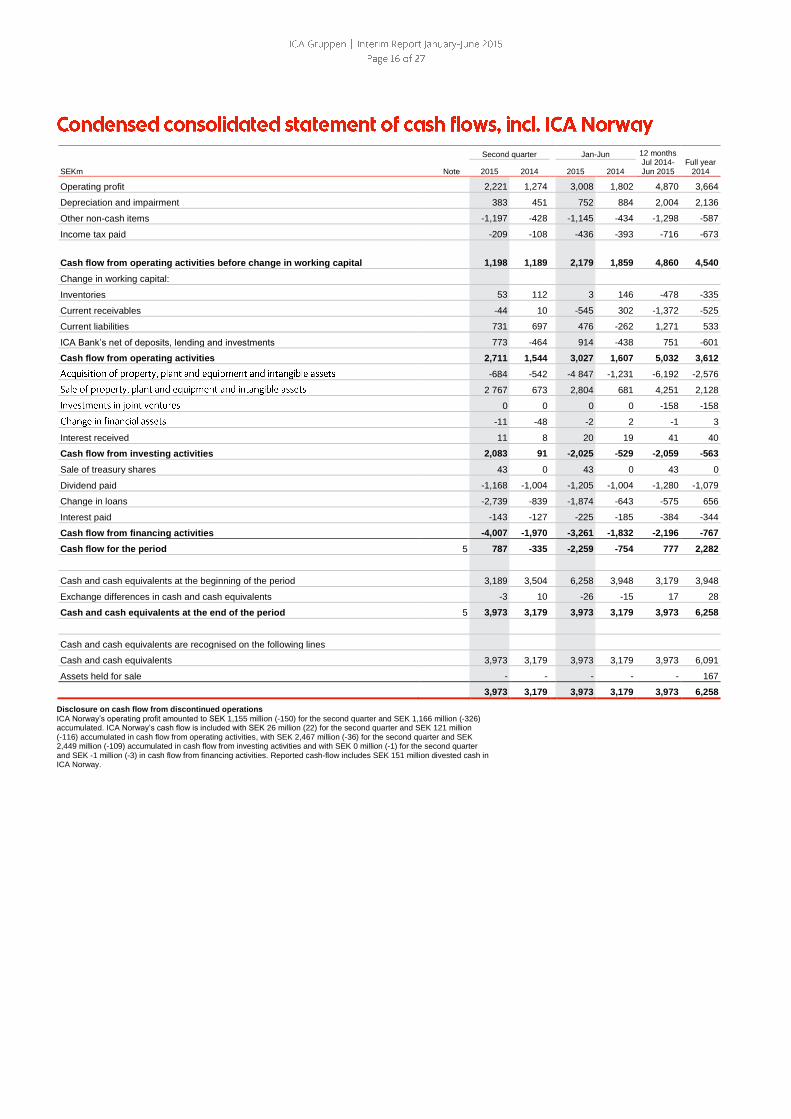
Operating profit 2,221 1,274
3,008 1,802 4,870 3,664
Depreciation and impairment 383 451
752 884 2,004 2,136
Other non-cash items -1,197 -428
-1,145 -434 -1,298 -587
Income tax paid -209 -108 -436 -393 -716 -673
Cash flow from operating activities before change in working capital 1,198 1,189 2,179 1,859 4,860 4,540
Change in working capital:
Inventories 53 112 3 146 -478 -335
Current receivables -44 10 -545 302 -1,372 -525
Current liabilities 731 697 476 -262 1,271 533
ICA Bank’s net of deposits, lending and investments 773 -464 914 -438 751 -601
Cash flow from operating activities 2,711 1,544 3,027 1,607 5,032 3,612
-684 -542 -4 847 -1,231 -6,192 -2,576
2 767 673 2,804 681 4,251 2,128
0 0 0 0 -158 -158
-11 -48 -2 2 -1 3
Interest received 11 8 20 19 41 40
Cash flow from investing activities 2,083 91 -2,025 -529 -2,059 -563
Sale of treasury shares 43 0 43 0 43 0
Dividend paid -1,168 -1,004 -1,205 -1,004 -1,280 -1,079
Change in loans -2,739 -839 -1,874 -643 -575 656
Interest paid -143 -127 -225 -185 -384 -344
Cash flow from financing activities -4,007 -1,970 -3,261 -1,832 -2,196 -767
Cash flow for the period 5 787 -335 -2,259 -754 777 2,282
Cash and cash equivalents at the beginning of the period 3,189 3,504 6,258 3,948 3,179 3,948
Exchange differences in cash and cash equivalents -3 10 -26 -15 17 28
Cash and cash equivalents at the end of the period 5 3,973 3,179 3,973 3,179 3,973 6,258
Cash and cash equivalents are recognised on the following lines
Cash and cash equivalents 3,973 3,179 3,973 3,179 3,973 6,091
Assets held for sale - - - - - 167
3,973 3,179 3,973 3,179 3,973 6,258
Disclosure on cash flow from discontinued operations
ICA Norway’s operating profit amounted to SEK 1,155 million (-150) for the second quarter and SEK 1,166 million (-326) accumulated. ICA Norway’s cash flow is included with SEK 26 million (22) for the second quarter and SEK 121 million (-116) accumulated in cash flow from operating activities, with SEK 2,467 million (-36) for the second quarter and SEK 2,449 million (-109) accumulated in cash flow from investing activities and with SEK 0 million (-1) for the second quarter and SEK -1 million (-3) in cash flow from financing activities. Reported cash-flow includes SEK 151 million divested cash in ICA Norway.
SEKm Note Attributable to owners of the
parent Attributable to non-controlling interests Total
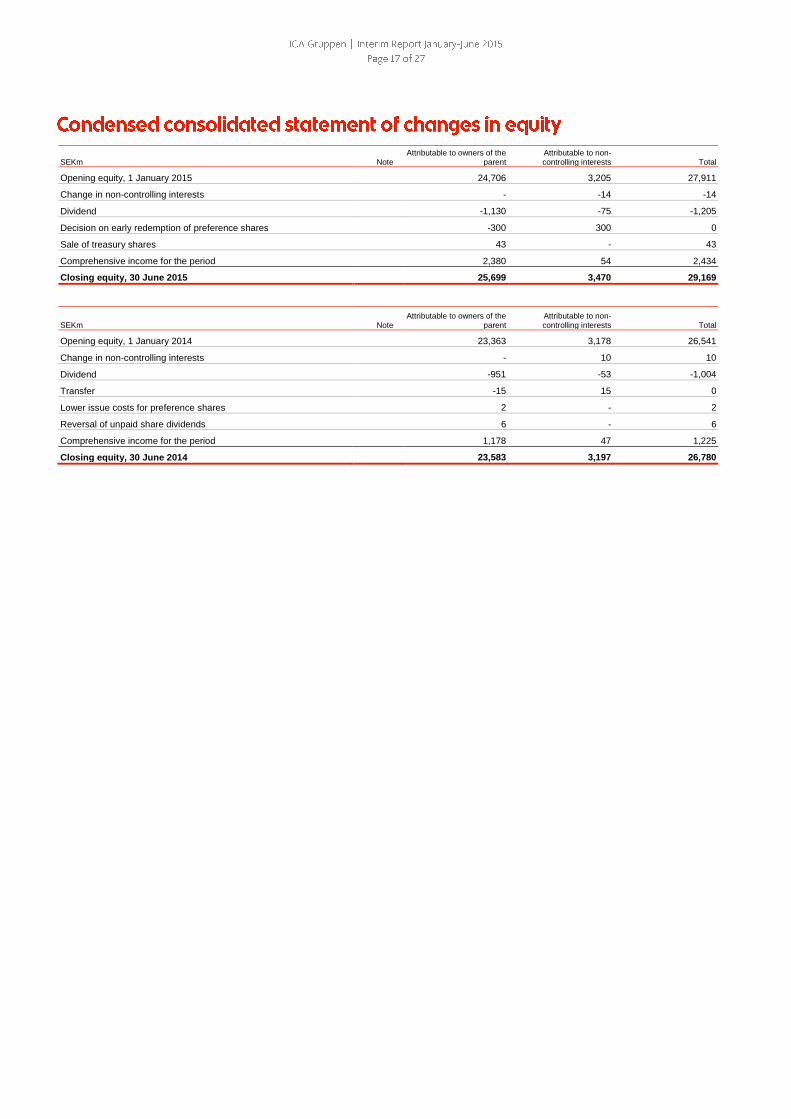
Opening equity, 1 January 2015 24,706 3,205 27,911
Change in non-controlling interests - -14 -14
Dividend -1,130 -75 -1,205
Decision on early redemption of preference shares -300 300 0
Sale of treasury shares 43 - 43
Comprehensive income for the period 2,380 54 2,434
Closing equity, 30 June 2015 25,699 3,470 29,169
SEKm Note Attributable to owners of the
parent Attributable to non-controlling interests Total
Opening equity, 1 January 2014 23,363 3,178 26,541
Change in non-controlling interests - 10 10
Dividend -951 -53 -1,004
Transfer -15 15 0
Lower issue costs for preference shares 2 - 2
Reversal of unpaid share dividends 6 - 6
Comprehensive income for the period 1,178 47 1,225
Closing equity, 30 June 2014 23,583 3,197 26,780

Book value 30 June Share of profit Jan-Jun
SEKm 2015 2014 2015 2014
Trade Press AS - - 0 0
Kjell & Co Elektronik AB - - - 11
Ancore Fastigheter AB 758 669 7 -2
Other 2 6 1 1
Total 760 675 8 10
SEKm Apr-Jun
2015 Apr-Jun
2014 Jan-Jun
2015 Jan-Jun
2014
Full year
2014
Income 100 75 196 151 325
Expenses -43 -28 -83 -62 -135
Operating profit 57 47 113 89 190
Net financial items -45 -40 -88 -80 -168
Tax -6 -4 -11 -10 -19
Profit/loss for the period 6 3 14 -1 3
Other comprehensive income 25 -34
18 -66 -121
Comprehensive income for the period 31 -31 32 -67 -118
Non-current assets 4,800 3,752 4,826
Current assets 77 148 122
Total assets 4,877 3,900 4,948
Equity -80 -75 -112
Shareholder loan 1,526 1,226 1,526
Non-current liabilities 3,194 2,508 3,138
Current liabilities 237 241 396
Total equity and liabilities 4,877 3,900 4,948
Ancore Fastigheter AB is co-owned in a joint venture between Alecta pensionsförsäkring and ICA Gruppen. The parties each own 50% of the company which is a joint venture. Ancore fastigheter AB owns and manages 30 properties in Sweden which contain ICA stores in which operations are conducted by non-consolidated ICA retailers.

SEKm Apr-Jun
2015 Apr-Jun
2014 Jan-Jun
2015 Jan-Jun
2014 Full year
2014
Operating profit excl. non-recurring items 1,018 985 1,793 1,684 3,937
Capital gains on sale of non-current assets
Portfolio Companies, Forma -7 - -7 - -2
Portfolio Companies, Kjell & Co - 440 - 440 445
Portfolio Companies, inkClub - - 2 - -
Portfolio Companies, Cervera -8 - -8 - -
ICA Real Estate - 1 - 1 49
Rimi Baltic 64 - 64 - 54
Other 2 -2 2 3 0
Impairment
Portfolio Companies - - - - -322
ICA Real Estate -3 - -3 - -42
Rimi Baltic -1 - -1 - -22
Operating profit 1,065 1,424 1,842 2,128 4,097
Apotek Hjärtat ICA
Real Estate Total
Intangible assets 2 - 2
Property, plant and equipment 1 793 794
Inventories 25 - 25
Other current assets 128 - 128
Total assets held for sale 156 793 949
Current liabilities 109 0 109
Total liabilities held for sale 109 0 109
Apotek Hjärtat intends to divest its care and nursing business within Apotek Hjärtat to ApoEx. The divestment is expected to be completed in the fourth quarter of 2015 and the purchase sum after transaction costs corresponds to book value.
SEKm Group 2015
ICA Bank 2015
Group excl. Bank
Cash flow from operating activities before change in working capital 2 179 -4 2 183
Change in working capital
Inventories 3 0 3
Current receivables -545 48 -593
Current liabilities 476 142 334
ICA Bank’s net of deposits, lending and investments 914 914 0
Cash flow from operating activities 3 027 1 100 1 927
Cash flow from investing activities -2 025 -31 -1 994
Cash flow from financing activities -3 261 20 -3 281
Cash flow for the period -2 259 1 089 -3 348
Cash and cash equivalents at the beginning of the period 6 258 2 380 3 878
Exchange differences in cash and cash equivalents -26 0 -26
Cash and cash equivalents at the end of the period 3 973 3 469 504
SEKm Apr-Jun
2015 Apr-Jun
2014 Jan-Jun
2015 Jan-Jun
2014
Full year
2014
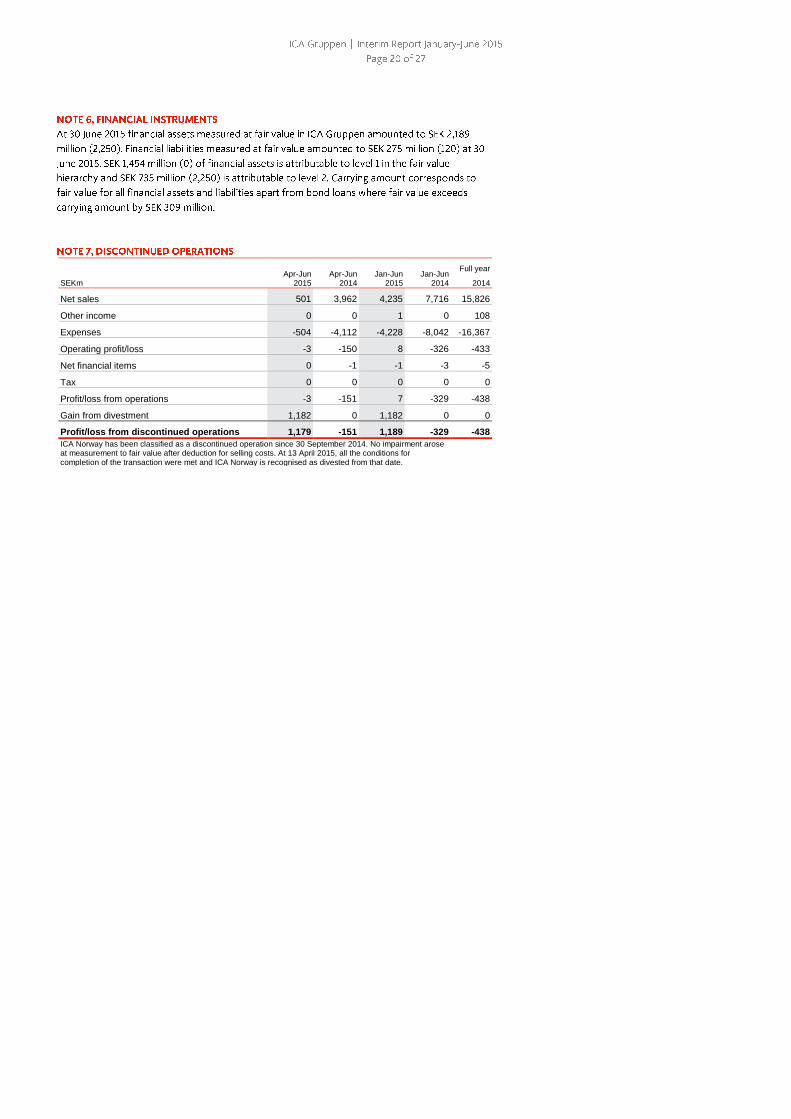
Net sales 501 3,962 4,235 7,716 15,826
Other income 0 0 1 0 108
Expenses -504 -4,112 -4,228 -8,042 -16,367
Operating profit/loss -3 -150 8 -326 -433
Net financial items 0 -1 -1 -3 -5
Tax 0 0 0 0 0
Profit/loss from operations -3 -151 7 -329 -438
Gain from divestment 1,182 0 1,182 0 0
Profit/loss from discontinued operations 1,179 -151 1,189 -329 -438
ICA Norway has been classified as a discontinued operation since 30 September 2014. No impairment arose at measurement to fair value after deduction for selling costs. At 13 April 2015, all the conditions for completion of the transaction were met and ICA Norway is recognised as divested from that date.

SEKm
Value according to preliminary purchase price allocation
Trademarks 550
Customer relations 28
Other intangible assets 62
Property, plant and equipment 200
Other non-current assets 6
Inventories 800
Other current assets 755
Cash and cash equivalents 288
Provisions -1
Non-current liabilities -9
Deferred tax liabilities -126
Current liabilities -3,549
Acquired, identifiable net assets -996
Goodwill 4,783
Acquired, identifiable net assets including goodwill 3,787
Consideration transferred 3,787
Cash and cash equivalents in Apotek Hjärtat AB -288
Change in consolidated cash and cash equivalents 3,499

Second quarter Jan-Jun 12 months Jul 2014- Jun 2015
Full year 2014 SEKm 2015 2014 2015 2014
Net sales 10 11 21 24 41 44
Gross profit 10 11 21 24 41 44
Administrative expenses -111 -91 -224 -182 -441 -399
Operating profit/loss -101 -80 -203 -158 -400 -355
Financial income 0 0 0 0 0 0
Financial expenses -84 -115 -161 -222 -342 -403
Profit/loss from investments in group companies 806 4,500 800 4,283 308 3,791
Profit/loss after financial items 621 4,305 436 3,903 -434 3,033
Appropriations - - - - 1,159 1,159
Profit before tax 621 4,305 436 3 903 725 4,192
Tax 39 25 77 66 -100 -111
Profit for the period 660 4,330 513 3,969 625 4,081
SEKm 30 June
2015 30 June
2014 31 December
2014
ASSETS
Non-current assets
Investments in group companies 29,794 29,910 29,774
Other intangible assets 86 58 77
Deferred tax assets 217 308 214
Other non-current assets 113 127 120
Total non-current assets 30,210 30,403 30,185
Current assets
Current receivables from group companies 171 837 2,314
Other current assets 162 80 68
Cash and cash equivalents - - -
Total current assets 333 917 2,382
, , ,
TOTAL ASSETS 30,543 31,320 32,567
EQUITY AND LIABILITIES
Equity 19,702 20,164 20,276
Provisions 325 302 316
Non-current liabilities
Non-current interest-bearing liabilities 8,473 5,975 8,482
Liabilities to group companies - 3,000 3,000
Other non-current liabilities 8,473 8,975 11,482
Total non-current liabilities
Current liabilities 1,740 1,683 171
Current interest-bearing liabilities 4 44 20
Current liabilities to group companies 299 152 302
Other current liabilities 2,043 1,879 493
Total current liabilities
30,543 31,320 32,567
TOTAL EQUITY AND LIABILITIES 29,794 29,910 29,774

Pro forma excluding effects of acquisition of ICA AB through Q2 2013 Q3 2013 Q4 2013 Q1 2014 Q2 2014 Q3 2014 Q4 2014 Q1 2015 Q2 2015
Net sales, SEKm 20,800 21,820 19,755 22,223 22,016 23,180 23,673 25,542
Operating profit before depreciation (EBITDA), SEKm 1,408 1,307 1,028 1,752 1,616 1,423 1,146 1,448
Operating profit (EBIT) excl. non-recurring items, SEKm 1,110 1,058 699 985 1,172 1,081 775 1,018
Operating margin excl. non-recurring items, % 5.3 4.8 3.5 4.4 5.3 4.7 3.3 4.0
Operating profit (EBIT), SEKm 1,109 753 704 1,424 904 1,065 777 1,065
Operating margin, % 5.3 3.5 3.6 6.4 4.1 4.6 3.3 4.2
Profit before tax, SEKm 948 601 615 1,338 823 951 686 961
Profit from continuing operations, SEKm 714 645 477 1,145 676 807 529 786
Profit/loss from discontinued operations, SEKm -163 -114 -178 -151 -181 72 10 1,179
Profit for the period, SEKm 551 531 299 994 495 879 539 1,965
Earnings per share, continuing operations, SEK 1 3,57 3,06 2,39 5,40 3,19 3,74 2,51 3,77
Earnings per share, discontinued operations, SEK 1 -0.81 -0.57 -0.89 -0.75 -0.90 0.36 0.05 5.86
Earnings per share, SEK 1 2.76 2.49 1.50 4.65 2.29 4.09 2.56 9.63
Equity per share, SEK 1 113.70 116.23 117.27 117.33 120.21 122.91 123.12 127.76
Return on equity, % 8.7 6.0 7.0 8.6 7.9 9.3 10.2 15.3
Return on capital employed, % 9.3 8.5 8.1 9.7 9.3 10.1 10.0 8.9
Cash flow from operating activities, SEKm 676 2,105 201 1,522 395 1,676 221 2,685
Cash flow from continuing operating activities, SEKm -58 -95 -138 22 156 -222 95 26
Cash flow from operating activities, SEKm 618 2,010 63 1,544 551 1,454 316 2,711
Cash flow from continuing operating activities per share, SEK 1 3.36 10.47 1.00 7.57 1.96 8.34 1.10 13.35
Cash flow from discontinued operating activities, SEK 1 -0.29 -0.47 -0.69 0.11 0.78 -1.11 0.47 0.13
Cash flow from continuing activities per share, SEK 1 3.07 10.00 0.31 7.68 2.74 7.23 1.57 13.48
Investing activities continuing operations (cash flow), SEKm 1,311 562 615 496 558 682 4,144 684
Investing activities discontinued operations (cash flow), SEKm 65 84 74 46 45 60 19 0
Investing activities (cash flow), SEKm 1,376 646 689 542 603 742 4,163 684
Net debt, SEKm -13,854 -9,190 -9,909 -9,084 -8,276 -7,058 -13,596 -10,845
Net debt/EBITDA 2.8 1.9 2.0 1.7 1.5 1.2 2.3 1.9
1 Same figures for ordinary shares and C shares.

Net sales by segment SEKm Q3 2013 Q4 2013 Q1 2014 Q2 2014 Q3 2014 Q4 2014 Q1 2015 Q2 2015
ICA Sweden 16,765 17,251 15,671 17,811 17,550 18,216 17,024 18,340
Rimi Baltic 2,548 2,838 2,597 2,888 2,952 3,195 2,932 3,136
Apotek Hjärtat 410 445 469 535 524 564 2,783 3,212
ICA Bank 213 215 216 218 207 207 206 214
ICA Real Estate 564 573 556 560 562 575 582 594
Portfolio Companies 586 892 565 587 579 833 521 393
Other 20 20 24 22 20 31 26 27
Intra-group sales -306 -414 -343 -398 -378 -441 -401 -374
Net sales 20,800 21,820 19,755 22,223 22,016 23,180 23,673 25,542
Operating profit before depreciation by segment (EBITDA) SEKm Q3 2013 Q4 2013 Q1 2014 Q2 2014 Q3 2014 Q4 2014 Q1 2015 Q2 2015
ICA Sweden 978 922 702 914 1,056 909 787 961
Rimi Baltic 154 182 128 156 220 218 150 235
Apotek Hjärtat 2 0 3 17 24 14 61 114
ICA Bank 73 60 46 55 66 52 23 31
ICA Real Estate 231 245 223 238 290 222 234 243
Portfolio Companies -3 60 -28 437 3 125 -30 -51
Other -27 -162 -46 -65 -43 -117 -79 -85
Operating profit before depreciation (EBITDA) 1,408 1,307 1,028 1,752 1,616 1,423 1,146 1,448
Operating profit excluding non-recurring items by segment
SEKm Q3 2013 Q4 2013 Q1 2014 Q2 2014 Q3 2014 Q4 2014 Q1 2015 Q2 2015
ICA Sweden 897 828 618 833 970 807 694 864
Rimi Baltic 87 113 59 86 93 145 78 99
Apotek Hjärtat -6 -9 -7 7 12 9 25 79
ICA Bank 64 51 39 47 58 45 16 24
ICA Real Estate 126 123 94 108 112 95 104 106
Portfolio Companies -15 131 -36 -14 -13 116 -43 -46
Other -43 -179 -68 -82 -60 -136 -99 -108
Operating profit excluding non-recurring items 1,110 1,058 699 985 1,172 1,081 775 1,018
Depreciation by segment
SEKm Q3 2013 Q4 2013 Q1 2014 Q2 2014 Q3 2014 Q4 2014 Q1 2015 Q2 2015
ICA Sweden 81 94 84 83 87 104 93 97
Rimi Baltic 67 69 69 70 74 72 72 72
Apotek Hjärtat 8 9 10 10 12 5 36 35
ICA Bank 9 9 7 8 8 7 7 7
ICA Real Estate 105 108 129 129 127 130 130 137
Portfolio Companies 12 11 8 11 11 11 11 10
Other 16 17 17 17 17 19 20 21
Depreciation 298 317 324 328 336 348 369 379
Second quarter Jan-Jun 12 months Jul 2014- Jun 2015
Full year 2014 SEKm 2015 2014 2015 2014
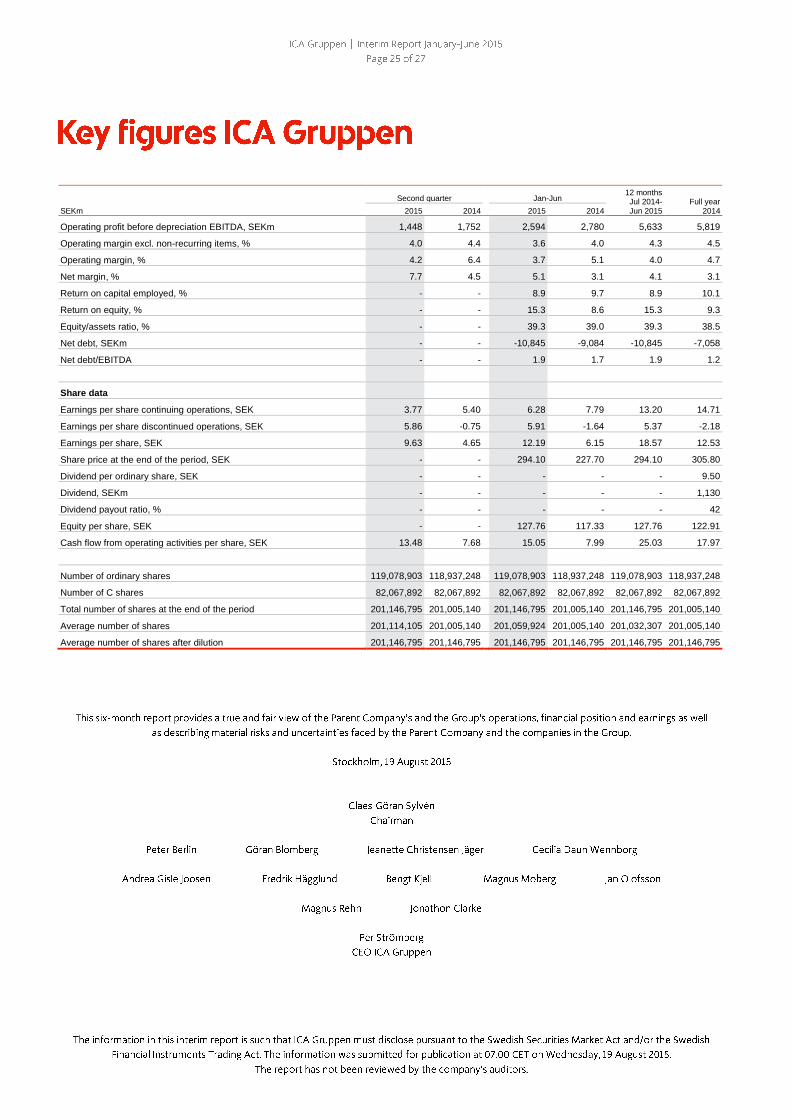
Operating profit before depreciation EBITDA, SEKm 1,448 1,752 2,594 2,780 5,633 5,819
Operating margin excl. non-recurring items, % 4.0 4.4 3.6 4.0 4.3 4.5
Operating margin, % 4.2 6.4 3.7 5.1 4.0 4.7
Net margin, % 7.7 4.5 5.1 3.1 4.1 3.1
Return on capital employed, % - - 8.9 9.7 8.9 10.1
Return on equity, % - - 15.3 8.6 15.3 9.3
Equity/assets ratio, % - - 39.3 39.0 39.3 38.5
Net debt, SEKm - - -10,845 -9,084 -10,845 -7,058
Net debt/EBITDA - - 1.9 1.7 1.9 1.2
Share data
Earnings per share continuing operations, SEK 3.77 5.40 6.28 7.79 13.20 14.71
Earnings per share discontinued operations, SEK 5.86 -0.75 5.91 -1.64 5.37 -2.18
Earnings per share, SEK 9.63 4.65 12.19 6.15 18.57 12.53
Share price at the end of the period, SEK - - 294.10 227.70 294.10 305.80
Dividend per ordinary share, SEK - - - - - 9.50
Dividend, SEKm - - - - - 1,130
Dividend payout ratio, % - - - - - 42
Equity per share, SEK - - 127.76 117.33 127.76 122.91
Cash flow from operating activities per share, SEK 13.48 7.68 15.05 7.99 25.03 17.97
Number of ordinary shares 119,078,903 118,937,248
119,078,903 118,937,248 119,078,903 118,937,248
Number of C shares 82,067,892 82,067,892
82,067,892 82,067,892 82,067,892 82,067,892
Total number of shares at the end of the period 201,146,795 201,005,140
201,146,795 201,005,140 201,146,795 201,005,140
Average number of shares 201,114,105 201,005,140
201,059,924 201,005,140 201,032,307 201,005,140
Average number of shares after dilution 201,146,795 201,146,795
201,146,795 201,146,795 201,146,795 201,146,795