Embed Size (px)
Citation preview

1
2Q21 Earnings Presentation

2
Important Disclosure
IN REVIEWING THE INFORMATION CONTAINED IN THIS PRESENTATION, YOU ARE AGREEING TO ABIDE BY THE TERMS OF THIS DISCLAIMER. THIS INFORMATION IS BEING MADE AVAILABLE TO EACH RECIPIENT SOLELY FOR ITS INFORMATION AND IS SUBJECT TO AMENDMENT.This presentation is prepared by XP Inc. (the “Company,” “we” or “our”), is solely for informational purposes. This presentation does not constitute a prospectus and does not constitute an offer to sell or the solicitation of an offer to buy any securities. In addition, this document and anymaterials distributed in connection with this presentation are not directed to, or intended for distribution to or use by, any person or entity that is a citizen or resident or located in any locality, state, country or other jurisdiction where such distribution, publication, availability or use wouldbe contrary to law or regulation or which would require any registration or licensing within such jurisdiction.This presentation was prepared by the Company. Neither the Company nor any of its affiliates, officers, employees or agents, make any representation or warranty, express or implied, in relation to the fairness, reasonableness, adequacy, accuracy or completeness of the information,statements or opinions, whichever their source, contained in this presentation or any oral information provided in connection herewith, or any data it generates and accept no responsibility, obligation or liability (whether direct or indirect, in contract, tort or otherwise) in relation to any ofsuch information. The information and opinions contained in this presentation are provided as at the date of this presentation, are subject to change without notice and do not purport to contain all information that may be required to evaluate the Company. The information in thispresentation is in draft form and has not been independently verified. The Company and its affiliates, officers, employees and agents expressly disclaim any and all liability which may be based on this presentation and any errors therein or omissions therefrom. Neither the Company norany of its affiliates, officers, employees or agents makes any representation or warranty, express or implied, as to the achievement or reasonableness of future projections, management targets, estimates, prospects or returns, if any.The information contained in this presentation does not purport to be comprehensive and has not been subject to any independent audit or review. Certain of the financial information as of and for the periods ended December 31, 2019, 2018 and 2017 has been derived from auditedfinancial statements and all other financial information has been derived from unaudited interim financial statements. A significant portion of the information contained in this presentation is based on estimates or expectations of the Company, and there can be no assurance thatthese estimates or expectations are or will prove to be accurate. The Company’s internal estimates have not been verified by an external expert, and the Company cannot guarantee that a third party using different methods to assemble, analyze or compute market information and datawould obtain or generate the same results.Statements in the presentation, including those regarding the possible or assumed future or other performance of the Company or its industry or other trend projections, constitute forward-looking statements. These statements are generally identified by the use of words such as“anticipate,” “believe,” “could,” “expect,” “should,” “plan,” “intend,” “estimate” and “potential,” among others. By their nature, forward-looking statements are necessarily subject to a high degree of uncertainty and involve known and unknown risks, uncertainties, assumptions and otherfactors because they relate to events and depend on circumstances that will occur in the future whether or not outside the control of the Company. Such factors may cause actual results, performance or developments to differ materially from those expressed or implied by suchforward-looking statements and there can be no assurance that such forward-looking statements will prove to be correct. These risks and uncertainties include factors relating to: (1) general economic, financial, political, demographic and business conditions in Brazil, as well as anyother countries we may serve in the future and their impact on our business; (2) fluctuations in interest, inflation and exchange rates in Brazil and any other countries we may serve in the future; (3) competition in the financial services industry; (4) our ability to implement our businessstrategy; (5) our ability to adapt to the rapid pace of technological changes in the financial services industry; (6) the reliability, performance, functionality and quality of our products and services and the investment performance of investment funds managed by third parties or by ourasset managers; (7) the availability of government authorizations on terms and conditions and within periods acceptable to us; (8) our ability to continue attracting and retaining new appropriately-skilled employees; (9) our capitalization and level of indebtedness; (10) the interests ofour controlling shareholders; (11) changes in government regulations applicable to the financial services industry in Brazil and elsewhere; (12) our ability to compete and conduct our business in the future; (13) the success of operating initiatives, including advertising and promotionalefforts and new product, service and concept development by us and our competitors; (14) changes in consumer demands regarding financial products, customer experience related to investments and technological advances, and our ability to innovate to respond to such changes;(15) changes in labor, distribution and other operating costs; (16) our compliance with, and changes to, government laws, regulations and tax matters that currently apply to us; (17) the negative impacts of the COVID-19 pandemic on global, regional and national economies and therelated market volatility and protracted economic downturn; and (18) other factors that may affect our financial condition, liquidity and results of operations. Accordingly, you should not place undue reliance on forward-looking statements. The forward-looking statements includedherein speak only as at the date of this presentation and the Company does not undertake any obligation to update these forward-looking statements. Past performance does not guarantee or predict future performance. Moreover, the Company and its affiliates, officers, employeesand agents do not undertake any obligation to review, update or confirm expectations or estimates or to release any revisions to any forward-looking statements to reflect events that occur or circumstances that arise in relation to the content of the presentation. You are cautioned notto unduly rely on such forward-looking statements when evaluating the information presented and we do not intend to update any of these forward-looking statements.Market data and industry information used throughout this presentation are based on management’s knowledge of the industry and the good faith estimates of management. The Company also relied, to the extent available, upon management’s review of industry surveys andpublications and other publicly available information prepared by a number of third party sources. All of the market data and industry information used in this presentation involves a number of assumptions and limitations, and you are cautioned not to give undue weight to suchestimates. Although the Company believes that these sources are reliable, there can be no assurance as to the accuracy or completeness of this information, and the Company has not independently verified this information.The contents hereof should not be construed as investment, legal, tax or other advice and you should consult your own advisers as to legal, business, tax and other related matters concerning an investment in the Company. The Company is not acting on your behalf and does notregard you as a customer or a client. It will not be responsible to you for providing protections afforded to clients or for advising you on the relevant transaction.This presentation also includes certain non-GAAP financial information. We believe that such information is meaningful and useful in understanding the activities and business metrics of the Company’s operations. We also believe that these non-GAAP financial measures reflect anadditional way of viewing aspects of the Company’s business that, when viewed with our International Financial Reporting Standards (“IFRS”) results, as issued by the International Accounting Standards Board, provide a more complete understanding of factors and trends affecting theCompany’s business. Further, investors regularly rely on non-GAAP financial measures to assess operating performance and such measures may highlight trends in the Company’s business that may not otherwise be apparent when relying on financial measures calculated inaccordance with IFRS. We also believe that certain non-GAAP financial measures are frequently used by securities analysts, investors and other interested parties in the evaluation of public companies in the Company’s industry, many of which present these measures when reportingtheir results. The non-GAAP financial information is presented for informational purposes and to enhance understanding of the IFRS financial statements. The non-GAAP measures should be considered in addition to results prepared in accordance with IFRS, but not as a substitute for,or superior to, IFRS results. As other companies may determine or calculate this non-GAAP financial information differently, the usefulness of these measures for comparative purposes is limited. A reconciliation of such non-GAAP financial measures to the nearest GAAP measure isincluded in this presentation.For purposes of this presentation:“Active Clients” means the total number of retail clients served through our XP Investimentos, Rico, Clear, XP Investments and XP Private (Europe) brands, with an AUC above R$100.00 or that have transacted at least once in the last thirty days. For purposes of calculating this metric, ifa client holds an account in more than one of the aforementioned entities, such client will be counted as one “active client” for each such account. For example, if a client holds an account in each of XP Investimentos and Rico, such client will count as two “active clients” for purposesof this metric.“Assets Under Custody (AUC)” means the market value of all client assets invested through XP’s platform, including equities, fixed income securities, mutual funds (including those managed by XP Gestão de Recursos Ltda., XP Advisory Gestão Recursos Ltda. and XP Vista AssetManagement Ltda., as well as by third-party asset managers), pension funds (including those from XP Vida e Previdência S.A., as well as by third-party insurance companies), exchange traded funds, COEs (Structured Notes), REITs, and uninvested cash balances (Floating Balances),among others.

3
Index
Highlights02
2Q21 KPIs and Financials03
01 Opening Remarks
Q&A04

1 Opening Remarks

5
Connecting the Dots to Build a Leading EcosystemXP’s revenue represent slightly more than 1% of the Brazilian Financial Industry
2001-2019Building a unique business while
competing with large banks
2019-2021Paving the way to enhance relationships
and expand TAM
2022 ONWARDSReaping the benefits of a
truly complete ecosystem
INROADS INTO NEW VERTICALS
INVESTMENTSTAM
EXPANSION
LEVERS TO ACCELERATE GROWTH THE BIG DREAM GETS BIGGER
EDUCATION
CLIENT CENTRICITY
DISTRIBUTIONCAPABILITIES
HARD TO PENETRATE
TRUSTED BRAND
PROFITABILITY
INSURANCE
PENSION FUNDS
CREDIT
CREDIT CARD
FX
COMPANIES
(SMB TO CORPORATE)
R$ 350 BILLION TAM R$ 800 BILLION TAM
+ BRAZILIAN INDIVIDUALS AND COMPANIES
ADRESSED
+ SHARE OF WALLET
+ CROSS SELLING
R$ 70 BILLION TAM
BUILDING MOATS

2 Highlights

7
Highlights
▪ Strongest Quarter Ever (Again)2Q21
Results
Bond Issuance ▪ Access to a sizeable and liquid market
M&As▪ Broker Dealers
▪ Independent Asset Managers
Brand Awareness
▪ XP Private awarded by Euromoney as Latin America’s best bank for wealth management 2021
▪ Main Sponsor Investor in the Brazilian Olympic Committee in Tokyo 2020

3 2Q21 KPIs andFinancials

9
(1) Does not include Credit Card related loans and receivables(2) See appendix for a reconciliation of Adjusted Net Income and Adjusted EBITDA(3) NPS, is an independent widely known survey methodology that measures the willingness of customers to recommend a Company’s products and services. The NPS calculation as of a given date reflects the average of the answersin the previous six months
KPIs
NPS3 Jun-21: 76
Total AuC
R$817 Billion+88% YoY
Credit Portfolio1
R$6.8 Billion+17x YoY
Gross Revenue
R$3.2 Billion+57% YoY
Active Clients
3.1 Million+33% YoY
Credit Card TPV
R$2.1 BillionAdjusted EBITDA2
R$1.2 Billion+77% YoY
Net Inflows
R$75 BillionNPL Ratio
0%Adjusted Net Income2
R$1.0 Billion+83% YoY
Investments Banking Financials
+159% YoY
+4x QoQ

10
Revenue and Breakdown
Total Gross Revenues (in R$ mn)
Highlights
▪ Strong growth leading to a new record, across different
channels, with Retail contributing with 84% of the growth.
▪ Institutional recorded the best quarter so far, driven by intense
Fixed income activity, benefiting from recent changes in Selic
rate.
2Q20 2Q21
2,041
3,200+57%
RETAIL INSTITUTIONAL
ISSUER SERVICES DIGITAL CONTENT
77% 12%
8% 1%
Other Revenue represented 3% of Total Gross Revenues
of 2Q21 Total Gross Revenue

11
Retail Revenue and Take RateResilient monetization and product diversification
LTM Take Rate (LTM Retail Revenue / Average AUC)Retail Revenue (in R$ mn)
3Q18 4Q19
1.4%
2Q19
1.5%
4Q18
1.3%1.4%
1Q19
1.3% 1.3%
3Q19
1.3%
1Q20 1Q21
1.3% 1.3%
2Q20
1.3%
3Q20
1.3%
4Q20
1.3%
2Q212Q212Q20
1,475
2,452+66%
Highlights
▪ Ability to add new products and services in the platform – such
as credit cards and credit, and diversified revenue profile.
Highlights
▪ Resilient revenue generation Retail despite steady volumes in
equities and futures. Key growth drivers were Financial
Products and Fixed Income.
▪ On 2Q21, Retail related revenues represented 82% of
consolidated Net Income from Financial Instruments.
Note: Average AUC = (Sum of AUC from the beginning of period and each-quarter end in a given year, being 5 data points in one year)/5
Zero brokerage Clear
New Online Pricing XP and Rico
AUC
LTM Take Rate
PandemicOutbreak
Banking License

12
InstitutionalInstitutional benefited from fixed income volumes
Institutional Revenue (in R$ mn)
2Q20 2Q21
333
375+13%
Highlights
▪ Fixed Income activity was strong – benefiting from recent
increases in interest rates in Brazil – driving the channel to
record its best quarter so far, despite high equity trading
volumes in 2Q20.
+15%Total Revenue Growth
Revenue Growth QoQ
+27%Institutional
+39%Institutional Fixed Income
2Q214Q20 1Q21
2.00%
6.25%7.25%
4.50%2.75%
4.25%
Selic Rate EoP
Expected Selic for 2021 EoP (1)
(1) Source - XP Department of Economy

13
2Q20
1,245
704
2Q21
+77%
900
2Q20 2Q21
765
+18%
Adjusted EBITDA and MarginOperational Leverage despite investments in technology, client experience and product offering
Highlights
▪ Result of a scalable business model, with significant cross-sell
and operating leverage opportunities
▪ Main drivers were (1) top line increase, mainly coming from
Retail; (2) higher gross margins, and (3) operating leverage in
SG&A.
Adjusted EBITDA2 (in R$ mn)
(1) Excluding Share Based Compensation(2) See appendix for a reconciliation of Adjusted EBITDA.
41.3%36.3%% Adj EBITDA
Margin
Operating Expenses (in R$ mn)
% of NetRevenue
Highlights
▪ Despite growing our headcount by 53% year-over-year,
continuously investing in technology and new verticals, and
deploying new products, we increased efficiency, reducing
expenses as a percentage of net revenue by 340 bps.
29.8%33.2%
4,489
3
2001
2,091
3Q19 (IPO)
2Q21
19 years
1.5 years
Headcount EvolutionSG&A1

14
2Q20 2Q21
565
1,034+83%
+104%
+75%
Gross Revenue
Adjusted EBITDA
Adjusted Net Income
+57%
+77%
+83%
Adjusted NetMargin
Adjusted Net Income and MarginNet margin expansion driven by strong growth in Retail, operating leverage and a lower tax rate
Adjusted Net Income (in R$ mn)
Note: See appendix for a reconciliation of Adjusted Net Income.
YoY Growth Across 2Q21 P&L
+463bps
Operating leverage
Efficient Corporate Structure
+485bps
Margin expansion YoY
Highlights
▪ Adjusted Net Income grew 83% vs. 2Q20, explained by (1)
strong growth in Retail Revenue, (2) operating leverage in
SG&A and (3) a lower effective tax rate.
34.2%29.4%

Q&A

Appendix

18
Non-GAAP Financial InformationFloating and Adjusted Gross Financial Assets
18
Adjusted Gross Financial Assets (in R$ mn)Floating Balance (in R$ mn)Adjusted Gross Financial Assets 2Q21 1Q21
Assets 105,113 113,590
(+) Cash 1,237 1,557
(+) Securities - Fair value through profit or loss 45,360 62,855
(+) Securities - Fair value through other comprehensive income 23,701 21,629
(+) Securities - Evaluated at amortized cost 988 1,916
(+) Derivative financial instruments 15,485 13,587
(+) Securities purchased under agreements to resell 8,174 6,741
(+) Loan Operations 7,964 5,041
(+) Foreign exchange portfolio 2,204 263
Liabilities (73,704) (85,205)
(-) Securities loaned (2,790) (2,706)
(-) Derivative financial instruments (16,373) (13,564)
(-) Securities sold under repurchase agreements (16,062) (44,483)
(-) Private Pension Liabilities (22,046) (16,897)
(-) Deposits (6,628) (4,003)
(-) Structured Operations (4,198) (2,841)
(-) Financial Bills (2,160) (83)
(-) Foreign exchange portfolio (2,324) (322)
(-) Credit cards operations (1,124) (307)
(-) Floating Balance (18,038) (17,214)
(=) Adjusted Gross Financial Assets 13,372 11,170
Floating Balance (=net univested clients' deposits) 2Q21 1Q21
Assets (2,776) (3,184)
(-) Securities trading and intermediation (2,776) (3,184)
Liabilities 20,814 20,399
(+) Securities trading and intermediation 20,814 20,399
(=) Floating Balance 18,038 17,214
19
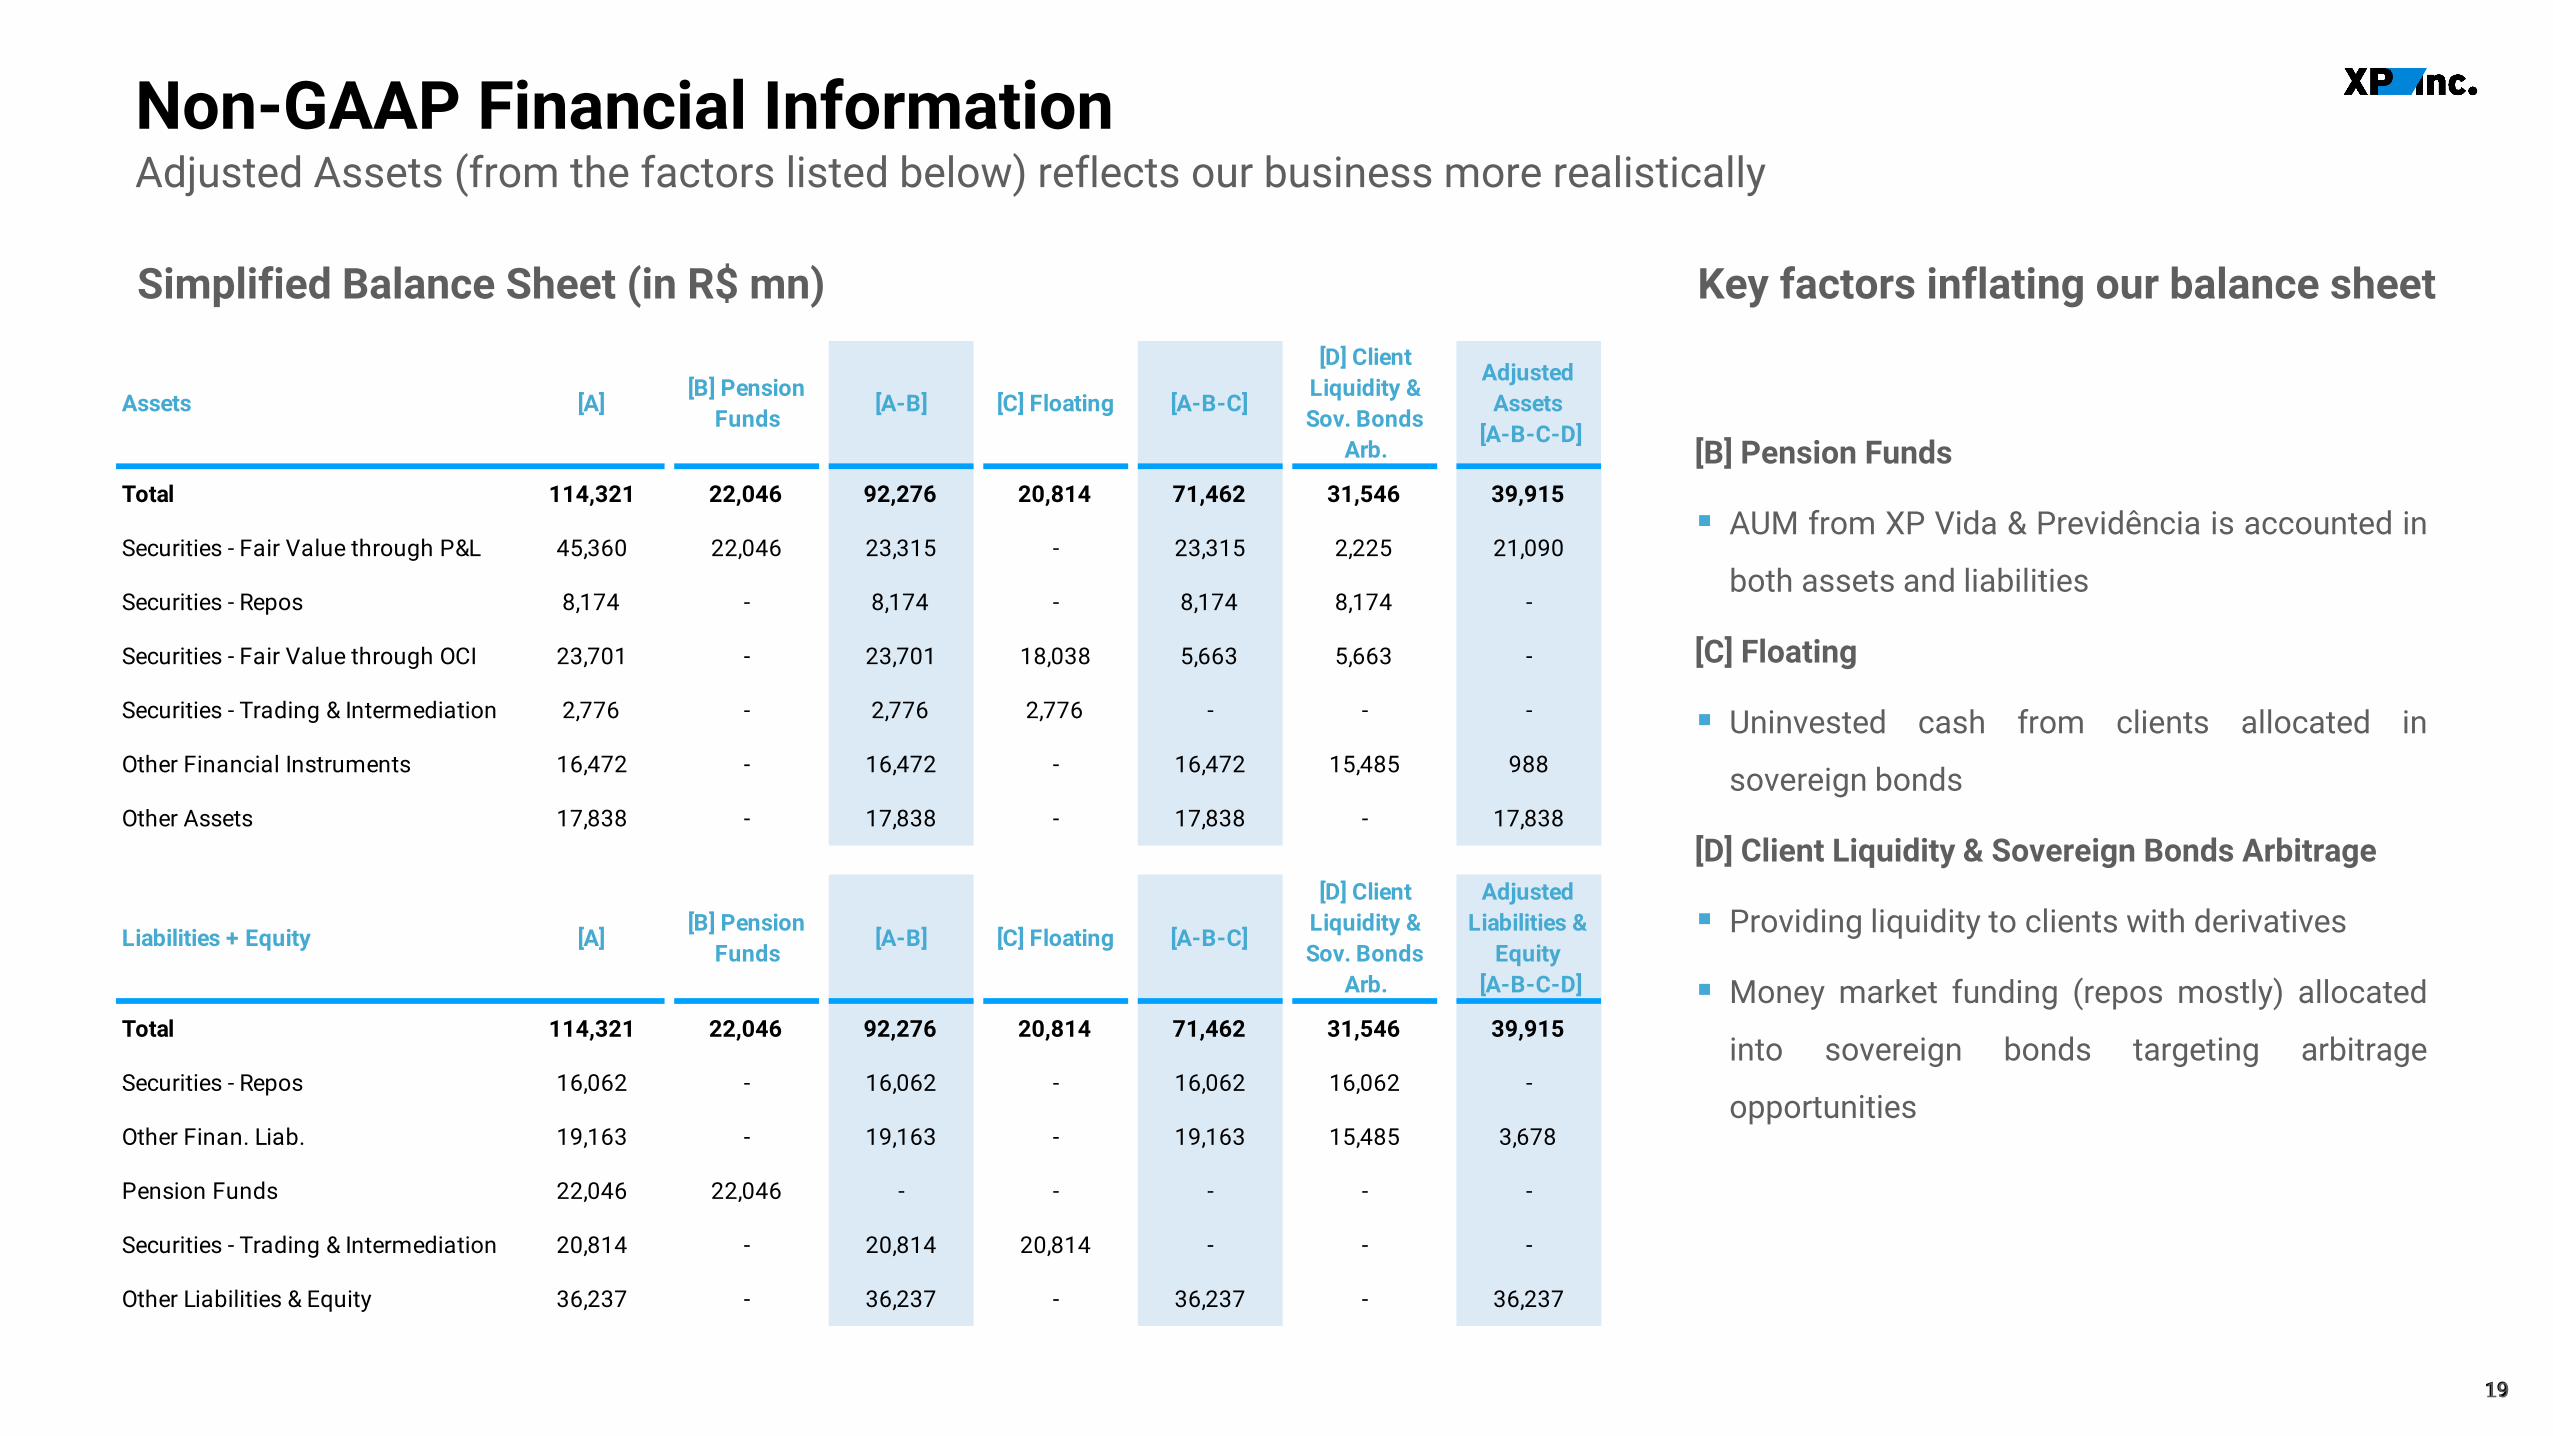
Non-GAAP Financial InformationAdjusted Assets (from the factors listed below) reflects our business more realistically
19
[B] Pension Funds
▪ AUM from XP Vida & Previdência is accounted in
both assets and liabilities
[C] Floating
▪ Uninvested cash from clients allocated in
sovereign bonds
[D] Client Liquidity & Sovereign Bonds Arbitrage
▪ Providing liquidity to clients with derivatives
▪ Money market funding (repos mostly) allocated
into sovereign bonds targeting arbitrage
opportunities
Assets [A][B] Pension
Funds[A-B] [C] Floating [A-B-C]
[D] Client
Liquidity &
Sov. Bonds
Arb.
Adjusted
Assets
[A-B-C-D]
Total 114,321 22,046 92,276 20,814 71,462 31,546 39,915
Securities - Fair Value through P&L 45,360 22,046 23,315 - 23,315 2,225 21,090
Securities - Repos 8,174 - 8,174 - 8,174 8,174 -
Securities - Fair Value through OCI 23,701 - 23,701 18,038 5,663 5,663 -
Securities - Trading & Intermediation 2,776 - 2,776 2,776 - - -
Other Financial Instruments 16,472 - 16,472 - 16,472 15,485 988
Other Assets 17,838 - 17,838 - 17,838 - 17,838
Liabilities + Equity [A][B] Pension
Funds[A-B] [C] Floating [A-B-C]
[D] Client
Liquidity &
Sov. Bonds
Arb.
Adjusted
Liabilities &
Equity
[A-B-C-D]
Total 114,321 22,046 92,276 20,814 71,462 31,546 39,915
Securities - Repos 16,062 - 16,062 - 16,062 16,062 -
Other Finan. Liab. 19,163 - 19,163 - 19,163 15,485 3,678
Pension Funds 22,046 22,046 - - - - -
Securities - Trading & Intermediation 20,814 - 20,814 20,814 - - -
Other Liabilities & Equity 36,237 - 36,237 - 36,237 - 36,237
Key factors inflating our balance sheetSimplified Balance Sheet (in R$ mn)

20
2Q21 2Q20 YoY 1Q21 QoQ
EBITDA 1,080 663 63% 864 25%
(+) Share Based Compensation 165 40 309% 178 -7%
Adj. EBITDA 1,245 704 77% 1,043 19%
Non-GAAP Financial InformationAdjusted EBITDA and Adjusted Net Income
20
Adjusted Net Income (in R$ mn)
Adjusted EBITDA (in R$ mn)
2Q21 2Q20 YoY 1Q21 QoQ
Net Income 931 540 72% 734 27%
(+) Share Based Compensation 165 40 309% 178 -7%
(+/-) Taxes (63) (16) 292% (67) -6%
Adj. Net Income 1,034 565 83% 846 22%